Kaysville, UT Map & Demographics
Kaysville Map
Kaysville Overview
$42,645
PER CAPITA INCOME
$132,203
AVG FAMILY INCOME
$121,867
AVG HOUSEHOLD INCOME
60.6%
WAGE / INCOME GAP [ % ]
39.4¢/ $1
WAGE / INCOME GAP [ $ ]
$11,859
FAMILY INCOME DEFICIT
0.39
INEQUALITY / GINI INDEX
32,714
TOTAL POPULATION
16,708
MALE POPULATION
16,006
FEMALE POPULATION
104.39
MALES / 100 FEMALES
95.80
FEMALES / 100 MALES
32.1
MEDIAN AGE
3.9
AVG FAMILY SIZE
3.6
AVG HOUSEHOLD SIZE
15,130
LABOR FORCE [ PEOPLE ]
68.4%
PERCENT IN LABOR FORCE
2.6%
UNEMPLOYMENT RATE
Kaysville Zip Codes
Income in Kaysville
Income Overview in Kaysville
Per Capita Income in Kaysville is $42,645, while median incomes of families and households are $132,203 and $121,867 respectively.
| Characteristic | Number | Measure |
| Per Capita Income | 32,714 | $42,645 |
| Median Family Income | 7,738 | $132,203 |
| Mean Family Income | 7,738 | $162,507 |
| Median Household Income | 8,996 | $121,867 |
| Mean Household Income | 8,996 | $151,513 |
| Income Deficit | 7,738 | $11,859 |
| Wage / Income Gap (%) | 32,714 | 60.58% |
| Wage / Income Gap ($) | 32,714 | 39.42¢ per $1 |
| Gini / Inequality Index | 32,714 | 0.39 |
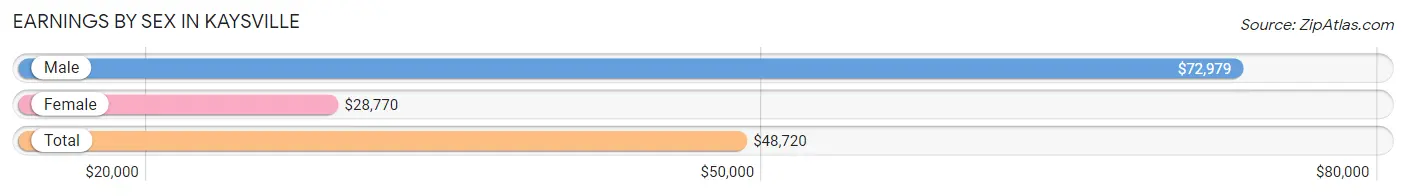
Earnings by Sex in Kaysville
Average Earnings in Kaysville are $48,720, $72,979 for men and $28,770 for women, a difference of 60.6%.
| Sex | Number | Average Earnings |
| Male | 9,072 (57.0%) | $72,979 |
| Female | 6,842 (43.0%) | $28,770 |
| Total | 15,914 (100.0%) | $48,720 |
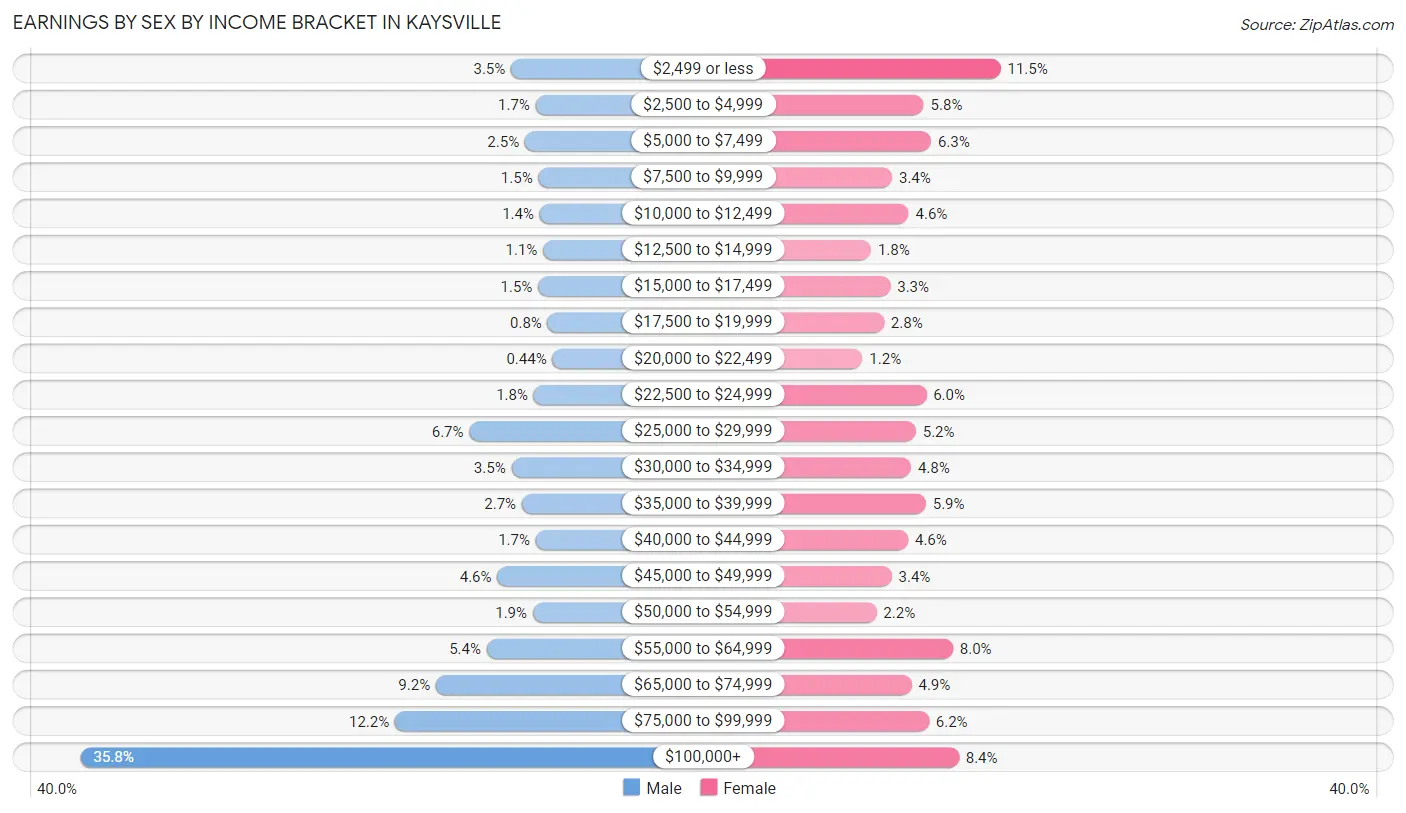
Earnings by Sex by Income Bracket in Kaysville
The most common earnings brackets in Kaysville are $100,000+ for men (3,249 | 35.8%) and $2,499 or less for women (788 | 11.5%).
| Income | Male | Female |
| $2,499 or less | 321 (3.5%) | 788 (11.5%) |
| $2,500 to $4,999 | 154 (1.7%) | 394 (5.8%) |
| $5,000 to $7,499 | 227 (2.5%) | 432 (6.3%) |
| $7,500 to $9,999 | 135 (1.5%) | 232 (3.4%) |
| $10,000 to $12,499 | 126 (1.4%) | 317 (4.6%) |
| $12,500 to $14,999 | 103 (1.1%) | 124 (1.8%) |
| $15,000 to $17,499 | 137 (1.5%) | 223 (3.3%) |
| $17,500 to $19,999 | 73 (0.8%) | 190 (2.8%) |
| $20,000 to $22,499 | 40 (0.4%) | 80 (1.2%) |
| $22,500 to $24,999 | 167 (1.8%) | 407 (5.9%) |
| $25,000 to $29,999 | 605 (6.7%) | 354 (5.2%) |
| $30,000 to $34,999 | 318 (3.5%) | 329 (4.8%) |
| $35,000 to $39,999 | 248 (2.7%) | 405 (5.9%) |
| $40,000 to $44,999 | 153 (1.7%) | 314 (4.6%) |
| $45,000 to $49,999 | 415 (4.6%) | 230 (3.4%) |
| $50,000 to $54,999 | 173 (1.9%) | 152 (2.2%) |
| $55,000 to $64,999 | 486 (5.4%) | 544 (8.0%) |
| $65,000 to $74,999 | 832 (9.2%) | 332 (4.9%) |
| $75,000 to $99,999 | 1,110 (12.2%) | 421 (6.1%) |
| $100,000+ | 3,249 (35.8%) | 574 (8.4%) |
| Total | 9,072 (100.0%) | 6,842 (100.0%) |
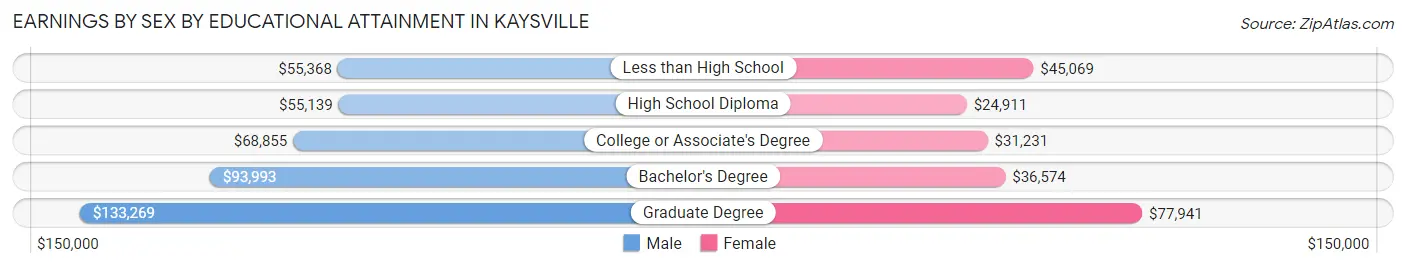
Earnings by Sex by Educational Attainment in Kaysville
Average earnings in Kaysville are $83,022 for men and $36,282 for women, a difference of 56.3%. Men with an educational attainment of graduate degree enjoy the highest average annual earnings of $133,269, while those with high school diploma education earn the least with $55,139. Women with an educational attainment of graduate degree earn the most with the average annual earnings of $77,941, while those with high school diploma education have the smallest earnings of $24,911.
| Educational Attainment | Male Income | Female Income |
| Less than High School | $55,368 | $45,069 |
| High School Diploma | $55,139 | $24,911 |
| College or Associate's Degree | $68,855 | $31,231 |
| Bachelor's Degree | $93,993 | $36,574 |
| Graduate Degree | $133,269 | $77,941 |
| Total | $83,022 | $36,282 |
Family Income in Kaysville
Family Income Brackets in Kaysville
According to the Kaysville family income data, there are 2,097 families falling into the $100,000 to $149,999 income range, which is the most common income bracket and makes up 27.1% of all families. Conversely, the less than $10,000 income bracket is the least frequent group with only 70 families (0.9%) belonging to this category.
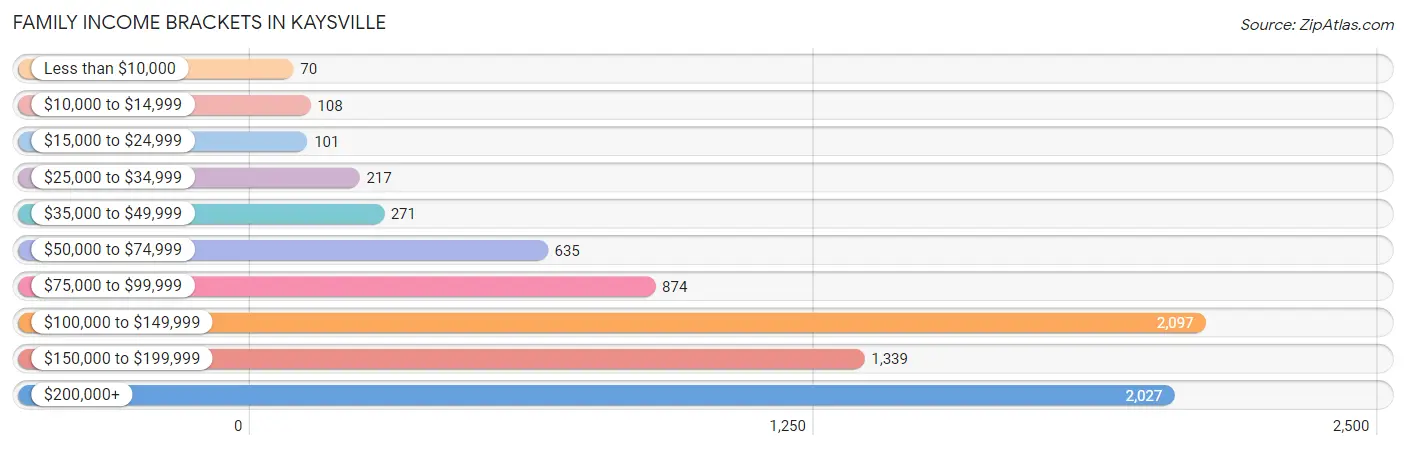
| Income Bracket | # Families | % Families |
| Less than $10,000 | 70 | 0.9% |
| $10,000 to $14,999 | 108 | 1.4% |
| $15,000 to $24,999 | 101 | 1.3% |
| $25,000 to $34,999 | 217 | 2.8% |
| $35,000 to $49,999 | 271 | 3.5% |
| $50,000 to $74,999 | 635 | 8.2% |
| $75,000 to $99,999 | 874 | 11.3% |
| $100,000 to $149,999 | 2,097 | 27.1% |
| $150,000 to $199,999 | 1,339 | 17.3% |
| $200,000+ | 2,027 | 26.2% |
Family Income by Famaliy Size in Kaysville
7+ person families (625 | 8.1%) account for the highest median family income in Kaysville with $189,306 per family, while 2-person families (2,584 | 33.4%) have the highest median income of $54,923 per family member.
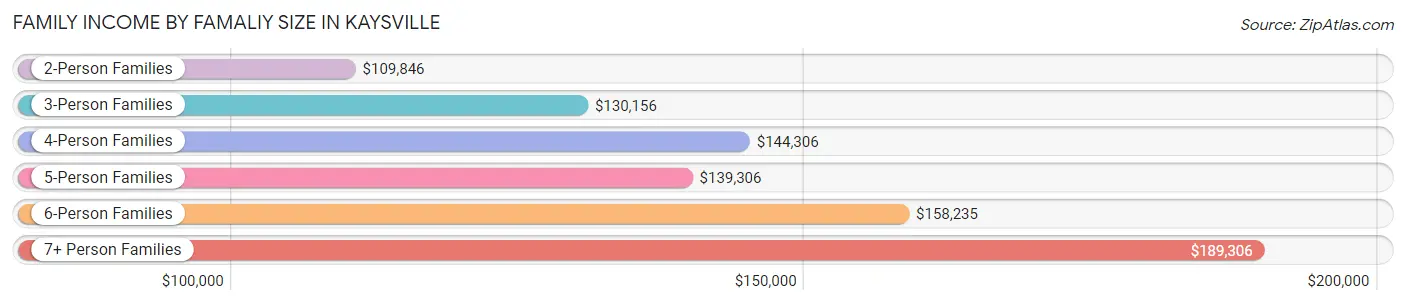
| Income Bracket | # Families | Median Income |
| 2-Person Families | 2,584 (33.4%) | $109,846 |
| 3-Person Families | 1,001 (12.9%) | $130,156 |
| 4-Person Families | 1,527 (19.7%) | $144,306 |
| 5-Person Families | 1,099 (14.2%) | $139,306 |
| 6-Person Families | 902 (11.7%) | $158,235 |
| 7+ Person Families | 625 (8.1%) | $189,306 |
| Total | 7,738 (100.0%) | $132,203 |
Family Income by Number of Earners in Kaysville
The median family income in Kaysville is $132,203, with families comprising 3+ earners (1,381) having the highest median family income of $176,224, while families with no earners (845) have the lowest median family income of $60,325, accounting for 17.8% and 10.9% of families, respectively.
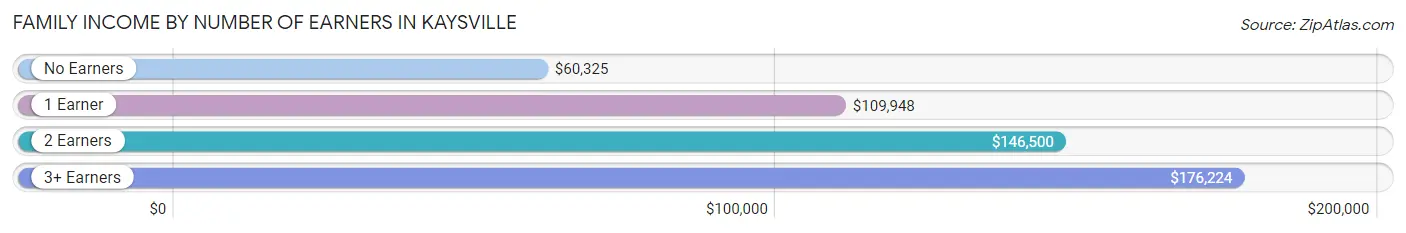
| Number of Earners | # Families | Median Income |
| No Earners | 845 (10.9%) | $60,325 |
| 1 Earner | 2,078 (26.9%) | $109,948 |
| 2 Earners | 3,434 (44.4%) | $146,500 |
| 3+ Earners | 1,381 (17.8%) | $176,224 |
| Total | 7,738 (100.0%) | $132,203 |
Household Income in Kaysville
Household Income Brackets in Kaysville
With 2,492 households falling in the category, the $100,000 to $149,999 income range is the most frequent in Kaysville, accounting for 27.7% of all households. In contrast, only 144 households (1.6%) fall into the $10,000 to $14,999 income bracket, making it the least populous group.
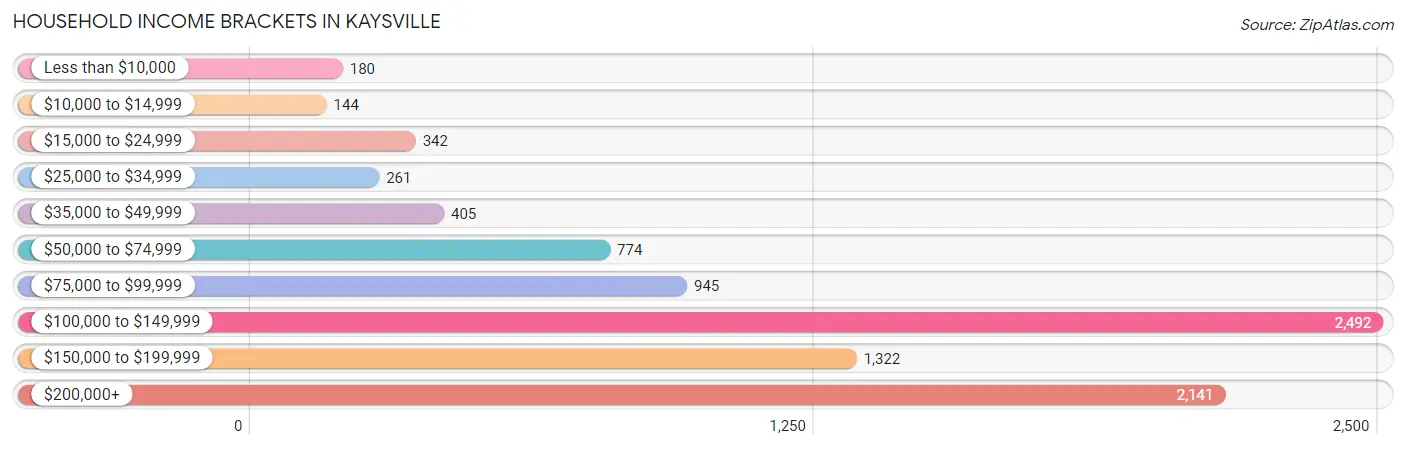
| Income Bracket | # Households | % Households |
| Less than $10,000 | 180 | 2.0% |
| $10,000 to $14,999 | 144 | 1.6% |
| $15,000 to $24,999 | 342 | 3.8% |
| $25,000 to $34,999 | 261 | 2.9% |
| $35,000 to $49,999 | 405 | 4.5% |
| $50,000 to $74,999 | 774 | 8.6% |
| $75,000 to $99,999 | 945 | 10.5% |
| $100,000 to $149,999 | 2,492 | 27.7% |
| $150,000 to $199,999 | 1,322 | 14.7% |
| $200,000+ | 2,141 | 23.8% |
Household Income by Householder Age in Kaysville
The median household income in Kaysville is $121,867, with the highest median household income of $160,665 found in the 45 to 64 years age bracket for the primary householder. A total of 3,413 households (37.9%) fall into this category. Meanwhile, the 15 to 24 years age bracket for the primary householder has the lowest median household income of $60,347, with 85 households (0.9%) in this group.
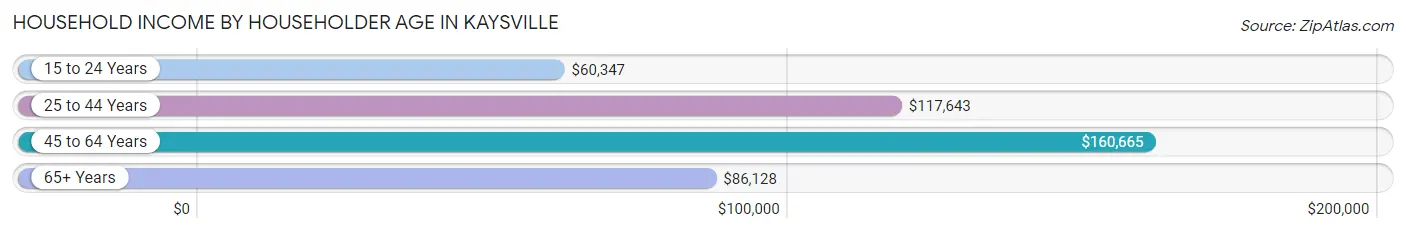
| Income Bracket | # Households | Median Income |
| 15 to 24 Years | 85 (0.9%) | $60,347 |
| 25 to 44 Years | 3,557 (39.5%) | $117,643 |
| 45 to 64 Years | 3,413 (37.9%) | $160,665 |
| 65+ Years | 1,941 (21.6%) | $86,128 |
| Total | 8,996 (100.0%) | $121,867 |
Poverty in Kaysville
Income Below Poverty by Sex and Age in Kaysville
With 2.5% poverty level for males and 3.4% for females among the residents of Kaysville, 75 year old and over males and 65 to 74 year old females are the most vulnerable to poverty, with 69 males (10.4%) and 88 females (9.2%) in their respective age groups living below the poverty level.
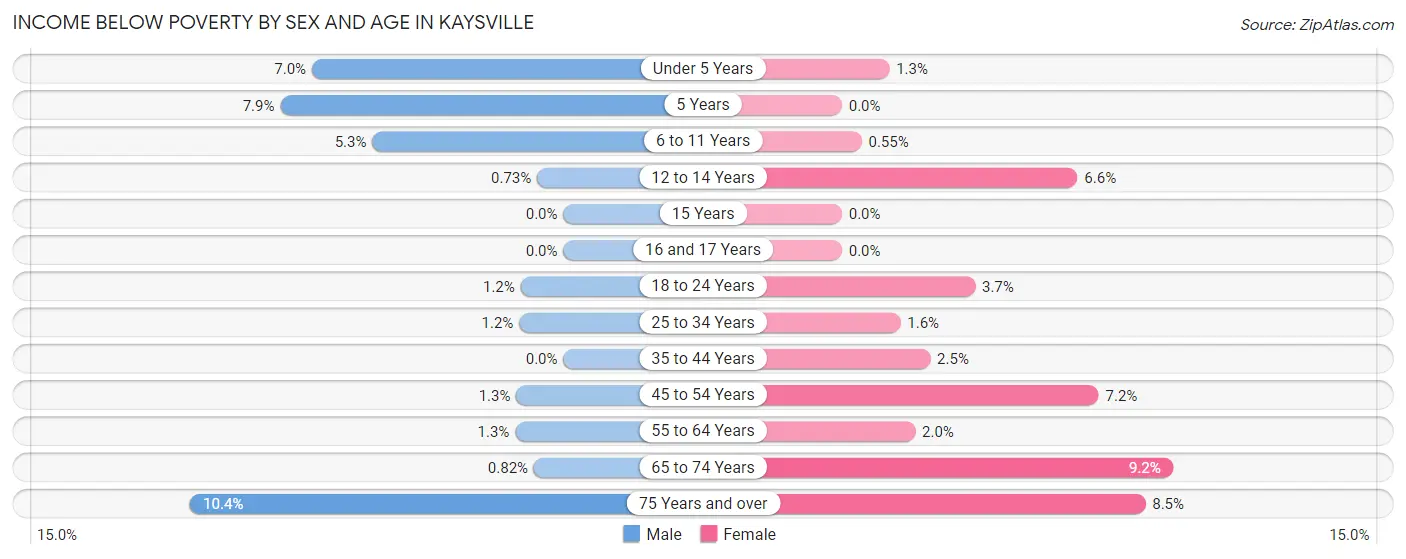
| Age Bracket | Male | Female |
| Under 5 Years | 78 (7.0%) | 13 (1.3%) |
| 5 Years | 51 (7.9%) | 0 (0.0%) |
| 6 to 11 Years | 117 (5.3%) | 13 (0.5%) |
| 12 to 14 Years | 9 (0.7%) | 65 (6.6%) |
| 15 Years | 0 (0.0%) | 0 (0.0%) |
| 16 and 17 Years | 0 (0.0%) | 0 (0.0%) |
| 18 to 24 Years | 15 (1.2%) | 42 (3.7%) |
| 25 to 34 Years | 19 (1.2%) | 25 (1.6%) |
| 35 to 44 Years | 0 (0.0%) | 64 (2.5%) |
| 45 to 54 Years | 26 (1.3%) | 133 (7.1%) |
| 55 to 64 Years | 22 (1.3%) | 30 (2.0%) |
| 65 to 74 Years | 7 (0.8%) | 88 (9.2%) |
| 75 Years and over | 69 (10.4%) | 72 (8.5%) |
| Total | 413 (2.5%) | 545 (3.4%) |
Income Above Poverty by Sex and Age in Kaysville
According to the poverty statistics in Kaysville, males aged 15 years and females aged 5 years are the age groups that are most secure financially, with 100.0% of males and 100.0% of females in these age groups living above the poverty line.
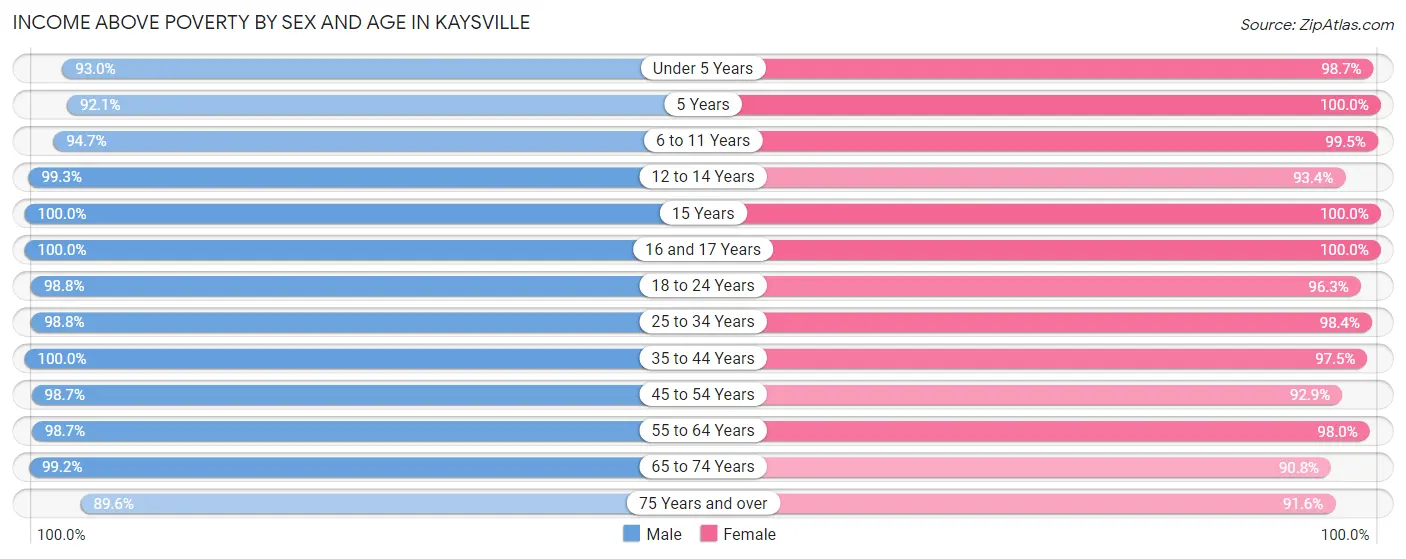
| Age Bracket | Male | Female |
| Under 5 Years | 1,036 (93.0%) | 969 (98.7%) |
| 5 Years | 596 (92.1%) | 248 (100.0%) |
| 6 to 11 Years | 2,084 (94.7%) | 2,330 (99.5%) |
| 12 to 14 Years | 1,224 (99.3%) | 926 (93.4%) |
| 15 Years | 384 (100.0%) | 418 (100.0%) |
| 16 and 17 Years | 559 (100.0%) | 616 (100.0%) |
| 18 to 24 Years | 1,247 (98.8%) | 1,091 (96.3%) |
| 25 to 34 Years | 1,525 (98.8%) | 1,508 (98.4%) |
| 35 to 44 Years | 2,588 (100.0%) | 2,541 (97.5%) |
| 45 to 54 Years | 1,962 (98.7%) | 1,726 (92.8%) |
| 55 to 64 Years | 1,619 (98.7%) | 1,440 (98.0%) |
| 65 to 74 Years | 842 (99.2%) | 867 (90.8%) |
| 75 Years and over | 595 (89.6%) | 780 (91.5%) |
| Total | 16,261 (97.5%) | 15,460 (96.6%) |
Income Below Poverty Among Married-Couple Families in Kaysville
The poverty statistics for married-couple families in Kaysville show that 1.7% or 119 of the total 7,013 families live below the poverty line. Families with no children have the highest poverty rate of 3.3%, comprising of 97 families. On the other hand, families with 5 or more children have the lowest poverty rate of 0.0%, which includes 0 families.
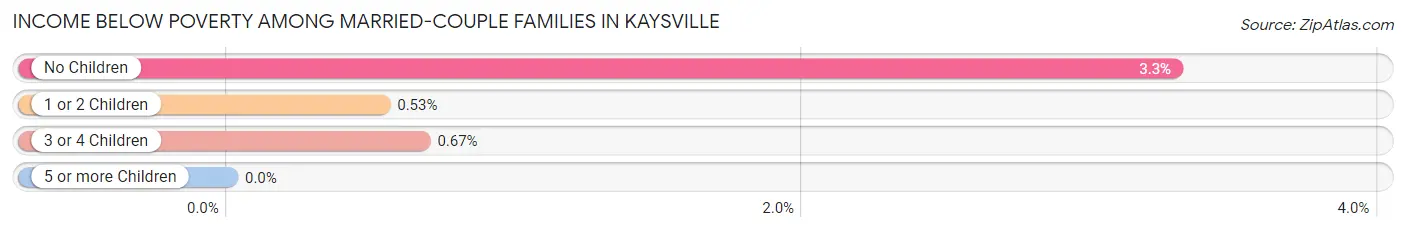
| Children | Above Poverty | Below Poverty |
| No Children | 2,847 (96.7%) | 97 (3.3%) |
| 1 or 2 Children | 2,079 (99.5%) | 11 (0.5%) |
| 3 or 4 Children | 1,635 (99.3%) | 11 (0.7%) |
| 5 or more Children | 333 (100.0%) | 0 (0.0%) |
| Total | 6,894 (98.3%) | 119 (1.7%) |
Income Below Poverty Among Single-Parent Households in Kaysville
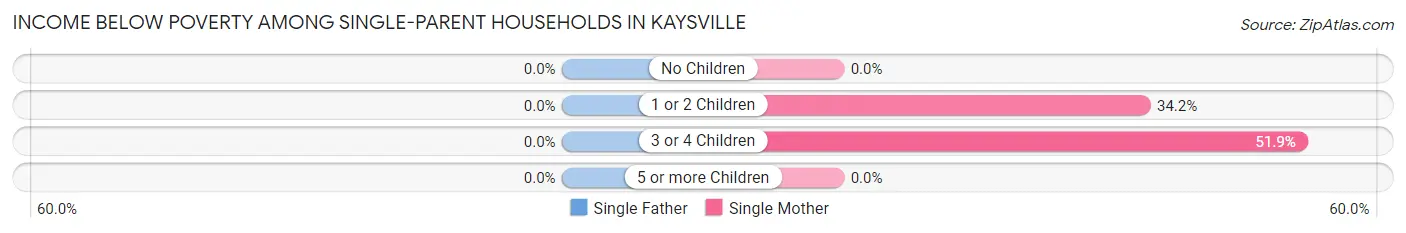
| Children | Single Father | Single Mother |
| No Children | 0 (0.0%) | 0 (0.0%) |
| 1 or 2 Children | 0 (0.0%) | 88 (34.2%) |
| 3 or 4 Children | 0 (0.0%) | 42 (51.8%) |
| 5 or more Children | 0 (0.0%) | 0 (0.0%) |
| Total | 0 (0.0%) | 130 (26.3%) |
Income Below Poverty Among Married-Couple vs Single-Parent Households in Kaysville
The poverty data for Kaysville shows that 119 of the married-couple family households (1.7%) and 130 of the single-parent households (17.9%) are living below the poverty level. Within the married-couple family households, those with no children have the highest poverty rate, with 97 households (3.3%) falling below the poverty line. Among the single-parent households, those with 3 or 4 children have the highest poverty rate, with 42 household (31.1%) living below poverty.
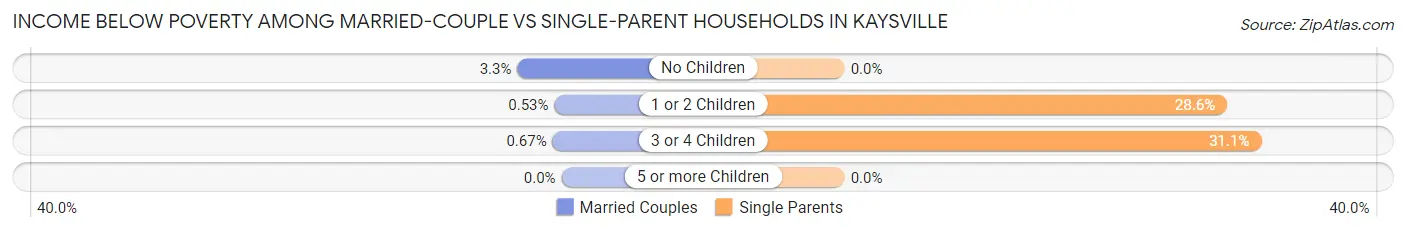
| Children | Married-Couple Families | Single-Parent Households |
| No Children | 97 (3.3%) | 0 (0.0%) |
| 1 or 2 Children | 11 (0.5%) | 88 (28.6%) |
| 3 or 4 Children | 11 (0.7%) | 42 (31.1%) |
| 5 or more Children | 0 (0.0%) | 0 (0.0%) |
| Total | 119 (1.7%) | 130 (17.9%) |
Race in Kaysville
The most populous races in Kaysville are White / Caucasian (29,599 | 90.5%), Two or more Races (2,102 | 6.4%), and Hispanic or Latino (1,533 | 4.7%).
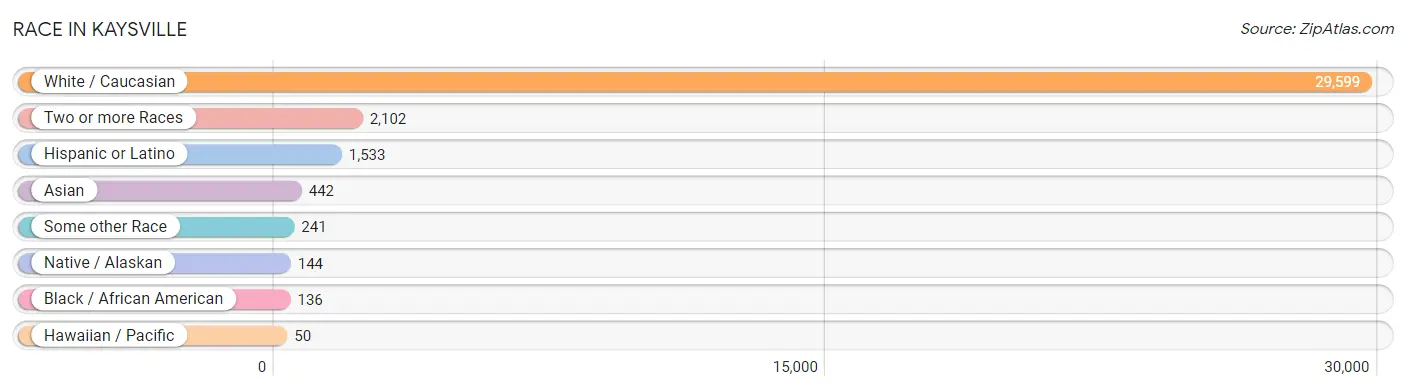
| Race | # Population | % Population |
| Asian | 442 | 1.3% |
| Black / African American | 136 | 0.4% |
| Hawaiian / Pacific | 50 | 0.2% |
| Hispanic or Latino | 1,533 | 4.7% |
| Native / Alaskan | 144 | 0.4% |
| White / Caucasian | 29,599 | 90.5% |
| Two or more Races | 2,102 | 6.4% |
| Some other Race | 241 | 0.7% |
| Total | 32,714 | 100.0% |
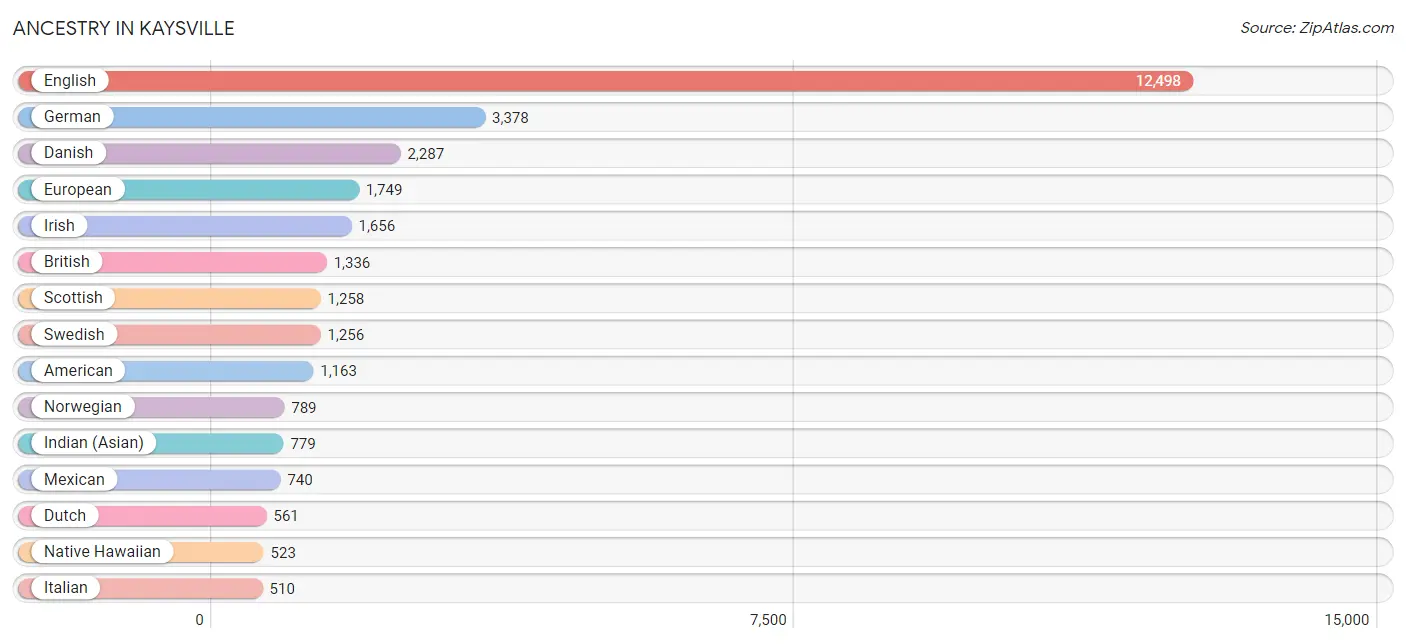
Ancestry in Kaysville
The most populous ancestries reported in Kaysville are English (12,498 | 38.2%), German (3,378 | 10.3%), Danish (2,287 | 7.0%), European (1,749 | 5.3%), and Irish (1,656 | 5.1%), together accounting for 65.9% of all Kaysville residents.
| Ancestry | # Population | % Population |
| African | 3 | 0.0% |
| American | 1,163 | 3.6% |
| Apache | 3 | 0.0% |
| Arab | 122 | 0.4% |
| Argentinean | 9 | 0.0% |
| Austrian | 13 | 0.0% |
| Bhutanese | 111 | 0.3% |
| British | 1,336 | 4.1% |
| Burmese | 163 | 0.5% |
| Cajun | 11 | 0.0% |
| Canadian | 173 | 0.5% |
| Central American | 137 | 0.4% |
| Cherokee | 52 | 0.2% |
| Chilean | 15 | 0.1% |
| Chinese | 255 | 0.8% |
| Colombian | 45 | 0.1% |
| Croatian | 91 | 0.3% |
| Czech | 122 | 0.4% |
| Danish | 2,287 | 7.0% |
| Dominican | 180 | 0.5% |
| Dutch | 561 | 1.7% |
| Eastern European | 30 | 0.1% |
| English | 12,498 | 38.2% |
| European | 1,749 | 5.3% |
| Finnish | 162 | 0.5% |
| French | 234 | 0.7% |
| German | 3,378 | 10.3% |
| Ghanaian | 32 | 0.1% |
| Greek | 155 | 0.5% |
| Guatemalan | 52 | 0.2% |
| Haitian | 27 | 0.1% |
| Honduran | 85 | 0.3% |
| Hungarian | 14 | 0.0% |
| Icelander | 22 | 0.1% |
| Indian (Asian) | 779 | 2.4% |
| Iranian | 23 | 0.1% |
| Irish | 1,656 | 5.1% |
| Italian | 510 | 1.6% |
| Jordanian | 7 | 0.0% |
| Korean | 64 | 0.2% |
| Latvian | 15 | 0.1% |
| Lebanese | 115 | 0.4% |
| Lithuanian | 29 | 0.1% |
| Mexican | 740 | 2.3% |
| Native Hawaiian | 523 | 1.6% |
| Navajo | 137 | 0.4% |
| Northern European | 140 | 0.4% |
| Norwegian | 789 | 2.4% |
| Peruvian | 20 | 0.1% |
| Polish | 103 | 0.3% |
| Portuguese | 41 | 0.1% |
| Puerto Rican | 115 | 0.4% |
| Russian | 34 | 0.1% |
| Scandinavian | 485 | 1.5% |
| Scotch-Irish | 193 | 0.6% |
| Scottish | 1,258 | 3.8% |
| Sioux | 18 | 0.1% |
| Slavic | 17 | 0.1% |
| Slovene | 15 | 0.1% |
| South American | 89 | 0.3% |
| South American Indian | 20 | 0.1% |
| Spaniard | 109 | 0.3% |
| Spanish | 134 | 0.4% |
| Sri Lankan | 39 | 0.1% |
| Subsaharan African | 35 | 0.1% |
| Swedish | 1,256 | 3.8% |
| Swiss | 284 | 0.9% |
| Tongan | 74 | 0.2% |
| Welsh | 475 | 1.5% |
| Yugoslavian | 16 | 0.1% | View All 70 Rows |
Immigrants in Kaysville
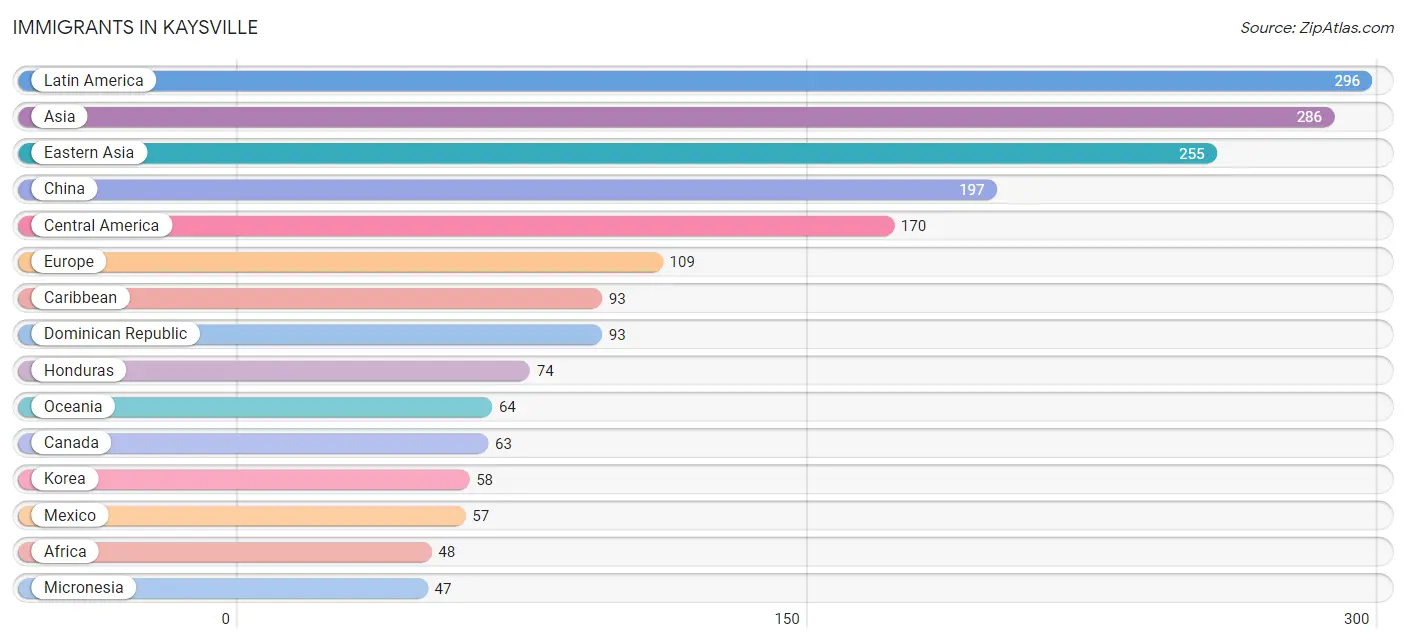
The most numerous immigrant groups reported in Kaysville came from Latin America (296 | 0.9%), Asia (286 | 0.9%), Eastern Asia (255 | 0.8%), China (197 | 0.6%), and Central America (170 | 0.5%), together accounting for 3.7% of all Kaysville residents.
| Immigration Origin | # Population | % Population |
| Africa | 48 | 0.2% |
| Argentina | 9 | 0.0% |
| Asia | 286 | 0.9% |
| Canada | 63 | 0.2% |
| Caribbean | 93 | 0.3% |
| Central America | 170 | 0.5% |
| China | 197 | 0.6% |
| Colombia | 24 | 0.1% |
| Dominican Republic | 93 | 0.3% |
| Eastern Asia | 255 | 0.8% |
| Eastern Europe | 30 | 0.1% |
| Egypt | 13 | 0.0% |
| England | 19 | 0.1% |
| Europe | 109 | 0.3% |
| Germany | 23 | 0.1% |
| Ghana | 32 | 0.1% |
| Guatemala | 39 | 0.1% |
| Honduras | 74 | 0.2% |
| Korea | 58 | 0.2% |
| Latin America | 296 | 0.9% |
| Mexico | 57 | 0.2% |
| Micronesia | 47 | 0.1% |
| Middle Africa | 3 | 0.0% |
| Northern Africa | 13 | 0.0% |
| Northern Europe | 19 | 0.1% |
| Oceania | 64 | 0.2% |
| Philippines | 21 | 0.1% |
| Poland | 30 | 0.1% |
| South America | 33 | 0.1% |
| South Eastern Asia | 31 | 0.1% |
| Southern Europe | 37 | 0.1% |
| Spain | 37 | 0.1% |
| Vietnam | 10 | 0.0% |
| Western Africa | 32 | 0.1% |
| Western Europe | 23 | 0.1% |
| Zaire | 3 | 0.0% | View All 36 Rows |
Sex and Age in Kaysville
Sex and Age in Kaysville
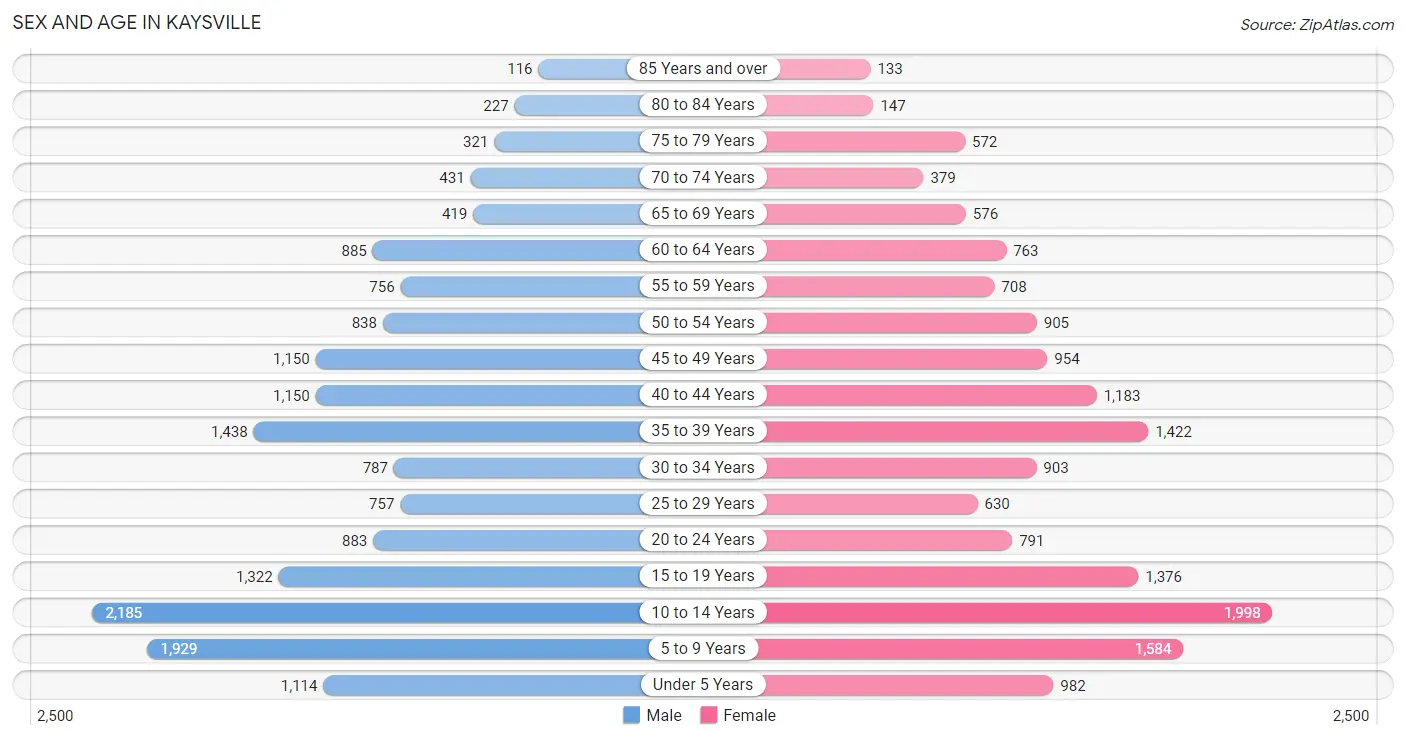
The most populous age groups in Kaysville are 10 to 14 Years (2,185 | 13.1%) for men and 10 to 14 Years (1,998 | 12.5%) for women.
| Age Bracket | Male | Female |
| Under 5 Years | 1,114 (6.7%) | 982 (6.1%) |
| 5 to 9 Years | 1,929 (11.6%) | 1,584 (9.9%) |
| 10 to 14 Years | 2,185 (13.1%) | 1,998 (12.5%) |
| 15 to 19 Years | 1,322 (7.9%) | 1,376 (8.6%) |
| 20 to 24 Years | 883 (5.3%) | 791 (4.9%) |
| 25 to 29 Years | 757 (4.5%) | 630 (3.9%) |
| 30 to 34 Years | 787 (4.7%) | 903 (5.6%) |
| 35 to 39 Years | 1,438 (8.6%) | 1,422 (8.9%) |
| 40 to 44 Years | 1,150 (6.9%) | 1,183 (7.4%) |
| 45 to 49 Years | 1,150 (6.9%) | 954 (6.0%) |
| 50 to 54 Years | 838 (5.0%) | 905 (5.7%) |
| 55 to 59 Years | 756 (4.5%) | 708 (4.4%) |
| 60 to 64 Years | 885 (5.3%) | 763 (4.8%) |
| 65 to 69 Years | 419 (2.5%) | 576 (3.6%) |
| 70 to 74 Years | 431 (2.6%) | 379 (2.4%) |
| 75 to 79 Years | 321 (1.9%) | 572 (3.6%) |
| 80 to 84 Years | 227 (1.4%) | 147 (0.9%) |
| 85 Years and over | 116 (0.7%) | 133 (0.8%) |
| Total | 16,708 (100.0%) | 16,006 (100.0%) |
Families and Households in Kaysville
Median Family Size in Kaysville
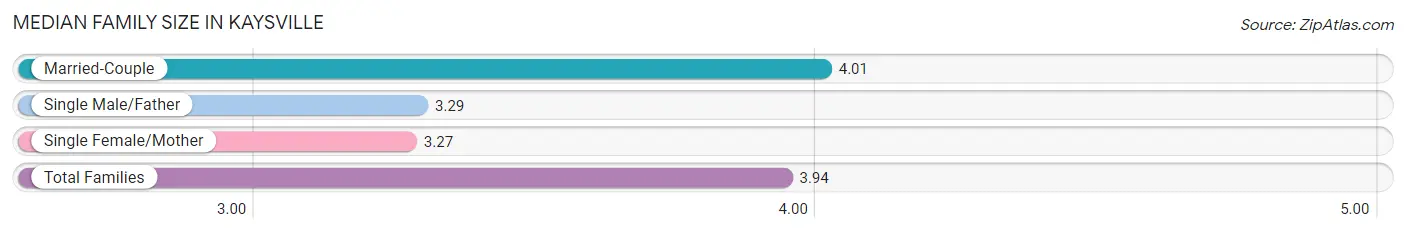
The median family size in Kaysville is 3.94 persons per family, with married-couple families (7,013 | 90.6%) accounting for the largest median family size of 4.01 persons per family. On the other hand, single female/mother families (494 | 6.4%) represent the smallest median family size with 3.27 persons per family.
| Family Type | # Families | Family Size |
| Married-Couple | 7,013 (90.6%) | 4.01 |
| Single Male/Father | 231 (3.0%) | 3.29 |
| Single Female/Mother | 494 (6.4%) | 3.27 |
| Total Families | 7,738 (100.0%) | 3.94 |
Median Household Size in Kaysville
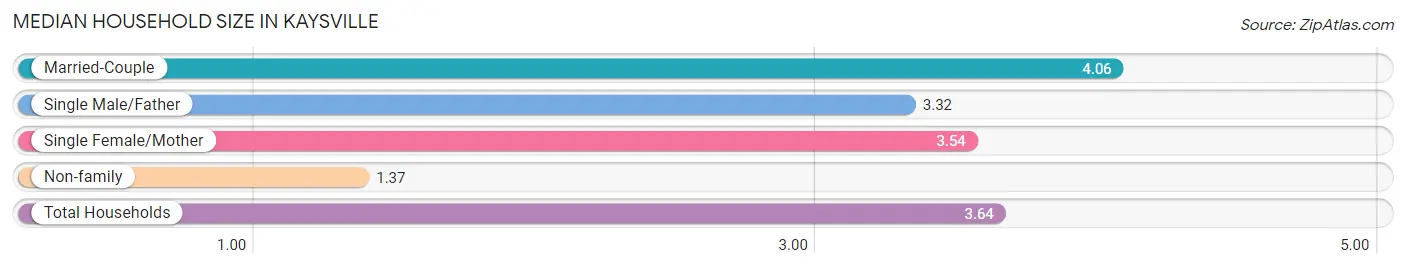
The median household size in Kaysville is 3.64 persons per household, with married-couple households (7,013 | 78.0%) accounting for the largest median household size of 4.06 persons per household. non-family households (1,258 | 14.0%) represent the smallest median household size with 1.37 persons per household.
| Household Type | # Households | Household Size |
| Married-Couple | 7,013 (78.0%) | 4.06 |
| Single Male/Father | 231 (2.6%) | 3.32 |
| Single Female/Mother | 494 (5.5%) | 3.54 |
| Non-family | 1,258 (14.0%) | 1.37 |
| Total Households | 8,996 (100.0%) | 3.64 |
Household Size by Marriage Status in Kaysville
Out of a total of 8,996 households in Kaysville, 7,738 (86.0%) are family households, while 1,258 (14.0%) are nonfamily households. The most numerous type of family households are 2-person households, comprising 2,494, and the most common type of nonfamily households are 1-person households, comprising 891.
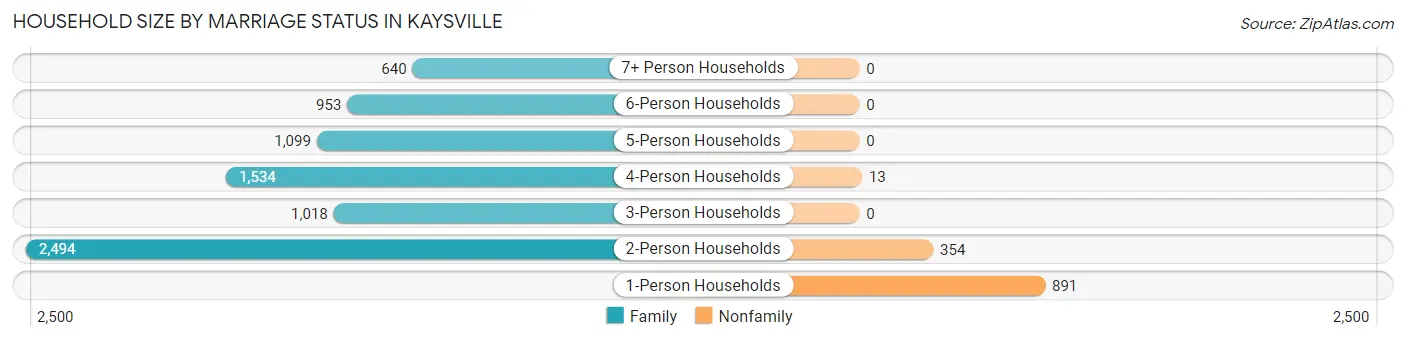
| Household Size | Family Households | Nonfamily Households |
| 1-Person Households | - | 891 (9.9%) |
| 2-Person Households | 2,494 (27.7%) | 354 (3.9%) |
| 3-Person Households | 1,018 (11.3%) | 0 (0.0%) |
| 4-Person Households | 1,534 (17.1%) | 13 (0.1%) |
| 5-Person Households | 1,099 (12.2%) | 0 (0.0%) |
| 6-Person Households | 953 (10.6%) | 0 (0.0%) |
| 7+ Person Households | 640 (7.1%) | 0 (0.0%) |
| Total | 7,738 (86.0%) | 1,258 (14.0%) |
Female Fertility in Kaysville
Fertility by Age in Kaysville
Average fertility rate in Kaysville is 71.0 births per 1,000 women. Women in the age bracket of 20 to 34 years have the highest fertility rate with 166.0 births per 1,000 women. Women in the age bracket of 20 to 34 years acount for 72.7% of all women with births.
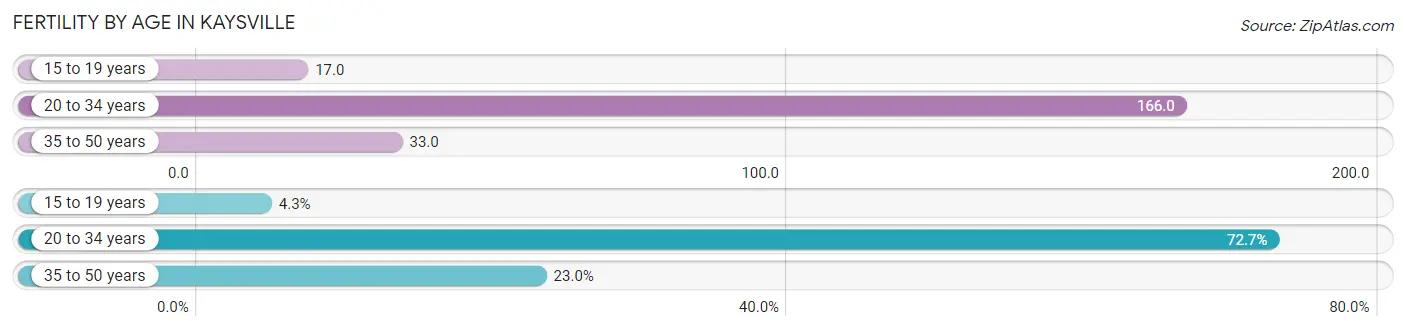
| Age Bracket | Women with Births | Births / 1,000 Women |
| 15 to 19 years | 23 (4.3%) | 17.0 |
| 20 to 34 years | 386 (72.7%) | 166.0 |
| 35 to 50 years | 122 (23.0%) | 33.0 |
| Total | 531 (100.0%) | 71.0 |
Fertility by Age by Marriage Status in Kaysville
88.7% of women with births (531) in Kaysville are married. The highest percentage of unmarried women with births falls into 15 to 19 years age bracket with 100.0% of them unmarried at the time of birth, while the lowest percentage of unmarried women with births belong to 20 to 34 years age bracket with 6.5% of them unmarried.
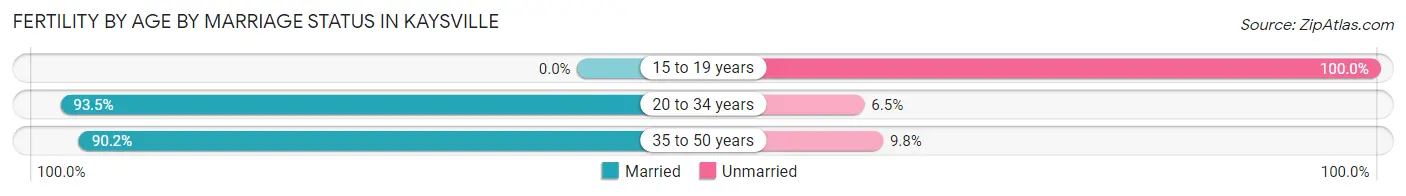
| Age Bracket | Married | Unmarried |
| 15 to 19 years | 0 (0.0%) | 23 (100.0%) |
| 20 to 34 years | 361 (93.5%) | 25 (6.5%) |
| 35 to 50 years | 110 (90.2%) | 12 (9.8%) |
| Total | 471 (88.7%) | 60 (11.3%) |
Fertility by Education in Kaysville
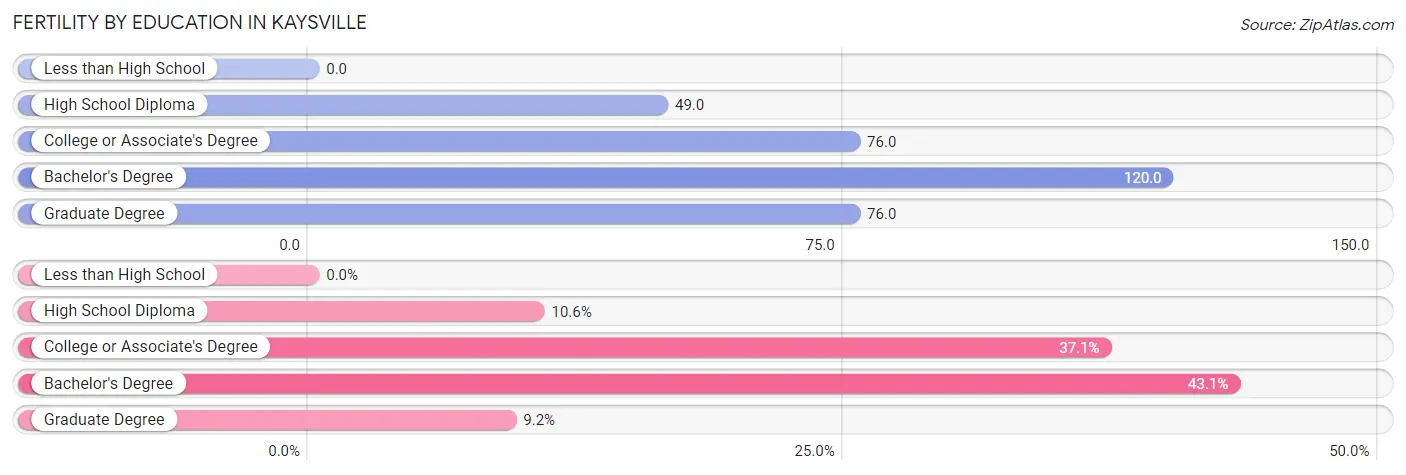
| Educational Attainment | Women with Births | Births / 1,000 Women |
| Less than High School | 0 (0.0%) | 0.0 |
| High School Diploma | 56 (10.5%) | 49.0 |
| College or Associate's Degree | 197 (37.1%) | 76.0 |
| Bachelor's Degree | 229 (43.1%) | 120.0 |
| Graduate Degree | 49 (9.2%) | 76.0 |
| Total | 531 (100.0%) | 71.0 |
Fertility by Education by Marriage Status in Kaysville
11.3% of women with births in Kaysville are unmarried. Women with the educational attainment of graduate degree are most likely to be married with 100.0% of them married at childbirth, while women with the educational attainment of high school diploma are least likely to be married with 62.5% of them unmarried at childbirth.
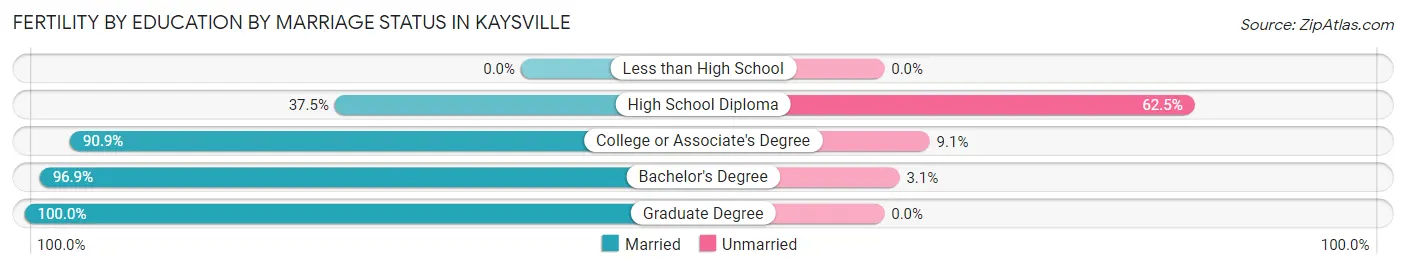
| Educational Attainment | Married | Unmarried |
| Less than High School | 0 (0.0%) | 0 (0.0%) |
| High School Diploma | 21 (37.5%) | 35 (62.5%) |
| College or Associate's Degree | 179 (90.9%) | 18 (9.1%) |
| Bachelor's Degree | 222 (96.9%) | 7 (3.1%) |
| Graduate Degree | 49 (100.0%) | 0 (0.0%) |
| Total | 471 (88.7%) | 60 (11.3%) |
Employment Characteristics in Kaysville
Employment by Class of Employer in Kaysville
Among the 14,491 employed individuals in Kaysville, private company employees (9,434 | 65.1%), local government employees (1,134 | 7.8%), and not-for-profit organizations (1,010 | 7.0%) make up the most common classes of employment.
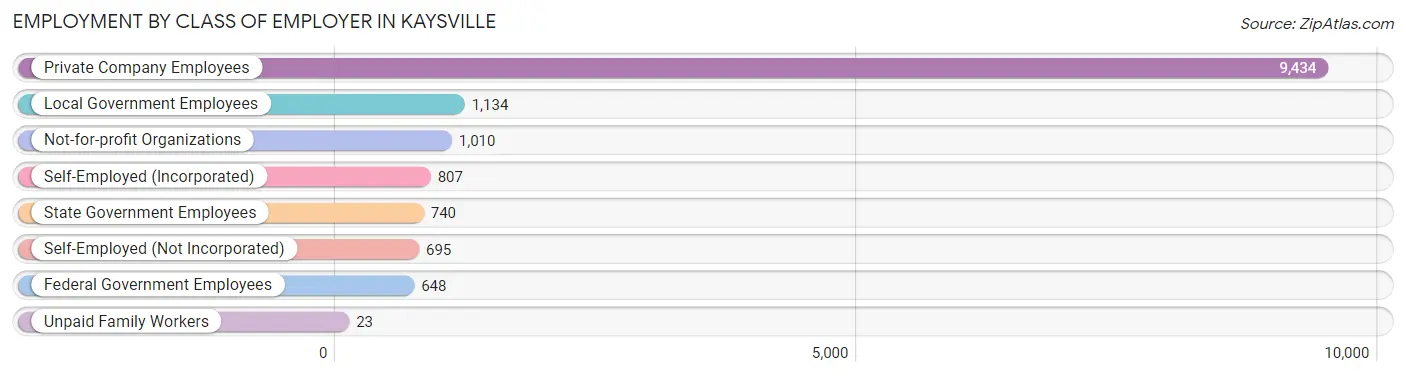
| Employer Class | # Employees | % Employees |
| Private Company Employees | 9,434 | 65.1% |
| Self-Employed (Incorporated) | 807 | 5.6% |
| Self-Employed (Not Incorporated) | 695 | 4.8% |
| Not-for-profit Organizations | 1,010 | 7.0% |
| Local Government Employees | 1,134 | 7.8% |
| State Government Employees | 740 | 5.1% |
| Federal Government Employees | 648 | 4.5% |
| Unpaid Family Workers | 23 | 0.2% |
| Total | 14,491 | 100.0% |
Employment Status by Age in Kaysville
According to the labor force statistics for Kaysville, out of the total population over 16 years of age (22,120), 68.4% or 15,130 individuals are in the labor force, with 2.6% or 393 of them unemployed. The age group with the highest labor force participation rate is 20 to 24 years, with 87.0% or 1,456 individuals in the labor force. Within the labor force, the 16 to 19 years age range has the highest percentage of unemployed individuals, with 9.5% or 99 of them being unemployed.
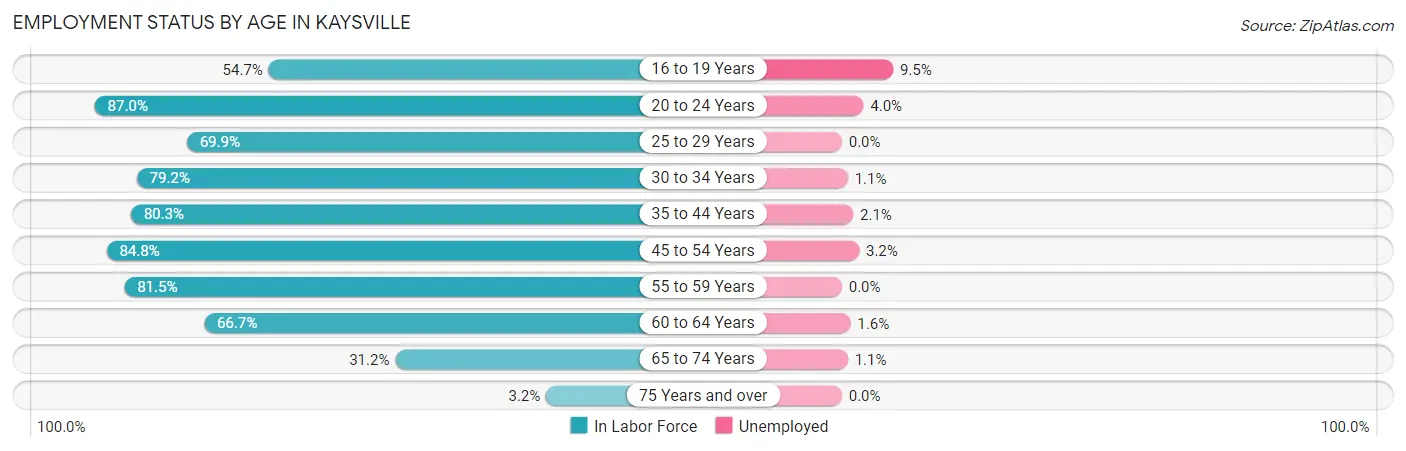
| Age Bracket | In Labor Force | Unemployed |
| 16 to 19 Years | 1,037 (54.7%) | 99 (9.5%) |
| 20 to 24 Years | 1,456 (87.0%) | 58 (4.0%) |
| 25 to 29 Years | 970 (69.9%) | 0 (0.0%) |
| 30 to 34 Years | 1,338 (79.2%) | 15 (1.1%) |
| 35 to 44 Years | 4,170 (80.3%) | 88 (2.1%) |
| 45 to 54 Years | 3,262 (84.8%) | 104 (3.2%) |
| 55 to 59 Years | 1,193 (81.5%) | 0 (0.0%) |
| 60 to 64 Years | 1,099 (66.7%) | 18 (1.6%) |
| 65 to 74 Years | 563 (31.2%) | 6 (1.1%) |
| 75 Years and over | 49 (3.2%) | 0 (0.0%) |
| Total | 15,130 (68.4%) | 393 (2.6%) |
Employment Status by Educational Attainment in Kaysville
According to labor force statistics for Kaysville, 79.0% of individuals (12,031) out of the total population between 25 and 64 years of age (15,229) are in the labor force, with 1.9% or 229 of them being unemployed. The group with the highest labor force participation rate are those with the educational attainment of bachelor's degree or higher, with 86.6% or 6,740 individuals in the labor force. Within the labor force, individuals with high school diploma education have the highest percentage of unemployment, with 6.8% or 88 of them being unemployed.
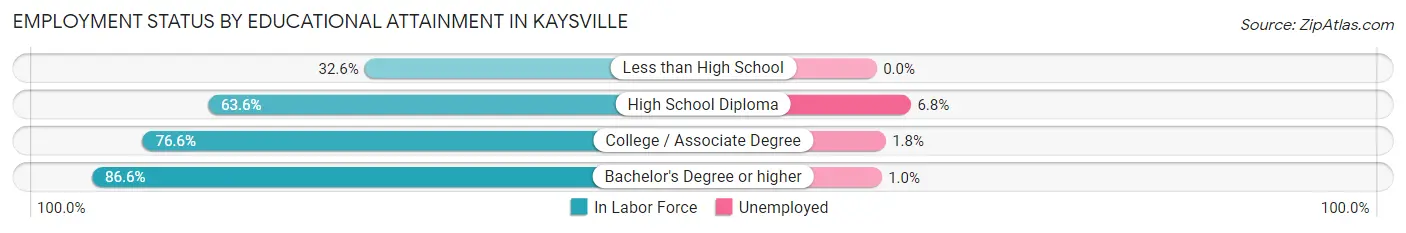
| Educational Attainment | In Labor Force | Unemployed |
| Less than High School | 106 (32.6%) | 0 (0.0%) |
| High School Diploma | 1,290 (63.6%) | 138 (6.8%) |
| College / Associate Degree | 3,901 (76.6%) | 92 (1.8%) |
| Bachelor's Degree or higher | 6,740 (86.6%) | 78 (1.0%) |
| Total | 12,031 (79.0%) | 289 (1.9%) |
Employment Occupations by Sex in Kaysville
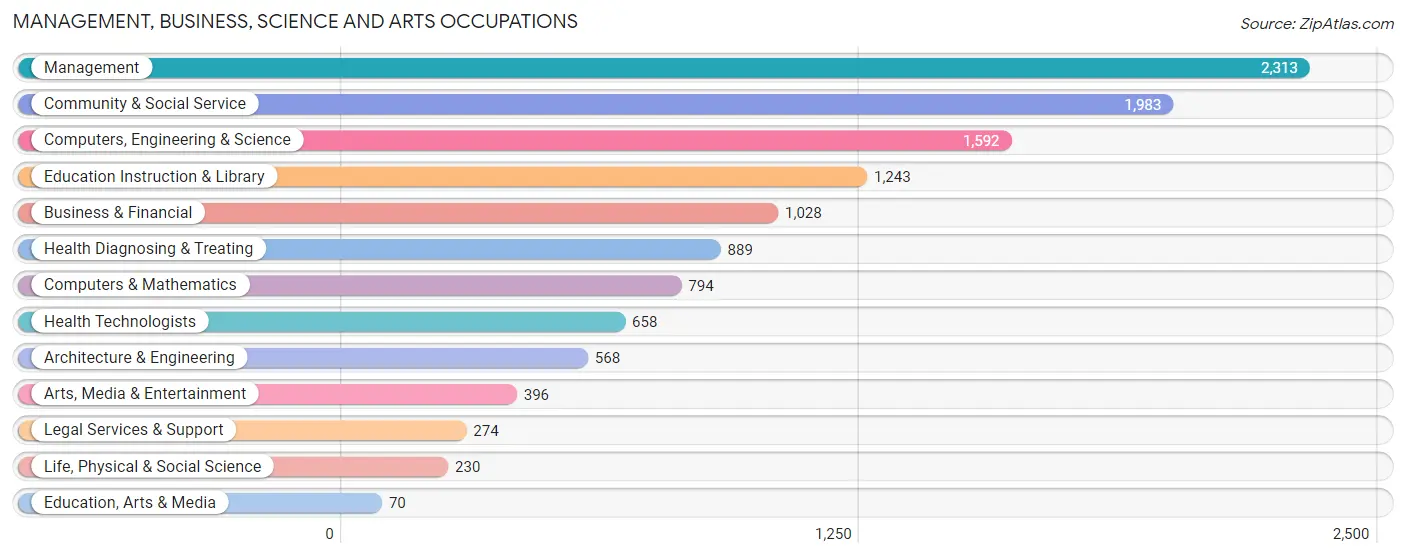
Management, Business, Science and Arts Occupations
The most common Management, Business, Science and Arts occupations in Kaysville are Management (2,313 | 15.7%), Community & Social Service (1,983 | 13.5%), Computers, Engineering & Science (1,592 | 10.8%), Education Instruction & Library (1,243 | 8.4%), and Business & Financial (1,028 | 7.0%).
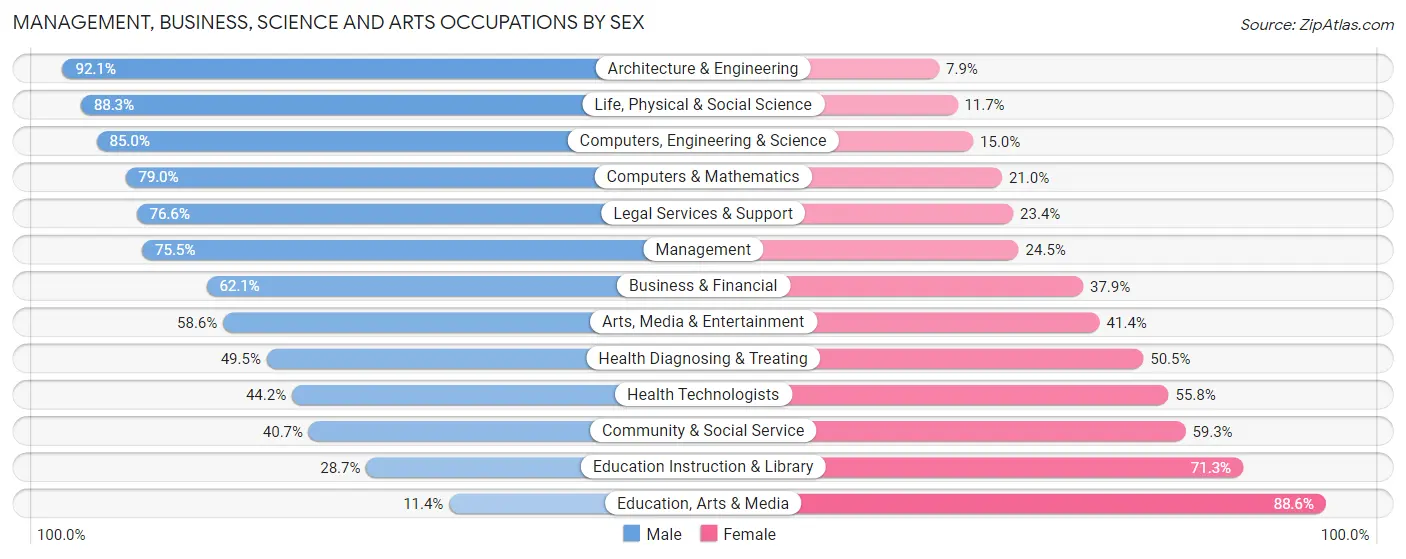
Management, Business, Science and Arts Occupations by Sex
Within the Management, Business, Science and Arts occupations in Kaysville, the most male-oriented occupations are Architecture & Engineering (92.1%), Life, Physical & Social Science (88.3%), and Computers, Engineering & Science (85.0%), while the most female-oriented occupations are Education, Arts & Media (88.6%), Education Instruction & Library (71.3%), and Community & Social Service (59.3%).
| Occupation | Male | Female |
| Management | 1,746 (75.5%) | 567 (24.5%) |
| Business & Financial | 638 (62.1%) | 390 (37.9%) |
| Computers, Engineering & Science | 1,353 (85.0%) | 239 (15.0%) |
| Computers & Mathematics | 627 (79.0%) | 167 (21.0%) |
| Architecture & Engineering | 523 (92.1%) | 45 (7.9%) |
| Life, Physical & Social Science | 203 (88.3%) | 27 (11.7%) |
| Community & Social Service | 807 (40.7%) | 1,176 (59.3%) |
| Education, Arts & Media | 8 (11.4%) | 62 (88.6%) |
| Legal Services & Support | 210 (76.6%) | 64 (23.4%) |
| Education Instruction & Library | 357 (28.7%) | 886 (71.3%) |
| Arts, Media & Entertainment | 232 (58.6%) | 164 (41.4%) |
| Health Diagnosing & Treating | 440 (49.5%) | 449 (50.5%) |
| Health Technologists | 291 (44.2%) | 367 (55.8%) |
| Total (Category) | 4,984 (63.9%) | 2,821 (36.1%) |
| Total (Overall) | 8,567 (58.2%) | 6,164 (41.8%) |
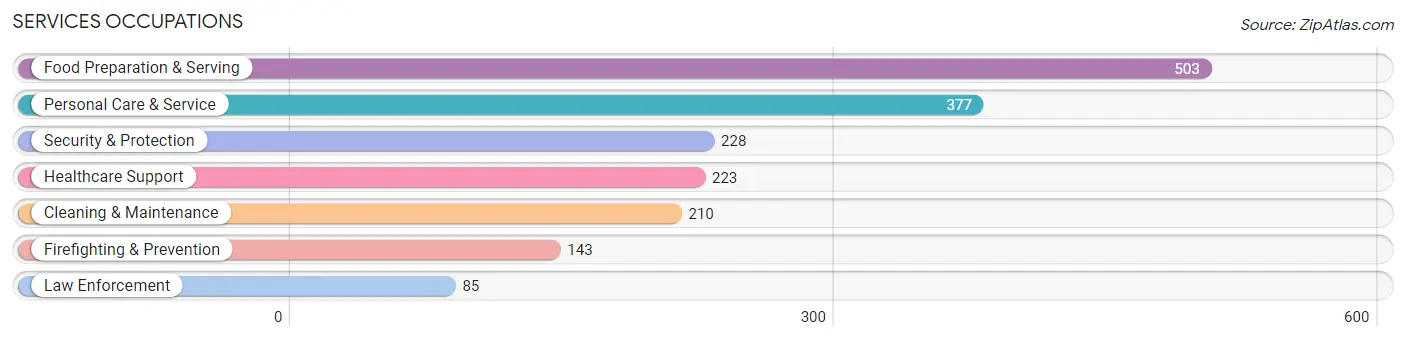
Services Occupations
The most common Services occupations in Kaysville are Food Preparation & Serving (503 | 3.4%), Personal Care & Service (377 | 2.6%), Security & Protection (228 | 1.5%), Healthcare Support (223 | 1.5%), and Cleaning & Maintenance (210 | 1.4%).
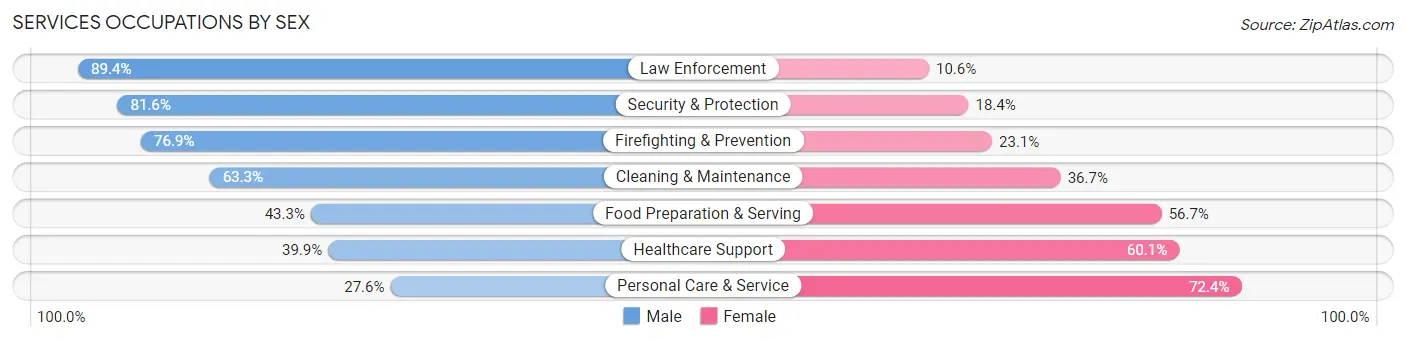
Services Occupations by Sex
Within the Services occupations in Kaysville, the most male-oriented occupations are Law Enforcement (89.4%), Security & Protection (81.6%), and Firefighting & Prevention (76.9%), while the most female-oriented occupations are Personal Care & Service (72.4%), Healthcare Support (60.1%), and Food Preparation & Serving (56.7%).
| Occupation | Male | Female |
| Healthcare Support | 89 (39.9%) | 134 (60.1%) |
| Security & Protection | 186 (81.6%) | 42 (18.4%) |
| Firefighting & Prevention | 110 (76.9%) | 33 (23.1%) |
| Law Enforcement | 76 (89.4%) | 9 (10.6%) |
| Food Preparation & Serving | 218 (43.3%) | 285 (56.7%) |
| Cleaning & Maintenance | 133 (63.3%) | 77 (36.7%) |
| Personal Care & Service | 104 (27.6%) | 273 (72.4%) |
| Total (Category) | 730 (47.4%) | 811 (52.6%) |
| Total (Overall) | 8,567 (58.2%) | 6,164 (41.8%) |
Sales and Office Occupations
The most common Sales and Office occupations in Kaysville are Office & Administration (1,917 | 13.0%), and Sales & Related (1,719 | 11.7%).

Sales and Office Occupations by Sex
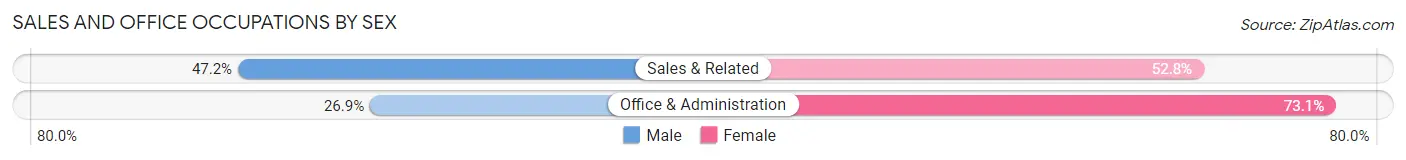
| Occupation | Male | Female |
| Sales & Related | 811 (47.2%) | 908 (52.8%) |
| Office & Administration | 515 (26.9%) | 1,402 (73.1%) |
| Total (Category) | 1,326 (36.5%) | 2,310 (63.5%) |
| Total (Overall) | 8,567 (58.2%) | 6,164 (41.8%) |
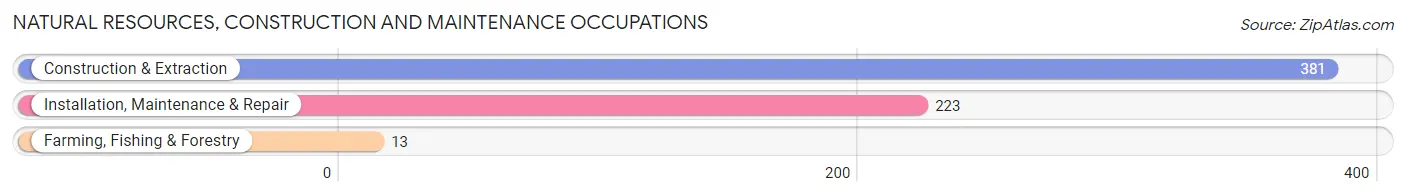
Natural Resources, Construction and Maintenance Occupations
The most common Natural Resources, Construction and Maintenance occupations in Kaysville are Construction & Extraction (381 | 2.6%), Installation, Maintenance & Repair (223 | 1.5%), and Farming, Fishing & Forestry (13 | 0.1%).
Natural Resources, Construction and Maintenance Occupations by Sex

| Occupation | Male | Female |
| Farming, Fishing & Forestry | 0 (0.0%) | 13 (100.0%) |
| Construction & Extraction | 381 (100.0%) | 0 (0.0%) |
| Installation, Maintenance & Repair | 223 (100.0%) | 0 (0.0%) |
| Total (Category) | 604 (97.9%) | 13 (2.1%) |
| Total (Overall) | 8,567 (58.2%) | 6,164 (41.8%) |
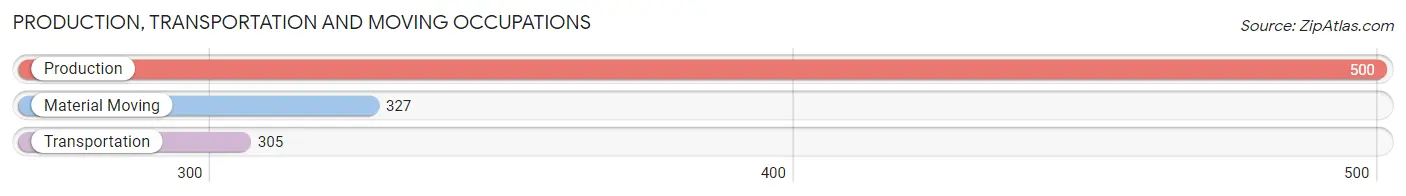
Production, Transportation and Moving Occupations
The most common Production, Transportation and Moving occupations in Kaysville are Production (500 | 3.4%), Material Moving (327 | 2.2%), and Transportation (305 | 2.1%).
Production, Transportation and Moving Occupations by Sex
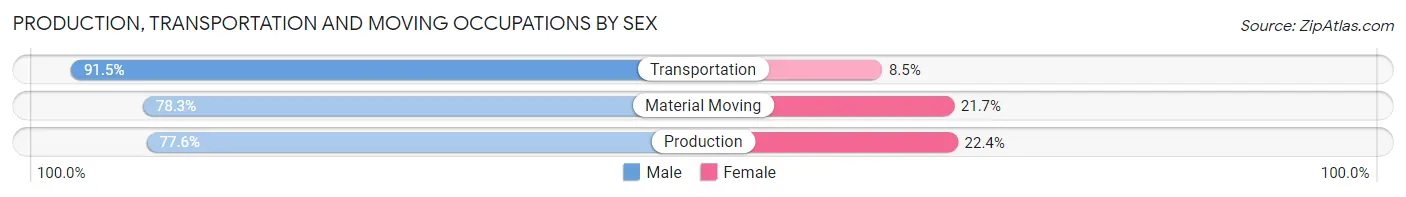
| Occupation | Male | Female |
| Production | 388 (77.6%) | 112 (22.4%) |
| Transportation | 279 (91.5%) | 26 (8.5%) |
| Material Moving | 256 (78.3%) | 71 (21.7%) |
| Total (Category) | 923 (81.5%) | 209 (18.5%) |
| Total (Overall) | 8,567 (58.2%) | 6,164 (41.8%) |
Employment Industries by Sex in Kaysville
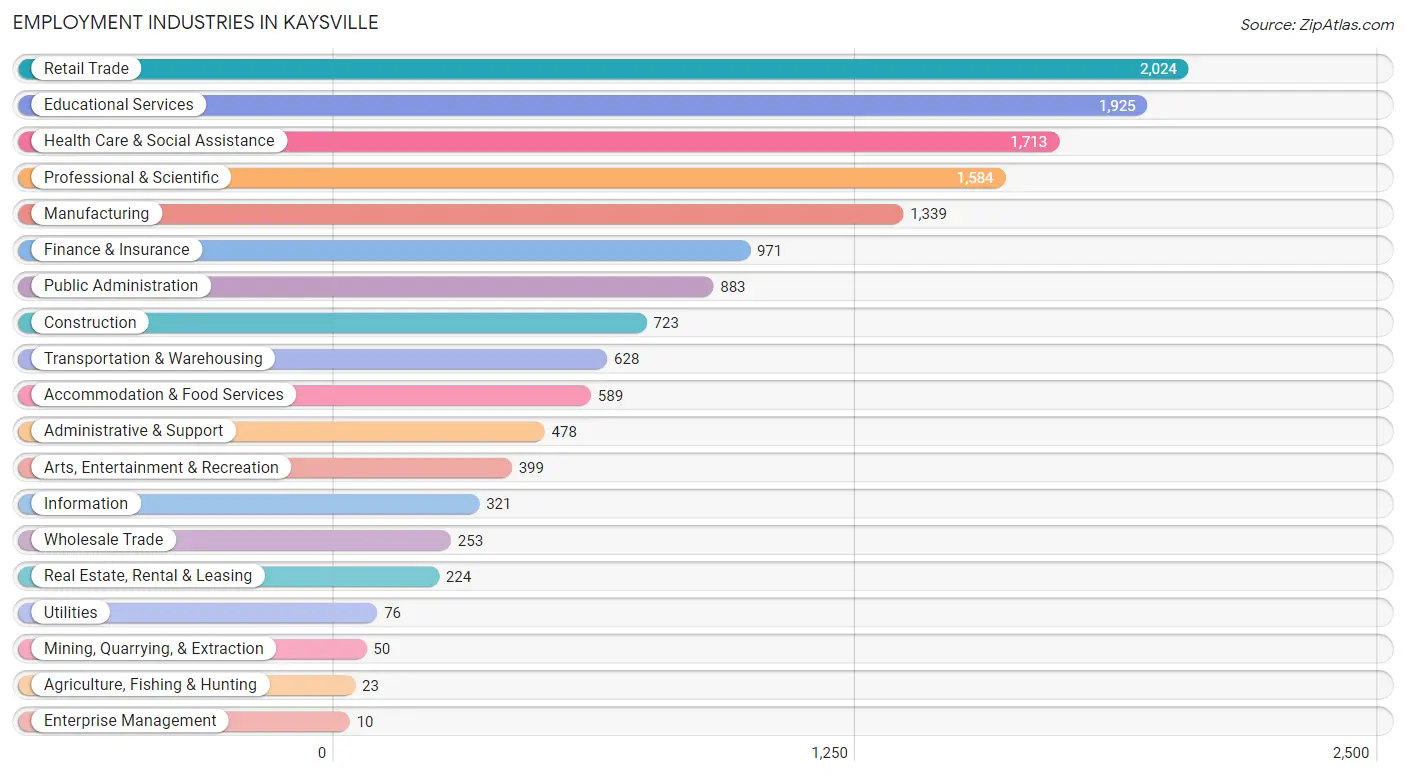
Employment Industries in Kaysville
The major employment industries in Kaysville include Retail Trade (2,024 | 13.7%), Educational Services (1,925 | 13.1%), Health Care & Social Assistance (1,713 | 11.6%), Professional & Scientific (1,584 | 10.7%), and Manufacturing (1,339 | 9.1%).
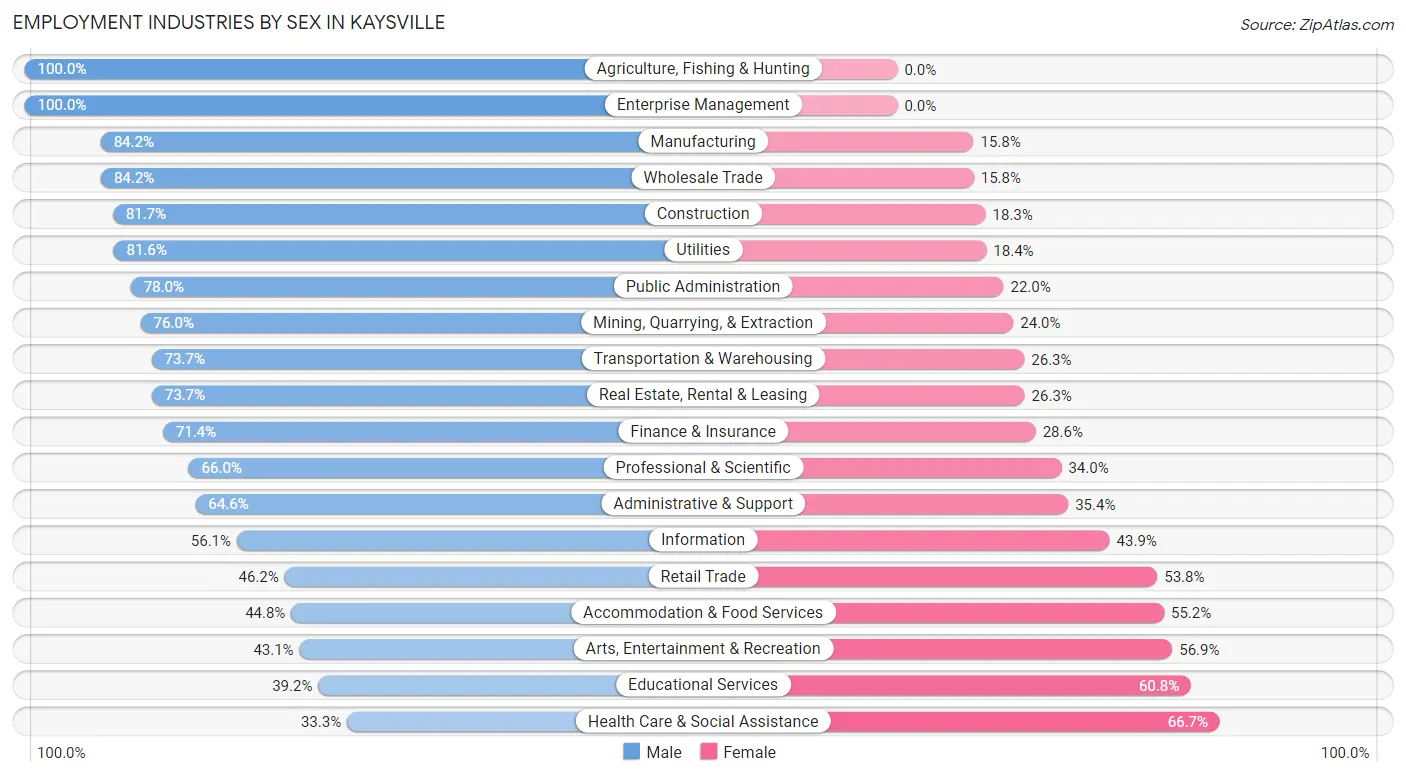
Employment Industries by Sex in Kaysville
The Kaysville industries that see more men than women are Agriculture, Fishing & Hunting (100.0%), Enterprise Management (100.0%), and Manufacturing (84.2%), whereas the industries that tend to have a higher number of women are Health Care & Social Assistance (66.7%), Educational Services (60.8%), and Arts, Entertainment & Recreation (56.9%).
| Industry | Male | Female |
| Agriculture, Fishing & Hunting | 23 (100.0%) | 0 (0.0%) |
| Mining, Quarrying, & Extraction | 38 (76.0%) | 12 (24.0%) |
| Construction | 591 (81.7%) | 132 (18.3%) |
| Manufacturing | 1,128 (84.2%) | 211 (15.8%) |
| Wholesale Trade | 213 (84.2%) | 40 (15.8%) |
| Retail Trade | 935 (46.2%) | 1,089 (53.8%) |
| Transportation & Warehousing | 463 (73.7%) | 165 (26.3%) |
| Utilities | 62 (81.6%) | 14 (18.4%) |
| Information | 180 (56.1%) | 141 (43.9%) |
| Finance & Insurance | 693 (71.4%) | 278 (28.6%) |
| Real Estate, Rental & Leasing | 165 (73.7%) | 59 (26.3%) |
| Professional & Scientific | 1,046 (66.0%) | 538 (34.0%) |
| Enterprise Management | 10 (100.0%) | 0 (0.0%) |
| Administrative & Support | 309 (64.6%) | 169 (35.4%) |
| Educational Services | 755 (39.2%) | 1,170 (60.8%) |
| Health Care & Social Assistance | 570 (33.3%) | 1,143 (66.7%) |
| Arts, Entertainment & Recreation | 172 (43.1%) | 227 (56.9%) |
| Accommodation & Food Services | 264 (44.8%) | 325 (55.2%) |
| Public Administration | 689 (78.0%) | 194 (22.0%) |
| Total | 8,567 (58.2%) | 6,164 (41.8%) |
Education in Kaysville
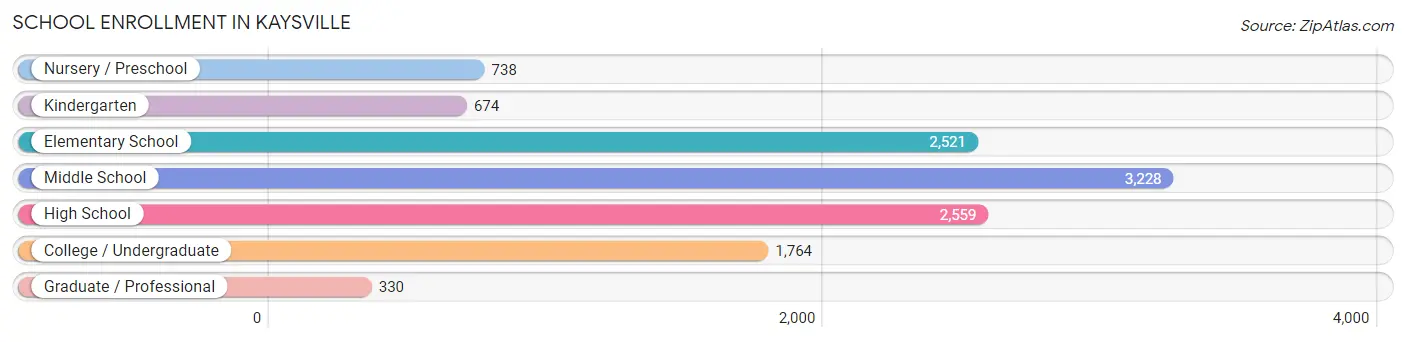
School Enrollment in Kaysville
The most common levels of schooling among the 11,814 students in Kaysville are middle school (3,228 | 27.3%), high school (2,559 | 21.7%), and elementary school (2,521 | 21.3%).
| School Level | # Students | % Students |
| Nursery / Preschool | 738 | 6.2% |
| Kindergarten | 674 | 5.7% |
| Elementary School | 2,521 | 21.3% |
| Middle School | 3,228 | 27.3% |
| High School | 2,559 | 21.7% |
| College / Undergraduate | 1,764 | 14.9% |
| Graduate / Professional | 330 | 2.8% |
| Total | 11,814 | 100.0% |
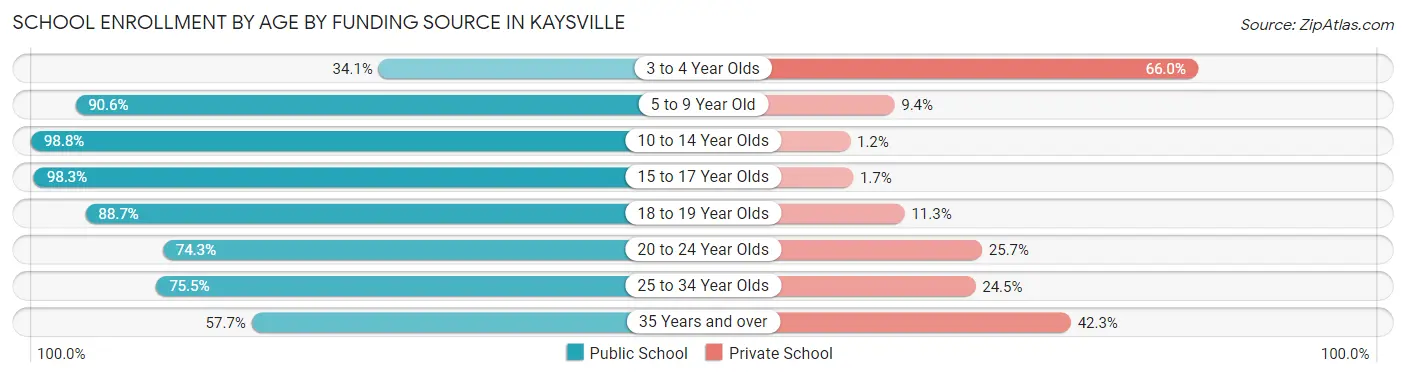
School Enrollment by Age by Funding Source in Kaysville
Out of a total of 11,814 students who are enrolled in schools in Kaysville, 1,229 (10.4%) attend a private institution, while the remaining 10,585 (89.6%) are enrolled in public schools. The age group of 3 to 4 year olds has the highest likelihood of being enrolled in private schools, with 184 (65.9% in the age bracket) enrolled. Conversely, the age group of 10 to 14 year olds has the lowest likelihood of being enrolled in a private school, with 3,855 (98.8% in the age bracket) attending a public institution.
| Age Bracket | Public School | Private School |
| 3 to 4 Year Olds | 95 (34.1%) | 184 (65.9%) |
| 5 to 9 Year Old | 2,899 (90.6%) | 302 (9.4%) |
| 10 to 14 Year Olds | 3,855 (98.8%) | 46 (1.2%) |
| 15 to 17 Year Olds | 1,928 (98.3%) | 34 (1.7%) |
| 18 to 19 Year Olds | 446 (88.7%) | 57 (11.3%) |
| 20 to 24 Year Olds | 649 (74.3%) | 225 (25.7%) |
| 25 to 34 Year Olds | 351 (75.5%) | 114 (24.5%) |
| 35 Years and over | 363 (57.7%) | 266 (42.3%) |
| Total | 10,585 (89.6%) | 1,229 (10.4%) |
Educational Attainment by Field of Study in Kaysville
Business (2,047 | 20.7%), education (1,259 | 12.7%), science & technology (1,163 | 11.7%), arts & humanities (1,050 | 10.6%), and engineering (773 | 7.8%) are the most common fields of study among 9,895 individuals in Kaysville who have obtained a bachelor's degree or higher.
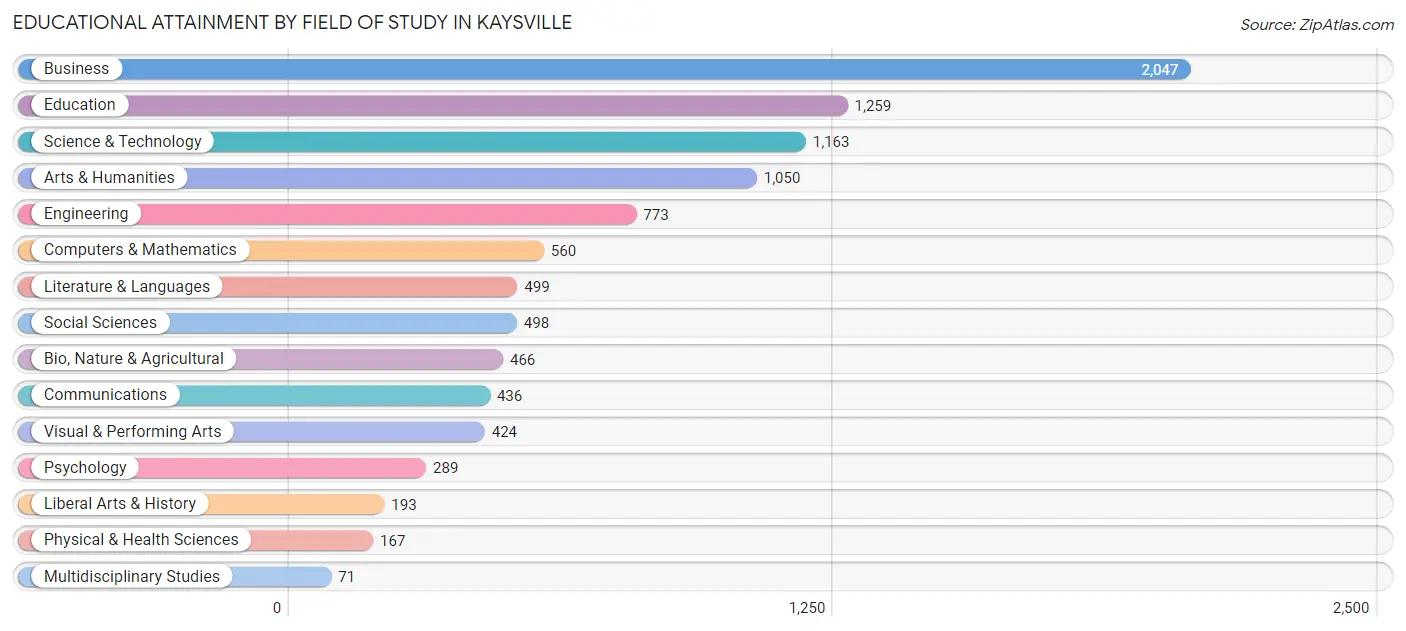
| Field of Study | # Graduates | % Graduates |
| Computers & Mathematics | 560 | 5.7% |
| Bio, Nature & Agricultural | 466 | 4.7% |
| Physical & Health Sciences | 167 | 1.7% |
| Psychology | 289 | 2.9% |
| Social Sciences | 498 | 5.0% |
| Engineering | 773 | 7.8% |
| Multidisciplinary Studies | 71 | 0.7% |
| Science & Technology | 1,163 | 11.7% |
| Business | 2,047 | 20.7% |
| Education | 1,259 | 12.7% |
| Literature & Languages | 499 | 5.0% |
| Liberal Arts & History | 193 | 1.9% |
| Visual & Performing Arts | 424 | 4.3% |
| Communications | 436 | 4.4% |
| Arts & Humanities | 1,050 | 10.6% |
| Total | 9,895 | 100.0% |
Transportation & Commute in Kaysville
Vehicle Availability by Sex in Kaysville
The most prevalent vehicle ownership categories in Kaysville are males with 2 vehicles (2,974, accounting for 35.3%) and females with 2 vehicles (2,198, making up 49.1%).
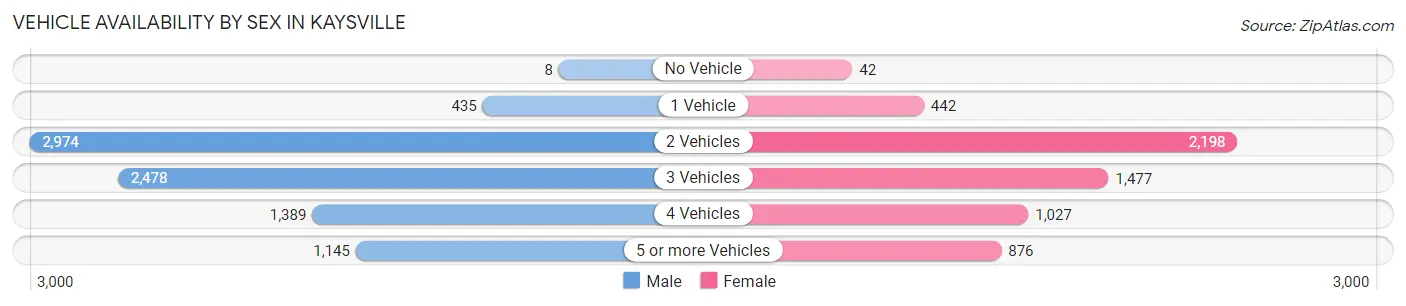
| Vehicles Available | Male | Female |
| No Vehicle | 8 (0.1%) | 42 (0.7%) |
| 1 Vehicle | 435 (5.2%) | 442 (7.3%) |
| 2 Vehicles | 2,974 (35.3%) | 2,198 (36.3%) |
| 3 Vehicles | 2,478 (29.4%) | 1,477 (24.4%) |
| 4 Vehicles | 1,389 (16.5%) | 1,027 (16.9%) |
| 5 or more Vehicles | 1,145 (13.6%) | 876 (14.4%) |
| Total | 8,429 (100.0%) | 6,062 (100.0%) |
Commute Time in Kaysville
The most frequently occuring commute durations in Kaysville are 15 to 19 minutes (2,021 commuters, 17.1%), 30 to 34 minutes (1,784 commuters, 15.1%), and 20 to 24 minutes (1,538 commuters, 13.0%).
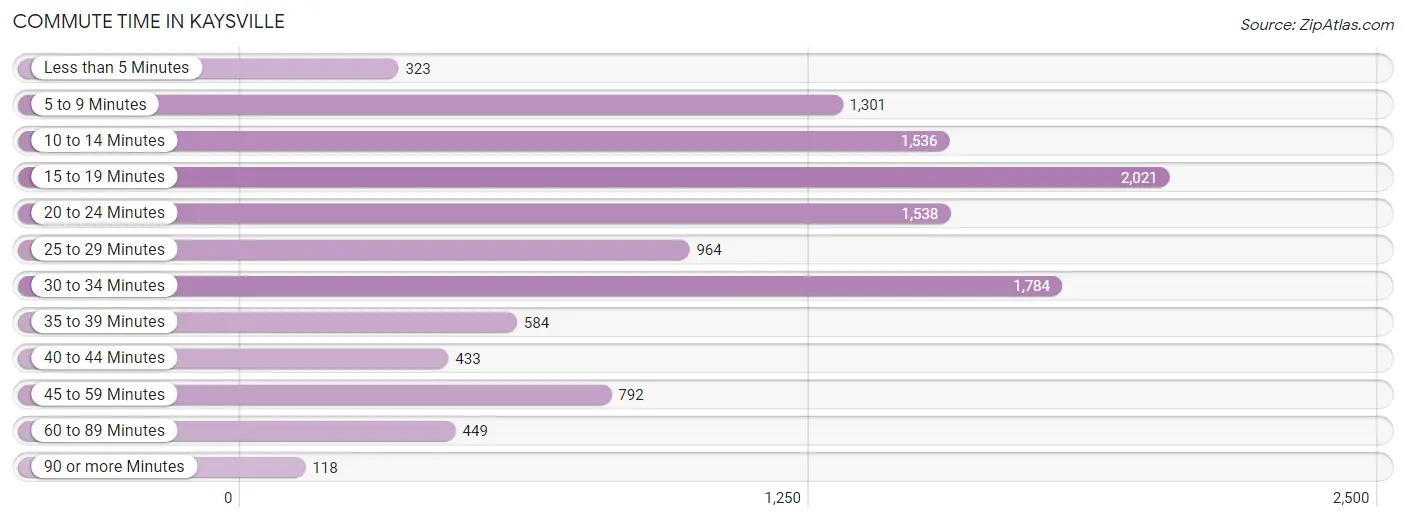
| Commute Time | # Commuters | % Commuters |
| Less than 5 Minutes | 323 | 2.7% |
| 5 to 9 Minutes | 1,301 | 11.0% |
| 10 to 14 Minutes | 1,536 | 13.0% |
| 15 to 19 Minutes | 2,021 | 17.1% |
| 20 to 24 Minutes | 1,538 | 13.0% |
| 25 to 29 Minutes | 964 | 8.1% |
| 30 to 34 Minutes | 1,784 | 15.1% |
| 35 to 39 Minutes | 584 | 4.9% |
| 40 to 44 Minutes | 433 | 3.7% |
| 45 to 59 Minutes | 792 | 6.7% |
| 60 to 89 Minutes | 449 | 3.8% |
| 90 or more Minutes | 118 | 1.0% |
Commute Time by Sex in Kaysville
The most common commute times in Kaysville are 30 to 34 minutes (1,127 commuters, 16.3%) for males and 15 to 19 minutes (976 commuters, 19.8%) for females.
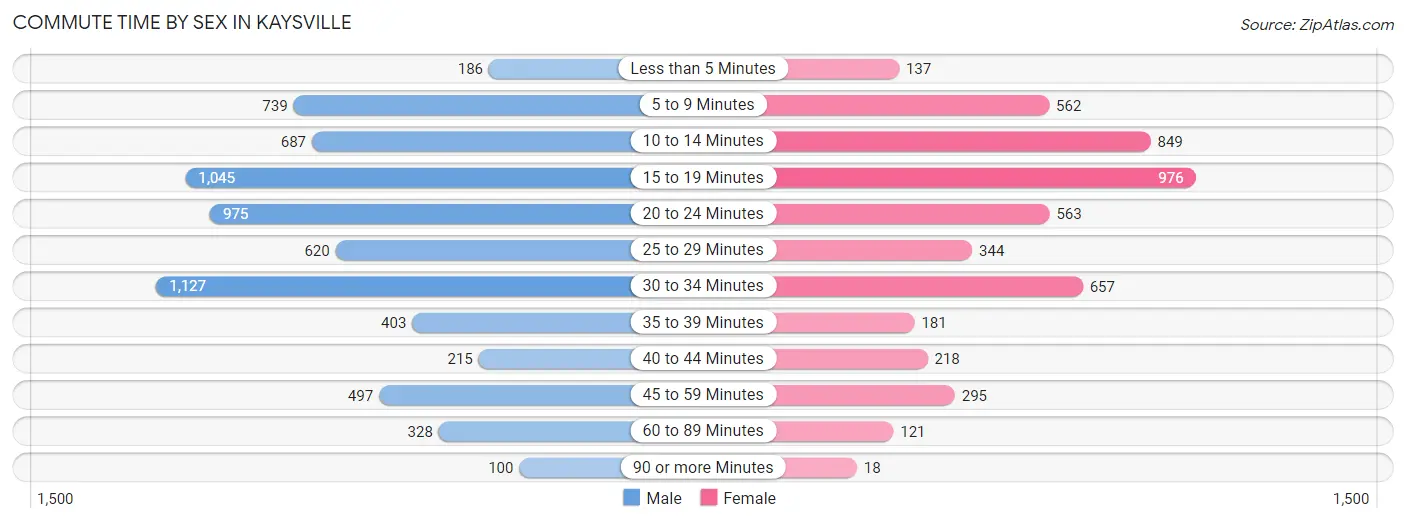
| Commute Time | Male | Female |
| Less than 5 Minutes | 186 (2.7%) | 137 (2.8%) |
| 5 to 9 Minutes | 739 (10.7%) | 562 (11.4%) |
| 10 to 14 Minutes | 687 (9.9%) | 849 (17.2%) |
| 15 to 19 Minutes | 1,045 (15.1%) | 976 (19.8%) |
| 20 to 24 Minutes | 975 (14.1%) | 563 (11.4%) |
| 25 to 29 Minutes | 620 (9.0%) | 344 (7.0%) |
| 30 to 34 Minutes | 1,127 (16.3%) | 657 (13.4%) |
| 35 to 39 Minutes | 403 (5.8%) | 181 (3.7%) |
| 40 to 44 Minutes | 215 (3.1%) | 218 (4.4%) |
| 45 to 59 Minutes | 497 (7.2%) | 295 (6.0%) |
| 60 to 89 Minutes | 328 (4.7%) | 121 (2.5%) |
| 90 or more Minutes | 100 (1.4%) | 18 (0.4%) |
Time of Departure to Work by Sex in Kaysville
The most frequent times of departure to work in Kaysville are 8:00 AM to 8:29 AM (969, 14.0%) for males and 7:30 AM to 7:59 AM (790, 16.1%) for females.
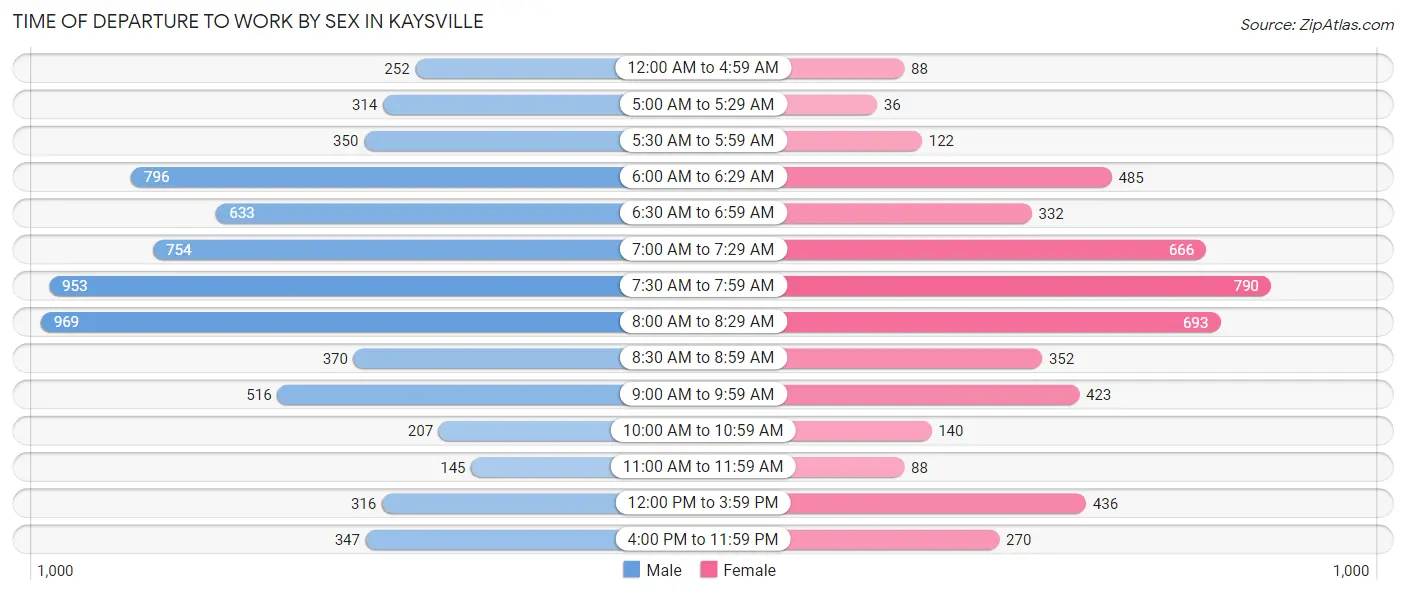
| Time of Departure | Male | Female |
| 12:00 AM to 4:59 AM | 252 (3.6%) | 88 (1.8%) |
| 5:00 AM to 5:29 AM | 314 (4.5%) | 36 (0.7%) |
| 5:30 AM to 5:59 AM | 350 (5.1%) | 122 (2.5%) |
| 6:00 AM to 6:29 AM | 796 (11.5%) | 485 (9.9%) |
| 6:30 AM to 6:59 AM | 633 (9.1%) | 332 (6.8%) |
| 7:00 AM to 7:29 AM | 754 (10.9%) | 666 (13.5%) |
| 7:30 AM to 7:59 AM | 953 (13.8%) | 790 (16.1%) |
| 8:00 AM to 8:29 AM | 969 (14.0%) | 693 (14.1%) |
| 8:30 AM to 8:59 AM | 370 (5.3%) | 352 (7.1%) |
| 9:00 AM to 9:59 AM | 516 (7.4%) | 423 (8.6%) |
| 10:00 AM to 10:59 AM | 207 (3.0%) | 140 (2.8%) |
| 11:00 AM to 11:59 AM | 145 (2.1%) | 88 (1.8%) |
| 12:00 PM to 3:59 PM | 316 (4.6%) | 436 (8.9%) |
| 4:00 PM to 11:59 PM | 347 (5.0%) | 270 (5.5%) |
| Total | 6,922 (100.0%) | 4,921 (100.0%) |
Housing Occupancy in Kaysville
Occupancy by Ownership in Kaysville
Of the total 8,996 dwellings in Kaysville, owner-occupied units account for 7,908 (87.9%), while renter-occupied units make up 1,088 (12.1%).
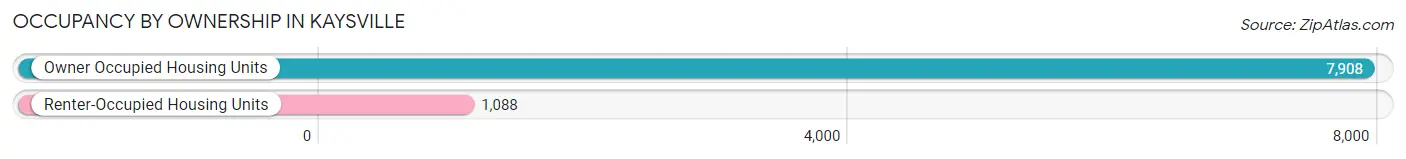
| Occupancy | # Housing Units | % Housing Units |
| Owner Occupied Housing Units | 7,908 | 87.9% |
| Renter-Occupied Housing Units | 1,088 | 12.1% |
| Total Occupied Housing Units | 8,996 | 100.0% |
Occupancy by Household Size in Kaysville
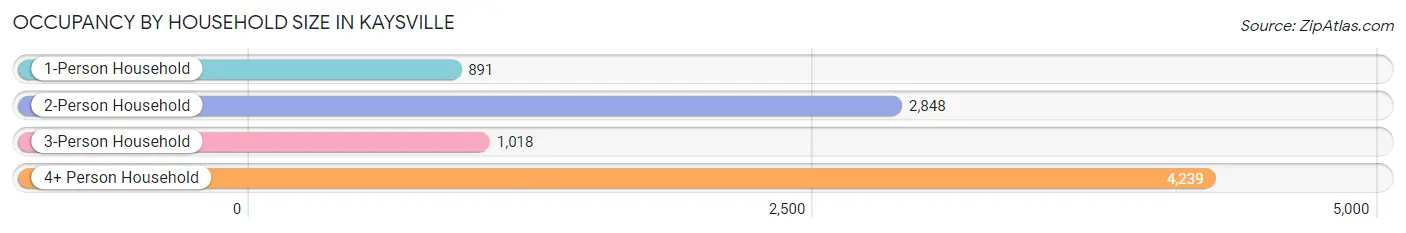
| Household Size | # Housing Units | % Housing Units |
| 1-Person Household | 891 | 9.9% |
| 2-Person Household | 2,848 | 31.7% |
| 3-Person Household | 1,018 | 11.3% |
| 4+ Person Household | 4,239 | 47.1% |
| Total Housing Units | 8,996 | 100.0% |
Occupancy by Ownership by Household Size in Kaysville
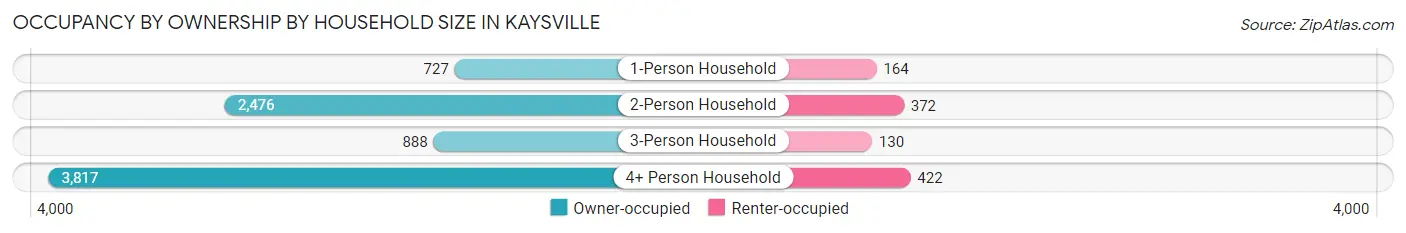
| Household Size | Owner-occupied | Renter-occupied |
| 1-Person Household | 727 (81.6%) | 164 (18.4%) |
| 2-Person Household | 2,476 (86.9%) | 372 (13.1%) |
| 3-Person Household | 888 (87.2%) | 130 (12.8%) |
| 4+ Person Household | 3,817 (90.0%) | 422 (10.0%) |
| Total Housing Units | 7,908 (87.9%) | 1,088 (12.1%) |
Occupancy by Educational Attainment in Kaysville
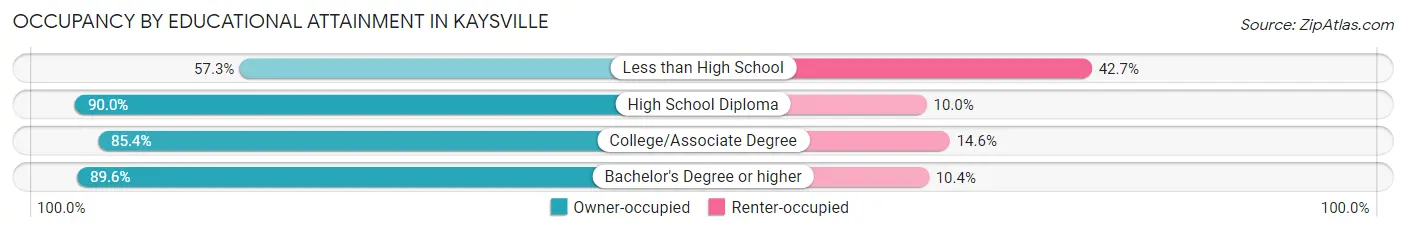
| Household Size | Owner-occupied | Renter-occupied |
| Less than High School | 71 (57.3%) | 53 (42.7%) |
| High School Diploma | 829 (90.0%) | 92 (10.0%) |
| College/Associate Degree | 2,350 (85.4%) | 401 (14.6%) |
| Bachelor's Degree or higher | 4,658 (89.6%) | 542 (10.4%) |
Occupancy by Age of Householder in Kaysville
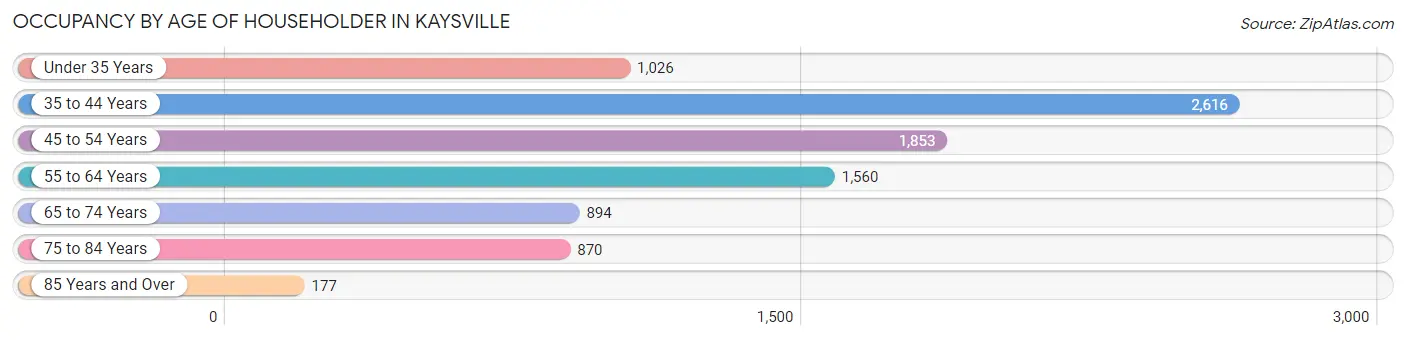
| Age Bracket | # Households | % Households |
| Under 35 Years | 1,026 | 11.4% |
| 35 to 44 Years | 2,616 | 29.1% |
| 45 to 54 Years | 1,853 | 20.6% |
| 55 to 64 Years | 1,560 | 17.3% |
| 65 to 74 Years | 894 | 9.9% |
| 75 to 84 Years | 870 | 9.7% |
| 85 Years and Over | 177 | 2.0% |
| Total | 8,996 | 100.0% |
Housing Finances in Kaysville
Median Income by Occupancy in Kaysville
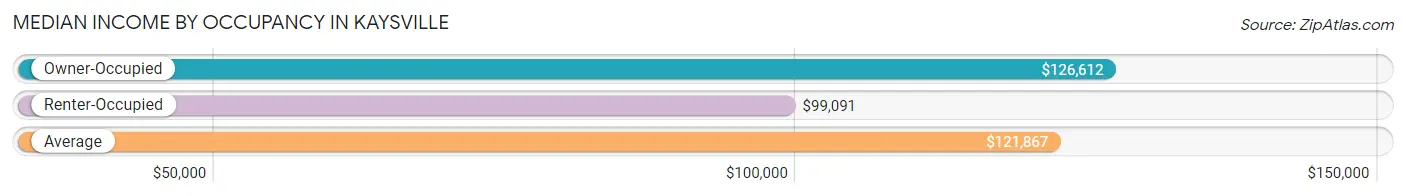
| Occupancy Type | # Households | Median Income |
| Owner-Occupied | 7,908 (87.9%) | $126,612 |
| Renter-Occupied | 1,088 (12.1%) | $99,091 |
| Average | 8,996 (100.0%) | $121,867 |
Occupancy by Householder Income Bracket in Kaysville
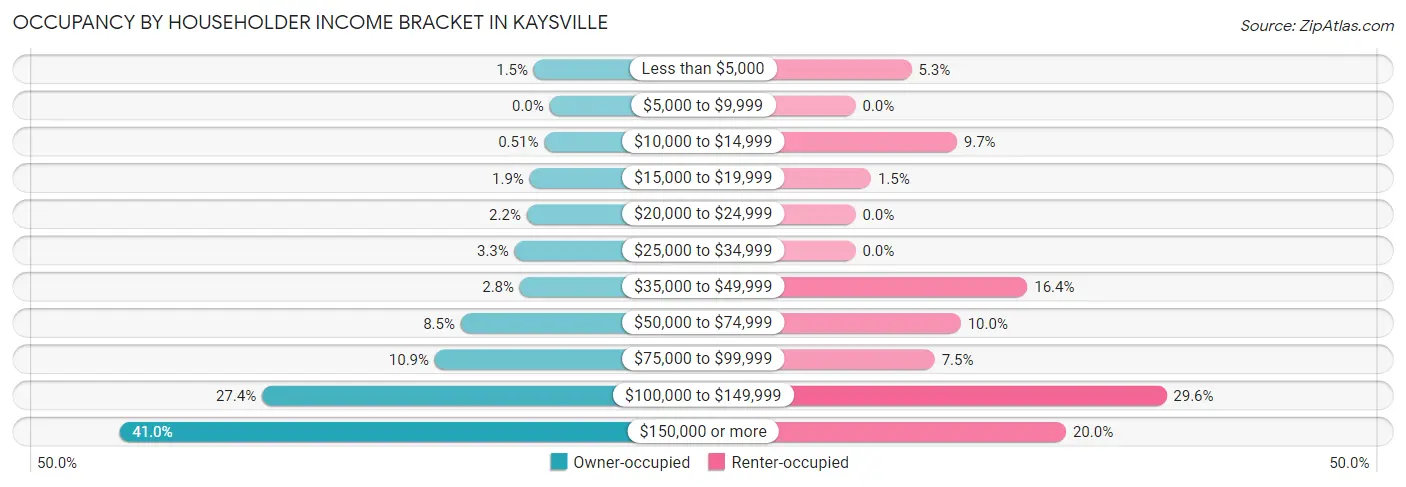
| Income Bracket | Owner-occupied | Renter-occupied |
| Less than $5,000 | 119 (1.5%) | 58 (5.3%) |
| $5,000 to $9,999 | 0 (0.0%) | 0 (0.0%) |
| $10,000 to $14,999 | 40 (0.5%) | 105 (9.7%) |
| $15,000 to $19,999 | 150 (1.9%) | 16 (1.5%) |
| $20,000 to $24,999 | 172 (2.2%) | 0 (0.0%) |
| $25,000 to $34,999 | 263 (3.3%) | 0 (0.0%) |
| $35,000 to $49,999 | 224 (2.8%) | 178 (16.4%) |
| $50,000 to $74,999 | 669 (8.5%) | 109 (10.0%) |
| $75,000 to $99,999 | 864 (10.9%) | 82 (7.5%) |
| $100,000 to $149,999 | 2,166 (27.4%) | 322 (29.6%) |
| $150,000 or more | 3,241 (41.0%) | 218 (20.0%) |
| Total | 7,908 (100.0%) | 1,088 (100.0%) |
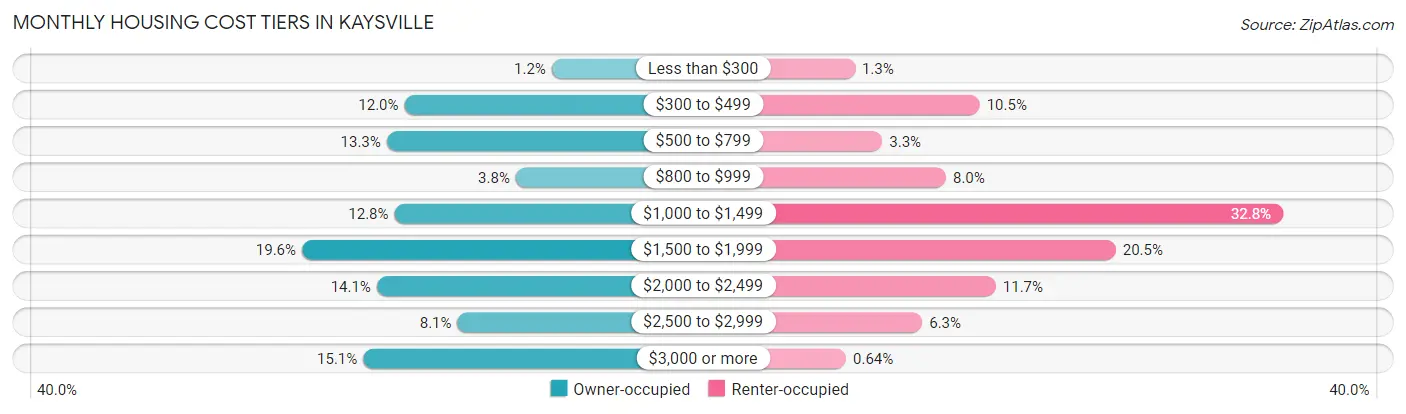
Monthly Housing Cost Tiers in Kaysville
| Monthly Cost | Owner-occupied | Renter-occupied |
| Less than $300 | 93 (1.2%) | 14 (1.3%) |
| $300 to $499 | 951 (12.0%) | 114 (10.5%) |
| $500 to $799 | 1,055 (13.3%) | 36 (3.3%) |
| $800 to $999 | 303 (3.8%) | 87 (8.0%) |
| $1,000 to $1,499 | 1,010 (12.8%) | 357 (32.8%) |
| $1,500 to $1,999 | 1,548 (19.6%) | 223 (20.5%) |
| $2,000 to $2,499 | 1,113 (14.1%) | 127 (11.7%) |
| $2,500 to $2,999 | 643 (8.1%) | 68 (6.2%) |
| $3,000 or more | 1,192 (15.1%) | 7 (0.6%) |
| Total | 7,908 (100.0%) | 1,088 (100.0%) |
Physical Housing Characteristics in Kaysville
Housing Structures in Kaysville
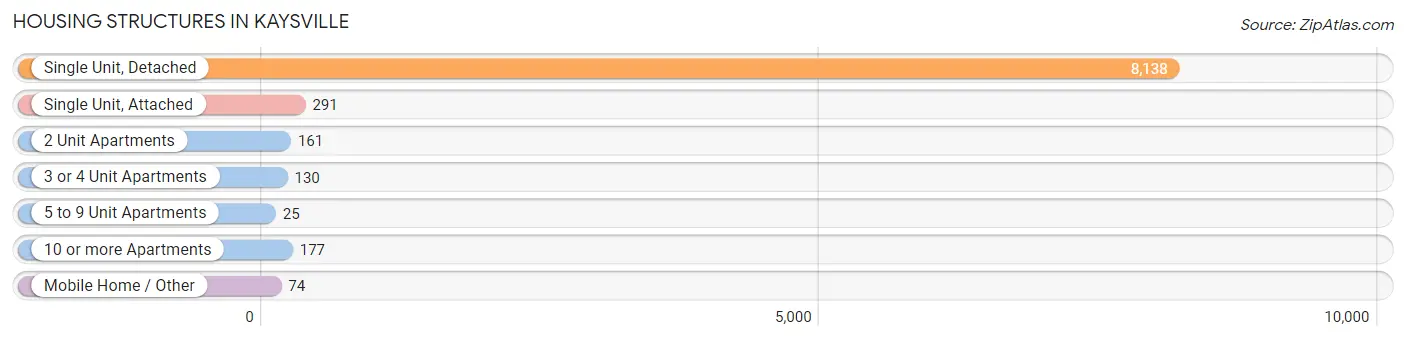
| Structure Type | # Housing Units | % Housing Units |
| Single Unit, Detached | 8,138 | 90.5% |
| Single Unit, Attached | 291 | 3.2% |
| 2 Unit Apartments | 161 | 1.8% |
| 3 or 4 Unit Apartments | 130 | 1.5% |
| 5 to 9 Unit Apartments | 25 | 0.3% |
| 10 or more Apartments | 177 | 2.0% |
| Mobile Home / Other | 74 | 0.8% |
| Total | 8,996 | 100.0% |
Housing Structures by Occupancy in Kaysville
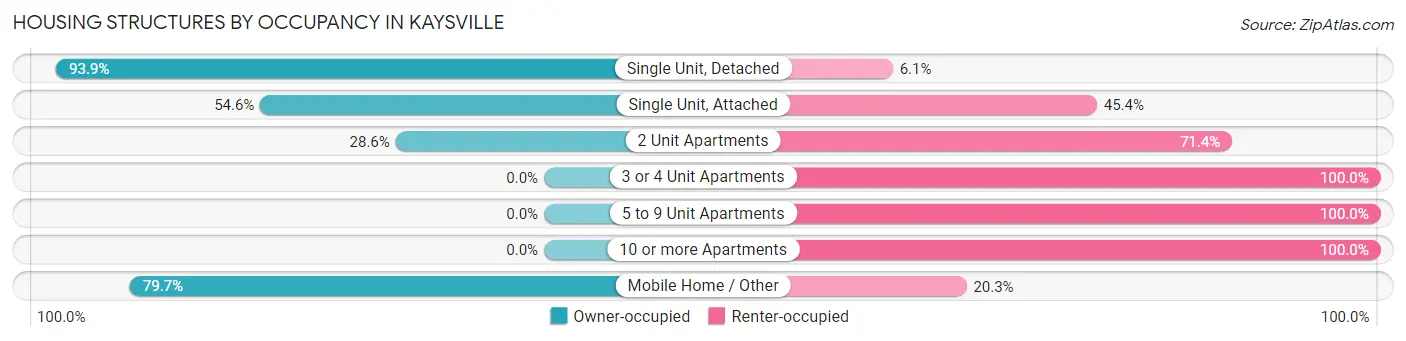
| Structure Type | Owner-occupied | Renter-occupied |
| Single Unit, Detached | 7,644 (93.9%) | 494 (6.1%) |
| Single Unit, Attached | 159 (54.6%) | 132 (45.4%) |
| 2 Unit Apartments | 46 (28.6%) | 115 (71.4%) |
| 3 or 4 Unit Apartments | 0 (0.0%) | 130 (100.0%) |
| 5 to 9 Unit Apartments | 0 (0.0%) | 25 (100.0%) |
| 10 or more Apartments | 0 (0.0%) | 177 (100.0%) |
| Mobile Home / Other | 59 (79.7%) | 15 (20.3%) |
| Total | 7,908 (87.9%) | 1,088 (12.1%) |
Housing Structures by Number of Rooms in Kaysville
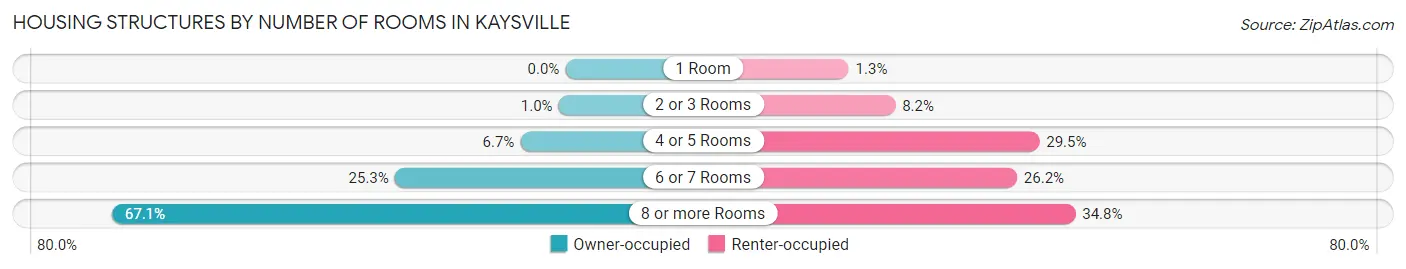
| Number of Rooms | Owner-occupied | Renter-occupied |
| 1 Room | 0 (0.0%) | 14 (1.3%) |
| 2 or 3 Rooms | 79 (1.0%) | 89 (8.2%) |
| 4 or 5 Rooms | 527 (6.7%) | 321 (29.5%) |
| 6 or 7 Rooms | 1,997 (25.3%) | 285 (26.2%) |
| 8 or more Rooms | 5,305 (67.1%) | 379 (34.8%) |
| Total | 7,908 (100.0%) | 1,088 (100.0%) |
Housing Structure by Heating Type in Kaysville
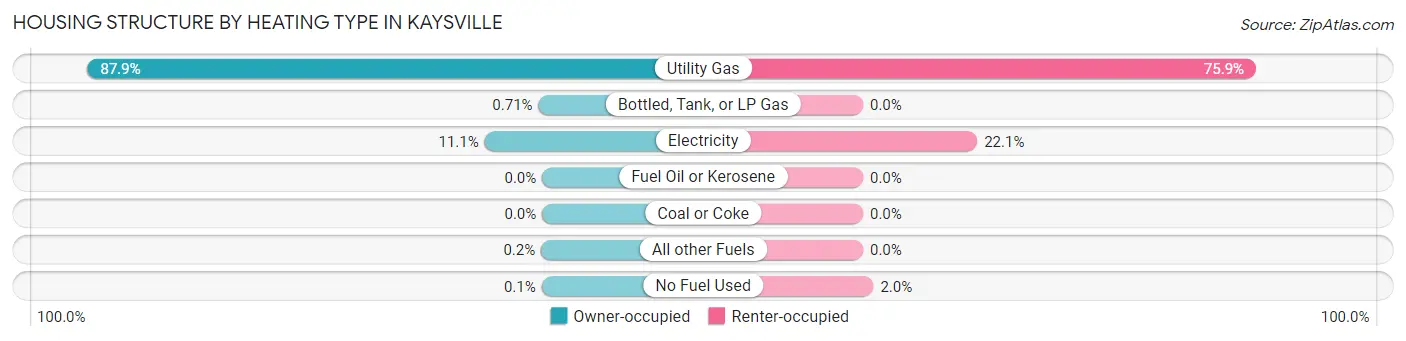
| Heating Type | Owner-occupied | Renter-occupied |
| Utility Gas | 6,949 (87.9%) | 826 (75.9%) |
| Bottled, Tank, or LP Gas | 56 (0.7%) | 0 (0.0%) |
| Electricity | 879 (11.1%) | 240 (22.1%) |
| Fuel Oil or Kerosene | 0 (0.0%) | 0 (0.0%) |
| Coal or Coke | 0 (0.0%) | 0 (0.0%) |
| All other Fuels | 16 (0.2%) | 0 (0.0%) |
| No Fuel Used | 8 (0.1%) | 22 (2.0%) |
| Total | 7,908 (100.0%) | 1,088 (100.0%) |
Household Vehicle Usage in Kaysville
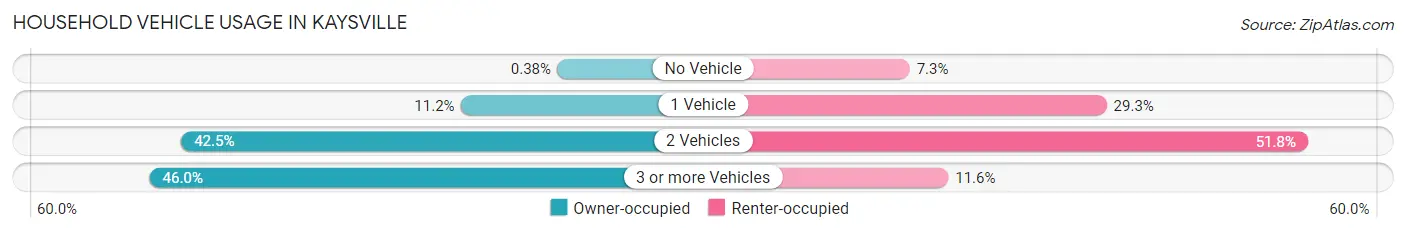
| Vehicles per Household | Owner-occupied | Renter-occupied |
| No Vehicle | 30 (0.4%) | 79 (7.3%) |
| 1 Vehicle | 884 (11.2%) | 319 (29.3%) |
| 2 Vehicles | 3,357 (42.4%) | 564 (51.8%) |
| 3 or more Vehicles | 3,637 (46.0%) | 126 (11.6%) |
| Total | 7,908 (100.0%) | 1,088 (100.0%) |
Real Estate & Mortgages in Kaysville
Real Estate and Mortgage Overview in Kaysville
| Characteristic | Without Mortgage | With Mortgage |
| Housing Units | 2,280 | 5,628 |
| Median Property Value | $486,100 | $524,400 |
| Median Household Income | $93,488 | $2,557 |
| Monthly Housing Costs | $530 | $1,192 |
| Real Estate Taxes | $2,583 | $91 |
Property Value by Mortgage Status in Kaysville
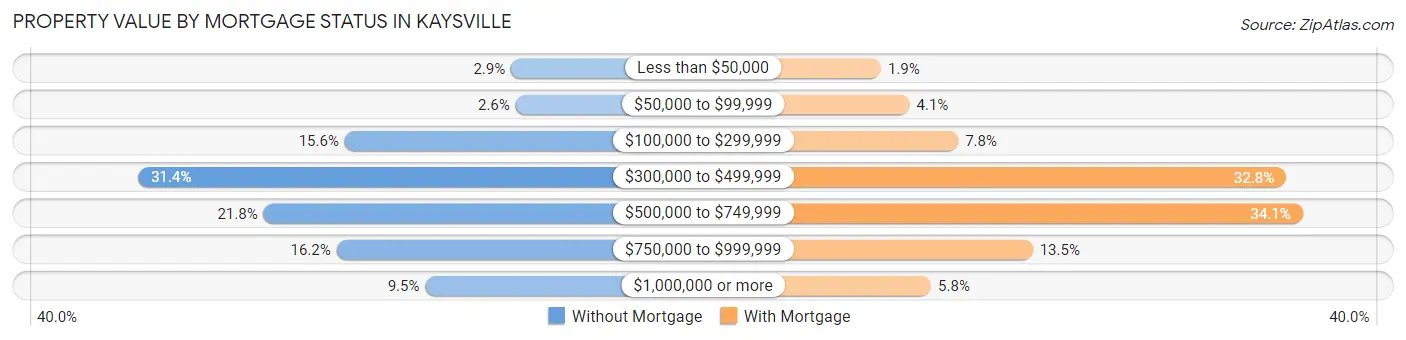
| Property Value | Without Mortgage | With Mortgage |
| Less than $50,000 | 67 (2.9%) | 109 (1.9%) |
| $50,000 to $99,999 | 59 (2.6%) | 232 (4.1%) |
| $100,000 to $299,999 | 356 (15.6%) | 440 (7.8%) |
| $300,000 to $499,999 | 715 (31.4%) | 1,846 (32.8%) |
| $500,000 to $749,999 | 497 (21.8%) | 1,917 (34.1%) |
| $750,000 to $999,999 | 370 (16.2%) | 760 (13.5%) |
| $1,000,000 or more | 216 (9.5%) | 324 (5.8%) |
| Total | 2,280 (100.0%) | 5,628 (100.0%) |
Household Income by Mortgage Status in Kaysville
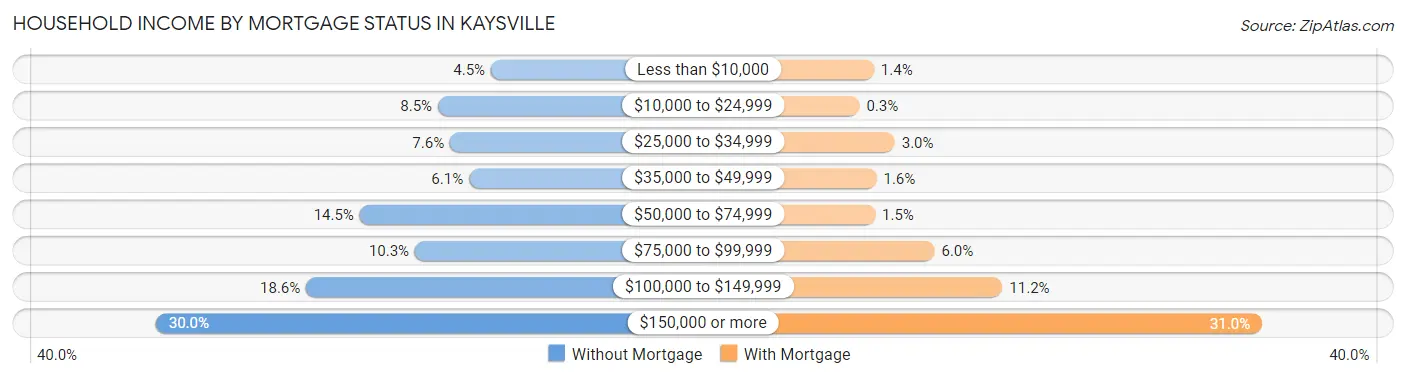
| Household Income | Without Mortgage | With Mortgage |
| Less than $10,000 | 102 (4.5%) | 79 (1.4%) |
| $10,000 to $24,999 | 194 (8.5%) | 17 (0.3%) |
| $25,000 to $34,999 | 173 (7.6%) | 168 (3.0%) |
| $35,000 to $49,999 | 140 (6.1%) | 90 (1.6%) |
| $50,000 to $74,999 | 330 (14.5%) | 84 (1.5%) |
| $75,000 to $99,999 | 234 (10.3%) | 339 (6.0%) |
| $100,000 to $149,999 | 423 (18.5%) | 630 (11.2%) |
| $150,000 or more | 684 (30.0%) | 1,743 (31.0%) |
| Total | 2,280 (100.0%) | 5,628 (100.0%) |
Property Value to Household Income Ratio in Kaysville
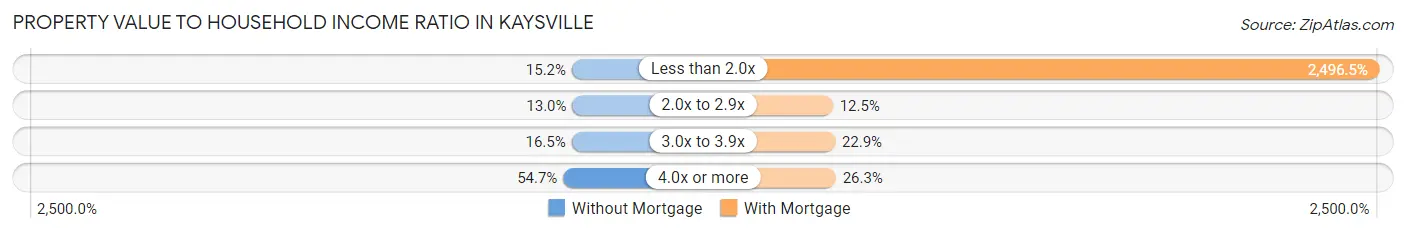
| Value-to-Income Ratio | Without Mortgage | With Mortgage |
| Less than 2.0x | 346 (15.2%) | 140,500 (2,496.5%) |
| 2.0x to 2.9x | 296 (13.0%) | 704 (12.5%) |
| 3.0x to 3.9x | 377 (16.5%) | 1,286 (22.9%) |
| 4.0x or more | 1,246 (54.6%) | 1,480 (26.3%) |
| Total | 2,280 (100.0%) | 5,628 (100.0%) |
Real Estate Taxes by Mortgage Status in Kaysville

| Property Taxes | Without Mortgage | With Mortgage |
| Less than $800 | 97 (4.3%) | 0 (0.0%) |
| $800 to $1,499 | 40 (1.8%) | 62 (1.1%) |
| $800 to $1,499 | 2,087 (91.5%) | 545 (9.7%) |
| Total | 2,280 (100.0%) | 5,628 (100.0%) |
Health & Disability in Kaysville
Health Insurance Coverage by Age in Kaysville
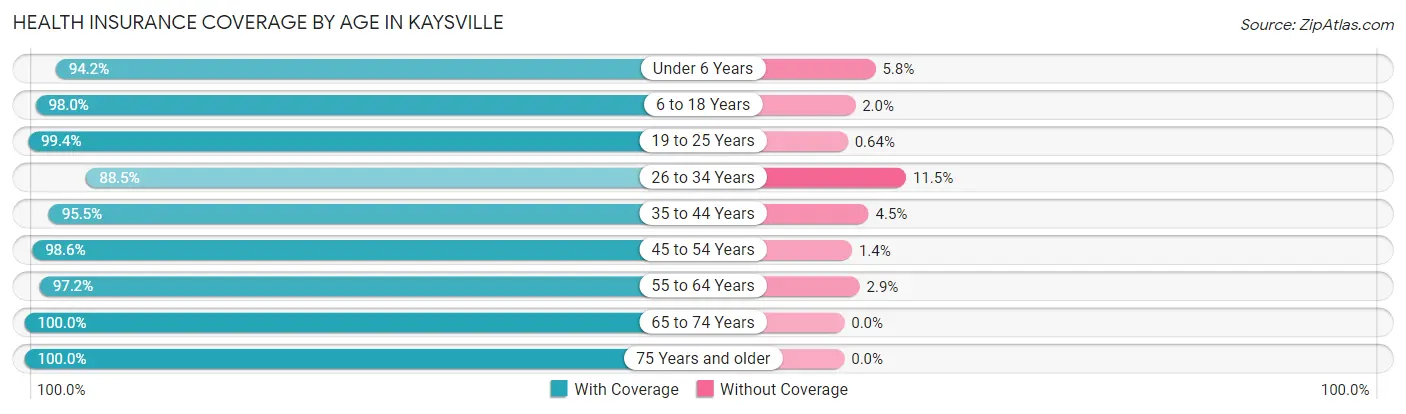
| Age Bracket | With Coverage | Without Coverage |
| Under 6 Years | 2,817 (94.2%) | 174 (5.8%) |
| 6 to 18 Years | 8,966 (98.0%) | 186 (2.0%) |
| 19 to 25 Years | 2,190 (99.4%) | 14 (0.6%) |
| 26 to 34 Years | 2,561 (88.5%) | 333 (11.5%) |
| 35 to 44 Years | 4,958 (95.5%) | 235 (4.5%) |
| 45 to 54 Years | 3,792 (98.6%) | 55 (1.4%) |
| 55 to 64 Years | 3,004 (97.2%) | 88 (2.9%) |
| 65 to 74 Years | 1,804 (100.0%) | 0 (0.0%) |
| 75 Years and older | 1,516 (100.0%) | 0 (0.0%) |
| Total | 31,608 (96.7%) | 1,085 (3.3%) |
Health Insurance Coverage by Citizenship Status in Kaysville

| Citizenship Status | With Coverage | Without Coverage |
| Native Born | 2,817 (94.2%) | 174 (5.8%) |
| Foreign Born, Citizen | 8,966 (98.0%) | 186 (2.0%) |
| Foreign Born, not a Citizen | 2,190 (99.4%) | 14 (0.6%) |
Health Insurance Coverage by Household Income in Kaysville
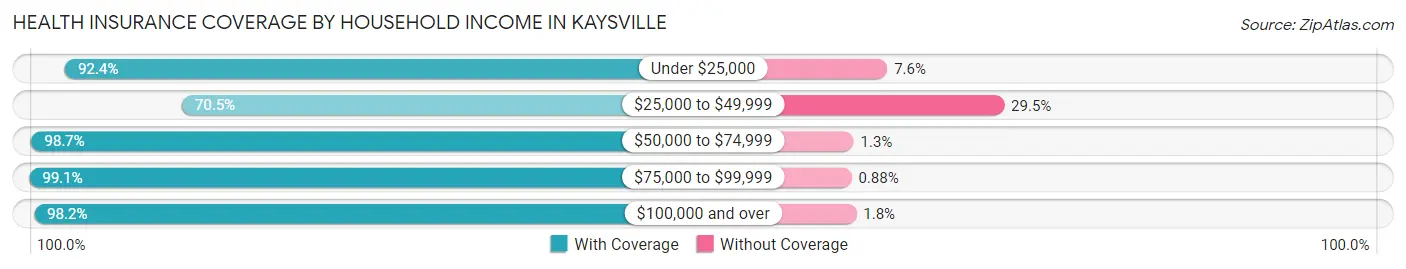
| Household Income | With Coverage | Without Coverage |
| Under $25,000 | 1,038 (92.4%) | 85 (7.6%) |
| $25,000 to $49,999 | 1,215 (70.5%) | 508 (29.5%) |
| $50,000 to $74,999 | 2,106 (98.7%) | 27 (1.3%) |
| $75,000 to $99,999 | 3,279 (99.1%) | 29 (0.9%) |
| $100,000 and over | 23,970 (98.2%) | 436 (1.8%) |
Public vs Private Health Insurance Coverage by Age in Kaysville
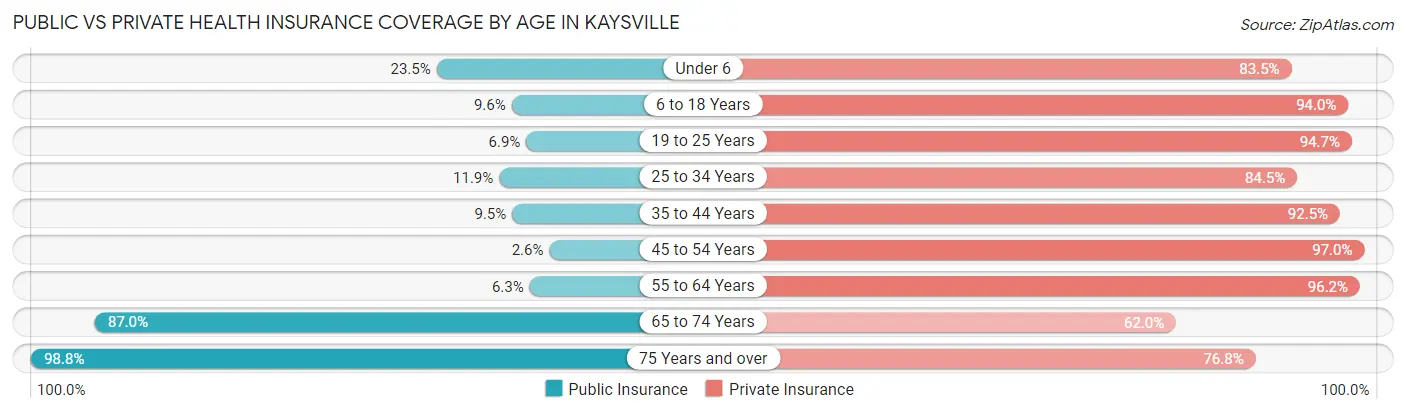
| Age Bracket | Public Insurance | Private Insurance |
| Under 6 | 704 (23.5%) | 2,496 (83.5%) |
| 6 to 18 Years | 880 (9.6%) | 8,602 (94.0%) |
| 19 to 25 Years | 152 (6.9%) | 2,086 (94.7%) |
| 25 to 34 Years | 345 (11.9%) | 2,446 (84.5%) |
| 35 to 44 Years | 494 (9.5%) | 4,801 (92.4%) |
| 45 to 54 Years | 100 (2.6%) | 3,731 (97.0%) |
| 55 to 64 Years | 194 (6.3%) | 2,973 (96.2%) |
| 65 to 74 Years | 1,569 (87.0%) | 1,119 (62.0%) |
| 75 Years and over | 1,498 (98.8%) | 1,164 (76.8%) |
| Total | 5,936 (18.2%) | 29,418 (90.0%) |
Disability Status by Sex by Age in Kaysville
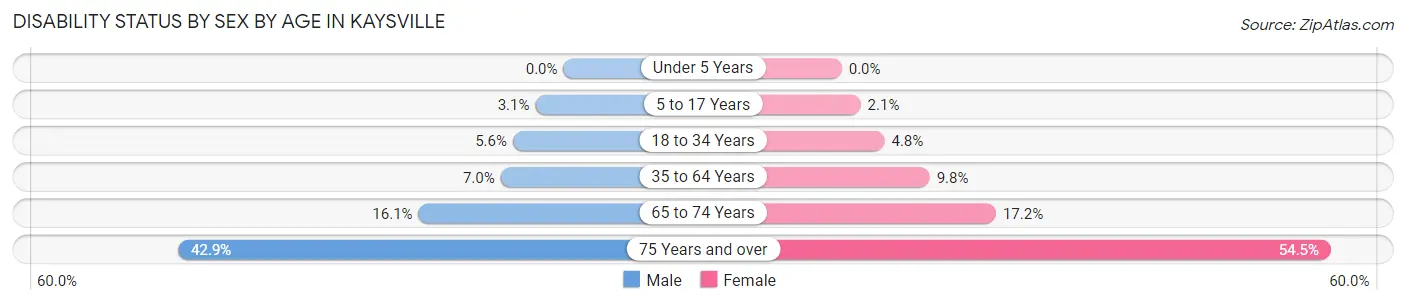
| Age Bracket | Male | Female |
| Under 5 Years | 0 (0.0%) | 0 (0.0%) |
| 5 to 17 Years | 158 (3.1%) | 97 (2.1%) |
| 18 to 34 Years | 158 (5.6%) | 127 (4.8%) |
| 35 to 64 Years | 433 (7.0%) | 581 (9.8%) |
| 65 to 74 Years | 137 (16.1%) | 164 (17.2%) |
| 75 Years and over | 285 (42.9%) | 464 (54.5%) |
Disability Class by Sex by Age in Kaysville
Disability Class: Hearing Difficulty
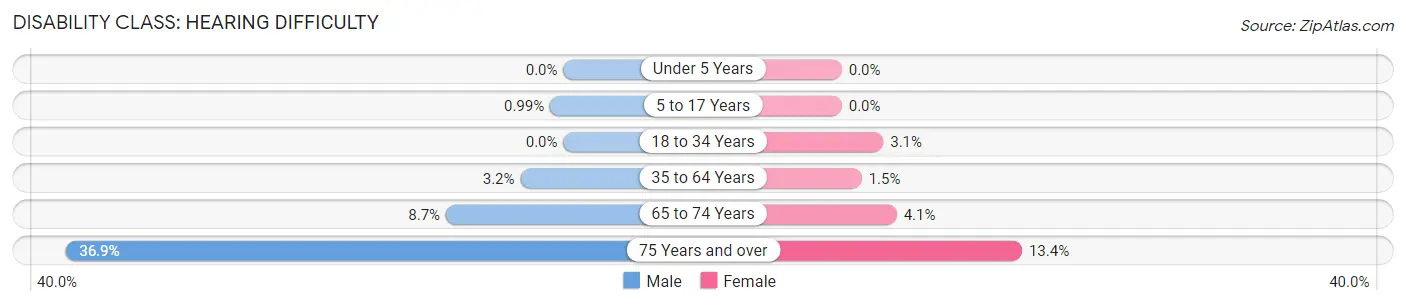
| Age Bracket | Male | Female |
| Under 5 Years | 0 (0.0%) | 0 (0.0%) |
| 5 to 17 Years | 50 (1.0%) | 0 (0.0%) |
| 18 to 34 Years | 0 (0.0%) | 82 (3.1%) |
| 35 to 64 Years | 198 (3.2%) | 88 (1.5%) |
| 65 to 74 Years | 74 (8.7%) | 39 (4.1%) |
| 75 Years and over | 245 (36.9%) | 114 (13.4%) |
Disability Class: Vision Difficulty
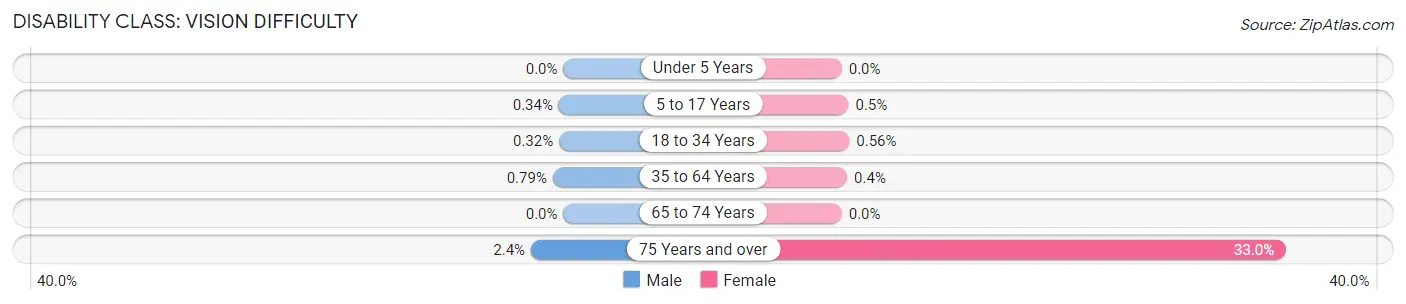
| Age Bracket | Male | Female |
| Under 5 Years | 0 (0.0%) | 0 (0.0%) |
| 5 to 17 Years | 17 (0.3%) | 23 (0.5%) |
| 18 to 34 Years | 9 (0.3%) | 15 (0.6%) |
| 35 to 64 Years | 49 (0.8%) | 24 (0.4%) |
| 65 to 74 Years | 0 (0.0%) | 0 (0.0%) |
| 75 Years and over | 16 (2.4%) | 281 (33.0%) |
Disability Class: Cognitive Difficulty
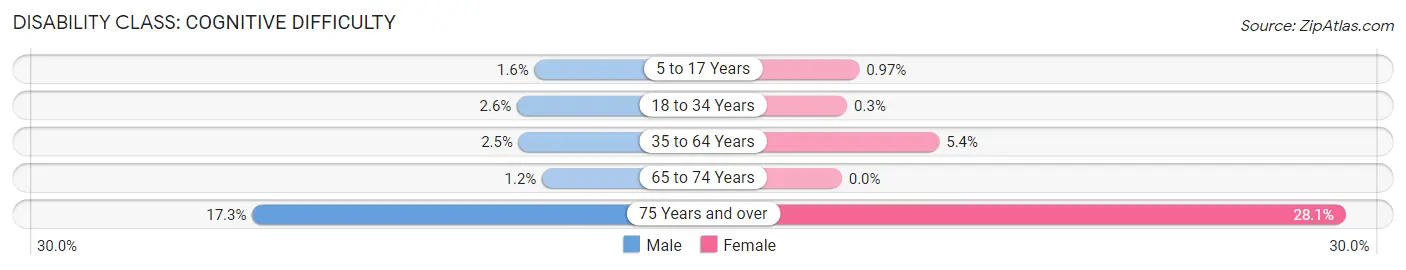
| Age Bracket | Male | Female |
| 5 to 17 Years | 81 (1.6%) | 45 (1.0%) |
| 18 to 34 Years | 72 (2.6%) | 8 (0.3%) |
| 35 to 64 Years | 154 (2.5%) | 322 (5.4%) |
| 65 to 74 Years | 10 (1.2%) | 0 (0.0%) |
| 75 Years and over | 115 (17.3%) | 239 (28.1%) |
Disability Class: Ambulatory Difficulty
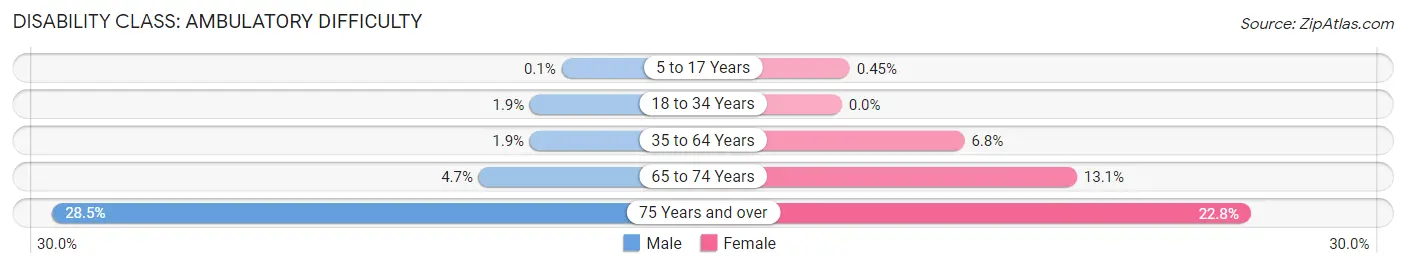
| Age Bracket | Male | Female |
| 5 to 17 Years | 5 (0.1%) | 21 (0.4%) |
| 18 to 34 Years | 52 (1.8%) | 0 (0.0%) |
| 35 to 64 Years | 115 (1.9%) | 405 (6.8%) |
| 65 to 74 Years | 40 (4.7%) | 125 (13.1%) |
| 75 Years and over | 189 (28.5%) | 194 (22.8%) |
Disability Class: Self-Care Difficulty
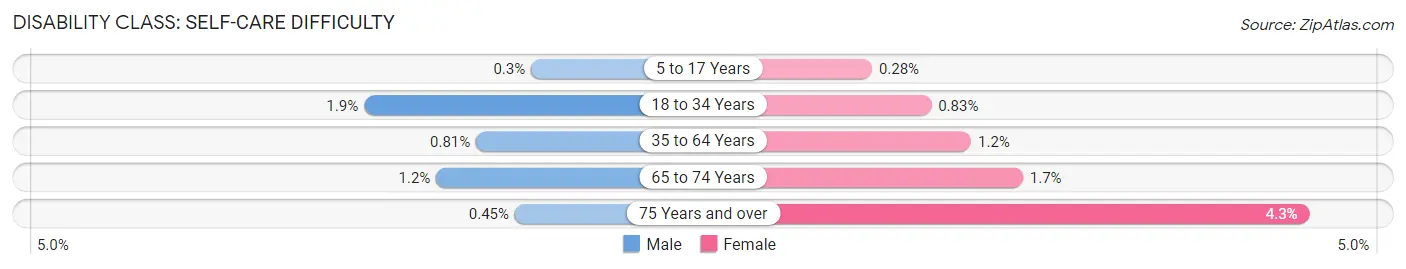
| Age Bracket | Male | Female |
| 5 to 17 Years | 15 (0.3%) | 13 (0.3%) |
| 18 to 34 Years | 52 (1.8%) | 22 (0.8%) |
| 35 to 64 Years | 50 (0.8%) | 71 (1.2%) |
| 65 to 74 Years | 10 (1.2%) | 16 (1.7%) |
| 75 Years and over | 3 (0.4%) | 37 (4.3%) |
Technology Access in Kaysville
Computing Device Access in Kaysville
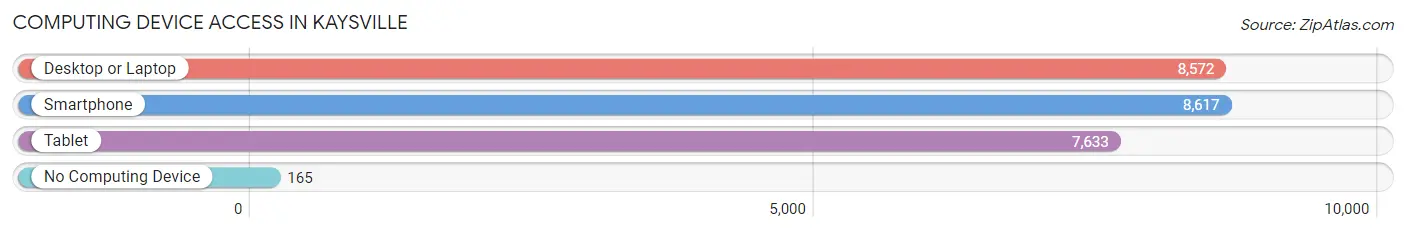
| Device Type | # Households | % Households |
| Desktop or Laptop | 8,572 | 95.3% |
| Smartphone | 8,617 | 95.8% |
| Tablet | 7,633 | 84.9% |
| No Computing Device | 165 | 1.8% |
| Total | 8,996 | 100.0% |
Internet Access in Kaysville
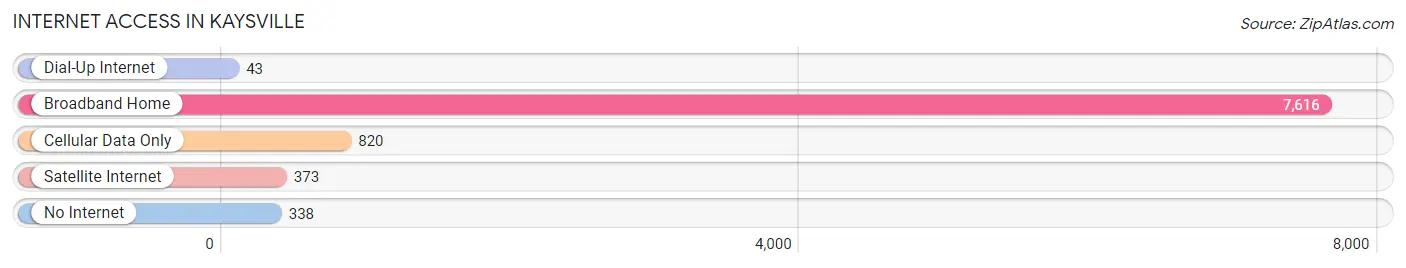
| Internet Type | # Households | % Households |
| Dial-Up Internet | 43 | 0.5% |
| Broadband Home | 7,616 | 84.7% |
| Cellular Data Only | 820 | 9.1% |
| Satellite Internet | 373 | 4.2% |
| No Internet | 338 | 3.8% |
| Total | 8,996 | 100.0% |
Kaysville Summary
Kaysville, Utah is a city located in Davis County, Utah, United States. It is part of the Ogden-Clearfield Metropolitan Statistical Area. The population was 27,300 at the 2010 census, making it the fourth-largest city in Davis County.
History
Kaysville was first settled in 1847 by William Kay, a Mormon pioneer. The city was named after him and was incorporated in 1868. Kaysville was the first city in Davis County to be incorporated.
Kaysville was a farming community for many years, but in the 1950s, the city began to experience rapid growth due to the expansion of Hill Air Force Base and the development of the Interstate 15 corridor. The city has since become a bedroom community for the Ogden-Clearfield area.
Geography
Kaysville is located at the northern end of Davis County, at the base of the Wasatch Mountains. It is bordered by the cities of Layton to the north, Fruit Heights to the east, and Farmington to the south. The city is situated at an elevation of 4,521 feet (1,378 m).
The city covers an area of 8.7 square miles (22.5 km2), of which 8.6 square miles (22.3 km2) is land and 0.1 square miles (0.2 km2) is water.
Economy
Kaysville is a bedroom community for the Ogden-Clearfield area, and the city's economy is largely based on the service industry. The city is home to several large employers, including Hill Air Force Base, Intermountain Healthcare, and the Davis School District.
The city also has a vibrant retail sector, with several shopping centers and retail stores located in the city.
Demographics
As of the 2010 census, there were 27,300 people, 8,845 households, and 7,072 families residing in the city. The population density was 3,133.3 people per square mile (1,206.3/km2). There were 9,093 housing units at an average density of 1,051.3 per square mile (406.3/km2).
The racial makeup of the city was 91.2% White, 1.2% African American, 0.5% Native American, 1.7% Asian, 0.2% Pacific Islander, 3.2% from other races, and 2.2% from two or more races. Hispanic or Latino of any race were 6.7% of the population.
The median income for a household in the city was $63,945, and the median income for a family was $71,945. Males had a median income of $50,945 versus $35,945 for females. The per capita income for the city was $25,945. About 3.2% of families and 4.3% of the population were below the poverty line, including 5.2% of those under age 18 and 4.2% of those age 65 or over.
Common Questions
What is Per Capita Income in Kaysville?
Per Capita income in Kaysville is $42,645.
What is the Median Family Income in Kaysville?
Median Family Income in Kaysville is $132,203.
What is the Median Household income in Kaysville?
Median Household Income in Kaysville is $121,867.
What is Income or Wage Gap in Kaysville?
Income or Wage Gap in Kaysville is 60.6%.
Women in Kaysville earn 39.4 cents for every dollar earned by a man.
What is Family Income Deficit in Kaysville?
Family Income Deficit in Kaysville is $11,859.
Families that are below poverty line in Kaysville earn $11,859 less on average than the poverty threshold level.
What is Inequality or Gini Index in Kaysville?
Inequality or Gini Index in Kaysville is 0.39.
What is the Total Population of Kaysville?
Total Population of Kaysville is 32,714.
What is the Total Male Population of Kaysville?
Total Male Population of Kaysville is 16,708.
What is the Total Female Population of Kaysville?
Total Female Population of Kaysville is 16,006.
What is the Ratio of Males per 100 Females in Kaysville?
There are 104.39 Males per 100 Females in Kaysville.
What is the Ratio of Females per 100 Males in Kaysville?
There are 95.80 Females per 100 Males in Kaysville.
What is the Median Population Age in Kaysville?
Median Population Age in Kaysville is 32.1 Years.
What is the Average Family Size in Kaysville
Average Family Size in Kaysville is 3.9 People.
What is the Average Household Size in Kaysville
Average Household Size in Kaysville is 3.6 People.
How Large is the Labor Force in Kaysville?
There are 15,130 People in the Labor Forcein in Kaysville.
What is the Percentage of People in the Labor Force in Kaysville?
68.4% of People are in the Labor Force in Kaysville.
What is the Unemployment Rate in Kaysville?
Unemployment Rate in Kaysville is 2.6%.