Captain Cook, HI Map & Demographics
Captain Cook Map
Captain Cook Overview
$39,062
PER CAPITA INCOME
$118,585
AVG FAMILY INCOME
$120,323
AVG HOUSEHOLD INCOME
1.7%
WAGE / INCOME GAP [ % ]
98.3¢/ $1
WAGE / INCOME GAP [ $ ]
0.45
INEQUALITY / GINI INDEX
4,135
TOTAL POPULATION
2,385
MALE POPULATION
1,750
FEMALE POPULATION
136.29
MALES / 100 FEMALES
73.38
FEMALES / 100 MALES
40.0
MEDIAN AGE
3.8
AVG FAMILY SIZE
4.2
AVG HOUSEHOLD SIZE
1,981
LABOR FORCE [ PEOPLE ]
59.9%
PERCENT IN LABOR FORCE
6.5%
UNEMPLOYMENT RATE
Captain Cook Zip Codes
Captain Cook Area Codes
Income in Captain Cook
Income Overview in Captain Cook
Per Capita Income in Captain Cook is $39,062, while median incomes of families and households are $118,585 and $120,323 respectively.
| Characteristic | Number | Measure |
| Per Capita Income | 4,135 | $39,062 |
| Median Family Income | 819 | $118,585 |
| Mean Family Income | 819 | $128,659 |
| Median Household Income | 992 | $120,323 |
| Mean Household Income | 992 | $159,458 |
| Income Deficit | 819 | $0 |
| Wage / Income Gap (%) | 4,135 | 1.67% |
| Wage / Income Gap ($) | 4,135 | 98.33¢ per $1 |
| Gini / Inequality Index | 4,135 | 0.45 |
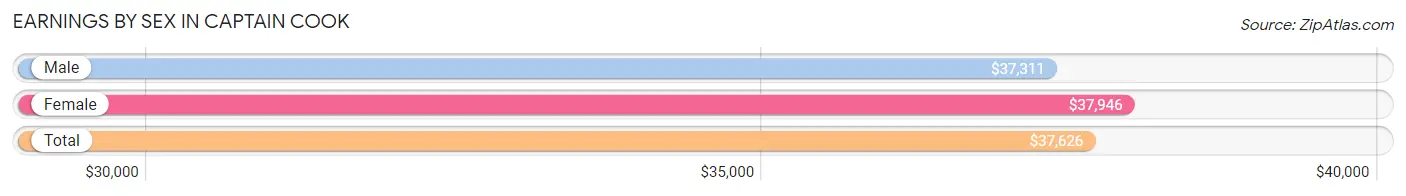
Earnings by Sex in Captain Cook
Average Earnings in Captain Cook are $37,626, $37,311 for men and $37,946 for women, a difference of 1.7%.
| Sex | Number | Average Earnings |
| Male | 1,326 (60.5%) | $37,311 |
| Female | 865 (39.5%) | $37,946 |
| Total | 2,191 (100.0%) | $37,626 |
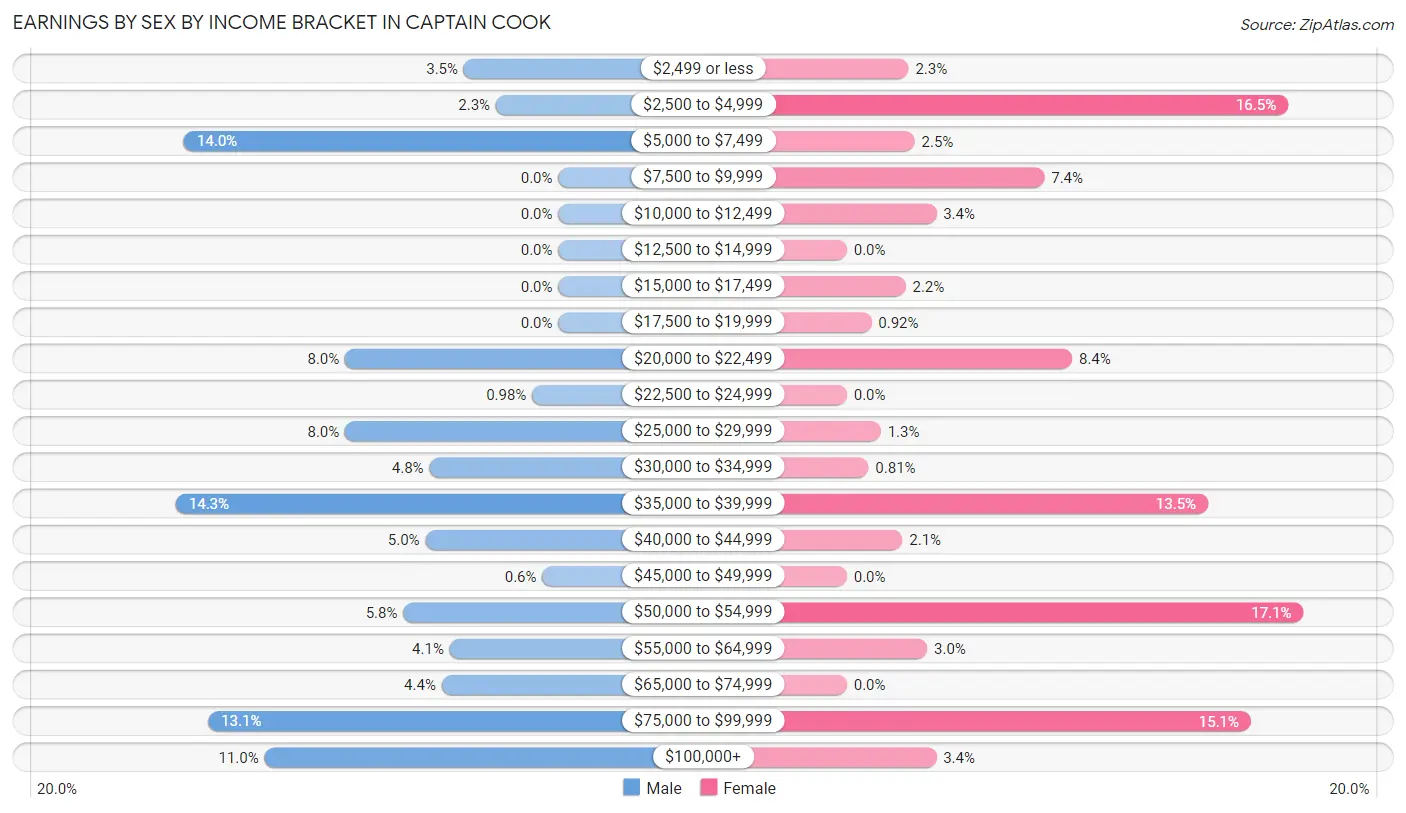
Earnings by Sex by Income Bracket in Captain Cook
The most common earnings brackets in Captain Cook are $35,000 to $39,999 for men (190 | 14.3%) and $50,000 to $54,999 for women (148 | 17.1%).
| Income | Male | Female |
| $2,499 or less | 47 (3.5%) | 20 (2.3%) |
| $2,500 to $4,999 | 31 (2.3%) | 143 (16.5%) |
| $5,000 to $7,499 | 186 (14.0%) | 22 (2.5%) |
| $7,500 to $9,999 | 0 (0.0%) | 64 (7.4%) |
| $10,000 to $12,499 | 0 (0.0%) | 29 (3.4%) |
| $12,500 to $14,999 | 0 (0.0%) | 0 (0.0%) |
| $15,000 to $17,499 | 0 (0.0%) | 19 (2.2%) |
| $17,500 to $19,999 | 0 (0.0%) | 8 (0.9%) |
| $20,000 to $22,499 | 106 (8.0%) | 73 (8.4%) |
| $22,500 to $24,999 | 13 (1.0%) | 0 (0.0%) |
| $25,000 to $29,999 | 106 (8.0%) | 11 (1.3%) |
| $30,000 to $34,999 | 64 (4.8%) | 7 (0.8%) |
| $35,000 to $39,999 | 190 (14.3%) | 117 (13.5%) |
| $40,000 to $44,999 | 66 (5.0%) | 18 (2.1%) |
| $45,000 to $49,999 | 8 (0.6%) | 0 (0.0%) |
| $50,000 to $54,999 | 77 (5.8%) | 148 (17.1%) |
| $55,000 to $64,999 | 54 (4.1%) | 26 (3.0%) |
| $65,000 to $74,999 | 58 (4.4%) | 0 (0.0%) |
| $75,000 to $99,999 | 174 (13.1%) | 131 (15.1%) |
| $100,000+ | 146 (11.0%) | 29 (3.4%) |
| Total | 1,326 (100.0%) | 865 (100.0%) |
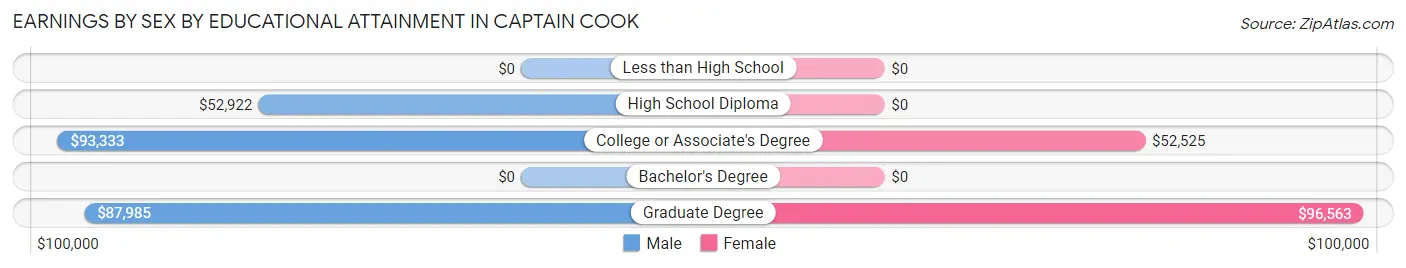
Earnings by Sex by Educational Attainment in Captain Cook
Average earnings in Captain Cook are $52,938 for men and $39,145 for women, a difference of 26.1%. Men with an educational attainment of college or associate's degree enjoy the highest average annual earnings of $93,333, while those with high school diploma education earn the least with $52,922. Women with an educational attainment of graduate degree earn the most with the average annual earnings of $96,563, while those with college or associate's degree education have the smallest earnings of $52,525.
| Educational Attainment | Male Income | Female Income |
| Less than High School | - | - |
| High School Diploma | $52,922 | $0 |
| College or Associate's Degree | $93,333 | $52,525 |
| Bachelor's Degree | - | - |
| Graduate Degree | $87,985 | $96,563 |
| Total | $52,938 | $39,145 |
Family Income in Captain Cook
Family Income Brackets in Captain Cook
According to the Captain Cook family income data, there are 254 families falling into the $100,000 to $149,999 income range, which is the most common income bracket and makes up 31.0% of all families.
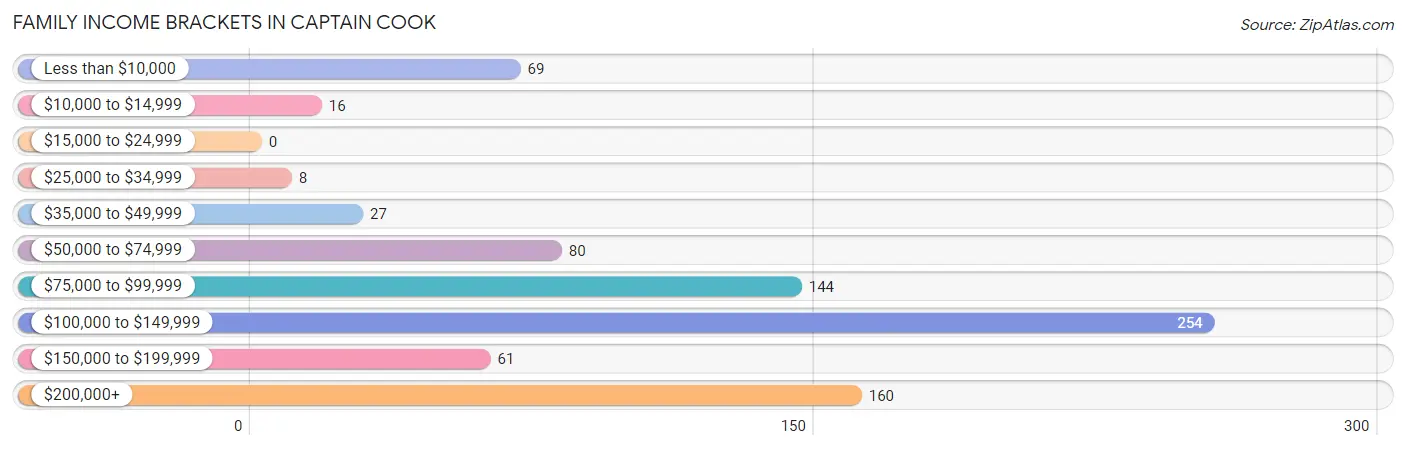
| Income Bracket | # Families | % Families |
| Less than $10,000 | 69 | 8.4% |
| $10,000 to $14,999 | 16 | 2.0% |
| $15,000 to $24,999 | 0 | 0.0% |
| $25,000 to $34,999 | 8 | 1.0% |
| $35,000 to $49,999 | 27 | 3.3% |
| $50,000 to $74,999 | 80 | 9.8% |
| $75,000 to $99,999 | 144 | 17.6% |
| $100,000 to $149,999 | 254 | 31.0% |
| $150,000 to $199,999 | 61 | 7.4% |
| $200,000+ | 160 | 19.5% |
Family Income by Famaliy Size in Captain Cook
7+ person families (63 | 7.7%) account for the highest median family income in Captain Cook with $250,001 per family, while 3-person families (169 | 20.6%) have the highest median income of $49,662 per family member.
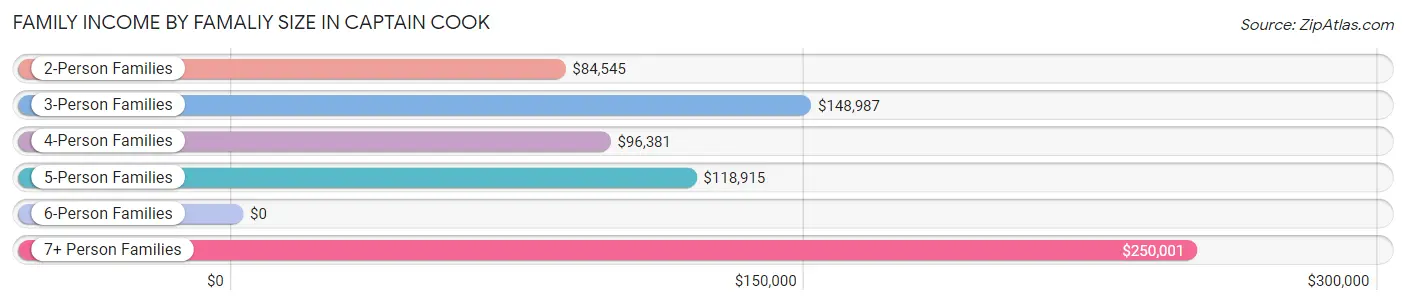
| Income Bracket | # Families | Median Income |
| 2-Person Families | 302 (36.9%) | $84,545 |
| 3-Person Families | 169 (20.6%) | $148,987 |
| 4-Person Families | 136 (16.6%) | $96,381 |
| 5-Person Families | 149 (18.2%) | $118,915 |
| 6-Person Families | 0 (0.0%) | $0 |
| 7+ Person Families | 63 (7.7%) | $250,001 |
| Total | 819 (100.0%) | $118,585 |
Family Income by Number of Earners in Captain Cook
The median family income in Captain Cook is $118,585, with families comprising 3+ earners (262) having the highest median family income of $148,448, while families with no earners (119) have the lowest median family income of $83,352, accounting for 32.0% and 14.5% of families, respectively.
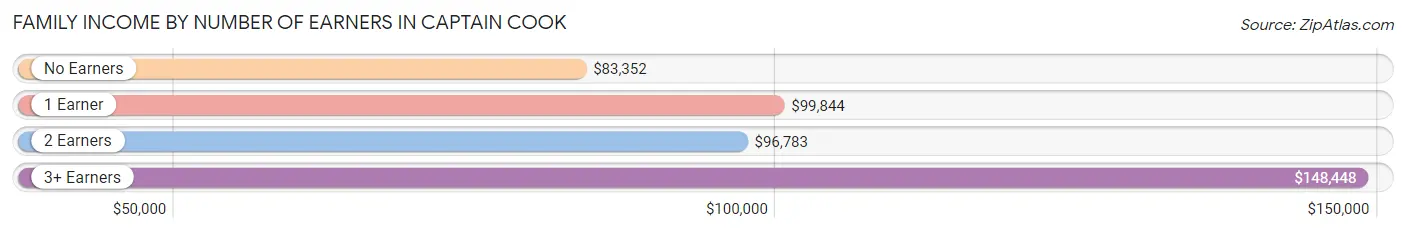
| Number of Earners | # Families | Median Income |
| No Earners | 119 (14.5%) | $83,352 |
| 1 Earner | 185 (22.6%) | $99,844 |
| 2 Earners | 253 (30.9%) | $96,783 |
| 3+ Earners | 262 (32.0%) | $148,448 |
| Total | 819 (100.0%) | $118,585 |
Household Income in Captain Cook
Household Income Brackets in Captain Cook
With 313 households falling in the category, the $200,000+ income range is the most frequent in Captain Cook, accounting for 31.6% of all households. In contrast, only 9 households (0.9%) fall into the $15,000 to $24,999 income bracket, making it the least populous group.
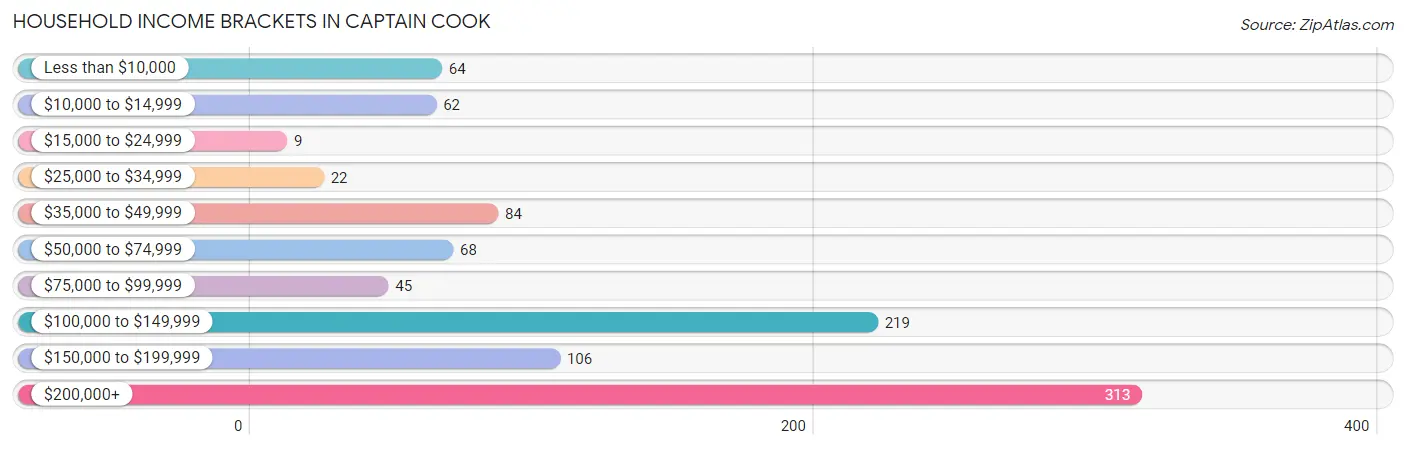
| Income Bracket | # Households | % Households |
| Less than $10,000 | 64 | 6.5% |
| $10,000 to $14,999 | 62 | 6.3% |
| $15,000 to $24,999 | 9 | 0.9% |
| $25,000 to $34,999 | 22 | 2.2% |
| $35,000 to $49,999 | 84 | 8.5% |
| $50,000 to $74,999 | 68 | 6.9% |
| $75,000 to $99,999 | 45 | 4.5% |
| $100,000 to $149,999 | 219 | 22.1% |
| $150,000 to $199,999 | 106 | 10.7% |
| $200,000+ | 313 | 31.6% |
Household Income by Householder Age in Captain Cook
The median household income in Captain Cook is $120,323, with the highest median household income of $203,211 found in the 45 to 64 years age bracket for the primary householder. A total of 211 households (21.3%) fall into this category.
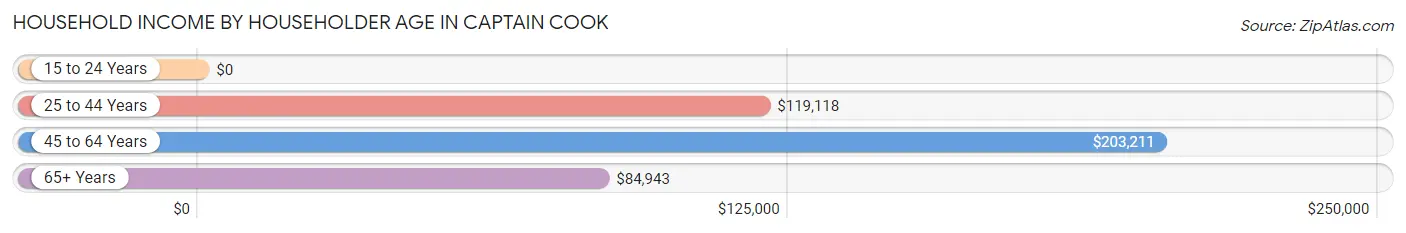
| Income Bracket | # Households | Median Income |
| 15 to 24 Years | 0 (0.0%) | $0 |
| 25 to 44 Years | 394 (39.7%) | $119,118 |
| 45 to 64 Years | 211 (21.3%) | $203,211 |
| 65+ Years | 387 (39.0%) | $84,943 |
| Total | 992 (100.0%) | $120,323 |
Poverty in Captain Cook
Income Below Poverty by Sex and Age in Captain Cook
With 9.3% poverty level for males and 10.5% for females among the residents of Captain Cook, 65 to 74 year old males and 18 to 24 year old females are the most vulnerable to poverty, with 104 males (23.6%) and 20 females (26.0%) in their respective age groups living below the poverty level.
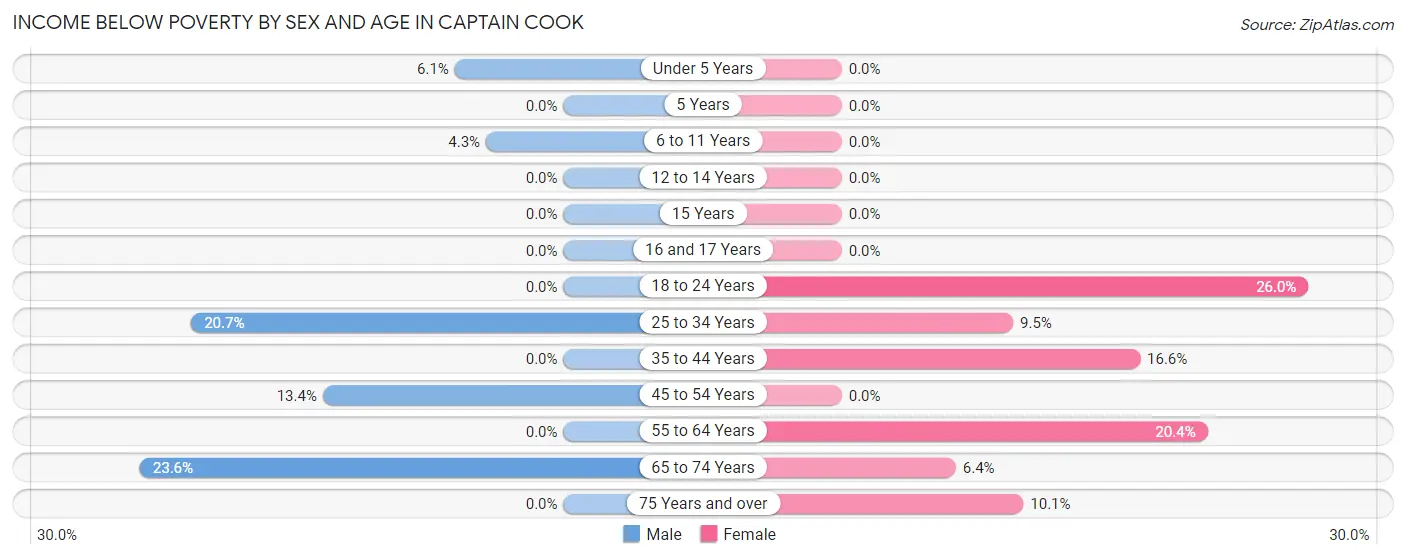
| Age Bracket | Male | Female |
| Under 5 Years | 13 (6.0%) | 0 (0.0%) |
| 5 Years | 0 (0.0%) | 0 (0.0%) |
| 6 to 11 Years | 11 (4.3%) | 0 (0.0%) |
| 12 to 14 Years | 0 (0.0%) | 0 (0.0%) |
| 15 Years | 0 (0.0%) | 0 (0.0%) |
| 16 and 17 Years | 0 (0.0%) | 0 (0.0%) |
| 18 to 24 Years | 0 (0.0%) | 20 (26.0%) |
| 25 to 34 Years | 63 (20.7%) | 23 (9.5%) |
| 35 to 44 Years | 0 (0.0%) | 50 (16.6%) |
| 45 to 54 Years | 28 (13.4%) | 0 (0.0%) |
| 55 to 64 Years | 0 (0.0%) | 57 (20.4%) |
| 65 to 74 Years | 104 (23.6%) | 25 (6.4%) |
| 75 Years and over | 0 (0.0%) | 9 (10.1%) |
| Total | 219 (9.3%) | 184 (10.5%) |
Income Above Poverty by Sex and Age in Captain Cook
According to the poverty statistics in Captain Cook, males aged 12 to 14 years and females aged under 5 years are the age groups that are most secure financially, with 100.0% of males and 100.0% of females in these age groups living above the poverty line.
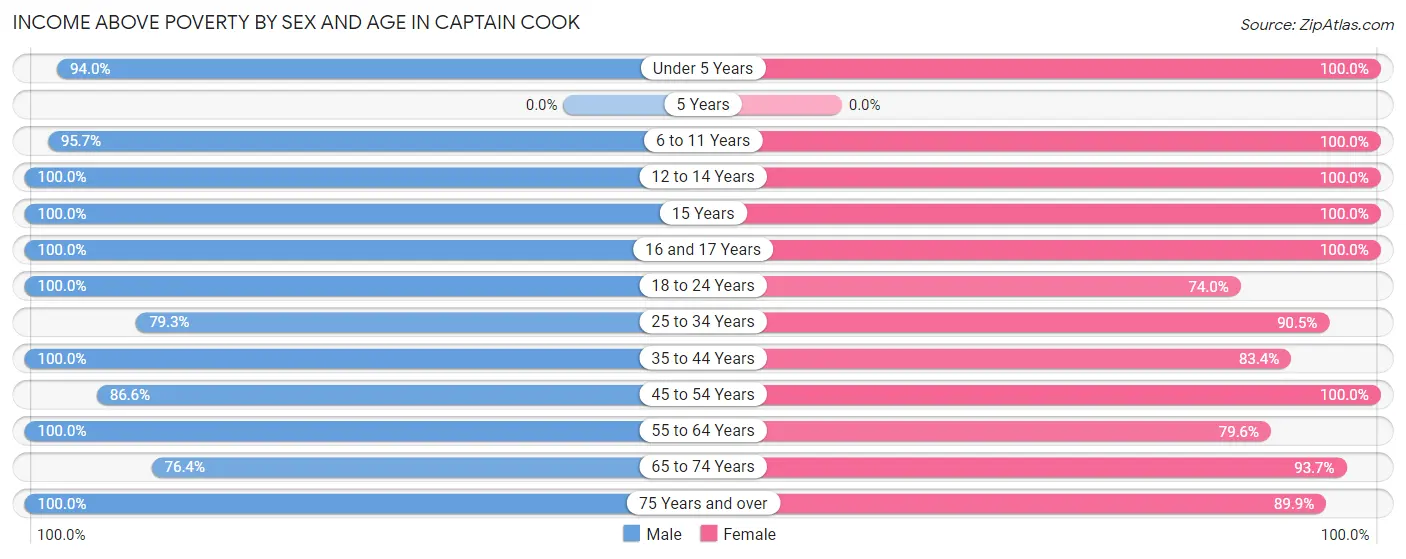
| Age Bracket | Male | Female |
| Under 5 Years | 202 (94.0%) | 78 (100.0%) |
| 5 Years | 0 (0.0%) | 0 (0.0%) |
| 6 to 11 Years | 244 (95.7%) | 117 (100.0%) |
| 12 to 14 Years | 47 (100.0%) | 48 (100.0%) |
| 15 Years | 7 (100.0%) | 26 (100.0%) |
| 16 and 17 Years | 59 (100.0%) | 36 (100.0%) |
| 18 to 24 Years | 288 (100.0%) | 57 (74.0%) |
| 25 to 34 Years | 241 (79.3%) | 218 (90.5%) |
| 35 to 44 Years | 230 (100.0%) | 251 (83.4%) |
| 45 to 54 Years | 181 (86.6%) | 63 (100.0%) |
| 55 to 64 Years | 222 (100.0%) | 223 (79.6%) |
| 65 to 74 Years | 337 (76.4%) | 369 (93.6%) |
| 75 Years and over | 74 (100.0%) | 80 (89.9%) |
| Total | 2,132 (90.7%) | 1,566 (89.5%) |
Income Below Poverty Among Married-Couple Families in Captain Cook
The poverty statistics for married-couple families in Captain Cook show that 12.7% or 71 of the total 560 families live below the poverty line. Families with no children have the highest poverty rate of 24.2%, comprising of 71 families. On the other hand, families with 1 or 2 children have the lowest poverty rate of 0.0%, which includes 0 families.
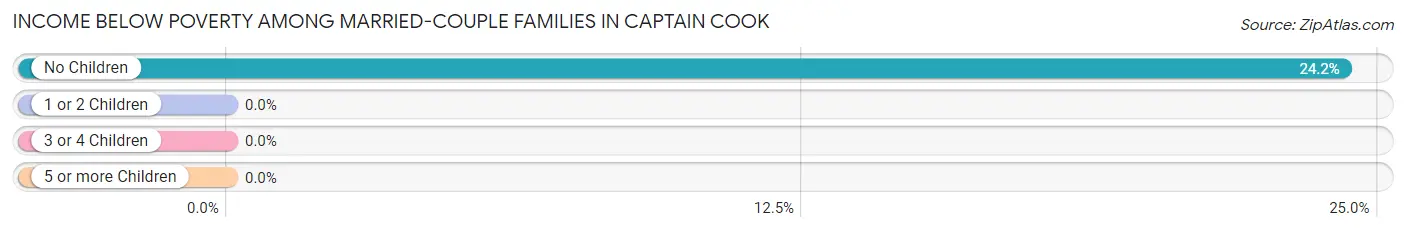
| Children | Above Poverty | Below Poverty |
| No Children | 222 (75.8%) | 71 (24.2%) |
| 1 or 2 Children | 195 (100.0%) | 0 (0.0%) |
| 3 or 4 Children | 72 (100.0%) | 0 (0.0%) |
| 5 or more Children | 0 (0.0%) | 0 (0.0%) |
| Total | 489 (87.3%) | 71 (12.7%) |
Income Below Poverty Among Single-Parent Households in Captain Cook
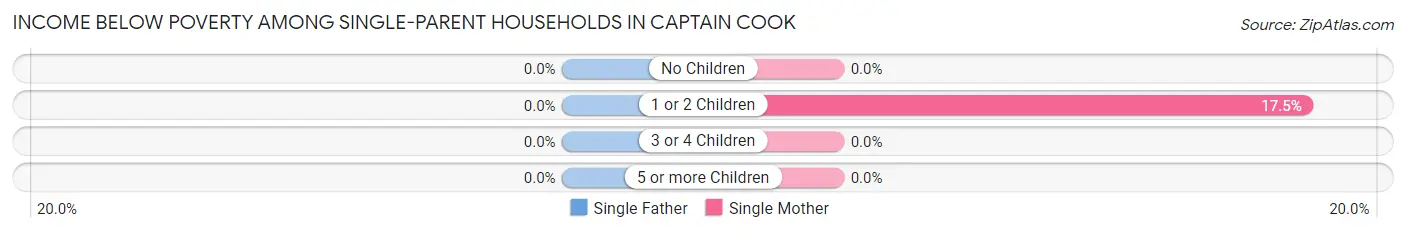
| Children | Single Father | Single Mother |
| No Children | 0 (0.0%) | 0 (0.0%) |
| 1 or 2 Children | 0 (0.0%) | 14 (17.5%) |
| 3 or 4 Children | 0 (0.0%) | 0 (0.0%) |
| 5 or more Children | 0 (0.0%) | 0 (0.0%) |
| Total | 0 (0.0%) | 14 (6.0%) |
Income Below Poverty Among Married-Couple vs Single-Parent Households in Captain Cook
The poverty data for Captain Cook shows that 71 of the married-couple family households (12.7%) and 14 of the single-parent households (5.4%) are living below the poverty level. Within the married-couple family households, those with no children have the highest poverty rate, with 71 households (24.2%) falling below the poverty line. Among the single-parent households, those with 1 or 2 children have the highest poverty rate, with 14 household (13.2%) living below poverty.
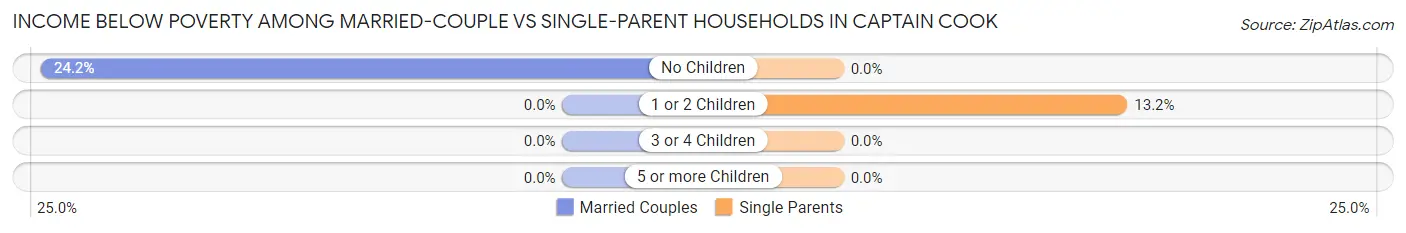
| Children | Married-Couple Families | Single-Parent Households |
| No Children | 71 (24.2%) | 0 (0.0%) |
| 1 or 2 Children | 0 (0.0%) | 14 (13.2%) |
| 3 or 4 Children | 0 (0.0%) | 0 (0.0%) |
| 5 or more Children | 0 (0.0%) | 0 (0.0%) |
| Total | 71 (12.7%) | 14 (5.4%) |
Race in Captain Cook
The most populous races in Captain Cook are Two or more Races (1,470 | 35.5%), White / Caucasian (1,304 | 31.5%), and Hispanic or Latino (1,023 | 24.7%).
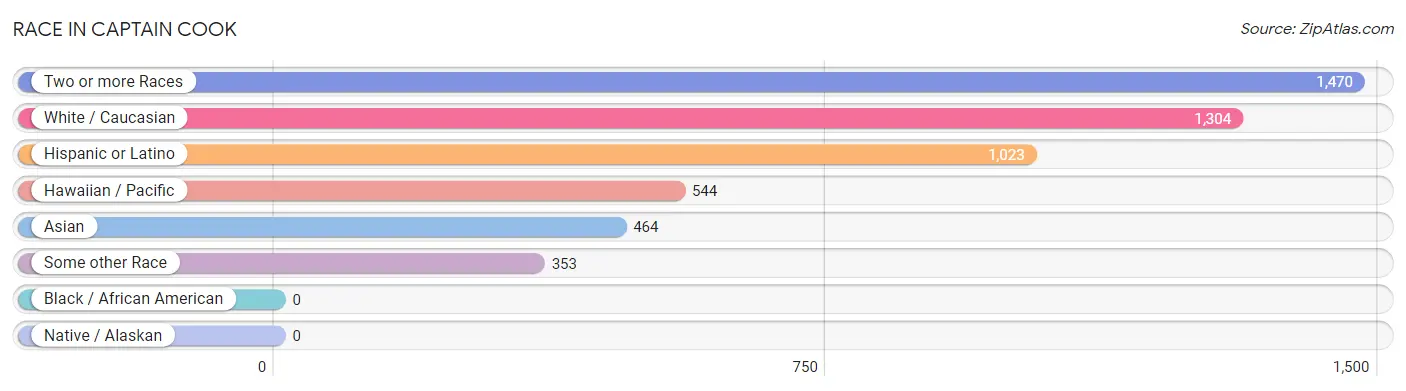
| Race | # Population | % Population |
| Asian | 464 | 11.2% |
| Black / African American | 0 | 0.0% |
| Hawaiian / Pacific | 544 | 13.2% |
| Hispanic or Latino | 1,023 | 24.7% |
| Native / Alaskan | 0 | 0.0% |
| White / Caucasian | 1,304 | 31.5% |
| Two or more Races | 1,470 | 35.5% |
| Some other Race | 353 | 8.5% |
| Total | 4,135 | 100.0% |
Ancestry in Captain Cook
The most populous ancestries reported in Captain Cook are Native Hawaiian (1,810 | 43.8%), Korean (943 | 22.8%), Bhutanese (727 | 17.6%), Puerto Rican (462 | 11.2%), and Mexican (414 | 10.0%), together accounting for 105.3% of all Captain Cook residents.
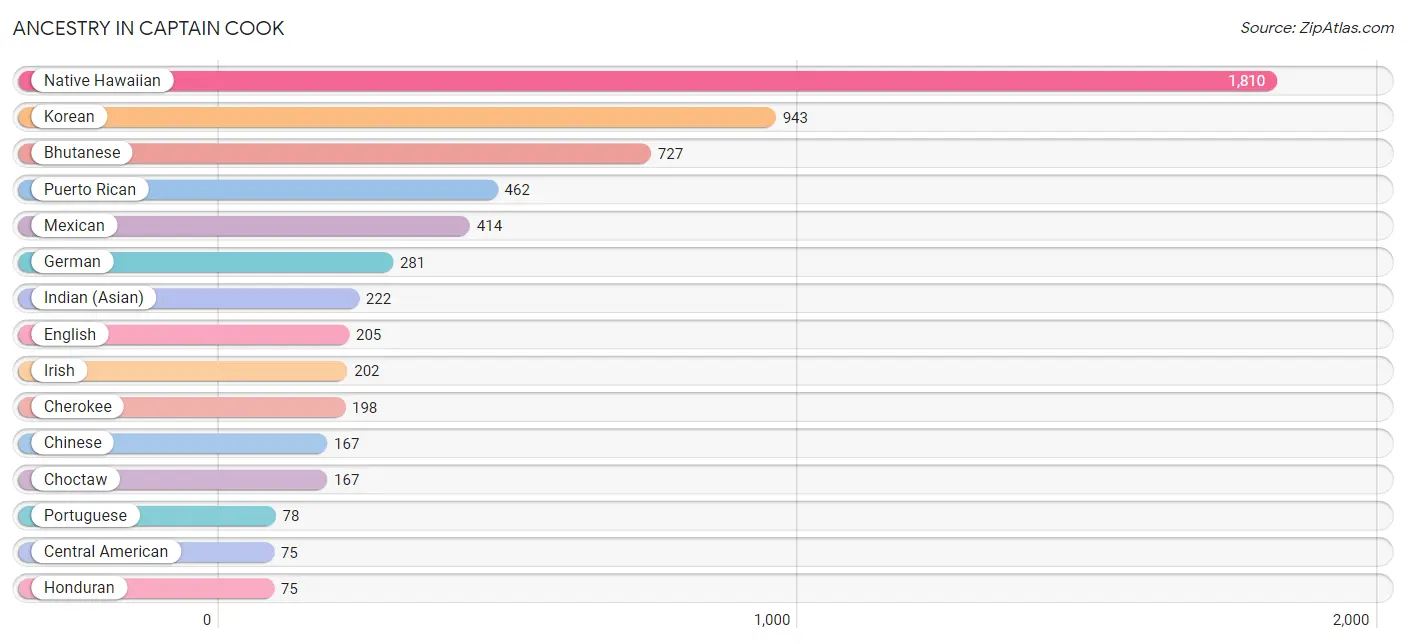
| Ancestry | # Population | % Population |
| Bhutanese | 727 | 17.6% |
| Burmese | 70 | 1.7% |
| Central American | 75 | 1.8% |
| Cherokee | 198 | 4.8% |
| Chinese | 167 | 4.0% |
| Choctaw | 167 | 4.0% |
| Colombian | 32 | 0.8% |
| Czech | 27 | 0.6% |
| English | 205 | 5.0% |
| European | 52 | 1.3% |
| German | 281 | 6.8% |
| Honduran | 75 | 1.8% |
| Indian (Asian) | 222 | 5.4% |
| Irish | 202 | 4.9% |
| Korean | 943 | 22.8% |
| Mexican | 414 | 10.0% |
| Native Hawaiian | 1,810 | 43.8% |
| Norwegian | 16 | 0.4% |
| Polish | 56 | 1.3% |
| Portuguese | 78 | 1.9% |
| Puerto Rican | 462 | 11.2% |
| Russian | 51 | 1.2% |
| Scotch-Irish | 64 | 1.5% |
| Scottish | 41 | 1.0% |
| South American | 32 | 0.8% |
| Spanish | 40 | 1.0% |
| Swiss | 33 | 0.8% |
| Tohono O'Odham | 17 | 0.4% | View All 28 Rows |
Immigrants in Captain Cook
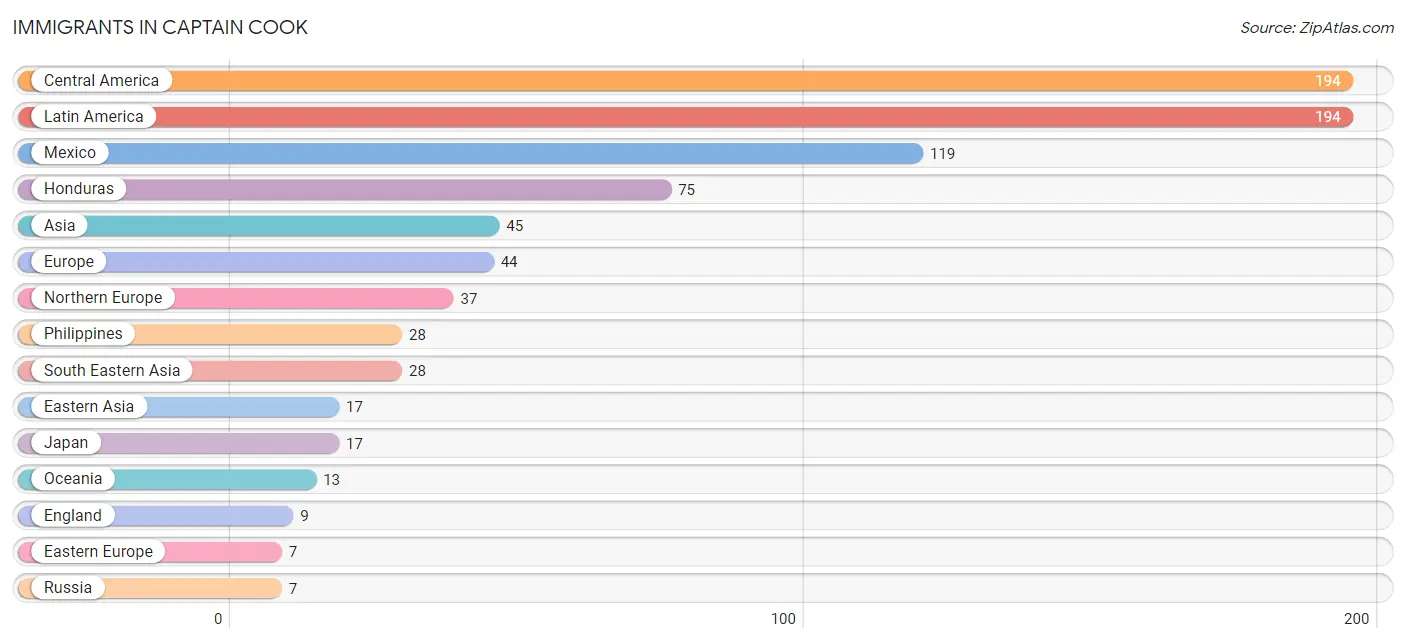
The most numerous immigrant groups reported in Captain Cook came from Central America (194 | 4.7%), Latin America (194 | 4.7%), Mexico (119 | 2.9%), Honduras (75 | 1.8%), and Asia (45 | 1.1%), together accounting for 15.2% of all Captain Cook residents.
| Immigration Origin | # Population | % Population |
| Asia | 45 | 1.1% |
| Central America | 194 | 4.7% |
| Eastern Asia | 17 | 0.4% |
| Eastern Europe | 7 | 0.2% |
| England | 9 | 0.2% |
| Europe | 44 | 1.1% |
| Honduras | 75 | 1.8% |
| Japan | 17 | 0.4% |
| Latin America | 194 | 4.7% |
| Mexico | 119 | 2.9% |
| Northern Europe | 37 | 0.9% |
| Oceania | 13 | 0.3% |
| Philippines | 28 | 0.7% |
| Russia | 7 | 0.2% |
| South Eastern Asia | 28 | 0.7% | View All 15 Rows |
Sex and Age in Captain Cook
Sex and Age in Captain Cook
The most populous age groups in Captain Cook are 70 to 74 Years (386 | 16.2%) for men and 30 to 34 Years (224 | 12.8%) for women.
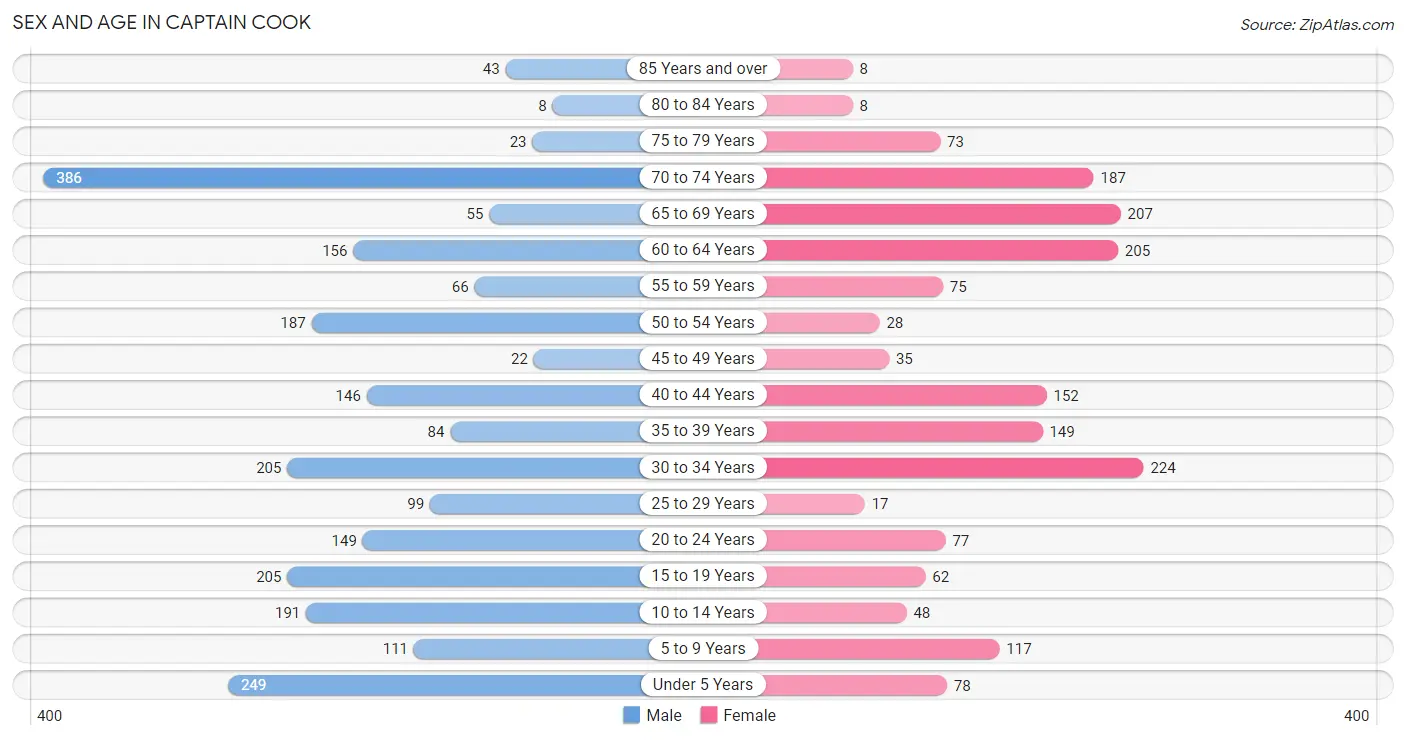
| Age Bracket | Male | Female |
| Under 5 Years | 249 (10.4%) | 78 (4.5%) |
| 5 to 9 Years | 111 (4.6%) | 117 (6.7%) |
| 10 to 14 Years | 191 (8.0%) | 48 (2.7%) |
| 15 to 19 Years | 205 (8.6%) | 62 (3.5%) |
| 20 to 24 Years | 149 (6.2%) | 77 (4.4%) |
| 25 to 29 Years | 99 (4.2%) | 17 (1.0%) |
| 30 to 34 Years | 205 (8.6%) | 224 (12.8%) |
| 35 to 39 Years | 84 (3.5%) | 149 (8.5%) |
| 40 to 44 Years | 146 (6.1%) | 152 (8.7%) |
| 45 to 49 Years | 22 (0.9%) | 35 (2.0%) |
| 50 to 54 Years | 187 (7.8%) | 28 (1.6%) |
| 55 to 59 Years | 66 (2.8%) | 75 (4.3%) |
| 60 to 64 Years | 156 (6.5%) | 205 (11.7%) |
| 65 to 69 Years | 55 (2.3%) | 207 (11.8%) |
| 70 to 74 Years | 386 (16.2%) | 187 (10.7%) |
| 75 to 79 Years | 23 (1.0%) | 73 (4.2%) |
| 80 to 84 Years | 8 (0.3%) | 8 (0.5%) |
| 85 Years and over | 43 (1.8%) | 8 (0.5%) |
| Total | 2,385 (100.0%) | 1,750 (100.0%) |
Families and Households in Captain Cook
Median Family Size in Captain Cook
The median family size in Captain Cook is 3.82 persons per family, with single male/father families (26 | 3.2%) accounting for the largest median family size of 8.35 persons per family. On the other hand, married-couple families (560 | 68.4%) represent the smallest median family size with 3.65 persons per family.
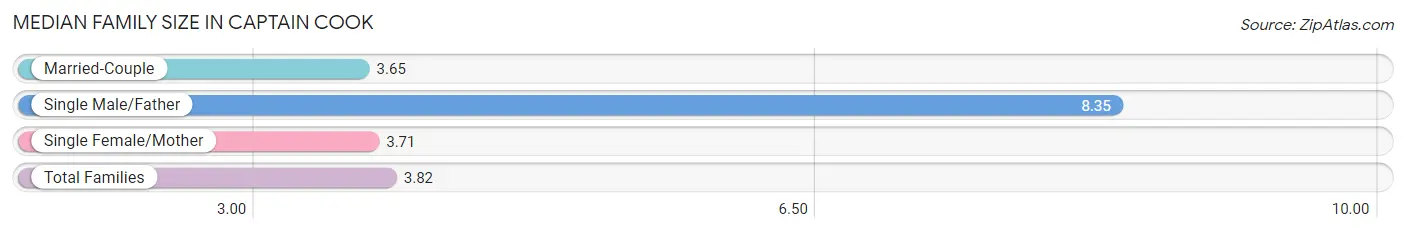
| Family Type | # Families | Family Size |
| Married-Couple | 560 (68.4%) | 3.65 |
| Single Male/Father | 26 (3.2%) | 8.35 |
| Single Female/Mother | 233 (28.4%) | 3.71 |
| Total Families | 819 (100.0%) | 3.82 |
Median Household Size in Captain Cook
The median household size in Captain Cook is 4.17 persons per household, with single male/father households (26 | 2.6%) accounting for the largest median household size of 9.46 persons per household. non-family households (173 | 17.4%) represent the smallest median household size with 1.21 persons per household.
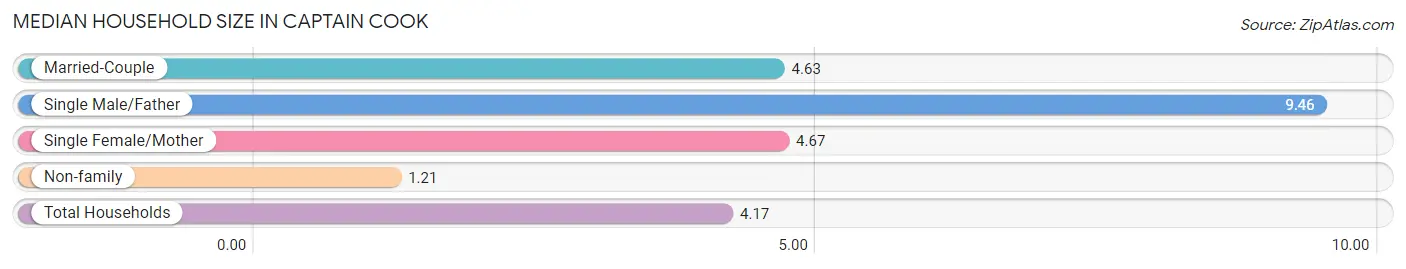
| Household Type | # Households | Household Size |
| Married-Couple | 560 (56.5%) | 4.63 |
| Single Male/Father | 26 (2.6%) | 9.46 |
| Single Female/Mother | 233 (23.5%) | 4.67 |
| Non-family | 173 (17.4%) | 1.21 |
| Total Households | 992 (100.0%) | 4.17 |
Household Size by Marriage Status in Captain Cook
Out of a total of 992 households in Captain Cook, 819 (82.6%) are family households, while 173 (17.4%) are nonfamily households. The most numerous type of family households are 2-person households, comprising 260, and the most common type of nonfamily households are 1-person households, comprising 153.
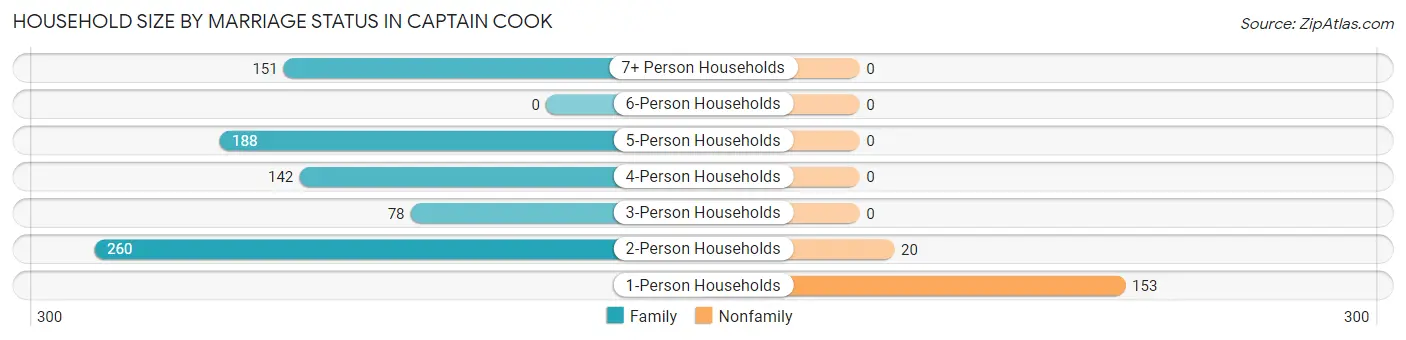
| Household Size | Family Households | Nonfamily Households |
| 1-Person Households | - | 153 (15.4%) |
| 2-Person Households | 260 (26.2%) | 20 (2.0%) |
| 3-Person Households | 78 (7.9%) | 0 (0.0%) |
| 4-Person Households | 142 (14.3%) | 0 (0.0%) |
| 5-Person Households | 188 (19.0%) | 0 (0.0%) |
| 6-Person Households | 0 (0.0%) | 0 (0.0%) |
| 7+ Person Households | 151 (15.2%) | 0 (0.0%) |
| Total | 819 (82.6%) | 173 (17.4%) |
Female Fertility in Captain Cook
Fertility by Age in Captain Cook
Average fertility rate in Captain Cook is 80.0 births per 1,000 women. Women in the age bracket of 20 to 34 years have the highest fertility rate with 113.0 births per 1,000 women. Women in the age bracket of 20 to 34 years acount for 63.2% of all women with births.
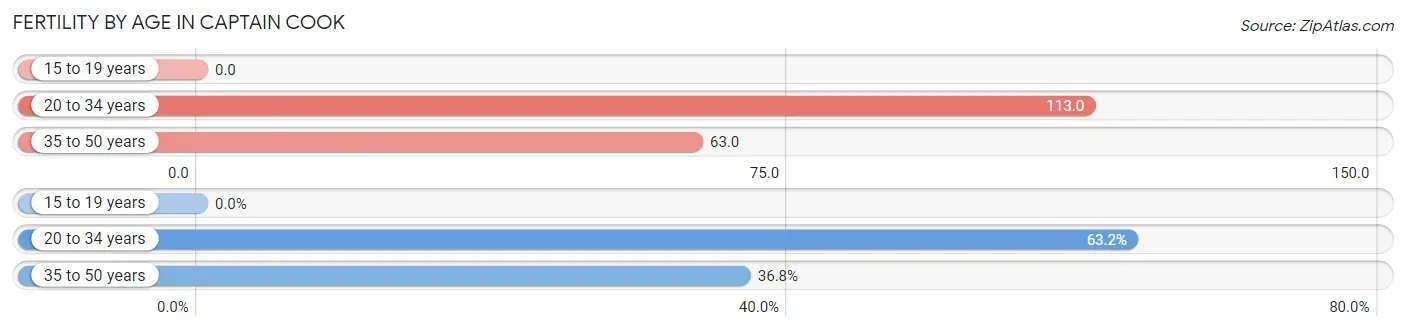
| Age Bracket | Women with Births | Births / 1,000 Women |
| 15 to 19 years | 0 (0.0%) | 0.0 |
| 20 to 34 years | 36 (63.2%) | 113.0 |
| 35 to 50 years | 21 (36.8%) | 63.0 |
| Total | 57 (100.0%) | 80.0 |
Fertility by Age by Marriage Status in Captain Cook
63.2% of women with births (57) in Captain Cook are married. The highest percentage of unmarried women with births falls into 35 to 50 years age bracket with 100.0% of them unmarried at the time of birth, while the lowest percentage of unmarried women with births belong to 20 to 34 years age bracket with 0.0% of them unmarried.
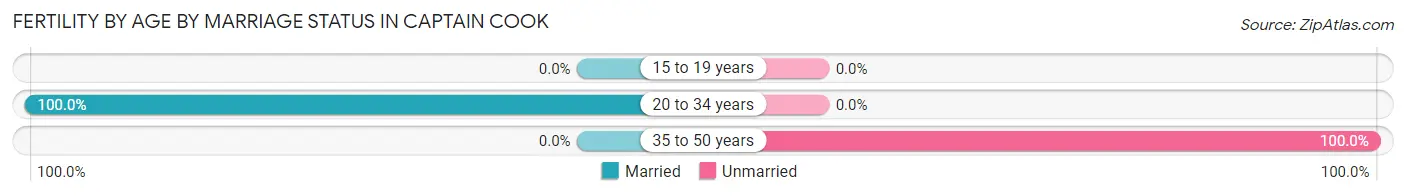
| Age Bracket | Married | Unmarried |
| 15 to 19 years | 0 (0.0%) | 0 (0.0%) |
| 20 to 34 years | 36 (100.0%) | 0 (0.0%) |
| 35 to 50 years | 0 (0.0%) | 21 (100.0%) |
| Total | 36 (63.2%) | 21 (36.8%) |
Fertility by Education in Captain Cook
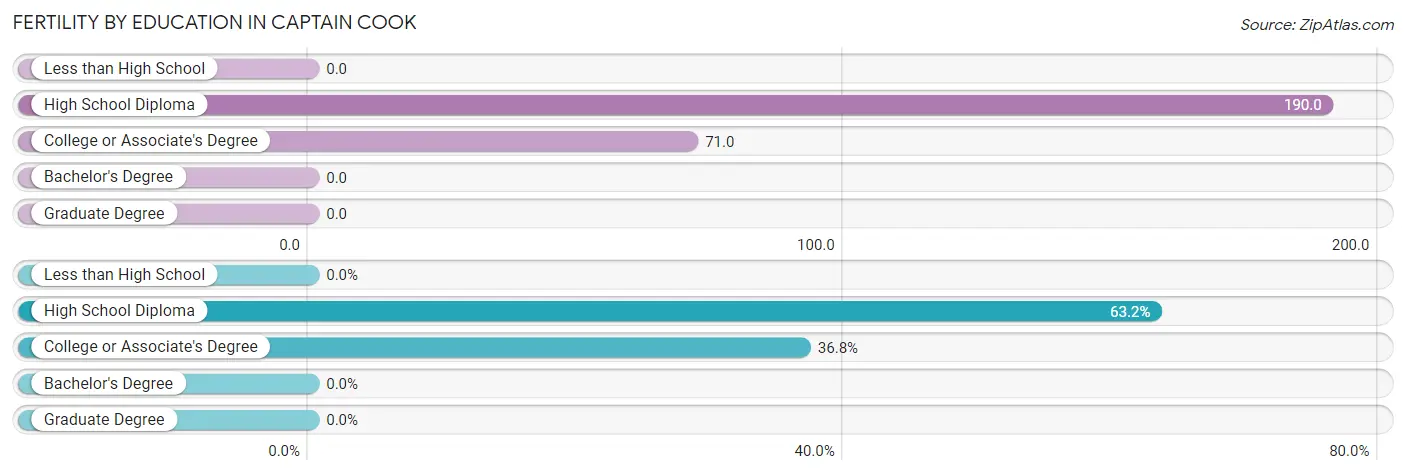
| Educational Attainment | Women with Births | Births / 1,000 Women |
| Less than High School | 0 (0.0%) | 0.0 |
| High School Diploma | 36 (63.2%) | 190.0 |
| College or Associate's Degree | 21 (36.8%) | 71.0 |
| Bachelor's Degree | 0 (0.0%) | 0.0 |
| Graduate Degree | 0 (0.0%) | 0.0 |
| Total | 57 (100.0%) | 80.0 |
Fertility by Education by Marriage Status in Captain Cook
36.8% of women with births in Captain Cook are unmarried. Women with the educational attainment of high school diploma are most likely to be married with 100.0% of them married at childbirth, while women with the educational attainment of college or associate's degree are least likely to be married with 100.0% of them unmarried at childbirth.
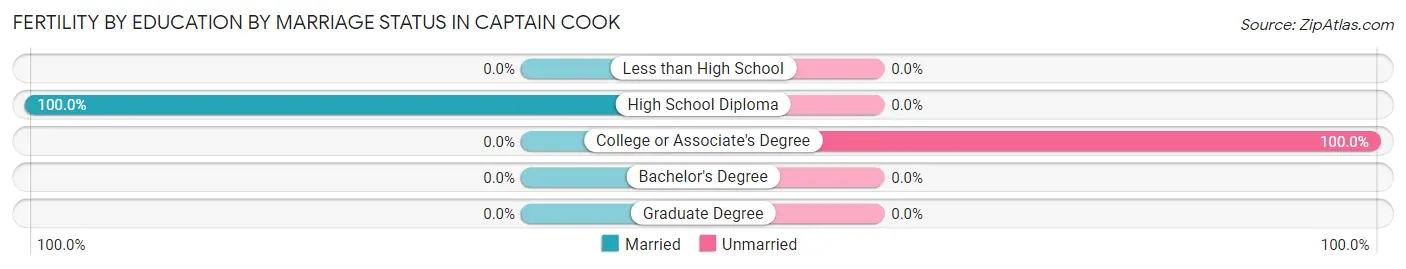
| Educational Attainment | Married | Unmarried |
| Less than High School | 0 (0.0%) | 0 (0.0%) |
| High School Diploma | 36 (100.0%) | 0 (0.0%) |
| College or Associate's Degree | 0 (0.0%) | 21 (100.0%) |
| Bachelor's Degree | 0 (0.0%) | 0 (0.0%) |
| Graduate Degree | 0 (0.0%) | 0 (0.0%) |
| Total | 36 (63.2%) | 21 (36.8%) |
Employment Characteristics in Captain Cook
Employment by Class of Employer in Captain Cook
Among the 1,836 employed individuals in Captain Cook, private company employees (1,227 | 66.8%), self-employed (not incorporated) (257 | 14.0%), and local government employees (163 | 8.9%) make up the most common classes of employment.
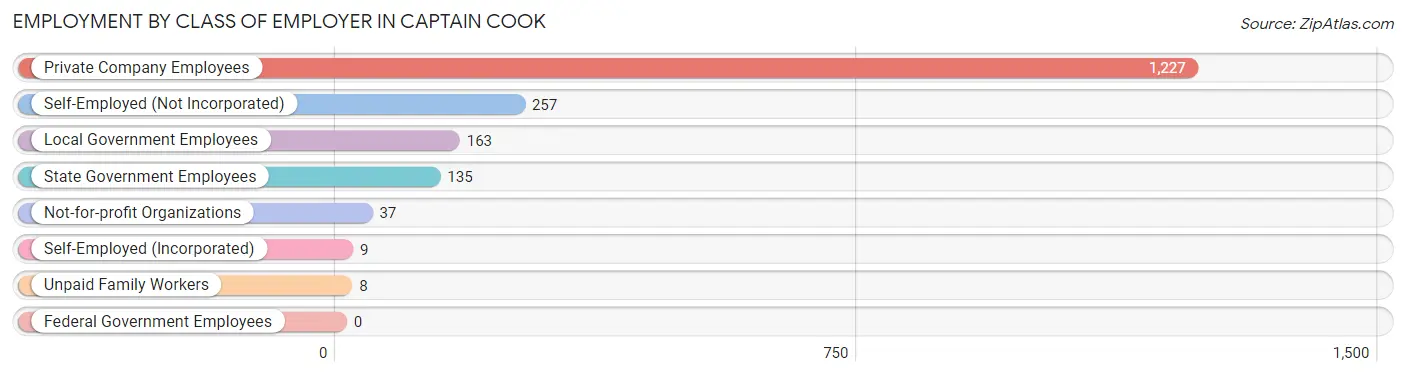
| Employer Class | # Employees | % Employees |
| Private Company Employees | 1,227 | 66.8% |
| Self-Employed (Incorporated) | 9 | 0.5% |
| Self-Employed (Not Incorporated) | 257 | 14.0% |
| Not-for-profit Organizations | 37 | 2.0% |
| Local Government Employees | 163 | 8.9% |
| State Government Employees | 135 | 7.3% |
| Federal Government Employees | 0 | 0.0% |
| Unpaid Family Workers | 8 | 0.4% |
| Total | 1,836 | 100.0% |
Employment Status by Age in Captain Cook
According to the labor force statistics for Captain Cook, out of the total population over 16 years of age (3,308), 59.9% or 1,981 individuals are in the labor force, with 6.5% or 129 of them unemployed. The age group with the highest labor force participation rate is 20 to 24 years, with 100.0% or 226 individuals in the labor force. Within the labor force, the 16 to 19 years age range has the highest percentage of unemployed individuals, with 36.5% or 57 of them being unemployed.
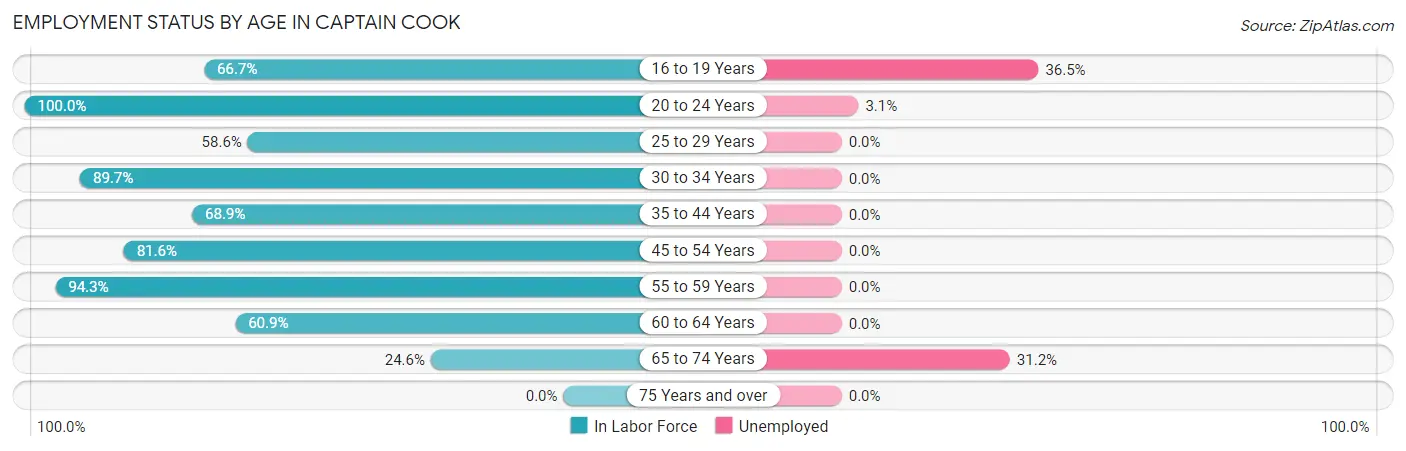
| Age Bracket | In Labor Force | Unemployed |
| 16 to 19 Years | 156 (66.7%) | 57 (36.5%) |
| 20 to 24 Years | 226 (100.0%) | 7 (3.1%) |
| 25 to 29 Years | 68 (58.6%) | 0 (0.0%) |
| 30 to 34 Years | 385 (89.7%) | 0 (0.0%) |
| 35 to 44 Years | 366 (68.9%) | 0 (0.0%) |
| 45 to 54 Years | 222 (81.6%) | 0 (0.0%) |
| 55 to 59 Years | 133 (94.3%) | 0 (0.0%) |
| 60 to 64 Years | 220 (60.9%) | 0 (0.0%) |
| 65 to 74 Years | 205 (24.6%) | 64 (31.2%) |
| 75 Years and over | 0 (0.0%) | 0 (0.0%) |
| Total | 1,981 (59.9%) | 129 (6.5%) |
Employment Status by Educational Attainment in Captain Cook
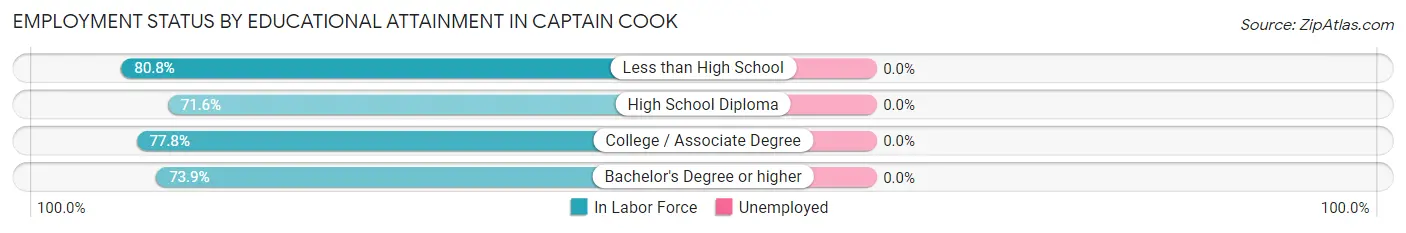
| Educational Attainment | In Labor Force | Unemployed |
| Less than High School | 219 (80.8%) | 0 (0.0%) |
| High School Diploma | 446 (71.6%) | 0 (0.0%) |
| College / Associate Degree | 452 (77.8%) | 0 (0.0%) |
| Bachelor's Degree or higher | 277 (73.9%) | 0 (0.0%) |
| Total | 1,395 (75.4%) | 0 (0.0%) |
Employment Occupations by Sex in Captain Cook
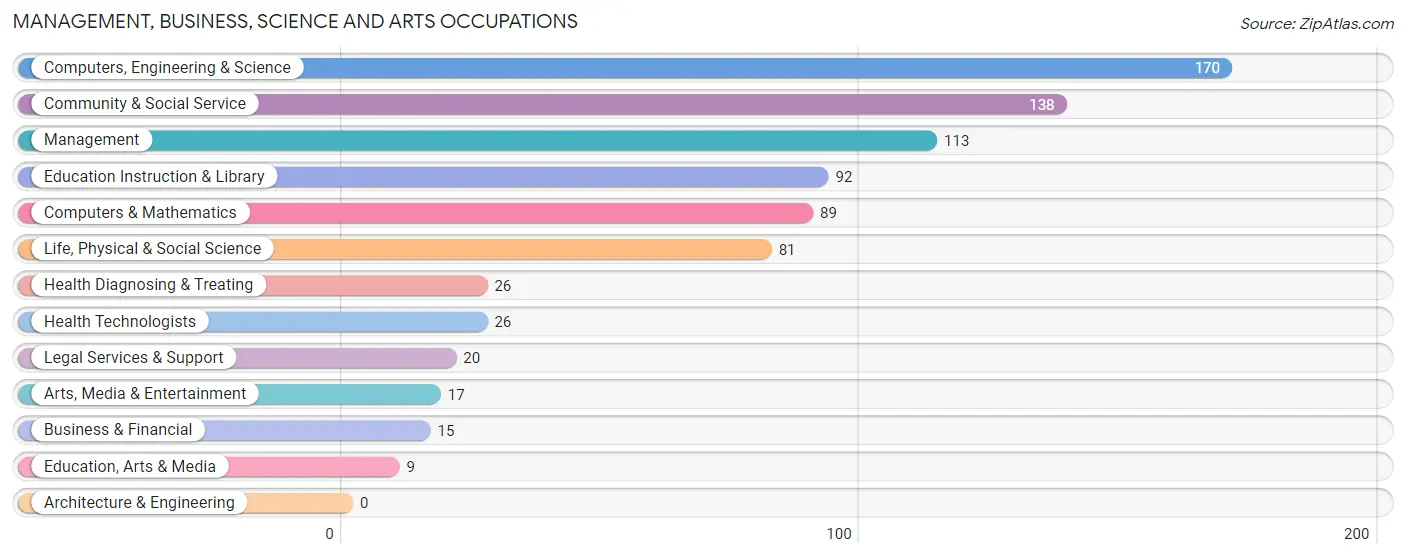
Management, Business, Science and Arts Occupations
The most common Management, Business, Science and Arts occupations in Captain Cook are Computers, Engineering & Science (170 | 9.2%), Community & Social Service (138 | 7.4%), Management (113 | 6.1%), Education Instruction & Library (92 | 5.0%), and Computers & Mathematics (89 | 4.8%).
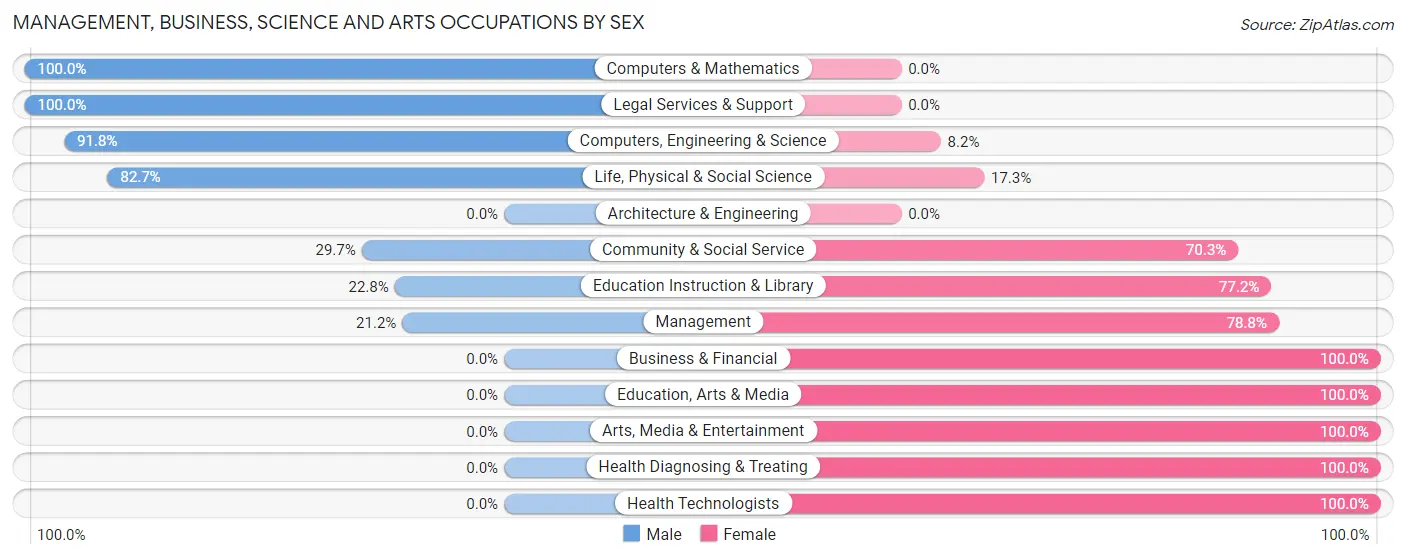
Management, Business, Science and Arts Occupations by Sex
Within the Management, Business, Science and Arts occupations in Captain Cook, the most male-oriented occupations are Computers & Mathematics (100.0%), Legal Services & Support (100.0%), and Computers, Engineering & Science (91.8%), while the most female-oriented occupations are Business & Financial (100.0%), Education, Arts & Media (100.0%), and Arts, Media & Entertainment (100.0%).
| Occupation | Male | Female |
| Management | 24 (21.2%) | 89 (78.8%) |
| Business & Financial | 0 (0.0%) | 15 (100.0%) |
| Computers, Engineering & Science | 156 (91.8%) | 14 (8.2%) |
| Computers & Mathematics | 89 (100.0%) | 0 (0.0%) |
| Architecture & Engineering | 0 (0.0%) | 0 (0.0%) |
| Life, Physical & Social Science | 67 (82.7%) | 14 (17.3%) |
| Community & Social Service | 41 (29.7%) | 97 (70.3%) |
| Education, Arts & Media | 0 (0.0%) | 9 (100.0%) |
| Legal Services & Support | 20 (100.0%) | 0 (0.0%) |
| Education Instruction & Library | 21 (22.8%) | 71 (77.2%) |
| Arts, Media & Entertainment | 0 (0.0%) | 17 (100.0%) |
| Health Diagnosing & Treating | 0 (0.0%) | 26 (100.0%) |
| Health Technologists | 0 (0.0%) | 26 (100.0%) |
| Total (Category) | 221 (47.8%) | 241 (52.2%) |
| Total (Overall) | 1,031 (55.6%) | 822 (44.4%) |
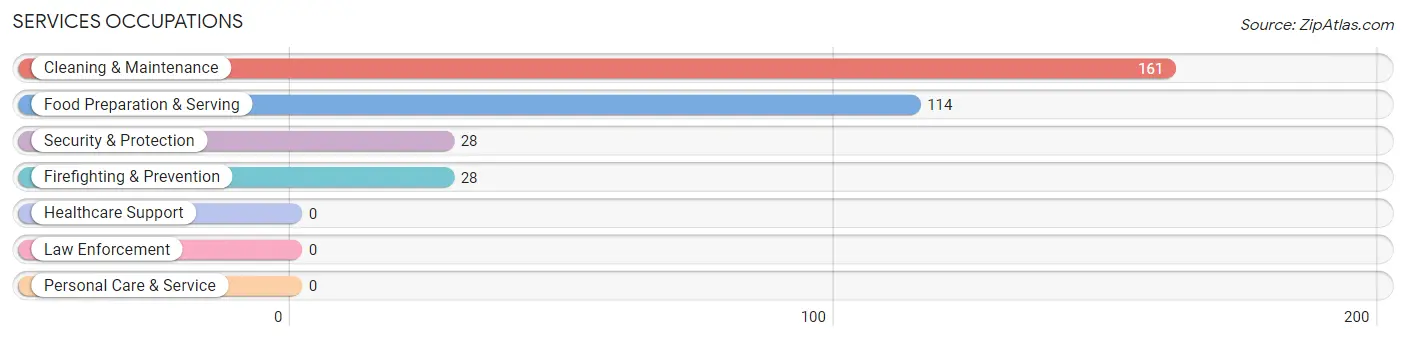
Services Occupations
The most common Services occupations in Captain Cook are Cleaning & Maintenance (161 | 8.7%), Food Preparation & Serving (114 | 6.1%), Security & Protection (28 | 1.5%), and Firefighting & Prevention (28 | 1.5%).
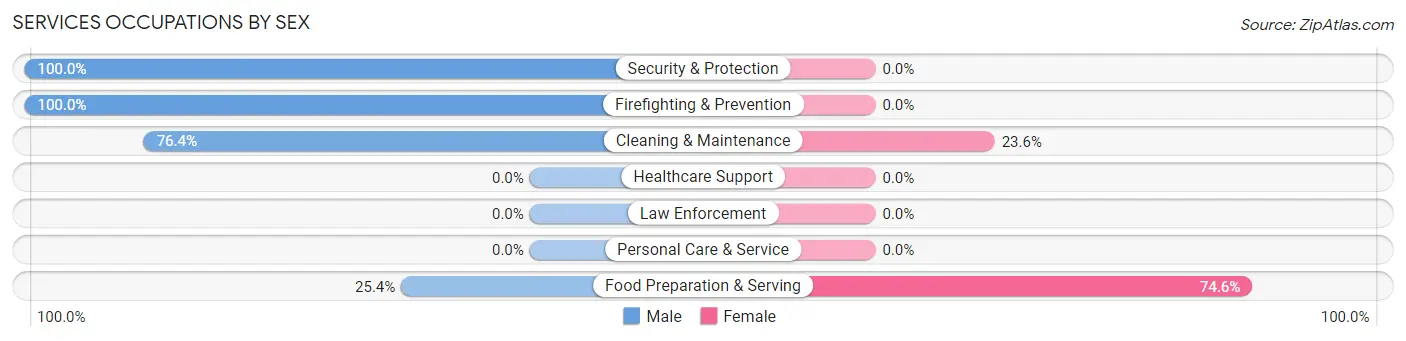
Services Occupations by Sex
Within the Services occupations in Captain Cook, the most male-oriented occupations are Security & Protection (100.0%), Firefighting & Prevention (100.0%), and Cleaning & Maintenance (76.4%), while the most female-oriented occupations are Food Preparation & Serving (74.6%), and Cleaning & Maintenance (23.6%).
| Occupation | Male | Female |
| Healthcare Support | 0 (0.0%) | 0 (0.0%) |
| Security & Protection | 28 (100.0%) | 0 (0.0%) |
| Firefighting & Prevention | 28 (100.0%) | 0 (0.0%) |
| Law Enforcement | 0 (0.0%) | 0 (0.0%) |
| Food Preparation & Serving | 29 (25.4%) | 85 (74.6%) |
| Cleaning & Maintenance | 123 (76.4%) | 38 (23.6%) |
| Personal Care & Service | 0 (0.0%) | 0 (0.0%) |
| Total (Category) | 180 (59.4%) | 123 (40.6%) |
| Total (Overall) | 1,031 (55.6%) | 822 (44.4%) |
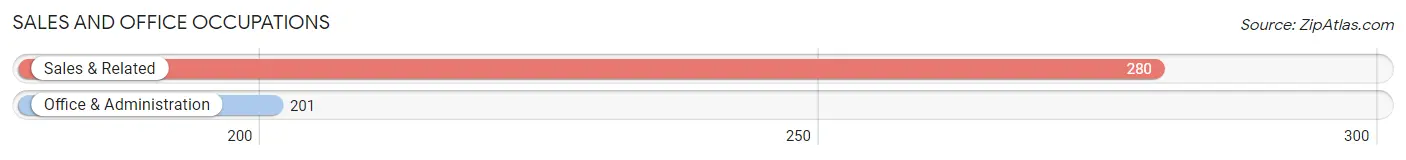
Sales and Office Occupations
The most common Sales and Office occupations in Captain Cook are Sales & Related (280 | 15.1%), and Office & Administration (201 | 10.8%).
Sales and Office Occupations by Sex
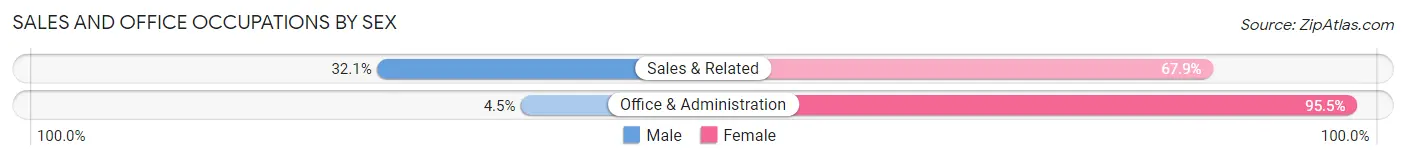
| Occupation | Male | Female |
| Sales & Related | 90 (32.1%) | 190 (67.9%) |
| Office & Administration | 9 (4.5%) | 192 (95.5%) |
| Total (Category) | 99 (20.6%) | 382 (79.4%) |
| Total (Overall) | 1,031 (55.6%) | 822 (44.4%) |
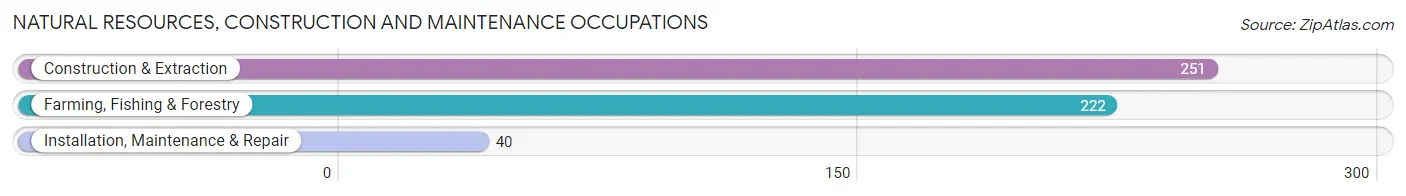
Natural Resources, Construction and Maintenance Occupations
The most common Natural Resources, Construction and Maintenance occupations in Captain Cook are Construction & Extraction (251 | 13.6%), Farming, Fishing & Forestry (222 | 12.0%), and Installation, Maintenance & Repair (40 | 2.2%).
Natural Resources, Construction and Maintenance Occupations by Sex
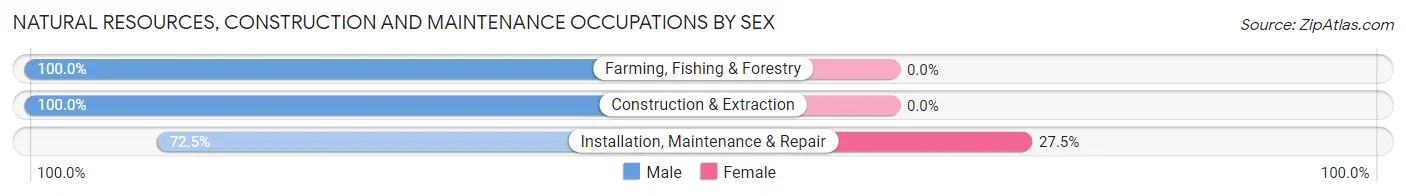
| Occupation | Male | Female |
| Farming, Fishing & Forestry | 222 (100.0%) | 0 (0.0%) |
| Construction & Extraction | 251 (100.0%) | 0 (0.0%) |
| Installation, Maintenance & Repair | 29 (72.5%) | 11 (27.5%) |
| Total (Category) | 502 (97.9%) | 11 (2.1%) |
| Total (Overall) | 1,031 (55.6%) | 822 (44.4%) |
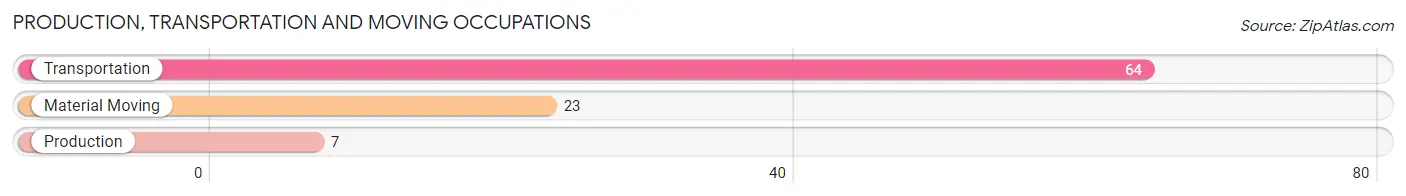
Production, Transportation and Moving Occupations
The most common Production, Transportation and Moving occupations in Captain Cook are Transportation (64 | 3.5%), Material Moving (23 | 1.2%), and Production (7 | 0.4%).
Production, Transportation and Moving Occupations by Sex
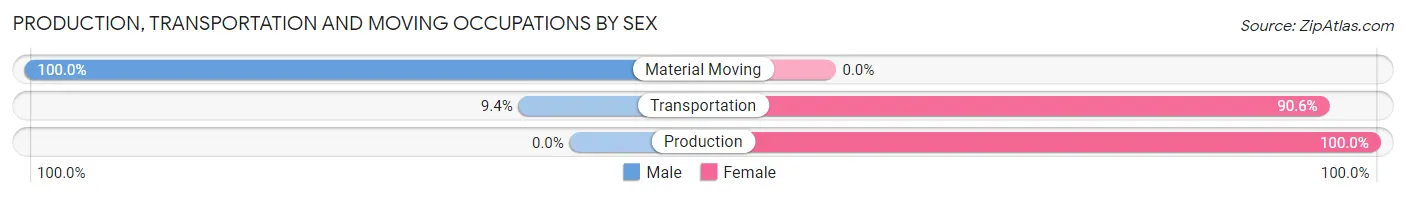
| Occupation | Male | Female |
| Production | 0 (0.0%) | 7 (100.0%) |
| Transportation | 6 (9.4%) | 58 (90.6%) |
| Material Moving | 23 (100.0%) | 0 (0.0%) |
| Total (Category) | 29 (30.8%) | 65 (69.2%) |
| Total (Overall) | 1,031 (55.6%) | 822 (44.4%) |
Employment Industries by Sex in Captain Cook
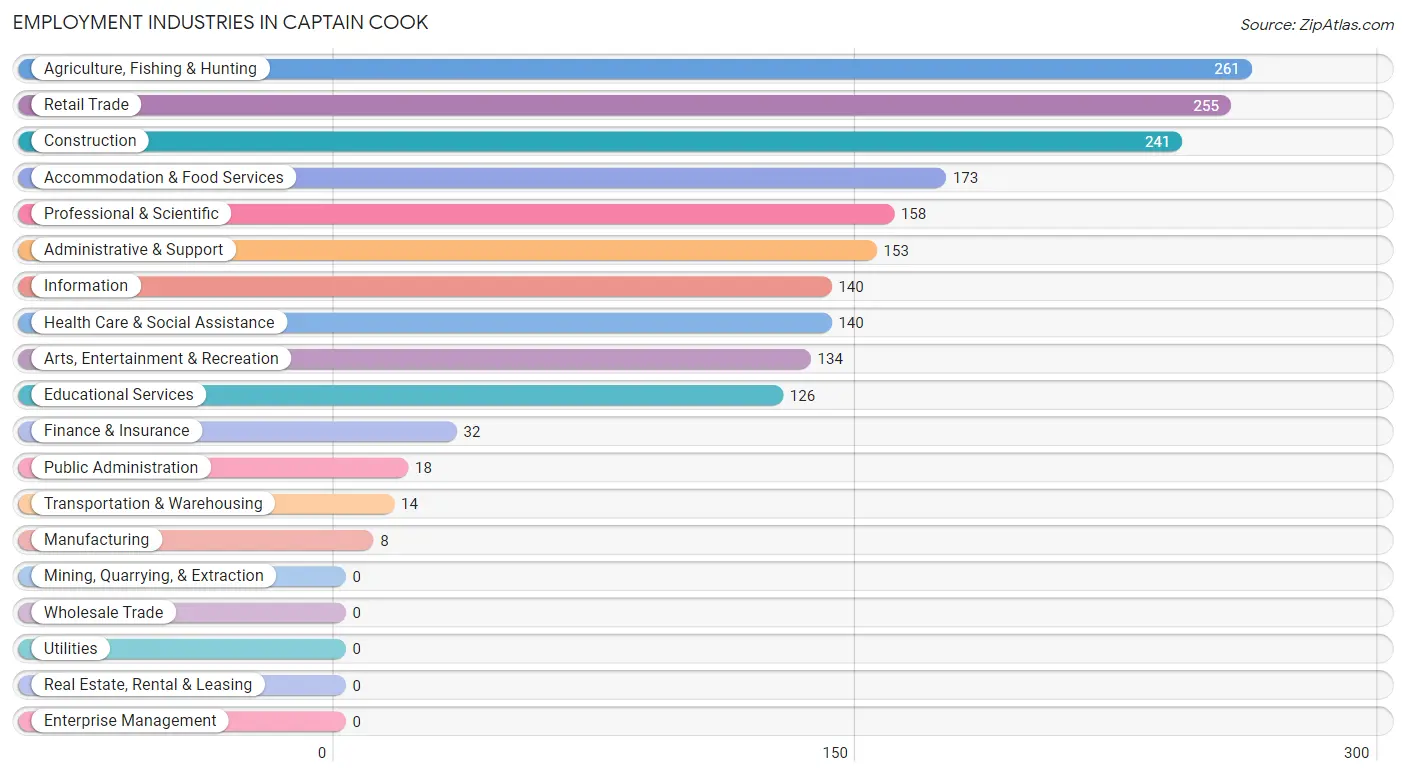
Employment Industries in Captain Cook
The major employment industries in Captain Cook include Agriculture, Fishing & Hunting (261 | 14.1%), Retail Trade (255 | 13.8%), Construction (241 | 13.0%), Accommodation & Food Services (173 | 9.3%), and Professional & Scientific (158 | 8.5%).
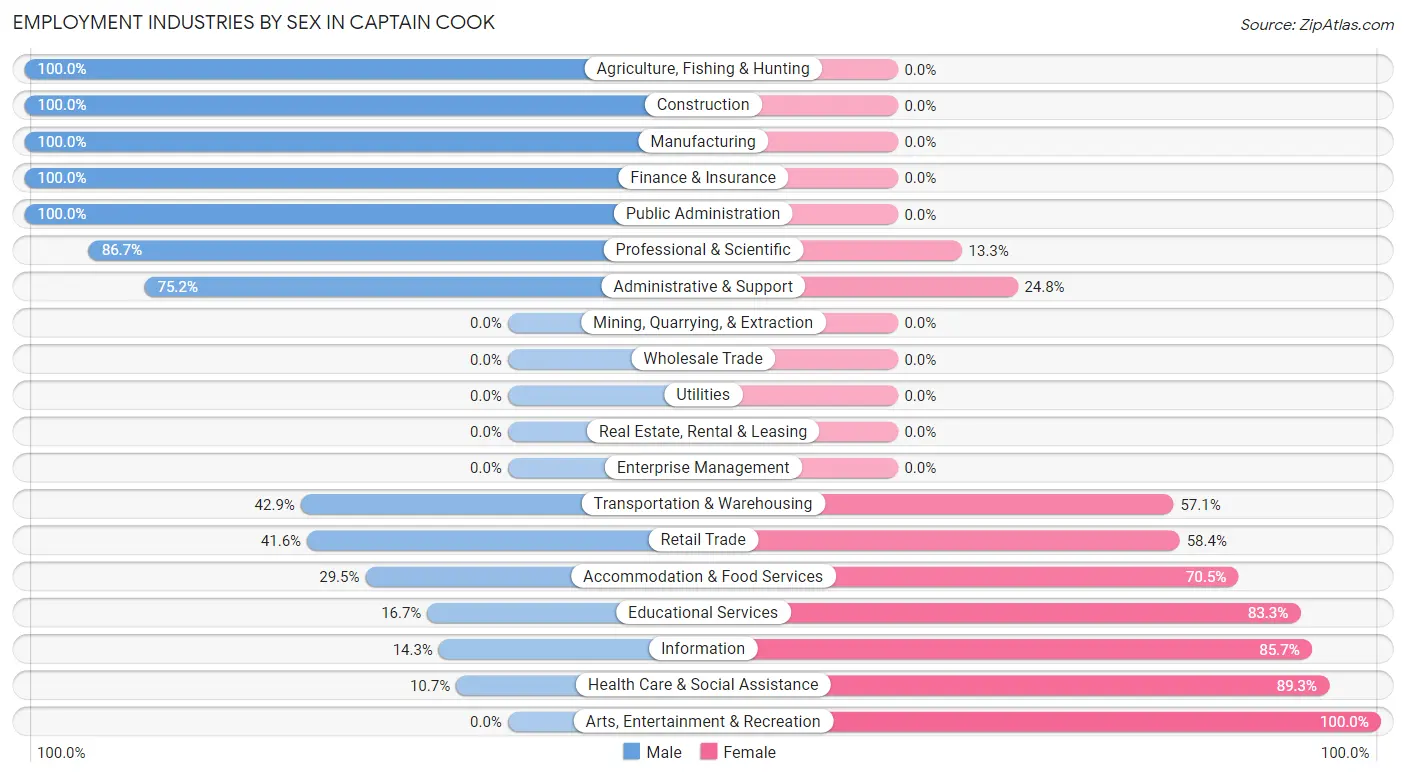
Employment Industries by Sex in Captain Cook
The Captain Cook industries that see more men than women are Agriculture, Fishing & Hunting (100.0%), Construction (100.0%), and Manufacturing (100.0%), whereas the industries that tend to have a higher number of women are Arts, Entertainment & Recreation (100.0%), Health Care & Social Assistance (89.3%), and Information (85.7%).
| Industry | Male | Female |
| Agriculture, Fishing & Hunting | 261 (100.0%) | 0 (0.0%) |
| Mining, Quarrying, & Extraction | 0 (0.0%) | 0 (0.0%) |
| Construction | 241 (100.0%) | 0 (0.0%) |
| Manufacturing | 8 (100.0%) | 0 (0.0%) |
| Wholesale Trade | 0 (0.0%) | 0 (0.0%) |
| Retail Trade | 106 (41.6%) | 149 (58.4%) |
| Transportation & Warehousing | 6 (42.9%) | 8 (57.1%) |
| Utilities | 0 (0.0%) | 0 (0.0%) |
| Information | 20 (14.3%) | 120 (85.7%) |
| Finance & Insurance | 32 (100.0%) | 0 (0.0%) |
| Real Estate, Rental & Leasing | 0 (0.0%) | 0 (0.0%) |
| Professional & Scientific | 137 (86.7%) | 21 (13.3%) |
| Enterprise Management | 0 (0.0%) | 0 (0.0%) |
| Administrative & Support | 115 (75.2%) | 38 (24.8%) |
| Educational Services | 21 (16.7%) | 105 (83.3%) |
| Health Care & Social Assistance | 15 (10.7%) | 125 (89.3%) |
| Arts, Entertainment & Recreation | 0 (0.0%) | 134 (100.0%) |
| Accommodation & Food Services | 51 (29.5%) | 122 (70.5%) |
| Public Administration | 18 (100.0%) | 0 (0.0%) |
| Total | 1,031 (55.6%) | 822 (44.4%) |
Education in Captain Cook
School Enrollment in Captain Cook
The most common levels of schooling among the 806 students in Captain Cook are elementary school (228 | 28.3%), college / undergraduate (196 | 24.3%), and middle school (192 | 23.8%).
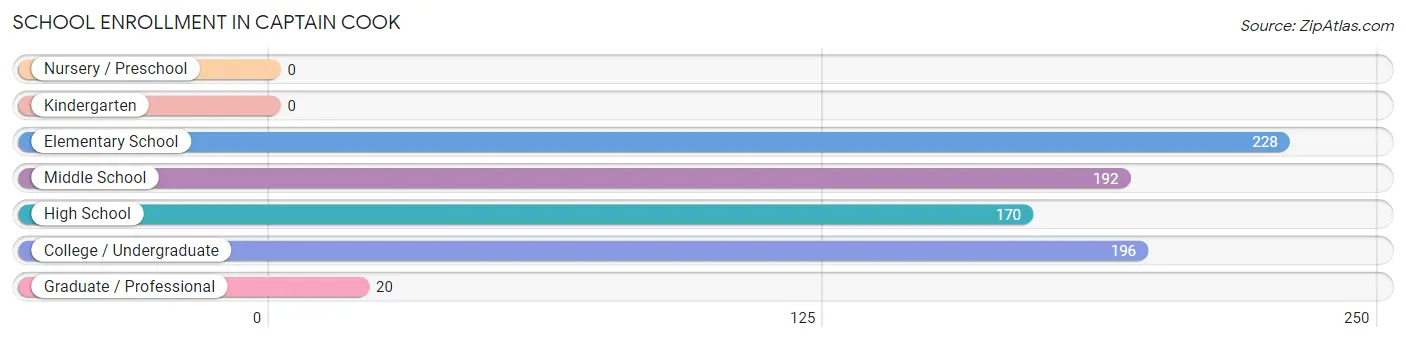
| School Level | # Students | % Students |
| Nursery / Preschool | 0 | 0.0% |
| Kindergarten | 0 | 0.0% |
| Elementary School | 228 | 28.3% |
| Middle School | 192 | 23.8% |
| High School | 170 | 21.1% |
| College / Undergraduate | 196 | 24.3% |
| Graduate / Professional | 20 | 2.5% |
| Total | 806 | 100.0% |
School Enrollment by Age by Funding Source in Captain Cook
Out of a total of 806 students who are enrolled in schools in Captain Cook, 78 (9.7%) attend a private institution, while the remaining 728 (90.3%) are enrolled in public schools. The age group of 35 years and over has the highest likelihood of being enrolled in private schools, with 20 (31.8% in the age bracket) enrolled. Conversely, the age group of 5 to 9 year old has the lowest likelihood of being enrolled in a private school, with 228 (100.0% in the age bracket) attending a public institution.
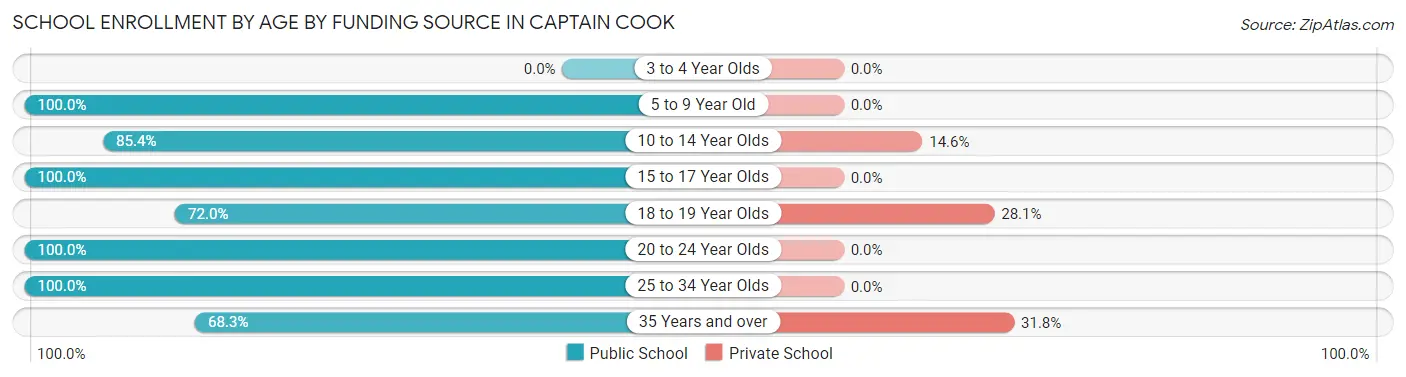
| Age Bracket | Public School | Private School |
| 3 to 4 Year Olds | 0 (0.0%) | 0 (0.0%) |
| 5 to 9 Year Old | 228 (100.0%) | 0 (0.0%) |
| 10 to 14 Year Olds | 204 (85.4%) | 35 (14.6%) |
| 15 to 17 Year Olds | 111 (100.0%) | 0 (0.0%) |
| 18 to 19 Year Olds | 59 (72.0%) | 23 (28.1%) |
| 20 to 24 Year Olds | 47 (100.0%) | 0 (0.0%) |
| 25 to 34 Year Olds | 36 (100.0%) | 0 (0.0%) |
| 35 Years and over | 43 (68.2%) | 20 (31.8%) |
| Total | 728 (90.3%) | 78 (9.7%) |
Educational Attainment by Field of Study in Captain Cook
Business (252 | 31.1%), education (126 | 15.6%), arts & humanities (126 | 15.6%), social sciences (67 | 8.3%), and engineering (57 | 7.0%) are the most common fields of study among 810 individuals in Captain Cook who have obtained a bachelor's degree or higher.
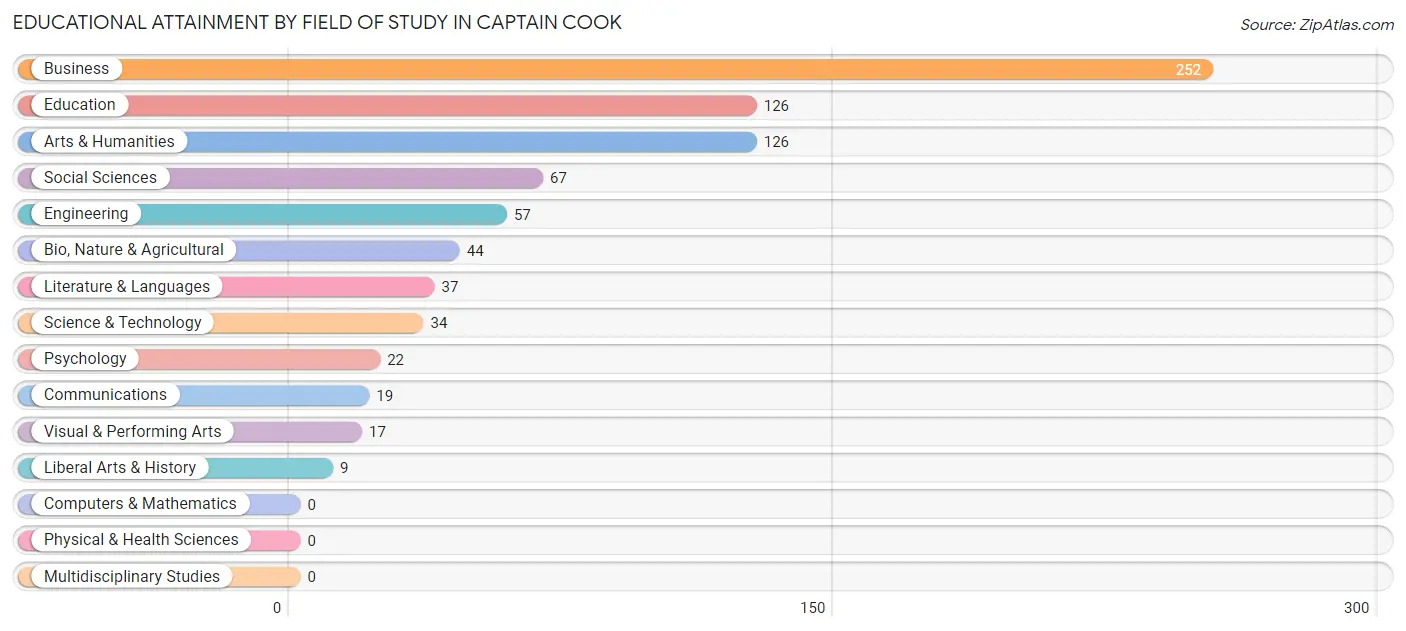
| Field of Study | # Graduates | % Graduates |
| Computers & Mathematics | 0 | 0.0% |
| Bio, Nature & Agricultural | 44 | 5.4% |
| Physical & Health Sciences | 0 | 0.0% |
| Psychology | 22 | 2.7% |
| Social Sciences | 67 | 8.3% |
| Engineering | 57 | 7.0% |
| Multidisciplinary Studies | 0 | 0.0% |
| Science & Technology | 34 | 4.2% |
| Business | 252 | 31.1% |
| Education | 126 | 15.6% |
| Literature & Languages | 37 | 4.6% |
| Liberal Arts & History | 9 | 1.1% |
| Visual & Performing Arts | 17 | 2.1% |
| Communications | 19 | 2.4% |
| Arts & Humanities | 126 | 15.6% |
| Total | 810 | 100.0% |
Transportation & Commute in Captain Cook
Vehicle Availability by Sex in Captain Cook
The most prevalent vehicle ownership categories in Captain Cook are males with 3 vehicles (286, accounting for 27.7%) and females with 3 vehicles (227, making up 35.5%).
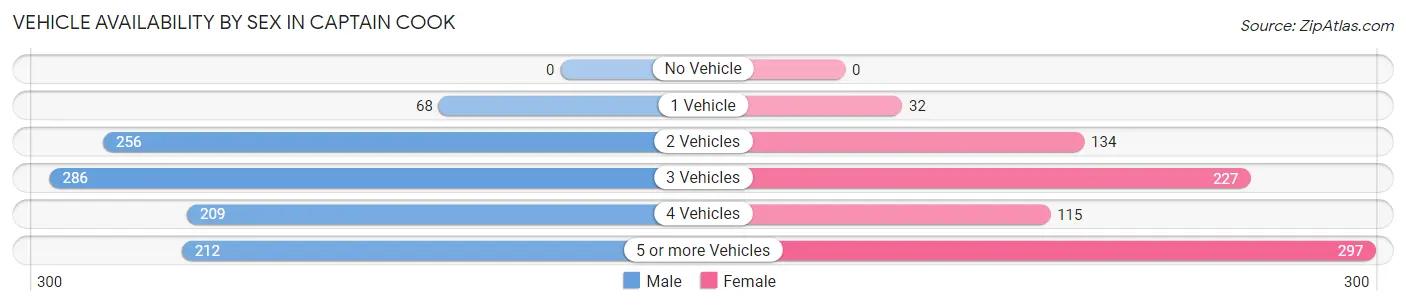
| Vehicles Available | Male | Female |
| No Vehicle | 0 (0.0%) | 0 (0.0%) |
| 1 Vehicle | 68 (6.6%) | 32 (4.0%) |
| 2 Vehicles | 256 (24.8%) | 134 (16.7%) |
| 3 Vehicles | 286 (27.7%) | 227 (28.2%) |
| 4 Vehicles | 209 (20.3%) | 115 (14.3%) |
| 5 or more Vehicles | 212 (20.6%) | 297 (36.9%) |
| Total | 1,031 (100.0%) | 805 (100.0%) |
Commute Time in Captain Cook
The most frequently occuring commute durations in Captain Cook are 30 to 34 minutes (268 commuters, 17.9%), 25 to 29 minutes (252 commuters, 16.8%), and 5 to 9 minutes (222 commuters, 14.8%).
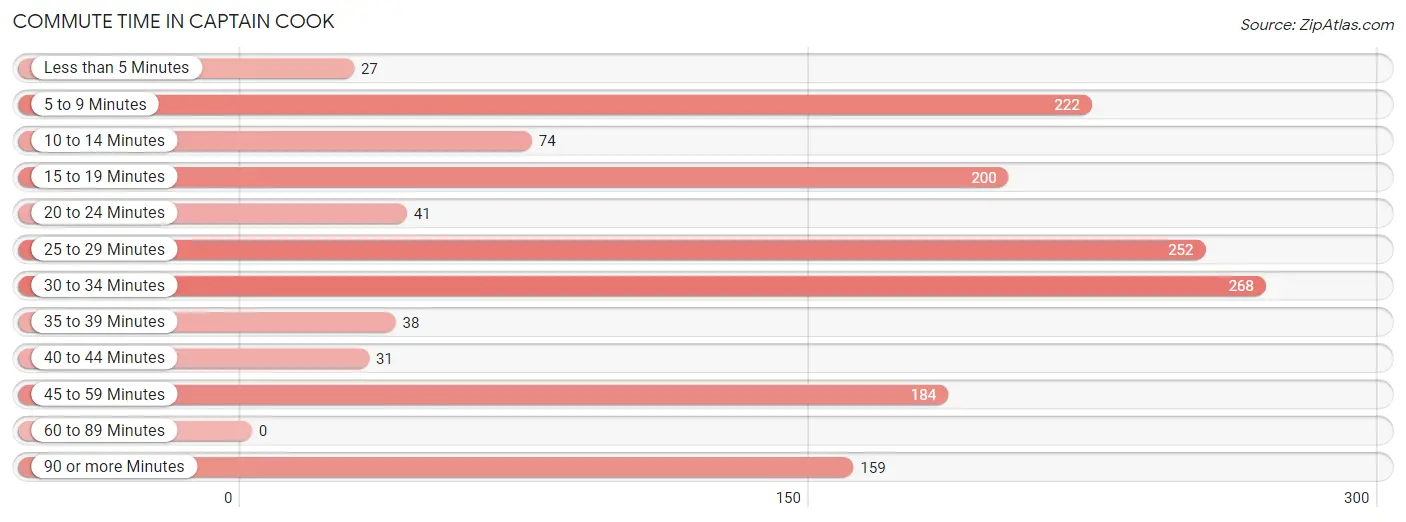
| Commute Time | # Commuters | % Commuters |
| Less than 5 Minutes | 27 | 1.8% |
| 5 to 9 Minutes | 222 | 14.8% |
| 10 to 14 Minutes | 74 | 5.0% |
| 15 to 19 Minutes | 200 | 13.4% |
| 20 to 24 Minutes | 41 | 2.7% |
| 25 to 29 Minutes | 252 | 16.8% |
| 30 to 34 Minutes | 268 | 17.9% |
| 35 to 39 Minutes | 38 | 2.5% |
| 40 to 44 Minutes | 31 | 2.1% |
| 45 to 59 Minutes | 184 | 12.3% |
| 60 to 89 Minutes | 0 | 0.0% |
| 90 or more Minutes | 159 | 10.6% |
Commute Time by Sex in Captain Cook
The most common commute times in Captain Cook are 25 to 29 minutes (205 commuters, 23.7%) for males and 30 to 34 minutes (221 commuters, 35.0%) for females.
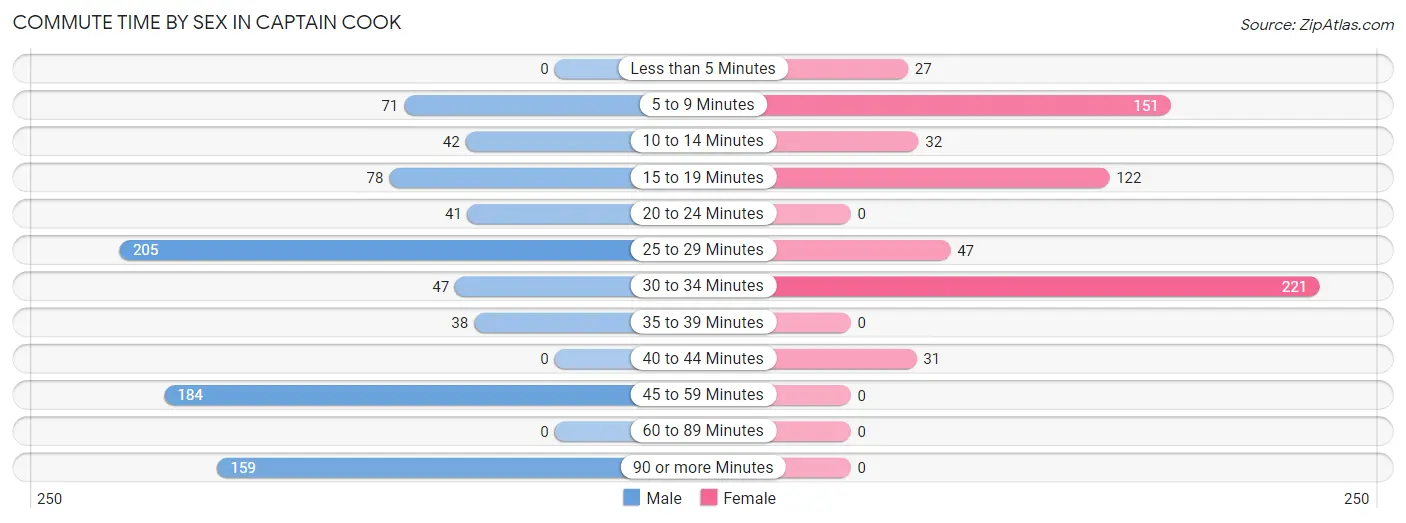
| Commute Time | Male | Female |
| Less than 5 Minutes | 0 (0.0%) | 27 (4.3%) |
| 5 to 9 Minutes | 71 (8.2%) | 151 (23.9%) |
| 10 to 14 Minutes | 42 (4.9%) | 32 (5.1%) |
| 15 to 19 Minutes | 78 (9.0%) | 122 (19.3%) |
| 20 to 24 Minutes | 41 (4.7%) | 0 (0.0%) |
| 25 to 29 Minutes | 205 (23.7%) | 47 (7.4%) |
| 30 to 34 Minutes | 47 (5.4%) | 221 (35.0%) |
| 35 to 39 Minutes | 38 (4.4%) | 0 (0.0%) |
| 40 to 44 Minutes | 0 (0.0%) | 31 (4.9%) |
| 45 to 59 Minutes | 184 (21.3%) | 0 (0.0%) |
| 60 to 89 Minutes | 0 (0.0%) | 0 (0.0%) |
| 90 or more Minutes | 159 (18.4%) | 0 (0.0%) |
Time of Departure to Work by Sex in Captain Cook
The most frequent times of departure to work in Captain Cook are 6:00 AM to 6:29 AM (277, 32.0%) for males and 8:00 AM to 8:29 AM (240, 38.0%) for females.
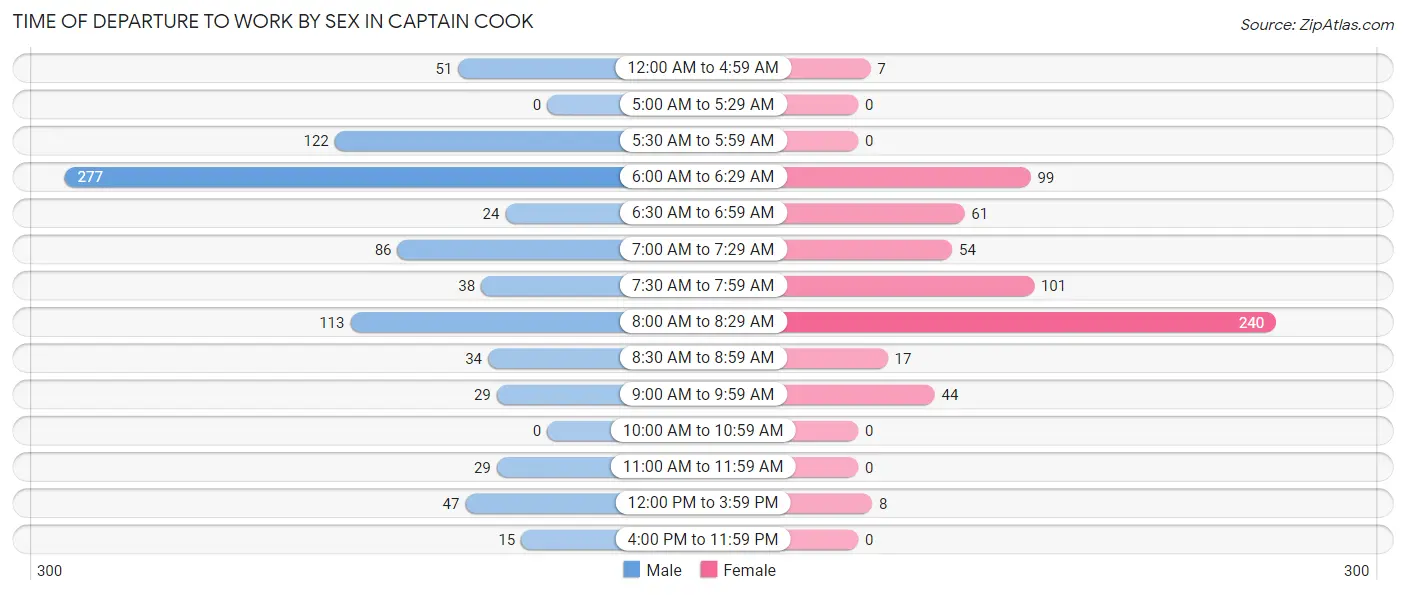
| Time of Departure | Male | Female |
| 12:00 AM to 4:59 AM | 51 (5.9%) | 7 (1.1%) |
| 5:00 AM to 5:29 AM | 0 (0.0%) | 0 (0.0%) |
| 5:30 AM to 5:59 AM | 122 (14.1%) | 0 (0.0%) |
| 6:00 AM to 6:29 AM | 277 (32.0%) | 99 (15.7%) |
| 6:30 AM to 6:59 AM | 24 (2.8%) | 61 (9.7%) |
| 7:00 AM to 7:29 AM | 86 (9.9%) | 54 (8.6%) |
| 7:30 AM to 7:59 AM | 38 (4.4%) | 101 (16.0%) |
| 8:00 AM to 8:29 AM | 113 (13.1%) | 240 (38.0%) |
| 8:30 AM to 8:59 AM | 34 (3.9%) | 17 (2.7%) |
| 9:00 AM to 9:59 AM | 29 (3.4%) | 44 (7.0%) |
| 10:00 AM to 10:59 AM | 0 (0.0%) | 0 (0.0%) |
| 11:00 AM to 11:59 AM | 29 (3.4%) | 0 (0.0%) |
| 12:00 PM to 3:59 PM | 47 (5.4%) | 8 (1.3%) |
| 4:00 PM to 11:59 PM | 15 (1.7%) | 0 (0.0%) |
| Total | 865 (100.0%) | 631 (100.0%) |
Housing Occupancy in Captain Cook
Occupancy by Ownership in Captain Cook
Of the total 992 dwellings in Captain Cook, owner-occupied units account for 471 (47.5%), while renter-occupied units make up 521 (52.5%).
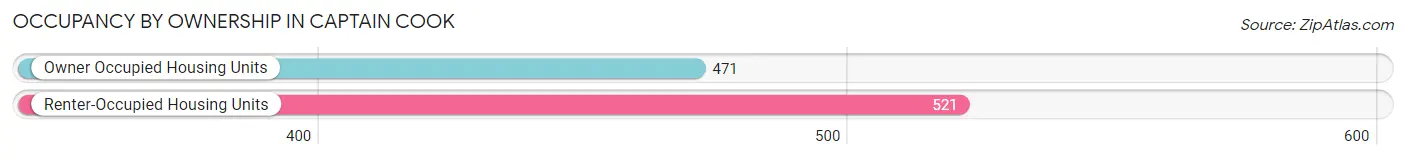
| Occupancy | # Housing Units | % Housing Units |
| Owner Occupied Housing Units | 471 | 47.5% |
| Renter-Occupied Housing Units | 521 | 52.5% |
| Total Occupied Housing Units | 992 | 100.0% |
Occupancy by Household Size in Captain Cook
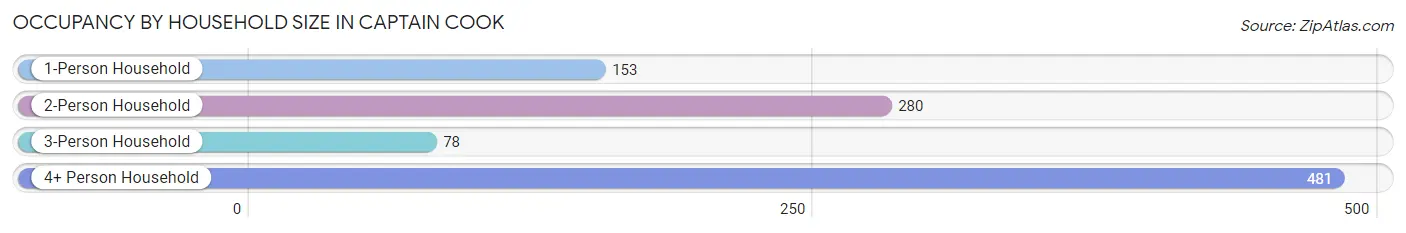
| Household Size | # Housing Units | % Housing Units |
| 1-Person Household | 153 | 15.4% |
| 2-Person Household | 280 | 28.2% |
| 3-Person Household | 78 | 7.9% |
| 4+ Person Household | 481 | 48.5% |
| Total Housing Units | 992 | 100.0% |
Occupancy by Ownership by Household Size in Captain Cook
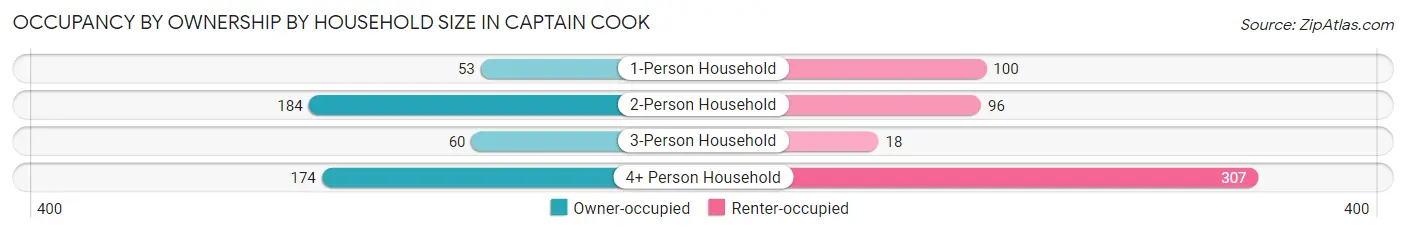
| Household Size | Owner-occupied | Renter-occupied |
| 1-Person Household | 53 (34.6%) | 100 (65.4%) |
| 2-Person Household | 184 (65.7%) | 96 (34.3%) |
| 3-Person Household | 60 (76.9%) | 18 (23.1%) |
| 4+ Person Household | 174 (36.2%) | 307 (63.8%) |
| Total Housing Units | 471 (47.5%) | 521 (52.5%) |
Occupancy by Educational Attainment in Captain Cook
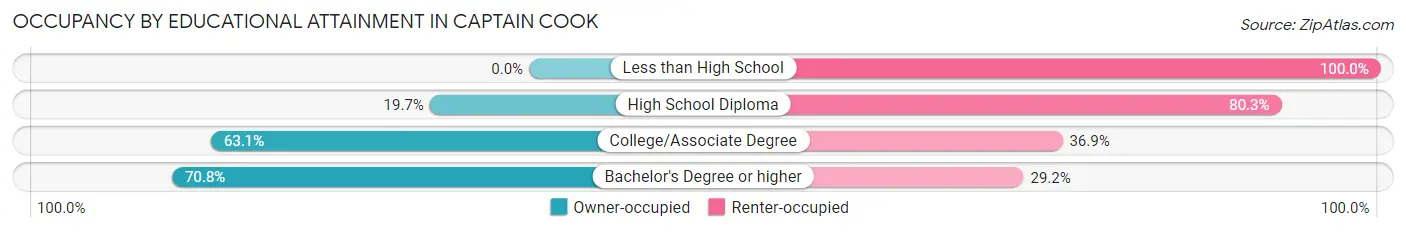
| Household Size | Owner-occupied | Renter-occupied |
| Less than High School | 0 (0.0%) | 158 (100.0%) |
| High School Diploma | 38 (19.7%) | 155 (80.3%) |
| College/Associate Degree | 169 (63.1%) | 99 (36.9%) |
| Bachelor's Degree or higher | 264 (70.8%) | 109 (29.2%) |
Occupancy by Age of Householder in Captain Cook
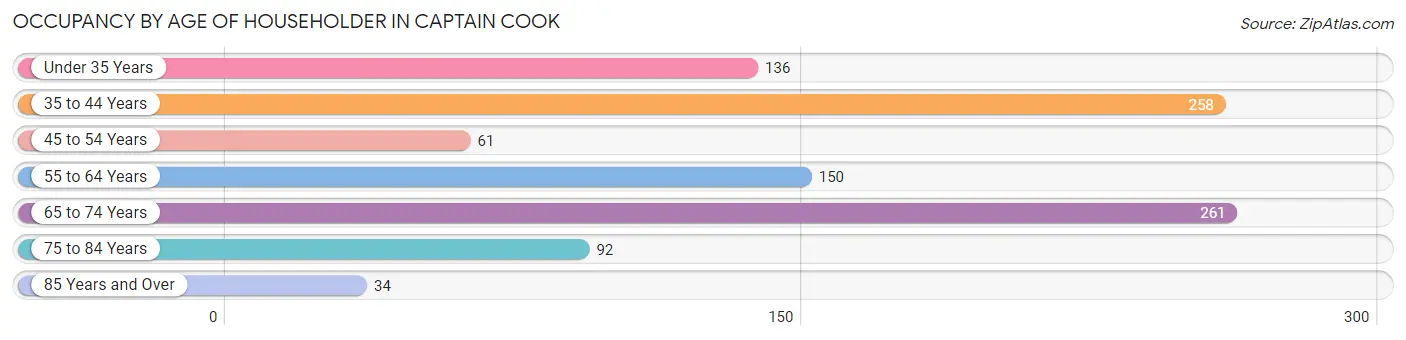
| Age Bracket | # Households | % Households |
| Under 35 Years | 136 | 13.7% |
| 35 to 44 Years | 258 | 26.0% |
| 45 to 54 Years | 61 | 6.1% |
| 55 to 64 Years | 150 | 15.1% |
| 65 to 74 Years | 261 | 26.3% |
| 75 to 84 Years | 92 | 9.3% |
| 85 Years and Over | 34 | 3.4% |
| Total | 992 | 100.0% |
Housing Finances in Captain Cook
Median Income by Occupancy in Captain Cook
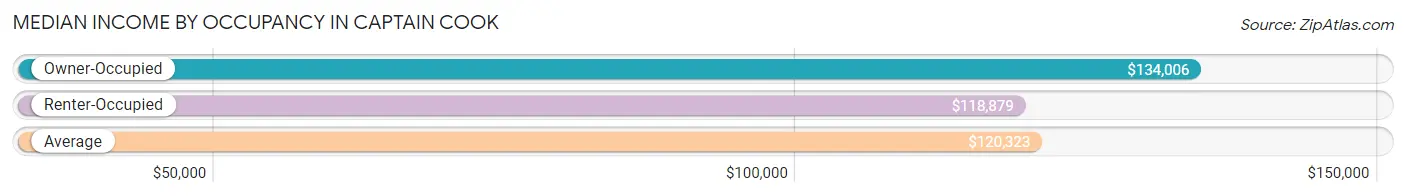
| Occupancy Type | # Households | Median Income |
| Owner-Occupied | 471 (47.5%) | $134,006 |
| Renter-Occupied | 521 (52.5%) | $118,879 |
| Average | 992 (100.0%) | $120,323 |
Occupancy by Householder Income Bracket in Captain Cook
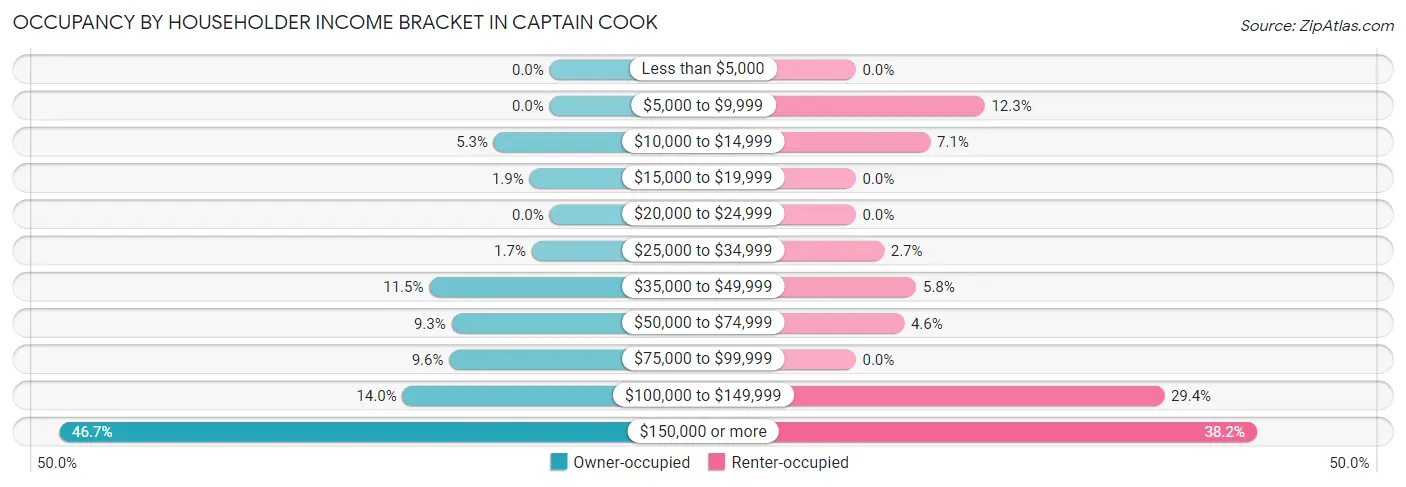
| Income Bracket | Owner-occupied | Renter-occupied |
| Less than $5,000 | 0 (0.0%) | 0 (0.0%) |
| $5,000 to $9,999 | 0 (0.0%) | 64 (12.3%) |
| $10,000 to $14,999 | 25 (5.3%) | 37 (7.1%) |
| $15,000 to $19,999 | 9 (1.9%) | 0 (0.0%) |
| $20,000 to $24,999 | 0 (0.0%) | 0 (0.0%) |
| $25,000 to $34,999 | 8 (1.7%) | 14 (2.7%) |
| $35,000 to $49,999 | 54 (11.5%) | 30 (5.8%) |
| $50,000 to $74,999 | 44 (9.3%) | 24 (4.6%) |
| $75,000 to $99,999 | 45 (9.6%) | 0 (0.0%) |
| $100,000 to $149,999 | 66 (14.0%) | 153 (29.4%) |
| $150,000 or more | 220 (46.7%) | 199 (38.2%) |
| Total | 471 (100.0%) | 521 (100.0%) |
Monthly Housing Cost Tiers in Captain Cook
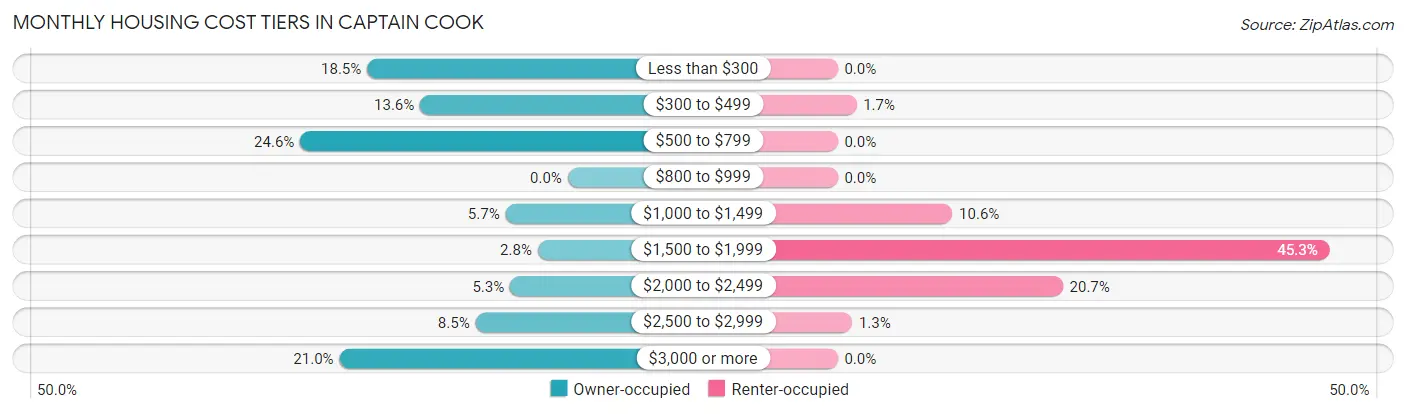
| Monthly Cost | Owner-occupied | Renter-occupied |
| Less than $300 | 87 (18.5%) | 0 (0.0%) |
| $300 to $499 | 64 (13.6%) | 9 (1.7%) |
| $500 to $799 | 116 (24.6%) | 0 (0.0%) |
| $800 to $999 | 0 (0.0%) | 0 (0.0%) |
| $1,000 to $1,499 | 27 (5.7%) | 55 (10.6%) |
| $1,500 to $1,999 | 13 (2.8%) | 236 (45.3%) |
| $2,000 to $2,499 | 25 (5.3%) | 108 (20.7%) |
| $2,500 to $2,999 | 40 (8.5%) | 7 (1.3%) |
| $3,000 or more | 99 (21.0%) | 0 (0.0%) |
| Total | 471 (100.0%) | 521 (100.0%) |
Physical Housing Characteristics in Captain Cook
Housing Structures in Captain Cook
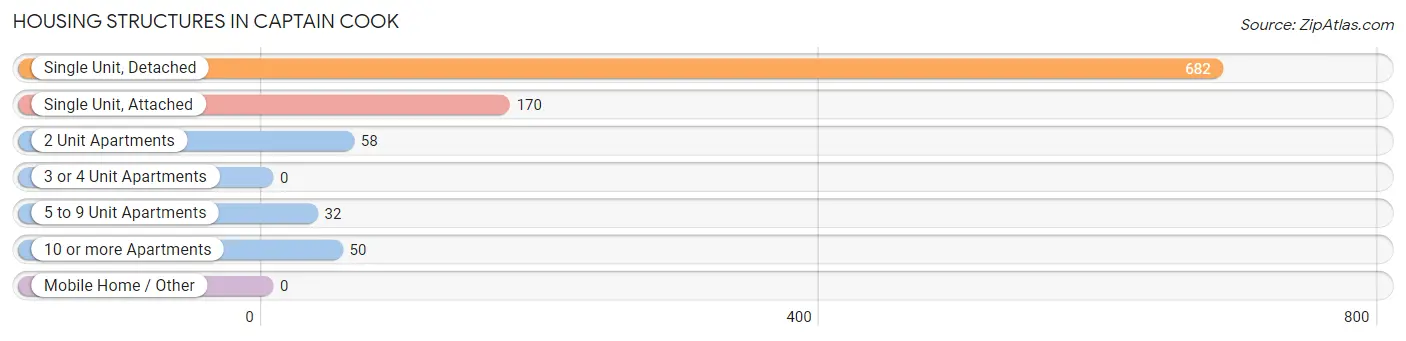
| Structure Type | # Housing Units | % Housing Units |
| Single Unit, Detached | 682 | 68.8% |
| Single Unit, Attached | 170 | 17.1% |
| 2 Unit Apartments | 58 | 5.9% |
| 3 or 4 Unit Apartments | 0 | 0.0% |
| 5 to 9 Unit Apartments | 32 | 3.2% |
| 10 or more Apartments | 50 | 5.0% |
| Mobile Home / Other | 0 | 0.0% |
| Total | 992 | 100.0% |
Housing Structures by Occupancy in Captain Cook
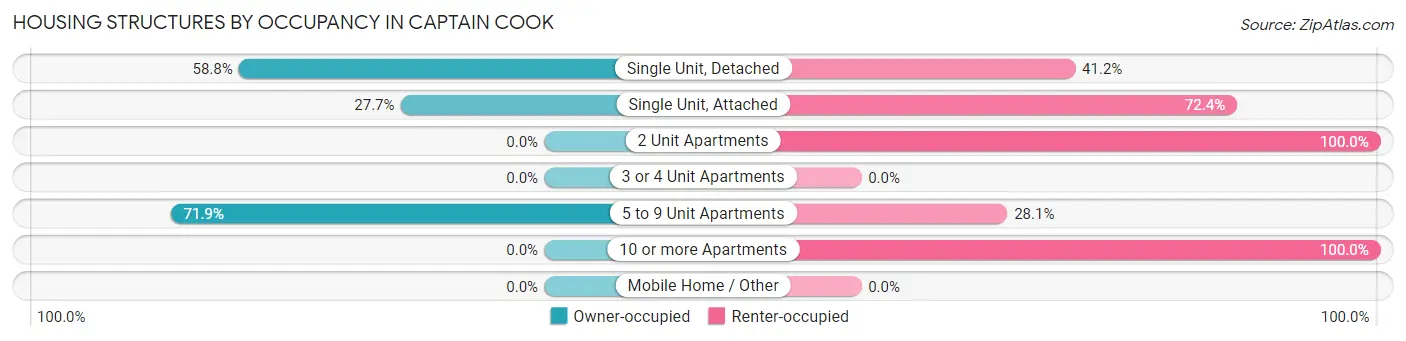
| Structure Type | Owner-occupied | Renter-occupied |
| Single Unit, Detached | 401 (58.8%) | 281 (41.2%) |
| Single Unit, Attached | 47 (27.7%) | 123 (72.4%) |
| 2 Unit Apartments | 0 (0.0%) | 58 (100.0%) |
| 3 or 4 Unit Apartments | 0 (0.0%) | 0 (0.0%) |
| 5 to 9 Unit Apartments | 23 (71.9%) | 9 (28.1%) |
| 10 or more Apartments | 0 (0.0%) | 50 (100.0%) |
| Mobile Home / Other | 0 (0.0%) | 0 (0.0%) |
| Total | 471 (47.5%) | 521 (52.5%) |
Housing Structures by Number of Rooms in Captain Cook
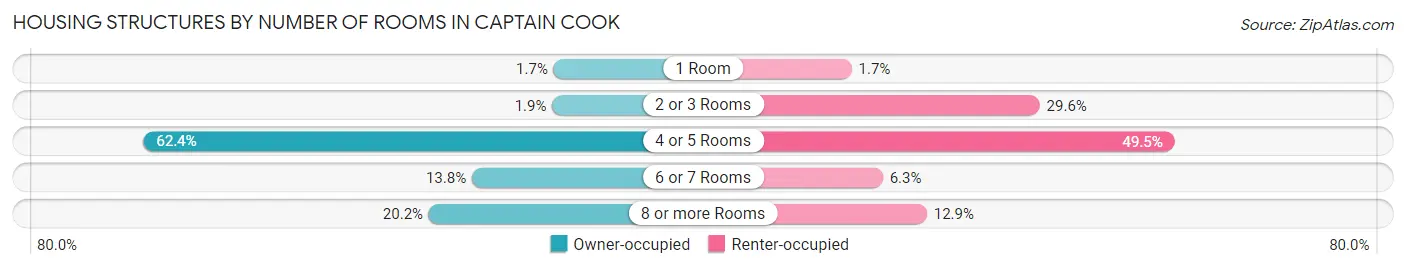
| Number of Rooms | Owner-occupied | Renter-occupied |
| 1 Room | 8 (1.7%) | 9 (1.7%) |
| 2 or 3 Rooms | 9 (1.9%) | 154 (29.6%) |
| 4 or 5 Rooms | 294 (62.4%) | 258 (49.5%) |
| 6 or 7 Rooms | 65 (13.8%) | 33 (6.3%) |
| 8 or more Rooms | 95 (20.2%) | 67 (12.9%) |
| Total | 471 (100.0%) | 521 (100.0%) |
Housing Structure by Heating Type in Captain Cook
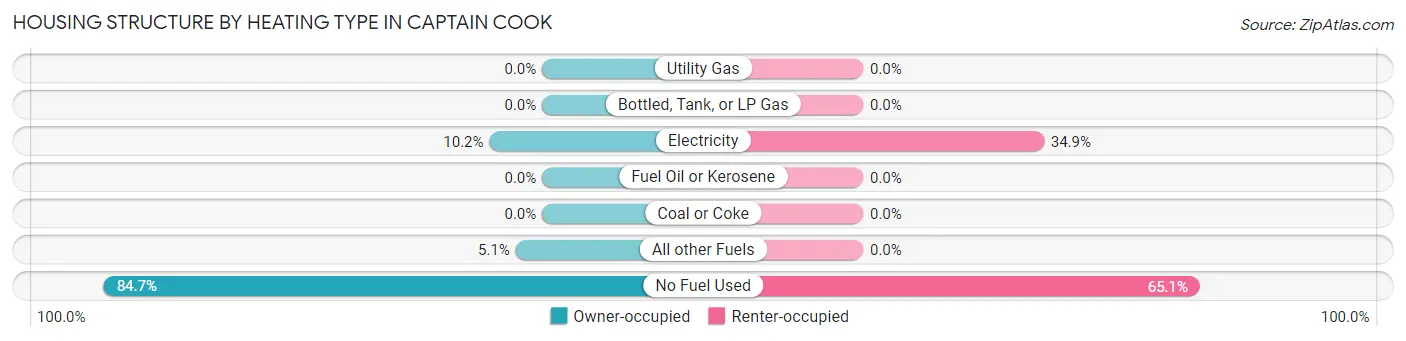
| Heating Type | Owner-occupied | Renter-occupied |
| Utility Gas | 0 (0.0%) | 0 (0.0%) |
| Bottled, Tank, or LP Gas | 0 (0.0%) | 0 (0.0%) |
| Electricity | 48 (10.2%) | 182 (34.9%) |
| Fuel Oil or Kerosene | 0 (0.0%) | 0 (0.0%) |
| Coal or Coke | 0 (0.0%) | 0 (0.0%) |
| All other Fuels | 24 (5.1%) | 0 (0.0%) |
| No Fuel Used | 399 (84.7%) | 339 (65.1%) |
| Total | 471 (100.0%) | 521 (100.0%) |
Household Vehicle Usage in Captain Cook
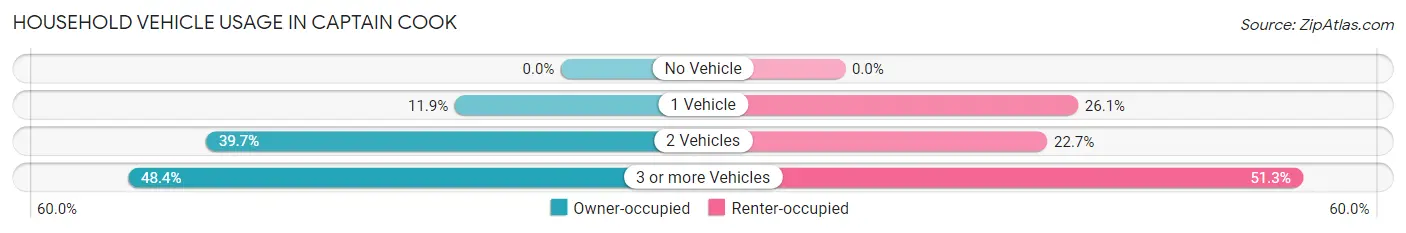
| Vehicles per Household | Owner-occupied | Renter-occupied |
| No Vehicle | 0 (0.0%) | 0 (0.0%) |
| 1 Vehicle | 56 (11.9%) | 136 (26.1%) |
| 2 Vehicles | 187 (39.7%) | 118 (22.7%) |
| 3 or more Vehicles | 228 (48.4%) | 267 (51.2%) |
| Total | 471 (100.0%) | 521 (100.0%) |
Real Estate & Mortgages in Captain Cook
Real Estate and Mortgage Overview in Captain Cook
| Characteristic | Without Mortgage | With Mortgage |
| Housing Units | 274 | 197 |
| Median Property Value | $505,500 | $657,600 |
| Median Household Income | - | - |
| Monthly Housing Costs | $390 | $99 |
| Real Estate Taxes | $871 | $0 |
Property Value by Mortgage Status in Captain Cook
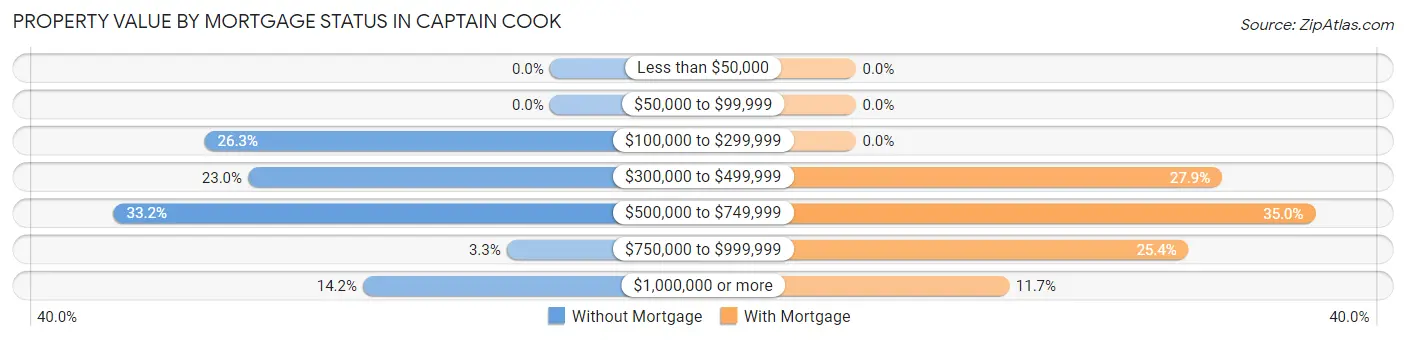
| Property Value | Without Mortgage | With Mortgage |
| Less than $50,000 | 0 (0.0%) | 0 (0.0%) |
| $50,000 to $99,999 | 0 (0.0%) | 0 (0.0%) |
| $100,000 to $299,999 | 72 (26.3%) | 0 (0.0%) |
| $300,000 to $499,999 | 63 (23.0%) | 55 (27.9%) |
| $500,000 to $749,999 | 91 (33.2%) | 69 (35.0%) |
| $750,000 to $999,999 | 9 (3.3%) | 50 (25.4%) |
| $1,000,000 or more | 39 (14.2%) | 23 (11.7%) |
| Total | 274 (100.0%) | 197 (100.0%) |
Household Income by Mortgage Status in Captain Cook
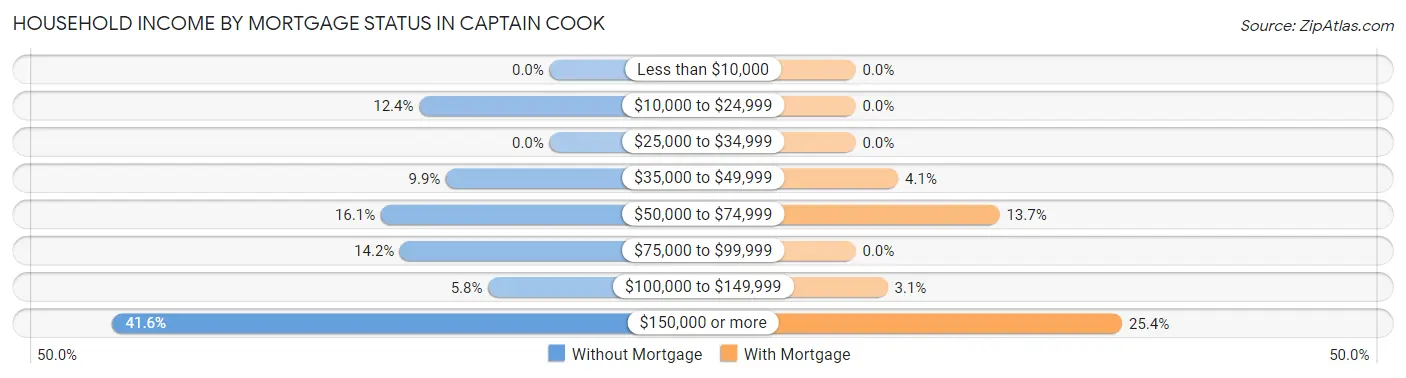
| Household Income | Without Mortgage | With Mortgage |
| Less than $10,000 | 0 (0.0%) | 0 (0.0%) |
| $10,000 to $24,999 | 34 (12.4%) | 0 (0.0%) |
| $25,000 to $34,999 | 0 (0.0%) | 0 (0.0%) |
| $35,000 to $49,999 | 27 (9.9%) | 8 (4.1%) |
| $50,000 to $74,999 | 44 (16.1%) | 27 (13.7%) |
| $75,000 to $99,999 | 39 (14.2%) | 0 (0.0%) |
| $100,000 to $149,999 | 16 (5.8%) | 6 (3.0%) |
| $150,000 or more | 114 (41.6%) | 50 (25.4%) |
| Total | 274 (100.0%) | 197 (100.0%) |
Property Value to Household Income Ratio in Captain Cook
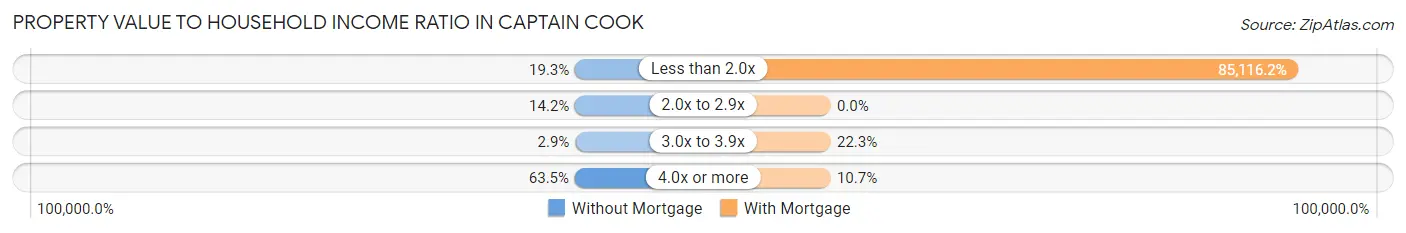
| Value-to-Income Ratio | Without Mortgage | With Mortgage |
| Less than 2.0x | 53 (19.3%) | 167,679 (85,116.2%) |
| 2.0x to 2.9x | 39 (14.2%) | 0 (0.0%) |
| 3.0x to 3.9x | 8 (2.9%) | 44 (22.3%) |
| 4.0x or more | 174 (63.5%) | 21 (10.7%) |
| Total | 274 (100.0%) | 197 (100.0%) |
Real Estate Taxes by Mortgage Status in Captain Cook
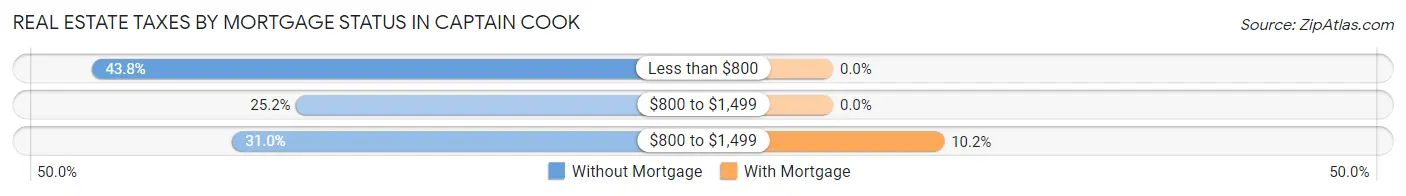
| Property Taxes | Without Mortgage | With Mortgage |
| Less than $800 | 120 (43.8%) | 0 (0.0%) |
| $800 to $1,499 | 69 (25.2%) | 0 (0.0%) |
| $800 to $1,499 | 85 (31.0%) | 20 (10.2%) |
| Total | 274 (100.0%) | 197 (100.0%) |
Health & Disability in Captain Cook
Health Insurance Coverage by Age in Captain Cook
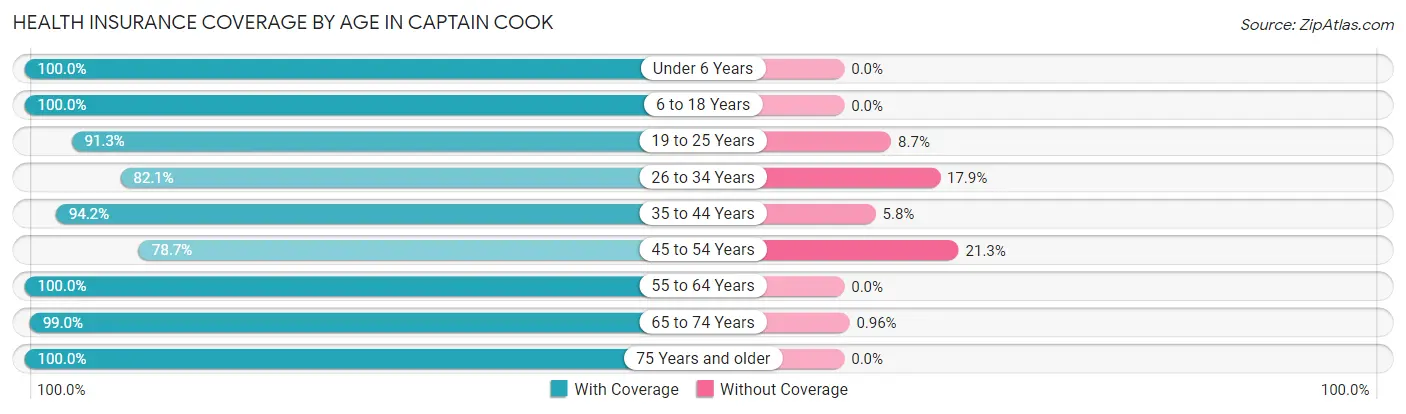
| Age Bracket | With Coverage | Without Coverage |
| Under 6 Years | 327 (100.0%) | 0 (0.0%) |
| 6 to 18 Years | 664 (100.0%) | 0 (0.0%) |
| 19 to 25 Years | 282 (91.3%) | 27 (8.7%) |
| 26 to 34 Years | 437 (82.1%) | 95 (17.9%) |
| 35 to 44 Years | 500 (94.2%) | 31 (5.8%) |
| 45 to 54 Years | 214 (78.7%) | 58 (21.3%) |
| 55 to 64 Years | 502 (100.0%) | 0 (0.0%) |
| 65 to 74 Years | 827 (99.0%) | 8 (1.0%) |
| 75 Years and older | 163 (100.0%) | 0 (0.0%) |
| Total | 3,916 (94.7%) | 219 (5.3%) |
Health Insurance Coverage by Citizenship Status in Captain Cook
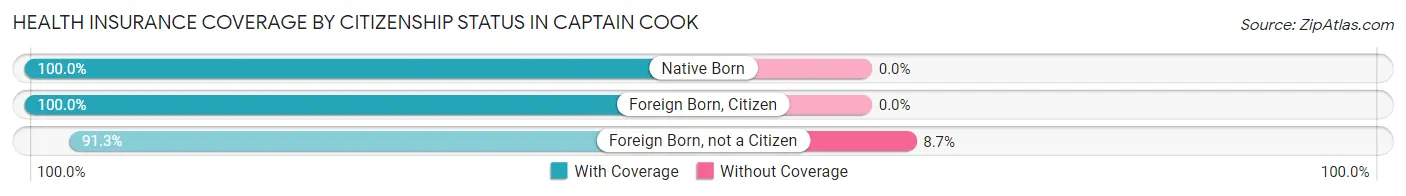
| Citizenship Status | With Coverage | Without Coverage |
| Native Born | 327 (100.0%) | 0 (0.0%) |
| Foreign Born, Citizen | 664 (100.0%) | 0 (0.0%) |
| Foreign Born, not a Citizen | 282 (91.3%) | 27 (8.7%) |
Health Insurance Coverage by Household Income in Captain Cook
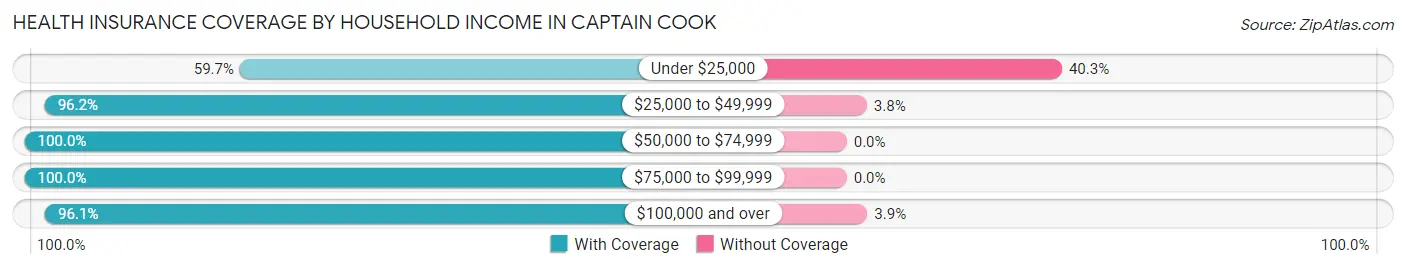
| Household Income | With Coverage | Without Coverage |
| Under $25,000 | 111 (59.7%) | 75 (40.3%) |
| $25,000 to $49,999 | 204 (96.2%) | 8 (3.8%) |
| $50,000 to $74,999 | 124 (100.0%) | 0 (0.0%) |
| $75,000 to $99,999 | 94 (100.0%) | 0 (0.0%) |
| $100,000 and over | 3,383 (96.1%) | 136 (3.9%) |
Public vs Private Health Insurance Coverage by Age in Captain Cook
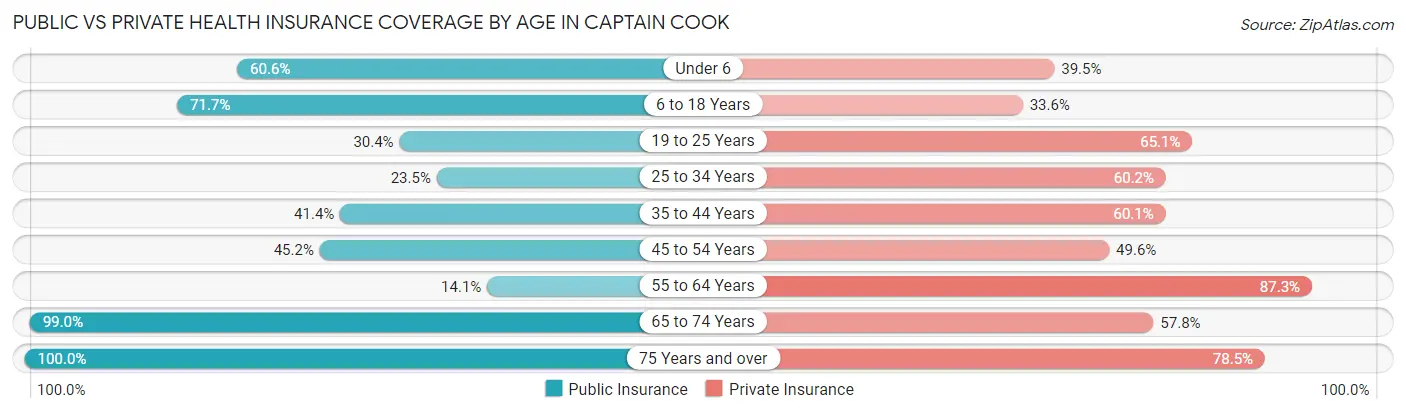
| Age Bracket | Public Insurance | Private Insurance |
| Under 6 | 198 (60.6%) | 129 (39.5%) |
| 6 to 18 Years | 476 (71.7%) | 223 (33.6%) |
| 19 to 25 Years | 94 (30.4%) | 201 (65.0%) |
| 25 to 34 Years | 125 (23.5%) | 320 (60.2%) |
| 35 to 44 Years | 220 (41.4%) | 319 (60.1%) |
| 45 to 54 Years | 123 (45.2%) | 135 (49.6%) |
| 55 to 64 Years | 71 (14.1%) | 438 (87.3%) |
| 65 to 74 Years | 827 (99.0%) | 483 (57.8%) |
| 75 Years and over | 163 (100.0%) | 128 (78.5%) |
| Total | 2,297 (55.5%) | 2,376 (57.5%) |
Disability Status by Sex by Age in Captain Cook
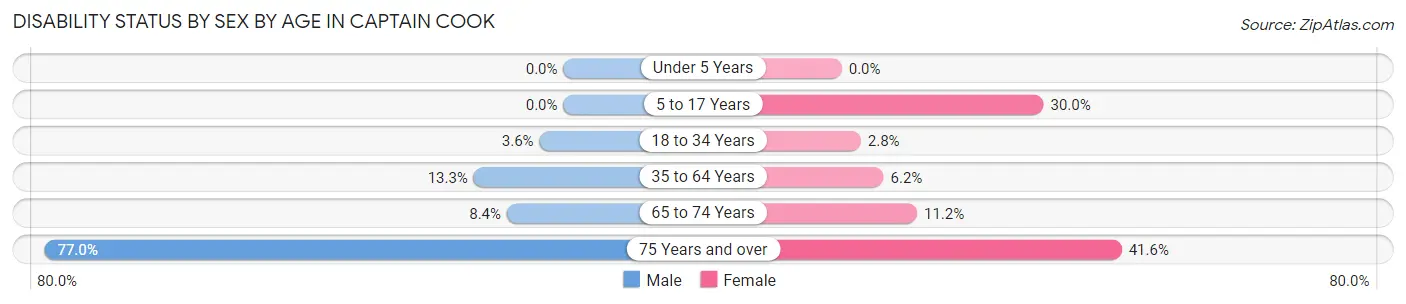
| Age Bracket | Male | Female |
| Under 5 Years | 0 (0.0%) | 0 (0.0%) |
| 5 to 17 Years | 0 (0.0%) | 68 (30.0%) |
| 18 to 34 Years | 21 (3.5%) | 9 (2.8%) |
| 35 to 64 Years | 88 (13.3%) | 40 (6.2%) |
| 65 to 74 Years | 37 (8.4%) | 44 (11.2%) |
| 75 Years and over | 57 (77.0%) | 37 (41.6%) |
Disability Class by Sex by Age in Captain Cook
Disability Class: Hearing Difficulty
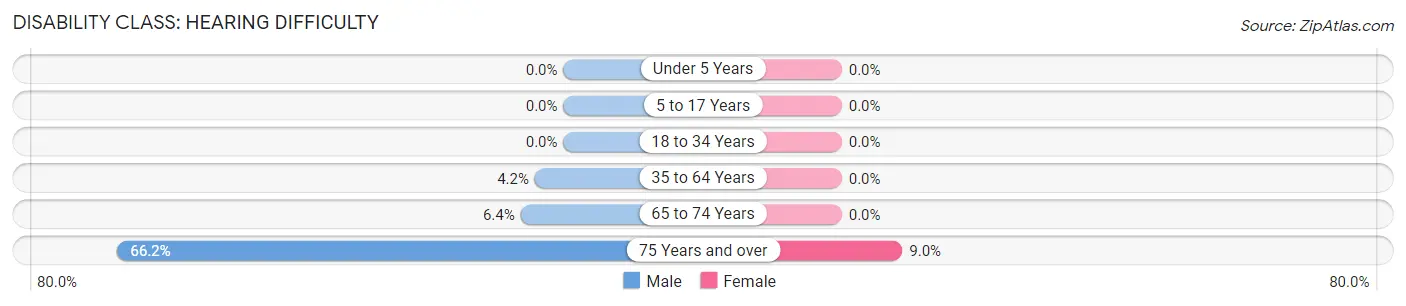
| Age Bracket | Male | Female |
| Under 5 Years | 0 (0.0%) | 0 (0.0%) |
| 5 to 17 Years | 0 (0.0%) | 0 (0.0%) |
| 18 to 34 Years | 0 (0.0%) | 0 (0.0%) |
| 35 to 64 Years | 28 (4.2%) | 0 (0.0%) |
| 65 to 74 Years | 28 (6.4%) | 0 (0.0%) |
| 75 Years and over | 49 (66.2%) | 8 (9.0%) |
Disability Class: Vision Difficulty
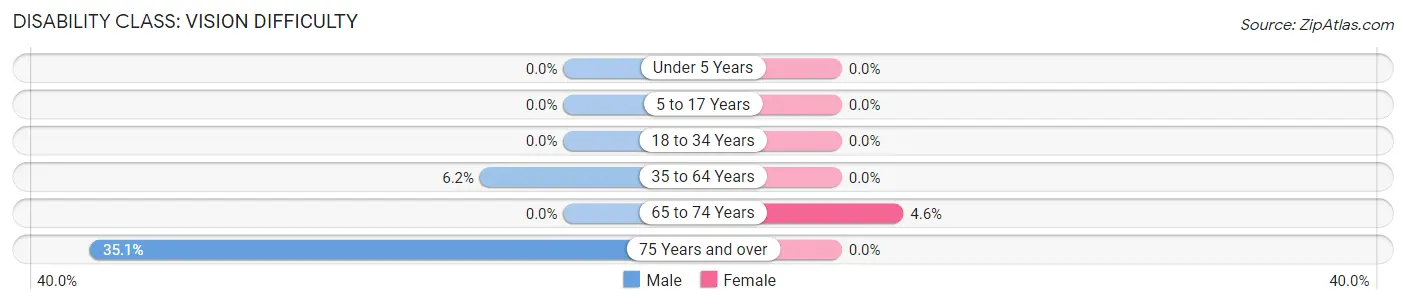
| Age Bracket | Male | Female |
| Under 5 Years | 0 (0.0%) | 0 (0.0%) |
| 5 to 17 Years | 0 (0.0%) | 0 (0.0%) |
| 18 to 34 Years | 0 (0.0%) | 0 (0.0%) |
| 35 to 64 Years | 41 (6.2%) | 0 (0.0%) |
| 65 to 74 Years | 0 (0.0%) | 18 (4.6%) |
| 75 Years and over | 26 (35.1%) | 0 (0.0%) |
Disability Class: Cognitive Difficulty
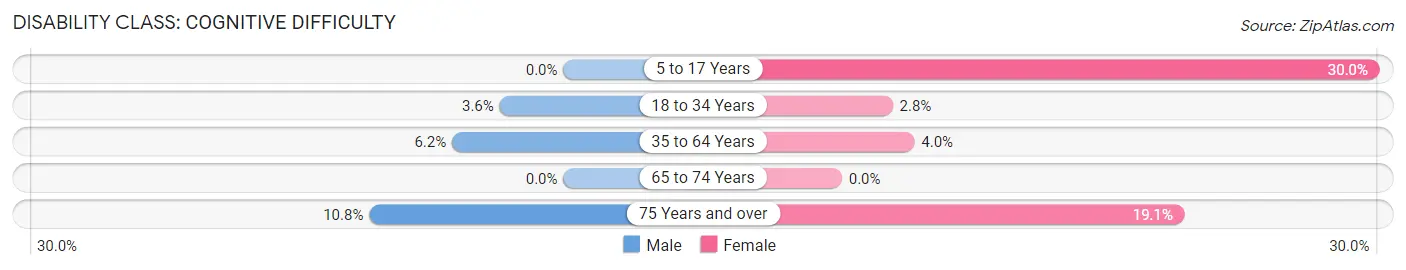
| Age Bracket | Male | Female |
| 5 to 17 Years | 0 (0.0%) | 68 (30.0%) |
| 18 to 34 Years | 21 (3.5%) | 9 (2.8%) |
| 35 to 64 Years | 41 (6.2%) | 26 (4.0%) |
| 65 to 74 Years | 0 (0.0%) | 0 (0.0%) |
| 75 Years and over | 8 (10.8%) | 17 (19.1%) |
Disability Class: Ambulatory Difficulty
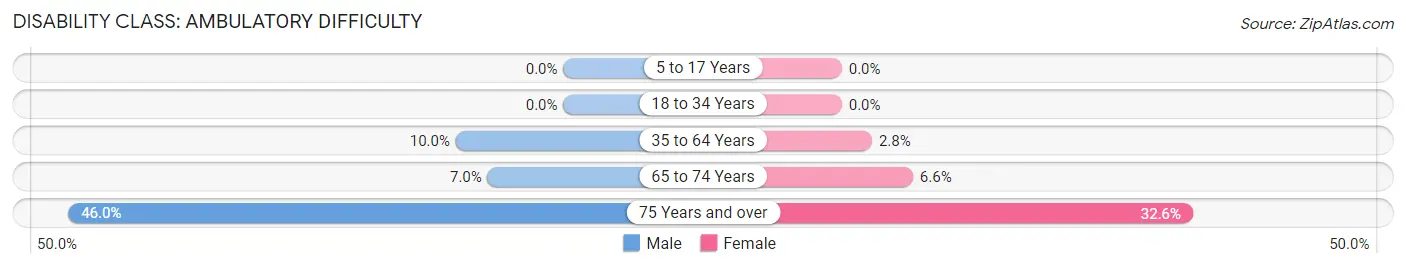
| Age Bracket | Male | Female |
| 5 to 17 Years | 0 (0.0%) | 0 (0.0%) |
| 18 to 34 Years | 0 (0.0%) | 0 (0.0%) |
| 35 to 64 Years | 66 (10.0%) | 18 (2.8%) |
| 65 to 74 Years | 31 (7.0%) | 26 (6.6%) |
| 75 Years and over | 34 (46.0%) | 29 (32.6%) |
Disability Class: Self-Care Difficulty
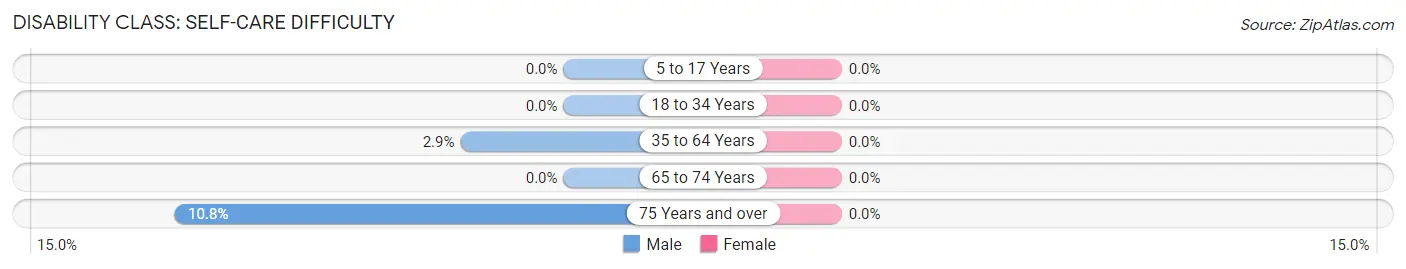
| Age Bracket | Male | Female |
| 5 to 17 Years | 0 (0.0%) | 0 (0.0%) |
| 18 to 34 Years | 0 (0.0%) | 0 (0.0%) |
| 35 to 64 Years | 19 (2.9%) | 0 (0.0%) |
| 65 to 74 Years | 0 (0.0%) | 0 (0.0%) |
| 75 Years and over | 8 (10.8%) | 0 (0.0%) |
Technology Access in Captain Cook
Computing Device Access in Captain Cook
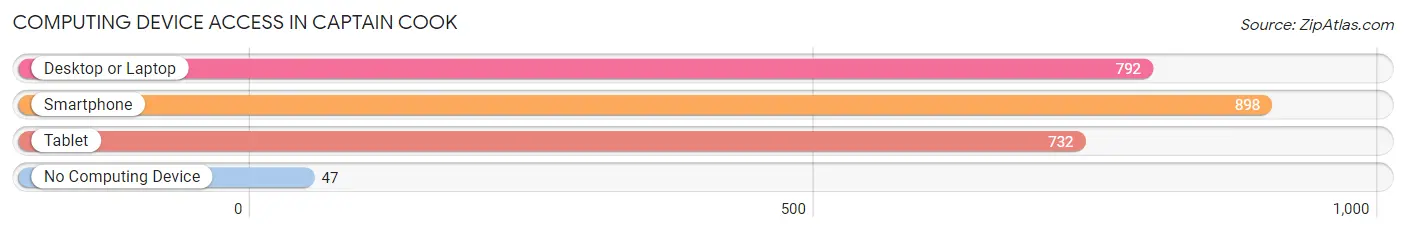
| Device Type | # Households | % Households |
| Desktop or Laptop | 792 | 79.8% |
| Smartphone | 898 | 90.5% |
| Tablet | 732 | 73.8% |
| No Computing Device | 47 | 4.7% |
| Total | 992 | 100.0% |
Internet Access in Captain Cook
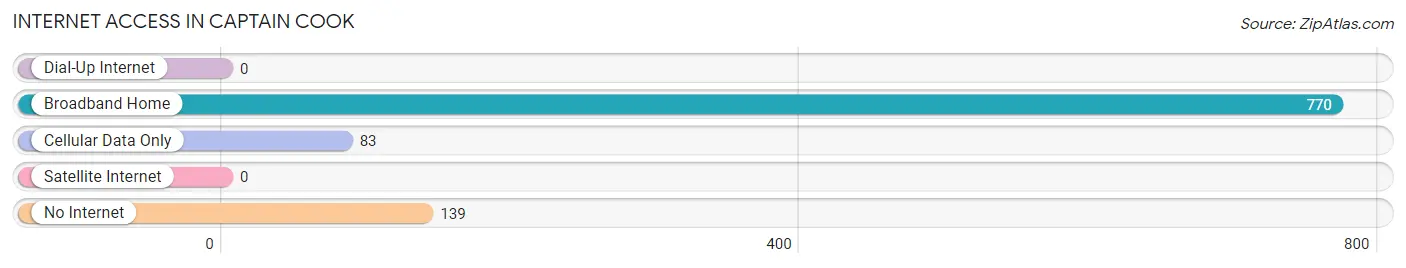
| Internet Type | # Households | % Households |
| Dial-Up Internet | 0 | 0.0% |
| Broadband Home | 770 | 77.6% |
| Cellular Data Only | 83 | 8.4% |
| Satellite Internet | 0 | 0.0% |
| No Internet | 139 | 14.0% |
| Total | 992 | 100.0% |
Captain Cook Summary
Cook Islands is a self-governing island nation in the South Pacific Ocean, located in the Polynesian region of Oceania. It is made up of 15 islands, with the largest being Rarotonga. The Cook Islands are named after the British explorer, Captain James Cook, who visited the islands in 1773. The Cook Islands are a parliamentary democracy, with a population of approximately 17,000 people.
History
The Cook Islands were first settled by Polynesian people around 1000 AD. The islands were first sighted by Europeans in 1595, when the Spanish explorer Alvaro de Mendaña de Neira sighted Pukapuka. The islands were later visited by the British explorer Captain James Cook in 1773, who named them the Hervey Islands. The islands were annexed by the United Kingdom in 1888, and became part of the British protectorate of the Gilbert and Ellice Islands in 1916. In 1965, the Cook Islands became a self-governing state in free association with New Zealand.
Geography
The Cook Islands are located in the South Pacific Ocean, approximately halfway between New Zealand and Hawaii. The islands are spread over an area of 2,200 square kilometers, and are made up of 15 islands, with the largest being Rarotonga. The islands are volcanic in origin, and are surrounded by coral reefs. The climate is tropical, with temperatures ranging from 21 to 32 degrees Celsius.
Economy
The economy of the Cook Islands is largely based on tourism, with the majority of visitors coming from New Zealand and Australia. Other industries include fishing, agriculture, and manufacturing. The currency of the Cook Islands is the New Zealand dollar. The government of the Cook Islands is the main source of employment, with the public sector accounting for around 40% of the total workforce.
Demographics
The population of the Cook Islands is approximately 17,000 people, with the majority of the population living on the main island of Rarotonga. The population is predominantly Polynesian, with a small minority of Europeans and Asians. The official language of the Cook Islands is English, although the native language is Cook Islands Maori. The majority of the population is Christian, with the largest denomination being the Cook Islands Christian Church.
Common Questions
What is Per Capita Income in Captain Cook?
Per Capita income in Captain Cook is $39,062.
What is the Median Family Income in Captain Cook?
Median Family Income in Captain Cook is $118,585.
What is the Median Household income in Captain Cook?
Median Household Income in Captain Cook is $120,323.
What is Income or Wage Gap in Captain Cook?
Income or Wage Gap in Captain Cook is 1.7%.
Women in Captain Cook earn 98.3 cents for every dollar earned by a man.
What is Inequality or Gini Index in Captain Cook?
Inequality or Gini Index in Captain Cook is 0.45.
What is the Total Population of Captain Cook?
Total Population of Captain Cook is 4,135.
What is the Total Male Population of Captain Cook?
Total Male Population of Captain Cook is 2,385.
What is the Total Female Population of Captain Cook?
Total Female Population of Captain Cook is 1,750.
What is the Ratio of Males per 100 Females in Captain Cook?
There are 136.29 Males per 100 Females in Captain Cook.
What is the Ratio of Females per 100 Males in Captain Cook?
There are 73.38 Females per 100 Males in Captain Cook.
What is the Median Population Age in Captain Cook?
Median Population Age in Captain Cook is 40.0 Years.
What is the Average Family Size in Captain Cook
Average Family Size in Captain Cook is 3.8 People.
What is the Average Household Size in Captain Cook
Average Household Size in Captain Cook is 4.2 People.
How Large is the Labor Force in Captain Cook?
There are 1,981 People in the Labor Forcein in Captain Cook.
What is the Percentage of People in the Labor Force in Captain Cook?
59.9% of People are in the Labor Force in Captain Cook.
What is the Unemployment Rate in Captain Cook?
Unemployment Rate in Captain Cook is 6.5%.