Waynesville, MO Map & Demographics
Waynesville Map
Waynesville Overview
$32,890
PER CAPITA INCOME
$103,164
AVG FAMILY INCOME
$47,193
AVG HOUSEHOLD INCOME
20.1%
WAGE / INCOME GAP [ % ]
79.9¢/ $1
WAGE / INCOME GAP [ $ ]
0.41
INEQUALITY / GINI INDEX
5,372
TOTAL POPULATION
2,665
MALE POPULATION
2,707
FEMALE POPULATION
98.45
MALES / 100 FEMALES
101.58
FEMALES / 100 MALES
34.3
MEDIAN AGE
2.6
AVG FAMILY SIZE
2.2
AVG HOUSEHOLD SIZE
2,868
LABOR FORCE [ PEOPLE ]
65.5%
PERCENT IN LABOR FORCE
5.2%
UNEMPLOYMENT RATE
Waynesville Zip Codes
Waynesville Area Codes
Income in Waynesville
Income Overview in Waynesville
Per Capita Income in Waynesville is $32,890, while median incomes of families and households are $103,164 and $47,193 respectively.
| Characteristic | Number | Measure |
| Per Capita Income | 5,372 | $32,890 |
| Median Family Income | 1,314 | $103,164 |
| Mean Family Income | 1,314 | $91,893 |
| Median Household Income | 2,359 | $47,193 |
| Mean Household Income | 2,359 | $69,717 |
| Income Deficit | 1,314 | $0 |
| Wage / Income Gap (%) | 5,372 | 20.15% |
| Wage / Income Gap ($) | 5,372 | 79.85¢ per $1 |
| Gini / Inequality Index | 5,372 | 0.41 |
Earnings by Sex in Waynesville
Average Earnings in Waynesville are $37,136, $42,744 for men and $34,133 for women, a difference of 20.2%.
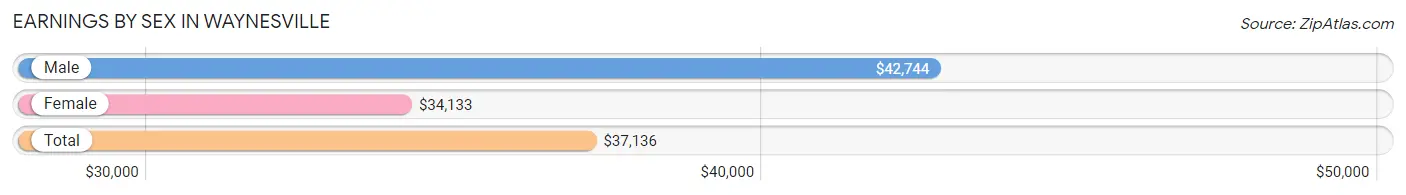
| Sex | Number | Average Earnings |
| Male | 1,648 (54.8%) | $42,744 |
| Female | 1,358 (45.2%) | $34,133 |
| Total | 3,006 (100.0%) | $37,136 |
Earnings by Sex by Income Bracket in Waynesville
The most common earnings brackets in Waynesville are $75,000 to $99,999 for men (295 | 17.9%) and $25,000 to $29,999 for women (184 | 13.6%).
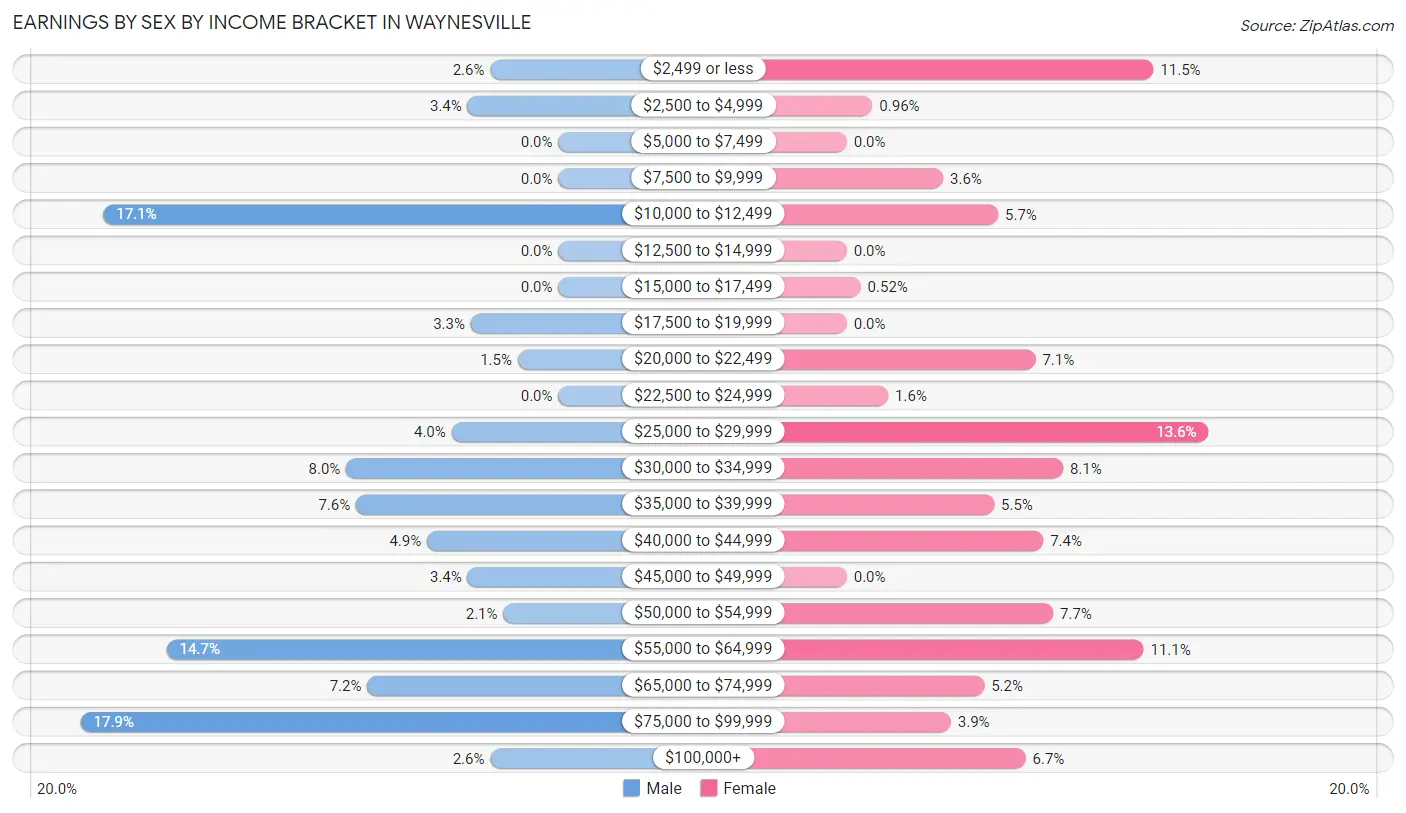
| Income | Male | Female |
| $2,499 or less | 42 (2.5%) | 156 (11.5%) |
| $2,500 to $4,999 | 56 (3.4%) | 13 (1.0%) |
| $5,000 to $7,499 | 0 (0.0%) | 0 (0.0%) |
| $7,500 to $9,999 | 0 (0.0%) | 49 (3.6%) |
| $10,000 to $12,499 | 281 (17.1%) | 77 (5.7%) |
| $12,500 to $14,999 | 0 (0.0%) | 0 (0.0%) |
| $15,000 to $17,499 | 0 (0.0%) | 7 (0.5%) |
| $17,500 to $19,999 | 54 (3.3%) | 0 (0.0%) |
| $20,000 to $22,499 | 25 (1.5%) | 96 (7.1%) |
| $22,500 to $24,999 | 0 (0.0%) | 21 (1.5%) |
| $25,000 to $29,999 | 66 (4.0%) | 184 (13.6%) |
| $30,000 to $34,999 | 131 (8.0%) | 110 (8.1%) |
| $35,000 to $39,999 | 125 (7.6%) | 75 (5.5%) |
| $40,000 to $44,999 | 81 (4.9%) | 100 (7.4%) |
| $45,000 to $49,999 | 56 (3.4%) | 0 (0.0%) |
| $50,000 to $54,999 | 34 (2.1%) | 105 (7.7%) |
| $55,000 to $64,999 | 242 (14.7%) | 151 (11.1%) |
| $65,000 to $74,999 | 118 (7.2%) | 70 (5.1%) |
| $75,000 to $99,999 | 295 (17.9%) | 53 (3.9%) |
| $100,000+ | 42 (2.5%) | 91 (6.7%) |
| Total | 1,648 (100.0%) | 1,358 (100.0%) |
Earnings by Sex by Educational Attainment in Waynesville
Average earnings in Waynesville are $45,781 for men and $34,579 for women, a difference of 24.5%. Men with an educational attainment of graduate degree enjoy the highest average annual earnings of $88,391, while those with high school diploma education earn the least with $11,477. Women with an educational attainment of college or associate's degree earn the most with the average annual earnings of $30,000, while those with college or associate's degree education have the smallest earnings of $30,000.
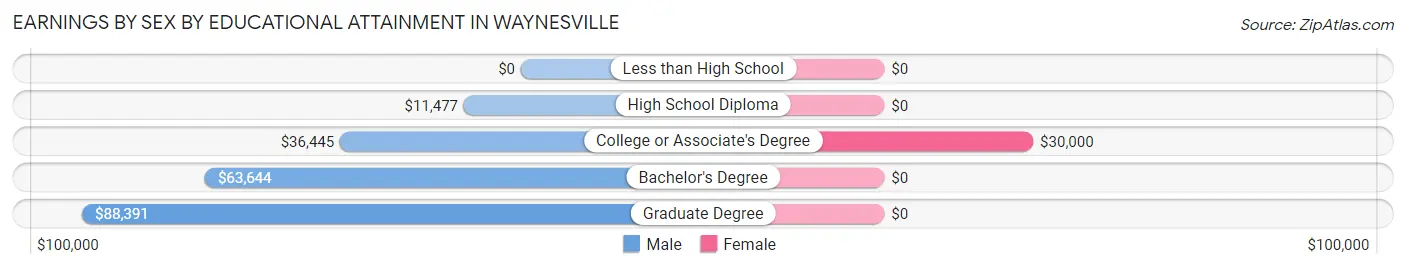
| Educational Attainment | Male Income | Female Income |
| Less than High School | - | - |
| High School Diploma | $11,477 | $0 |
| College or Associate's Degree | $36,445 | $30,000 |
| Bachelor's Degree | $63,644 | $0 |
| Graduate Degree | $88,391 | $0 |
| Total | $45,781 | $34,579 |
Family Income in Waynesville
Family Income Brackets in Waynesville
According to the Waynesville family income data, there are 474 families falling into the $100,000 to $149,999 income range, which is the most common income bracket and makes up 36.1% of all families.
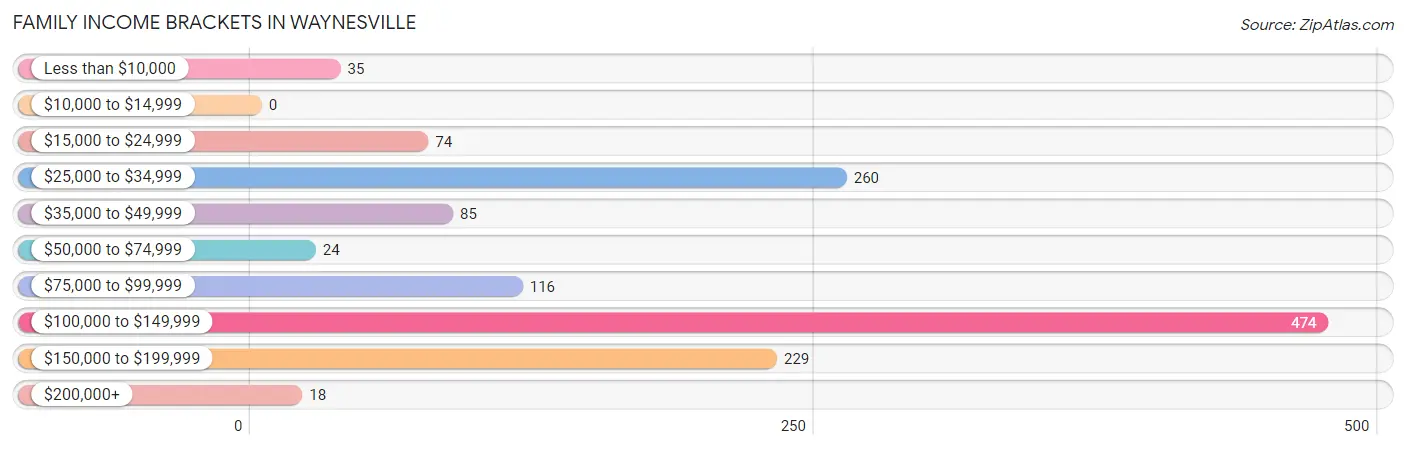
| Income Bracket | # Families | % Families |
| Less than $10,000 | 35 | 2.7% |
| $10,000 to $14,999 | 0 | 0.0% |
| $15,000 to $24,999 | 74 | 5.6% |
| $25,000 to $34,999 | 260 | 19.8% |
| $35,000 to $49,999 | 85 | 6.5% |
| $50,000 to $74,999 | 24 | 1.8% |
| $75,000 to $99,999 | 116 | 8.8% |
| $100,000 to $149,999 | 474 | 36.1% |
| $150,000 to $199,999 | 229 | 17.4% |
| $200,000+ | 18 | 1.4% |
Family Income by Famaliy Size in Waynesville
4-person families (167 | 12.7%) account for the highest median family income in Waynesville with $118,777 per family, while 2-person families (765 | 58.2%) have the highest median income of $51,326 per family member.
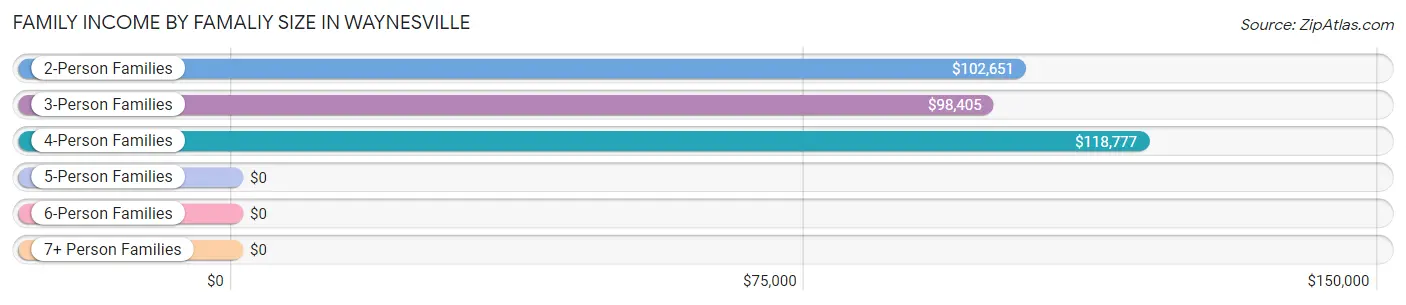
| Income Bracket | # Families | Median Income |
| 2-Person Families | 765 (58.2%) | $102,651 |
| 3-Person Families | 274 (20.8%) | $98,405 |
| 4-Person Families | 167 (12.7%) | $118,777 |
| 5-Person Families | 108 (8.2%) | $0 |
| 6-Person Families | 0 (0.0%) | $0 |
| 7+ Person Families | 0 (0.0%) | $0 |
| Total | 1,314 (100.0%) | $103,164 |
Family Income by Number of Earners in Waynesville
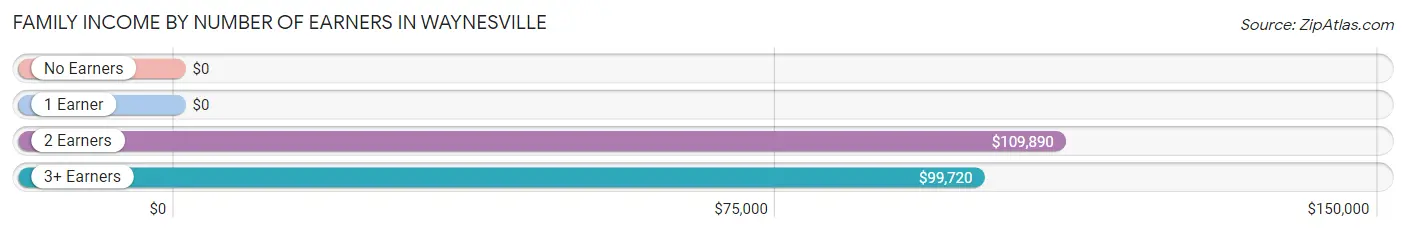
| Number of Earners | # Families | Median Income |
| No Earners | 263 (20.0%) | $0 |
| 1 Earner | 471 (35.8%) | $0 |
| 2 Earners | 477 (36.3%) | $109,890 |
| 3+ Earners | 103 (7.8%) | $99,720 |
| Total | 1,314 (100.0%) | $103,164 |
Household Income in Waynesville
Household Income Brackets in Waynesville
With 538 households falling in the category, the $100,000 to $149,999 income range is the most frequent in Waynesville, accounting for 22.8% of all households. In contrast, only 19 households (0.8%) fall into the $200,000+ income bracket, making it the least populous group.
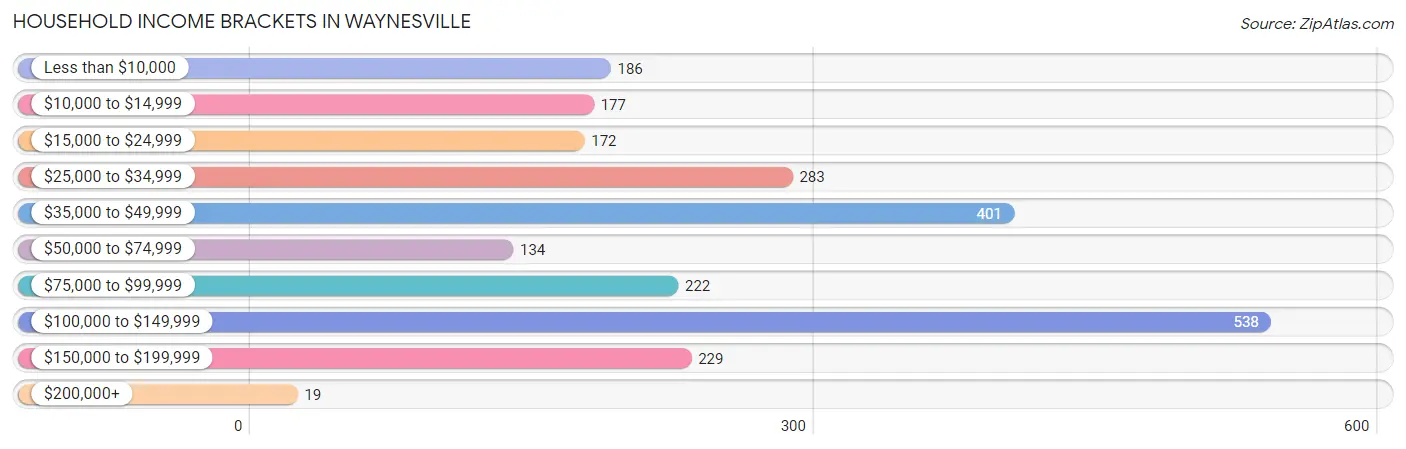
| Income Bracket | # Households | % Households |
| Less than $10,000 | 186 | 7.9% |
| $10,000 to $14,999 | 177 | 7.5% |
| $15,000 to $24,999 | 172 | 7.3% |
| $25,000 to $34,999 | 283 | 12.0% |
| $35,000 to $49,999 | 401 | 17.0% |
| $50,000 to $74,999 | 134 | 5.7% |
| $75,000 to $99,999 | 222 | 9.4% |
| $100,000 to $149,999 | 538 | 22.8% |
| $150,000 to $199,999 | 229 | 9.7% |
| $200,000+ | 19 | 0.8% |
Household Income by Householder Age in Waynesville
The median household income in Waynesville is $47,193, with the highest median household income of $99,483 found in the 45 to 64 years age bracket for the primary householder. A total of 562 households (23.8%) fall into this category. Meanwhile, the 15 to 24 years age bracket for the primary householder has the lowest median household income of $0, with 160 households (6.8%) in this group.
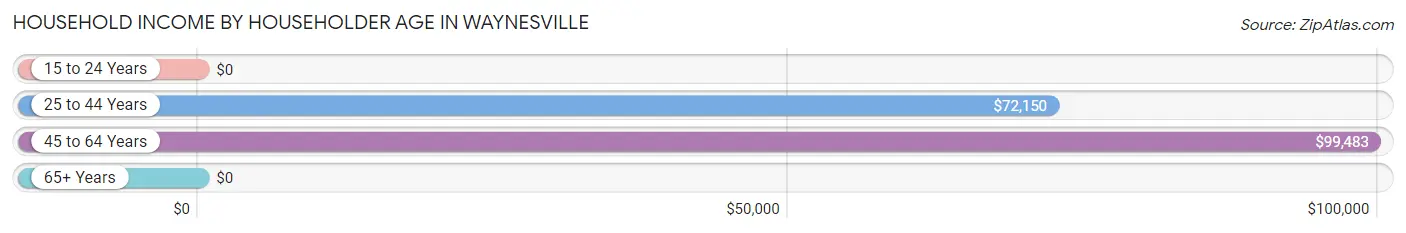
| Income Bracket | # Households | Median Income |
| 15 to 24 Years | 160 (6.8%) | $0 |
| 25 to 44 Years | 939 (39.8%) | $72,150 |
| 45 to 64 Years | 562 (23.8%) | $99,483 |
| 65+ Years | 698 (29.6%) | $0 |
| Total | 2,359 (100.0%) | $47,193 |
Poverty in Waynesville
Income Below Poverty by Sex and Age in Waynesville
With 23.1% poverty level for males and 13.9% for females among the residents of Waynesville, 12 to 14 year old males and under 5 year old females are the most vulnerable to poverty, with 52 males (100.0%) and 59 females (51.3%) in their respective age groups living below the poverty level.
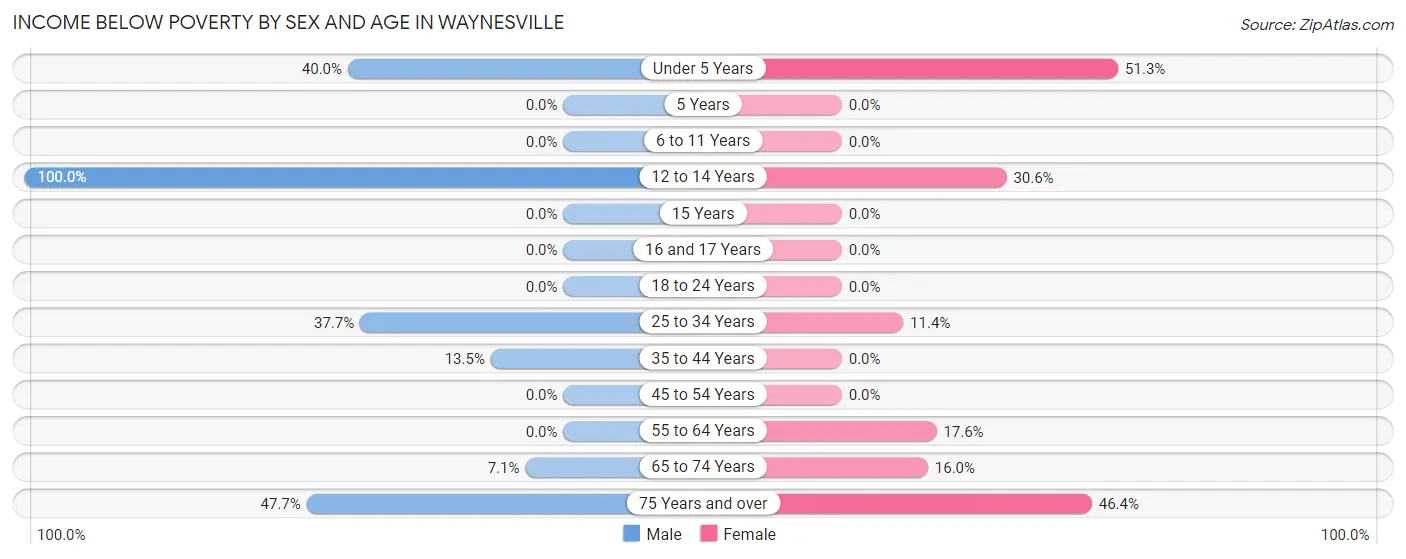
| Age Bracket | Male | Female |
| Under 5 Years | 56 (40.0%) | 59 (51.3%) |
| 5 Years | 0 (0.0%) | 0 (0.0%) |
| 6 to 11 Years | 0 (0.0%) | 0 (0.0%) |
| 12 to 14 Years | 52 (100.0%) | 33 (30.6%) |
| 15 Years | 0 (0.0%) | 0 (0.0%) |
| 16 and 17 Years | 0 (0.0%) | 0 (0.0%) |
| 18 to 24 Years | 0 (0.0%) | 0 (0.0%) |
| 25 to 34 Years | 335 (37.7%) | 50 (11.4%) |
| 35 to 44 Years | 36 (13.5%) | 0 (0.0%) |
| 45 to 54 Years | 0 (0.0%) | 0 (0.0%) |
| 55 to 64 Years | 0 (0.0%) | 26 (17.6%) |
| 65 to 74 Years | 18 (7.1%) | 27 (16.0%) |
| 75 Years and over | 102 (47.7%) | 155 (46.4%) |
| Total | 599 (23.1%) | 350 (13.9%) |
Income Above Poverty by Sex and Age in Waynesville
According to the poverty statistics in Waynesville, males aged 6 to 11 years and females aged 6 to 11 years are the age groups that are most secure financially, with 100.0% of males and 100.0% of females in these age groups living above the poverty line.
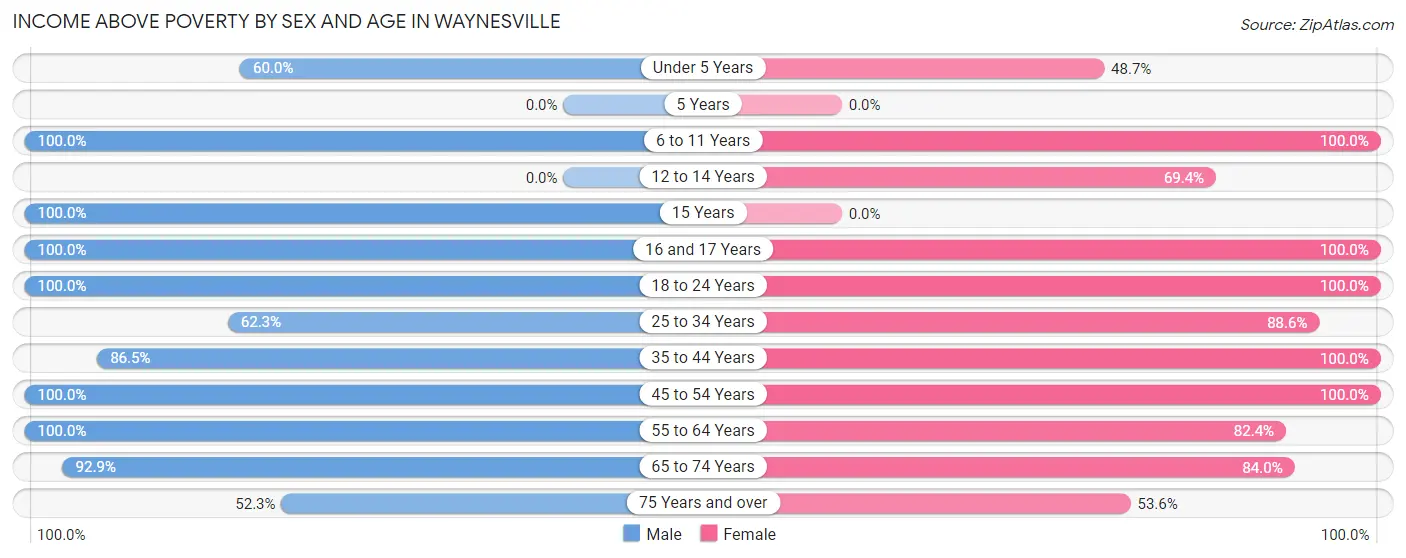
| Age Bracket | Male | Female |
| Under 5 Years | 84 (60.0%) | 56 (48.7%) |
| 5 Years | 0 (0.0%) | 0 (0.0%) |
| 6 to 11 Years | 43 (100.0%) | 340 (100.0%) |
| 12 to 14 Years | 0 (0.0%) | 75 (69.4%) |
| 15 Years | 76 (100.0%) | 0 (0.0%) |
| 16 and 17 Years | 32 (100.0%) | 96 (100.0%) |
| 18 to 24 Years | 117 (100.0%) | 168 (100.0%) |
| 25 to 34 Years | 553 (62.3%) | 389 (88.6%) |
| 35 to 44 Years | 231 (86.5%) | 308 (100.0%) |
| 45 to 54 Years | 278 (100.0%) | 300 (100.0%) |
| 55 to 64 Years | 231 (100.0%) | 122 (82.4%) |
| 65 to 74 Years | 237 (92.9%) | 142 (84.0%) |
| 75 Years and over | 112 (52.3%) | 179 (53.6%) |
| Total | 1,994 (76.9%) | 2,175 (86.1%) |
Income Below Poverty Among Married-Couple Families in Waynesville
The poverty statistics for married-couple families in Waynesville show that 5.2% or 50 of the total 967 families live below the poverty line. Families with 3 or 4 children have the highest poverty rate of 100.0%, comprising of 50 families. On the other hand, families with no children have the lowest poverty rate of 0.0%, which includes 0 families.
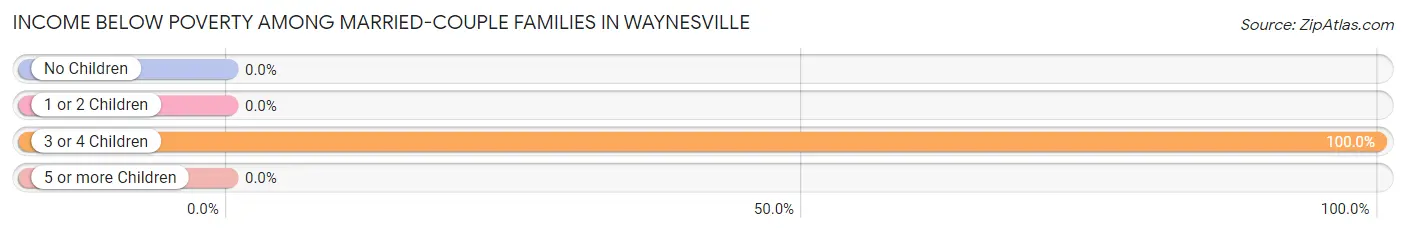
| Children | Above Poverty | Below Poverty |
| No Children | 564 (100.0%) | 0 (0.0%) |
| 1 or 2 Children | 353 (100.0%) | 0 (0.0%) |
| 3 or 4 Children | 0 (0.0%) | 50 (100.0%) |
| 5 or more Children | 0 (0.0%) | 0 (0.0%) |
| Total | 917 (94.8%) | 50 (5.2%) |
Income Below Poverty Among Single-Parent Households in Waynesville
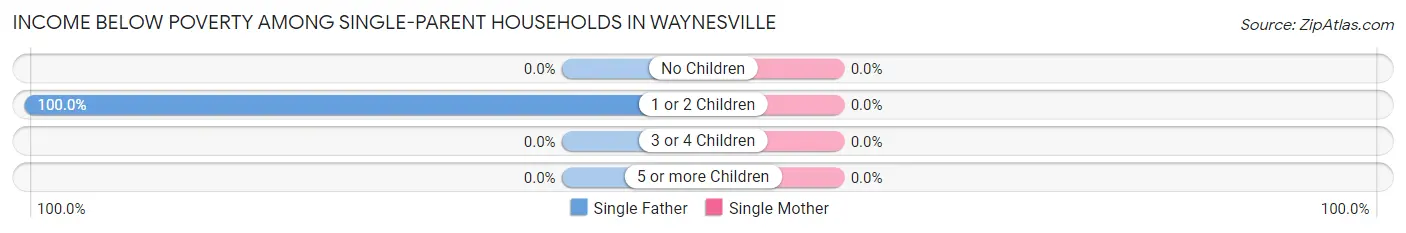
| Children | Single Father | Single Mother |
| No Children | 0 (0.0%) | 0 (0.0%) |
| 1 or 2 Children | 36 (100.0%) | 0 (0.0%) |
| 3 or 4 Children | 0 (0.0%) | 0 (0.0%) |
| 5 or more Children | 0 (0.0%) | 0 (0.0%) |
| Total | 36 (100.0%) | 0 (0.0%) |
Income Below Poverty Among Married-Couple vs Single-Parent Households in Waynesville
The poverty data for Waynesville shows that 50 of the married-couple family households (5.2%) and 36 of the single-parent households (10.4%) are living below the poverty level. Within the married-couple family households, those with 3 or 4 children have the highest poverty rate, with 50 households (100.0%) falling below the poverty line. Among the single-parent households, those with 1 or 2 children have the highest poverty rate, with 36 household (18.6%) living below poverty.
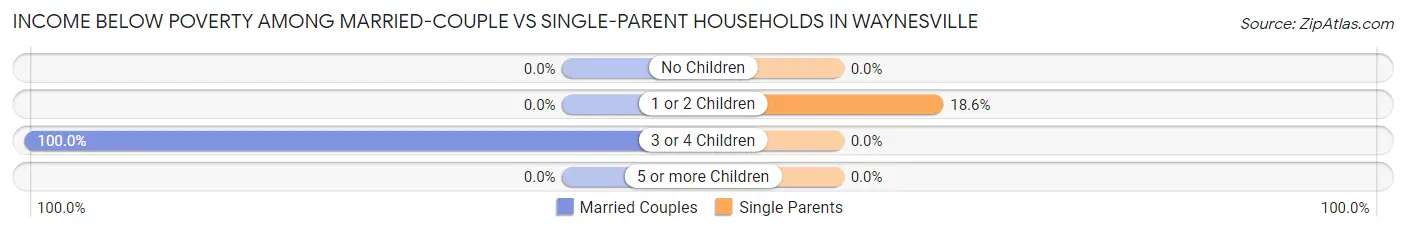
| Children | Married-Couple Families | Single-Parent Households |
| No Children | 0 (0.0%) | 0 (0.0%) |
| 1 or 2 Children | 0 (0.0%) | 36 (18.6%) |
| 3 or 4 Children | 50 (100.0%) | 0 (0.0%) |
| 5 or more Children | 0 (0.0%) | 0 (0.0%) |
| Total | 50 (5.2%) | 36 (10.4%) |
Race in Waynesville
The most populous races in Waynesville are White / Caucasian (4,439 | 82.6%), Two or more Races (406 | 7.6%), and Hispanic or Latino (329 | 6.1%).
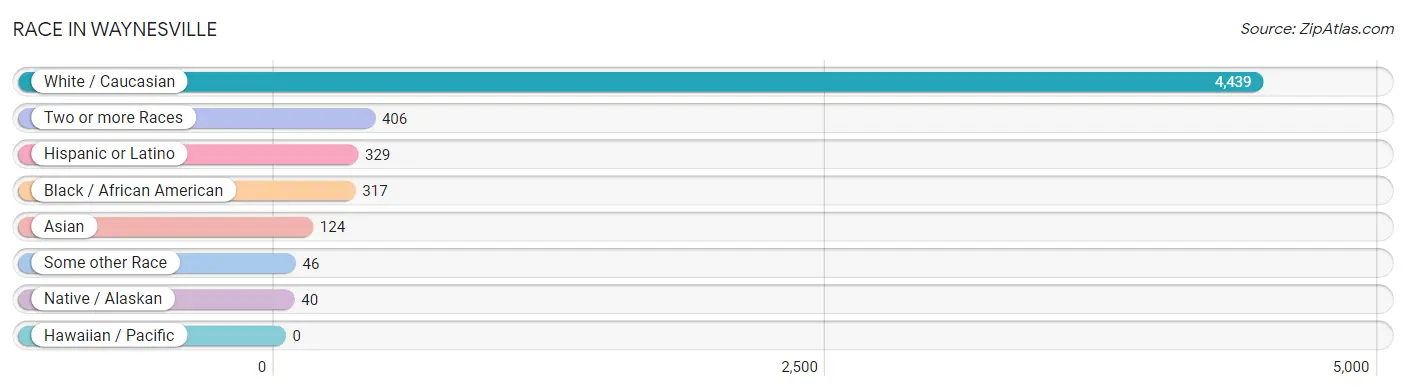
| Race | # Population | % Population |
| Asian | 124 | 2.3% |
| Black / African American | 317 | 5.9% |
| Hawaiian / Pacific | 0 | 0.0% |
| Hispanic or Latino | 329 | 6.1% |
| Native / Alaskan | 40 | 0.7% |
| White / Caucasian | 4,439 | 82.6% |
| Two or more Races | 406 | 7.6% |
| Some other Race | 46 | 0.9% |
| Total | 5,372 | 100.0% |
Ancestry in Waynesville
The most populous ancestries reported in Waynesville are German (1,467 | 27.3%), Irish (778 | 14.5%), Italian (652 | 12.1%), English (509 | 9.5%), and Dutch (404 | 7.5%), together accounting for 70.9% of all Waynesville residents.
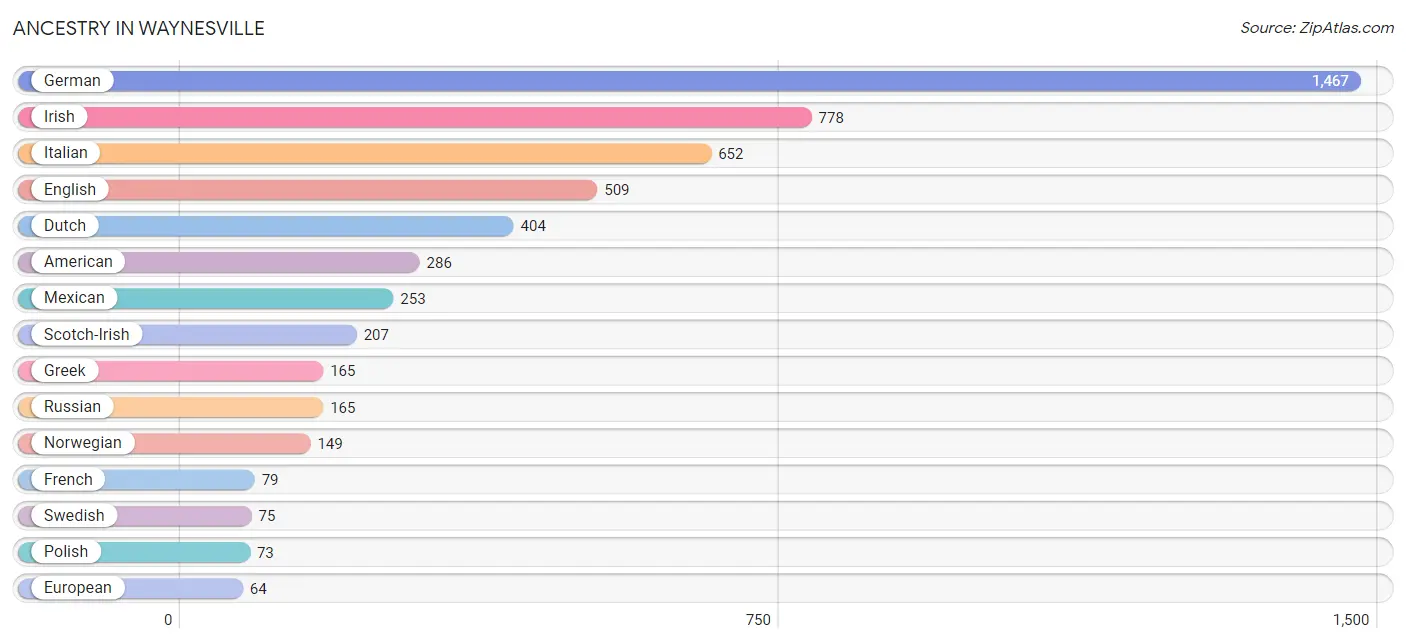
| Ancestry | # Population | % Population |
| American | 286 | 5.3% |
| Bhutanese | 53 | 1.0% |
| Burmese | 41 | 0.8% |
| Canadian | 58 | 1.1% |
| Cherokee | 10 | 0.2% |
| Chinese | 30 | 0.6% |
| Choctaw | 39 | 0.7% |
| Czech | 44 | 0.8% |
| Dutch | 404 | 7.5% |
| English | 509 | 9.5% |
| European | 64 | 1.2% |
| French | 79 | 1.5% |
| German | 1,467 | 27.3% |
| Greek | 165 | 3.1% |
| Irish | 778 | 14.5% |
| Italian | 652 | 12.1% |
| Mexican | 253 | 4.7% |
| Norwegian | 149 | 2.8% |
| Polish | 73 | 1.4% |
| Puerto Rican | 22 | 0.4% |
| Romanian | 5 | 0.1% |
| Russian | 165 | 3.1% |
| Scandinavian | 43 | 0.8% |
| Scotch-Irish | 207 | 3.8% |
| Scottish | 41 | 0.8% |
| Spaniard | 54 | 1.0% |
| Sri Lankan | 53 | 1.0% |
| Swedish | 75 | 1.4% |
| Swiss | 16 | 0.3% |
| Trinidadian and Tobagonian | 57 | 1.1% | View All 30 Rows |
Immigrants in Waynesville
The most numerous immigrant groups reported in Waynesville came from Europe (78 | 1.5%), Germany (78 | 1.5%), Western Europe (78 | 1.5%), Asia (71 | 1.3%), and Eastern Asia (71 | 1.3%), together accounting for 7.0% of all Waynesville residents.
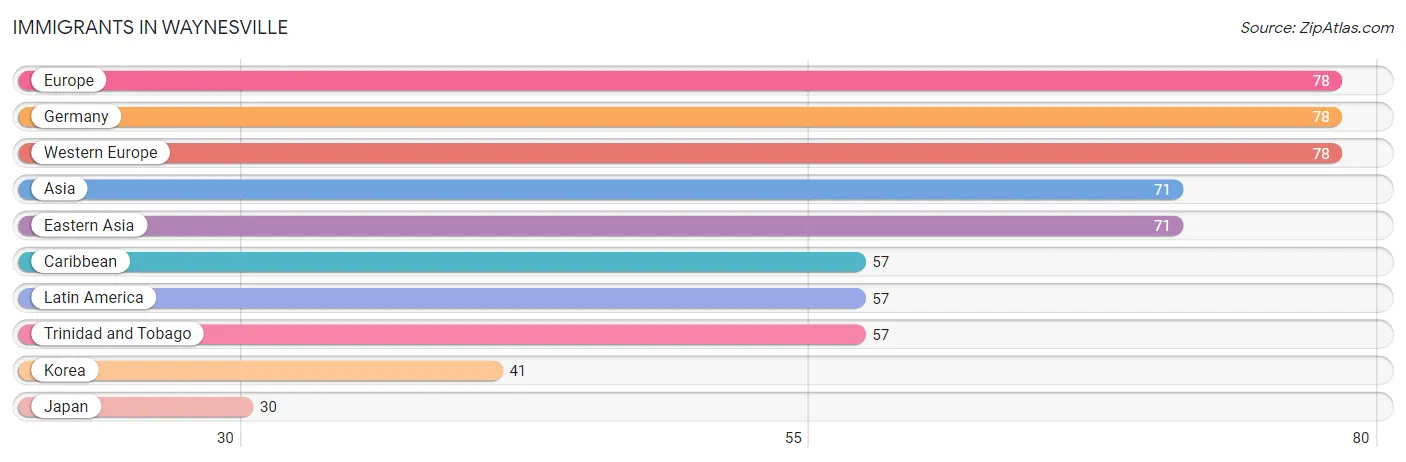
| Immigration Origin | # Population | % Population |
| Asia | 71 | 1.3% |
| Caribbean | 57 | 1.1% |
| Eastern Asia | 71 | 1.3% |
| Europe | 78 | 1.5% |
| Germany | 78 | 1.5% |
| Japan | 30 | 0.6% |
| Korea | 41 | 0.8% |
| Latin America | 57 | 1.1% |
| Trinidad and Tobago | 57 | 1.1% |
| Western Europe | 78 | 1.5% | View All 10 Rows |
Sex and Age in Waynesville
Sex and Age in Waynesville
The most populous age groups in Waynesville are 25 to 29 Years (718 | 26.9%) for men and 10 to 14 Years (451 | 16.7%) for women.
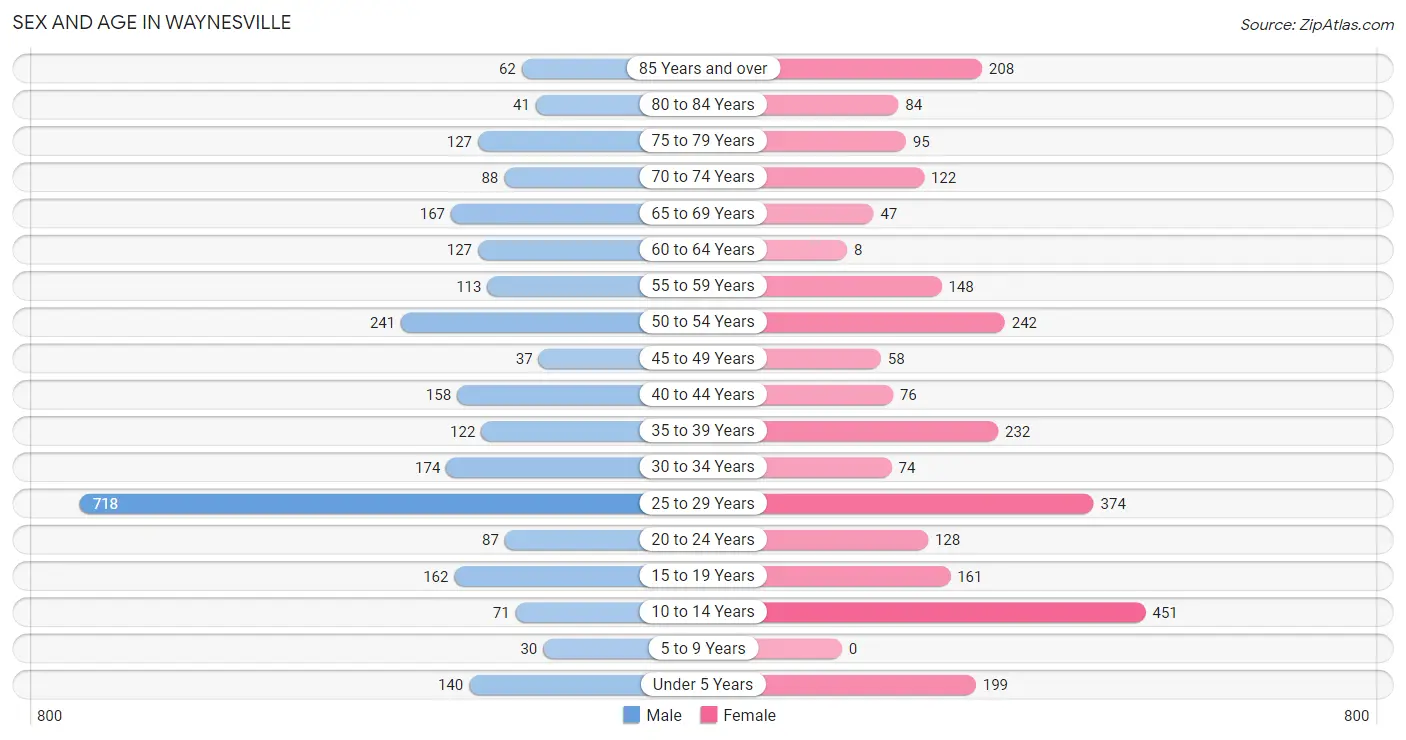
| Age Bracket | Male | Female |
| Under 5 Years | 140 (5.2%) | 199 (7.3%) |
| 5 to 9 Years | 30 (1.1%) | 0 (0.0%) |
| 10 to 14 Years | 71 (2.7%) | 451 (16.7%) |
| 15 to 19 Years | 162 (6.1%) | 161 (5.9%) |
| 20 to 24 Years | 87 (3.3%) | 128 (4.7%) |
| 25 to 29 Years | 718 (26.9%) | 374 (13.8%) |
| 30 to 34 Years | 174 (6.5%) | 74 (2.7%) |
| 35 to 39 Years | 122 (4.6%) | 232 (8.6%) |
| 40 to 44 Years | 158 (5.9%) | 76 (2.8%) |
| 45 to 49 Years | 37 (1.4%) | 58 (2.1%) |
| 50 to 54 Years | 241 (9.0%) | 242 (8.9%) |
| 55 to 59 Years | 113 (4.2%) | 148 (5.5%) |
| 60 to 64 Years | 127 (4.8%) | 8 (0.3%) |
| 65 to 69 Years | 167 (6.3%) | 47 (1.7%) |
| 70 to 74 Years | 88 (3.3%) | 122 (4.5%) |
| 75 to 79 Years | 127 (4.8%) | 95 (3.5%) |
| 80 to 84 Years | 41 (1.5%) | 84 (3.1%) |
| 85 Years and over | 62 (2.3%) | 208 (7.7%) |
| Total | 2,665 (100.0%) | 2,707 (100.0%) |
Families and Households in Waynesville
Median Family Size in Waynesville
The median family size in Waynesville is 2.63 persons per family, with single female/mother families (311 | 23.7%) accounting for the largest median family size of 2.81 persons per family. On the other hand, single male/father families (36 | 2.7%) represent the smallest median family size with 1.92 persons per family.
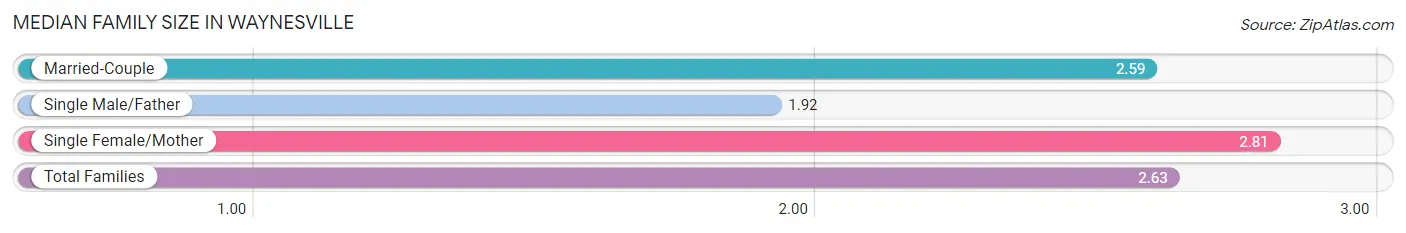
| Family Type | # Families | Family Size |
| Married-Couple | 967 (73.6%) | 2.59 |
| Single Male/Father | 36 (2.7%) | 1.92 |
| Single Female/Mother | 311 (23.7%) | 2.81 |
| Total Families | 1,314 (100.0%) | 2.63 |
Median Household Size in Waynesville
The median household size in Waynesville is 2.21 persons per household, with single female/mother households (311 | 13.2%) accounting for the largest median household size of 2.95 persons per household. non-family households (1,045 | 44.3%) represent the smallest median household size with 1.64 persons per household.
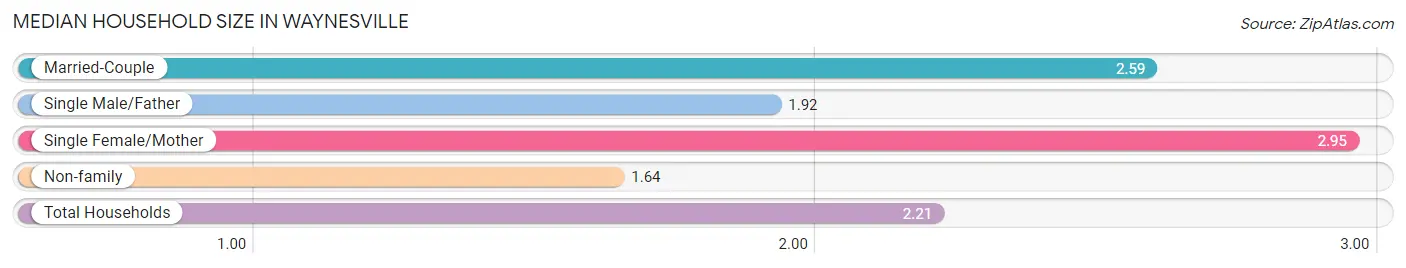
| Household Type | # Households | Household Size |
| Married-Couple | 967 (41.0%) | 2.59 |
| Single Male/Father | 36 (1.5%) | 1.92 |
| Single Female/Mother | 311 (13.2%) | 2.95 |
| Non-family | 1,045 (44.3%) | 1.64 |
| Total Households | 2,359 (100.0%) | 2.21 |
Household Size by Marriage Status in Waynesville
Out of a total of 2,359 households in Waynesville, 1,314 (55.7%) are family households, while 1,045 (44.3%) are nonfamily households. The most numerous type of family households are 2-person households, comprising 690, and the most common type of nonfamily households are 1-person households, comprising 909.
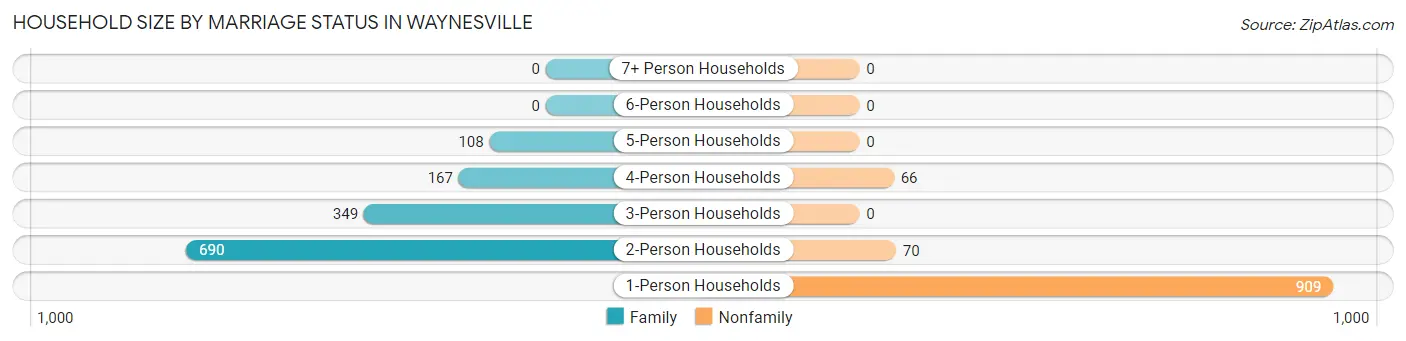
| Household Size | Family Households | Nonfamily Households |
| 1-Person Households | - | 909 (38.5%) |
| 2-Person Households | 690 (29.2%) | 70 (3.0%) |
| 3-Person Households | 349 (14.8%) | 0 (0.0%) |
| 4-Person Households | 167 (7.1%) | 66 (2.8%) |
| 5-Person Households | 108 (4.6%) | 0 (0.0%) |
| 6-Person Households | 0 (0.0%) | 0 (0.0%) |
| 7+ Person Households | 0 (0.0%) | 0 (0.0%) |
| Total | 1,314 (55.7%) | 1,045 (44.3%) |
Female Fertility in Waynesville
Fertility by Age in Waynesville
Average fertility rate in Waynesville is 124.0 births per 1,000 women. Women in the age bracket of 35 to 50 years have the highest fertility rate with 262.0 births per 1,000 women. Women in the age bracket of 35 to 50 years acount for 71.9% of all women with births.
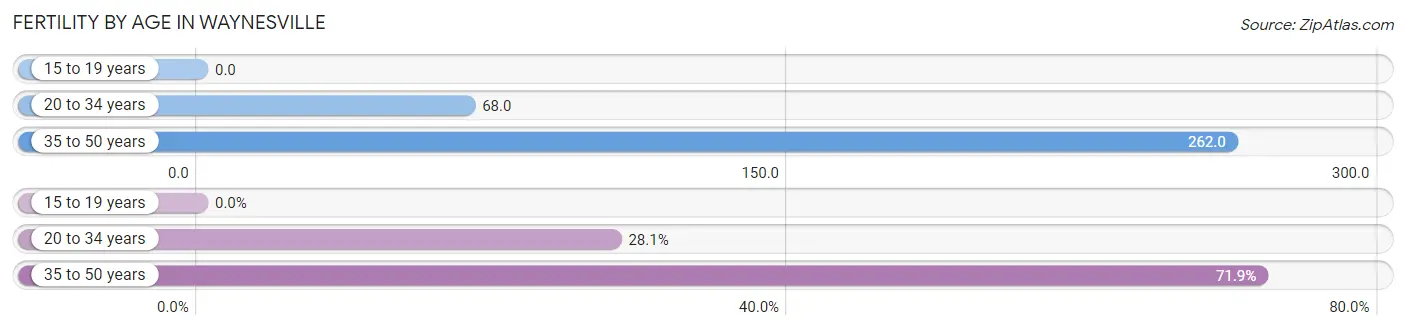
| Age Bracket | Women with Births | Births / 1,000 Women |
| 15 to 19 years | 0 (0.0%) | 0.0 |
| 20 to 34 years | 39 (28.1%) | 68.0 |
| 35 to 50 years | 100 (71.9%) | 262.0 |
| Total | 139 (100.0%) | 124.0 |
Fertility by Age by Marriage Status in Waynesville
46.0% of women with births (139) in Waynesville are married. The highest percentage of unmarried women with births falls into 35 to 50 years age bracket with 75.0% of them unmarried at the time of birth, while the lowest percentage of unmarried women with births belong to 20 to 34 years age bracket with 0.0% of them unmarried.
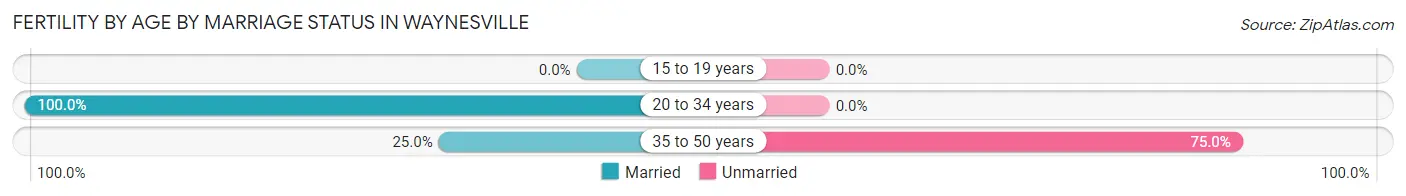
| Age Bracket | Married | Unmarried |
| 15 to 19 years | 0 (0.0%) | 0 (0.0%) |
| 20 to 34 years | 39 (100.0%) | 0 (0.0%) |
| 35 to 50 years | 25 (25.0%) | 75 (75.0%) |
| Total | 64 (46.0%) | 75 (54.0%) |
Fertility by Education in Waynesville
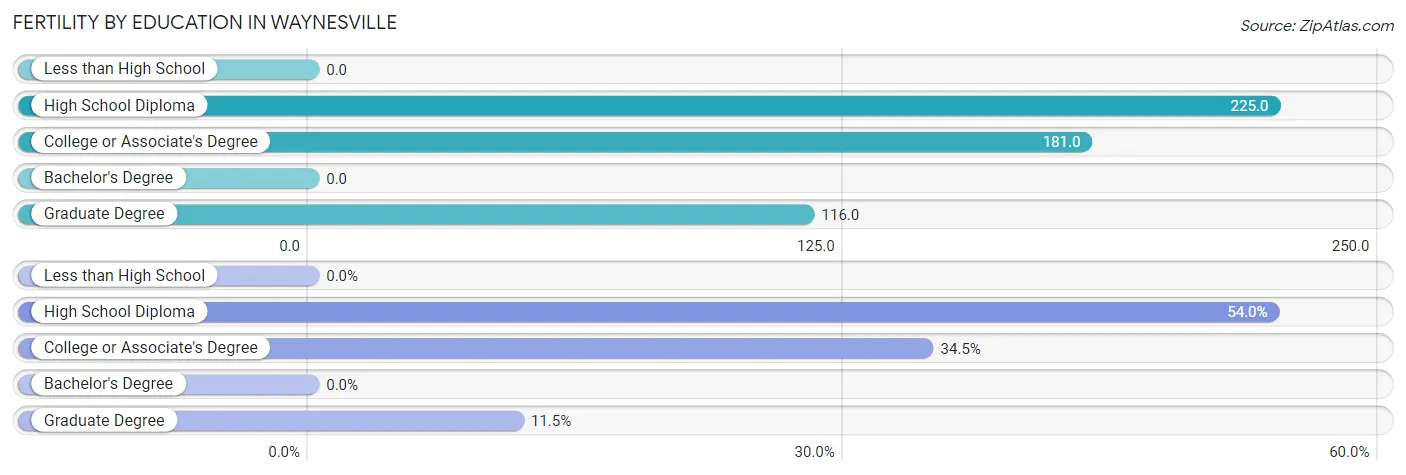
| Educational Attainment | Women with Births | Births / 1,000 Women |
| Less than High School | 0 (0.0%) | 0.0 |
| High School Diploma | 75 (54.0%) | 225.0 |
| College or Associate's Degree | 48 (34.5%) | 181.0 |
| Bachelor's Degree | 0 (0.0%) | 0.0 |
| Graduate Degree | 16 (11.5%) | 116.0 |
| Total | 139 (100.0%) | 124.0 |
Fertility by Education by Marriage Status in Waynesville
54.0% of women with births in Waynesville are unmarried. Women with the educational attainment of college or associate's degree are most likely to be married with 100.0% of them married at childbirth, while women with the educational attainment of high school diploma are least likely to be married with 100.0% of them unmarried at childbirth.
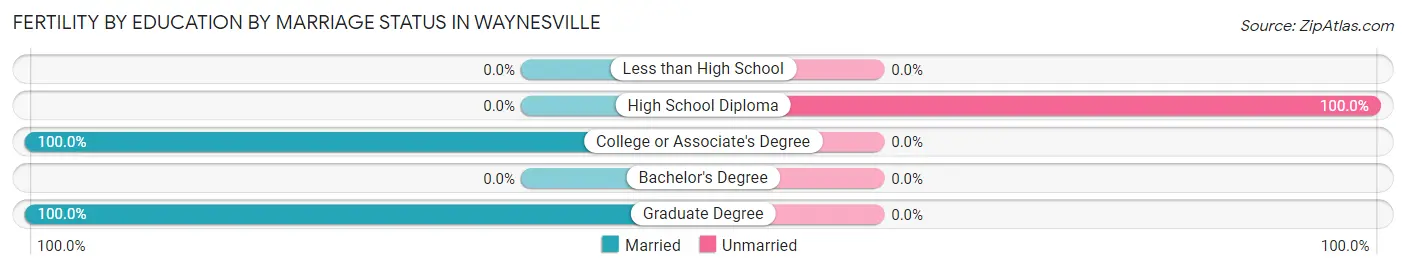
| Educational Attainment | Married | Unmarried |
| Less than High School | 0 (0.0%) | 0 (0.0%) |
| High School Diploma | 0 (0.0%) | 75 (100.0%) |
| College or Associate's Degree | 48 (100.0%) | 0 (0.0%) |
| Bachelor's Degree | 0 (0.0%) | 0 (0.0%) |
| Graduate Degree | 16 (100.0%) | 0 (0.0%) |
| Total | 64 (46.0%) | 75 (54.0%) |
Employment Characteristics in Waynesville
Employment by Class of Employer in Waynesville
Among the 2,712 employed individuals in Waynesville, private company employees (1,039 | 38.3%), federal government employees (1,003 | 37.0%), and local government employees (282 | 10.4%) make up the most common classes of employment.
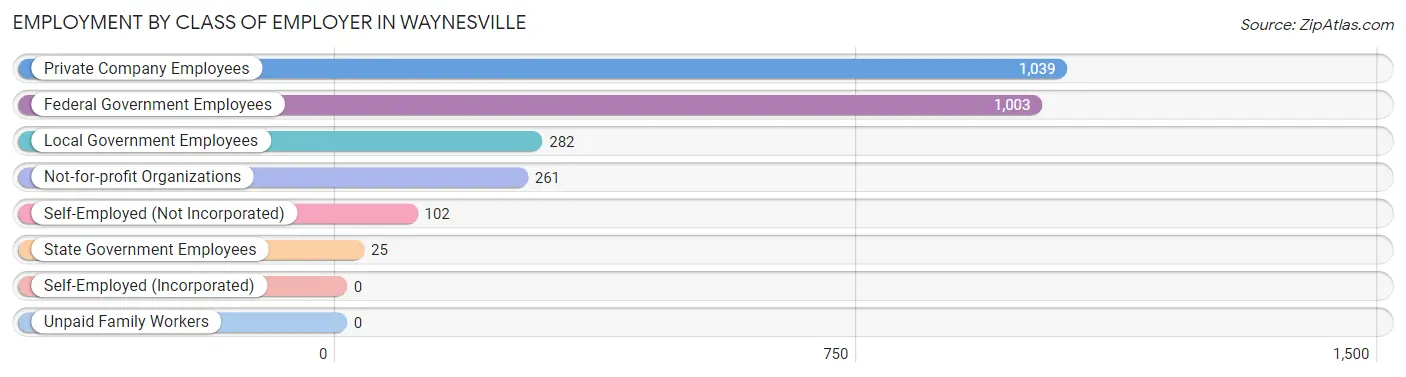
| Employer Class | # Employees | % Employees |
| Private Company Employees | 1,039 | 38.3% |
| Self-Employed (Incorporated) | 0 | 0.0% |
| Self-Employed (Not Incorporated) | 102 | 3.8% |
| Not-for-profit Organizations | 261 | 9.6% |
| Local Government Employees | 282 | 10.4% |
| State Government Employees | 25 | 0.9% |
| Federal Government Employees | 1,003 | 37.0% |
| Unpaid Family Workers | 0 | 0.0% |
| Total | 2,712 | 100.0% |
Employment Status by Age in Waynesville
According to the labor force statistics for Waynesville, out of the total population over 16 years of age (4,378), 65.5% or 2,868 individuals are in the labor force, with 5.2% or 149 of them unemployed. The age group with the highest labor force participation rate is 30 to 34 years, with 98.4% or 244 individuals in the labor force. Within the labor force, the 16 to 19 years age range has the highest percentage of unemployed individuals, with 44.9% or 53 of them being unemployed.
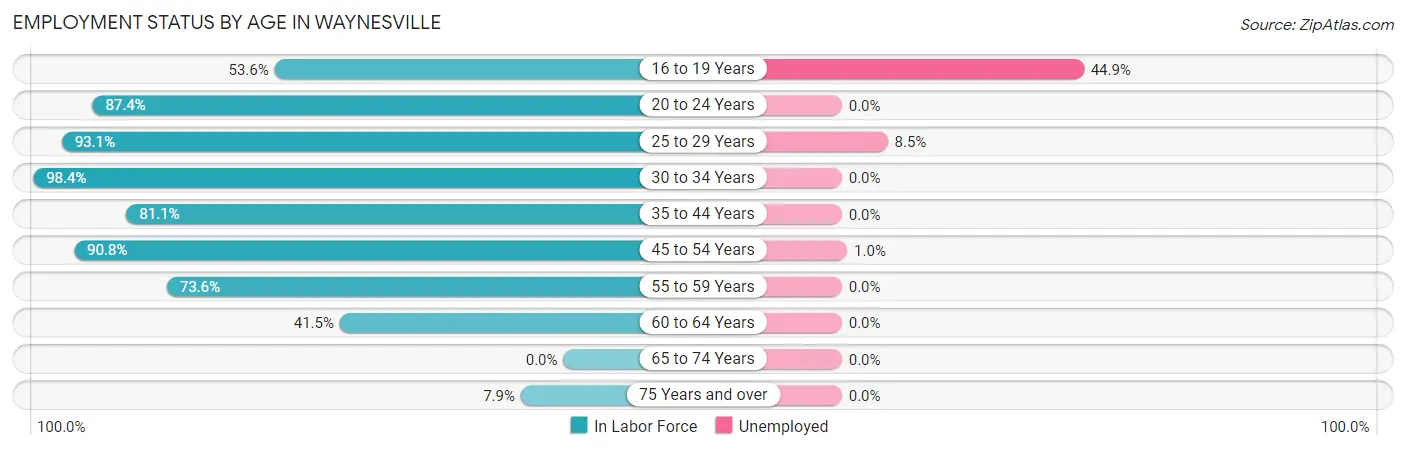
| Age Bracket | In Labor Force | Unemployed |
| 16 to 19 Years | 118 (53.6%) | 53 (44.9%) |
| 20 to 24 Years | 188 (87.4%) | 0 (0.0%) |
| 25 to 29 Years | 1,017 (93.1%) | 86 (8.5%) |
| 30 to 34 Years | 244 (98.4%) | 0 (0.0%) |
| 35 to 44 Years | 477 (81.1%) | 0 (0.0%) |
| 45 to 54 Years | 525 (90.8%) | 5 (1.0%) |
| 55 to 59 Years | 192 (73.6%) | 0 (0.0%) |
| 60 to 64 Years | 56 (41.5%) | 0 (0.0%) |
| 65 to 74 Years | 0 (0.0%) | 0 (0.0%) |
| 75 Years and over | 49 (7.9%) | 0 (0.0%) |
| Total | 2,868 (65.5%) | 149 (5.2%) |
Employment Status by Educational Attainment in Waynesville
According to labor force statistics for Waynesville, 86.5% of individuals (2,510) out of the total population between 25 and 64 years of age (2,902) are in the labor force, with 3.4% or 85 of them being unemployed. The group with the highest labor force participation rate are those with the educational attainment of bachelor's degree or higher, with 97.4% or 1,008 individuals in the labor force. Within the labor force, individuals with bachelor's degree or higher education have the highest percentage of unemployment, with 9.4% or 95 of them being unemployed.
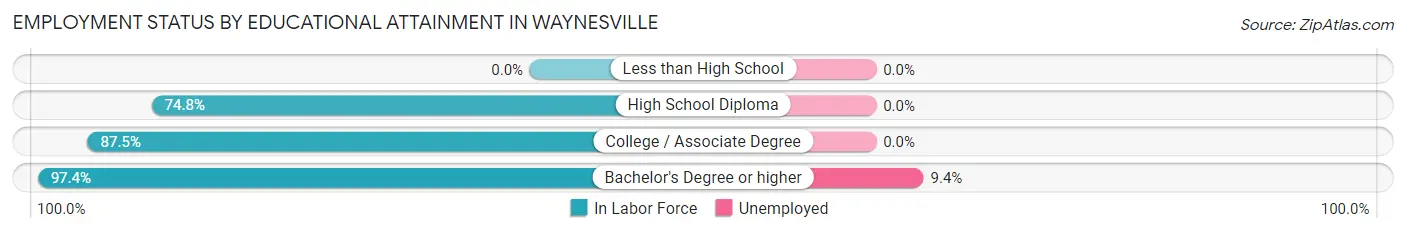
| Educational Attainment | In Labor Force | Unemployed |
| Less than High School | 0 (0.0%) | 0 (0.0%) |
| High School Diploma | 676 (74.8%) | 0 (0.0%) |
| College / Associate Degree | 827 (87.5%) | 0 (0.0%) |
| Bachelor's Degree or higher | 1,008 (97.4%) | 97 (9.4%) |
| Total | 2,510 (86.5%) | 99 (3.4%) |
Employment Occupations by Sex in Waynesville
Management, Business, Science and Arts Occupations
The most common Management, Business, Science and Arts occupations in Waynesville are Computers, Engineering & Science (329 | 13.9%), Computers & Mathematics (275 | 11.6%), Health Diagnosing & Treating (272 | 11.5%), Community & Social Service (257 | 10.8%), and Health Technologists (134 | 5.6%).
Management, Business, Science and Arts Occupations by Sex
Within the Management, Business, Science and Arts occupations in Waynesville, the most male-oriented occupations are Computers, Engineering & Science (100.0%), Computers & Mathematics (100.0%), and Architecture & Engineering (100.0%), while the most female-oriented occupations are Legal Services & Support (100.0%), Health Technologists (100.0%), and Education Instruction & Library (73.2%).
| Occupation | Male | Female |
| Management | 40 (39.2%) | 62 (60.8%) |
| Business & Financial | 29 (44.6%) | 36 (55.4%) |
| Computers, Engineering & Science | 329 (100.0%) | 0 (0.0%) |
| Computers & Mathematics | 275 (100.0%) | 0 (0.0%) |
| Architecture & Engineering | 54 (100.0%) | 0 (0.0%) |
| Life, Physical & Social Science | 0 (0.0%) | 0 (0.0%) |
| Community & Social Service | 70 (27.2%) | 187 (72.8%) |
| Education, Arts & Media | 14 (40.0%) | 21 (60.0%) |
| Legal Services & Support | 0 (0.0%) | 73 (100.0%) |
| Education Instruction & Library | 34 (26.8%) | 93 (73.2%) |
| Arts, Media & Entertainment | 22 (100.0%) | 0 (0.0%) |
| Health Diagnosing & Treating | 79 (29.0%) | 193 (71.0%) |
| Health Technologists | 0 (0.0%) | 134 (100.0%) |
| Total (Category) | 547 (53.4%) | 478 (46.6%) |
| Total (Overall) | 1,213 (51.1%) | 1,162 (48.9%) |
Services Occupations
The most common Services occupations in Waynesville are Food Preparation & Serving (75 | 3.2%), Security & Protection (59 | 2.5%), Law Enforcement (59 | 2.5%), Cleaning & Maintenance (8 | 0.3%), and Personal Care & Service (7 | 0.3%).
Services Occupations by Sex
Within the Services occupations in Waynesville, the most male-oriented occupations are Security & Protection (100.0%), Law Enforcement (100.0%), and Food Preparation & Serving (42.7%), while the most female-oriented occupations are Cleaning & Maintenance (100.0%), Personal Care & Service (100.0%), and Food Preparation & Serving (57.3%).
| Occupation | Male | Female |
| Healthcare Support | 0 (0.0%) | 0 (0.0%) |
| Security & Protection | 59 (100.0%) | 0 (0.0%) |
| Firefighting & Prevention | 0 (0.0%) | 0 (0.0%) |
| Law Enforcement | 59 (100.0%) | 0 (0.0%) |
| Food Preparation & Serving | 32 (42.7%) | 43 (57.3%) |
| Cleaning & Maintenance | 0 (0.0%) | 8 (100.0%) |
| Personal Care & Service | 0 (0.0%) | 7 (100.0%) |
| Total (Category) | 91 (61.1%) | 58 (38.9%) |
| Total (Overall) | 1,213 (51.1%) | 1,162 (48.9%) |
Sales and Office Occupations
The most common Sales and Office occupations in Waynesville are Office & Administration (445 | 18.7%), and Sales & Related (163 | 6.9%).

Sales and Office Occupations by Sex
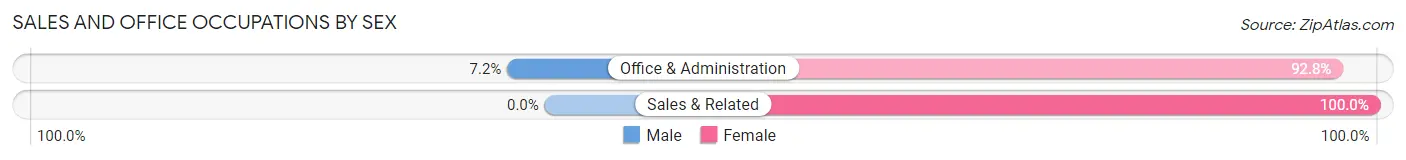
| Occupation | Male | Female |
| Sales & Related | 0 (0.0%) | 163 (100.0%) |
| Office & Administration | 32 (7.2%) | 413 (92.8%) |
| Total (Category) | 32 (5.3%) | 576 (94.7%) |
| Total (Overall) | 1,213 (51.1%) | 1,162 (48.9%) |
Natural Resources, Construction and Maintenance Occupations
The most common Natural Resources, Construction and Maintenance occupations in Waynesville are Construction & Extraction (82 | 3.5%), and Installation, Maintenance & Repair (25 | 1.1%).

Natural Resources, Construction and Maintenance Occupations by Sex
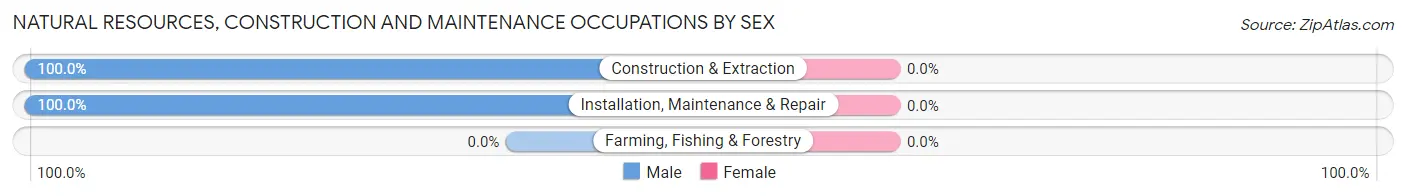
| Occupation | Male | Female |
| Farming, Fishing & Forestry | 0 (0.0%) | 0 (0.0%) |
| Construction & Extraction | 82 (100.0%) | 0 (0.0%) |
| Installation, Maintenance & Repair | 25 (100.0%) | 0 (0.0%) |
| Total (Category) | 107 (100.0%) | 0 (0.0%) |
| Total (Overall) | 1,213 (51.1%) | 1,162 (48.9%) |
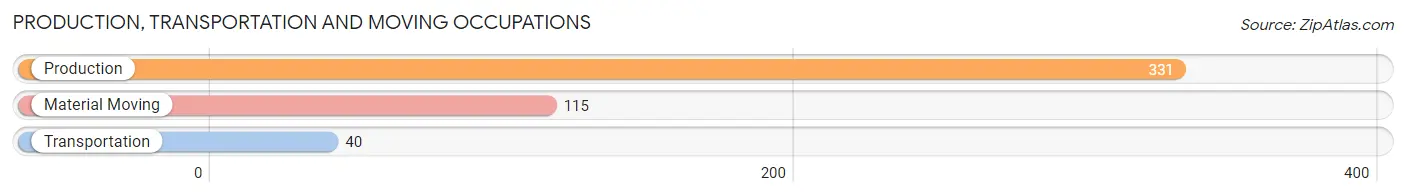
Production, Transportation and Moving Occupations
The most common Production, Transportation and Moving occupations in Waynesville are Production (331 | 13.9%), Material Moving (115 | 4.8%), and Transportation (40 | 1.7%).
Production, Transportation and Moving Occupations by Sex
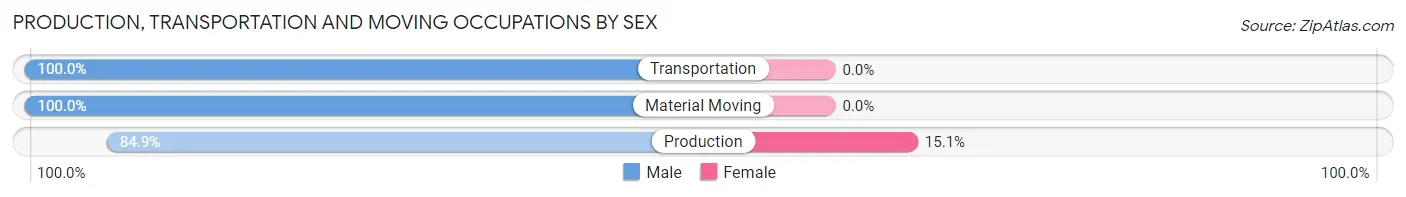
| Occupation | Male | Female |
| Production | 281 (84.9%) | 50 (15.1%) |
| Transportation | 40 (100.0%) | 0 (0.0%) |
| Material Moving | 115 (100.0%) | 0 (0.0%) |
| Total (Category) | 436 (89.7%) | 50 (10.3%) |
| Total (Overall) | 1,213 (51.1%) | 1,162 (48.9%) |
Employment Industries by Sex in Waynesville
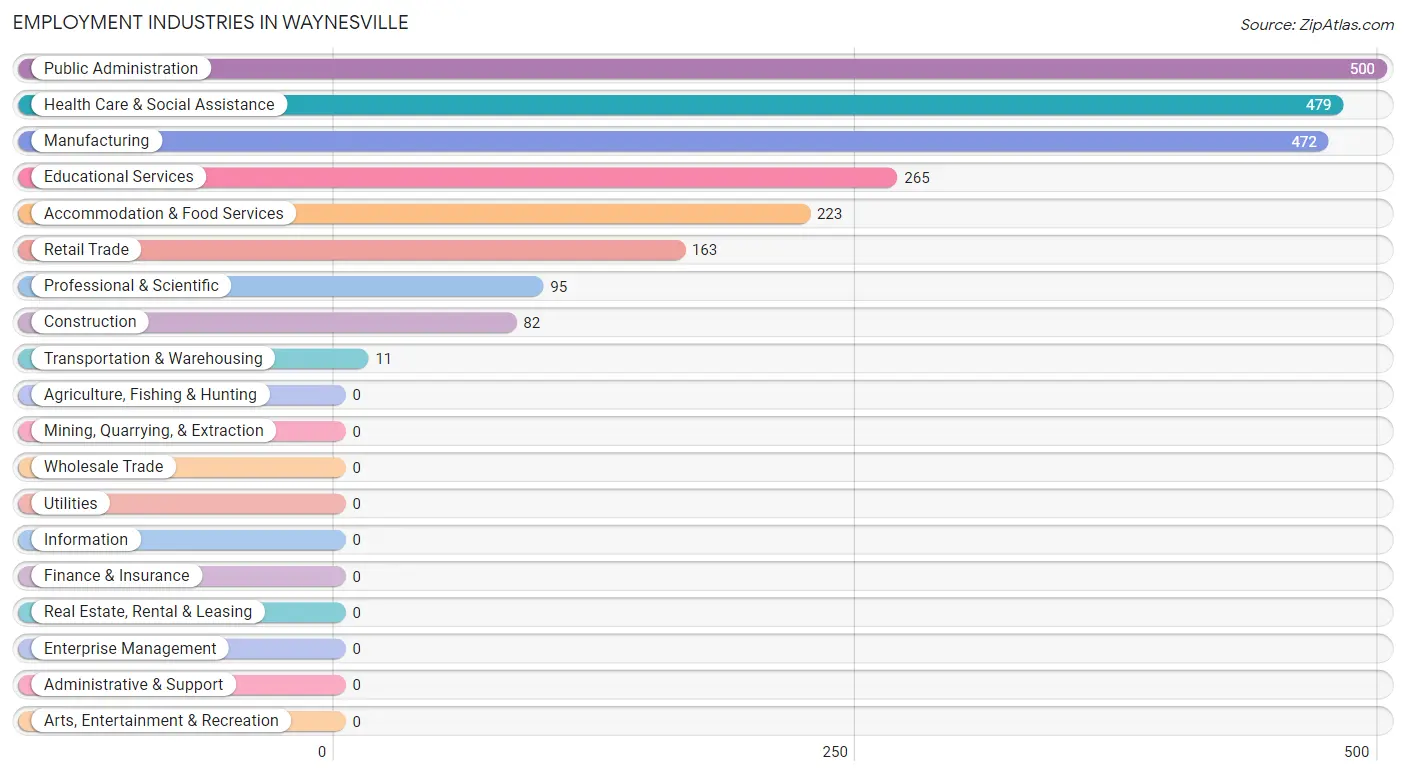
Employment Industries in Waynesville
The major employment industries in Waynesville include Public Administration (500 | 21.0%), Health Care & Social Assistance (479 | 20.2%), Manufacturing (472 | 19.9%), Educational Services (265 | 11.2%), and Accommodation & Food Services (223 | 9.4%).
Employment Industries by Sex in Waynesville
The Waynesville industries that see more men than women are Construction (100.0%), Transportation & Warehousing (100.0%), and Manufacturing (89.4%), whereas the industries that tend to have a higher number of women are Retail Trade (100.0%), Accommodation & Food Services (87.0%), and Professional & Scientific (76.8%).
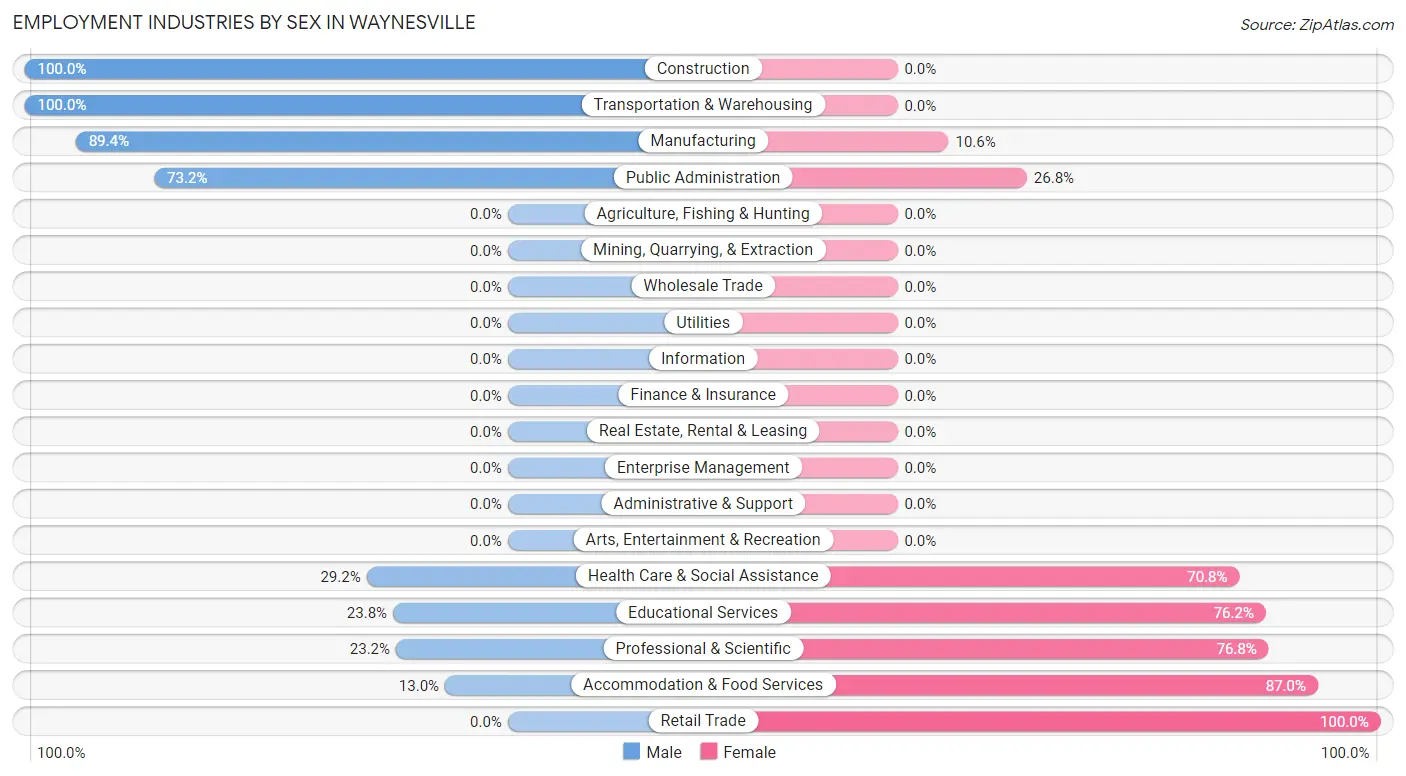
| Industry | Male | Female |
| Agriculture, Fishing & Hunting | 0 (0.0%) | 0 (0.0%) |
| Mining, Quarrying, & Extraction | 0 (0.0%) | 0 (0.0%) |
| Construction | 82 (100.0%) | 0 (0.0%) |
| Manufacturing | 422 (89.4%) | 50 (10.6%) |
| Wholesale Trade | 0 (0.0%) | 0 (0.0%) |
| Retail Trade | 0 (0.0%) | 163 (100.0%) |
| Transportation & Warehousing | 11 (100.0%) | 0 (0.0%) |
| Utilities | 0 (0.0%) | 0 (0.0%) |
| Information | 0 (0.0%) | 0 (0.0%) |
| Finance & Insurance | 0 (0.0%) | 0 (0.0%) |
| Real Estate, Rental & Leasing | 0 (0.0%) | 0 (0.0%) |
| Professional & Scientific | 22 (23.2%) | 73 (76.8%) |
| Enterprise Management | 0 (0.0%) | 0 (0.0%) |
| Administrative & Support | 0 (0.0%) | 0 (0.0%) |
| Educational Services | 63 (23.8%) | 202 (76.2%) |
| Health Care & Social Assistance | 140 (29.2%) | 339 (70.8%) |
| Arts, Entertainment & Recreation | 0 (0.0%) | 0 (0.0%) |
| Accommodation & Food Services | 29 (13.0%) | 194 (87.0%) |
| Public Administration | 366 (73.2%) | 134 (26.8%) |
| Total | 1,213 (51.1%) | 1,162 (48.9%) |
Education in Waynesville
School Enrollment in Waynesville
The most common levels of schooling among the 1,184 students in Waynesville are middle school (472 | 39.9%), high school (298 | 25.2%), and college / undergraduate (198 | 16.7%).
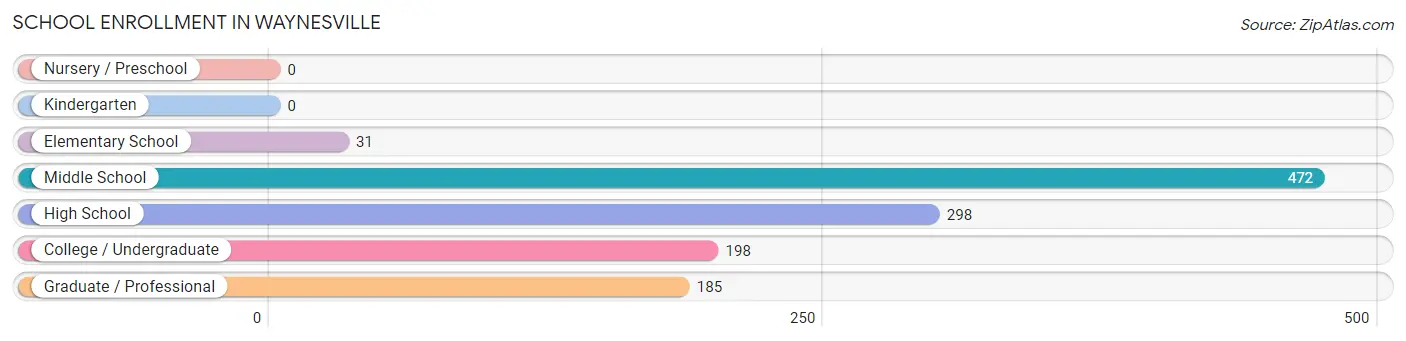
| School Level | # Students | % Students |
| Nursery / Preschool | 0 | 0.0% |
| Kindergarten | 0 | 0.0% |
| Elementary School | 31 | 2.6% |
| Middle School | 472 | 39.9% |
| High School | 298 | 25.2% |
| College / Undergraduate | 198 | 16.7% |
| Graduate / Professional | 185 | 15.6% |
| Total | 1,184 | 100.0% |
School Enrollment by Age by Funding Source in Waynesville
Out of a total of 1,184 students who are enrolled in schools in Waynesville, 90 (7.6%) attend a private institution, while the remaining 1,094 (92.4%) are enrolled in public schools. The age group of 25 to 34 year olds has the highest likelihood of being enrolled in private schools, with 86 (33.6% in the age bracket) enrolled. Conversely, the age group of 5 to 9 year old has the lowest likelihood of being enrolled in a private school, with 30 (100.0% in the age bracket) attending a public institution.
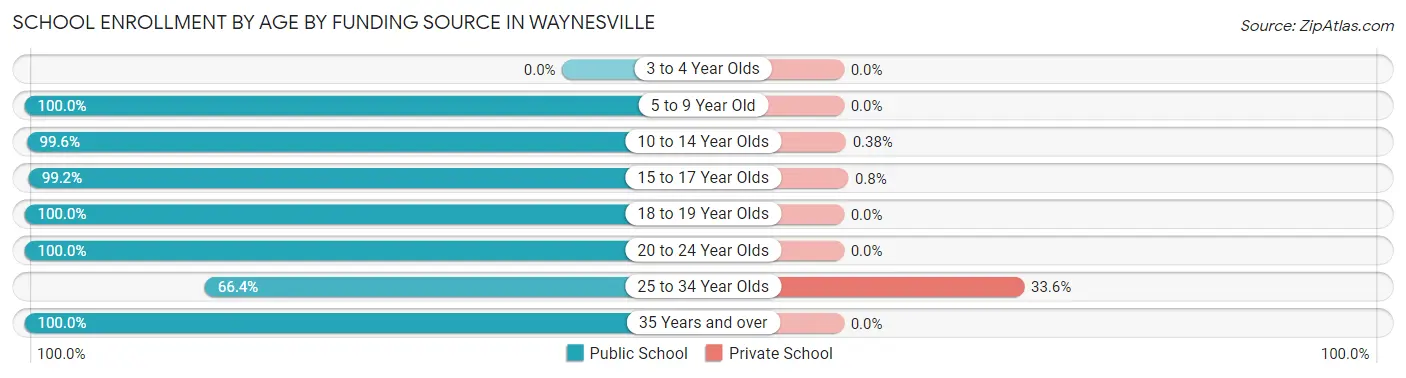
| Age Bracket | Public School | Private School |
| 3 to 4 Year Olds | 0 (0.0%) | 0 (0.0%) |
| 5 to 9 Year Old | 30 (100.0%) | 0 (0.0%) |
| 10 to 14 Year Olds | 520 (99.6%) | 2 (0.4%) |
| 15 to 17 Year Olds | 247 (99.2%) | 2 (0.8%) |
| 18 to 19 Year Olds | 52 (100.0%) | 0 (0.0%) |
| 20 to 24 Year Olds | 34 (100.0%) | 0 (0.0%) |
| 25 to 34 Year Olds | 170 (66.4%) | 86 (33.6%) |
| 35 Years and over | 41 (100.0%) | 0 (0.0%) |
| Total | 1,094 (92.4%) | 90 (7.6%) |
Educational Attainment by Field of Study in Waynesville
Business (337 | 26.3%), science & technology (161 | 12.5%), education (131 | 10.2%), computers & mathematics (127 | 9.9%), and arts & humanities (127 | 9.9%) are the most common fields of study among 1,284 individuals in Waynesville who have obtained a bachelor's degree or higher.
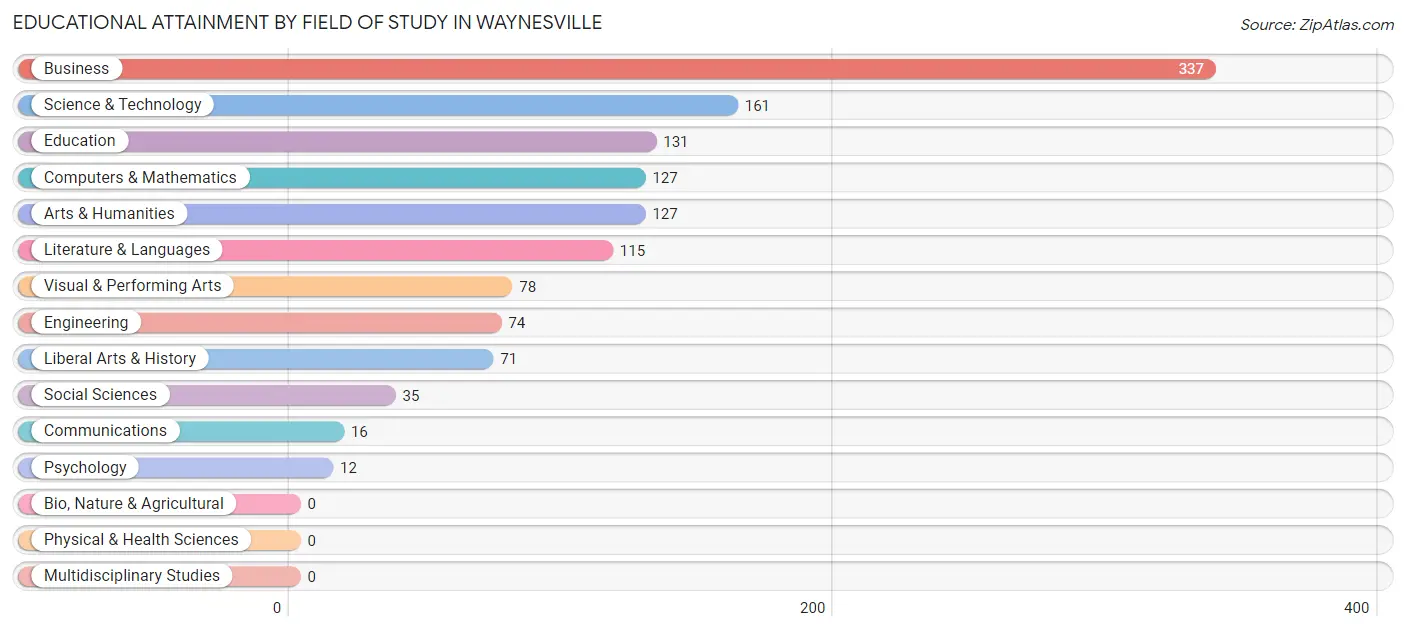
| Field of Study | # Graduates | % Graduates |
| Computers & Mathematics | 127 | 9.9% |
| Bio, Nature & Agricultural | 0 | 0.0% |
| Physical & Health Sciences | 0 | 0.0% |
| Psychology | 12 | 0.9% |
| Social Sciences | 35 | 2.7% |
| Engineering | 74 | 5.8% |
| Multidisciplinary Studies | 0 | 0.0% |
| Science & Technology | 161 | 12.5% |
| Business | 337 | 26.3% |
| Education | 131 | 10.2% |
| Literature & Languages | 115 | 9.0% |
| Liberal Arts & History | 71 | 5.5% |
| Visual & Performing Arts | 78 | 6.1% |
| Communications | 16 | 1.3% |
| Arts & Humanities | 127 | 9.9% |
| Total | 1,284 | 100.0% |
Transportation & Commute in Waynesville
Vehicle Availability by Sex in Waynesville
The most prevalent vehicle ownership categories in Waynesville are males with 3 vehicles (617, accounting for 41.7%) and females with 3 vehicles (373, making up 50.0%).
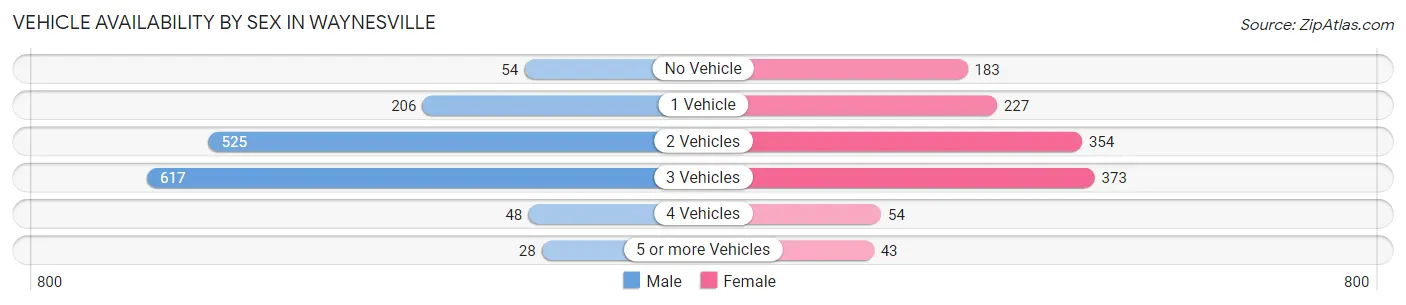
| Vehicles Available | Male | Female |
| No Vehicle | 54 (3.6%) | 183 (14.8%) |
| 1 Vehicle | 206 (13.9%) | 227 (18.4%) |
| 2 Vehicles | 525 (35.5%) | 354 (28.7%) |
| 3 Vehicles | 617 (41.7%) | 373 (30.2%) |
| 4 Vehicles | 48 (3.3%) | 54 (4.4%) |
| 5 or more Vehicles | 28 (1.9%) | 43 (3.5%) |
| Total | 1,478 (100.0%) | 1,234 (100.0%) |
Commute Time in Waynesville
The most frequently occuring commute durations in Waynesville are 15 to 19 minutes (605 commuters, 23.3%), 30 to 34 minutes (544 commuters, 20.9%), and 5 to 9 minutes (462 commuters, 17.8%).
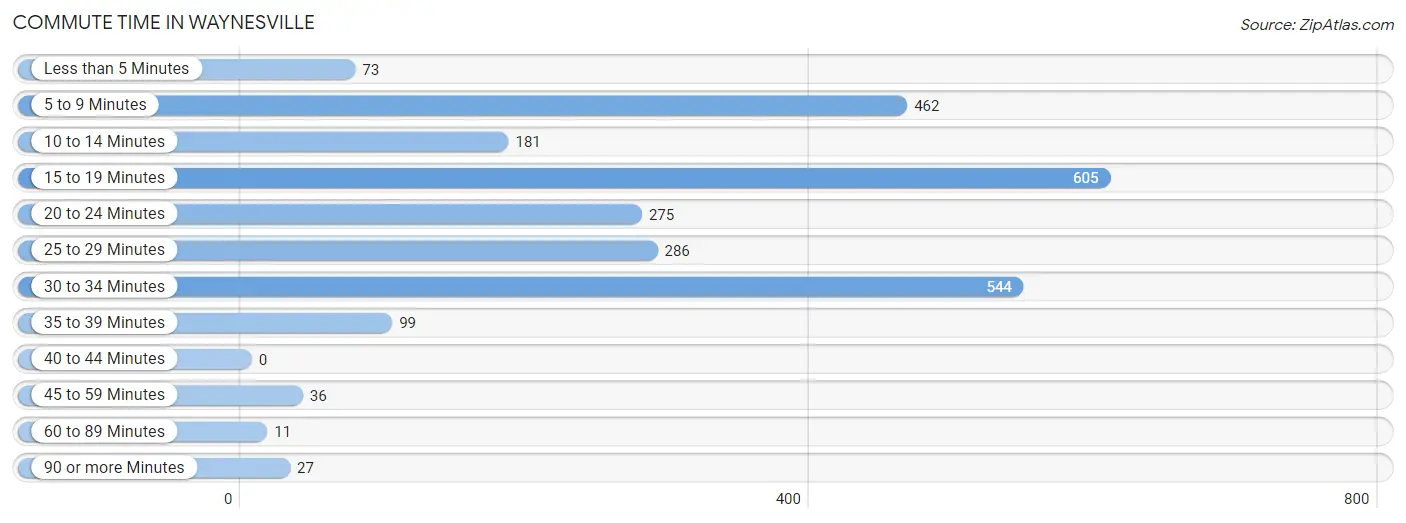
| Commute Time | # Commuters | % Commuters |
| Less than 5 Minutes | 73 | 2.8% |
| 5 to 9 Minutes | 462 | 17.8% |
| 10 to 14 Minutes | 181 | 7.0% |
| 15 to 19 Minutes | 605 | 23.3% |
| 20 to 24 Minutes | 275 | 10.6% |
| 25 to 29 Minutes | 286 | 11.0% |
| 30 to 34 Minutes | 544 | 20.9% |
| 35 to 39 Minutes | 99 | 3.8% |
| 40 to 44 Minutes | 0 | 0.0% |
| 45 to 59 Minutes | 36 | 1.4% |
| 60 to 89 Minutes | 11 | 0.4% |
| 90 or more Minutes | 27 | 1.0% |
Commute Time by Sex in Waynesville
The most common commute times in Waynesville are 30 to 34 minutes (494 commuters, 34.4%) for males and 5 to 9 minutes (419 commuters, 36.1%) for females.
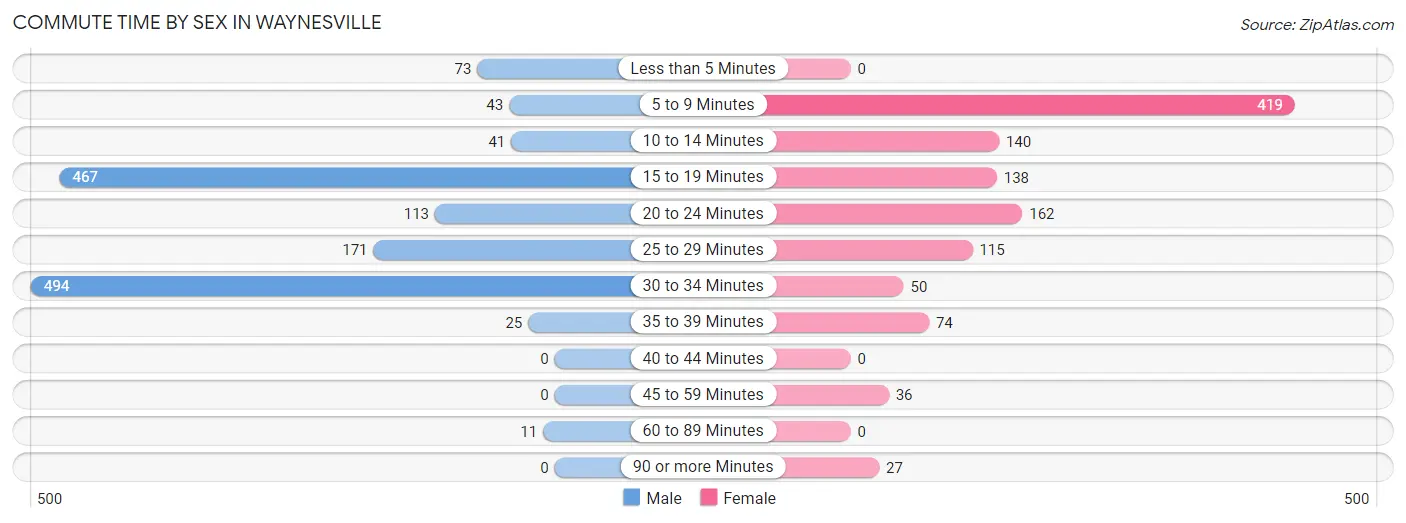
| Commute Time | Male | Female |
| Less than 5 Minutes | 73 (5.1%) | 0 (0.0%) |
| 5 to 9 Minutes | 43 (3.0%) | 419 (36.1%) |
| 10 to 14 Minutes | 41 (2.9%) | 140 (12.1%) |
| 15 to 19 Minutes | 467 (32.5%) | 138 (11.9%) |
| 20 to 24 Minutes | 113 (7.9%) | 162 (14.0%) |
| 25 to 29 Minutes | 171 (11.9%) | 115 (9.9%) |
| 30 to 34 Minutes | 494 (34.4%) | 50 (4.3%) |
| 35 to 39 Minutes | 25 (1.7%) | 74 (6.4%) |
| 40 to 44 Minutes | 0 (0.0%) | 0 (0.0%) |
| 45 to 59 Minutes | 0 (0.0%) | 36 (3.1%) |
| 60 to 89 Minutes | 11 (0.8%) | 0 (0.0%) |
| 90 or more Minutes | 0 (0.0%) | 27 (2.3%) |
Time of Departure to Work by Sex in Waynesville
The most frequent times of departure to work in Waynesville are 12:00 PM to 3:59 PM (281, 19.5%) for males and 5:00 AM to 5:29 AM (208, 17.9%) for females.
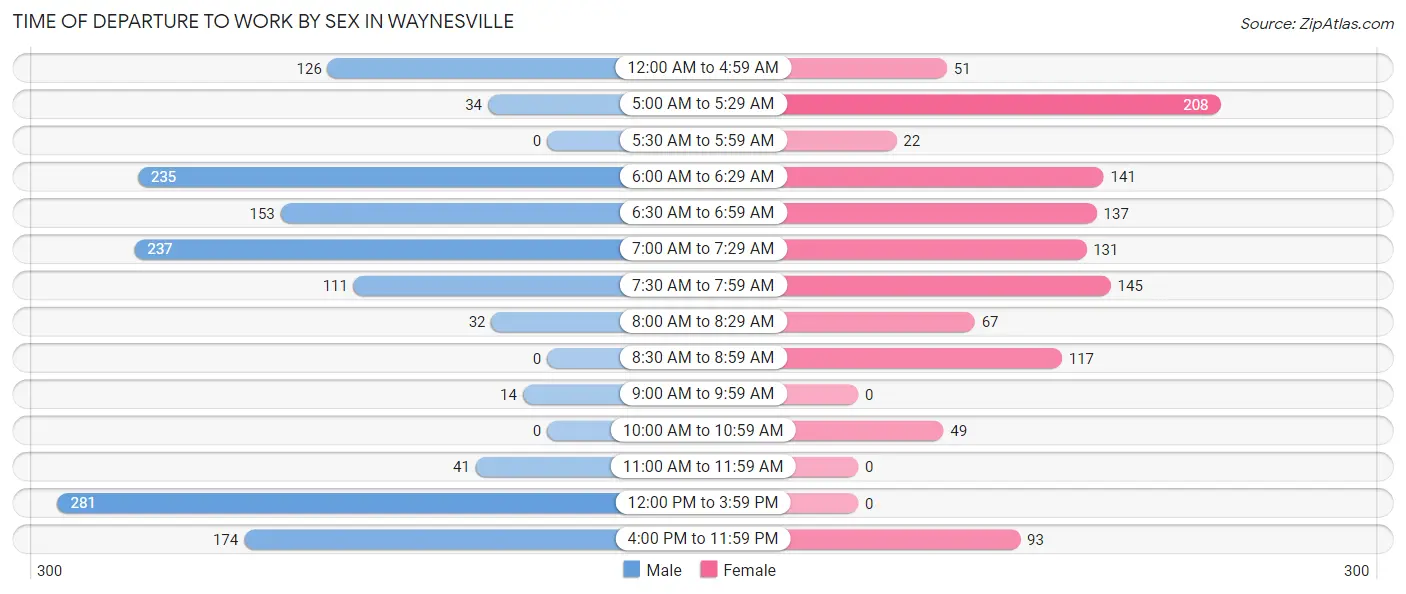
| Time of Departure | Male | Female |
| 12:00 AM to 4:59 AM | 126 (8.8%) | 51 (4.4%) |
| 5:00 AM to 5:29 AM | 34 (2.4%) | 208 (17.9%) |
| 5:30 AM to 5:59 AM | 0 (0.0%) | 22 (1.9%) |
| 6:00 AM to 6:29 AM | 235 (16.3%) | 141 (12.1%) |
| 6:30 AM to 6:59 AM | 153 (10.6%) | 137 (11.8%) |
| 7:00 AM to 7:29 AM | 237 (16.5%) | 131 (11.3%) |
| 7:30 AM to 7:59 AM | 111 (7.7%) | 145 (12.5%) |
| 8:00 AM to 8:29 AM | 32 (2.2%) | 67 (5.8%) |
| 8:30 AM to 8:59 AM | 0 (0.0%) | 117 (10.1%) |
| 9:00 AM to 9:59 AM | 14 (1.0%) | 0 (0.0%) |
| 10:00 AM to 10:59 AM | 0 (0.0%) | 49 (4.2%) |
| 11:00 AM to 11:59 AM | 41 (2.9%) | 0 (0.0%) |
| 12:00 PM to 3:59 PM | 281 (19.5%) | 0 (0.0%) |
| 4:00 PM to 11:59 PM | 174 (12.1%) | 93 (8.0%) |
| Total | 1,438 (100.0%) | 1,161 (100.0%) |
Housing Occupancy in Waynesville
Occupancy by Ownership in Waynesville
Of the total 2,359 dwellings in Waynesville, owner-occupied units account for 1,371 (58.1%), while renter-occupied units make up 988 (41.9%).
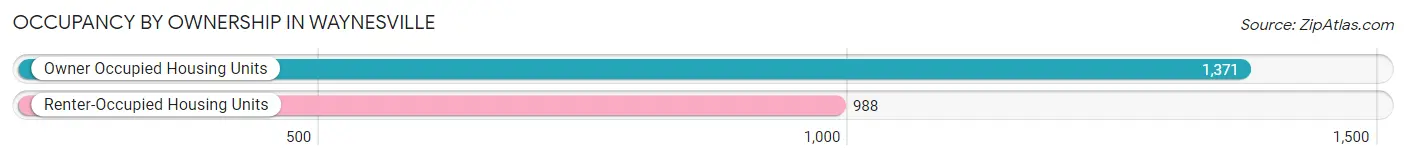
| Occupancy | # Housing Units | % Housing Units |
| Owner Occupied Housing Units | 1,371 | 58.1% |
| Renter-Occupied Housing Units | 988 | 41.9% |
| Total Occupied Housing Units | 2,359 | 100.0% |
Occupancy by Household Size in Waynesville
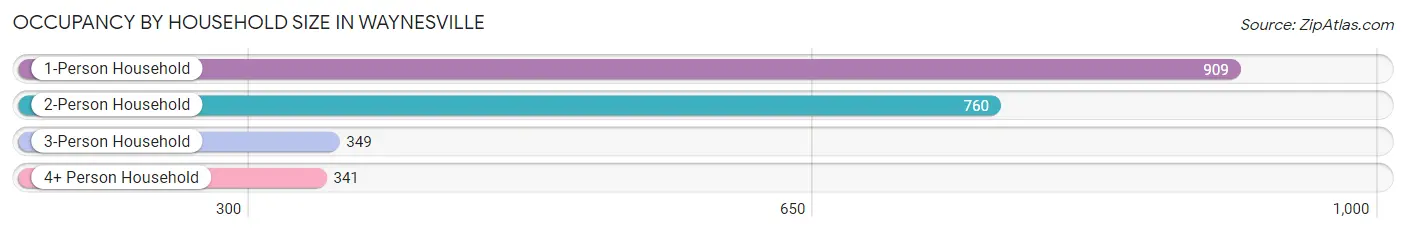
| Household Size | # Housing Units | % Housing Units |
| 1-Person Household | 909 | 38.5% |
| 2-Person Household | 760 | 32.2% |
| 3-Person Household | 349 | 14.8% |
| 4+ Person Household | 341 | 14.5% |
| Total Housing Units | 2,359 | 100.0% |
Occupancy by Ownership by Household Size in Waynesville
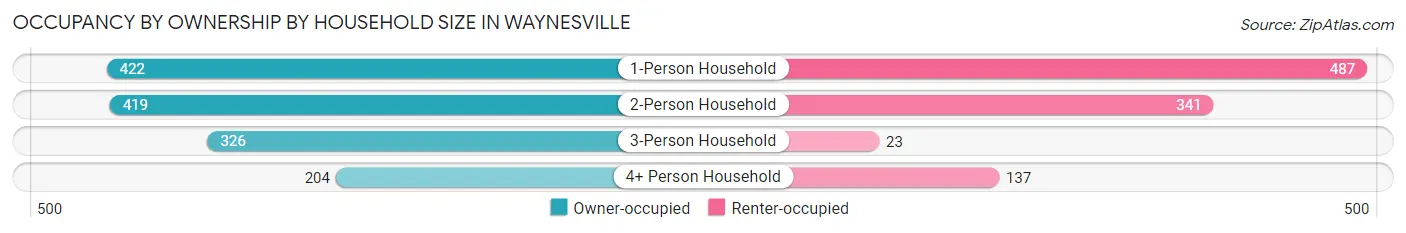
| Household Size | Owner-occupied | Renter-occupied |
| 1-Person Household | 422 (46.4%) | 487 (53.6%) |
| 2-Person Household | 419 (55.1%) | 341 (44.9%) |
| 3-Person Household | 326 (93.4%) | 23 (6.6%) |
| 4+ Person Household | 204 (59.8%) | 137 (40.2%) |
| Total Housing Units | 1,371 (58.1%) | 988 (41.9%) |
Occupancy by Educational Attainment in Waynesville
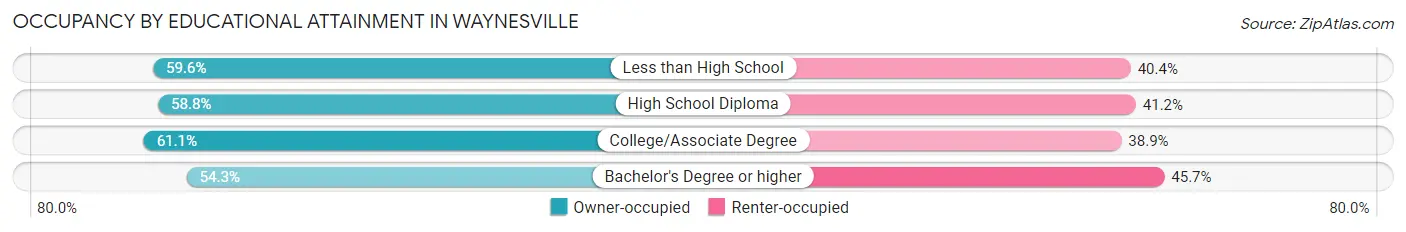
| Household Size | Owner-occupied | Renter-occupied |
| Less than High School | 62 (59.6%) | 42 (40.4%) |
| High School Diploma | 217 (58.8%) | 152 (41.2%) |
| College/Associate Degree | 611 (61.1%) | 389 (38.9%) |
| Bachelor's Degree or higher | 481 (54.3%) | 405 (45.7%) |
Occupancy by Age of Householder in Waynesville
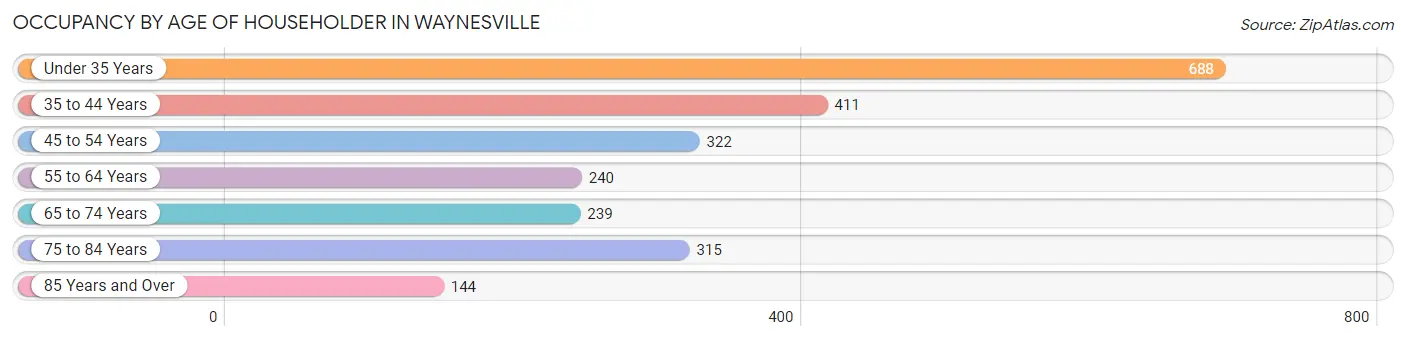
| Age Bracket | # Households | % Households |
| Under 35 Years | 688 | 29.2% |
| 35 to 44 Years | 411 | 17.4% |
| 45 to 54 Years | 322 | 13.7% |
| 55 to 64 Years | 240 | 10.2% |
| 65 to 74 Years | 239 | 10.1% |
| 75 to 84 Years | 315 | 13.4% |
| 85 Years and Over | 144 | 6.1% |
| Total | 2,359 | 100.0% |
Housing Finances in Waynesville
Median Income by Occupancy in Waynesville
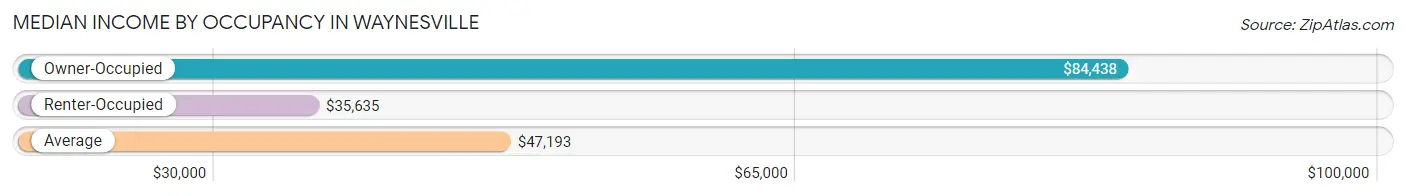
| Occupancy Type | # Households | Median Income |
| Owner-Occupied | 1,371 (58.1%) | $84,438 |
| Renter-Occupied | 988 (41.9%) | $35,635 |
| Average | 2,359 (100.0%) | $47,193 |
Occupancy by Householder Income Bracket in Waynesville
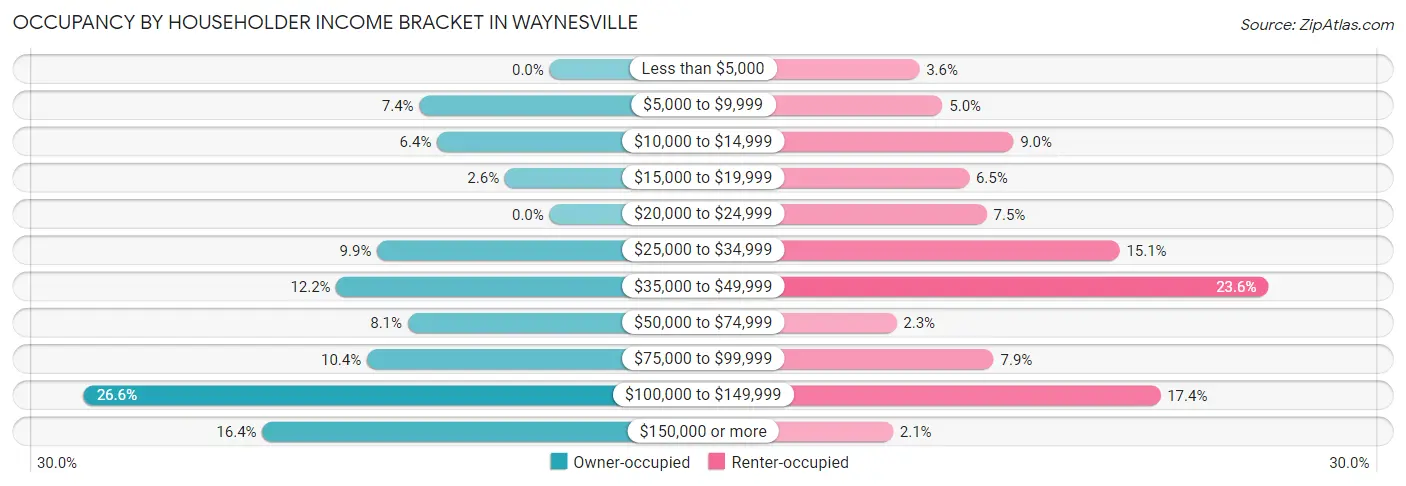
| Income Bracket | Owner-occupied | Renter-occupied |
| Less than $5,000 | 0 (0.0%) | 36 (3.6%) |
| $5,000 to $9,999 | 102 (7.4%) | 49 (5.0%) |
| $10,000 to $14,999 | 88 (6.4%) | 89 (9.0%) |
| $15,000 to $19,999 | 35 (2.5%) | 64 (6.5%) |
| $20,000 to $24,999 | 0 (0.0%) | 74 (7.5%) |
| $25,000 to $34,999 | 135 (9.9%) | 149 (15.1%) |
| $35,000 to $49,999 | 167 (12.2%) | 233 (23.6%) |
| $50,000 to $74,999 | 111 (8.1%) | 23 (2.3%) |
| $75,000 to $99,999 | 143 (10.4%) | 78 (7.9%) |
| $100,000 to $149,999 | 365 (26.6%) | 172 (17.4%) |
| $150,000 or more | 225 (16.4%) | 21 (2.1%) |
| Total | 1,371 (100.0%) | 988 (100.0%) |
Monthly Housing Cost Tiers in Waynesville
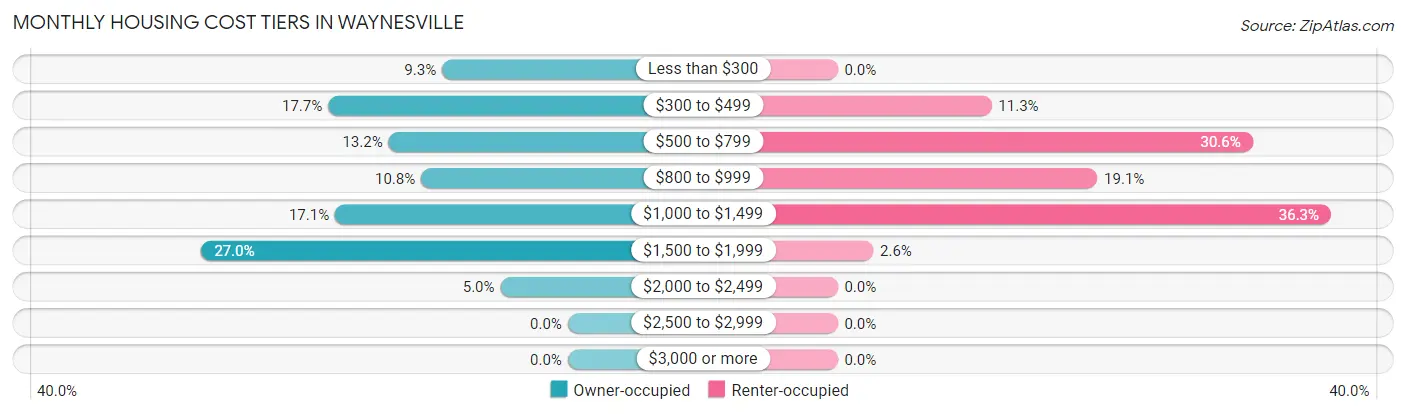
| Monthly Cost | Owner-occupied | Renter-occupied |
| Less than $300 | 127 (9.3%) | 0 (0.0%) |
| $300 to $499 | 242 (17.6%) | 112 (11.3%) |
| $500 to $799 | 181 (13.2%) | 302 (30.6%) |
| $800 to $999 | 148 (10.8%) | 189 (19.1%) |
| $1,000 to $1,499 | 235 (17.1%) | 359 (36.3%) |
| $1,500 to $1,999 | 370 (27.0%) | 26 (2.6%) |
| $2,000 to $2,499 | 68 (5.0%) | 0 (0.0%) |
| $2,500 to $2,999 | 0 (0.0%) | 0 (0.0%) |
| $3,000 or more | 0 (0.0%) | 0 (0.0%) |
| Total | 1,371 (100.0%) | 988 (100.0%) |
Physical Housing Characteristics in Waynesville
Housing Structures in Waynesville
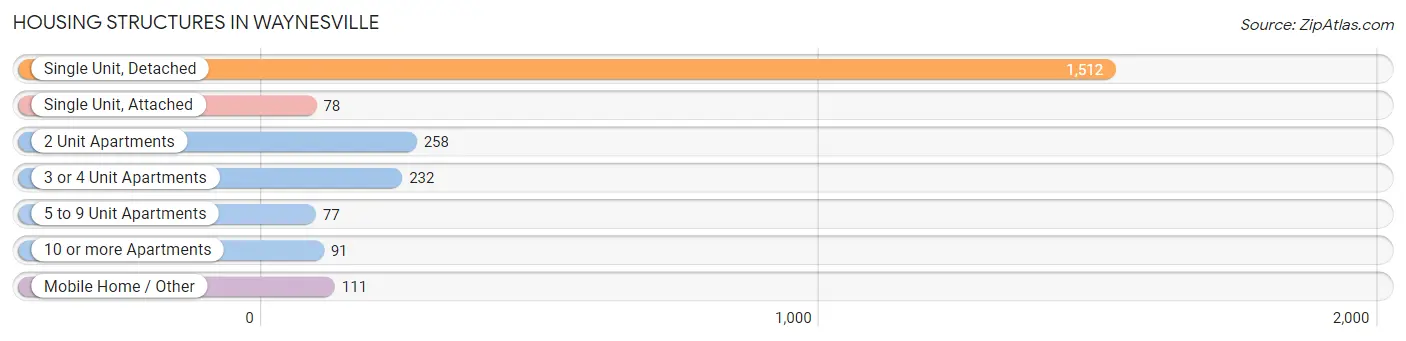
| Structure Type | # Housing Units | % Housing Units |
| Single Unit, Detached | 1,512 | 64.1% |
| Single Unit, Attached | 78 | 3.3% |
| 2 Unit Apartments | 258 | 10.9% |
| 3 or 4 Unit Apartments | 232 | 9.8% |
| 5 to 9 Unit Apartments | 77 | 3.3% |
| 10 or more Apartments | 91 | 3.9% |
| Mobile Home / Other | 111 | 4.7% |
| Total | 2,359 | 100.0% |
Housing Structures by Occupancy in Waynesville
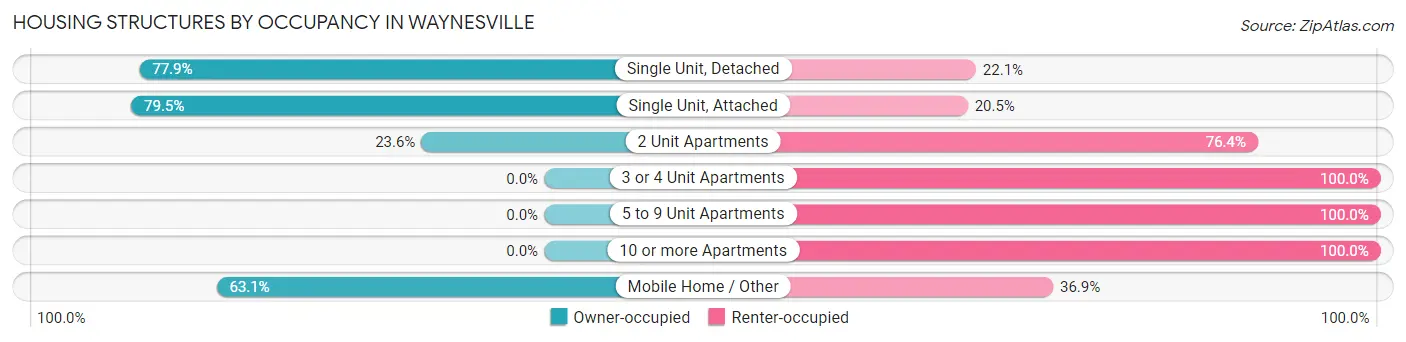
| Structure Type | Owner-occupied | Renter-occupied |
| Single Unit, Detached | 1,178 (77.9%) | 334 (22.1%) |
| Single Unit, Attached | 62 (79.5%) | 16 (20.5%) |
| 2 Unit Apartments | 61 (23.6%) | 197 (76.4%) |
| 3 or 4 Unit Apartments | 0 (0.0%) | 232 (100.0%) |
| 5 to 9 Unit Apartments | 0 (0.0%) | 77 (100.0%) |
| 10 or more Apartments | 0 (0.0%) | 91 (100.0%) |
| Mobile Home / Other | 70 (63.1%) | 41 (36.9%) |
| Total | 1,371 (58.1%) | 988 (41.9%) |
Housing Structures by Number of Rooms in Waynesville
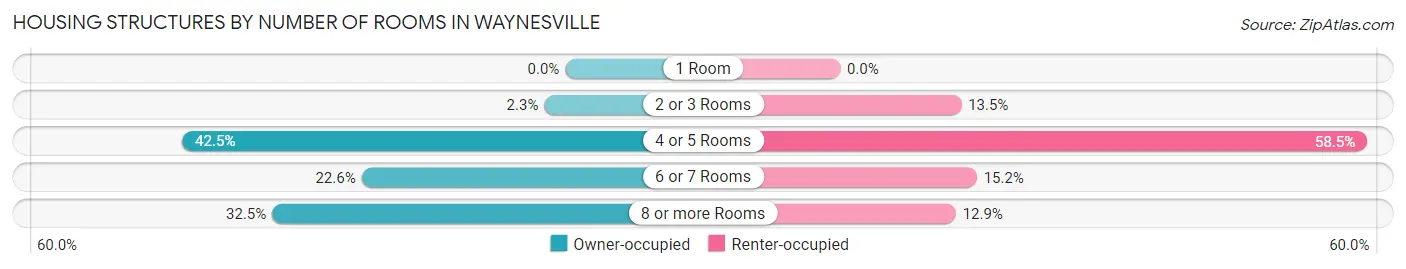
| Number of Rooms | Owner-occupied | Renter-occupied |
| 1 Room | 0 (0.0%) | 0 (0.0%) |
| 2 or 3 Rooms | 32 (2.3%) | 133 (13.5%) |
| 4 or 5 Rooms | 583 (42.5%) | 578 (58.5%) |
| 6 or 7 Rooms | 310 (22.6%) | 150 (15.2%) |
| 8 or more Rooms | 446 (32.5%) | 127 (12.9%) |
| Total | 1,371 (100.0%) | 988 (100.0%) |
Housing Structure by Heating Type in Waynesville
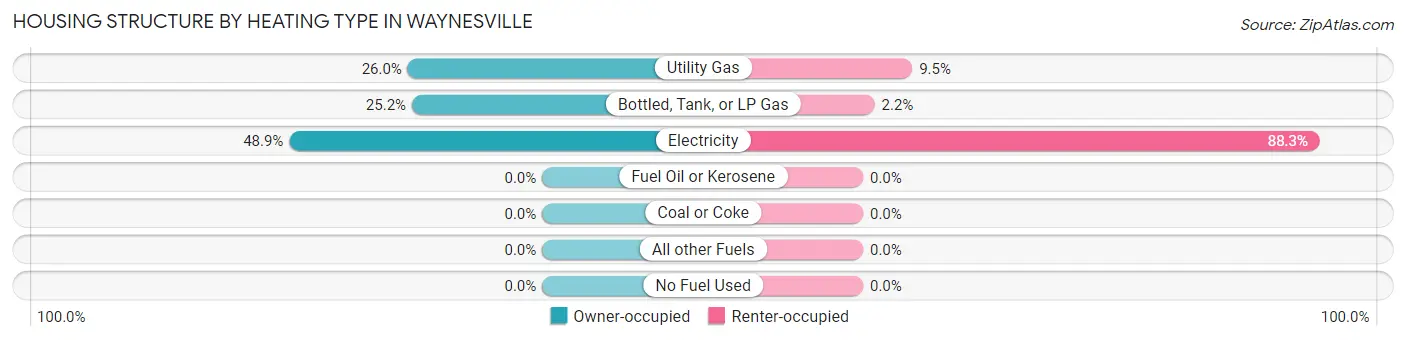
| Heating Type | Owner-occupied | Renter-occupied |
| Utility Gas | 356 (26.0%) | 94 (9.5%) |
| Bottled, Tank, or LP Gas | 345 (25.2%) | 22 (2.2%) |
| Electricity | 670 (48.9%) | 872 (88.3%) |
| Fuel Oil or Kerosene | 0 (0.0%) | 0 (0.0%) |
| Coal or Coke | 0 (0.0%) | 0 (0.0%) |
| All other Fuels | 0 (0.0%) | 0 (0.0%) |
| No Fuel Used | 0 (0.0%) | 0 (0.0%) |
| Total | 1,371 (100.0%) | 988 (100.0%) |
Household Vehicle Usage in Waynesville
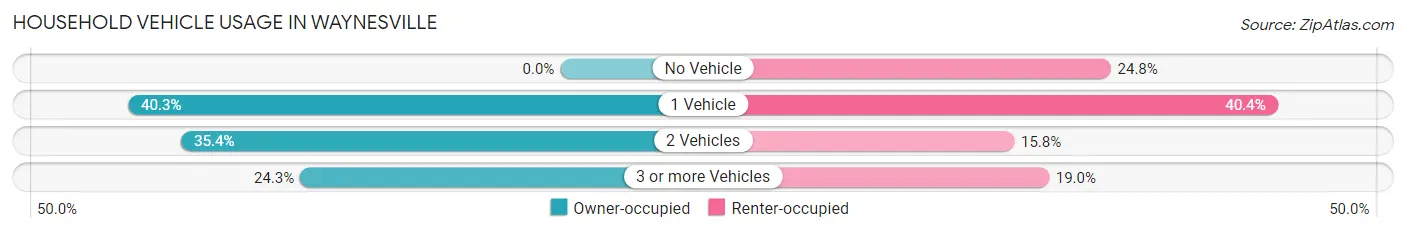
| Vehicles per Household | Owner-occupied | Renter-occupied |
| No Vehicle | 0 (0.0%) | 245 (24.8%) |
| 1 Vehicle | 553 (40.3%) | 399 (40.4%) |
| 2 Vehicles | 485 (35.4%) | 156 (15.8%) |
| 3 or more Vehicles | 333 (24.3%) | 188 (19.0%) |
| Total | 1,371 (100.0%) | 988 (100.0%) |
Real Estate & Mortgages in Waynesville
Real Estate and Mortgage Overview in Waynesville
| Characteristic | Without Mortgage | With Mortgage |
| Housing Units | 610 | 761 |
| Median Property Value | $108,800 | $213,200 |
| Median Household Income | - | - |
| Monthly Housing Costs | $471 | $0 |
| Real Estate Taxes | $741 | $0 |
Property Value by Mortgage Status in Waynesville
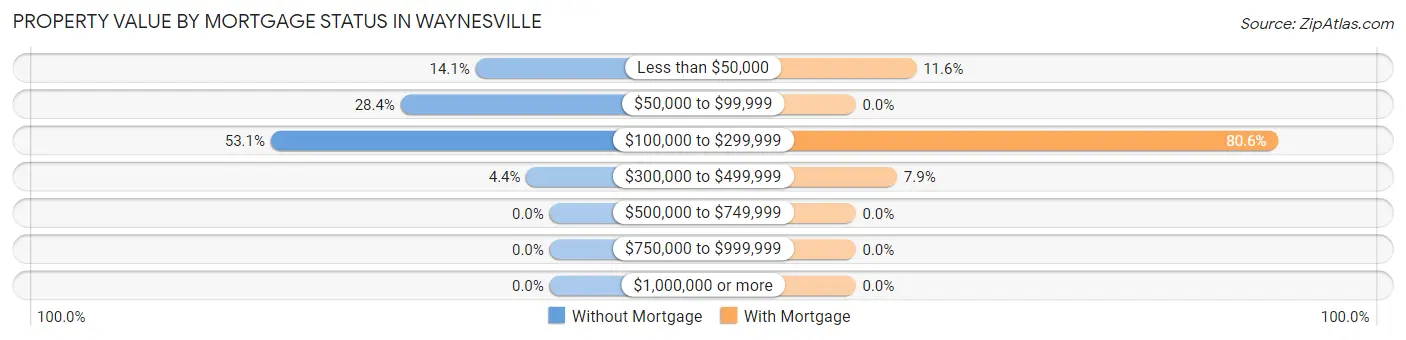
| Property Value | Without Mortgage | With Mortgage |
| Less than $50,000 | 86 (14.1%) | 88 (11.6%) |
| $50,000 to $99,999 | 173 (28.4%) | 0 (0.0%) |
| $100,000 to $299,999 | 324 (53.1%) | 613 (80.5%) |
| $300,000 to $499,999 | 27 (4.4%) | 60 (7.9%) |
| $500,000 to $749,999 | 0 (0.0%) | 0 (0.0%) |
| $750,000 to $999,999 | 0 (0.0%) | 0 (0.0%) |
| $1,000,000 or more | 0 (0.0%) | 0 (0.0%) |
| Total | 610 (100.0%) | 761 (100.0%) |
Household Income by Mortgage Status in Waynesville
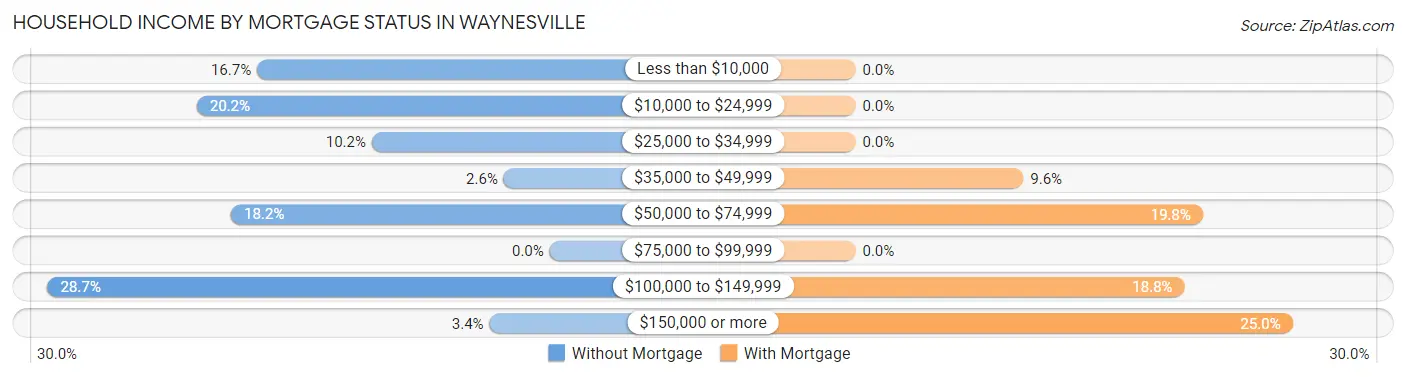
| Household Income | Without Mortgage | With Mortgage |
| Less than $10,000 | 102 (16.7%) | 0 (0.0%) |
| $10,000 to $24,999 | 123 (20.2%) | 0 (0.0%) |
| $25,000 to $34,999 | 62 (10.2%) | 0 (0.0%) |
| $35,000 to $49,999 | 16 (2.6%) | 73 (9.6%) |
| $50,000 to $74,999 | 111 (18.2%) | 151 (19.8%) |
| $75,000 to $99,999 | 0 (0.0%) | 0 (0.0%) |
| $100,000 to $149,999 | 175 (28.7%) | 143 (18.8%) |
| $150,000 or more | 21 (3.4%) | 190 (25.0%) |
| Total | 610 (100.0%) | 761 (100.0%) |
Property Value to Household Income Ratio in Waynesville
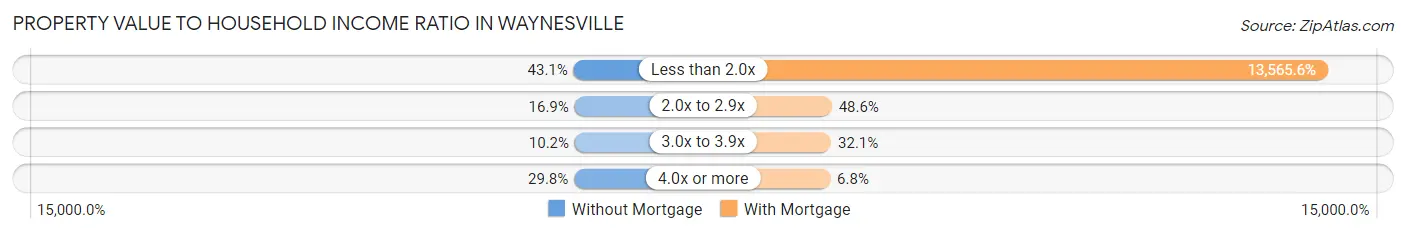
| Value-to-Income Ratio | Without Mortgage | With Mortgage |
| Less than 2.0x | 263 (43.1%) | 103,234 (13,565.6%) |
| 2.0x to 2.9x | 103 (16.9%) | 370 (48.6%) |
| 3.0x to 3.9x | 62 (10.2%) | 244 (32.1%) |
| 4.0x or more | 182 (29.8%) | 52 (6.8%) |
| Total | 610 (100.0%) | 761 (100.0%) |
Real Estate Taxes by Mortgage Status in Waynesville
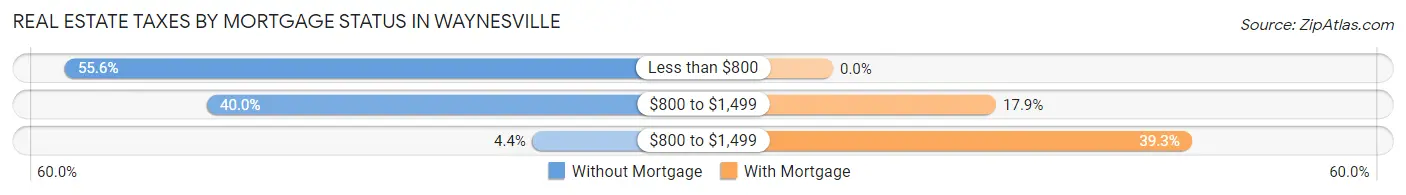
| Property Taxes | Without Mortgage | With Mortgage |
| Less than $800 | 339 (55.6%) | 0 (0.0%) |
| $800 to $1,499 | 244 (40.0%) | 136 (17.9%) |
| $800 to $1,499 | 27 (4.4%) | 299 (39.3%) |
| Total | 610 (100.0%) | 761 (100.0%) |
Health & Disability in Waynesville
Health Insurance Coverage by Age in Waynesville
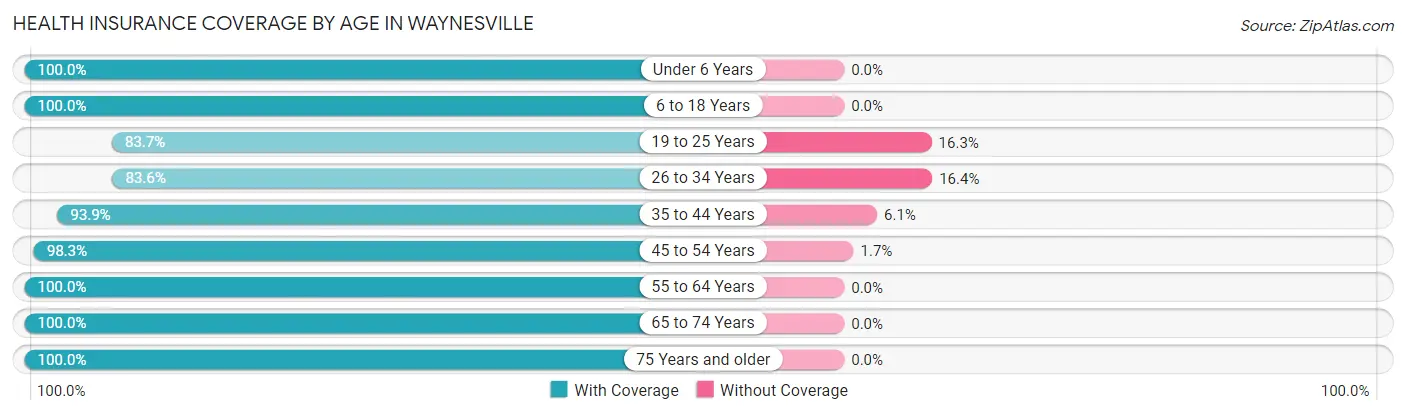
| Age Bracket | With Coverage | Without Coverage |
| Under 6 Years | 339 (100.0%) | 0 (0.0%) |
| 6 to 18 Years | 747 (100.0%) | 0 (0.0%) |
| 19 to 25 Years | 406 (83.7%) | 79 (16.3%) |
| 26 to 34 Years | 683 (83.6%) | 134 (16.4%) |
| 35 to 44 Years | 491 (93.9%) | 32 (6.1%) |
| 45 to 54 Years | 568 (98.3%) | 10 (1.7%) |
| 55 to 64 Years | 379 (100.0%) | 0 (0.0%) |
| 65 to 74 Years | 424 (100.0%) | 0 (0.0%) |
| 75 Years and older | 548 (100.0%) | 0 (0.0%) |
| Total | 4,585 (94.7%) | 255 (5.3%) |
Health Insurance Coverage by Citizenship Status in Waynesville
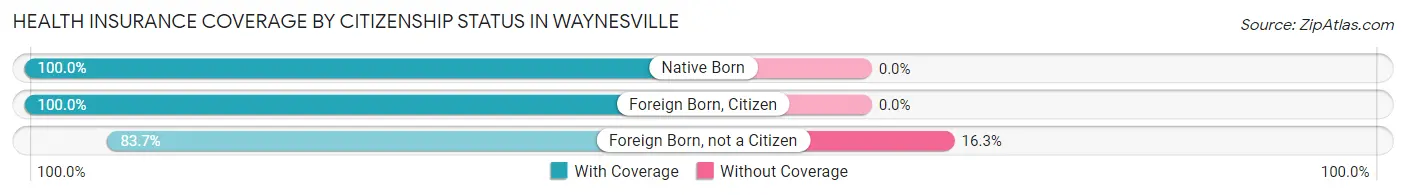
| Citizenship Status | With Coverage | Without Coverage |
| Native Born | 339 (100.0%) | 0 (0.0%) |
| Foreign Born, Citizen | 747 (100.0%) | 0 (0.0%) |
| Foreign Born, not a Citizen | 406 (83.7%) | 79 (16.3%) |
Health Insurance Coverage by Household Income in Waynesville
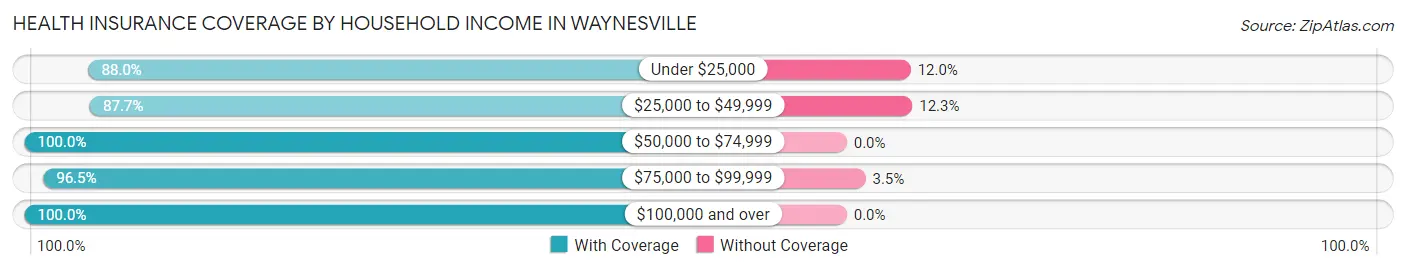
| Household Income | With Coverage | Without Coverage |
| Under $25,000 | 544 (88.0%) | 74 (12.0%) |
| $25,000 to $49,999 | 1,064 (87.7%) | 149 (12.3%) |
| $50,000 to $74,999 | 254 (100.0%) | 0 (0.0%) |
| $75,000 to $99,999 | 879 (96.5%) | 32 (3.5%) |
| $100,000 and over | 1,844 (100.0%) | 0 (0.0%) |
Public vs Private Health Insurance Coverage by Age in Waynesville
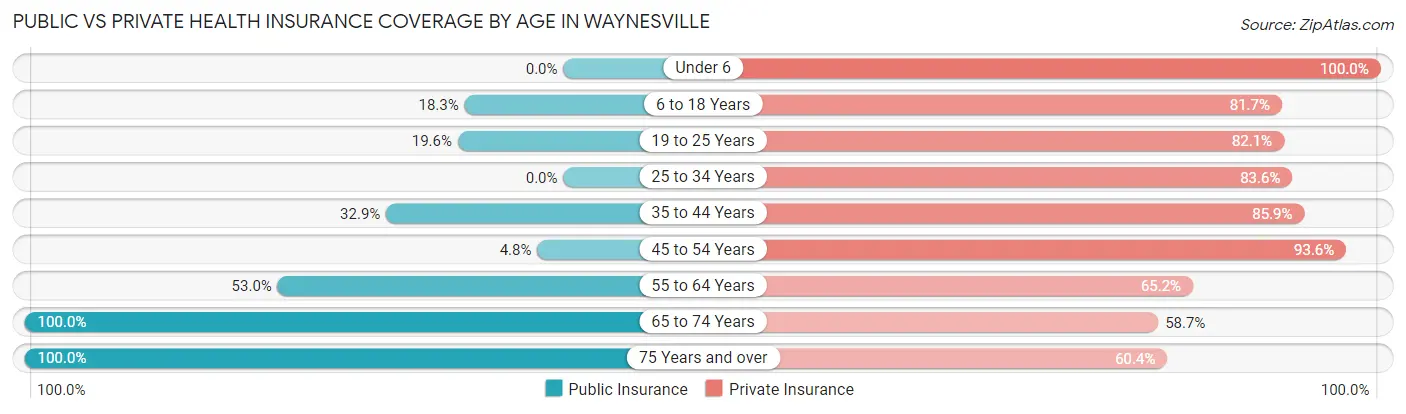
| Age Bracket | Public Insurance | Private Insurance |
| Under 6 | 0 (0.0%) | 339 (100.0%) |
| 6 to 18 Years | 137 (18.3%) | 610 (81.7%) |
| 19 to 25 Years | 95 (19.6%) | 398 (82.1%) |
| 25 to 34 Years | 0 (0.0%) | 683 (83.6%) |
| 35 to 44 Years | 172 (32.9%) | 449 (85.9%) |
| 45 to 54 Years | 28 (4.8%) | 541 (93.6%) |
| 55 to 64 Years | 201 (53.0%) | 247 (65.2%) |
| 65 to 74 Years | 424 (100.0%) | 249 (58.7%) |
| 75 Years and over | 548 (100.0%) | 331 (60.4%) |
| Total | 1,605 (33.2%) | 3,847 (79.5%) |
Disability Status by Sex by Age in Waynesville
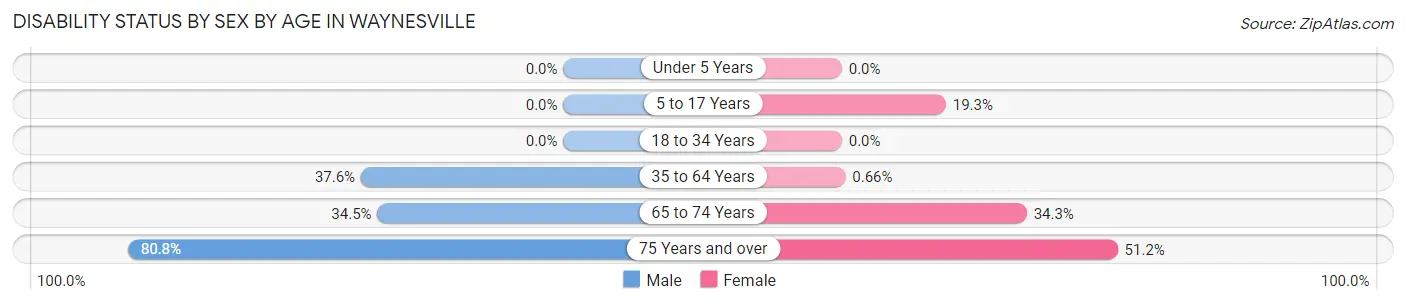
| Age Bracket | Male | Female |
| Under 5 Years | 0 (0.0%) | 0 (0.0%) |
| 5 to 17 Years | 0 (0.0%) | 105 (19.3%) |
| 18 to 34 Years | 0 (0.0%) | 0 (0.0%) |
| 35 to 64 Years | 272 (37.6%) | 5 (0.7%) |
| 65 to 74 Years | 88 (34.5%) | 58 (34.3%) |
| 75 Years and over | 173 (80.8%) | 171 (51.2%) |
Disability Class by Sex by Age in Waynesville
Disability Class: Hearing Difficulty
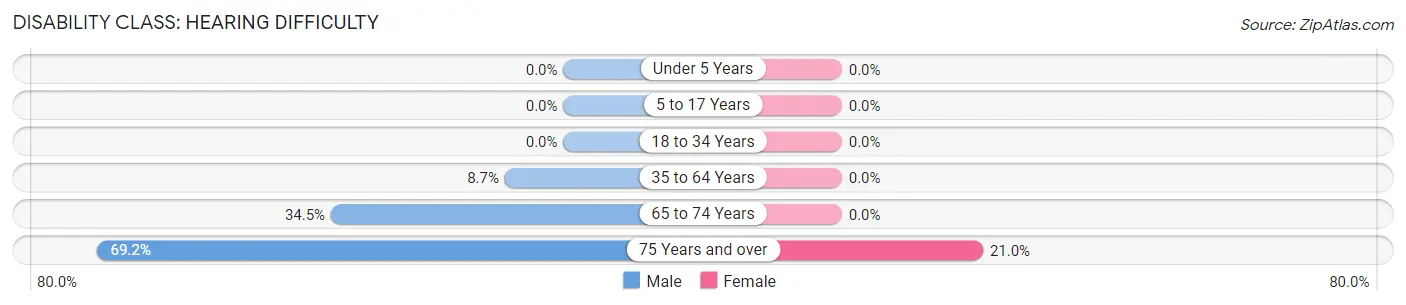
| Age Bracket | Male | Female |
| Under 5 Years | 0 (0.0%) | 0 (0.0%) |
| 5 to 17 Years | 0 (0.0%) | 0 (0.0%) |
| 18 to 34 Years | 0 (0.0%) | 0 (0.0%) |
| 35 to 64 Years | 63 (8.7%) | 0 (0.0%) |
| 65 to 74 Years | 88 (34.5%) | 0 (0.0%) |
| 75 Years and over | 148 (69.2%) | 70 (21.0%) |
Disability Class: Vision Difficulty
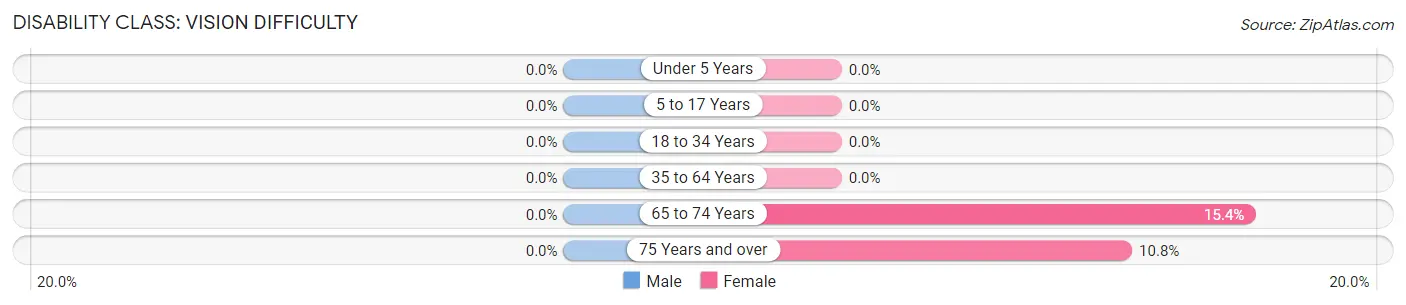
| Age Bracket | Male | Female |
| Under 5 Years | 0 (0.0%) | 0 (0.0%) |
| 5 to 17 Years | 0 (0.0%) | 0 (0.0%) |
| 18 to 34 Years | 0 (0.0%) | 0 (0.0%) |
| 35 to 64 Years | 0 (0.0%) | 0 (0.0%) |
| 65 to 74 Years | 0 (0.0%) | 26 (15.4%) |
| 75 Years and over | 0 (0.0%) | 36 (10.8%) |
Disability Class: Cognitive Difficulty
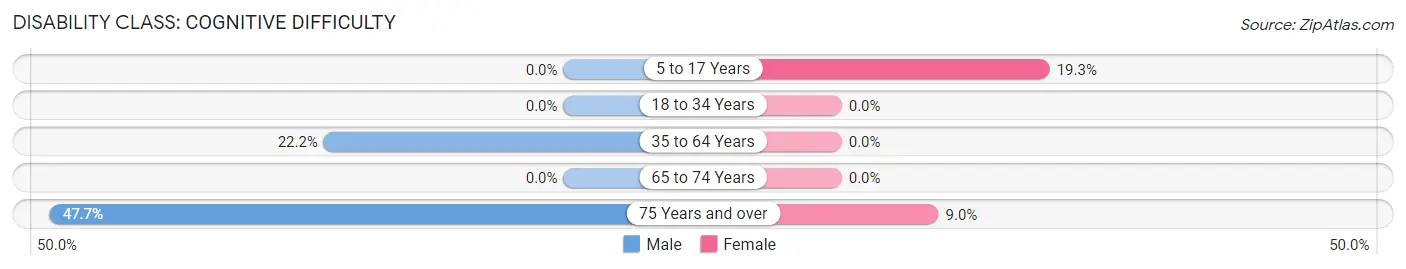
| Age Bracket | Male | Female |
| 5 to 17 Years | 0 (0.0%) | 105 (19.3%) |
| 18 to 34 Years | 0 (0.0%) | 0 (0.0%) |
| 35 to 64 Years | 161 (22.2%) | 0 (0.0%) |
| 65 to 74 Years | 0 (0.0%) | 0 (0.0%) |
| 75 Years and over | 102 (47.7%) | 30 (9.0%) |
Disability Class: Ambulatory Difficulty
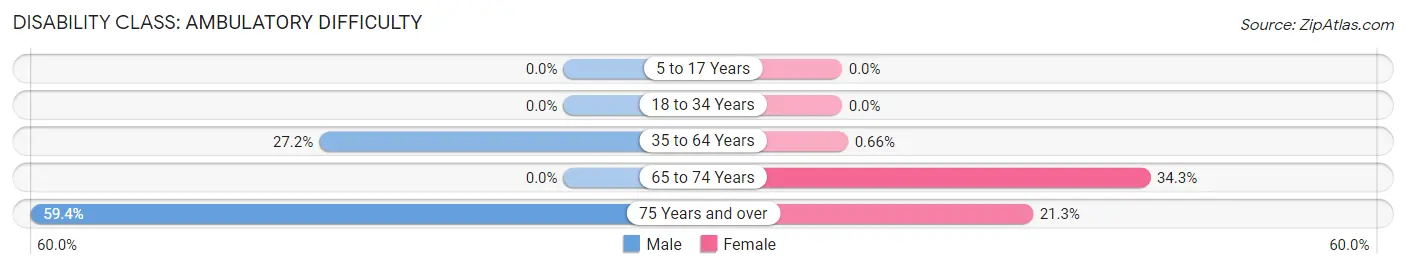
| Age Bracket | Male | Female |
| 5 to 17 Years | 0 (0.0%) | 0 (0.0%) |
| 18 to 34 Years | 0 (0.0%) | 0 (0.0%) |
| 35 to 64 Years | 197 (27.2%) | 5 (0.7%) |
| 65 to 74 Years | 0 (0.0%) | 58 (34.3%) |
| 75 Years and over | 127 (59.4%) | 71 (21.3%) |
Disability Class: Self-Care Difficulty
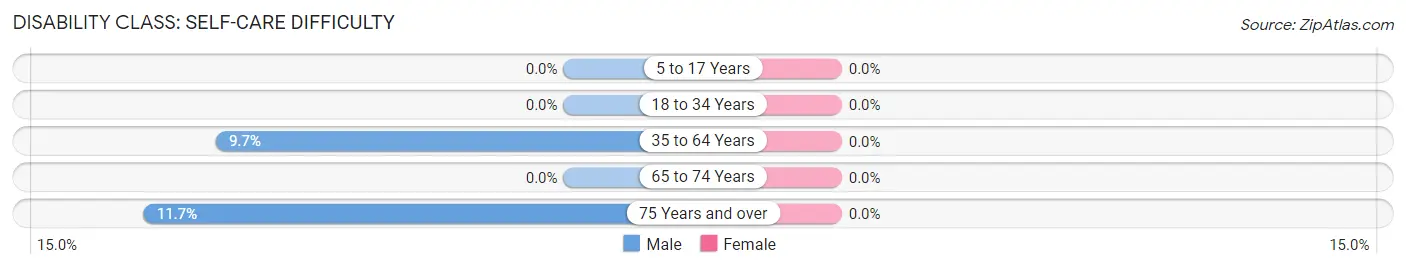
| Age Bracket | Male | Female |
| 5 to 17 Years | 0 (0.0%) | 0 (0.0%) |
| 18 to 34 Years | 0 (0.0%) | 0 (0.0%) |
| 35 to 64 Years | 70 (9.7%) | 0 (0.0%) |
| 65 to 74 Years | 0 (0.0%) | 0 (0.0%) |
| 75 Years and over | 25 (11.7%) | 0 (0.0%) |
Technology Access in Waynesville
Computing Device Access in Waynesville
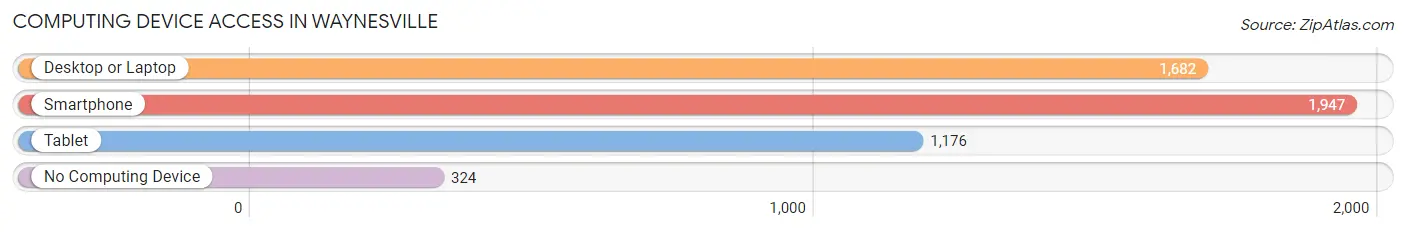
| Device Type | # Households | % Households |
| Desktop or Laptop | 1,682 | 71.3% |
| Smartphone | 1,947 | 82.5% |
| Tablet | 1,176 | 49.8% |
| No Computing Device | 324 | 13.7% |
| Total | 2,359 | 100.0% |
Internet Access in Waynesville
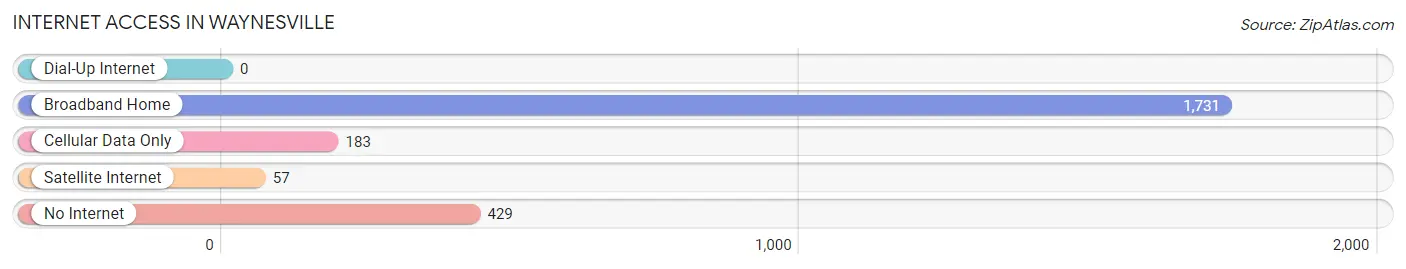
| Internet Type | # Households | % Households |
| Dial-Up Internet | 0 | 0.0% |
| Broadband Home | 1,731 | 73.4% |
| Cellular Data Only | 183 | 7.8% |
| Satellite Internet | 57 | 2.4% |
| No Internet | 429 | 18.2% |
| Total | 2,359 | 100.0% |
Waynesville Summary
Waynesville, Missouri is a small city located in Pulaski County, Missouri. It is the county seat of Pulaski County and is located in the Ozark Mountains. The city has a population of 5,711 as of the 2010 census.
History
Waynesville was founded in 1818 by William Wayne, a Revolutionary War veteran. The city was named after him and was originally known as Waynesville Court House. The city was incorporated in 1859 and was the first county seat of Pulaski County.
The city was a major stop on the Butterfield Overland Mail route, which ran from St. Louis to San Francisco. The route was established in 1858 and ran through Waynesville until 1861 when the Civil War began.
During the Civil War, Waynesville was the site of several battles. The Battle of Waynesville was fought in 1862 and resulted in a Confederate victory. The Battle of Waynesville was the last major battle in the state of Missouri.
Geography
Waynesville is located in the Ozark Mountains in Pulaski County, Missouri. The city is situated at the intersection of Interstate 44 and U.S. Route 66. The city is located about 60 miles south of Springfield, Missouri and about 100 miles north of Little Rock, Arkansas.
The city has a total area of 4.2 square miles, all of which is land. The city is located at an elevation of 1,068 feet above sea level.
Economy
Waynesville’s economy is largely based on tourism and agriculture. The city is home to several tourist attractions, including the Waynesville-St. Robert Regional Airport, the Pulaski County Museum, and the Waynesville-St. Robert Chamber of Commerce.
Agriculture is also an important part of the local economy. The city is home to several farms, including cattle, poultry, and hog farms.
Demographics
As of the 2010 census, the population of Waynesville was 5,711. The racial makeup of the city was 95.3% White, 1.2% African American, 0.7% Native American, 0.4% Asian, 0.1% Pacific Islander, 0.7% from other races, and 1.6% from two or more races. Hispanic or Latino of any race were 2.2% of the population.
The median income for a household in the city was $35,938, and the median income for a family was $41,944. The per capita income for the city was $17,845. About 15.2% of families and 18.2% of the population were below the poverty line, including 25.2% of those under age 18 and 11.2% of those age 65 or over.
Conclusion
Waynesville, Missouri is a small city located in Pulaski County, Missouri. It is the county seat of Pulaski County and is located in the Ozark Mountains. The city has a population of 5,711 as of the 2010 census. Waynesville was founded in 1818 by William Wayne, a Revolutionary War veteran. The city was a major stop on the Butterfield Overland Mail route and was the site of several battles during the Civil War. The city’s economy is largely based on tourism and agriculture. The racial makeup of the city is 95.3% White, 1.2% African American, 0.7% Native American, 0.4% Asian, 0.1% Pacific Islander, 0.7% from other races, and 1.6% from two or more races. The median income for a household in the city was $35,938, and the median income for a family was $41,944. About 15.2% of families and 18.2% of the population were below the poverty line.
Common Questions
What is Per Capita Income in Waynesville?
Per Capita income in Waynesville is $32,890.
What is the Median Family Income in Waynesville?
Median Family Income in Waynesville is $103,164.
What is the Median Household income in Waynesville?
Median Household Income in Waynesville is $47,193.
What is Income or Wage Gap in Waynesville?
Income or Wage Gap in Waynesville is 20.1%.
Women in Waynesville earn 79.9 cents for every dollar earned by a man.
What is Inequality or Gini Index in Waynesville?
Inequality or Gini Index in Waynesville is 0.41.
What is the Total Population of Waynesville?
Total Population of Waynesville is 5,372.
What is the Total Male Population of Waynesville?
Total Male Population of Waynesville is 2,665.
What is the Total Female Population of Waynesville?
Total Female Population of Waynesville is 2,707.
What is the Ratio of Males per 100 Females in Waynesville?
There are 98.45 Males per 100 Females in Waynesville.
What is the Ratio of Females per 100 Males in Waynesville?
There are 101.58 Females per 100 Males in Waynesville.
What is the Median Population Age in Waynesville?
Median Population Age in Waynesville is 34.3 Years.
What is the Average Family Size in Waynesville
Average Family Size in Waynesville is 2.6 People.
What is the Average Household Size in Waynesville
Average Household Size in Waynesville is 2.2 People.
How Large is the Labor Force in Waynesville?
There are 2,868 People in the Labor Forcein in Waynesville.
What is the Percentage of People in the Labor Force in Waynesville?
65.5% of People are in the Labor Force in Waynesville.
What is the Unemployment Rate in Waynesville?
Unemployment Rate in Waynesville is 5.2%.