Ocean Springs, MS Map & Demographics
Ocean Springs Map
Ocean Springs Overview
$41,076
PER CAPITA INCOME
$97,522
AVG FAMILY INCOME
$72,500
AVG HOUSEHOLD INCOME
44.7%
WAGE / INCOME GAP [ % ]
55.3¢/ $1
WAGE / INCOME GAP [ $ ]
0.42
INEQUALITY / GINI INDEX
18,417
TOTAL POPULATION
9,377
MALE POPULATION
9,040
FEMALE POPULATION
103.73
MALES / 100 FEMALES
96.41
FEMALES / 100 MALES
41.5
MEDIAN AGE
3.0
AVG FAMILY SIZE
2.3
AVG HOUSEHOLD SIZE
9,089
LABOR FORCE [ PEOPLE ]
61.6%
PERCENT IN LABOR FORCE
4.1%
UNEMPLOYMENT RATE
Ocean Springs Zip Codes
Ocean Springs Area Codes
Income in Ocean Springs
Income Overview in Ocean Springs
Per Capita Income in Ocean Springs is $41,076, while median incomes of families and households are $97,522 and $72,500 respectively.
| Characteristic | Number | Measure |
| Per Capita Income | 18,417 | $41,076 |
| Median Family Income | 5,005 | $97,522 |
| Mean Family Income | 5,005 | $113,352 |
| Median Household Income | 7,902 | $72,500 |
| Mean Household Income | 7,902 | $92,694 |
| Income Deficit | 5,005 | $0 |
| Wage / Income Gap (%) | 18,417 | 44.71% |
| Wage / Income Gap ($) | 18,417 | 55.29¢ per $1 |
| Gini / Inequality Index | 18,417 | 0.42 |
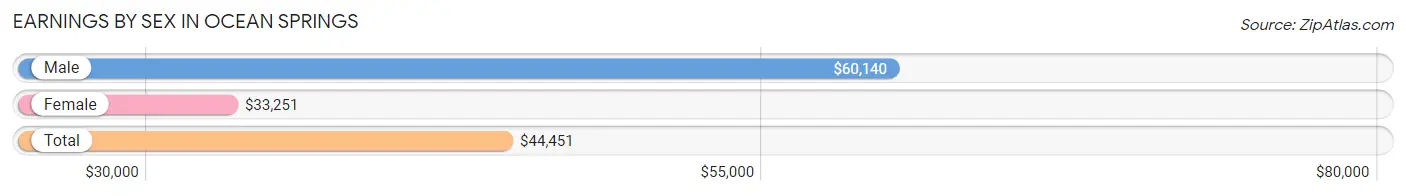
Earnings by Sex in Ocean Springs
Average Earnings in Ocean Springs are $44,451, $60,140 for men and $33,251 for women, a difference of 44.7%.
| Sex | Number | Average Earnings |
| Male | 5,360 (56.0%) | $60,140 |
| Female | 4,207 (44.0%) | $33,251 |
| Total | 9,567 (100.0%) | $44,451 |
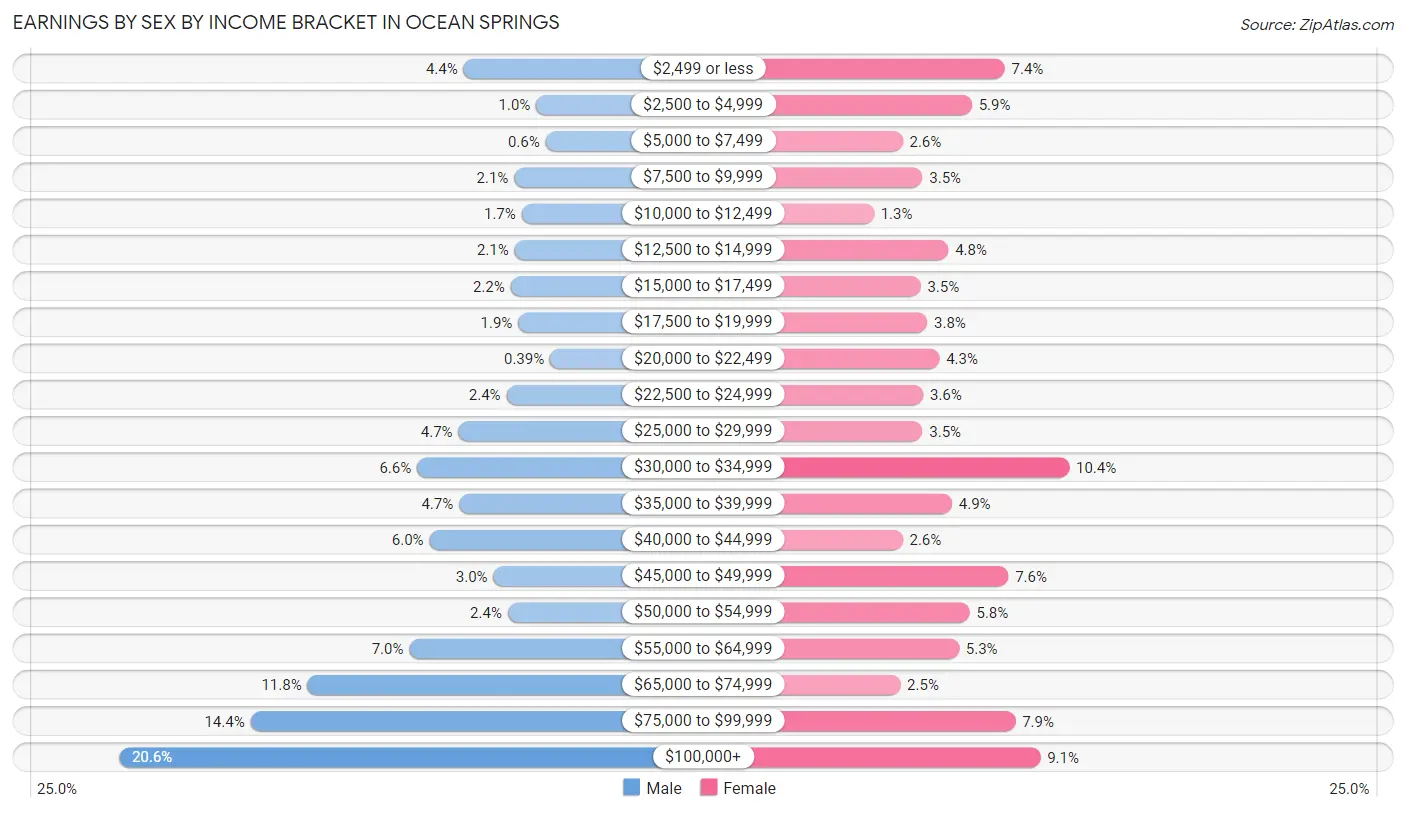
Earnings by Sex by Income Bracket in Ocean Springs
The most common earnings brackets in Ocean Springs are $100,000+ for men (1,103 | 20.6%) and $30,000 to $34,999 for women (438 | 10.4%).
| Income | Male | Female |
| $2,499 or less | 238 (4.4%) | 311 (7.4%) |
| $2,500 to $4,999 | 56 (1.0%) | 246 (5.9%) |
| $5,000 to $7,499 | 32 (0.6%) | 110 (2.6%) |
| $7,500 to $9,999 | 111 (2.1%) | 149 (3.5%) |
| $10,000 to $12,499 | 92 (1.7%) | 53 (1.3%) |
| $12,500 to $14,999 | 110 (2.1%) | 200 (4.8%) |
| $15,000 to $17,499 | 120 (2.2%) | 145 (3.5%) |
| $17,500 to $19,999 | 101 (1.9%) | 158 (3.8%) |
| $20,000 to $22,499 | 21 (0.4%) | 182 (4.3%) |
| $22,500 to $24,999 | 130 (2.4%) | 150 (3.6%) |
| $25,000 to $29,999 | 251 (4.7%) | 149 (3.5%) |
| $30,000 to $34,999 | 355 (6.6%) | 438 (10.4%) |
| $35,000 to $39,999 | 249 (4.6%) | 207 (4.9%) |
| $40,000 to $44,999 | 324 (6.0%) | 110 (2.6%) |
| $45,000 to $49,999 | 163 (3.0%) | 318 (7.6%) |
| $50,000 to $54,999 | 127 (2.4%) | 242 (5.8%) |
| $55,000 to $64,999 | 374 (7.0%) | 221 (5.2%) |
| $65,000 to $74,999 | 630 (11.7%) | 105 (2.5%) |
| $75,000 to $99,999 | 773 (14.4%) | 332 (7.9%) |
| $100,000+ | 1,103 (20.6%) | 381 (9.1%) |
| Total | 5,360 (100.0%) | 4,207 (100.0%) |
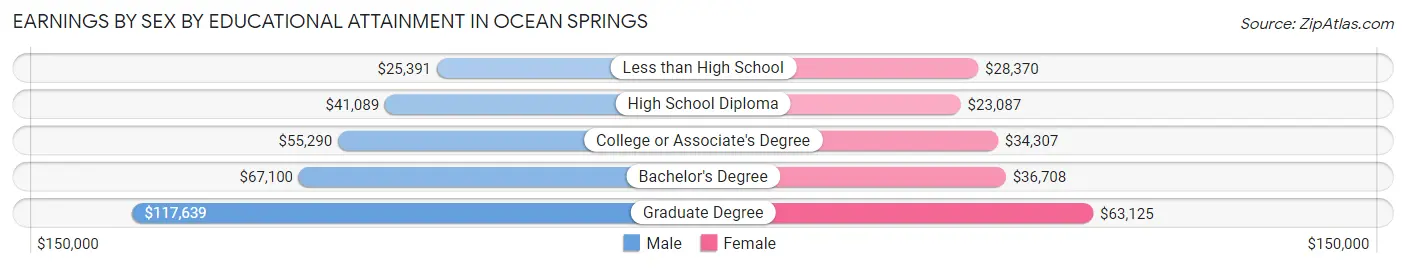
Earnings by Sex by Educational Attainment in Ocean Springs
Average earnings in Ocean Springs are $64,712 for men and $37,136 for women, a difference of 42.6%. Men with an educational attainment of graduate degree enjoy the highest average annual earnings of $117,639, while those with less than high school education earn the least with $25,391. Women with an educational attainment of graduate degree earn the most with the average annual earnings of $63,125, while those with high school diploma education have the smallest earnings of $23,087.
| Educational Attainment | Male Income | Female Income |
| Less than High School | $25,391 | $28,370 |
| High School Diploma | $41,089 | $23,087 |
| College or Associate's Degree | $55,290 | $34,307 |
| Bachelor's Degree | $67,100 | $36,708 |
| Graduate Degree | $117,639 | $63,125 |
| Total | $64,712 | $37,136 |
Family Income in Ocean Springs
Family Income Brackets in Ocean Springs
According to the Ocean Springs family income data, there are 1,156 families falling into the $100,000 to $149,999 income range, which is the most common income bracket and makes up 23.1% of all families. Conversely, the $15,000 to $24,999 income bracket is the least frequent group with only 45 families (0.9%) belonging to this category.
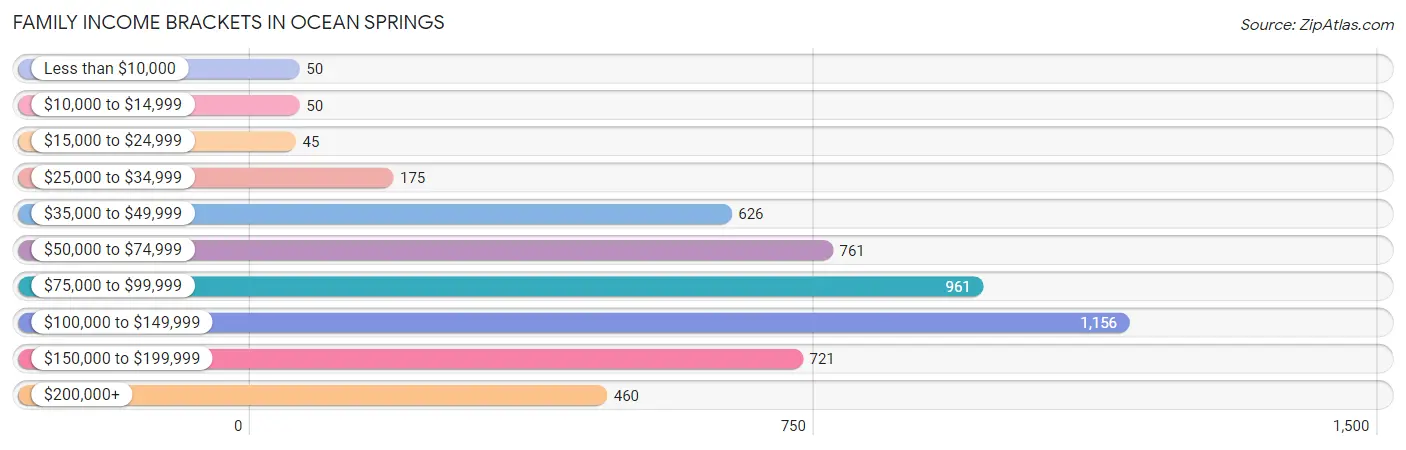
| Income Bracket | # Families | % Families |
| Less than $10,000 | 50 | 1.0% |
| $10,000 to $14,999 | 50 | 1.0% |
| $15,000 to $24,999 | 45 | 0.9% |
| $25,000 to $34,999 | 175 | 3.5% |
| $35,000 to $49,999 | 626 | 12.5% |
| $50,000 to $74,999 | 761 | 15.2% |
| $75,000 to $99,999 | 961 | 19.2% |
| $100,000 to $149,999 | 1,156 | 23.1% |
| $150,000 to $199,999 | 721 | 14.4% |
| $200,000+ | 460 | 9.2% |
Family Income by Famaliy Size in Ocean Springs
6-person families (48 | 1.0%) account for the highest median family income in Ocean Springs with $138,333 per family, while 2-person families (2,465 | 49.2%) have the highest median income of $45,306 per family member.
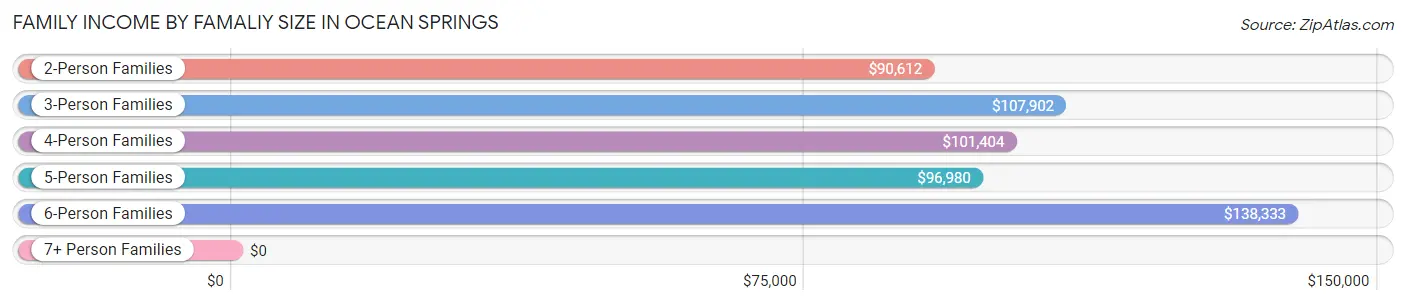
| Income Bracket | # Families | Median Income |
| 2-Person Families | 2,465 (49.2%) | $90,612 |
| 3-Person Families | 1,163 (23.2%) | $107,902 |
| 4-Person Families | 825 (16.5%) | $101,404 |
| 5-Person Families | 498 (10.0%) | $96,980 |
| 6-Person Families | 48 (1.0%) | $138,333 |
| 7+ Person Families | 6 (0.1%) | $0 |
| Total | 5,005 (100.0%) | $97,522 |
Family Income by Number of Earners in Ocean Springs
The median family income in Ocean Springs is $97,522, with families comprising 3+ earners (330) having the highest median family income of $146,857, while families with no earners (884) have the lowest median family income of $65,172, accounting for 6.6% and 17.7% of families, respectively.
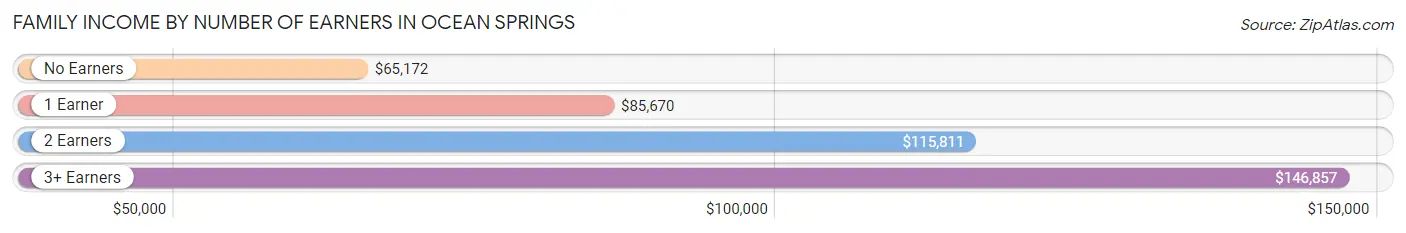
| Number of Earners | # Families | Median Income |
| No Earners | 884 (17.7%) | $65,172 |
| 1 Earner | 1,699 (34.0%) | $85,670 |
| 2 Earners | 2,092 (41.8%) | $115,811 |
| 3+ Earners | 330 (6.6%) | $146,857 |
| Total | 5,005 (100.0%) | $97,522 |
Household Income in Ocean Springs
Household Income Brackets in Ocean Springs
With 1,280 households falling in the category, the $75,000 to $99,999 income range is the most frequent in Ocean Springs, accounting for 16.2% of all households. In contrast, only 316 households (4.0%) fall into the $10,000 to $14,999 income bracket, making it the least populous group.
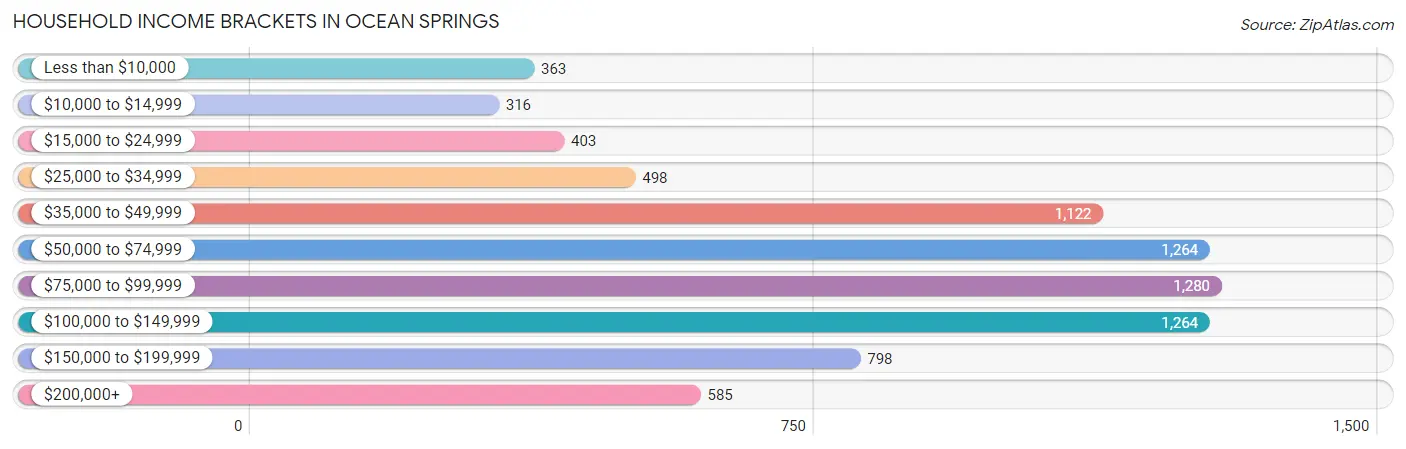
| Income Bracket | # Households | % Households |
| Less than $10,000 | 363 | 4.6% |
| $10,000 to $14,999 | 316 | 4.0% |
| $15,000 to $24,999 | 403 | 5.1% |
| $25,000 to $34,999 | 498 | 6.3% |
| $35,000 to $49,999 | 1,122 | 14.2% |
| $50,000 to $74,999 | 1,264 | 16.0% |
| $75,000 to $99,999 | 1,280 | 16.2% |
| $100,000 to $149,999 | 1,264 | 16.0% |
| $150,000 to $199,999 | 798 | 10.1% |
| $200,000+ | 585 | 7.4% |
Household Income by Householder Age in Ocean Springs
The median household income in Ocean Springs is $72,500, with the highest median household income of $97,555 found in the 45 to 64 years age bracket for the primary householder. A total of 3,015 households (38.2%) fall into this category. Meanwhile, the 15 to 24 years age bracket for the primary householder has the lowest median household income of $0, with 130 households (1.7%) in this group.
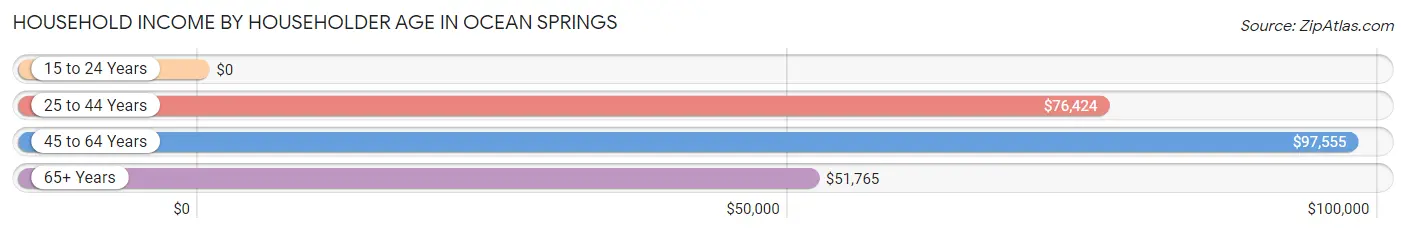
| Income Bracket | # Households | Median Income |
| 15 to 24 Years | 130 (1.7%) | $0 |
| 25 to 44 Years | 2,570 (32.5%) | $76,424 |
| 45 to 64 Years | 3,015 (38.2%) | $97,555 |
| 65+ Years | 2,187 (27.7%) | $51,765 |
| Total | 7,902 (100.0%) | $72,500 |
Poverty in Ocean Springs
Income Below Poverty by Sex and Age in Ocean Springs
With 3.6% poverty level for males and 8.9% for females among the residents of Ocean Springs, under 5 year old males and 5 year old females are the most vulnerable to poverty, with 50 males (10.4%) and 55 females (35.5%) in their respective age groups living below the poverty level.
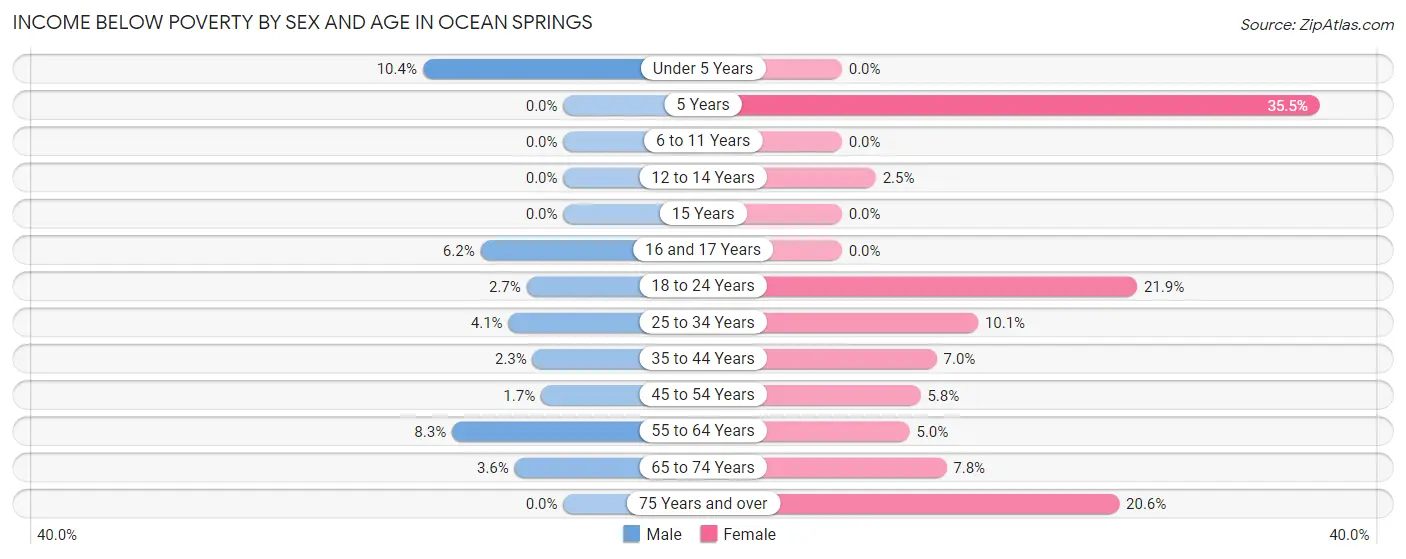
| Age Bracket | Male | Female |
| Under 5 Years | 50 (10.4%) | 0 (0.0%) |
| 5 Years | 0 (0.0%) | 55 (35.5%) |
| 6 to 11 Years | 0 (0.0%) | 0 (0.0%) |
| 12 to 14 Years | 0 (0.0%) | 16 (2.5%) |
| 15 Years | 0 (0.0%) | 0 (0.0%) |
| 16 and 17 Years | 22 (6.1%) | 0 (0.0%) |
| 18 to 24 Years | 13 (2.7%) | 151 (21.9%) |
| 25 to 34 Years | 43 (4.1%) | 83 (10.1%) |
| 35 to 44 Years | 33 (2.3%) | 92 (7.0%) |
| 45 to 54 Years | 19 (1.7%) | 60 (5.8%) |
| 55 to 64 Years | 124 (8.3%) | 61 (5.0%) |
| 65 to 74 Years | 29 (3.6%) | 74 (7.8%) |
| 75 Years and over | 0 (0.0%) | 210 (20.6%) |
| Total | 333 (3.6%) | 802 (8.9%) |
Income Above Poverty by Sex and Age in Ocean Springs
According to the poverty statistics in Ocean Springs, males aged 5 years and females aged under 5 years are the age groups that are most secure financially, with 100.0% of males and 100.0% of females in these age groups living above the poverty line.
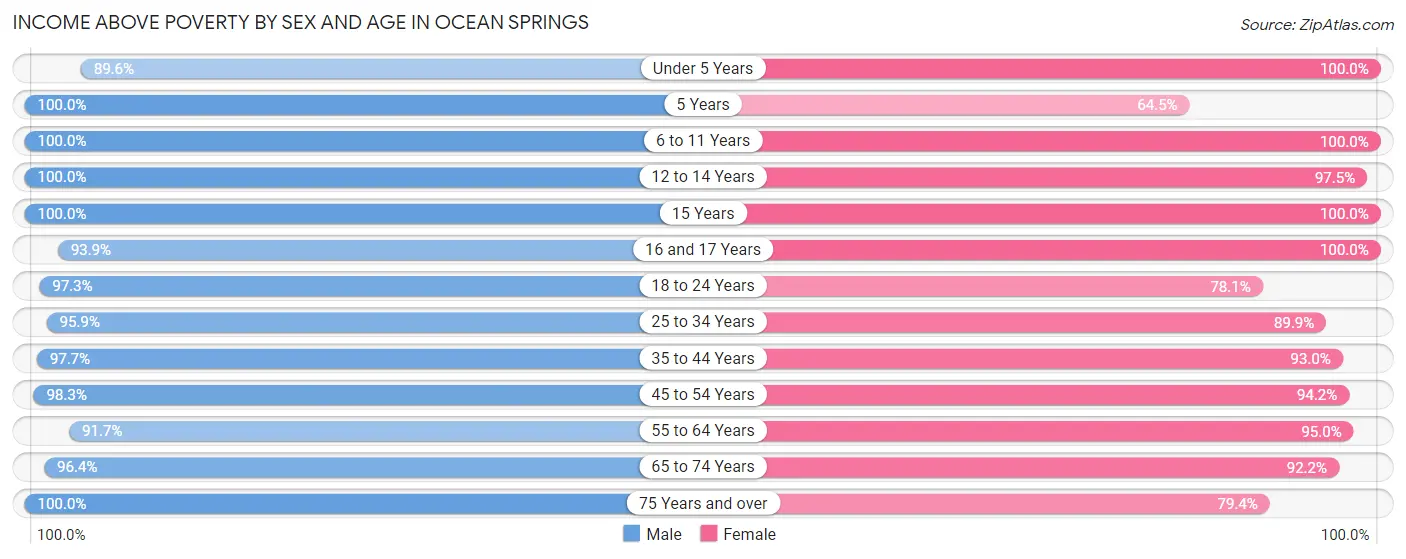
| Age Bracket | Male | Female |
| Under 5 Years | 429 (89.6%) | 202 (100.0%) |
| 5 Years | 61 (100.0%) | 100 (64.5%) |
| 6 to 11 Years | 694 (100.0%) | 621 (100.0%) |
| 12 to 14 Years | 449 (100.0%) | 619 (97.5%) |
| 15 Years | 234 (100.0%) | 85 (100.0%) |
| 16 and 17 Years | 336 (93.9%) | 239 (100.0%) |
| 18 to 24 Years | 463 (97.3%) | 538 (78.1%) |
| 25 to 34 Years | 1,010 (95.9%) | 738 (89.9%) |
| 35 to 44 Years | 1,417 (97.7%) | 1,215 (93.0%) |
| 45 to 54 Years | 1,124 (98.3%) | 967 (94.2%) |
| 55 to 64 Years | 1,375 (91.7%) | 1,152 (95.0%) |
| 65 to 74 Years | 772 (96.4%) | 880 (92.2%) |
| 75 Years and over | 570 (100.0%) | 810 (79.4%) |
| Total | 8,934 (96.4%) | 8,166 (91.1%) |
Income Below Poverty Among Married-Couple Families in Ocean Springs
The poverty statistics for married-couple families in Ocean Springs show that 0.9% or 33 of the total 3,681 families live below the poverty line. Families with no children have the highest poverty rate of 1.6%, comprising of 33 families. On the other hand, families with 1 or 2 children have the lowest poverty rate of 0.0%, which includes 0 families.
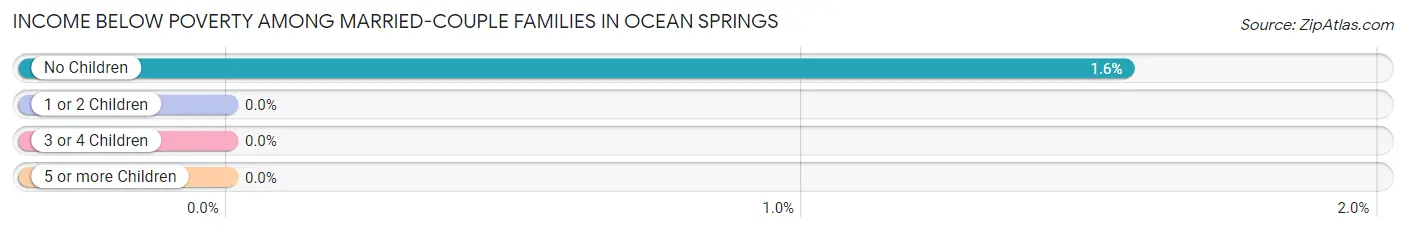
| Children | Above Poverty | Below Poverty |
| No Children | 2,080 (98.4%) | 33 (1.6%) |
| 1 or 2 Children | 1,190 (100.0%) | 0 (0.0%) |
| 3 or 4 Children | 374 (100.0%) | 0 (0.0%) |
| 5 or more Children | 4 (100.0%) | 0 (0.0%) |
| Total | 3,648 (99.1%) | 33 (0.9%) |
Income Below Poverty Among Single-Parent Households in Ocean Springs
According to the poverty data in Ocean Springs, 6.7% or 30 single-father households and 10.7% or 94 single-mother households are living below the poverty line. Among single-father households, those with no children have the highest poverty rate, with 17 households (8.1%) experiencing poverty. Likewise, among single-mother households, those with 1 or 2 children have the highest poverty rate, with 58 households (15.1%) falling below the poverty line.
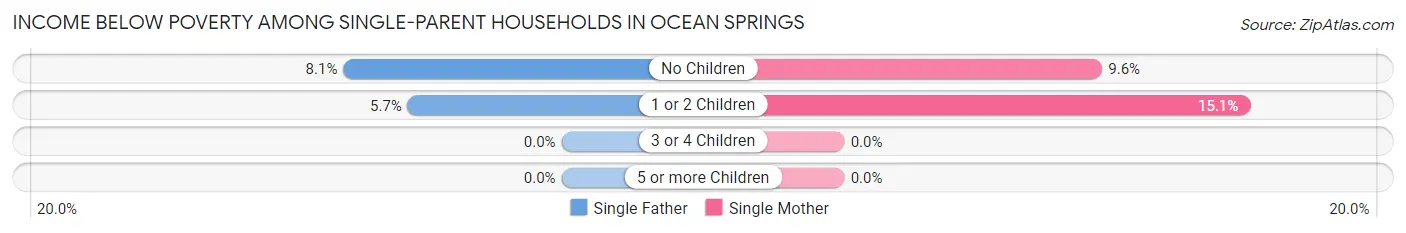
| Children | Single Father | Single Mother |
| No Children | 17 (8.1%) | 36 (9.6%) |
| 1 or 2 Children | 13 (5.7%) | 58 (15.1%) |
| 3 or 4 Children | 0 (0.0%) | 0 (0.0%) |
| 5 or more Children | 0 (0.0%) | 0 (0.0%) |
| Total | 30 (6.7%) | 94 (10.7%) |
Income Below Poverty Among Married-Couple vs Single-Parent Households in Ocean Springs
The poverty data for Ocean Springs shows that 33 of the married-couple family households (0.9%) and 124 of the single-parent households (9.4%) are living below the poverty level. Within the married-couple family households, those with no children have the highest poverty rate, with 33 households (1.6%) falling below the poverty line. Among the single-parent households, those with 1 or 2 children have the highest poverty rate, with 71 household (11.6%) living below poverty.
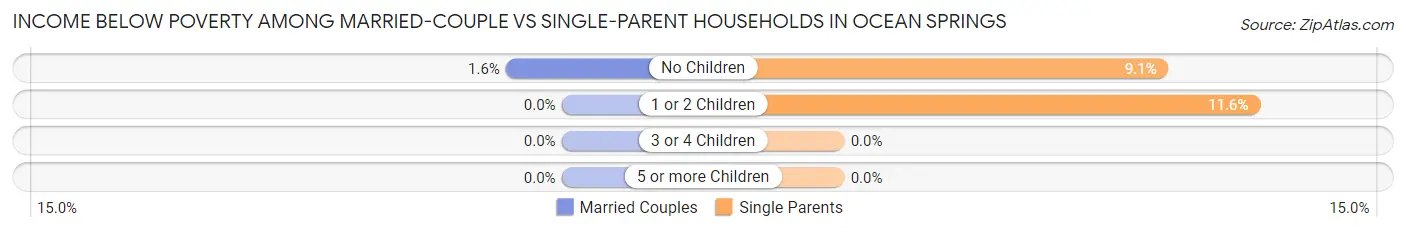
| Children | Married-Couple Families | Single-Parent Households |
| No Children | 33 (1.6%) | 53 (9.1%) |
| 1 or 2 Children | 0 (0.0%) | 71 (11.6%) |
| 3 or 4 Children | 0 (0.0%) | 0 (0.0%) |
| 5 or more Children | 0 (0.0%) | 0 (0.0%) |
| Total | 33 (0.9%) | 124 (9.4%) |
Race in Ocean Springs
The most populous races in Ocean Springs are White / Caucasian (15,079 | 81.9%), Hispanic or Latino (1,429 | 7.8%), and Black / African American (1,174 | 6.4%).
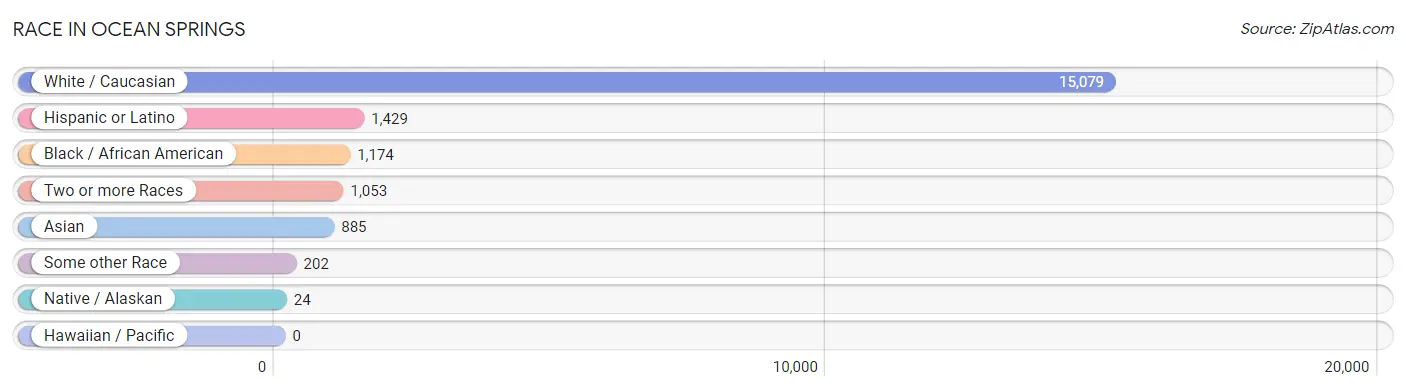
| Race | # Population | % Population |
| Asian | 885 | 4.8% |
| Black / African American | 1,174 | 6.4% |
| Hawaiian / Pacific | 0 | 0.0% |
| Hispanic or Latino | 1,429 | 7.8% |
| Native / Alaskan | 24 | 0.1% |
| White / Caucasian | 15,079 | 81.9% |
| Two or more Races | 1,053 | 5.7% |
| Some other Race | 202 | 1.1% |
| Total | 18,417 | 100.0% |
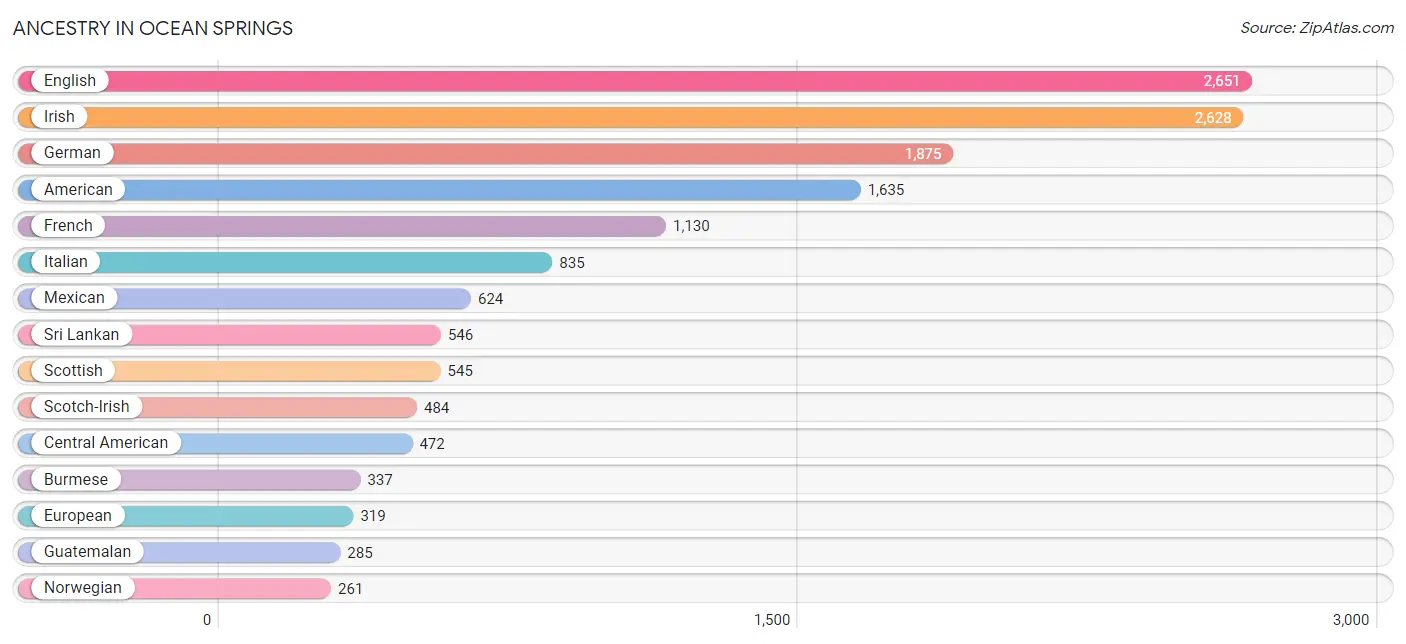
Ancestry in Ocean Springs
The most populous ancestries reported in Ocean Springs are English (2,651 | 14.4%), Irish (2,628 | 14.3%), German (1,875 | 10.2%), American (1,635 | 8.9%), and French (1,130 | 6.1%), together accounting for 53.9% of all Ocean Springs residents.
| Ancestry | # Population | % Population |
| American | 1,635 | 8.9% |
| Apache | 41 | 0.2% |
| Armenian | 54 | 0.3% |
| Austrian | 42 | 0.2% |
| Basque | 33 | 0.2% |
| Bhutanese | 15 | 0.1% |
| Brazilian | 24 | 0.1% |
| British | 110 | 0.6% |
| Burmese | 337 | 1.8% |
| Cajun | 24 | 0.1% |
| Canadian | 11 | 0.1% |
| Central American | 472 | 2.6% |
| Cherokee | 16 | 0.1% |
| Chickasaw | 3 | 0.0% |
| Chinese | 139 | 0.7% |
| Colombian | 57 | 0.3% |
| Comanche | 7 | 0.0% |
| Croatian | 48 | 0.3% |
| Danish | 51 | 0.3% |
| Dutch | 107 | 0.6% |
| Eastern European | 7 | 0.0% |
| English | 2,651 | 14.4% |
| European | 319 | 1.7% |
| Filipino | 11 | 0.1% |
| Finnish | 7 | 0.0% |
| French | 1,130 | 6.1% |
| French Canadian | 70 | 0.4% |
| German | 1,875 | 10.2% |
| Greek | 124 | 0.7% |
| Guatemalan | 285 | 1.5% |
| Honduran | 24 | 0.1% |
| Hungarian | 29 | 0.2% |
| Indian (Asian) | 18 | 0.1% |
| Iranian | 103 | 0.6% |
| Irish | 2,628 | 14.3% |
| Italian | 835 | 4.5% |
| Jamaican | 22 | 0.1% |
| Korean | 189 | 1.0% |
| Lithuanian | 60 | 0.3% |
| Maltese | 22 | 0.1% |
| Mexican | 624 | 3.4% |
| Navajo | 4 | 0.0% |
| Nicaraguan | 21 | 0.1% |
| Northern European | 88 | 0.5% |
| Norwegian | 261 | 1.4% |
| Panamanian | 142 | 0.8% |
| Pennsylvania German | 18 | 0.1% |
| Polish | 182 | 1.0% |
| Portuguese | 11 | 0.1% |
| Puerto Rican | 62 | 0.3% |
| Russian | 57 | 0.3% |
| Scandinavian | 32 | 0.2% |
| Scotch-Irish | 484 | 2.6% |
| Scottish | 545 | 3.0% |
| Slavic | 46 | 0.3% |
| Slovak | 12 | 0.1% |
| South American | 57 | 0.3% |
| Spaniard | 42 | 0.2% |
| Spanish | 172 | 0.9% |
| Sri Lankan | 546 | 3.0% |
| Swedish | 108 | 0.6% |
| Swiss | 16 | 0.1% |
| Welsh | 47 | 0.3% |
| Yugoslavian | 105 | 0.6% | View All 64 Rows |
Immigrants in Ocean Springs
The most numerous immigrant groups reported in Ocean Springs came from Asia (486 | 2.6%), Latin America (311 | 1.7%), South Eastern Asia (252 | 1.4%), Central America (219 | 1.2%), and Europe (149 | 0.8%), together accounting for 7.7% of all Ocean Springs residents.
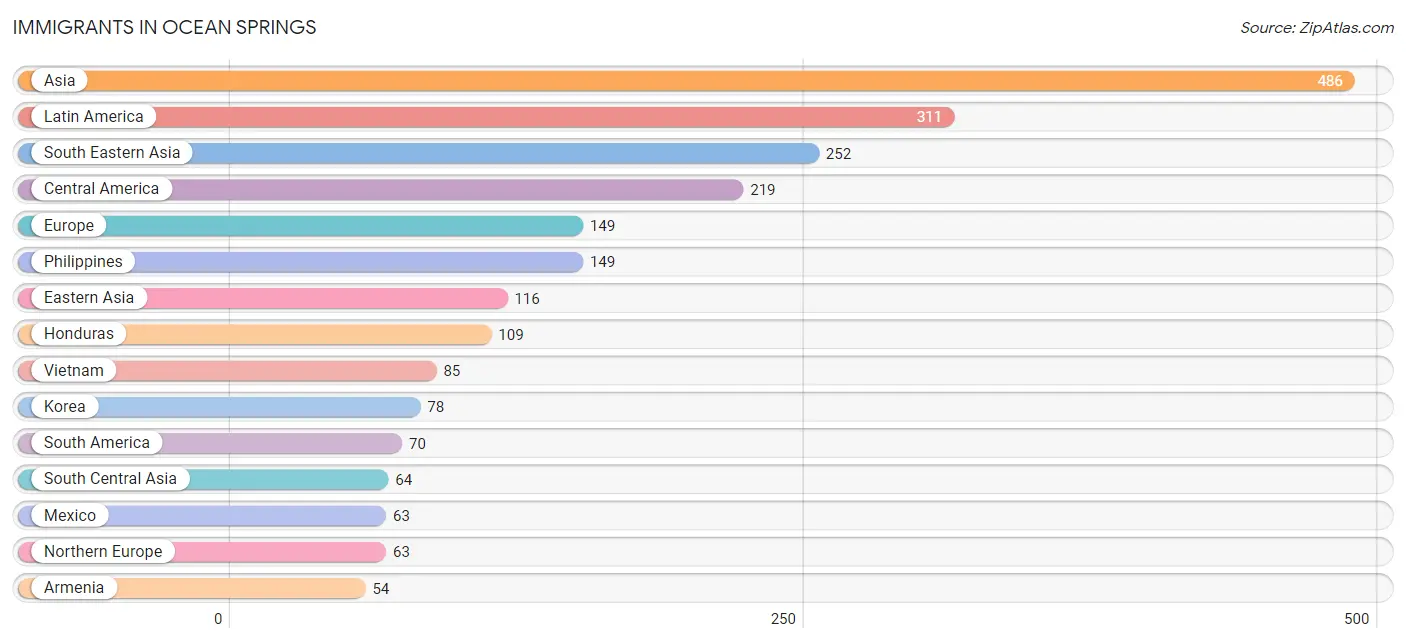
| Immigration Origin | # Population | % Population |
| Armenia | 54 | 0.3% |
| Asia | 486 | 2.6% |
| Brazil | 35 | 0.2% |
| Canada | 40 | 0.2% |
| Caribbean | 22 | 0.1% |
| Central America | 219 | 1.2% |
| China | 23 | 0.1% |
| Colombia | 35 | 0.2% |
| Eastern Asia | 116 | 0.6% |
| England | 47 | 0.3% |
| Europe | 149 | 0.8% |
| France | 33 | 0.2% |
| Germany | 16 | 0.1% |
| Honduras | 109 | 0.6% |
| Italy | 15 | 0.1% |
| Jamaica | 22 | 0.1% |
| Japan | 15 | 0.1% |
| Korea | 78 | 0.4% |
| Latin America | 311 | 1.7% |
| Malaysia | 18 | 0.1% |
| Mexico | 63 | 0.3% |
| Nepal | 15 | 0.1% |
| Northern Europe | 63 | 0.3% |
| Pakistan | 49 | 0.3% |
| Panama | 47 | 0.3% |
| Philippines | 149 | 0.8% |
| Scotland | 16 | 0.1% |
| South America | 70 | 0.4% |
| South Central Asia | 64 | 0.4% |
| South Eastern Asia | 252 | 1.4% |
| Southern Europe | 37 | 0.2% |
| Taiwan | 23 | 0.1% |
| Vietnam | 85 | 0.5% |
| Western Asia | 54 | 0.3% |
| Western Europe | 49 | 0.3% | View All 35 Rows |
Sex and Age in Ocean Springs
Sex and Age in Ocean Springs
The most populous age groups in Ocean Springs are 60 to 64 Years (884 | 9.4%) for men and 10 to 14 Years (1,000 | 11.1%) for women.
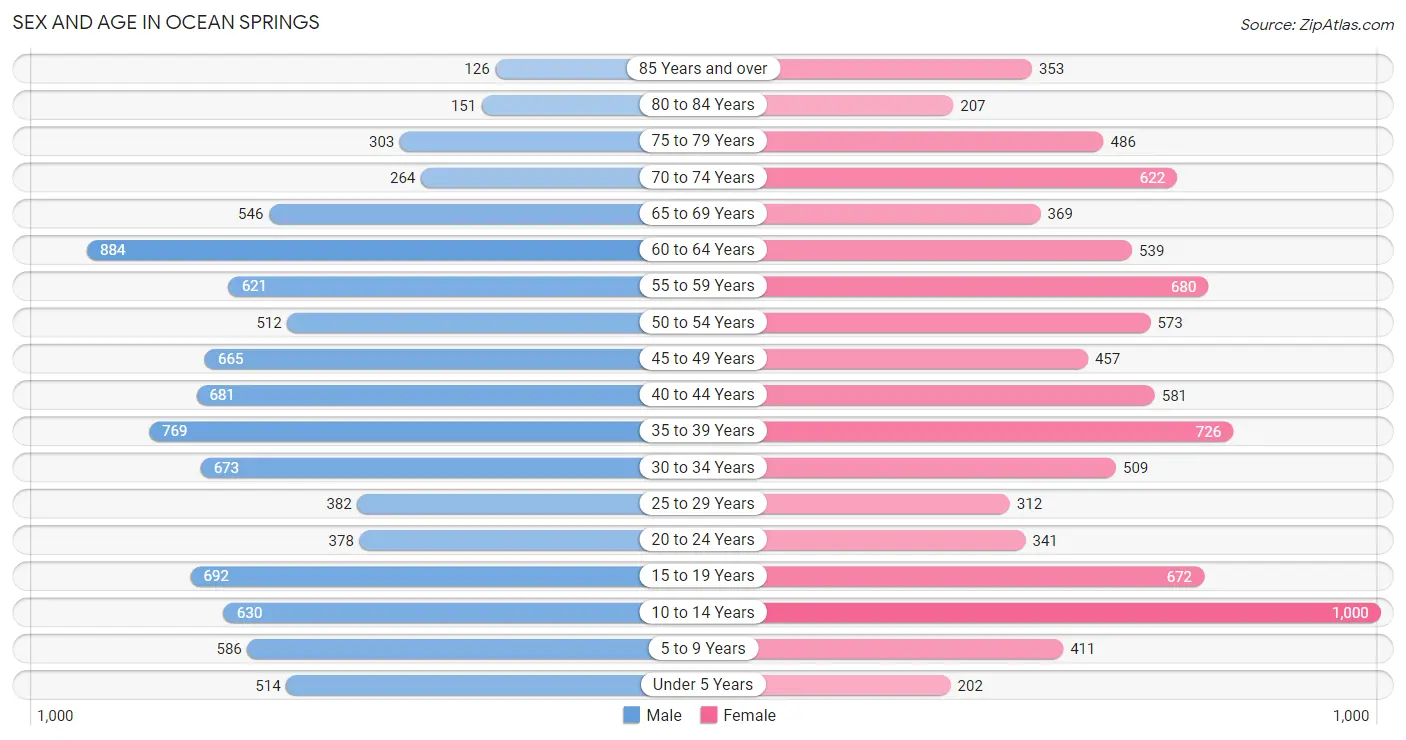
| Age Bracket | Male | Female |
| Under 5 Years | 514 (5.5%) | 202 (2.2%) |
| 5 to 9 Years | 586 (6.2%) | 411 (4.5%) |
| 10 to 14 Years | 630 (6.7%) | 1,000 (11.1%) |
| 15 to 19 Years | 692 (7.4%) | 672 (7.4%) |
| 20 to 24 Years | 378 (4.0%) | 341 (3.8%) |
| 25 to 29 Years | 382 (4.1%) | 312 (3.5%) |
| 30 to 34 Years | 673 (7.2%) | 509 (5.6%) |
| 35 to 39 Years | 769 (8.2%) | 726 (8.0%) |
| 40 to 44 Years | 681 (7.3%) | 581 (6.4%) |
| 45 to 49 Years | 665 (7.1%) | 457 (5.1%) |
| 50 to 54 Years | 512 (5.5%) | 573 (6.3%) |
| 55 to 59 Years | 621 (6.6%) | 680 (7.5%) |
| 60 to 64 Years | 884 (9.4%) | 539 (6.0%) |
| 65 to 69 Years | 546 (5.8%) | 369 (4.1%) |
| 70 to 74 Years | 264 (2.8%) | 622 (6.9%) |
| 75 to 79 Years | 303 (3.2%) | 486 (5.4%) |
| 80 to 84 Years | 151 (1.6%) | 207 (2.3%) |
| 85 Years and over | 126 (1.3%) | 353 (3.9%) |
| Total | 9,377 (100.0%) | 9,040 (100.0%) |
Families and Households in Ocean Springs
Median Family Size in Ocean Springs
The median family size in Ocean Springs is 2.97 persons per family, with single female/mother families (875 | 17.5%) accounting for the largest median family size of 3.16 persons per family. On the other hand, single male/father families (449 | 9.0%) represent the smallest median family size with 2.30 persons per family.
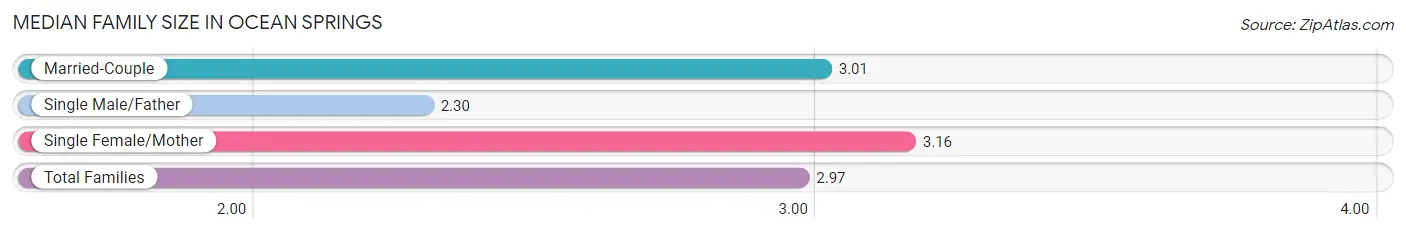
| Family Type | # Families | Family Size |
| Married-Couple | 3,681 (73.6%) | 3.01 |
| Single Male/Father | 449 (9.0%) | 2.30 |
| Single Female/Mother | 875 (17.5%) | 3.16 |
| Total Families | 5,005 (100.0%) | 2.97 |
Median Household Size in Ocean Springs
The median household size in Ocean Springs is 2.31 persons per household, with single female/mother households (875 | 11.1%) accounting for the largest median household size of 3.18 persons per household. non-family households (2,897 | 36.7%) represent the smallest median household size with 1.13 persons per household.
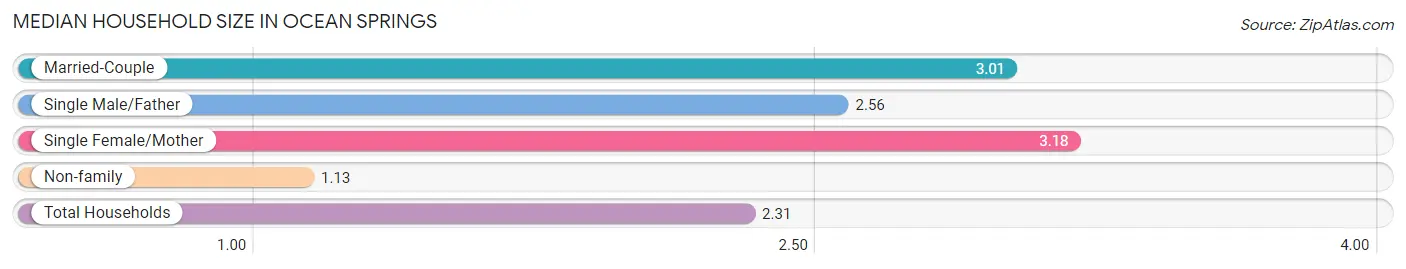
| Household Type | # Households | Household Size |
| Married-Couple | 3,681 (46.6%) | 3.01 |
| Single Male/Father | 449 (5.7%) | 2.56 |
| Single Female/Mother | 875 (11.1%) | 3.18 |
| Non-family | 2,897 (36.7%) | 1.13 |
| Total Households | 7,902 (100.0%) | 2.31 |
Household Size by Marriage Status in Ocean Springs
Out of a total of 7,902 households in Ocean Springs, 5,005 (63.3%) are family households, while 2,897 (36.7%) are nonfamily households. The most numerous type of family households are 2-person households, comprising 2,378, and the most common type of nonfamily households are 1-person households, comprising 2,627.
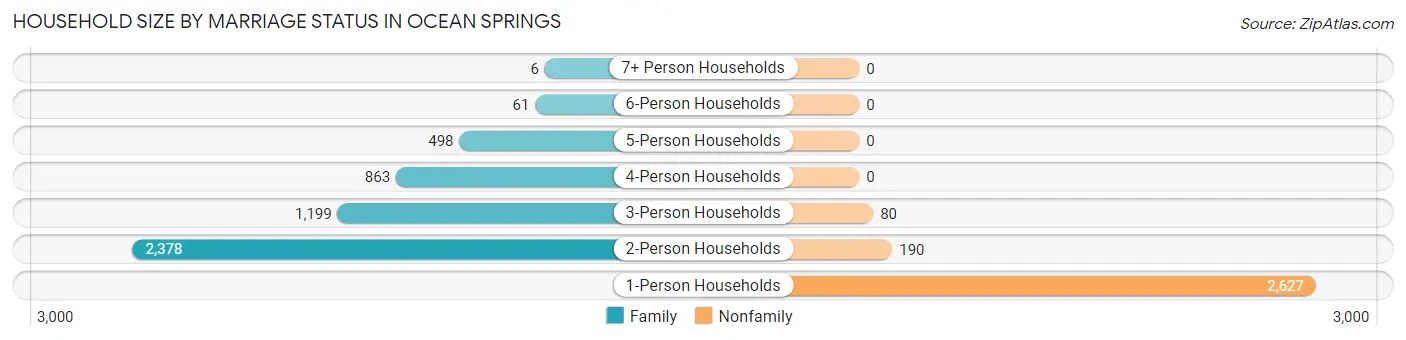
| Household Size | Family Households | Nonfamily Households |
| 1-Person Households | - | 2,627 (33.2%) |
| 2-Person Households | 2,378 (30.1%) | 190 (2.4%) |
| 3-Person Households | 1,199 (15.2%) | 80 (1.0%) |
| 4-Person Households | 863 (10.9%) | 0 (0.0%) |
| 5-Person Households | 498 (6.3%) | 0 (0.0%) |
| 6-Person Households | 61 (0.8%) | 0 (0.0%) |
| 7+ Person Households | 6 (0.1%) | 0 (0.0%) |
| Total | 5,005 (63.3%) | 2,897 (36.7%) |
Female Fertility in Ocean Springs
Fertility by Age in Ocean Springs
Average fertility rate in Ocean Springs is 33.0 births per 1,000 women. Women in the age bracket of 20 to 34 years have the highest fertility rate with 91.0 births per 1,000 women. Women in the age bracket of 20 to 34 years acount for 85.5% of all women with births.
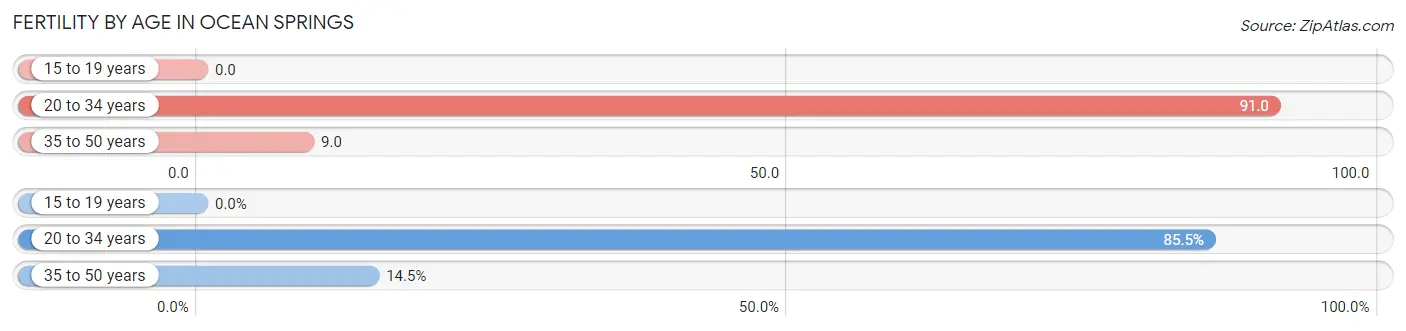
| Age Bracket | Women with Births | Births / 1,000 Women |
| 15 to 19 years | 0 (0.0%) | 0.0 |
| 20 to 34 years | 106 (85.5%) | 91.0 |
| 35 to 50 years | 18 (14.5%) | 9.0 |
| Total | 124 (100.0%) | 33.0 |
Fertility by Age by Marriage Status in Ocean Springs
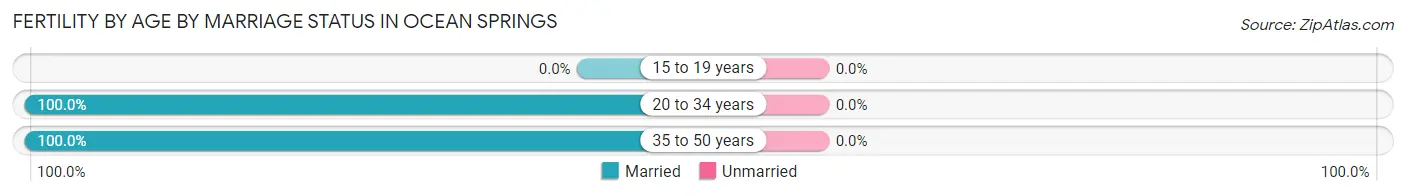
| Age Bracket | Married | Unmarried |
| 15 to 19 years | 0 (0.0%) | 0 (0.0%) |
| 20 to 34 years | 106 (100.0%) | 0 (0.0%) |
| 35 to 50 years | 18 (100.0%) | 0 (0.0%) |
| Total | 124 (100.0%) | 0 (0.0%) |
Fertility by Education in Ocean Springs
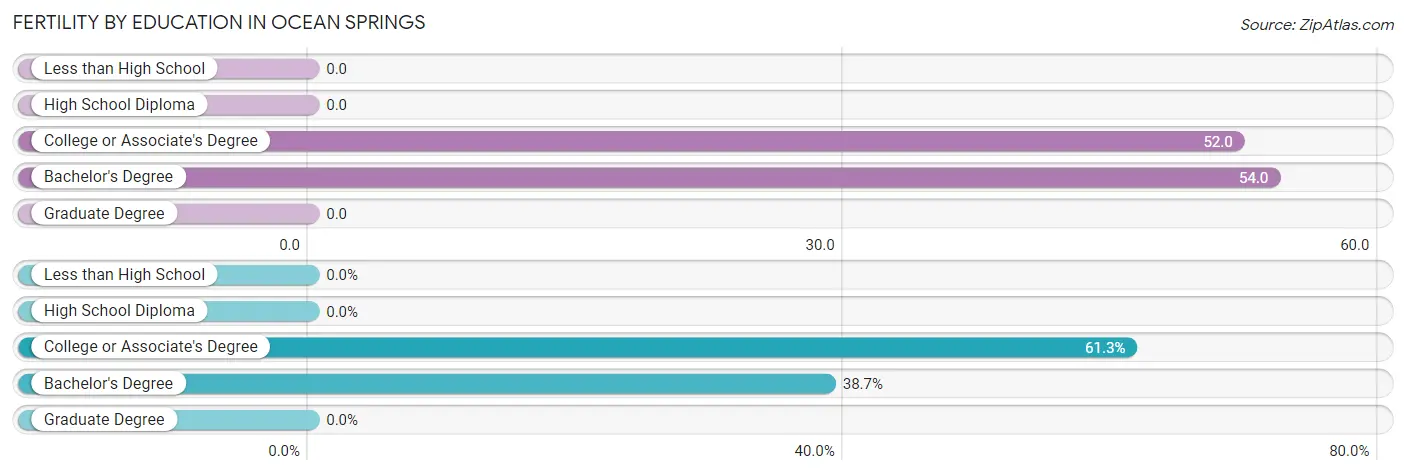
| Educational Attainment | Women with Births | Births / 1,000 Women |
| Less than High School | 0 (0.0%) | 0.0 |
| High School Diploma | 0 (0.0%) | 0.0 |
| College or Associate's Degree | 76 (61.3%) | 52.0 |
| Bachelor's Degree | 48 (38.7%) | 54.0 |
| Graduate Degree | 0 (0.0%) | 0.0 |
| Total | 124 (100.0%) | 33.0 |
Fertility by Education by Marriage Status in Ocean Springs
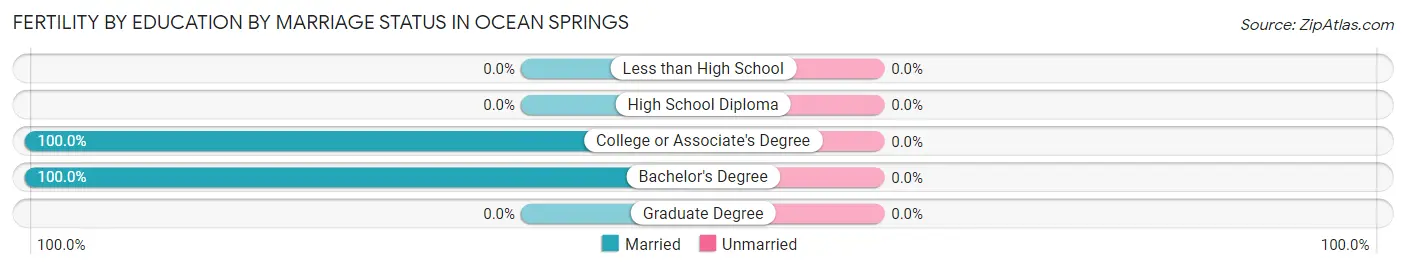
| Educational Attainment | Married | Unmarried |
| Less than High School | 0 (0.0%) | 0 (0.0%) |
| High School Diploma | 0 (0.0%) | 0 (0.0%) |
| College or Associate's Degree | 76 (100.0%) | 0 (0.0%) |
| Bachelor's Degree | 48 (100.0%) | 0 (0.0%) |
| Graduate Degree | 0 (0.0%) | 0 (0.0%) |
| Total | 124 (100.0%) | 0 (0.0%) |
Employment Characteristics in Ocean Springs
Employment by Class of Employer in Ocean Springs
Among the 8,520 employed individuals in Ocean Springs, private company employees (5,467 | 64.2%), federal government employees (742 | 8.7%), and state government employees (596 | 7.0%) make up the most common classes of employment.
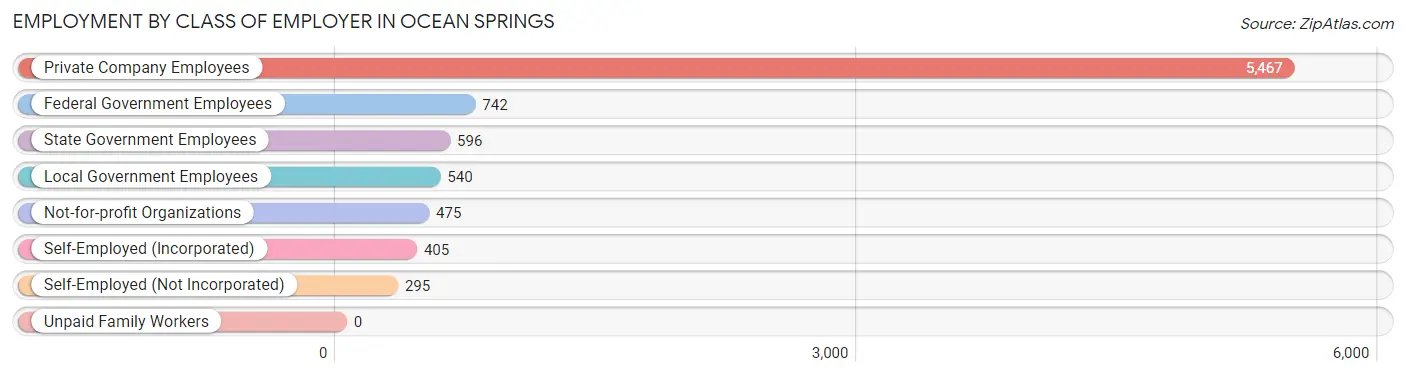
| Employer Class | # Employees | % Employees |
| Private Company Employees | 5,467 | 64.2% |
| Self-Employed (Incorporated) | 405 | 4.8% |
| Self-Employed (Not Incorporated) | 295 | 3.5% |
| Not-for-profit Organizations | 475 | 5.6% |
| Local Government Employees | 540 | 6.3% |
| State Government Employees | 596 | 7.0% |
| Federal Government Employees | 742 | 8.7% |
| Unpaid Family Workers | 0 | 0.0% |
| Total | 8,520 | 100.0% |
Employment Status by Age in Ocean Springs
According to the labor force statistics for Ocean Springs, out of the total population over 16 years of age (14,755), 61.6% or 9,089 individuals are in the labor force, with 4.1% or 373 of them unemployed. The age group with the highest labor force participation rate is 30 to 34 years, with 95.4% or 1,128 individuals in the labor force. Within the labor force, the 16 to 19 years age range has the highest percentage of unemployed individuals, with 22.0% or 87 of them being unemployed.
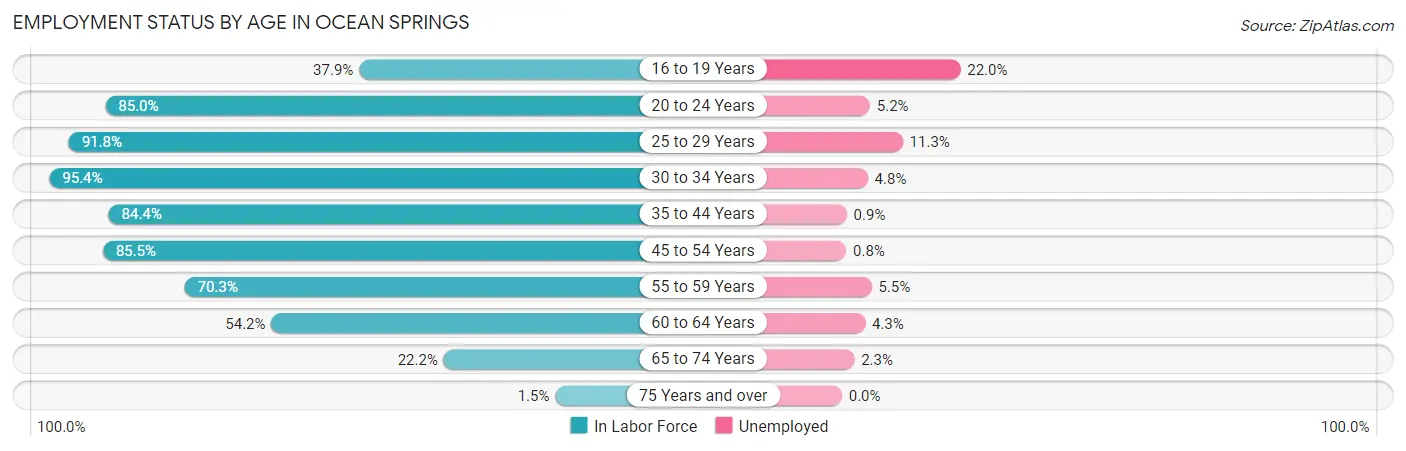
| Age Bracket | In Labor Force | Unemployed |
| 16 to 19 Years | 396 (37.9%) | 87 (22.0%) |
| 20 to 24 Years | 611 (85.0%) | 32 (5.2%) |
| 25 to 29 Years | 637 (91.8%) | 72 (11.3%) |
| 30 to 34 Years | 1,128 (95.4%) | 54 (4.8%) |
| 35 to 44 Years | 2,327 (84.4%) | 21 (0.9%) |
| 45 to 54 Years | 1,887 (85.5%) | 15 (0.8%) |
| 55 to 59 Years | 915 (70.3%) | 50 (5.5%) |
| 60 to 64 Years | 771 (54.2%) | 33 (4.3%) |
| 65 to 74 Years | 400 (22.2%) | 9 (2.3%) |
| 75 Years and over | 24 (1.5%) | 0 (0.0%) |
| Total | 9,089 (61.6%) | 373 (4.1%) |
Employment Status by Educational Attainment in Ocean Springs
According to labor force statistics for Ocean Springs, 80.1% of individuals (7,661) out of the total population between 25 and 64 years of age (9,564) are in the labor force, with 3.2% or 245 of them being unemployed. The group with the highest labor force participation rate are those with the educational attainment of bachelor's degree or higher, with 87.1% or 3,722 individuals in the labor force. Within the labor force, individuals with high school diploma education have the highest percentage of unemployment, with 13.0% or 121 of them being unemployed.
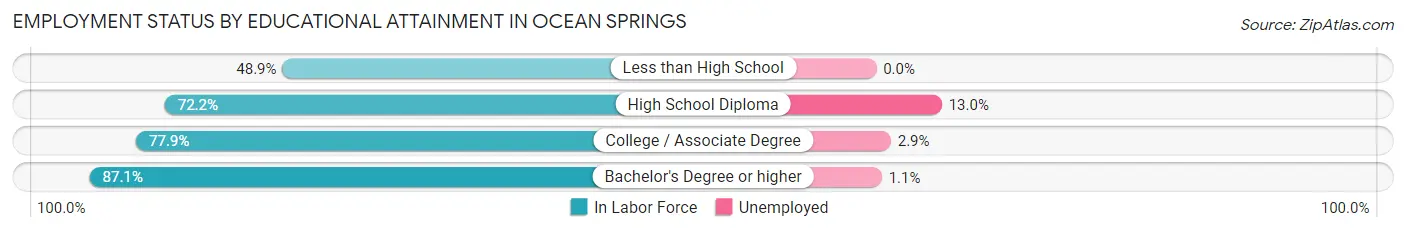
| Educational Attainment | In Labor Force | Unemployed |
| Less than High School | 174 (48.9%) | 0 (0.0%) |
| High School Diploma | 930 (72.2%) | 167 (13.0%) |
| College / Associate Degree | 2,841 (77.9%) | 106 (2.9%) |
| Bachelor's Degree or higher | 3,722 (87.1%) | 47 (1.1%) |
| Total | 7,661 (80.1%) | 306 (3.2%) |
Employment Occupations by Sex in Ocean Springs
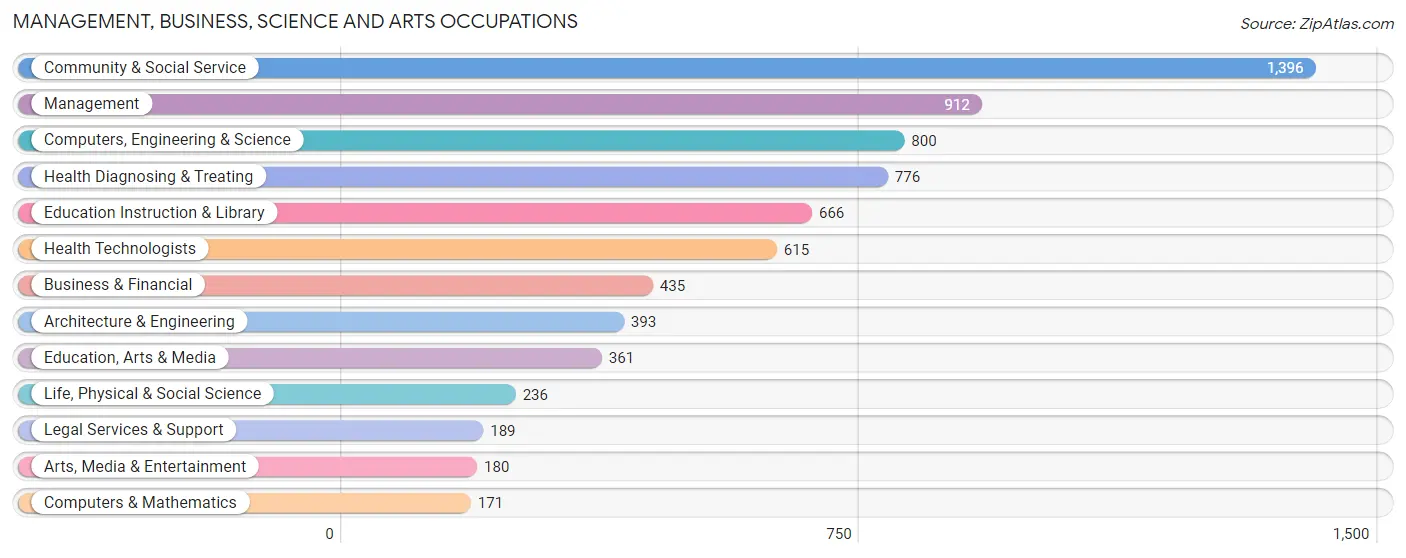
Management, Business, Science and Arts Occupations
The most common Management, Business, Science and Arts occupations in Ocean Springs are Community & Social Service (1,396 | 16.2%), Management (912 | 10.6%), Computers, Engineering & Science (800 | 9.3%), Health Diagnosing & Treating (776 | 9.0%), and Education Instruction & Library (666 | 7.7%).
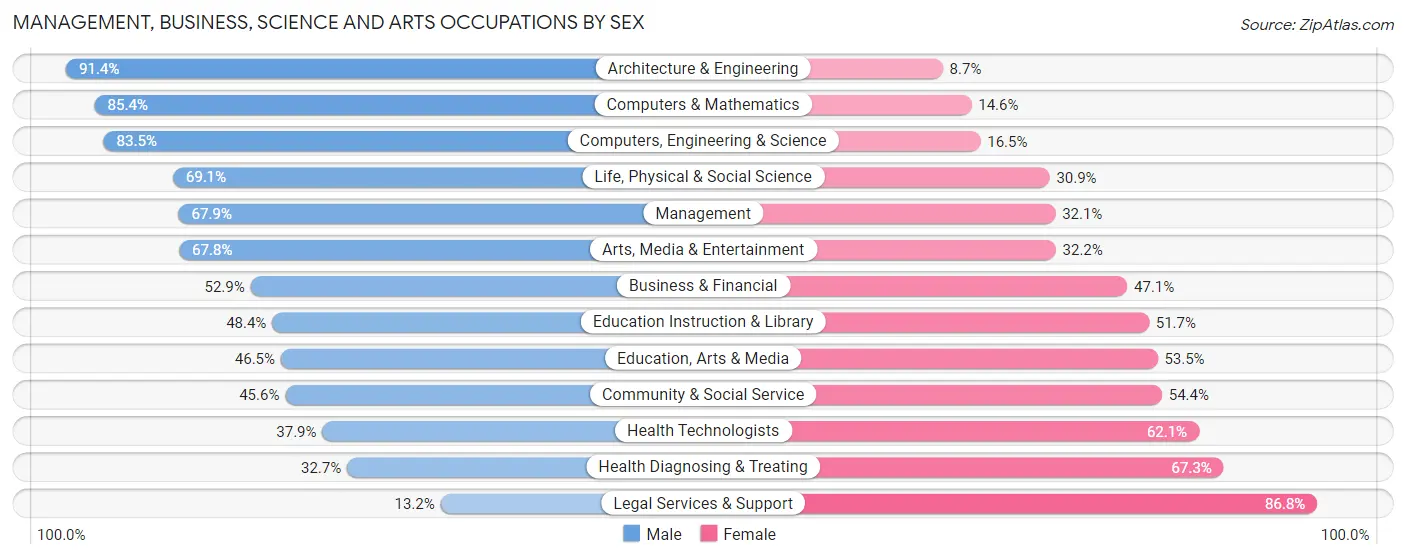
Management, Business, Science and Arts Occupations by Sex
Within the Management, Business, Science and Arts occupations in Ocean Springs, the most male-oriented occupations are Architecture & Engineering (91.3%), Computers & Mathematics (85.4%), and Computers, Engineering & Science (83.5%), while the most female-oriented occupations are Legal Services & Support (86.8%), Health Diagnosing & Treating (67.3%), and Health Technologists (62.1%).
| Occupation | Male | Female |
| Management | 619 (67.9%) | 293 (32.1%) |
| Business & Financial | 230 (52.9%) | 205 (47.1%) |
| Computers, Engineering & Science | 668 (83.5%) | 132 (16.5%) |
| Computers & Mathematics | 146 (85.4%) | 25 (14.6%) |
| Architecture & Engineering | 359 (91.3%) | 34 (8.6%) |
| Life, Physical & Social Science | 163 (69.1%) | 73 (30.9%) |
| Community & Social Service | 637 (45.6%) | 759 (54.4%) |
| Education, Arts & Media | 168 (46.5%) | 193 (53.5%) |
| Legal Services & Support | 25 (13.2%) | 164 (86.8%) |
| Education Instruction & Library | 322 (48.3%) | 344 (51.6%) |
| Arts, Media & Entertainment | 122 (67.8%) | 58 (32.2%) |
| Health Diagnosing & Treating | 254 (32.7%) | 522 (67.3%) |
| Health Technologists | 233 (37.9%) | 382 (62.1%) |
| Total (Category) | 2,408 (55.7%) | 1,911 (44.3%) |
| Total (Overall) | 4,967 (57.6%) | 3,658 (42.4%) |
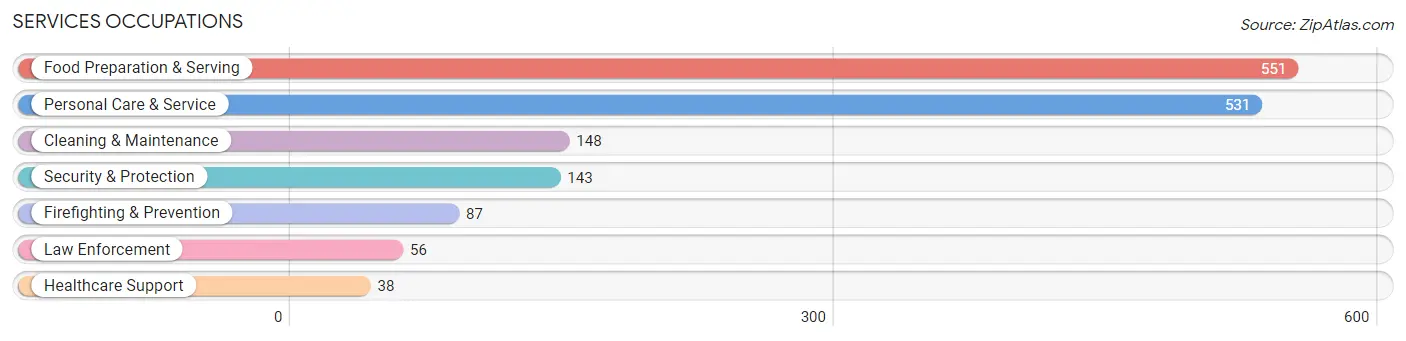
Services Occupations
The most common Services occupations in Ocean Springs are Food Preparation & Serving (551 | 6.4%), Personal Care & Service (531 | 6.2%), Cleaning & Maintenance (148 | 1.7%), Security & Protection (143 | 1.7%), and Firefighting & Prevention (87 | 1.0%).
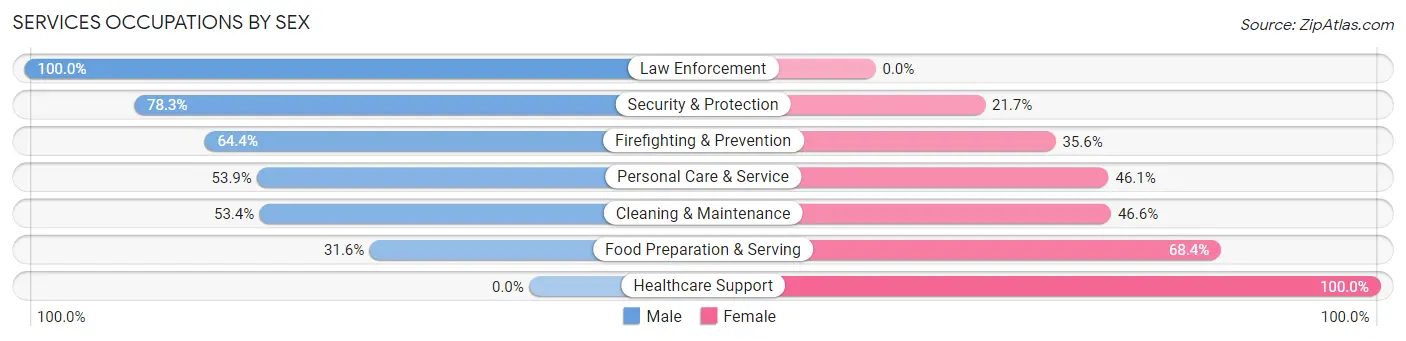
Services Occupations by Sex
Within the Services occupations in Ocean Springs, the most male-oriented occupations are Law Enforcement (100.0%), Security & Protection (78.3%), and Firefighting & Prevention (64.4%), while the most female-oriented occupations are Healthcare Support (100.0%), Food Preparation & Serving (68.4%), and Cleaning & Maintenance (46.6%).
| Occupation | Male | Female |
| Healthcare Support | 0 (0.0%) | 38 (100.0%) |
| Security & Protection | 112 (78.3%) | 31 (21.7%) |
| Firefighting & Prevention | 56 (64.4%) | 31 (35.6%) |
| Law Enforcement | 56 (100.0%) | 0 (0.0%) |
| Food Preparation & Serving | 174 (31.6%) | 377 (68.4%) |
| Cleaning & Maintenance | 79 (53.4%) | 69 (46.6%) |
| Personal Care & Service | 286 (53.9%) | 245 (46.1%) |
| Total (Category) | 651 (46.1%) | 760 (53.9%) |
| Total (Overall) | 4,967 (57.6%) | 3,658 (42.4%) |
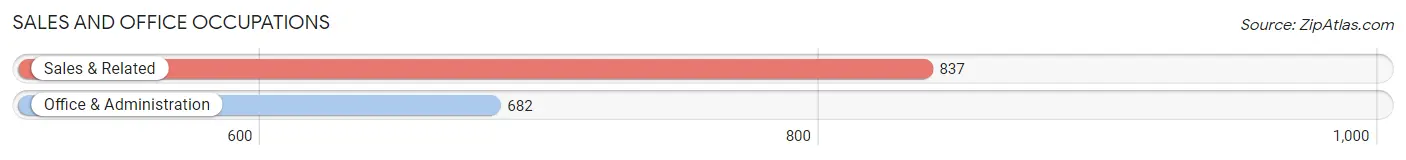
Sales and Office Occupations
The most common Sales and Office occupations in Ocean Springs are Sales & Related (837 | 9.7%), and Office & Administration (682 | 7.9%).
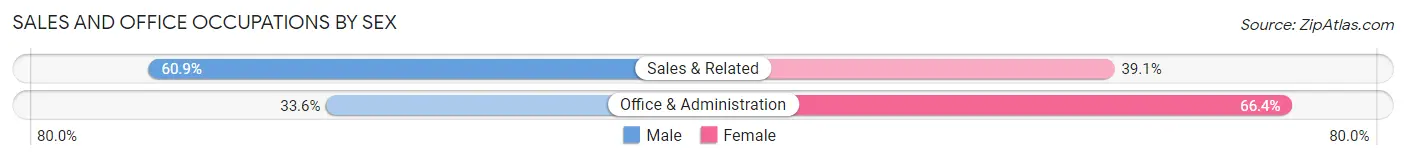
Sales and Office Occupations by Sex
| Occupation | Male | Female |
| Sales & Related | 510 (60.9%) | 327 (39.1%) |
| Office & Administration | 229 (33.6%) | 453 (66.4%) |
| Total (Category) | 739 (48.6%) | 780 (51.3%) |
| Total (Overall) | 4,967 (57.6%) | 3,658 (42.4%) |
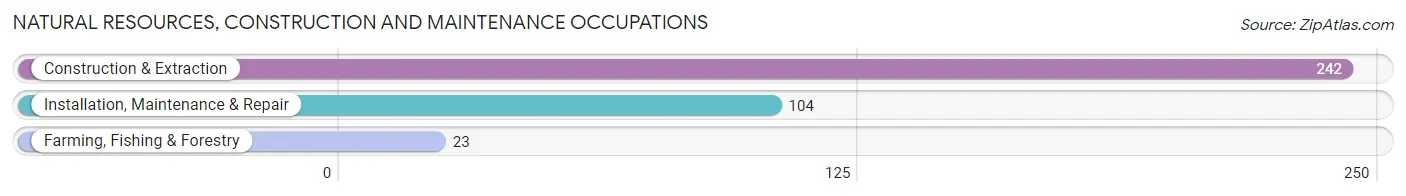
Natural Resources, Construction and Maintenance Occupations
The most common Natural Resources, Construction and Maintenance occupations in Ocean Springs are Construction & Extraction (242 | 2.8%), Installation, Maintenance & Repair (104 | 1.2%), and Farming, Fishing & Forestry (23 | 0.3%).
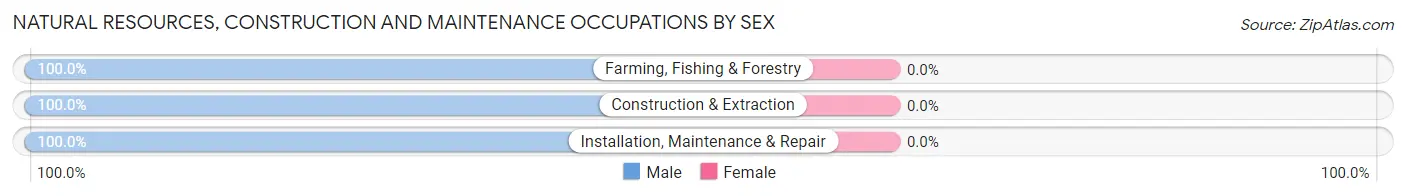
Natural Resources, Construction and Maintenance Occupations by Sex
| Occupation | Male | Female |
| Farming, Fishing & Forestry | 23 (100.0%) | 0 (0.0%) |
| Construction & Extraction | 242 (100.0%) | 0 (0.0%) |
| Installation, Maintenance & Repair | 104 (100.0%) | 0 (0.0%) |
| Total (Category) | 369 (100.0%) | 0 (0.0%) |
| Total (Overall) | 4,967 (57.6%) | 3,658 (42.4%) |
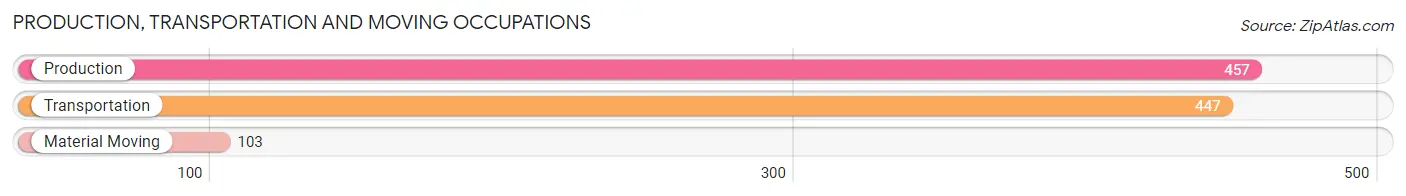
Production, Transportation and Moving Occupations
The most common Production, Transportation and Moving occupations in Ocean Springs are Production (457 | 5.3%), Transportation (447 | 5.2%), and Material Moving (103 | 1.2%).
Production, Transportation and Moving Occupations by Sex
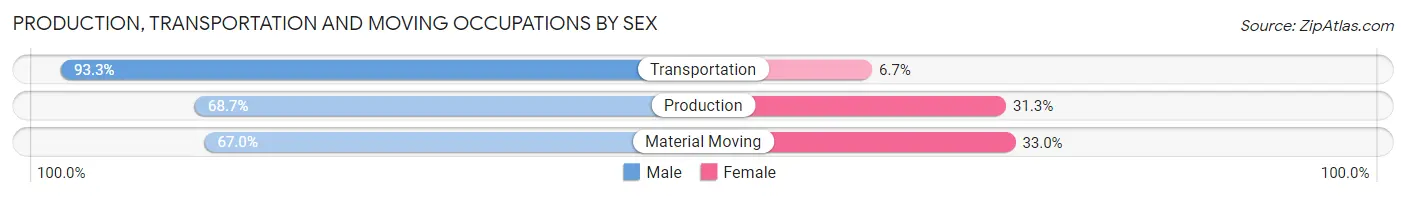
| Occupation | Male | Female |
| Production | 314 (68.7%) | 143 (31.3%) |
| Transportation | 417 (93.3%) | 30 (6.7%) |
| Material Moving | 69 (67.0%) | 34 (33.0%) |
| Total (Category) | 800 (79.4%) | 207 (20.6%) |
| Total (Overall) | 4,967 (57.6%) | 3,658 (42.4%) |
Employment Industries by Sex in Ocean Springs
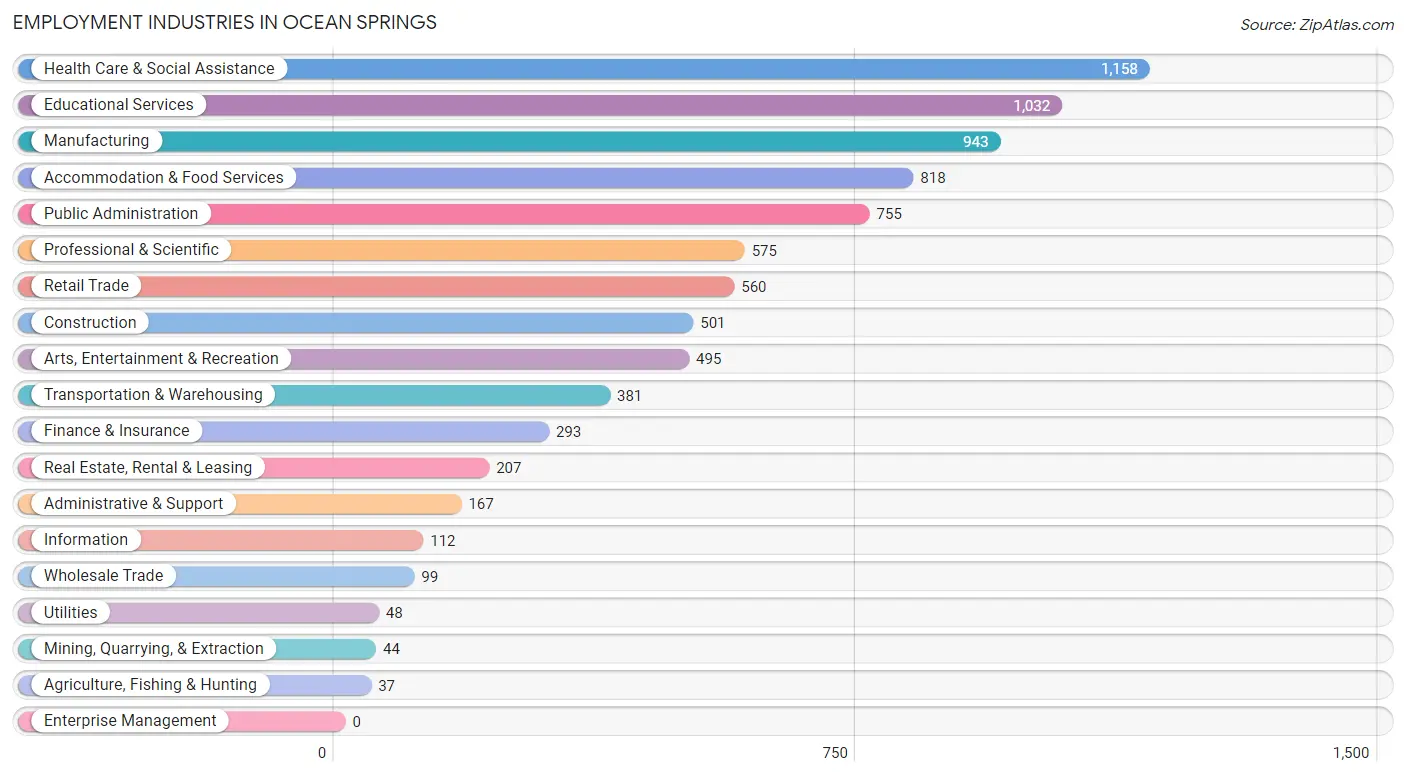
Employment Industries in Ocean Springs
The major employment industries in Ocean Springs include Health Care & Social Assistance (1,158 | 13.4%), Educational Services (1,032 | 12.0%), Manufacturing (943 | 10.9%), Accommodation & Food Services (818 | 9.5%), and Public Administration (755 | 8.7%).
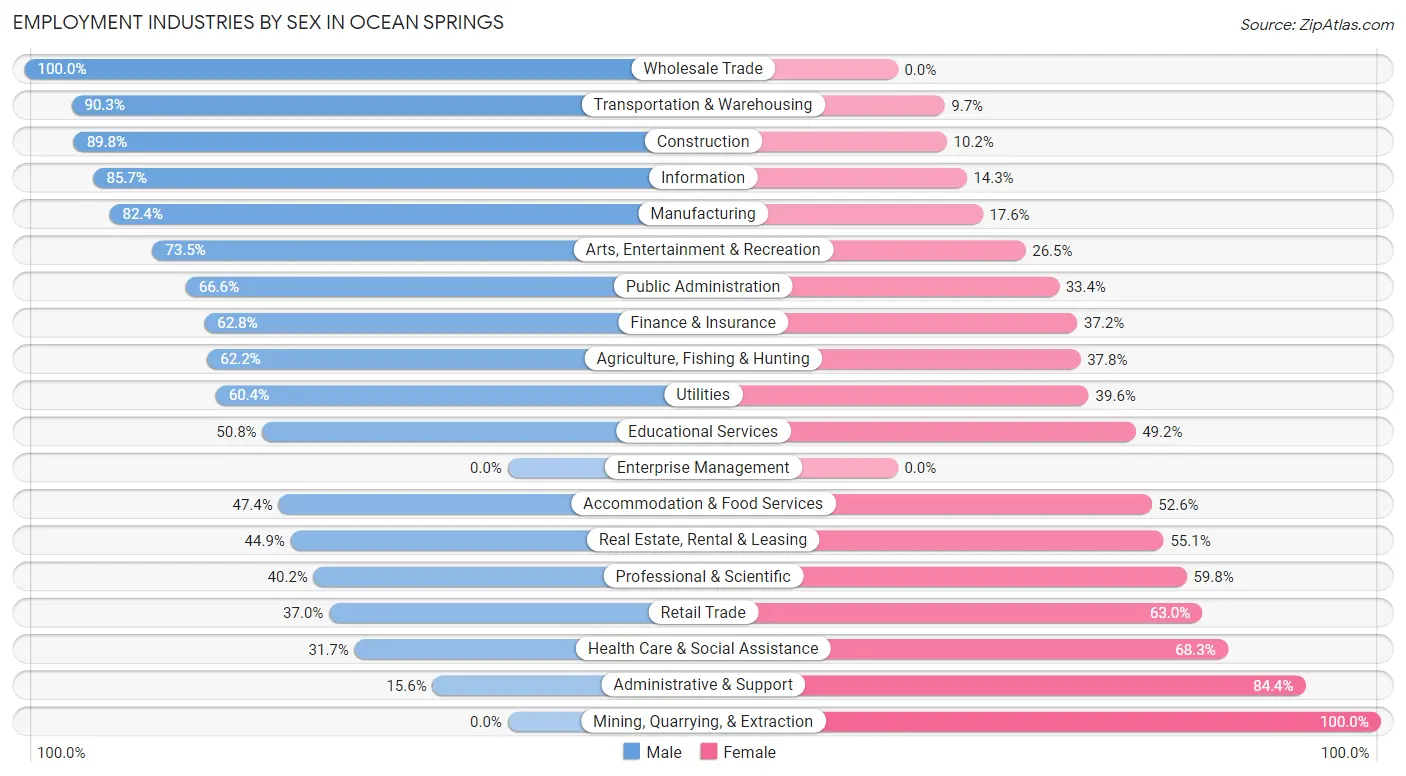
Employment Industries by Sex in Ocean Springs
The Ocean Springs industries that see more men than women are Wholesale Trade (100.0%), Transportation & Warehousing (90.3%), and Construction (89.8%), whereas the industries that tend to have a higher number of women are Mining, Quarrying, & Extraction (100.0%), Administrative & Support (84.4%), and Health Care & Social Assistance (68.3%).
| Industry | Male | Female |
| Agriculture, Fishing & Hunting | 23 (62.2%) | 14 (37.8%) |
| Mining, Quarrying, & Extraction | 0 (0.0%) | 44 (100.0%) |
| Construction | 450 (89.8%) | 51 (10.2%) |
| Manufacturing | 777 (82.4%) | 166 (17.6%) |
| Wholesale Trade | 99 (100.0%) | 0 (0.0%) |
| Retail Trade | 207 (37.0%) | 353 (63.0%) |
| Transportation & Warehousing | 344 (90.3%) | 37 (9.7%) |
| Utilities | 29 (60.4%) | 19 (39.6%) |
| Information | 96 (85.7%) | 16 (14.3%) |
| Finance & Insurance | 184 (62.8%) | 109 (37.2%) |
| Real Estate, Rental & Leasing | 93 (44.9%) | 114 (55.1%) |
| Professional & Scientific | 231 (40.2%) | 344 (59.8%) |
| Enterprise Management | 0 (0.0%) | 0 (0.0%) |
| Administrative & Support | 26 (15.6%) | 141 (84.4%) |
| Educational Services | 524 (50.8%) | 508 (49.2%) |
| Health Care & Social Assistance | 367 (31.7%) | 791 (68.3%) |
| Arts, Entertainment & Recreation | 364 (73.5%) | 131 (26.5%) |
| Accommodation & Food Services | 388 (47.4%) | 430 (52.6%) |
| Public Administration | 503 (66.6%) | 252 (33.4%) |
| Total | 4,967 (57.6%) | 3,658 (42.4%) |
Education in Ocean Springs
School Enrollment in Ocean Springs
The most common levels of schooling among the 4,679 students in Ocean Springs are middle school (1,495 | 32.0%), high school (988 | 21.1%), and elementary school (775 | 16.6%).
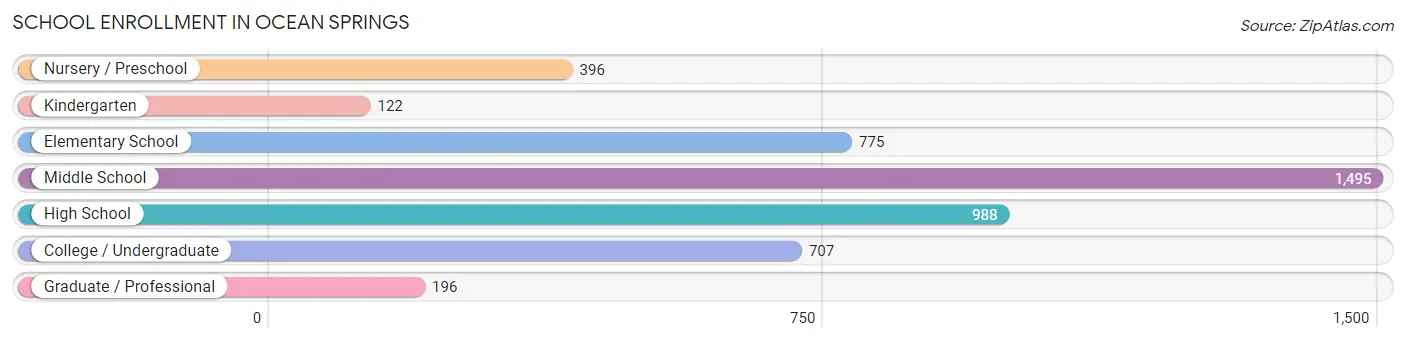
| School Level | # Students | % Students |
| Nursery / Preschool | 396 | 8.5% |
| Kindergarten | 122 | 2.6% |
| Elementary School | 775 | 16.6% |
| Middle School | 1,495 | 32.0% |
| High School | 988 | 21.1% |
| College / Undergraduate | 707 | 15.1% |
| Graduate / Professional | 196 | 4.2% |
| Total | 4,679 | 100.0% |
School Enrollment by Age by Funding Source in Ocean Springs
Out of a total of 4,679 students who are enrolled in schools in Ocean Springs, 571 (12.2%) attend a private institution, while the remaining 4,108 (87.8%) are enrolled in public schools. The age group of 3 to 4 year olds has the highest likelihood of being enrolled in private schools, with 110 (44.4% in the age bracket) enrolled. Conversely, the age group of 18 to 19 year olds has the lowest likelihood of being enrolled in a private school, with 314 (95.4% in the age bracket) attending a public institution.
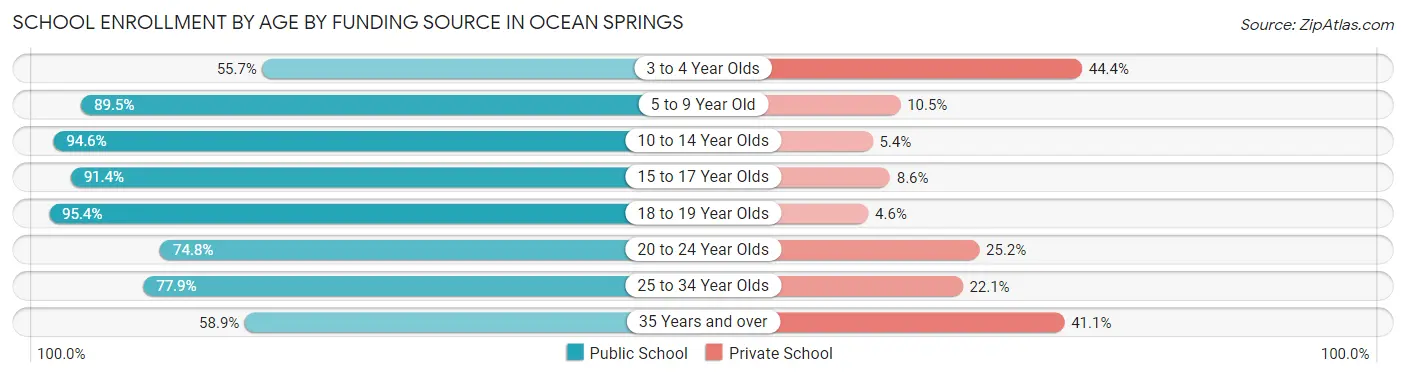
| Age Bracket | Public School | Private School |
| 3 to 4 Year Olds | 138 (55.6%) | 110 (44.4%) |
| 5 to 9 Year Old | 892 (89.5%) | 105 (10.5%) |
| 10 to 14 Year Olds | 1,518 (94.6%) | 86 (5.4%) |
| 15 to 17 Year Olds | 809 (91.4%) | 76 (8.6%) |
| 18 to 19 Year Olds | 314 (95.4%) | 15 (4.6%) |
| 20 to 24 Year Olds | 160 (74.8%) | 54 (25.2%) |
| 25 to 34 Year Olds | 169 (77.9%) | 48 (22.1%) |
| 35 Years and over | 109 (58.9%) | 76 (41.1%) |
| Total | 4,108 (87.8%) | 571 (12.2%) |
Educational Attainment by Field of Study in Ocean Springs
Business (1,152 | 18.7%), education (894 | 14.5%), science & technology (678 | 11.0%), engineering (496 | 8.1%), and physical & health sciences (488 | 7.9%) are the most common fields of study among 6,164 individuals in Ocean Springs who have obtained a bachelor's degree or higher.
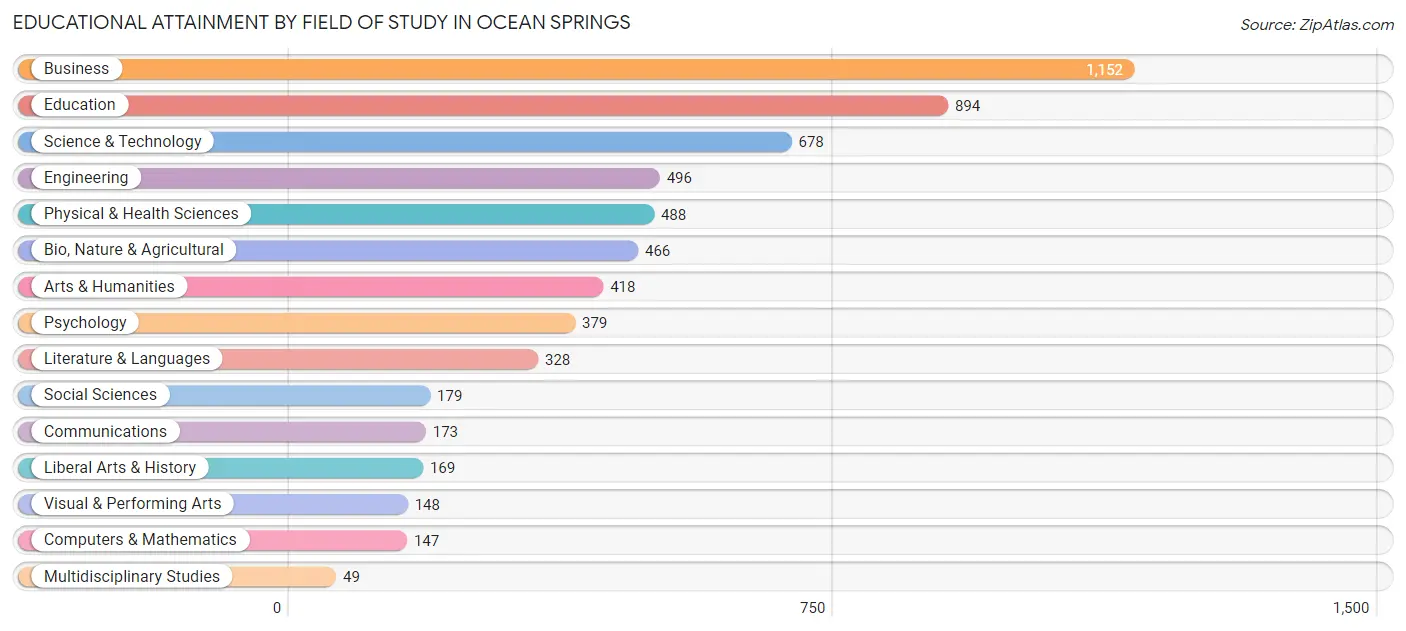
| Field of Study | # Graduates | % Graduates |
| Computers & Mathematics | 147 | 2.4% |
| Bio, Nature & Agricultural | 466 | 7.6% |
| Physical & Health Sciences | 488 | 7.9% |
| Psychology | 379 | 6.1% |
| Social Sciences | 179 | 2.9% |
| Engineering | 496 | 8.1% |
| Multidisciplinary Studies | 49 | 0.8% |
| Science & Technology | 678 | 11.0% |
| Business | 1,152 | 18.7% |
| Education | 894 | 14.5% |
| Literature & Languages | 328 | 5.3% |
| Liberal Arts & History | 169 | 2.7% |
| Visual & Performing Arts | 148 | 2.4% |
| Communications | 173 | 2.8% |
| Arts & Humanities | 418 | 6.8% |
| Total | 6,164 | 100.0% |
Transportation & Commute in Ocean Springs
Vehicle Availability by Sex in Ocean Springs
The most prevalent vehicle ownership categories in Ocean Springs are males with 2 vehicles (2,252, accounting for 45.0%) and females with 2 vehicles (1,315, making up 64.0%).
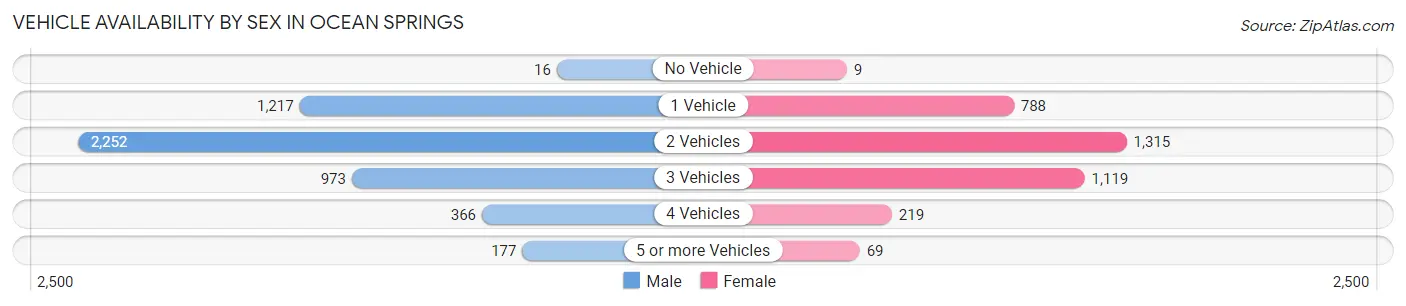
| Vehicles Available | Male | Female |
| No Vehicle | 16 (0.3%) | 9 (0.3%) |
| 1 Vehicle | 1,217 (24.3%) | 788 (22.4%) |
| 2 Vehicles | 2,252 (45.0%) | 1,315 (37.4%) |
| 3 Vehicles | 973 (19.5%) | 1,119 (31.8%) |
| 4 Vehicles | 366 (7.3%) | 219 (6.2%) |
| 5 or more Vehicles | 177 (3.5%) | 69 (2.0%) |
| Total | 5,001 (100.0%) | 3,519 (100.0%) |
Commute Time in Ocean Springs
The most frequently occuring commute durations in Ocean Springs are 15 to 19 minutes (1,544 commuters, 19.7%), 30 to 34 minutes (1,172 commuters, 15.0%), and 20 to 24 minutes (1,073 commuters, 13.7%).
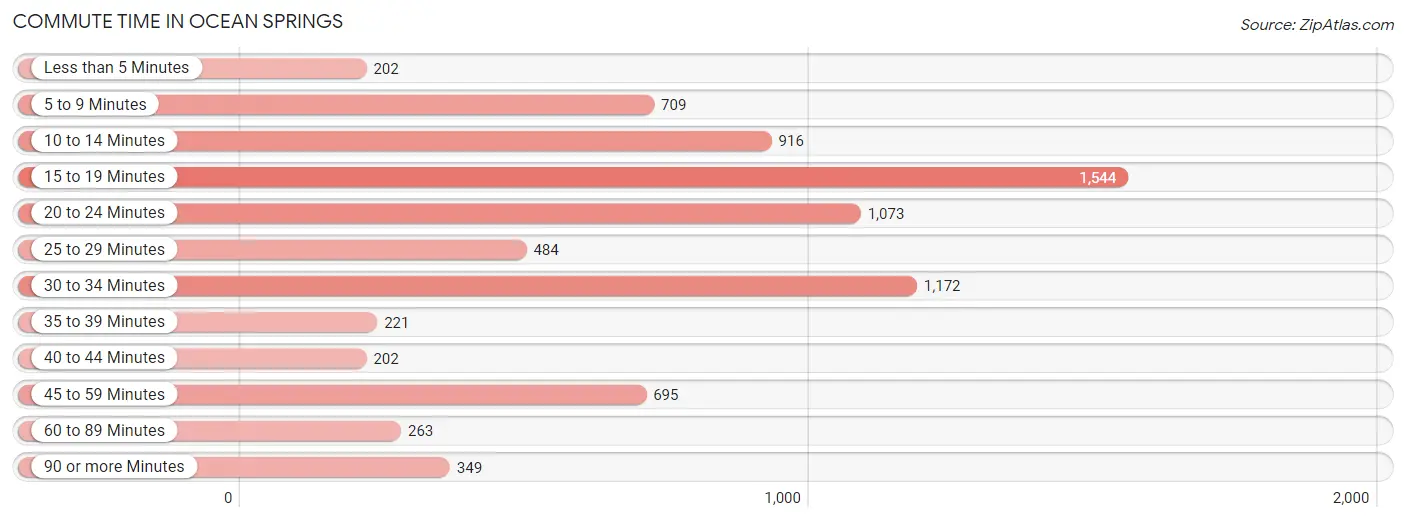
| Commute Time | # Commuters | % Commuters |
| Less than 5 Minutes | 202 | 2.6% |
| 5 to 9 Minutes | 709 | 9.0% |
| 10 to 14 Minutes | 916 | 11.7% |
| 15 to 19 Minutes | 1,544 | 19.7% |
| 20 to 24 Minutes | 1,073 | 13.7% |
| 25 to 29 Minutes | 484 | 6.2% |
| 30 to 34 Minutes | 1,172 | 15.0% |
| 35 to 39 Minutes | 221 | 2.8% |
| 40 to 44 Minutes | 202 | 2.6% |
| 45 to 59 Minutes | 695 | 8.9% |
| 60 to 89 Minutes | 263 | 3.4% |
| 90 or more Minutes | 349 | 4.5% |
Commute Time by Sex in Ocean Springs
The most common commute times in Ocean Springs are 15 to 19 minutes (853 commuters, 18.4%) for males and 15 to 19 minutes (691 commuters, 21.6%) for females.
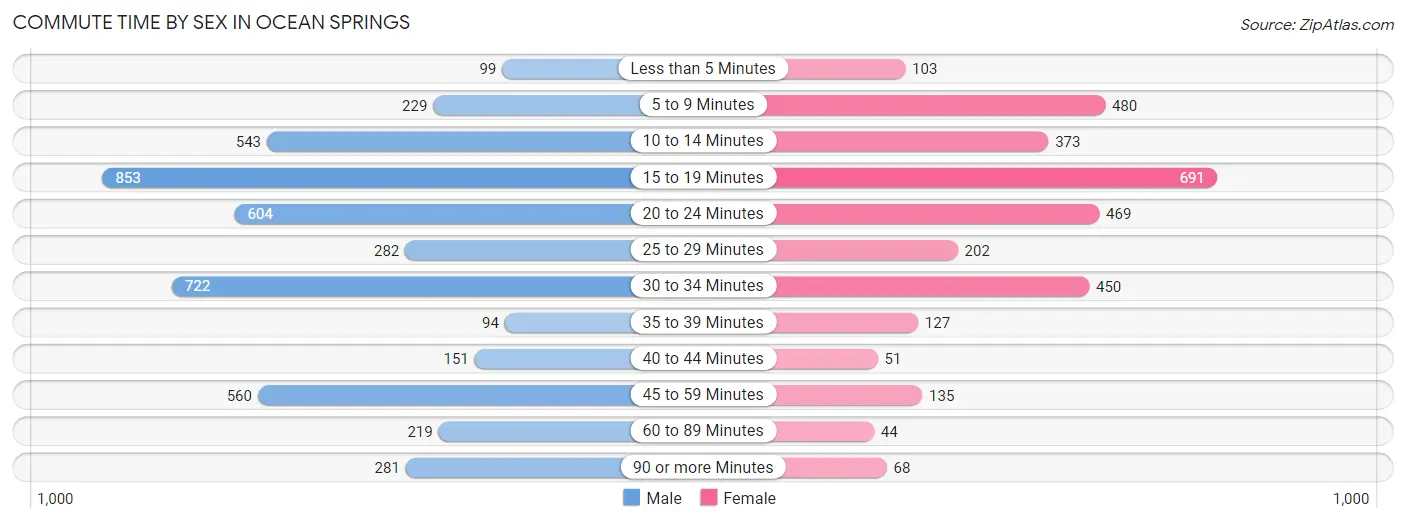
| Commute Time | Male | Female |
| Less than 5 Minutes | 99 (2.1%) | 103 (3.2%) |
| 5 to 9 Minutes | 229 (4.9%) | 480 (15.0%) |
| 10 to 14 Minutes | 543 (11.7%) | 373 (11.7%) |
| 15 to 19 Minutes | 853 (18.4%) | 691 (21.6%) |
| 20 to 24 Minutes | 604 (13.0%) | 469 (14.7%) |
| 25 to 29 Minutes | 282 (6.1%) | 202 (6.3%) |
| 30 to 34 Minutes | 722 (15.6%) | 450 (14.1%) |
| 35 to 39 Minutes | 94 (2.0%) | 127 (4.0%) |
| 40 to 44 Minutes | 151 (3.3%) | 51 (1.6%) |
| 45 to 59 Minutes | 560 (12.1%) | 135 (4.2%) |
| 60 to 89 Minutes | 219 (4.7%) | 44 (1.4%) |
| 90 or more Minutes | 281 (6.1%) | 68 (2.1%) |
Time of Departure to Work by Sex in Ocean Springs
The most frequent times of departure to work in Ocean Springs are 6:00 AM to 6:29 AM (626, 13.5%) for males and 7:30 AM to 7:59 AM (578, 18.1%) for females.
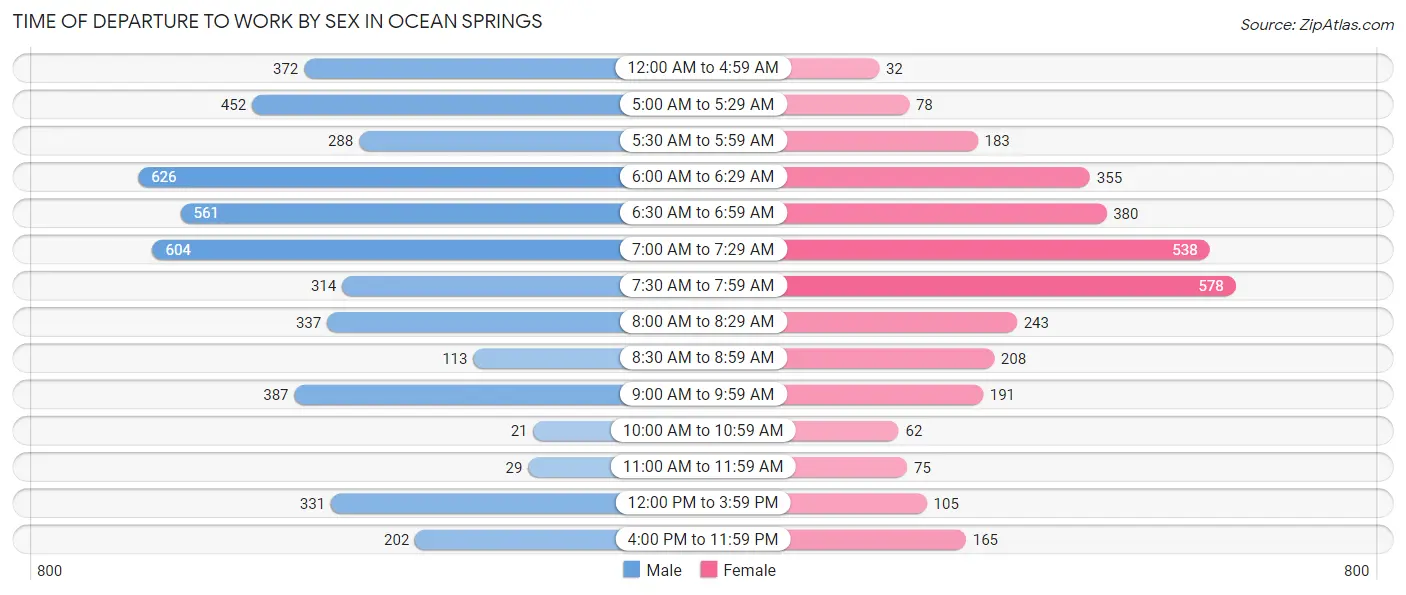
| Time of Departure | Male | Female |
| 12:00 AM to 4:59 AM | 372 (8.0%) | 32 (1.0%) |
| 5:00 AM to 5:29 AM | 452 (9.8%) | 78 (2.4%) |
| 5:30 AM to 5:59 AM | 288 (6.2%) | 183 (5.7%) |
| 6:00 AM to 6:29 AM | 626 (13.5%) | 355 (11.1%) |
| 6:30 AM to 6:59 AM | 561 (12.1%) | 380 (11.9%) |
| 7:00 AM to 7:29 AM | 604 (13.0%) | 538 (16.9%) |
| 7:30 AM to 7:59 AM | 314 (6.8%) | 578 (18.1%) |
| 8:00 AM to 8:29 AM | 337 (7.3%) | 243 (7.6%) |
| 8:30 AM to 8:59 AM | 113 (2.4%) | 208 (6.5%) |
| 9:00 AM to 9:59 AM | 387 (8.4%) | 191 (6.0%) |
| 10:00 AM to 10:59 AM | 21 (0.4%) | 62 (1.9%) |
| 11:00 AM to 11:59 AM | 29 (0.6%) | 75 (2.4%) |
| 12:00 PM to 3:59 PM | 331 (7.1%) | 105 (3.3%) |
| 4:00 PM to 11:59 PM | 202 (4.4%) | 165 (5.2%) |
| Total | 4,637 (100.0%) | 3,193 (100.0%) |
Housing Occupancy in Ocean Springs
Occupancy by Ownership in Ocean Springs
Of the total 7,902 dwellings in Ocean Springs, owner-occupied units account for 5,529 (70.0%), while renter-occupied units make up 2,373 (30.0%).
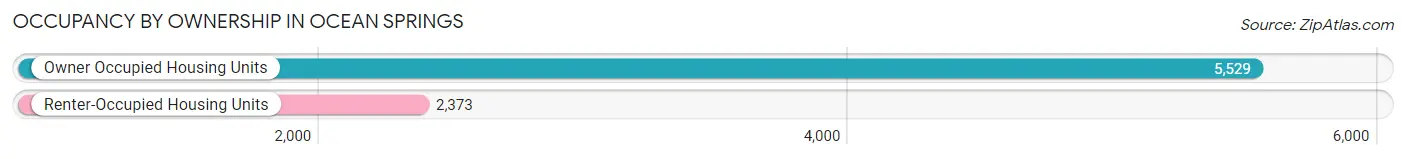
| Occupancy | # Housing Units | % Housing Units |
| Owner Occupied Housing Units | 5,529 | 70.0% |
| Renter-Occupied Housing Units | 2,373 | 30.0% |
| Total Occupied Housing Units | 7,902 | 100.0% |
Occupancy by Household Size in Ocean Springs
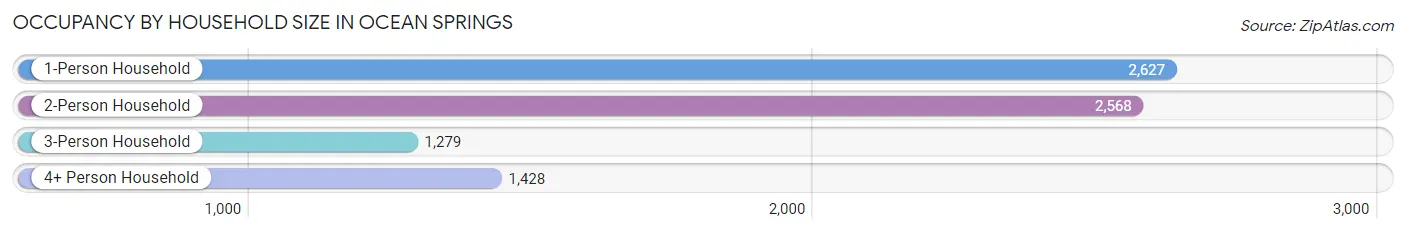
| Household Size | # Housing Units | % Housing Units |
| 1-Person Household | 2,627 | 33.2% |
| 2-Person Household | 2,568 | 32.5% |
| 3-Person Household | 1,279 | 16.2% |
| 4+ Person Household | 1,428 | 18.1% |
| Total Housing Units | 7,902 | 100.0% |
Occupancy by Ownership by Household Size in Ocean Springs
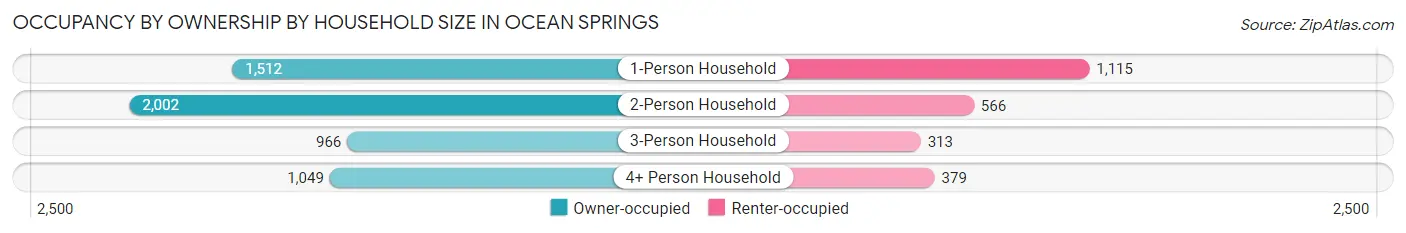
| Household Size | Owner-occupied | Renter-occupied |
| 1-Person Household | 1,512 (57.6%) | 1,115 (42.4%) |
| 2-Person Household | 2,002 (78.0%) | 566 (22.0%) |
| 3-Person Household | 966 (75.5%) | 313 (24.5%) |
| 4+ Person Household | 1,049 (73.5%) | 379 (26.5%) |
| Total Housing Units | 5,529 (70.0%) | 2,373 (30.0%) |
Occupancy by Educational Attainment in Ocean Springs
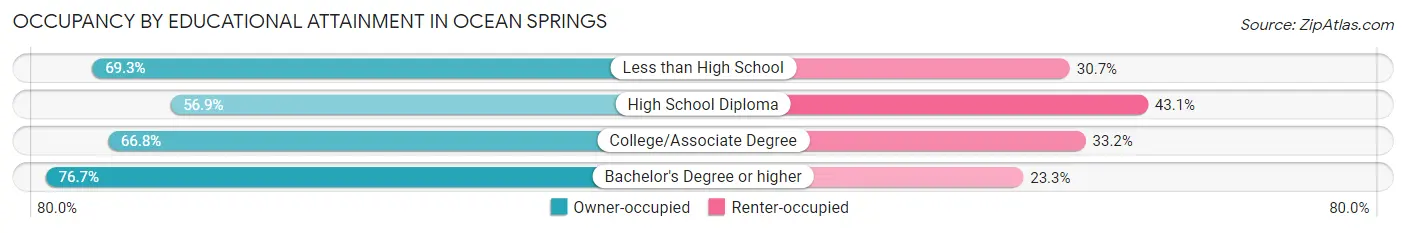
| Household Size | Owner-occupied | Renter-occupied |
| Less than High School | 284 (69.3%) | 126 (30.7%) |
| High School Diploma | 697 (56.9%) | 528 (43.1%) |
| College/Associate Degree | 1,733 (66.8%) | 862 (33.2%) |
| Bachelor's Degree or higher | 2,815 (76.7%) | 857 (23.3%) |
Occupancy by Age of Householder in Ocean Springs
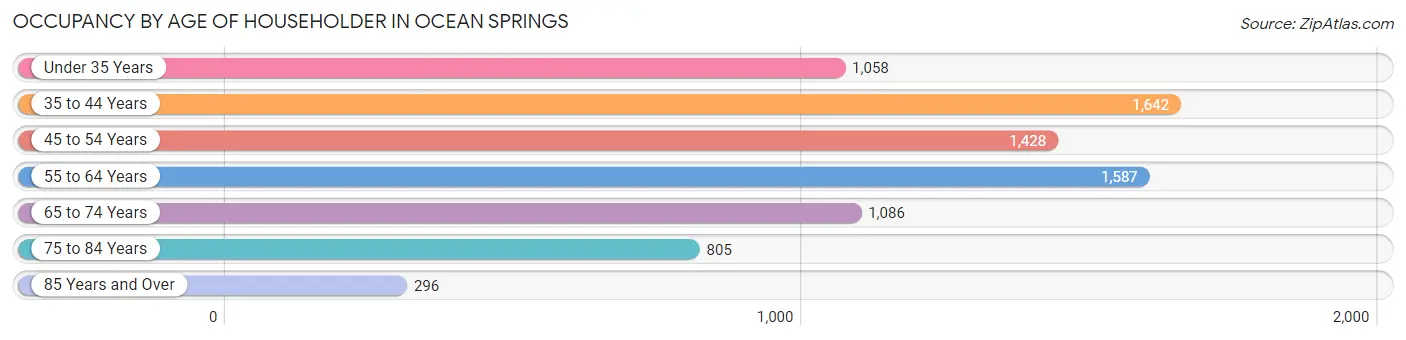
| Age Bracket | # Households | % Households |
| Under 35 Years | 1,058 | 13.4% |
| 35 to 44 Years | 1,642 | 20.8% |
| 45 to 54 Years | 1,428 | 18.1% |
| 55 to 64 Years | 1,587 | 20.1% |
| 65 to 74 Years | 1,086 | 13.7% |
| 75 to 84 Years | 805 | 10.2% |
| 85 Years and Over | 296 | 3.7% |
| Total | 7,902 | 100.0% |
Housing Finances in Ocean Springs
Median Income by Occupancy in Ocean Springs
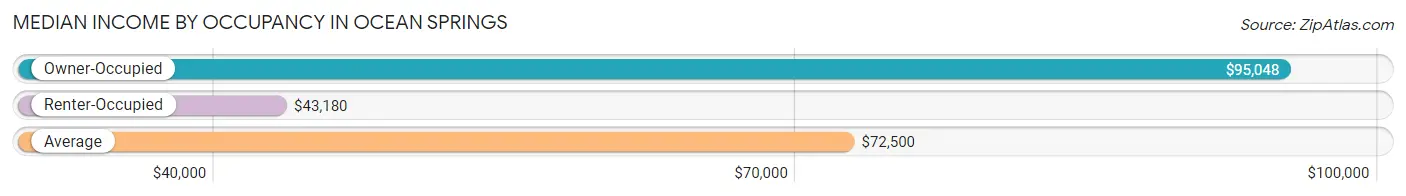
| Occupancy Type | # Households | Median Income |
| Owner-Occupied | 5,529 (70.0%) | $95,048 |
| Renter-Occupied | 2,373 (30.0%) | $43,180 |
| Average | 7,902 (100.0%) | $72,500 |
Occupancy by Householder Income Bracket in Ocean Springs
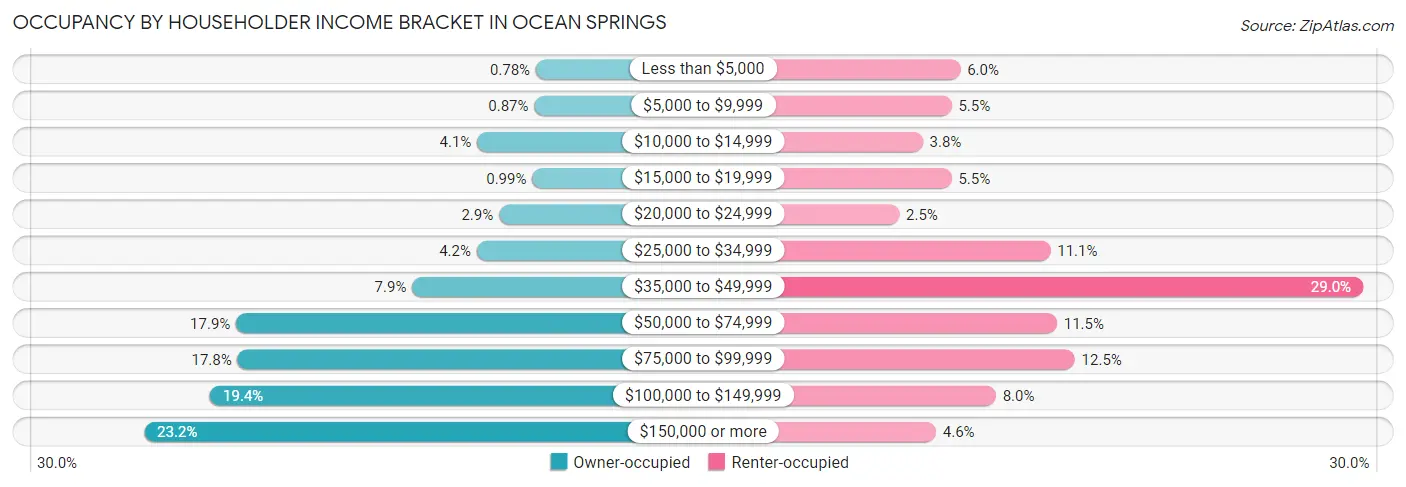
| Income Bracket | Owner-occupied | Renter-occupied |
| Less than $5,000 | 43 (0.8%) | 142 (6.0%) |
| $5,000 to $9,999 | 48 (0.9%) | 130 (5.5%) |
| $10,000 to $14,999 | 229 (4.1%) | 91 (3.8%) |
| $15,000 to $19,999 | 55 (1.0%) | 130 (5.5%) |
| $20,000 to $24,999 | 160 (2.9%) | 59 (2.5%) |
| $25,000 to $34,999 | 230 (4.2%) | 264 (11.1%) |
| $35,000 to $49,999 | 434 (7.9%) | 688 (29.0%) |
| $50,000 to $74,999 | 990 (17.9%) | 273 (11.5%) |
| $75,000 to $99,999 | 986 (17.8%) | 297 (12.5%) |
| $100,000 to $149,999 | 1,073 (19.4%) | 190 (8.0%) |
| $150,000 or more | 1,281 (23.2%) | 109 (4.6%) |
| Total | 5,529 (100.0%) | 2,373 (100.0%) |
Monthly Housing Cost Tiers in Ocean Springs
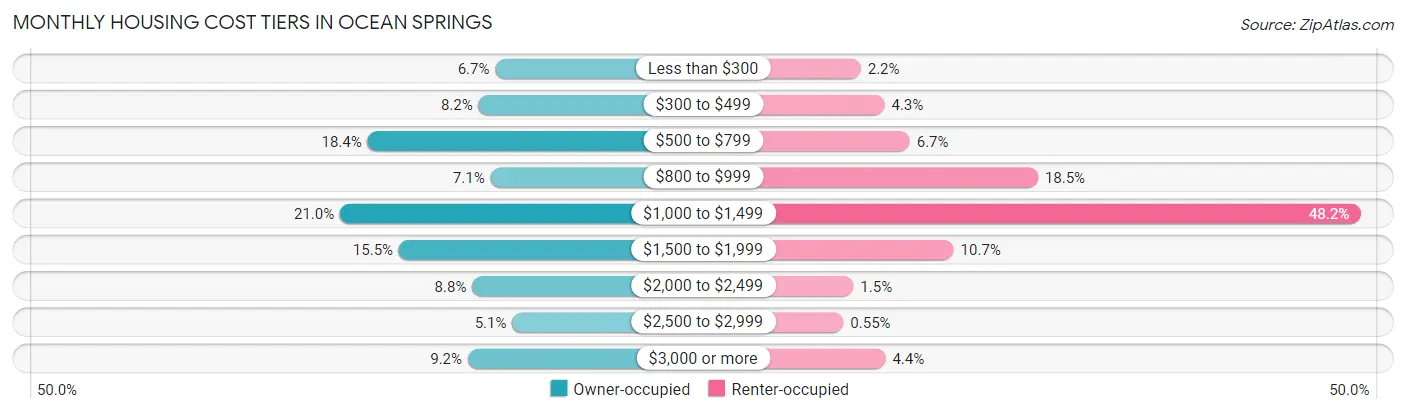
| Monthly Cost | Owner-occupied | Renter-occupied |
| Less than $300 | 369 (6.7%) | 51 (2.1%) |
| $300 to $499 | 454 (8.2%) | 103 (4.3%) |
| $500 to $799 | 1,019 (18.4%) | 158 (6.7%) |
| $800 to $999 | 393 (7.1%) | 438 (18.5%) |
| $1,000 to $1,499 | 1,159 (21.0%) | 1,144 (48.2%) |
| $1,500 to $1,999 | 859 (15.5%) | 254 (10.7%) |
| $2,000 to $2,499 | 486 (8.8%) | 35 (1.5%) |
| $2,500 to $2,999 | 282 (5.1%) | 13 (0.5%) |
| $3,000 or more | 508 (9.2%) | 105 (4.4%) |
| Total | 5,529 (100.0%) | 2,373 (100.0%) |
Physical Housing Characteristics in Ocean Springs
Housing Structures in Ocean Springs
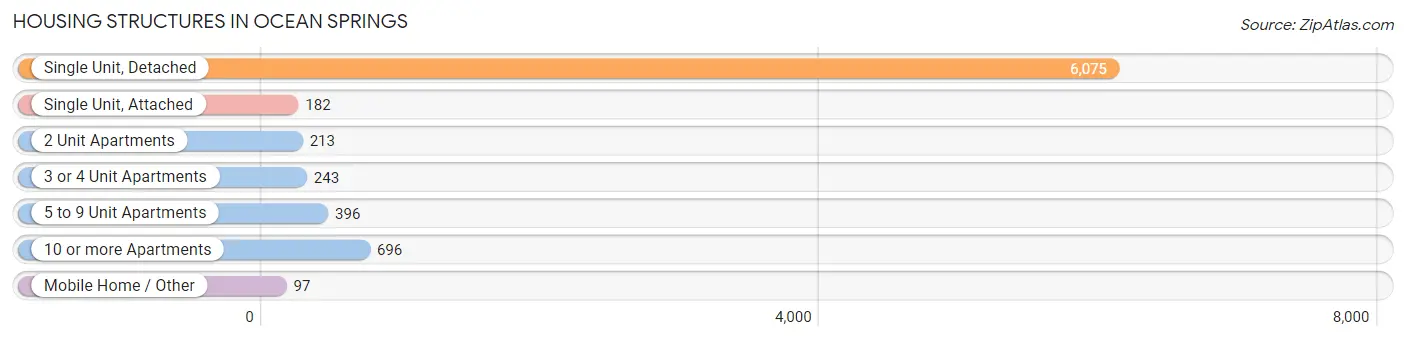
| Structure Type | # Housing Units | % Housing Units |
| Single Unit, Detached | 6,075 | 76.9% |
| Single Unit, Attached | 182 | 2.3% |
| 2 Unit Apartments | 213 | 2.7% |
| 3 or 4 Unit Apartments | 243 | 3.1% |
| 5 to 9 Unit Apartments | 396 | 5.0% |
| 10 or more Apartments | 696 | 8.8% |
| Mobile Home / Other | 97 | 1.2% |
| Total | 7,902 | 100.0% |
Housing Structures by Occupancy in Ocean Springs
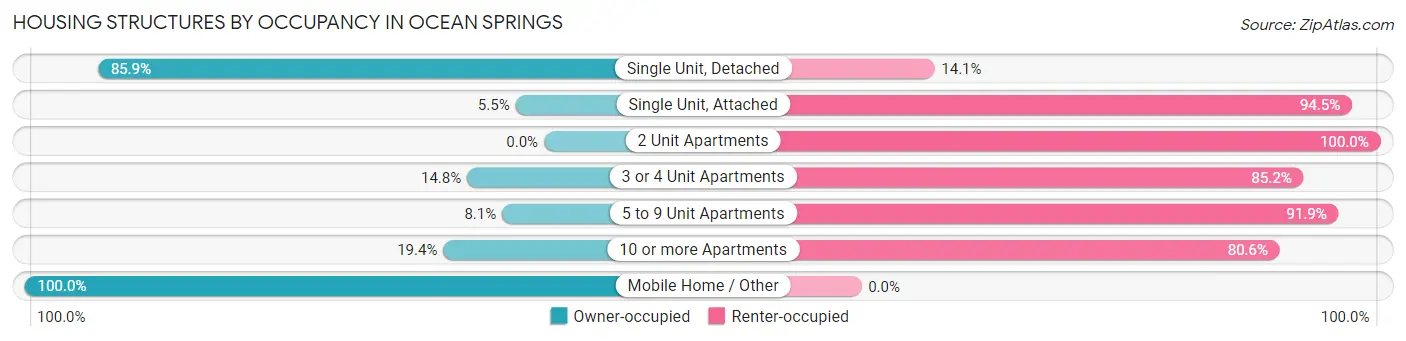
| Structure Type | Owner-occupied | Renter-occupied |
| Single Unit, Detached | 5,219 (85.9%) | 856 (14.1%) |
| Single Unit, Attached | 10 (5.5%) | 172 (94.5%) |
| 2 Unit Apartments | 0 (0.0%) | 213 (100.0%) |
| 3 or 4 Unit Apartments | 36 (14.8%) | 207 (85.2%) |
| 5 to 9 Unit Apartments | 32 (8.1%) | 364 (91.9%) |
| 10 or more Apartments | 135 (19.4%) | 561 (80.6%) |
| Mobile Home / Other | 97 (100.0%) | 0 (0.0%) |
| Total | 5,529 (70.0%) | 2,373 (30.0%) |
Housing Structures by Number of Rooms in Ocean Springs
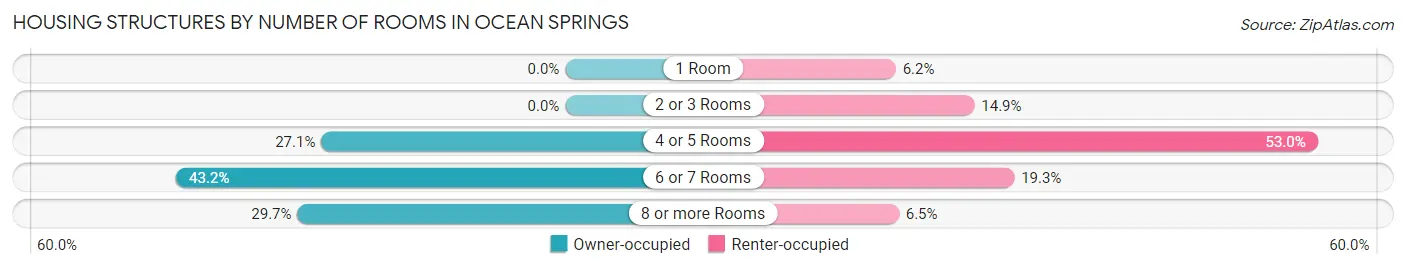
| Number of Rooms | Owner-occupied | Renter-occupied |
| 1 Room | 0 (0.0%) | 147 (6.2%) |
| 2 or 3 Rooms | 0 (0.0%) | 354 (14.9%) |
| 4 or 5 Rooms | 1,497 (27.1%) | 1,258 (53.0%) |
| 6 or 7 Rooms | 2,388 (43.2%) | 459 (19.3%) |
| 8 or more Rooms | 1,644 (29.7%) | 155 (6.5%) |
| Total | 5,529 (100.0%) | 2,373 (100.0%) |
Housing Structure by Heating Type in Ocean Springs
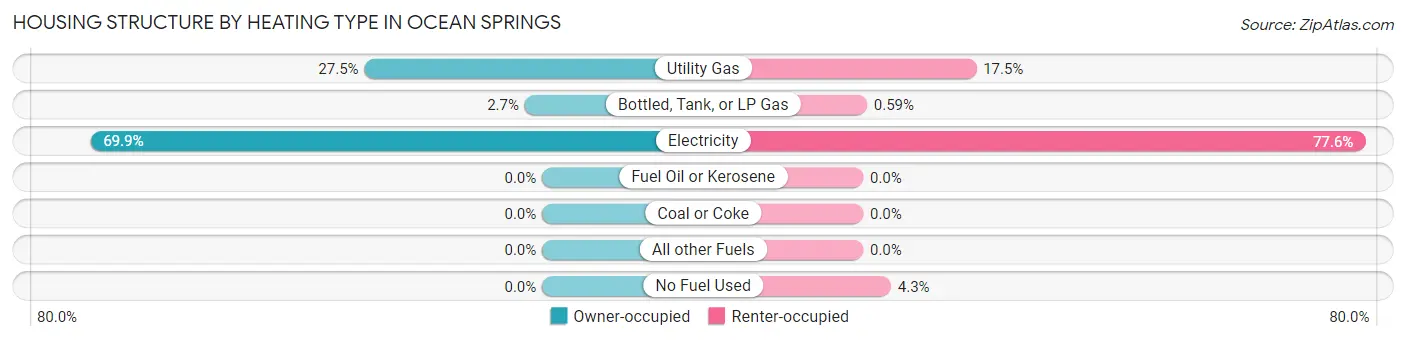
| Heating Type | Owner-occupied | Renter-occupied |
| Utility Gas | 1,519 (27.5%) | 415 (17.5%) |
| Bottled, Tank, or LP Gas | 148 (2.7%) | 14 (0.6%) |
| Electricity | 3,862 (69.9%) | 1,842 (77.6%) |
| Fuel Oil or Kerosene | 0 (0.0%) | 0 (0.0%) |
| Coal or Coke | 0 (0.0%) | 0 (0.0%) |
| All other Fuels | 0 (0.0%) | 0 (0.0%) |
| No Fuel Used | 0 (0.0%) | 102 (4.3%) |
| Total | 5,529 (100.0%) | 2,373 (100.0%) |
Household Vehicle Usage in Ocean Springs
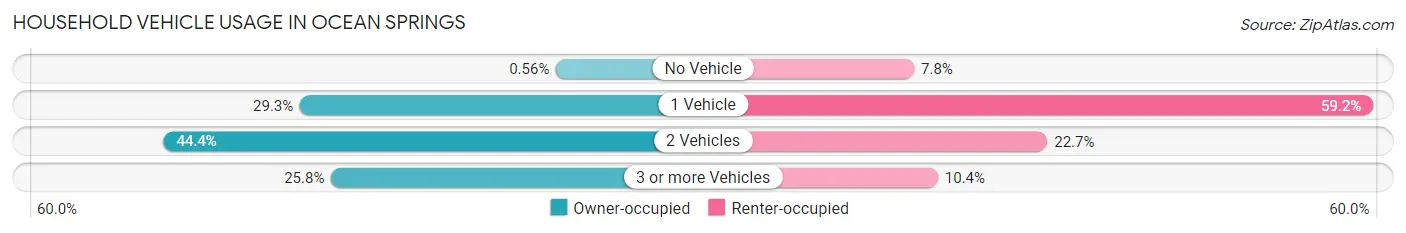
| Vehicles per Household | Owner-occupied | Renter-occupied |
| No Vehicle | 31 (0.6%) | 184 (7.7%) |
| 1 Vehicle | 1,617 (29.2%) | 1,404 (59.2%) |
| 2 Vehicles | 2,457 (44.4%) | 538 (22.7%) |
| 3 or more Vehicles | 1,424 (25.8%) | 247 (10.4%) |
| Total | 5,529 (100.0%) | 2,373 (100.0%) |
Real Estate & Mortgages in Ocean Springs
Real Estate and Mortgage Overview in Ocean Springs
| Characteristic | Without Mortgage | With Mortgage |
| Housing Units | 2,027 | 3,502 |
| Median Property Value | $197,500 | $223,700 |
| Median Household Income | $63,074 | $993 |
| Monthly Housing Costs | $567 | $489 |
| Real Estate Taxes | $1,510 | $220 |
Property Value by Mortgage Status in Ocean Springs
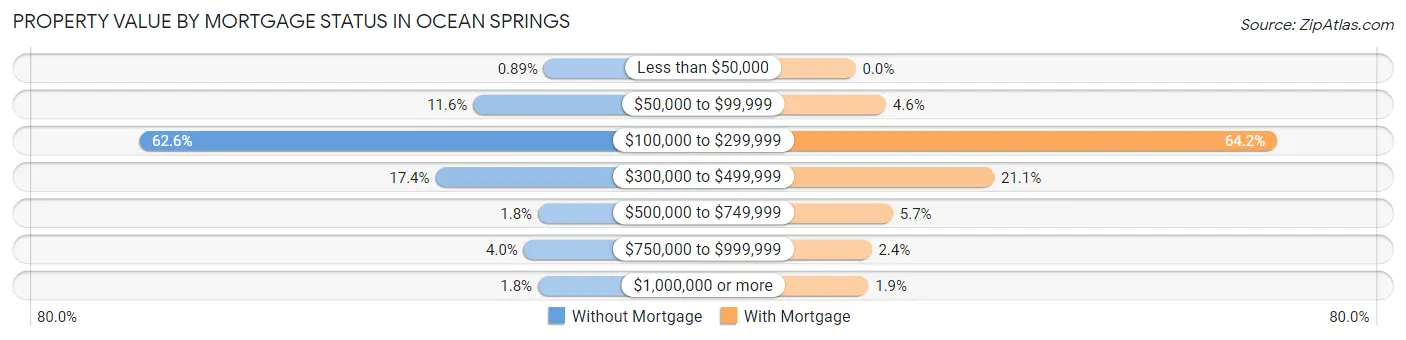
| Property Value | Without Mortgage | With Mortgage |
| Less than $50,000 | 18 (0.9%) | 0 (0.0%) |
| $50,000 to $99,999 | 236 (11.6%) | 162 (4.6%) |
| $100,000 to $299,999 | 1,268 (62.6%) | 2,249 (64.2%) |
| $300,000 to $499,999 | 353 (17.4%) | 739 (21.1%) |
| $500,000 to $749,999 | 36 (1.8%) | 199 (5.7%) |
| $750,000 to $999,999 | 80 (4.0%) | 85 (2.4%) |
| $1,000,000 or more | 36 (1.8%) | 68 (1.9%) |
| Total | 2,027 (100.0%) | 3,502 (100.0%) |
Household Income by Mortgage Status in Ocean Springs
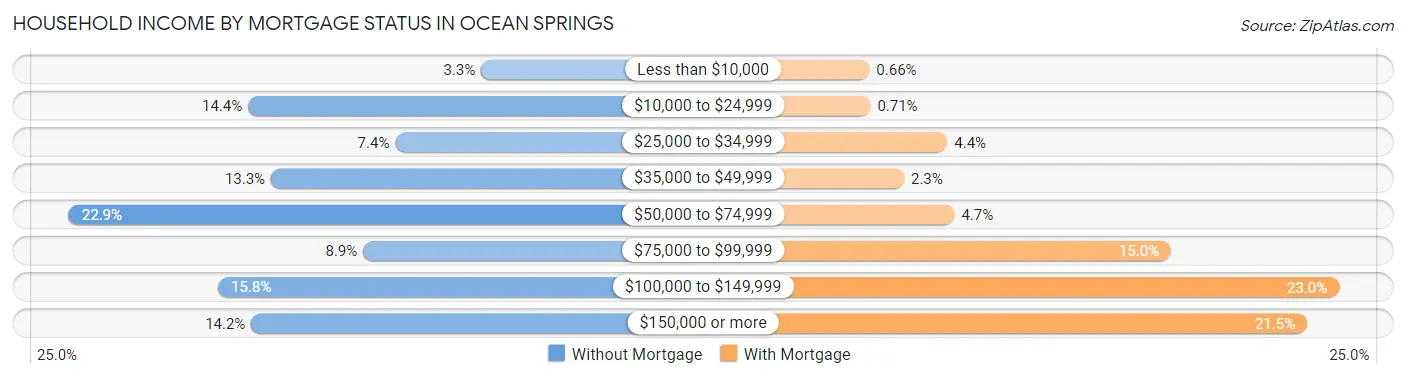
| Household Income | Without Mortgage | With Mortgage |
| Less than $10,000 | 66 (3.3%) | 23 (0.7%) |
| $10,000 to $24,999 | 291 (14.4%) | 25 (0.7%) |
| $25,000 to $34,999 | 149 (7.3%) | 153 (4.4%) |
| $35,000 to $49,999 | 269 (13.3%) | 81 (2.3%) |
| $50,000 to $74,999 | 464 (22.9%) | 165 (4.7%) |
| $75,000 to $99,999 | 180 (8.9%) | 526 (15.0%) |
| $100,000 to $149,999 | 320 (15.8%) | 806 (23.0%) |
| $150,000 or more | 288 (14.2%) | 753 (21.5%) |
| Total | 2,027 (100.0%) | 3,502 (100.0%) |
Property Value to Household Income Ratio in Ocean Springs
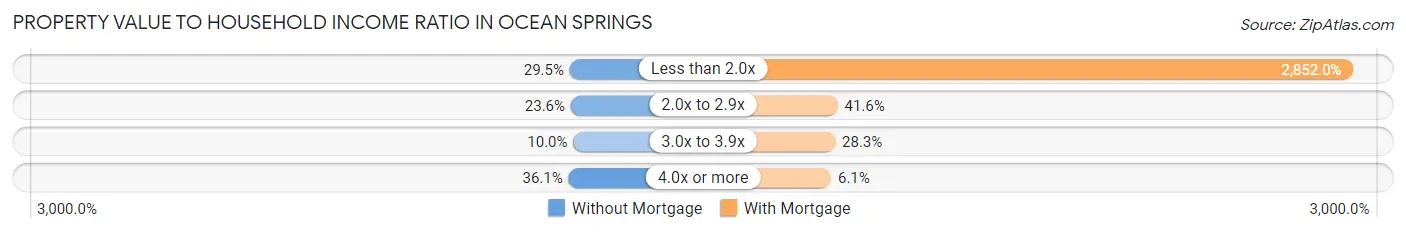
| Value-to-Income Ratio | Without Mortgage | With Mortgage |
| Less than 2.0x | 598 (29.5%) | 99,877 (2,852.0%) |
| 2.0x to 2.9x | 479 (23.6%) | 1,456 (41.6%) |
| 3.0x to 3.9x | 203 (10.0%) | 991 (28.3%) |
| 4.0x or more | 731 (36.1%) | 213 (6.1%) |
| Total | 2,027 (100.0%) | 3,502 (100.0%) |
Real Estate Taxes by Mortgage Status in Ocean Springs
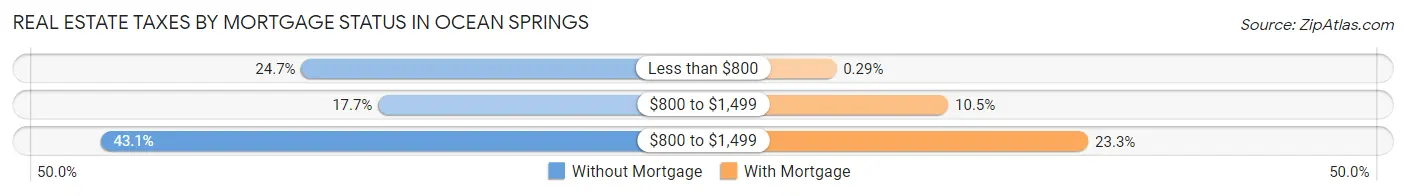
| Property Taxes | Without Mortgage | With Mortgage |
| Less than $800 | 501 (24.7%) | 10 (0.3%) |
| $800 to $1,499 | 359 (17.7%) | 368 (10.5%) |
| $800 to $1,499 | 873 (43.1%) | 816 (23.3%) |
| Total | 2,027 (100.0%) | 3,502 (100.0%) |
Health & Disability in Ocean Springs
Health Insurance Coverage by Age in Ocean Springs
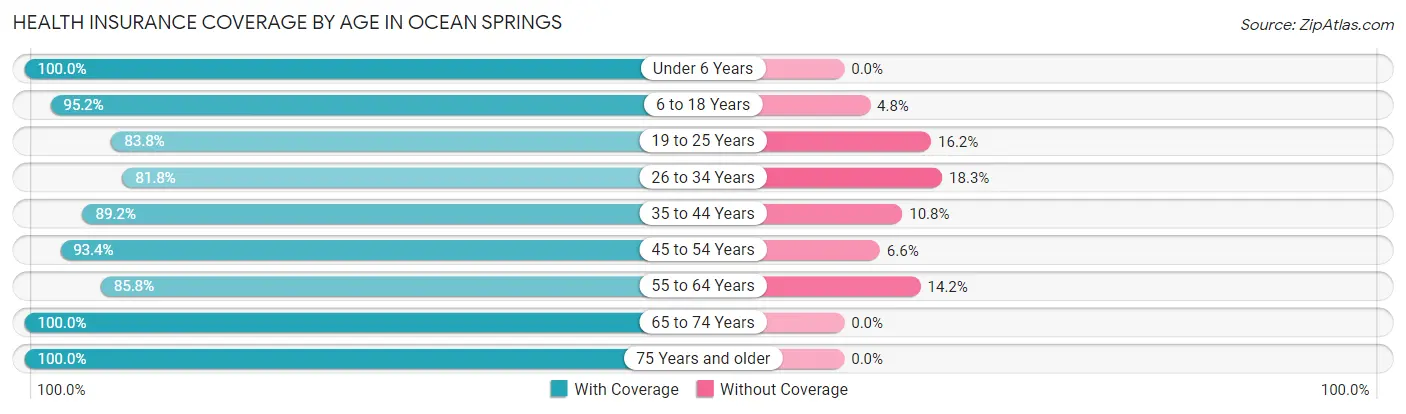
| Age Bracket | With Coverage | Without Coverage |
| Under 6 Years | 932 (100.0%) | 0 (0.0%) |
| 6 to 18 Years | 3,344 (95.2%) | 169 (4.8%) |
| 19 to 25 Years | 854 (83.8%) | 165 (16.2%) |
| 26 to 34 Years | 1,496 (81.8%) | 334 (18.2%) |
| 35 to 44 Years | 2,374 (89.2%) | 288 (10.8%) |
| 45 to 54 Years | 2,026 (93.4%) | 144 (6.6%) |
| 55 to 64 Years | 2,326 (85.8%) | 386 (14.2%) |
| 65 to 74 Years | 1,755 (100.0%) | 0 (0.0%) |
| 75 Years and older | 1,590 (100.0%) | 0 (0.0%) |
| Total | 16,697 (91.8%) | 1,486 (8.2%) |
Health Insurance Coverage by Citizenship Status in Ocean Springs
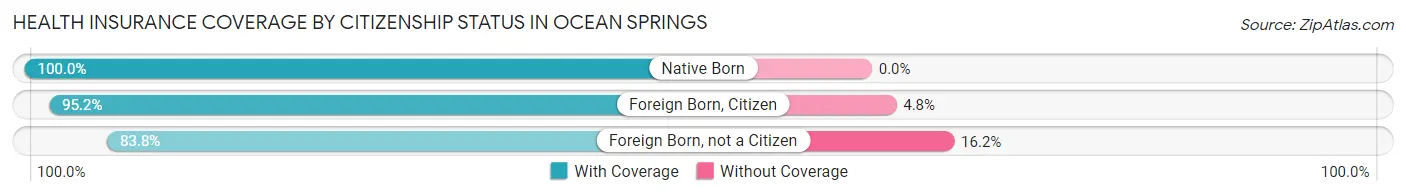
| Citizenship Status | With Coverage | Without Coverage |
| Native Born | 932 (100.0%) | 0 (0.0%) |
| Foreign Born, Citizen | 3,344 (95.2%) | 169 (4.8%) |
| Foreign Born, not a Citizen | 854 (83.8%) | 165 (16.2%) |
Health Insurance Coverage by Household Income in Ocean Springs
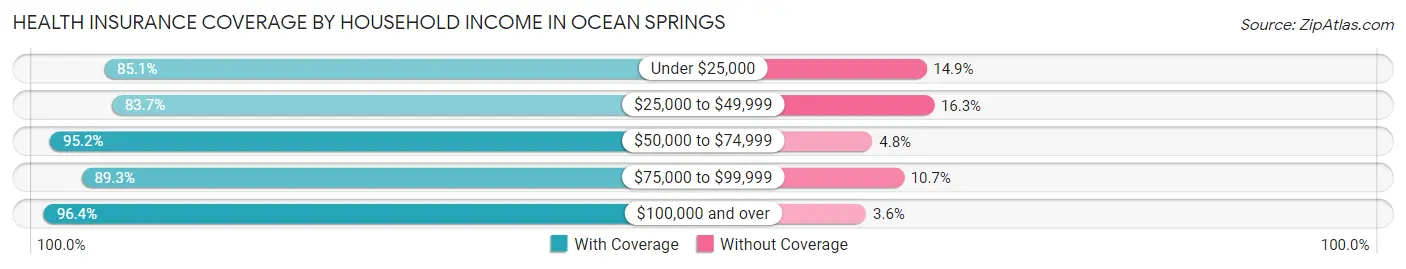
| Household Income | With Coverage | Without Coverage |
| Under $25,000 | 1,131 (85.1%) | 198 (14.9%) |
| $25,000 to $49,999 | 2,491 (83.7%) | 486 (16.3%) |
| $50,000 to $74,999 | 2,267 (95.2%) | 114 (4.8%) |
| $75,000 to $99,999 | 3,454 (89.3%) | 412 (10.7%) |
| $100,000 and over | 7,344 (96.4%) | 275 (3.6%) |
Public vs Private Health Insurance Coverage by Age in Ocean Springs
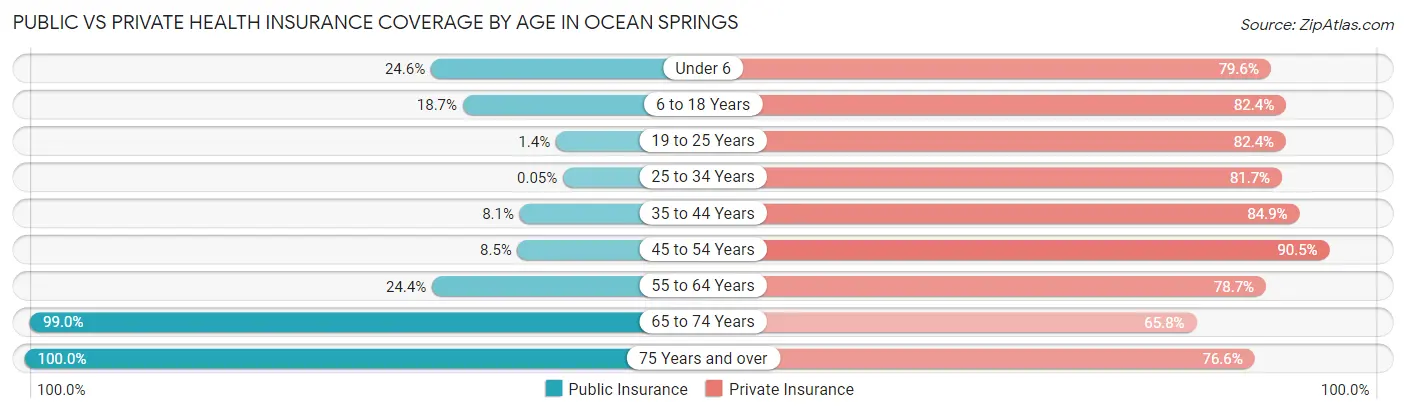
| Age Bracket | Public Insurance | Private Insurance |
| Under 6 | 229 (24.6%) | 742 (79.6%) |
| 6 to 18 Years | 655 (18.6%) | 2,896 (82.4%) |
| 19 to 25 Years | 14 (1.4%) | 840 (82.4%) |
| 25 to 34 Years | 1 (0.1%) | 1,495 (81.7%) |
| 35 to 44 Years | 215 (8.1%) | 2,261 (84.9%) |
| 45 to 54 Years | 184 (8.5%) | 1,964 (90.5%) |
| 55 to 64 Years | 661 (24.4%) | 2,135 (78.7%) |
| 65 to 74 Years | 1,737 (99.0%) | 1,155 (65.8%) |
| 75 Years and over | 1,590 (100.0%) | 1,218 (76.6%) |
| Total | 5,286 (29.1%) | 14,706 (80.9%) |
Disability Status by Sex by Age in Ocean Springs
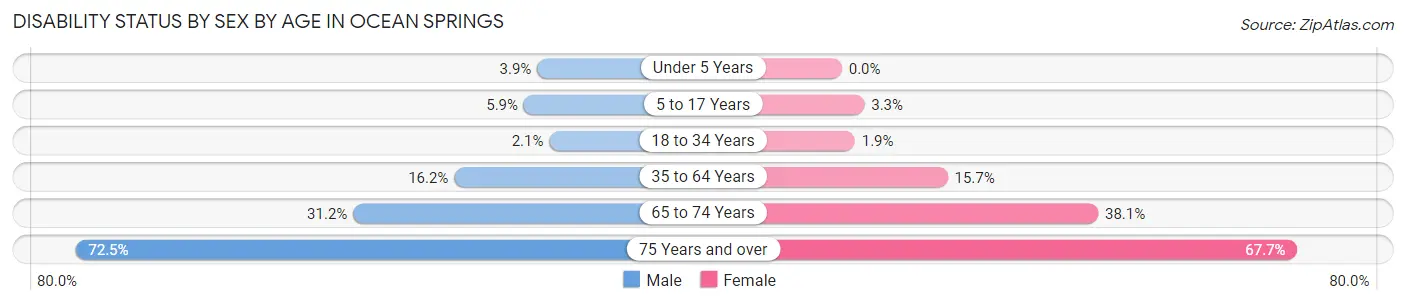
| Age Bracket | Male | Female |
| Under 5 Years | 20 (3.9%) | 0 (0.0%) |
| 5 to 17 Years | 106 (5.9%) | 58 (3.3%) |
| 18 to 34 Years | 32 (2.1%) | 29 (1.9%) |
| 35 to 64 Years | 654 (16.2%) | 551 (15.7%) |
| 65 to 74 Years | 250 (31.2%) | 363 (38.1%) |
| 75 Years and over | 413 (72.5%) | 690 (67.6%) |
Disability Class by Sex by Age in Ocean Springs
Disability Class: Hearing Difficulty
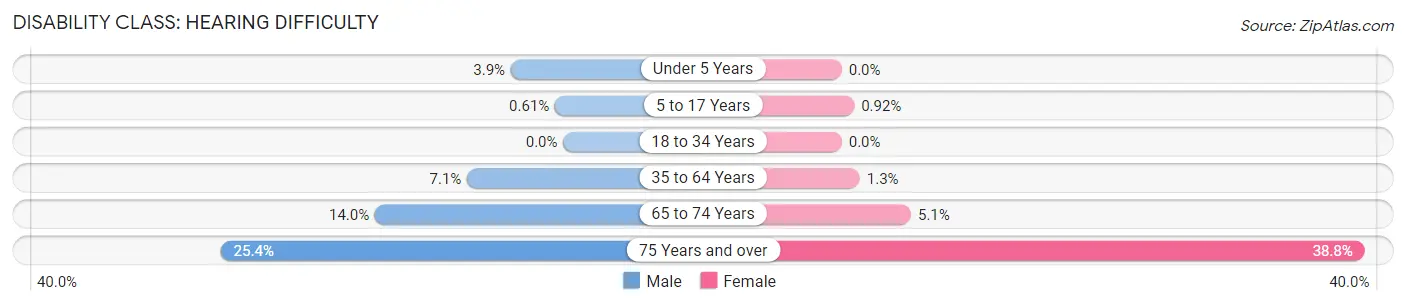
| Age Bracket | Male | Female |
| Under 5 Years | 20 (3.9%) | 0 (0.0%) |
| 5 to 17 Years | 11 (0.6%) | 16 (0.9%) |
| 18 to 34 Years | 0 (0.0%) | 0 (0.0%) |
| 35 to 64 Years | 288 (7.1%) | 47 (1.3%) |
| 65 to 74 Years | 112 (14.0%) | 49 (5.1%) |
| 75 Years and over | 145 (25.4%) | 396 (38.8%) |
Disability Class: Vision Difficulty
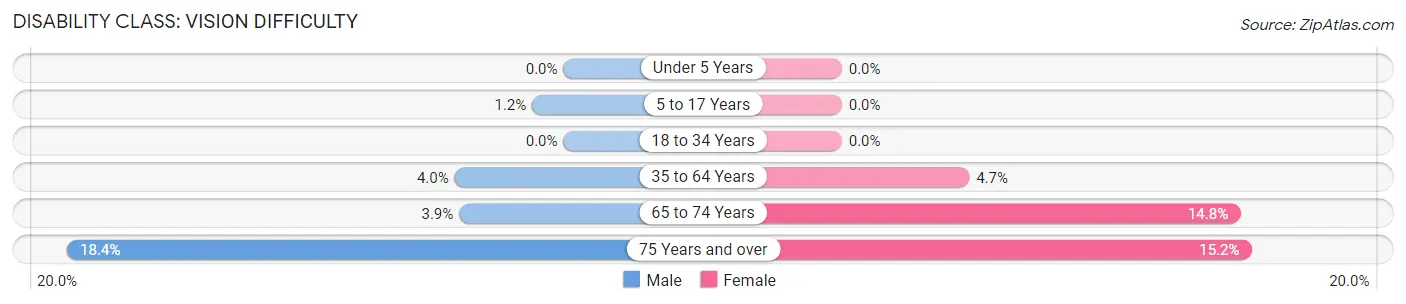
| Age Bracket | Male | Female |
| Under 5 Years | 0 (0.0%) | 0 (0.0%) |
| 5 to 17 Years | 21 (1.2%) | 0 (0.0%) |
| 18 to 34 Years | 0 (0.0%) | 0 (0.0%) |
| 35 to 64 Years | 163 (4.0%) | 166 (4.7%) |
| 65 to 74 Years | 31 (3.9%) | 141 (14.8%) |
| 75 Years and over | 105 (18.4%) | 155 (15.2%) |
Disability Class: Cognitive Difficulty
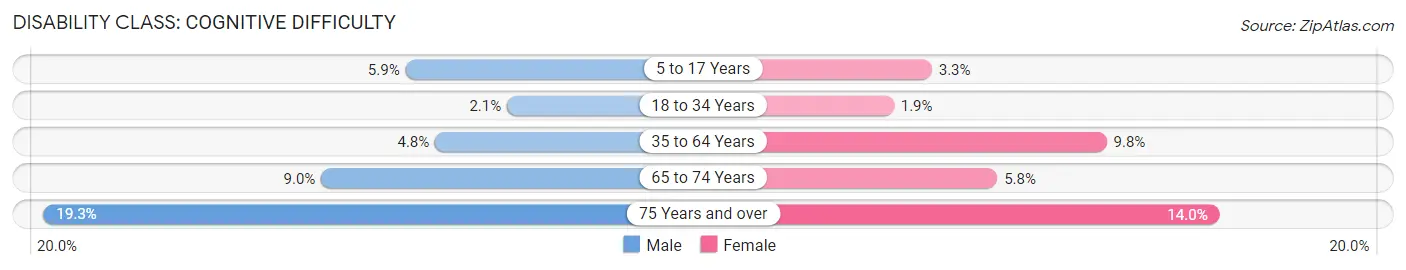
| Age Bracket | Male | Female |
| 5 to 17 Years | 106 (5.9%) | 58 (3.3%) |
| 18 to 34 Years | 32 (2.1%) | 29 (1.9%) |
| 35 to 64 Years | 192 (4.8%) | 345 (9.8%) |
| 65 to 74 Years | 72 (9.0%) | 55 (5.8%) |
| 75 Years and over | 110 (19.3%) | 143 (14.0%) |
Disability Class: Ambulatory Difficulty
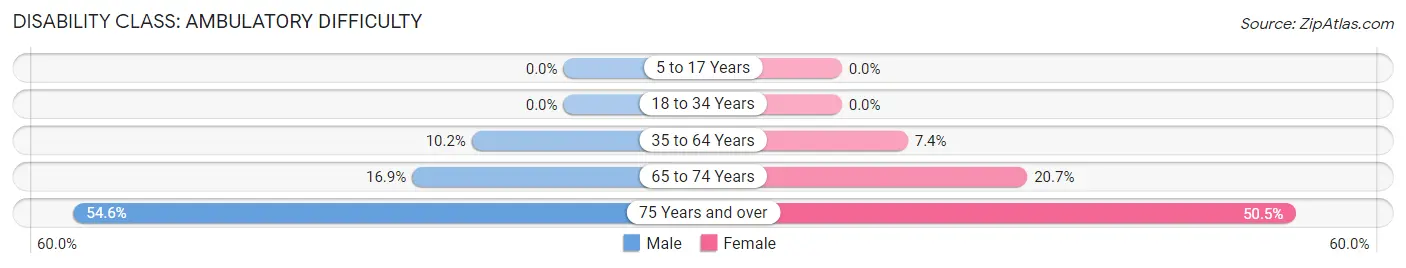
| Age Bracket | Male | Female |
| 5 to 17 Years | 0 (0.0%) | 0 (0.0%) |
| 18 to 34 Years | 0 (0.0%) | 0 (0.0%) |
| 35 to 64 Years | 412 (10.2%) | 258 (7.3%) |
| 65 to 74 Years | 135 (16.9%) | 197 (20.6%) |
| 75 Years and over | 311 (54.6%) | 515 (50.5%) |
Disability Class: Self-Care Difficulty
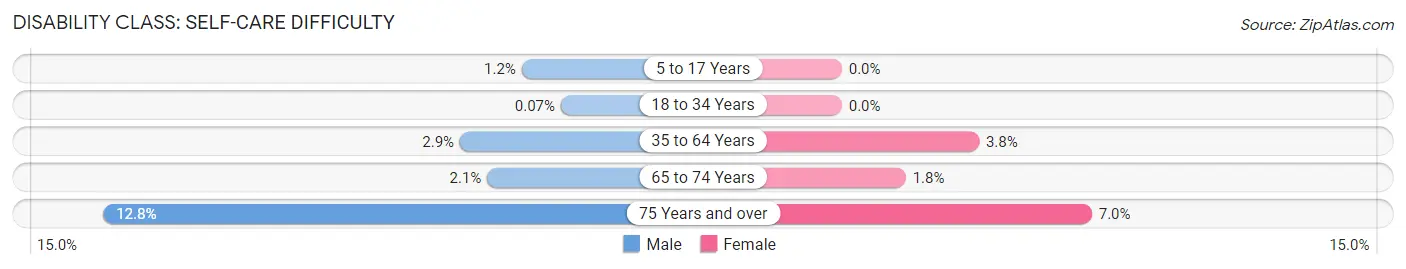
| Age Bracket | Male | Female |
| 5 to 17 Years | 21 (1.2%) | 0 (0.0%) |
| 18 to 34 Years | 1 (0.1%) | 0 (0.0%) |
| 35 to 64 Years | 116 (2.9%) | 134 (3.8%) |
| 65 to 74 Years | 17 (2.1%) | 17 (1.8%) |
| 75 Years and over | 73 (12.8%) | 71 (7.0%) |
Technology Access in Ocean Springs
Computing Device Access in Ocean Springs
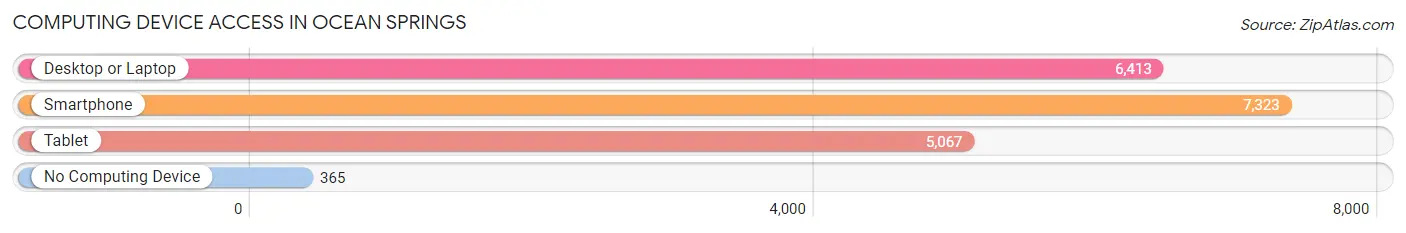
| Device Type | # Households | % Households |
| Desktop or Laptop | 6,413 | 81.2% |
| Smartphone | 7,323 | 92.7% |
| Tablet | 5,067 | 64.1% |
| No Computing Device | 365 | 4.6% |
| Total | 7,902 | 100.0% |
Internet Access in Ocean Springs
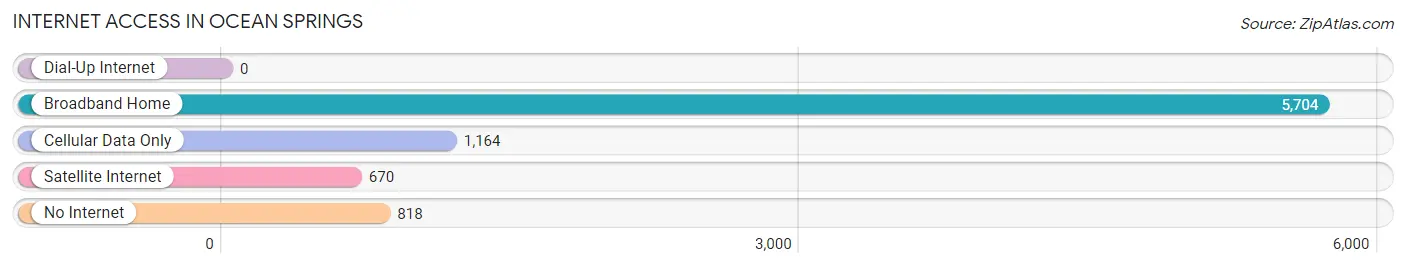
| Internet Type | # Households | % Households |
| Dial-Up Internet | 0 | 0.0% |
| Broadband Home | 5,704 | 72.2% |
| Cellular Data Only | 1,164 | 14.7% |
| Satellite Internet | 670 | 8.5% |
| No Internet | 818 | 10.3% |
| Total | 7,902 | 100.0% |
Ocean Springs Summary
History
The city of Ocean Springs, Mississippi is located in Jackson County, on the Gulf Coast of the United States. It is part of the Gulfport-Biloxi metropolitan area and is the second-largest city in the county. The city was founded in 1699 by French colonists, who named it “Biloxi” after the local Native American tribe. The city was later renamed “Ocean Springs” in 1854, after the nearby springs that were believed to have healing properties.
The city has a long and rich history, and has been home to many different cultures over the centuries. The first settlers were French colonists, who established a trading post in the area in 1699. The city was later taken over by the Spanish, who held it until 1810, when it was ceded to the United States. During the Civil War, the city was occupied by Union forces, and it was later occupied by Confederate forces during the Reconstruction era.
In the late 19th century, the city began to grow and develop, and it became a popular tourist destination. The city was home to many famous artists, including Walter Anderson and George Ohr, and it was also home to a thriving seafood industry. The city was also home to a large number of African-American residents, who were employed in the seafood industry and in other industries.
In the 20th century, the city continued to grow and develop, and it became a popular destination for tourists and retirees. The city was also home to a large number of military personnel, who were stationed at nearby Keesler Air Force Base. In the 21st century, the city has continued to grow and develop, and it is now home to a thriving arts and culture scene, as well as a vibrant economy.
Geography
Ocean Springs is located in Jackson County, on the Gulf Coast of the United States. It is part of the Gulfport-Biloxi metropolitan area and is the second-largest city in the county. The city is situated on the Mississippi Sound, and is bordered by the cities of Biloxi, Gulfport, and Pascagoula. The city is located approximately 30 miles east of Mobile, Alabama, and approximately 50 miles west of New Orleans, Louisiana.
The city has a total area of 11.3 square miles, of which 10.9 square miles is land and 0.4 square miles is water. The city is located at an elevation of 10 feet above sea level. The city is located on the Gulf of Mexico, and is bordered by the Jourdan River to the north and the Biloxi Bay to the south.
Economy
The economy of Ocean Springs is largely based on tourism, with the city being a popular destination for both domestic and international visitors. The city is home to a number of attractions, including the Walter Anderson Museum of Art, the Ocean Springs Museum of History, and the Ocean Springs Yacht Club. The city is also home to a number of restaurants, bars, and shops, as well as a number of hotels and resorts.
The city is also home to a number of industries, including shipbuilding, seafood processing, and manufacturing. The city is home to a number of large employers, including Ingalls Shipbuilding, the largest employer in the city, and the Ocean Springs School District. The city is also home to a number of smaller businesses, including restaurants, bars, and shops.
Demographics
As of the 2010 census, the population of Ocean Springs was 17,442, with a population density of 1,541 people per square mile. The median age of the population was 40.7 years, and the median household income was $50,945. The racial makeup of the city was 79.2% White, 15.3% African American, 0.5% Native American, 1.2% Asian, 0.1% Pacific Islander, 1.7% from other races, and 2.1% from two or more races.
The city is home to a number of religious denominations, including Baptist, Catholic, Methodist, and Presbyterian. The city is also home to a number of educational institutions, including the Ocean Springs School District, Mississippi Gulf Coast Community College, and the University of Southern Mississippi. The city is also home to a number of parks and recreational facilities, including the Ocean Springs Municipal Park, the Ocean Springs Yacht Club, and the Ocean Springs Golf Course.
Common Questions
What is Per Capita Income in Ocean Springs?
Per Capita income in Ocean Springs is $41,076.
What is the Median Family Income in Ocean Springs?
Median Family Income in Ocean Springs is $97,522.
What is the Median Household income in Ocean Springs?
Median Household Income in Ocean Springs is $72,500.
What is Income or Wage Gap in Ocean Springs?
Income or Wage Gap in Ocean Springs is 44.7%.
Women in Ocean Springs earn 55.3 cents for every dollar earned by a man.
What is Inequality or Gini Index in Ocean Springs?
Inequality or Gini Index in Ocean Springs is 0.42.
What is the Total Population of Ocean Springs?
Total Population of Ocean Springs is 18,417.
What is the Total Male Population of Ocean Springs?
Total Male Population of Ocean Springs is 9,377.
What is the Total Female Population of Ocean Springs?
Total Female Population of Ocean Springs is 9,040.
What is the Ratio of Males per 100 Females in Ocean Springs?
There are 103.73 Males per 100 Females in Ocean Springs.
What is the Ratio of Females per 100 Males in Ocean Springs?
There are 96.41 Females per 100 Males in Ocean Springs.
What is the Median Population Age in Ocean Springs?
Median Population Age in Ocean Springs is 41.5 Years.
What is the Average Family Size in Ocean Springs
Average Family Size in Ocean Springs is 3.0 People.
What is the Average Household Size in Ocean Springs
Average Household Size in Ocean Springs is 2.3 People.
How Large is the Labor Force in Ocean Springs?
There are 9,089 People in the Labor Forcein in Ocean Springs.
What is the Percentage of People in the Labor Force in Ocean Springs?
61.6% of People are in the Labor Force in Ocean Springs.
What is the Unemployment Rate in Ocean Springs?
Unemployment Rate in Ocean Springs is 4.1%.