Waimanalo, HI Map & Demographics
Waimanalo Map
Waimanalo Overview
$41,610
PER CAPITA INCOME
$147,200
AVG FAMILY INCOME
$127,143
AVG HOUSEHOLD INCOME
37.0%
WAGE / INCOME GAP [ % ]
63.0¢/ $1
WAGE / INCOME GAP [ $ ]
$8,176
FAMILY INCOME DEFICIT
0.45
INEQUALITY / GINI INDEX
5,743
TOTAL POPULATION
2,952
MALE POPULATION
2,791
FEMALE POPULATION
105.77
MALES / 100 FEMALES
94.55
FEMALES / 100 MALES
31.3
MEDIAN AGE
5.1
AVG FAMILY SIZE
4.6
AVG HOUSEHOLD SIZE
2,800
LABOR FORCE [ PEOPLE ]
68.2%
PERCENT IN LABOR FORCE
4.2%
UNEMPLOYMENT RATE
Waimanalo Zip Codes
Waimanalo Area Codes
Income in Waimanalo
Income Overview in Waimanalo
Per Capita Income in Waimanalo is $41,610, while median incomes of families and households are $147,200 and $127,143 respectively.
| Characteristic | Number | Measure |
| Per Capita Income | 5,743 | $41,610 |
| Median Family Income | 958 | $147,200 |
| Mean Family Income | 958 | $159,445 |
| Median Household Income | 1,242 | $127,143 |
| Mean Household Income | 1,242 | $174,092 |
| Income Deficit | 958 | $8,176 |
| Wage / Income Gap (%) | 5,743 | 36.97% |
| Wage / Income Gap ($) | 5,743 | 63.03¢ per $1 |
| Gini / Inequality Index | 5,743 | 0.45 |
Earnings by Sex in Waimanalo
Average Earnings in Waimanalo are $45,661, $53,887 for men and $33,966 for women, a difference of 37.0%.
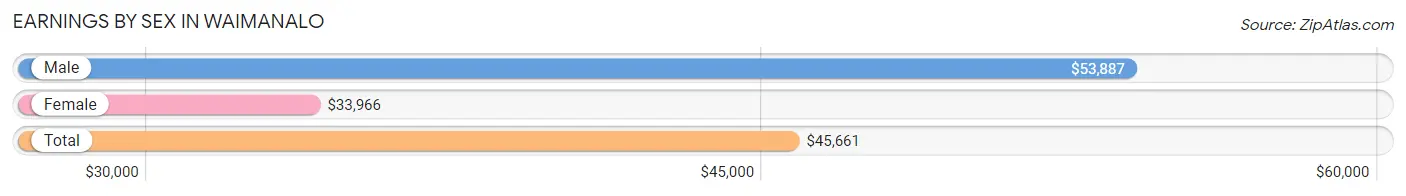
| Sex | Number | Average Earnings |
| Male | 1,668 (58.4%) | $53,887 |
| Female | 1,190 (41.6%) | $33,966 |
| Total | 2,858 (100.0%) | $45,661 |
Earnings by Sex by Income Bracket in Waimanalo
The most common earnings brackets in Waimanalo are $100,000+ for men (402 | 24.1%) and $100,000+ for women (137 | 11.5%).
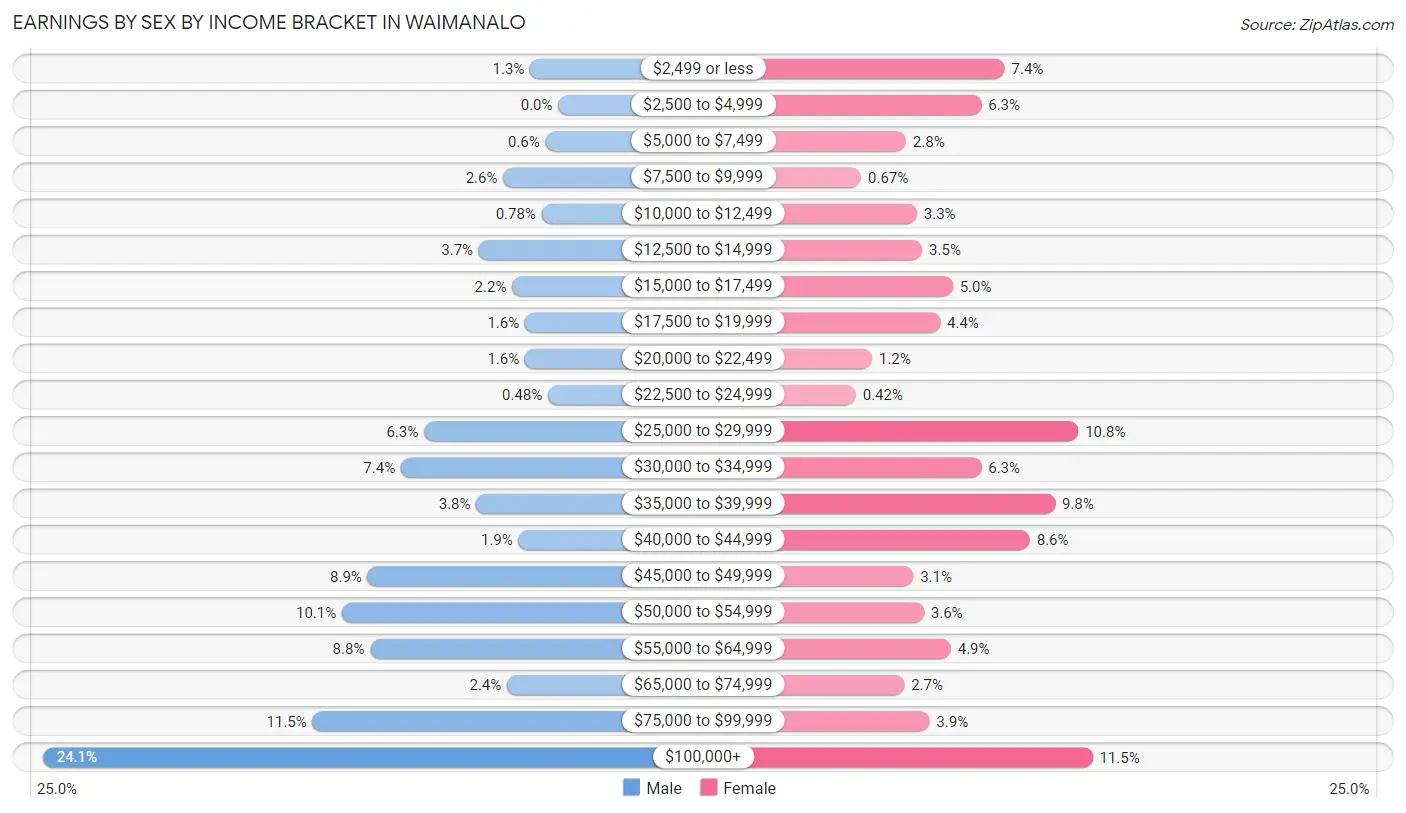
| Income | Male | Female |
| $2,499 or less | 22 (1.3%) | 88 (7.4%) |
| $2,500 to $4,999 | 0 (0.0%) | 75 (6.3%) |
| $5,000 to $7,499 | 10 (0.6%) | 33 (2.8%) |
| $7,500 to $9,999 | 43 (2.6%) | 8 (0.7%) |
| $10,000 to $12,499 | 13 (0.8%) | 39 (3.3%) |
| $12,500 to $14,999 | 62 (3.7%) | 42 (3.5%) |
| $15,000 to $17,499 | 36 (2.2%) | 59 (5.0%) |
| $17,500 to $19,999 | 26 (1.6%) | 52 (4.4%) |
| $20,000 to $22,499 | 26 (1.6%) | 14 (1.2%) |
| $22,500 to $24,999 | 8 (0.5%) | 5 (0.4%) |
| $25,000 to $29,999 | 105 (6.3%) | 129 (10.8%) |
| $30,000 to $34,999 | 123 (7.4%) | 75 (6.3%) |
| $35,000 to $39,999 | 64 (3.8%) | 116 (9.8%) |
| $40,000 to $44,999 | 31 (1.9%) | 102 (8.6%) |
| $45,000 to $49,999 | 149 (8.9%) | 37 (3.1%) |
| $50,000 to $54,999 | 169 (10.1%) | 43 (3.6%) |
| $55,000 to $64,999 | 147 (8.8%) | 58 (4.9%) |
| $65,000 to $74,999 | 40 (2.4%) | 32 (2.7%) |
| $75,000 to $99,999 | 192 (11.5%) | 46 (3.9%) |
| $100,000+ | 402 (24.1%) | 137 (11.5%) |
| Total | 1,668 (100.0%) | 1,190 (100.0%) |
Earnings by Sex by Educational Attainment in Waimanalo
Average earnings in Waimanalo are $56,926 for men and $38,388 for women, a difference of 32.6%. Men with an educational attainment of graduate degree enjoy the highest average annual earnings of $158,667, while those with college or associate's degree education earn the least with $50,954. Women with an educational attainment of bachelor's degree earn the most with the average annual earnings of $57,222, while those with high school diploma education have the smallest earnings of $27,063.
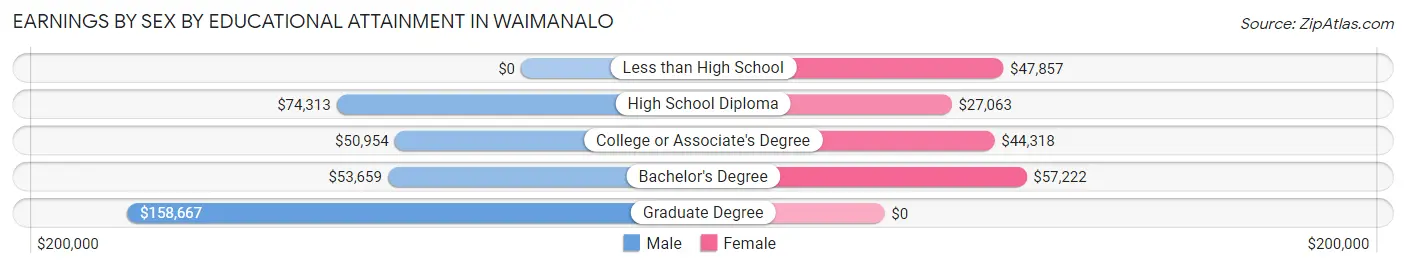
| Educational Attainment | Male Income | Female Income |
| Less than High School | - | - |
| High School Diploma | $74,313 | $27,063 |
| College or Associate's Degree | $50,954 | $44,318 |
| Bachelor's Degree | $53,659 | $57,222 |
| Graduate Degree | $158,667 | $0 |
| Total | $56,926 | $38,388 |
Family Income in Waimanalo
Family Income Brackets in Waimanalo
According to the Waimanalo family income data, there are 278 families falling into the $200,000+ income range, which is the most common income bracket and makes up 29.0% of all families.
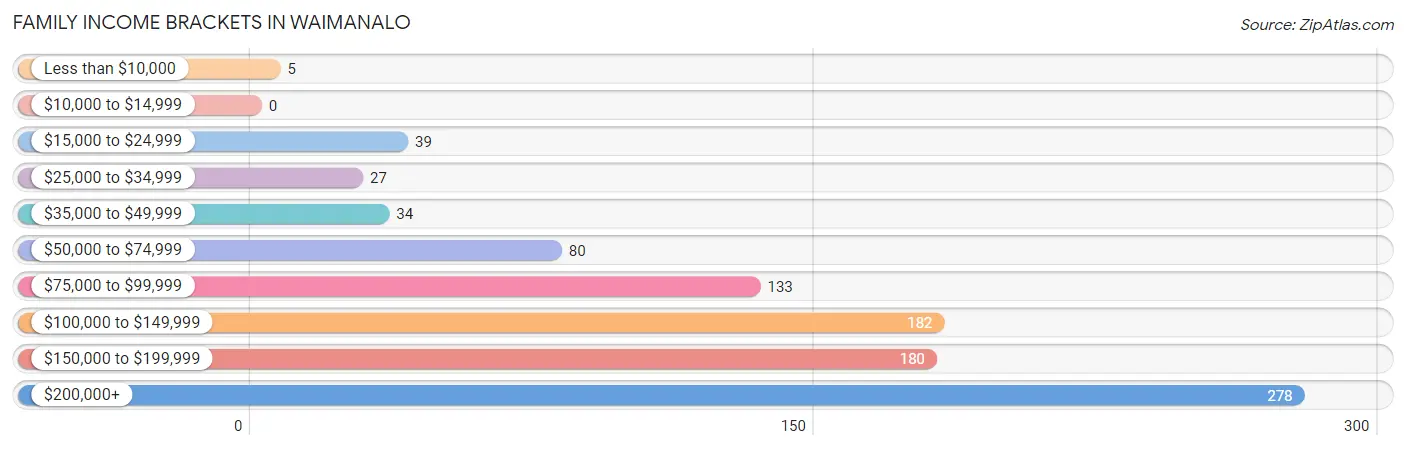
| Income Bracket | # Families | % Families |
| Less than $10,000 | 5 | 0.5% |
| $10,000 to $14,999 | 0 | 0.0% |
| $15,000 to $24,999 | 39 | 4.1% |
| $25,000 to $34,999 | 27 | 2.8% |
| $35,000 to $49,999 | 34 | 3.5% |
| $50,000 to $74,999 | 80 | 8.4% |
| $75,000 to $99,999 | 133 | 13.9% |
| $100,000 to $149,999 | 182 | 19.0% |
| $150,000 to $199,999 | 180 | 18.8% |
| $200,000+ | 278 | 29.0% |
Family Income by Famaliy Size in Waimanalo
6-person families (51 | 5.3%) account for the highest median family income in Waimanalo with $250,001 per family, while 2-person families (137 | 14.3%) have the highest median income of $55,982 per family member.
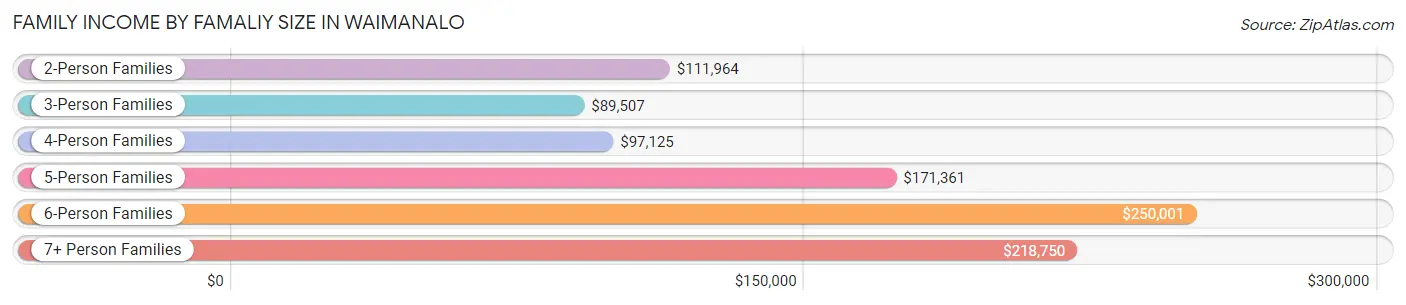
| Income Bracket | # Families | Median Income |
| 2-Person Families | 137 (14.3%) | $111,964 |
| 3-Person Families | 199 (20.8%) | $89,507 |
| 4-Person Families | 149 (15.5%) | $97,125 |
| 5-Person Families | 268 (28.0%) | $171,361 |
| 6-Person Families | 51 (5.3%) | $250,001 |
| 7+ Person Families | 154 (16.1%) | $218,750 |
| Total | 958 (100.0%) | $147,200 |
Family Income by Number of Earners in Waimanalo
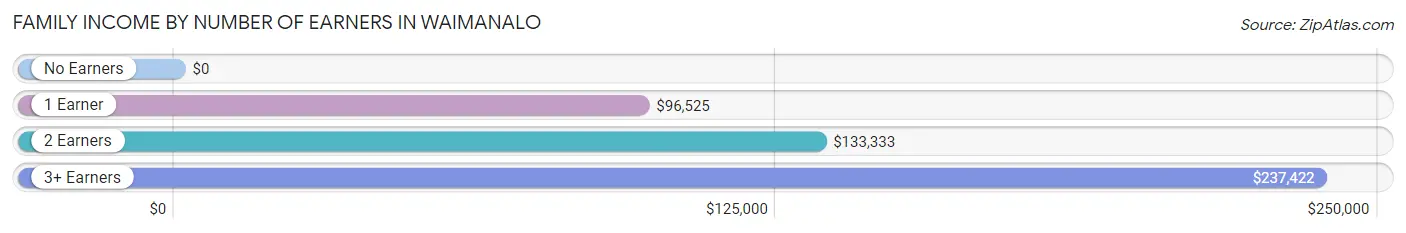
| Number of Earners | # Families | Median Income |
| No Earners | 31 (3.2%) | $0 |
| 1 Earner | 357 (37.3%) | $96,525 |
| 2 Earners | 286 (29.8%) | $133,333 |
| 3+ Earners | 284 (29.6%) | $237,422 |
| Total | 958 (100.0%) | $147,200 |
Household Income in Waimanalo
Household Income Brackets in Waimanalo
With 356 households falling in the category, the $200,000+ income range is the most frequent in Waimanalo, accounting for 28.7% of all households.
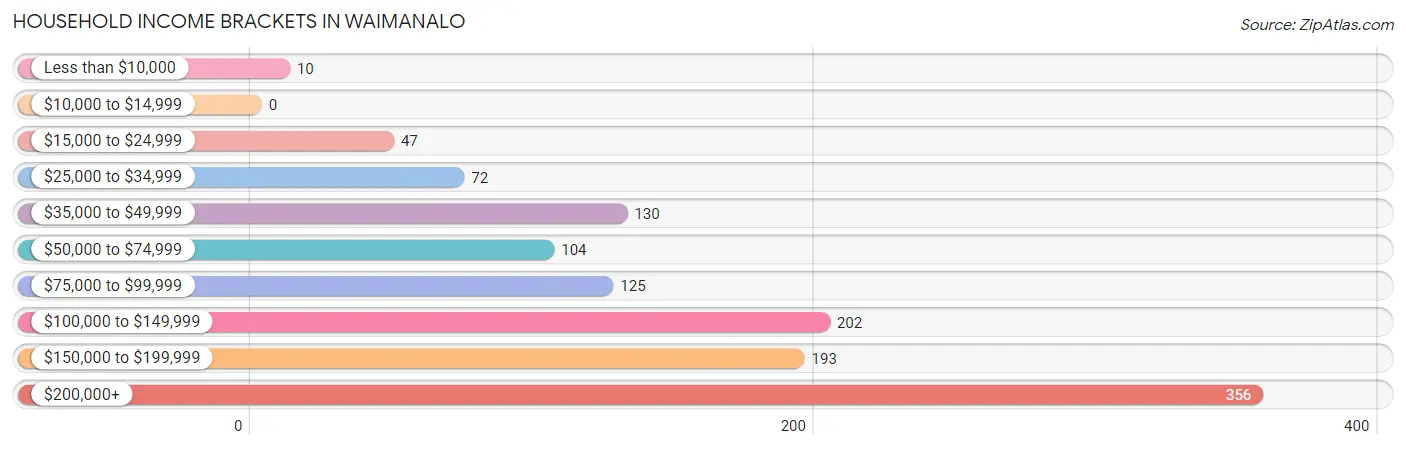
| Income Bracket | # Households | % Households |
| Less than $10,000 | 10 | 0.8% |
| $10,000 to $14,999 | 0 | 0.0% |
| $15,000 to $24,999 | 47 | 3.8% |
| $25,000 to $34,999 | 72 | 5.8% |
| $35,000 to $49,999 | 130 | 10.5% |
| $50,000 to $74,999 | 104 | 8.4% |
| $75,000 to $99,999 | 125 | 10.1% |
| $100,000 to $149,999 | 202 | 16.3% |
| $150,000 to $199,999 | 193 | 15.5% |
| $200,000+ | 356 | 28.7% |
Household Income by Householder Age in Waimanalo
The median household income in Waimanalo is $127,143, with the highest median household income of $154,375 found in the 45 to 64 years age bracket for the primary householder. A total of 469 households (37.8%) fall into this category. Meanwhile, the 15 to 24 years age bracket for the primary householder has the lowest median household income of $0, with 9 households (0.7%) in this group.
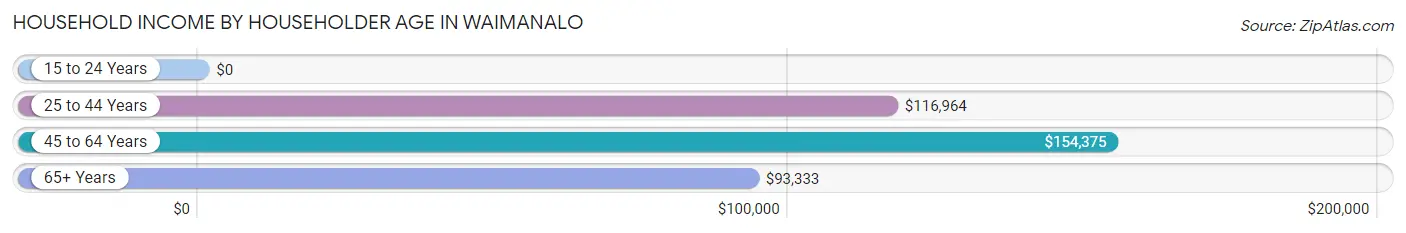
| Income Bracket | # Households | Median Income |
| 15 to 24 Years | 9 (0.7%) | $0 |
| 25 to 44 Years | 386 (31.1%) | $116,964 |
| 45 to 64 Years | 469 (37.8%) | $154,375 |
| 65+ Years | 378 (30.4%) | $93,333 |
| Total | 1,242 (100.0%) | $127,143 |
Poverty in Waimanalo
Income Below Poverty by Sex and Age in Waimanalo
With 6.8% poverty level for males and 9.9% for females among the residents of Waimanalo, 18 to 24 year old males and 5 year old females are the most vulnerable to poverty, with 78 males (33.9%) and 35 females (41.7%) in their respective age groups living below the poverty level.
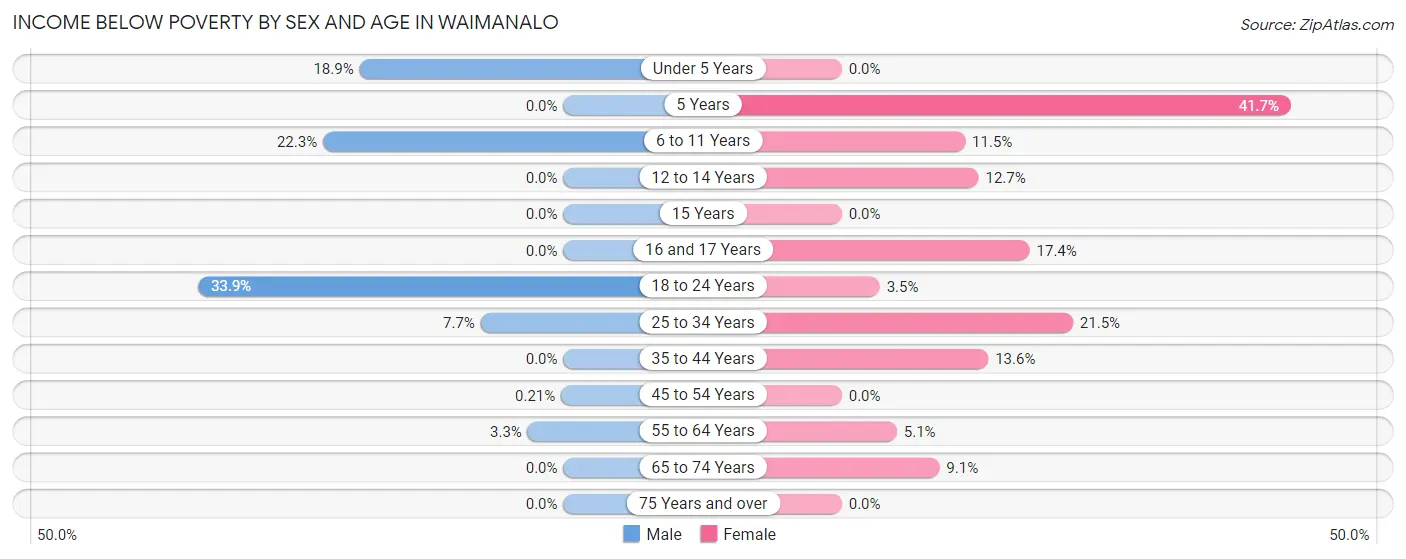
| Age Bracket | Male | Female |
| Under 5 Years | 28 (18.9%) | 0 (0.0%) |
| 5 Years | 0 (0.0%) | 35 (41.7%) |
| 6 to 11 Years | 58 (22.3%) | 38 (11.5%) |
| 12 to 14 Years | 0 (0.0%) | 17 (12.7%) |
| 15 Years | 0 (0.0%) | 0 (0.0%) |
| 16 and 17 Years | 0 (0.0%) | 19 (17.4%) |
| 18 to 24 Years | 78 (33.9%) | 12 (3.5%) |
| 25 to 34 Years | 31 (7.7%) | 89 (21.4%) |
| 35 to 44 Years | 0 (0.0%) | 25 (13.6%) |
| 45 to 54 Years | 1 (0.2%) | 0 (0.0%) |
| 55 to 64 Years | 5 (3.3%) | 9 (5.1%) |
| 65 to 74 Years | 0 (0.0%) | 31 (9.1%) |
| 75 Years and over | 0 (0.0%) | 0 (0.0%) |
| Total | 201 (6.8%) | 275 (9.9%) |
Income Above Poverty by Sex and Age in Waimanalo
According to the poverty statistics in Waimanalo, males aged 5 years and females aged under 5 years are the age groups that are most secure financially, with 100.0% of males and 100.0% of females in these age groups living above the poverty line.
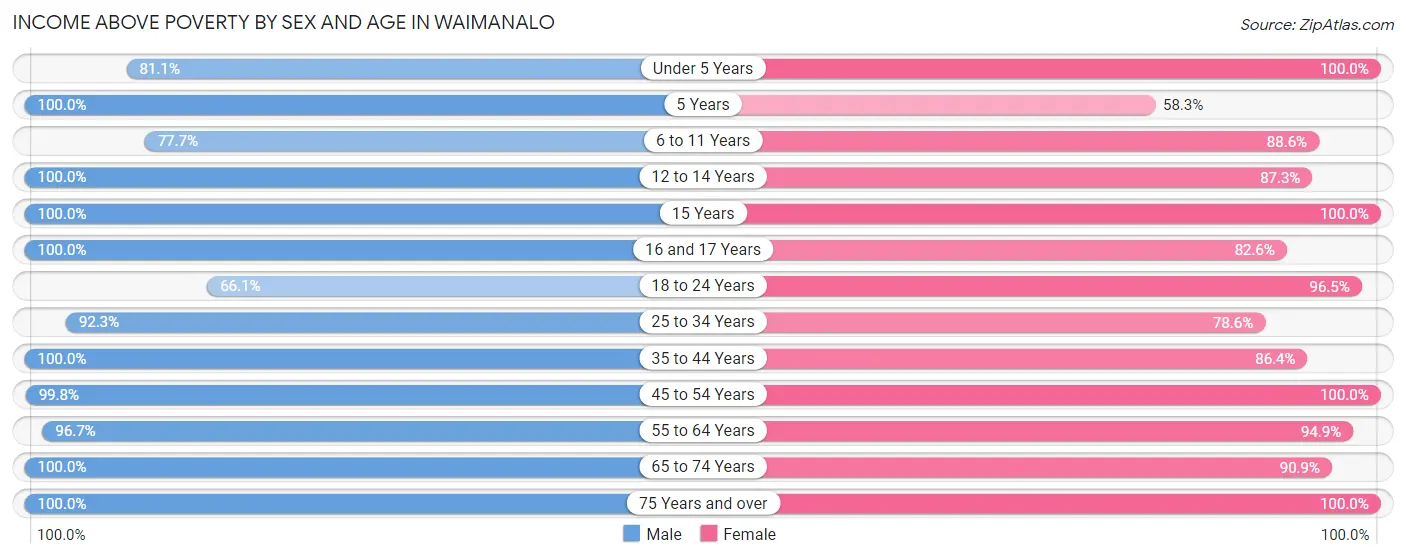
| Age Bracket | Male | Female |
| Under 5 Years | 120 (81.1%) | 166 (100.0%) |
| 5 Years | 53 (100.0%) | 49 (58.3%) |
| 6 to 11 Years | 202 (77.7%) | 294 (88.5%) |
| 12 to 14 Years | 279 (100.0%) | 117 (87.3%) |
| 15 Years | 121 (100.0%) | 40 (100.0%) |
| 16 and 17 Years | 31 (100.0%) | 90 (82.6%) |
| 18 to 24 Years | 152 (66.1%) | 329 (96.5%) |
| 25 to 34 Years | 373 (92.3%) | 326 (78.5%) |
| 35 to 44 Years | 428 (100.0%) | 159 (86.4%) |
| 45 to 54 Years | 471 (99.8%) | 327 (100.0%) |
| 55 to 64 Years | 146 (96.7%) | 167 (94.9%) |
| 65 to 74 Years | 222 (100.0%) | 311 (90.9%) |
| 75 Years and over | 153 (100.0%) | 120 (100.0%) |
| Total | 2,751 (93.2%) | 2,495 (90.1%) |
Income Below Poverty Among Married-Couple Families in Waimanalo
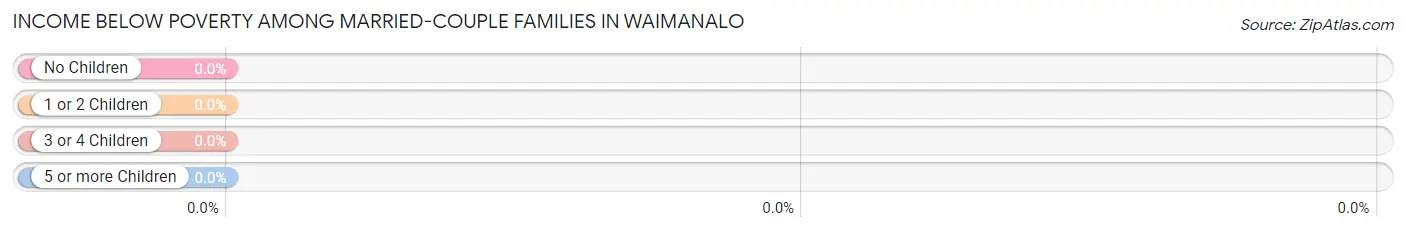
| Children | Above Poverty | Below Poverty |
| No Children | 273 (100.0%) | 0 (0.0%) |
| 1 or 2 Children | 209 (100.0%) | 0 (0.0%) |
| 3 or 4 Children | 113 (100.0%) | 0 (0.0%) |
| 5 or more Children | 30 (100.0%) | 0 (0.0%) |
| Total | 625 (100.0%) | 0 (0.0%) |
Income Below Poverty Among Single-Parent Households in Waimanalo
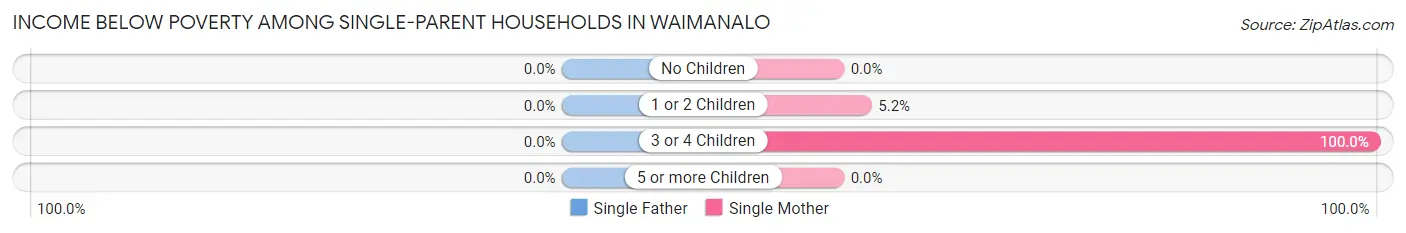
| Children | Single Father | Single Mother |
| No Children | 0 (0.0%) | 0 (0.0%) |
| 1 or 2 Children | 0 (0.0%) | 5 (5.1%) |
| 3 or 4 Children | 0 (0.0%) | 50 (100.0%) |
| 5 or more Children | 0 (0.0%) | 0 (0.0%) |
| Total | 0 (0.0%) | 55 (29.1%) |
Income Below Poverty Among Married-Couple vs Single-Parent Households in Waimanalo
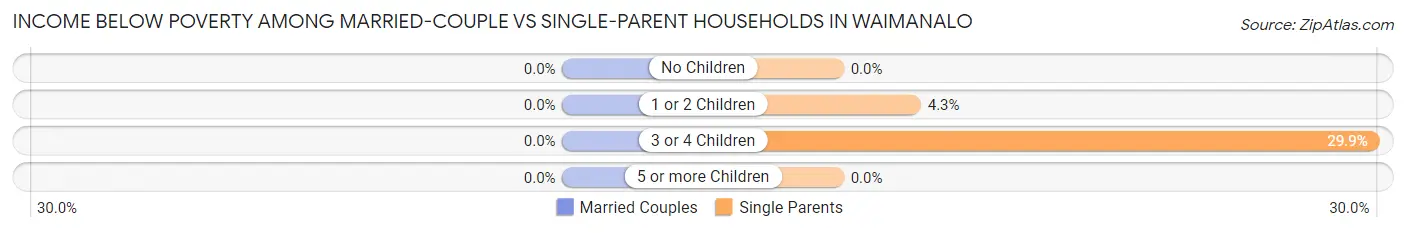
| Children | Married-Couple Families | Single-Parent Households |
| No Children | 0 (0.0%) | 0 (0.0%) |
| 1 or 2 Children | 0 (0.0%) | 5 (4.3%) |
| 3 or 4 Children | 0 (0.0%) | 50 (29.9%) |
| 5 or more Children | 0 (0.0%) | 0 (0.0%) |
| Total | 0 (0.0%) | 55 (16.5%) |
Race in Waimanalo
The most populous races in Waimanalo are Two or more Races (2,748 | 47.8%), Hawaiian / Pacific (1,585 | 27.6%), and Hispanic or Latino (1,106 | 19.3%).
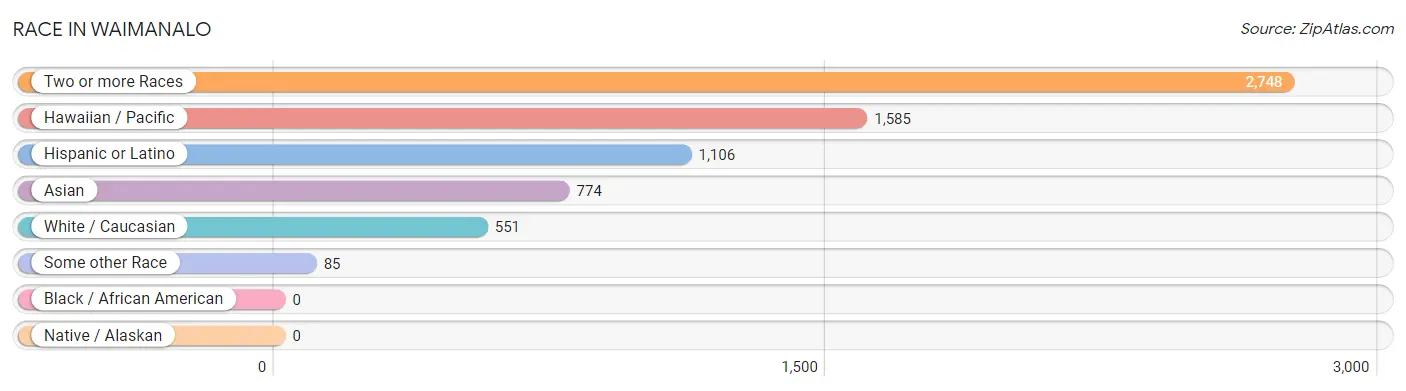
| Race | # Population | % Population |
| Asian | 774 | 13.5% |
| Black / African American | 0 | 0.0% |
| Hawaiian / Pacific | 1,585 | 27.6% |
| Hispanic or Latino | 1,106 | 19.3% |
| Native / Alaskan | 0 | 0.0% |
| White / Caucasian | 551 | 9.6% |
| Two or more Races | 2,748 | 47.8% |
| Some other Race | 85 | 1.5% |
| Total | 5,743 | 100.0% |
Ancestry in Waimanalo
The most populous ancestries reported in Waimanalo are Native Hawaiian (3,437 | 59.9%), Korean (1,555 | 27.1%), Indian (Asian) (1,390 | 24.2%), Bhutanese (894 | 15.6%), and Samoan (410 | 7.1%), together accounting for 133.8% of all Waimanalo residents.
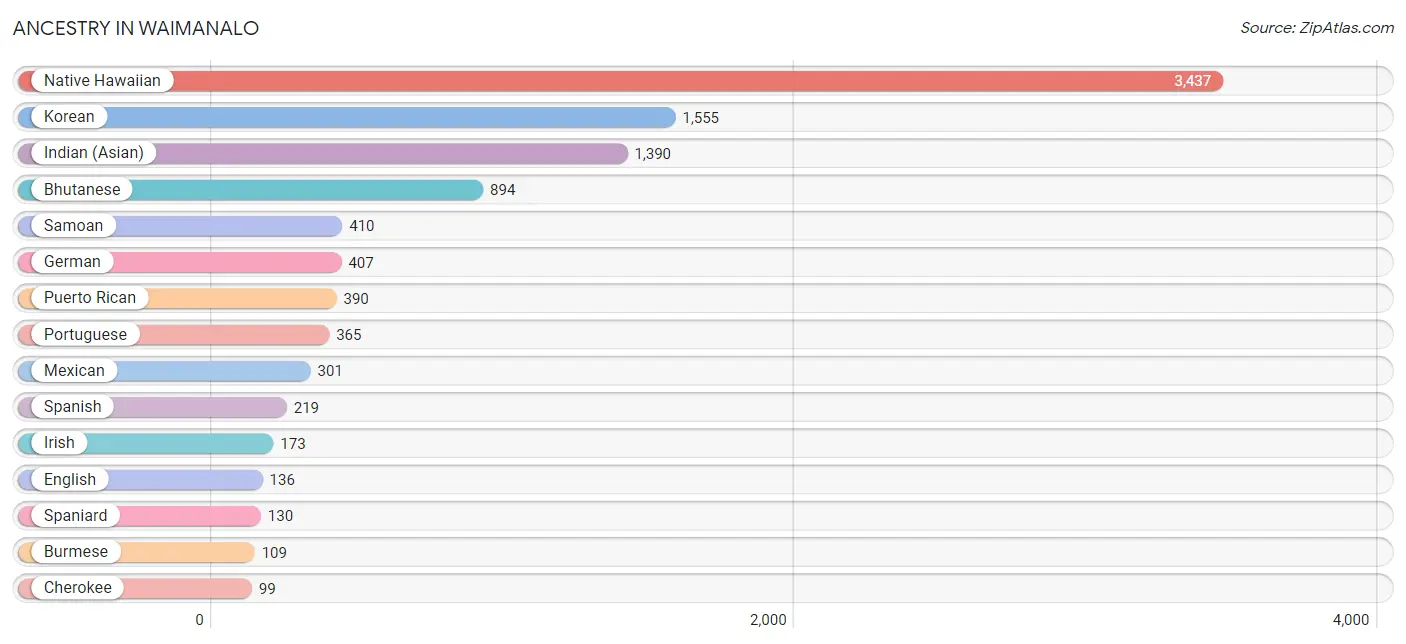
| Ancestry | # Population | % Population |
| American | 37 | 0.6% |
| Argentinean | 9 | 0.2% |
| Bhutanese | 894 | 15.6% |
| Burmese | 109 | 1.9% |
| Cherokee | 99 | 1.7% |
| Chilean | 20 | 0.4% |
| Chinese | 67 | 1.2% |
| Creek | 10 | 0.2% |
| Croatian | 9 | 0.2% |
| Czechoslovakian | 8 | 0.1% |
| Dominican | 6 | 0.1% |
| Dutch | 9 | 0.2% |
| English | 136 | 2.4% |
| European | 20 | 0.4% |
| French | 29 | 0.5% |
| French Canadian | 13 | 0.2% |
| German | 407 | 7.1% |
| Indian (Asian) | 1,390 | 24.2% |
| Irish | 173 | 3.0% |
| Italian | 22 | 0.4% |
| Korean | 1,555 | 27.1% |
| Mexican | 301 | 5.2% |
| Mexican American Indian | 50 | 0.9% |
| Native Hawaiian | 3,437 | 59.9% |
| Norwegian | 25 | 0.4% |
| Peruvian | 27 | 0.5% |
| Portuguese | 365 | 6.4% |
| Puerto Rican | 390 | 6.8% |
| Samoan | 410 | 7.1% |
| Scottish | 4 | 0.1% |
| South American | 56 | 1.0% |
| Spaniard | 130 | 2.3% |
| Spanish | 219 | 3.8% |
| Swedish | 27 | 0.5% |
| Thai | 23 | 0.4% |
| Tongan | 4 | 0.1% | View All 36 Rows |
Immigrants in Waimanalo
The most numerous immigrant groups reported in Waimanalo came from Asia (293 | 5.1%), Philippines (229 | 4.0%), South Eastern Asia (229 | 4.0%), Eastern Asia (47 | 0.8%), and China (46 | 0.8%), together accounting for 14.7% of all Waimanalo residents.
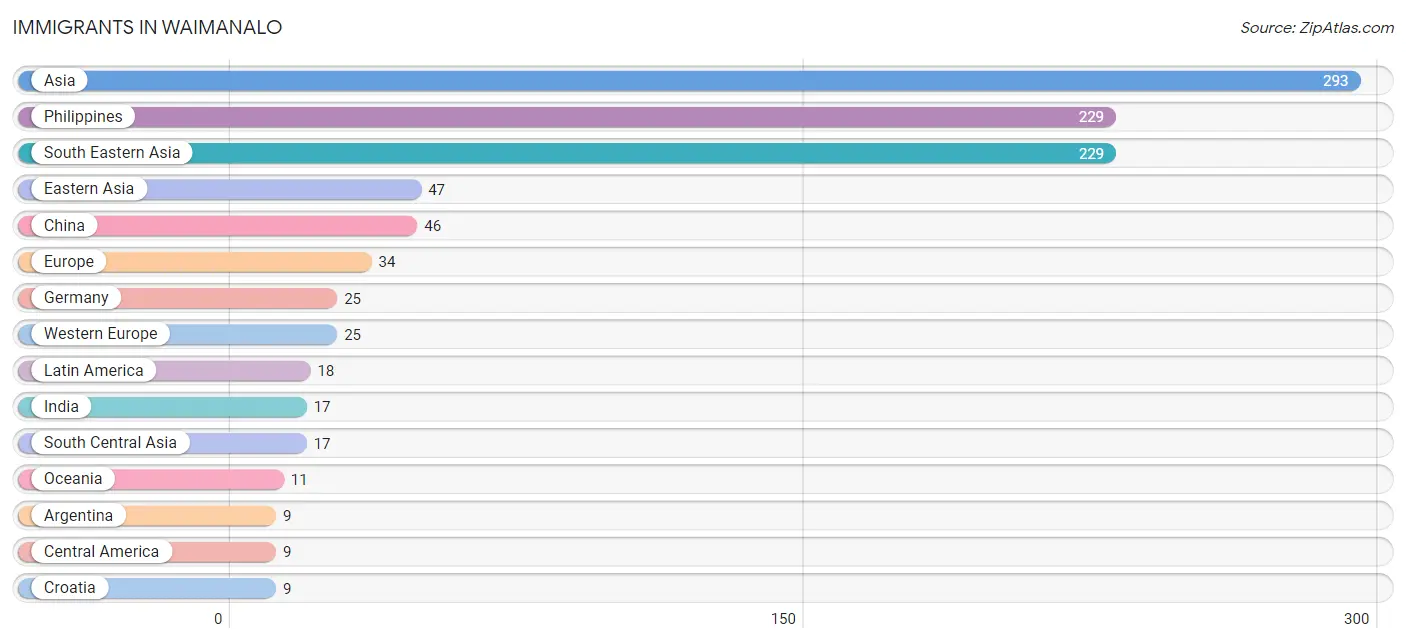
| Immigration Origin | # Population | % Population |
| Argentina | 9 | 0.2% |
| Asia | 293 | 5.1% |
| Central America | 9 | 0.2% |
| China | 46 | 0.8% |
| Croatia | 9 | 0.2% |
| Eastern Asia | 47 | 0.8% |
| Eastern Europe | 9 | 0.2% |
| Europe | 34 | 0.6% |
| Germany | 25 | 0.4% |
| India | 17 | 0.3% |
| Japan | 1 | 0.0% |
| Latin America | 18 | 0.3% |
| Mexico | 9 | 0.2% |
| Oceania | 11 | 0.2% |
| Philippines | 229 | 4.0% |
| South America | 9 | 0.2% |
| South Central Asia | 17 | 0.3% |
| South Eastern Asia | 229 | 4.0% |
| Western Europe | 25 | 0.4% | View All 19 Rows |
Sex and Age in Waimanalo
Sex and Age in Waimanalo
The most populous age groups in Waimanalo are 10 to 14 Years (363 | 12.3%) for men and 5 to 9 Years (315 | 11.3%) for women.
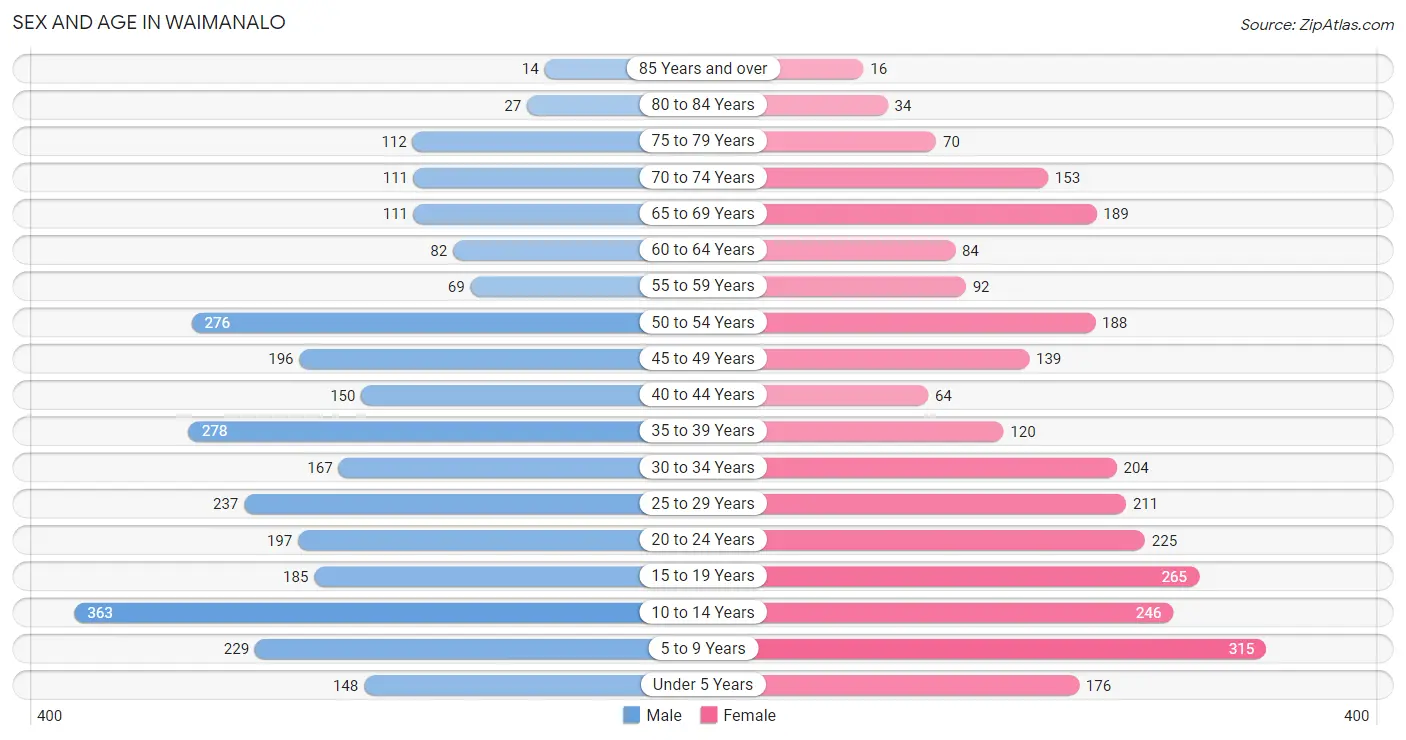
| Age Bracket | Male | Female |
| Under 5 Years | 148 (5.0%) | 176 (6.3%) |
| 5 to 9 Years | 229 (7.8%) | 315 (11.3%) |
| 10 to 14 Years | 363 (12.3%) | 246 (8.8%) |
| 15 to 19 Years | 185 (6.3%) | 265 (9.5%) |
| 20 to 24 Years | 197 (6.7%) | 225 (8.1%) |
| 25 to 29 Years | 237 (8.0%) | 211 (7.6%) |
| 30 to 34 Years | 167 (5.7%) | 204 (7.3%) |
| 35 to 39 Years | 278 (9.4%) | 120 (4.3%) |
| 40 to 44 Years | 150 (5.1%) | 64 (2.3%) |
| 45 to 49 Years | 196 (6.6%) | 139 (5.0%) |
| 50 to 54 Years | 276 (9.3%) | 188 (6.7%) |
| 55 to 59 Years | 69 (2.3%) | 92 (3.3%) |
| 60 to 64 Years | 82 (2.8%) | 84 (3.0%) |
| 65 to 69 Years | 111 (3.8%) | 189 (6.8%) |
| 70 to 74 Years | 111 (3.8%) | 153 (5.5%) |
| 75 to 79 Years | 112 (3.8%) | 70 (2.5%) |
| 80 to 84 Years | 27 (0.9%) | 34 (1.2%) |
| 85 Years and over | 14 (0.5%) | 16 (0.6%) |
| Total | 2,952 (100.0%) | 2,791 (100.0%) |
Families and Households in Waimanalo
Median Family Size in Waimanalo
The median family size in Waimanalo is 5.11 persons per family, with married-couple families (625 | 65.2%) accounting for the largest median family size of 5.4 persons per family. On the other hand, single male/father families (144 | 15.0%) represent the smallest median family size with 4.20 persons per family.
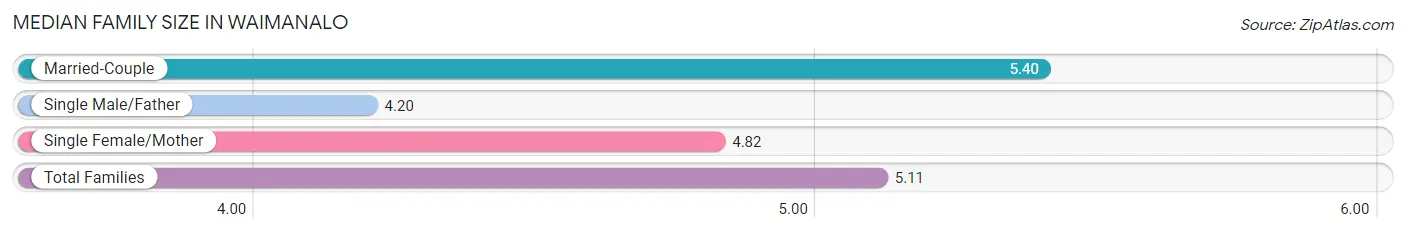
| Family Type | # Families | Family Size |
| Married-Couple | 625 (65.2%) | 5.40 |
| Single Male/Father | 144 (15.0%) | 4.20 |
| Single Female/Mother | 189 (19.7%) | 4.82 |
| Total Families | 958 (100.0%) | 5.11 |
Median Household Size in Waimanalo
The median household size in Waimanalo is 4.62 persons per household, with married-couple households (625 | 50.3%) accounting for the largest median household size of 5.87 persons per household. non-family households (284 | 22.9%) represent the smallest median household size with 1.32 persons per household.
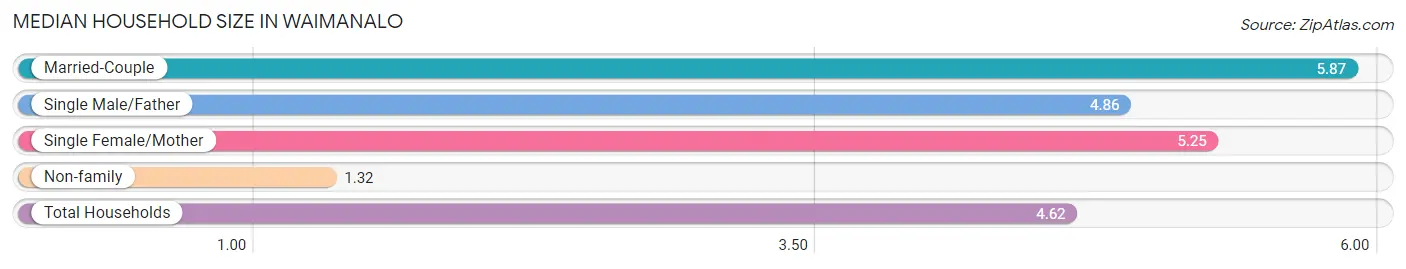
| Household Type | # Households | Household Size |
| Married-Couple | 625 (50.3%) | 5.87 |
| Single Male/Father | 144 (11.6%) | 4.86 |
| Single Female/Mother | 189 (15.2%) | 5.25 |
| Non-family | 284 (22.9%) | 1.32 |
| Total Households | 1,242 (100.0%) | 4.62 |
Household Size by Marriage Status in Waimanalo
Out of a total of 1,242 households in Waimanalo, 958 (77.1%) are family households, while 284 (22.9%) are nonfamily households. The most numerous type of family households are 5-person households, comprising 296, and the most common type of nonfamily households are 1-person households, comprising 218.
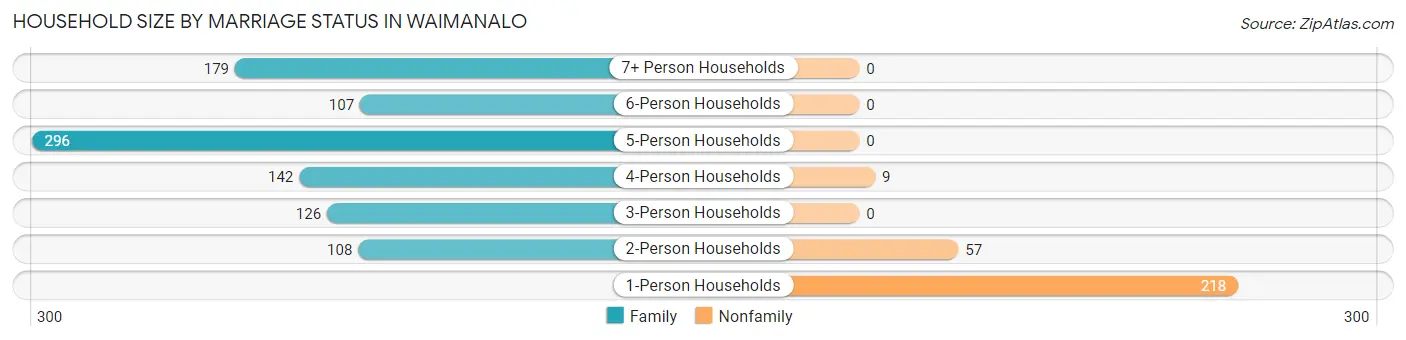
| Household Size | Family Households | Nonfamily Households |
| 1-Person Households | - | 218 (17.5%) |
| 2-Person Households | 108 (8.7%) | 57 (4.6%) |
| 3-Person Households | 126 (10.1%) | 0 (0.0%) |
| 4-Person Households | 142 (11.4%) | 9 (0.7%) |
| 5-Person Households | 296 (23.8%) | 0 (0.0%) |
| 6-Person Households | 107 (8.6%) | 0 (0.0%) |
| 7+ Person Households | 179 (14.4%) | 0 (0.0%) |
| Total | 958 (77.1%) | 284 (22.9%) |
Female Fertility in Waimanalo
Fertility by Age in Waimanalo
Average fertility rate in Waimanalo is 27.0 births per 1,000 women. Women in the age bracket of 20 to 34 years have the highest fertility rate with 34.0 births per 1,000 women. Women in the age bracket of 20 to 34 years acount for 66.7% of all women with births.
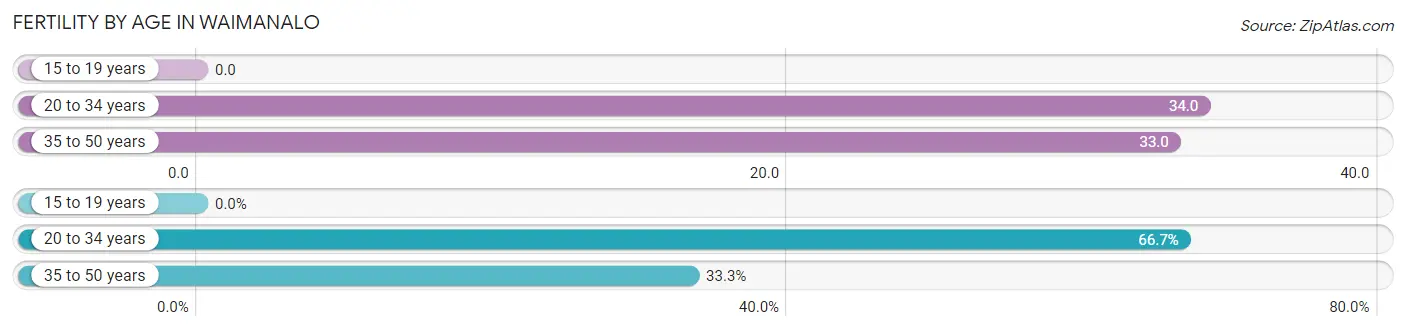
| Age Bracket | Women with Births | Births / 1,000 Women |
| 15 to 19 years | 0 (0.0%) | 0.0 |
| 20 to 34 years | 22 (66.7%) | 34.0 |
| 35 to 50 years | 11 (33.3%) | 33.0 |
| Total | 33 (100.0%) | 27.0 |
Fertility by Age by Marriage Status in Waimanalo
42.4% of women with births (33) in Waimanalo are married. The highest percentage of unmarried women with births falls into 20 to 34 years age bracket with 86.4% of them unmarried at the time of birth, while the lowest percentage of unmarried women with births belong to 35 to 50 years age bracket with 0.0% of them unmarried.
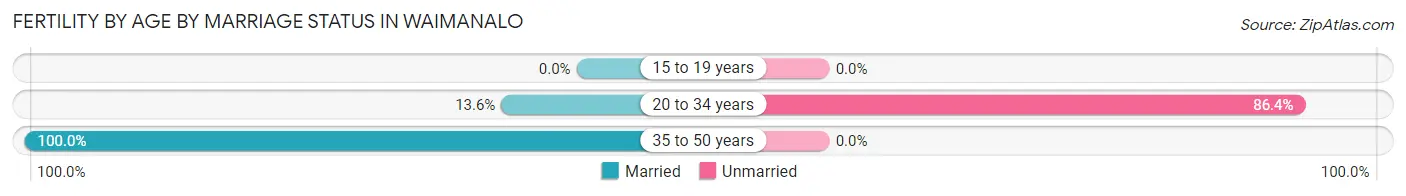
| Age Bracket | Married | Unmarried |
| 15 to 19 years | 0 (0.0%) | 0 (0.0%) |
| 20 to 34 years | 3 (13.6%) | 19 (86.4%) |
| 35 to 50 years | 11 (100.0%) | 0 (0.0%) |
| Total | 14 (42.4%) | 19 (57.6%) |
Fertility by Education in Waimanalo
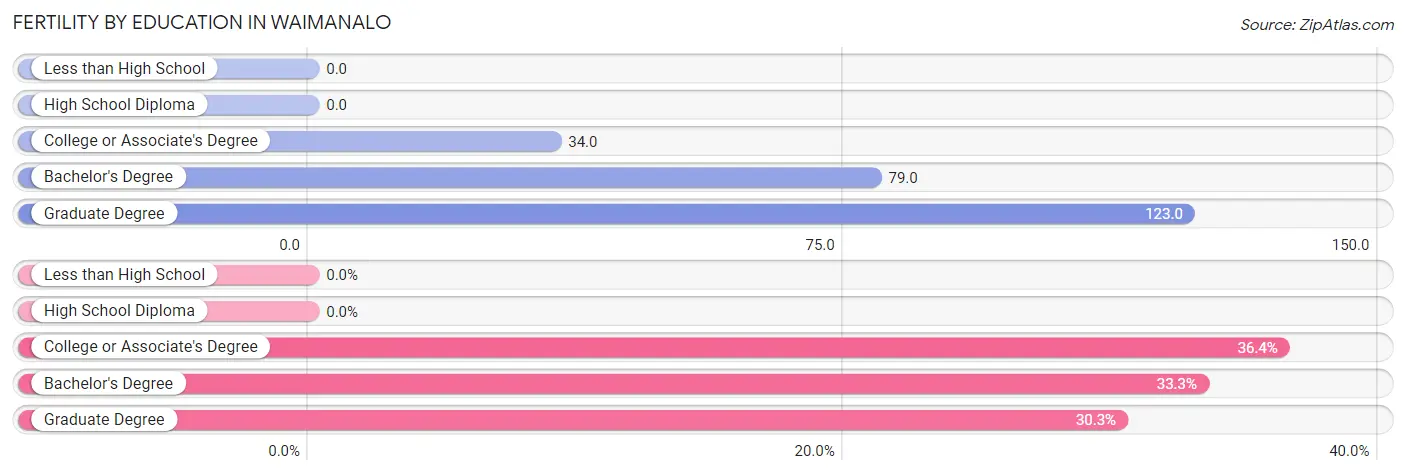
| Educational Attainment | Women with Births | Births / 1,000 Women |
| Less than High School | 0 (0.0%) | 0.0 |
| High School Diploma | 0 (0.0%) | 0.0 |
| College or Associate's Degree | 12 (36.4%) | 34.0 |
| Bachelor's Degree | 11 (33.3%) | 79.0 |
| Graduate Degree | 10 (30.3%) | 123.0 |
| Total | 33 (100.0%) | 27.0 |
Fertility by Education by Marriage Status in Waimanalo
57.6% of women with births in Waimanalo are unmarried. Women with the educational attainment of bachelor's degree are most likely to be married with 100.0% of them married at childbirth, while women with the educational attainment of graduate degree are least likely to be married with 100.0% of them unmarried at childbirth.
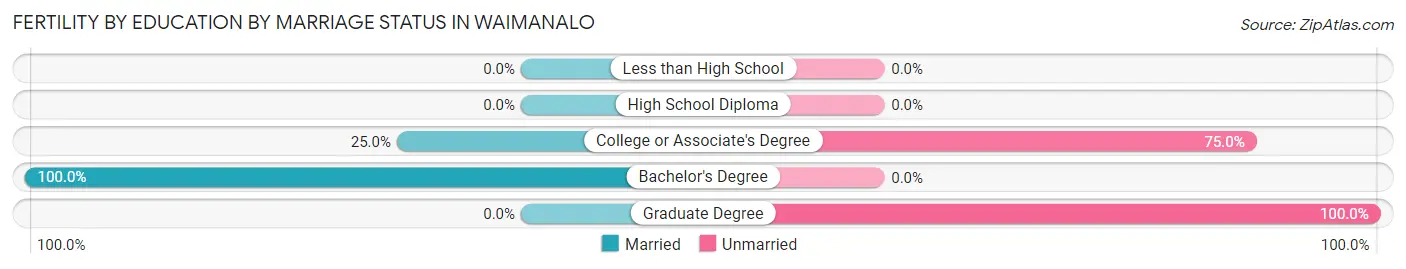
| Educational Attainment | Married | Unmarried |
| Less than High School | 0 (0.0%) | 0 (0.0%) |
| High School Diploma | 0 (0.0%) | 0 (0.0%) |
| College or Associate's Degree | 3 (25.0%) | 9 (75.0%) |
| Bachelor's Degree | 11 (100.0%) | 0 (0.0%) |
| Graduate Degree | 0 (0.0%) | 10 (100.0%) |
| Total | 14 (42.4%) | 19 (57.6%) |
Employment Characteristics in Waimanalo
Employment by Class of Employer in Waimanalo
Among the 2,666 employed individuals in Waimanalo, private company employees (1,628 | 61.1%), state government employees (253 | 9.5%), and not-for-profit organizations (232 | 8.7%) make up the most common classes of employment.
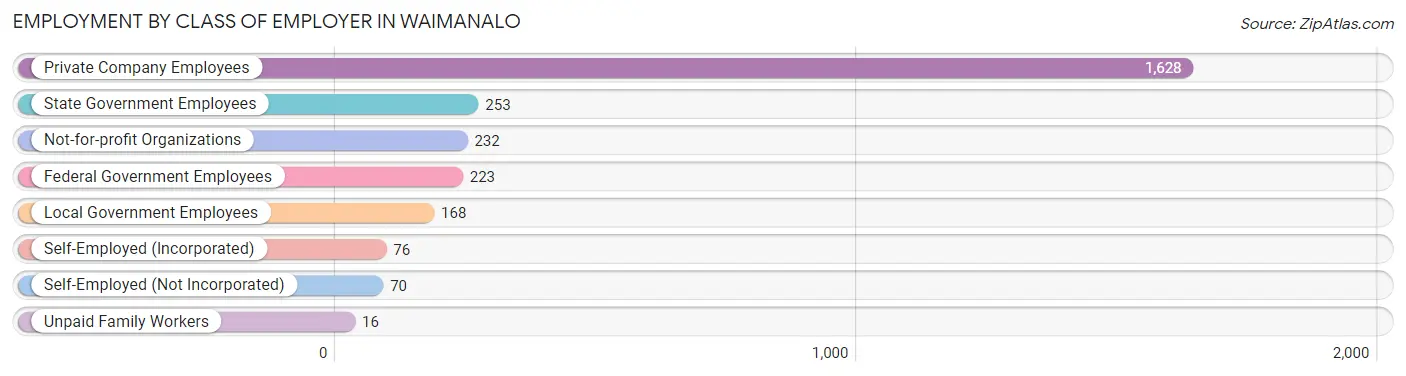
| Employer Class | # Employees | % Employees |
| Private Company Employees | 1,628 | 61.1% |
| Self-Employed (Incorporated) | 76 | 2.9% |
| Self-Employed (Not Incorporated) | 70 | 2.6% |
| Not-for-profit Organizations | 232 | 8.7% |
| Local Government Employees | 168 | 6.3% |
| State Government Employees | 253 | 9.5% |
| Federal Government Employees | 223 | 8.4% |
| Unpaid Family Workers | 16 | 0.6% |
| Total | 2,666 | 100.0% |
Employment Status by Age in Waimanalo
According to the labor force statistics for Waimanalo, out of the total population over 16 years of age (4,105), 68.2% or 2,800 individuals are in the labor force, with 4.2% or 118 of them unemployed. The age group with the highest labor force participation rate is 45 to 54 years, with 95.9% or 766 individuals in the labor force. Within the labor force, the 20 to 24 years age range has the highest percentage of unemployed individuals, with 22.0% or 64 of them being unemployed.
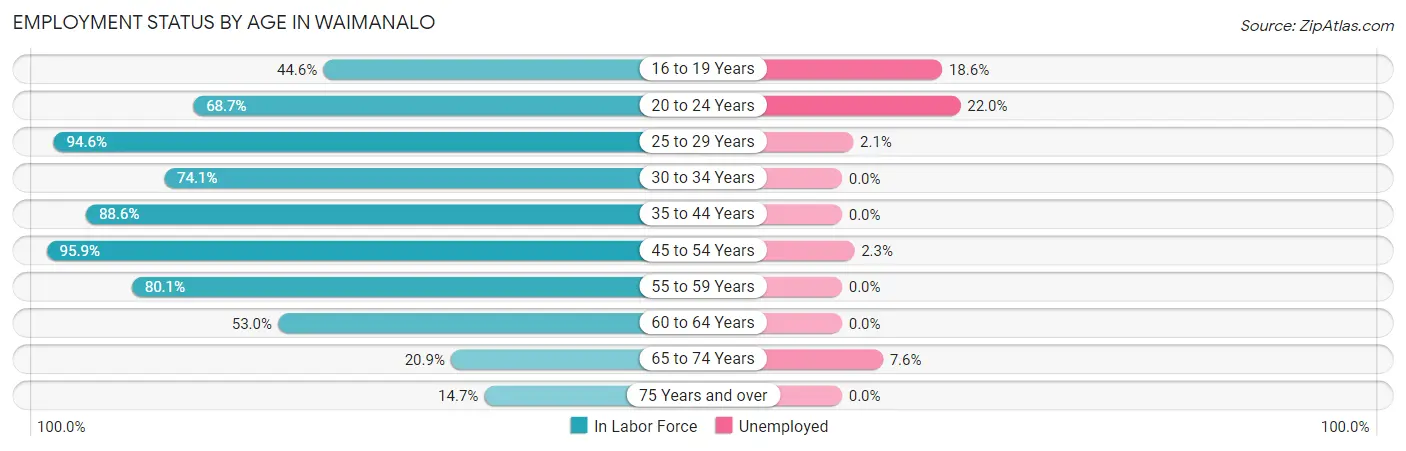
| Age Bracket | In Labor Force | Unemployed |
| 16 to 19 Years | 129 (44.6%) | 24 (18.6%) |
| 20 to 24 Years | 290 (68.7%) | 64 (22.0%) |
| 25 to 29 Years | 424 (94.6%) | 9 (2.1%) |
| 30 to 34 Years | 275 (74.1%) | 0 (0.0%) |
| 35 to 44 Years | 542 (88.6%) | 0 (0.0%) |
| 45 to 54 Years | 766 (95.9%) | 18 (2.3%) |
| 55 to 59 Years | 129 (80.1%) | 0 (0.0%) |
| 60 to 64 Years | 88 (53.0%) | 0 (0.0%) |
| 65 to 74 Years | 118 (20.9%) | 9 (7.6%) |
| 75 Years and over | 40 (14.7%) | 0 (0.0%) |
| Total | 2,800 (68.2%) | 118 (4.2%) |
Employment Status by Educational Attainment in Waimanalo
According to labor force statistics for Waimanalo, 87.0% of individuals (2,225) out of the total population between 25 and 64 years of age (2,557) are in the labor force, with 1.2% or 27 of them being unemployed. The group with the highest labor force participation rate are those with the educational attainment of less than high school, with 91.1% or 112 individuals in the labor force. Within the labor force, individuals with bachelor's degree or higher education have the highest percentage of unemployment, with 3.2% or 11 of them being unemployed.
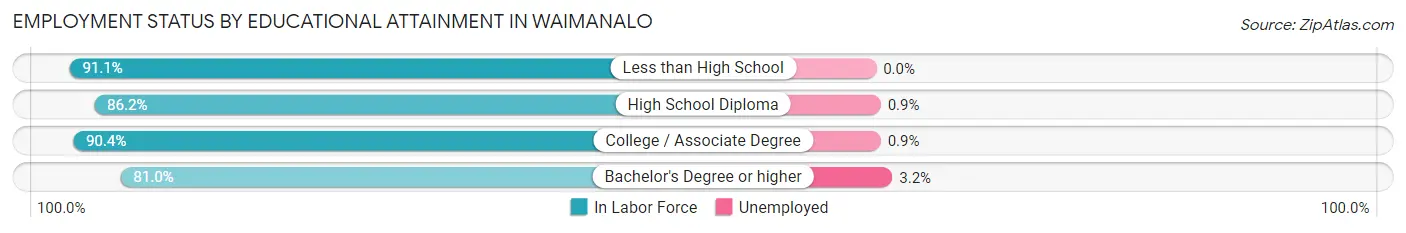
| Educational Attainment | In Labor Force | Unemployed |
| Less than High School | 112 (91.1%) | 0 (0.0%) |
| High School Diploma | 1,027 (86.2%) | 11 (0.9%) |
| College / Associate Degree | 748 (90.4%) | 7 (0.9%) |
| Bachelor's Degree or higher | 337 (81.0%) | 13 (3.2%) |
| Total | 2,225 (87.0%) | 31 (1.2%) |
Employment Occupations by Sex in Waimanalo
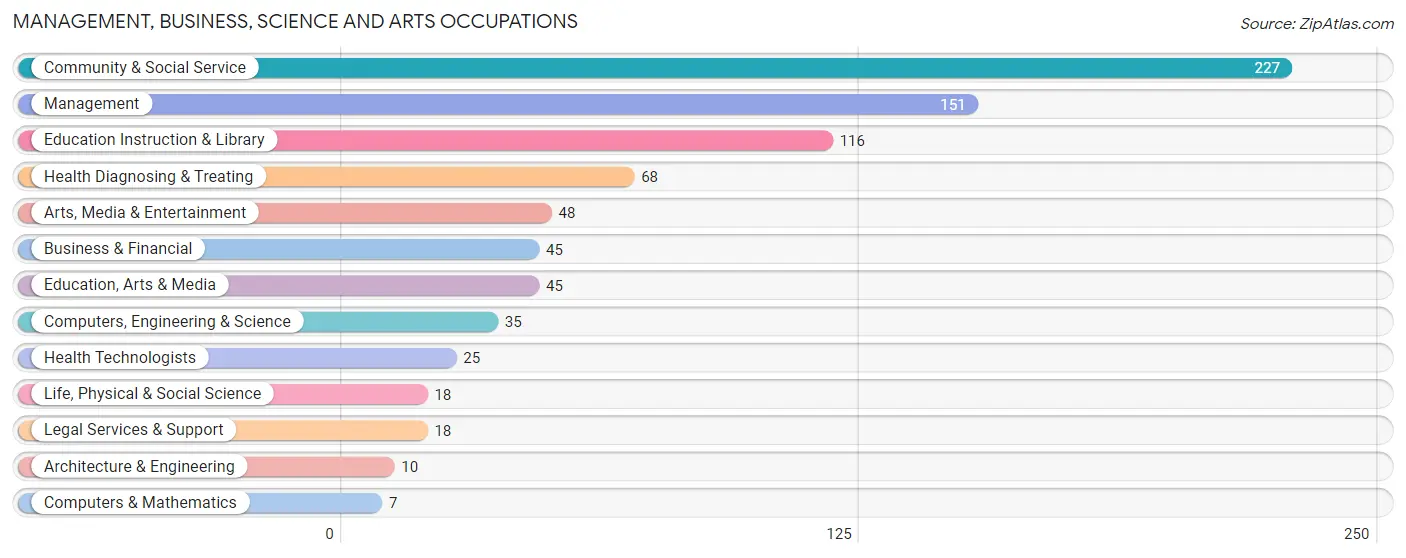
Management, Business, Science and Arts Occupations
The most common Management, Business, Science and Arts occupations in Waimanalo are Community & Social Service (227 | 8.6%), Management (151 | 5.8%), Education Instruction & Library (116 | 4.4%), Health Diagnosing & Treating (68 | 2.6%), and Arts, Media & Entertainment (48 | 1.8%).
Management, Business, Science and Arts Occupations by Sex
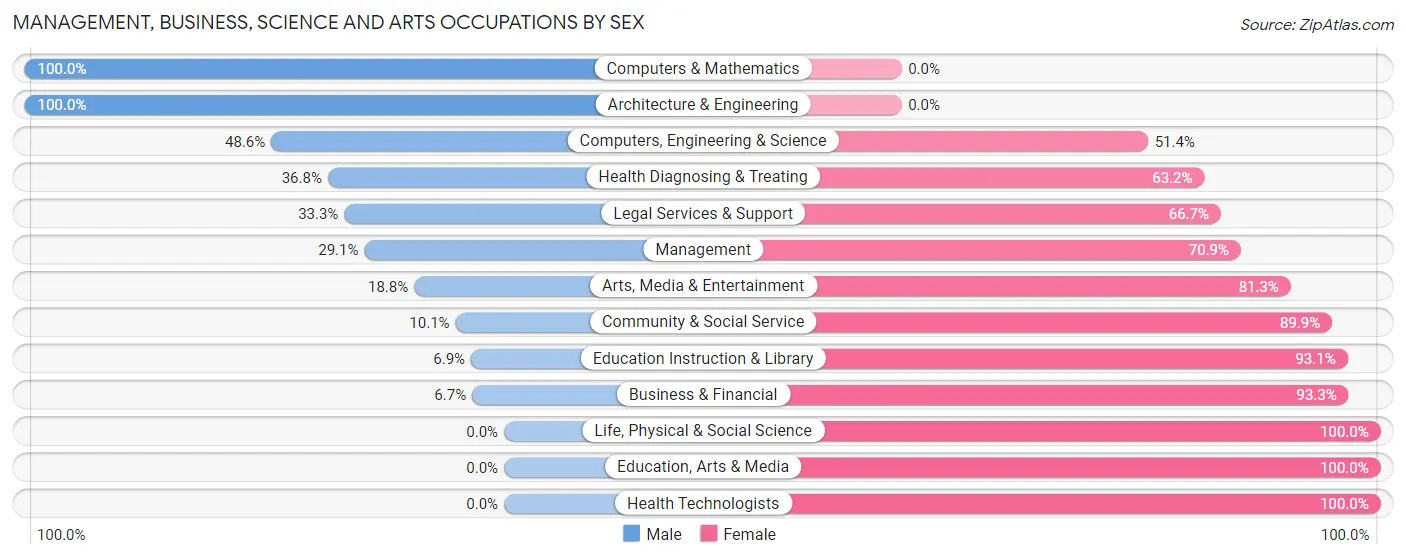
Within the Management, Business, Science and Arts occupations in Waimanalo, the most male-oriented occupations are Computers & Mathematics (100.0%), Architecture & Engineering (100.0%), and Computers, Engineering & Science (48.6%), while the most female-oriented occupations are Life, Physical & Social Science (100.0%), Education, Arts & Media (100.0%), and Health Technologists (100.0%).
| Occupation | Male | Female |
| Management | 44 (29.1%) | 107 (70.9%) |
| Business & Financial | 3 (6.7%) | 42 (93.3%) |
| Computers, Engineering & Science | 17 (48.6%) | 18 (51.4%) |
| Computers & Mathematics | 7 (100.0%) | 0 (0.0%) |
| Architecture & Engineering | 10 (100.0%) | 0 (0.0%) |
| Life, Physical & Social Science | 0 (0.0%) | 18 (100.0%) |
| Community & Social Service | 23 (10.1%) | 204 (89.9%) |
| Education, Arts & Media | 0 (0.0%) | 45 (100.0%) |
| Legal Services & Support | 6 (33.3%) | 12 (66.7%) |
| Education Instruction & Library | 8 (6.9%) | 108 (93.1%) |
| Arts, Media & Entertainment | 9 (18.8%) | 39 (81.2%) |
| Health Diagnosing & Treating | 25 (36.8%) | 43 (63.2%) |
| Health Technologists | 0 (0.0%) | 25 (100.0%) |
| Total (Category) | 112 (21.3%) | 414 (78.7%) |
| Total (Overall) | 1,597 (60.8%) | 1,029 (39.2%) |
Services Occupations
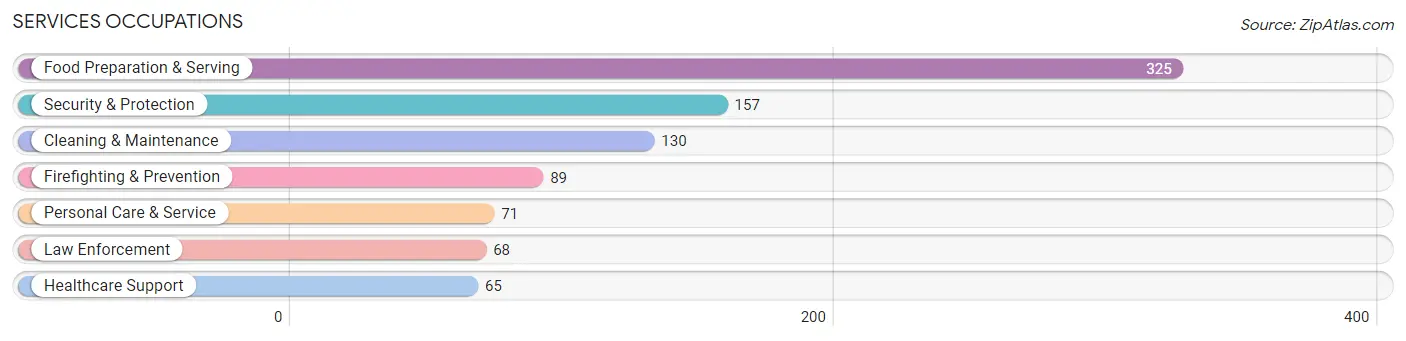
The most common Services occupations in Waimanalo are Food Preparation & Serving (325 | 12.4%), Security & Protection (157 | 6.0%), Cleaning & Maintenance (130 | 5.0%), Firefighting & Prevention (89 | 3.4%), and Personal Care & Service (71 | 2.7%).
Services Occupations by Sex
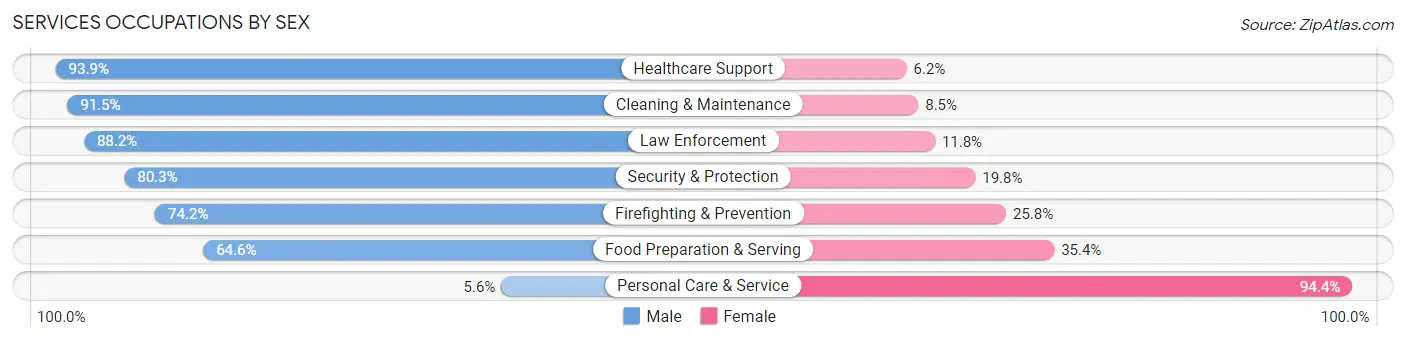
Within the Services occupations in Waimanalo, the most male-oriented occupations are Healthcare Support (93.9%), Cleaning & Maintenance (91.5%), and Law Enforcement (88.2%), while the most female-oriented occupations are Personal Care & Service (94.4%), Food Preparation & Serving (35.4%), and Firefighting & Prevention (25.8%).
| Occupation | Male | Female |
| Healthcare Support | 61 (93.9%) | 4 (6.1%) |
| Security & Protection | 126 (80.2%) | 31 (19.8%) |
| Firefighting & Prevention | 66 (74.2%) | 23 (25.8%) |
| Law Enforcement | 60 (88.2%) | 8 (11.8%) |
| Food Preparation & Serving | 210 (64.6%) | 115 (35.4%) |
| Cleaning & Maintenance | 119 (91.5%) | 11 (8.5%) |
| Personal Care & Service | 4 (5.6%) | 67 (94.4%) |
| Total (Category) | 520 (69.5%) | 228 (30.5%) |
| Total (Overall) | 1,597 (60.8%) | 1,029 (39.2%) |
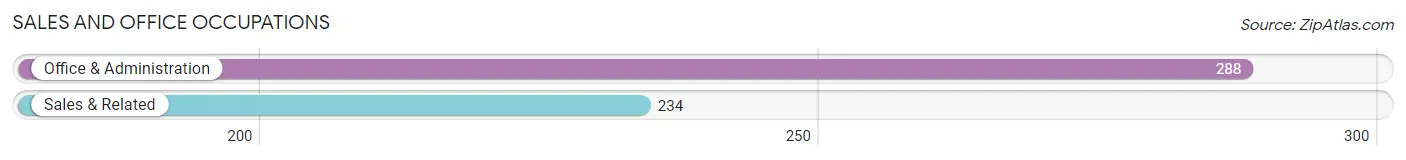
Sales and Office Occupations
The most common Sales and Office occupations in Waimanalo are Office & Administration (288 | 11.0%), and Sales & Related (234 | 8.9%).
Sales and Office Occupations by Sex
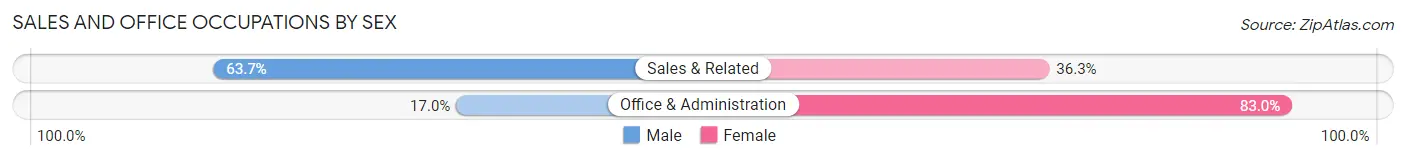
| Occupation | Male | Female |
| Sales & Related | 149 (63.7%) | 85 (36.3%) |
| Office & Administration | 49 (17.0%) | 239 (83.0%) |
| Total (Category) | 198 (37.9%) | 324 (62.1%) |
| Total (Overall) | 1,597 (60.8%) | 1,029 (39.2%) |
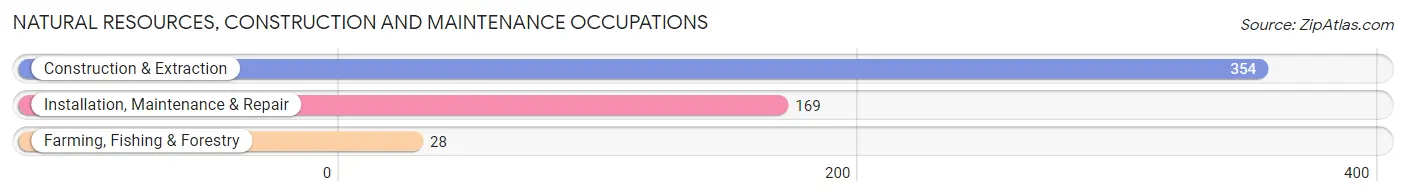
Natural Resources, Construction and Maintenance Occupations
The most common Natural Resources, Construction and Maintenance occupations in Waimanalo are Construction & Extraction (354 | 13.5%), Installation, Maintenance & Repair (169 | 6.4%), and Farming, Fishing & Forestry (28 | 1.1%).
Natural Resources, Construction and Maintenance Occupations by Sex
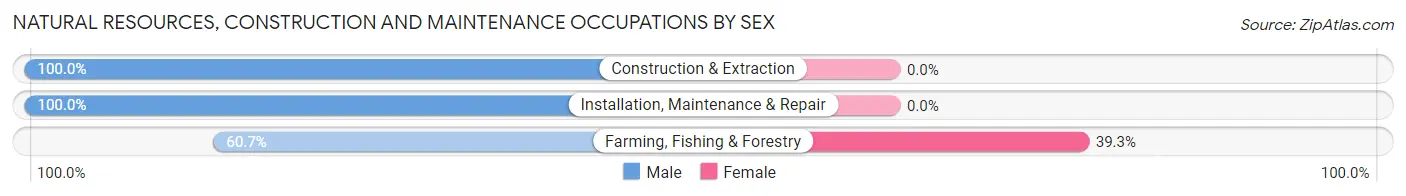
| Occupation | Male | Female |
| Farming, Fishing & Forestry | 17 (60.7%) | 11 (39.3%) |
| Construction & Extraction | 354 (100.0%) | 0 (0.0%) |
| Installation, Maintenance & Repair | 169 (100.0%) | 0 (0.0%) |
| Total (Category) | 540 (98.0%) | 11 (2.0%) |
| Total (Overall) | 1,597 (60.8%) | 1,029 (39.2%) |
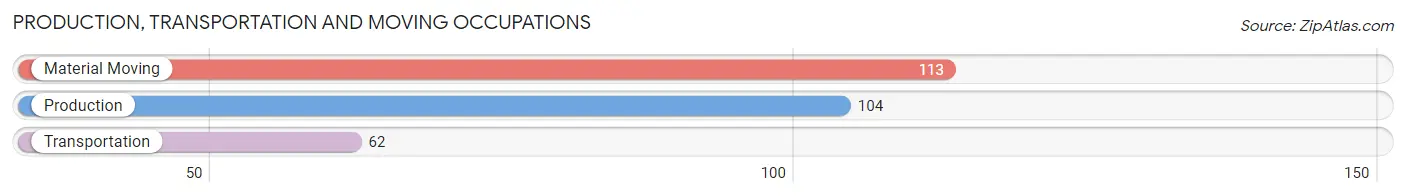
Production, Transportation and Moving Occupations
The most common Production, Transportation and Moving occupations in Waimanalo are Material Moving (113 | 4.3%), Production (104 | 4.0%), and Transportation (62 | 2.4%).
Production, Transportation and Moving Occupations by Sex
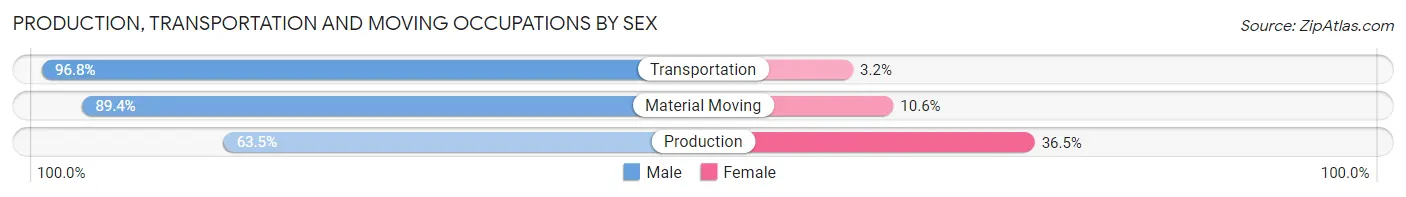
| Occupation | Male | Female |
| Production | 66 (63.5%) | 38 (36.5%) |
| Transportation | 60 (96.8%) | 2 (3.2%) |
| Material Moving | 101 (89.4%) | 12 (10.6%) |
| Total (Category) | 227 (81.4%) | 52 (18.6%) |
| Total (Overall) | 1,597 (60.8%) | 1,029 (39.2%) |
Employment Industries by Sex in Waimanalo
Employment Industries in Waimanalo
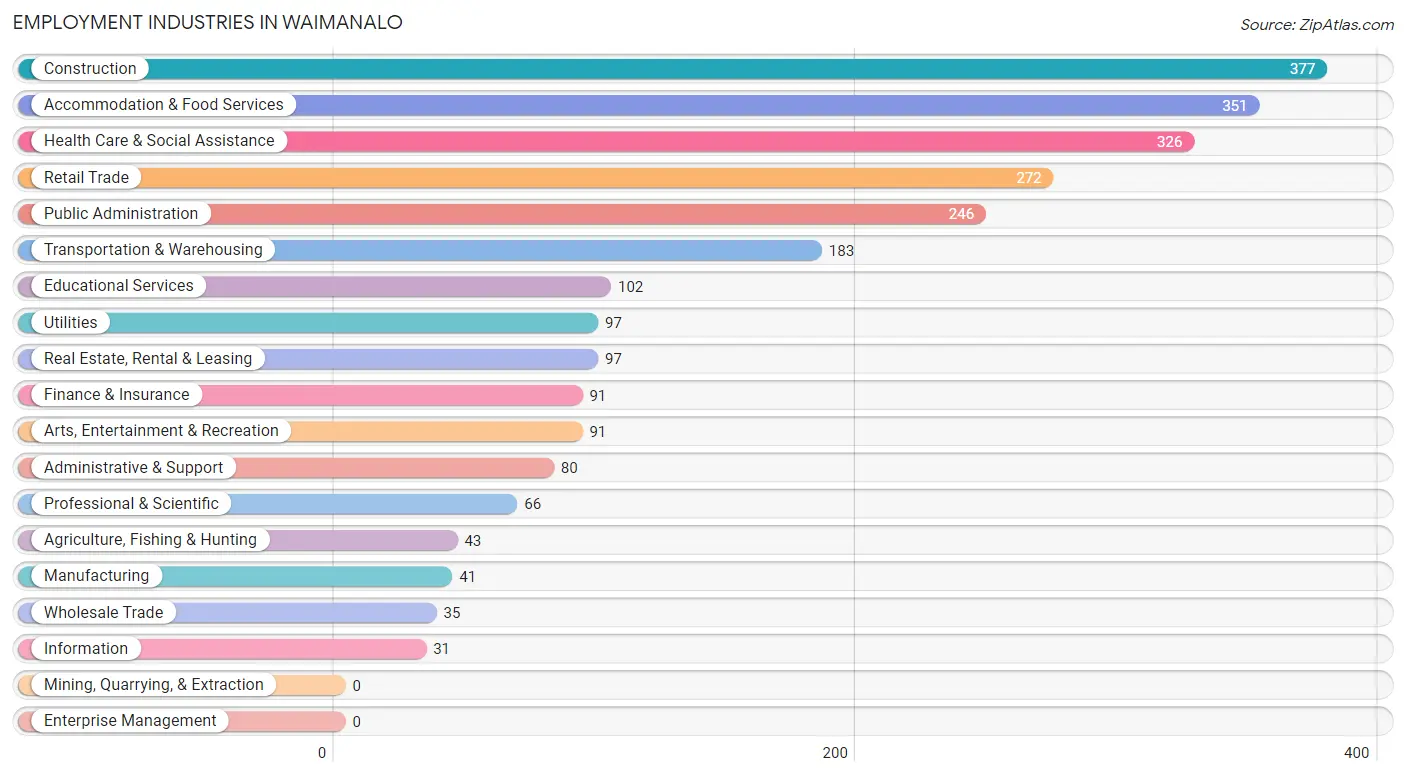
The major employment industries in Waimanalo include Construction (377 | 14.4%), Accommodation & Food Services (351 | 13.4%), Health Care & Social Assistance (326 | 12.4%), Retail Trade (272 | 10.4%), and Public Administration (246 | 9.4%).
Employment Industries by Sex in Waimanalo
The Waimanalo industries that see more men than women are Construction (98.7%), Transportation & Warehousing (98.4%), and Utilities (97.9%), whereas the industries that tend to have a higher number of women are Information (100.0%), Educational Services (92.2%), and Retail Trade (77.9%).
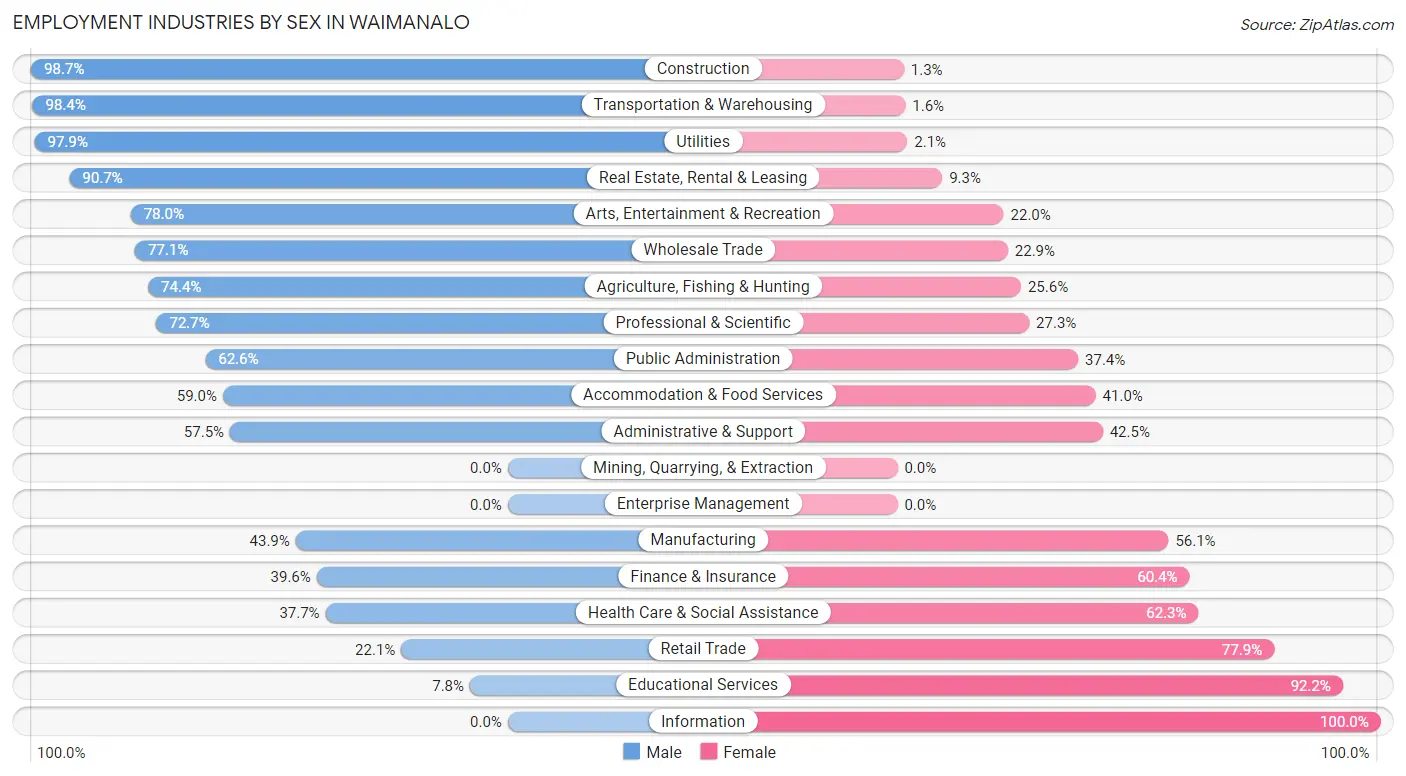
| Industry | Male | Female |
| Agriculture, Fishing & Hunting | 32 (74.4%) | 11 (25.6%) |
| Mining, Quarrying, & Extraction | 0 (0.0%) | 0 (0.0%) |
| Construction | 372 (98.7%) | 5 (1.3%) |
| Manufacturing | 18 (43.9%) | 23 (56.1%) |
| Wholesale Trade | 27 (77.1%) | 8 (22.9%) |
| Retail Trade | 60 (22.1%) | 212 (77.9%) |
| Transportation & Warehousing | 180 (98.4%) | 3 (1.6%) |
| Utilities | 95 (97.9%) | 2 (2.1%) |
| Information | 0 (0.0%) | 31 (100.0%) |
| Finance & Insurance | 36 (39.6%) | 55 (60.4%) |
| Real Estate, Rental & Leasing | 88 (90.7%) | 9 (9.3%) |
| Professional & Scientific | 48 (72.7%) | 18 (27.3%) |
| Enterprise Management | 0 (0.0%) | 0 (0.0%) |
| Administrative & Support | 46 (57.5%) | 34 (42.5%) |
| Educational Services | 8 (7.8%) | 94 (92.2%) |
| Health Care & Social Assistance | 123 (37.7%) | 203 (62.3%) |
| Arts, Entertainment & Recreation | 71 (78.0%) | 20 (22.0%) |
| Accommodation & Food Services | 207 (59.0%) | 144 (41.0%) |
| Public Administration | 154 (62.6%) | 92 (37.4%) |
| Total | 1,597 (60.8%) | 1,029 (39.2%) |
Education in Waimanalo
School Enrollment in Waimanalo
The most common levels of schooling among the 2,043 students in Waimanalo are middle school (554 | 27.1%), elementary school (432 | 21.1%), and college / undergraduate (398 | 19.5%).
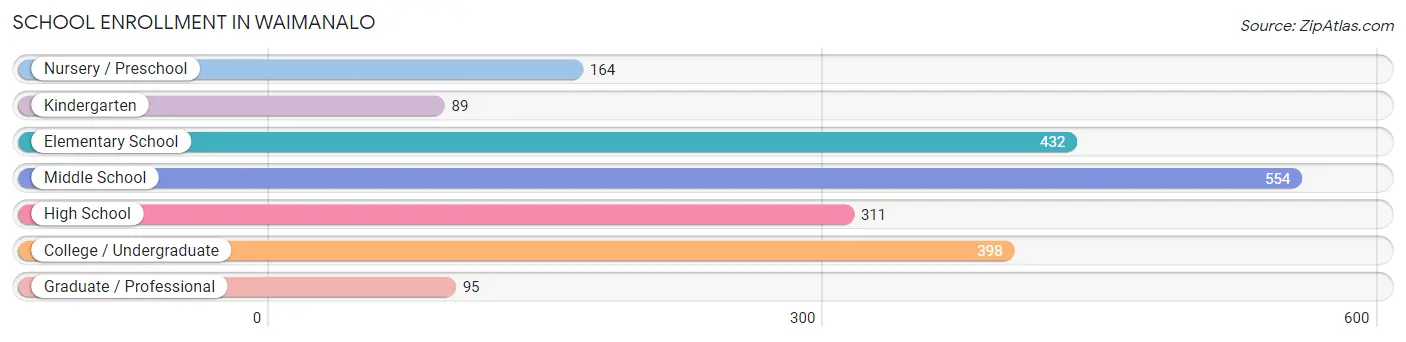
| School Level | # Students | % Students |
| Nursery / Preschool | 164 | 8.0% |
| Kindergarten | 89 | 4.4% |
| Elementary School | 432 | 21.1% |
| Middle School | 554 | 27.1% |
| High School | 311 | 15.2% |
| College / Undergraduate | 398 | 19.5% |
| Graduate / Professional | 95 | 4.6% |
| Total | 2,043 | 100.0% |
School Enrollment by Age by Funding Source in Waimanalo
Out of a total of 2,043 students who are enrolled in schools in Waimanalo, 543 (26.6%) attend a private institution, while the remaining 1,500 (73.4%) are enrolled in public schools. The age group of 18 to 19 year olds has the highest likelihood of being enrolled in private schools, with 67 (58.8% in the age bracket) enrolled. Conversely, the age group of 25 to 34 year olds has the lowest likelihood of being enrolled in a private school, with 142 (96.6% in the age bracket) attending a public institution.
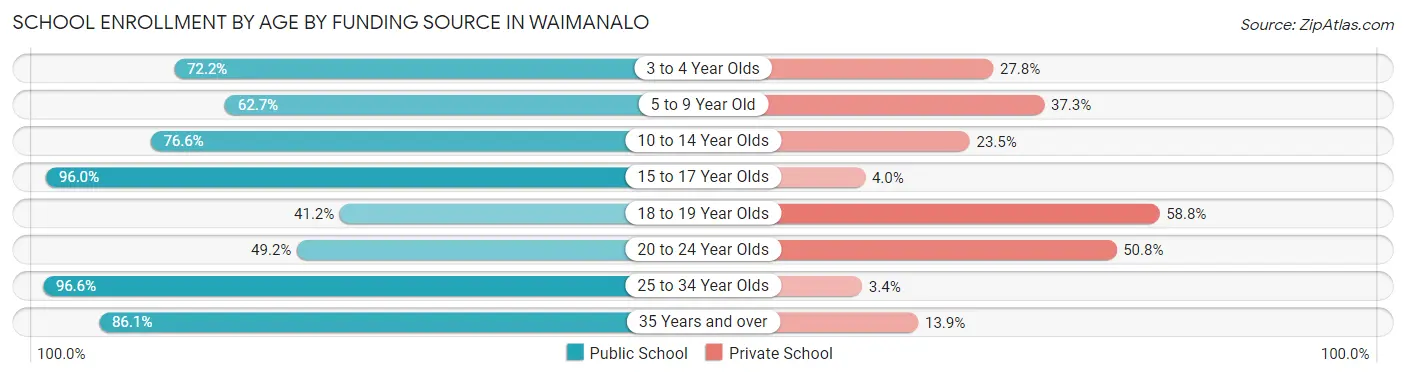
| Age Bracket | Public School | Private School |
| 3 to 4 Year Olds | 96 (72.2%) | 37 (27.8%) |
| 5 to 9 Year Old | 341 (62.7%) | 203 (37.3%) |
| 10 to 14 Year Olds | 457 (76.5%) | 140 (23.4%) |
| 15 to 17 Year Olds | 266 (96.0%) | 11 (4.0%) |
| 18 to 19 Year Olds | 47 (41.2%) | 67 (58.8%) |
| 20 to 24 Year Olds | 64 (49.2%) | 66 (50.8%) |
| 25 to 34 Year Olds | 142 (96.6%) | 5 (3.4%) |
| 35 Years and over | 87 (86.1%) | 14 (13.9%) |
| Total | 1,500 (73.4%) | 543 (26.6%) |
Educational Attainment by Field of Study in Waimanalo
Social sciences (119 | 21.0%), business (96 | 17.0%), liberal arts & history (78 | 13.8%), bio, nature & agricultural (55 | 9.7%), and computers & mathematics (46 | 8.1%) are the most common fields of study among 566 individuals in Waimanalo who have obtained a bachelor's degree or higher.
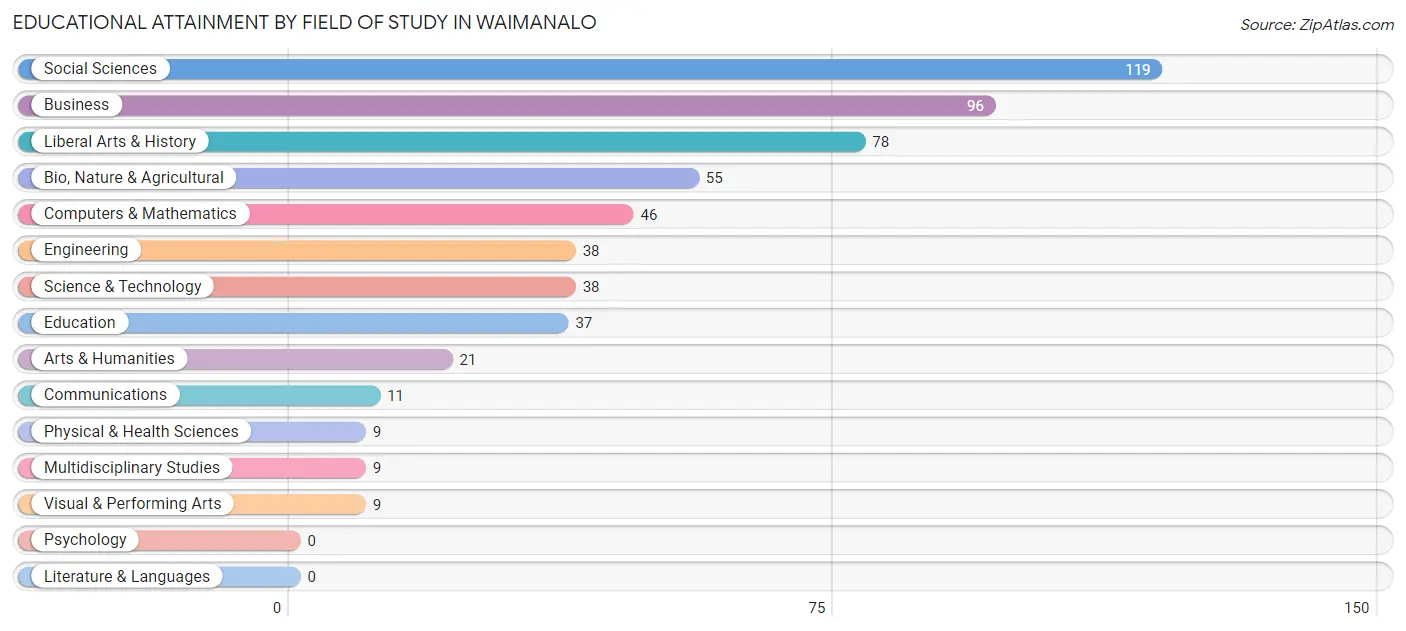
| Field of Study | # Graduates | % Graduates |
| Computers & Mathematics | 46 | 8.1% |
| Bio, Nature & Agricultural | 55 | 9.7% |
| Physical & Health Sciences | 9 | 1.6% |
| Psychology | 0 | 0.0% |
| Social Sciences | 119 | 21.0% |
| Engineering | 38 | 6.7% |
| Multidisciplinary Studies | 9 | 1.6% |
| Science & Technology | 38 | 6.7% |
| Business | 96 | 17.0% |
| Education | 37 | 6.5% |
| Literature & Languages | 0 | 0.0% |
| Liberal Arts & History | 78 | 13.8% |
| Visual & Performing Arts | 9 | 1.6% |
| Communications | 11 | 1.9% |
| Arts & Humanities | 21 | 3.7% |
| Total | 566 | 100.0% |
Transportation & Commute in Waimanalo
Vehicle Availability by Sex in Waimanalo
The most prevalent vehicle ownership categories in Waimanalo are males with 4 vehicles (398, accounting for 24.5%) and females with 4 vehicles (280, making up 38.3%).
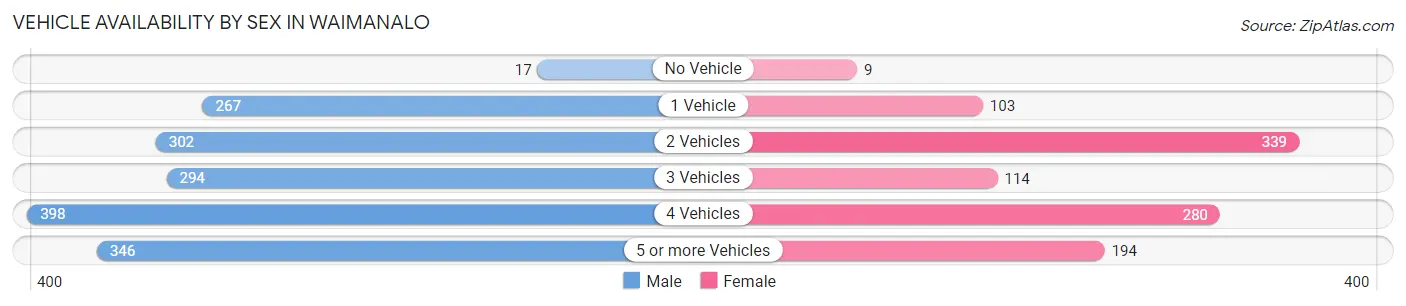
| Vehicles Available | Male | Female |
| No Vehicle | 17 (1.1%) | 9 (0.9%) |
| 1 Vehicle | 267 (16.4%) | 103 (9.9%) |
| 2 Vehicles | 302 (18.6%) | 339 (32.6%) |
| 3 Vehicles | 294 (18.1%) | 114 (11.0%) |
| 4 Vehicles | 398 (24.5%) | 280 (27.0%) |
| 5 or more Vehicles | 346 (21.3%) | 194 (18.7%) |
| Total | 1,624 (100.0%) | 1,039 (100.0%) |
Commute Time in Waimanalo
The most frequently occuring commute durations in Waimanalo are 30 to 34 minutes (745 commuters, 30.1%), 20 to 24 minutes (326 commuters, 13.2%), and 40 to 44 minutes (239 commuters, 9.6%).
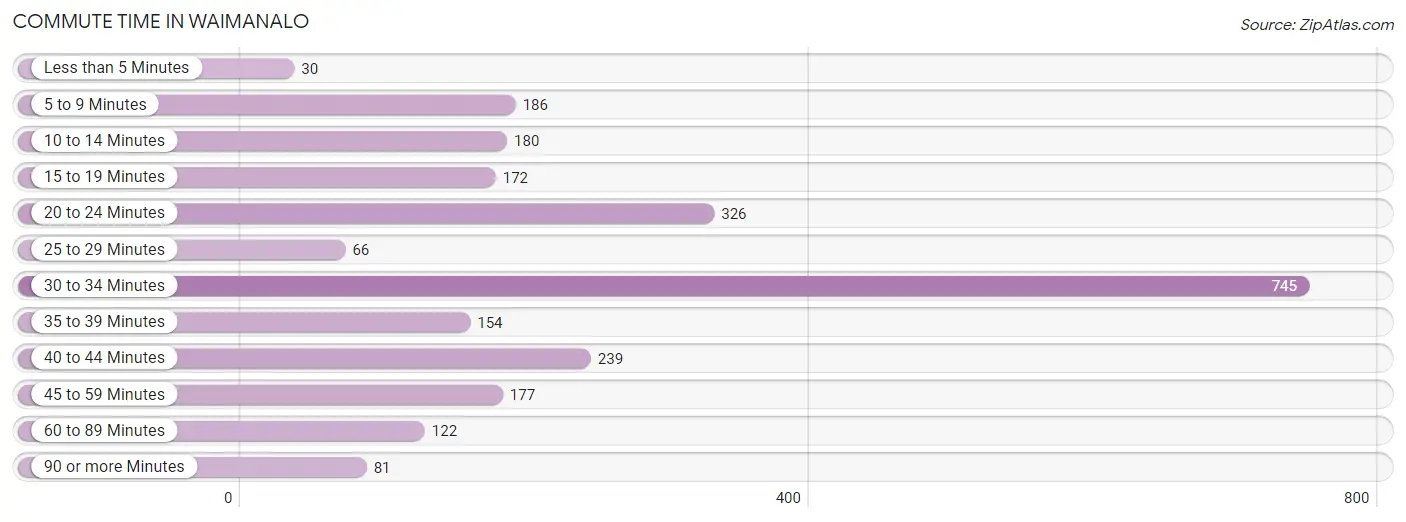
| Commute Time | # Commuters | % Commuters |
| Less than 5 Minutes | 30 | 1.2% |
| 5 to 9 Minutes | 186 | 7.5% |
| 10 to 14 Minutes | 180 | 7.3% |
| 15 to 19 Minutes | 172 | 6.9% |
| 20 to 24 Minutes | 326 | 13.2% |
| 25 to 29 Minutes | 66 | 2.7% |
| 30 to 34 Minutes | 745 | 30.1% |
| 35 to 39 Minutes | 154 | 6.2% |
| 40 to 44 Minutes | 239 | 9.6% |
| 45 to 59 Minutes | 177 | 7.1% |
| 60 to 89 Minutes | 122 | 4.9% |
| 90 or more Minutes | 81 | 3.3% |
Commute Time by Sex in Waimanalo
The most common commute times in Waimanalo are 30 to 34 minutes (552 commuters, 36.2%) for males and 30 to 34 minutes (193 commuters, 20.3%) for females.
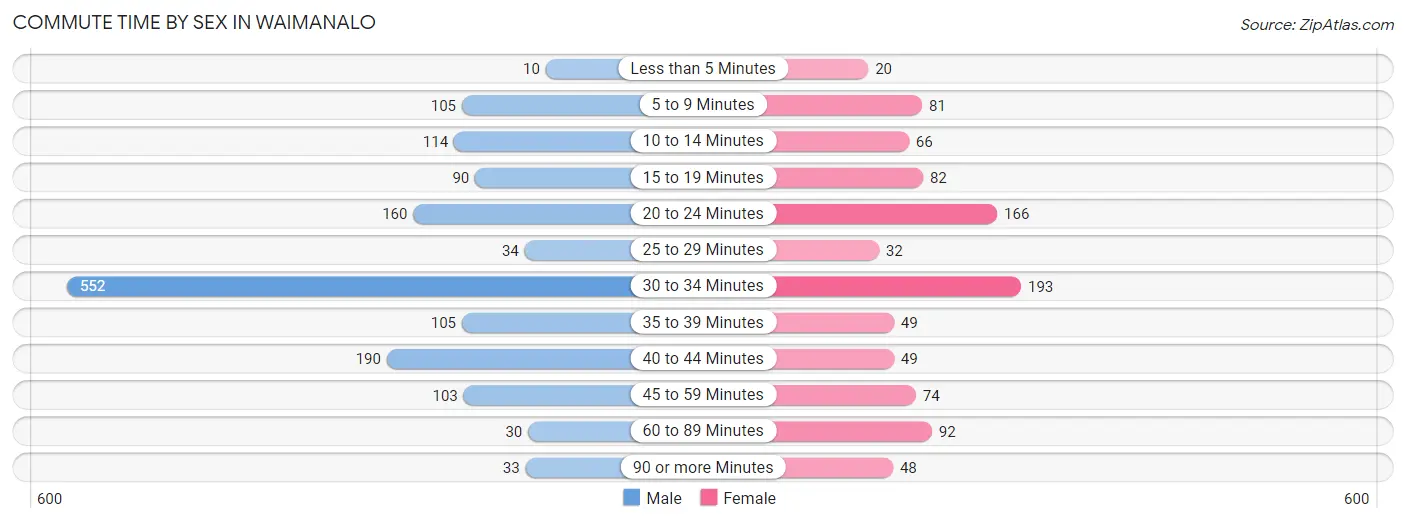
| Commute Time | Male | Female |
| Less than 5 Minutes | 10 (0.7%) | 20 (2.1%) |
| 5 to 9 Minutes | 105 (6.9%) | 81 (8.5%) |
| 10 to 14 Minutes | 114 (7.5%) | 66 (6.9%) |
| 15 to 19 Minutes | 90 (5.9%) | 82 (8.6%) |
| 20 to 24 Minutes | 160 (10.5%) | 166 (17.4%) |
| 25 to 29 Minutes | 34 (2.2%) | 32 (3.4%) |
| 30 to 34 Minutes | 552 (36.2%) | 193 (20.3%) |
| 35 to 39 Minutes | 105 (6.9%) | 49 (5.1%) |
| 40 to 44 Minutes | 190 (12.4%) | 49 (5.1%) |
| 45 to 59 Minutes | 103 (6.8%) | 74 (7.8%) |
| 60 to 89 Minutes | 30 (2.0%) | 92 (9.7%) |
| 90 or more Minutes | 33 (2.2%) | 48 (5.0%) |
Time of Departure to Work by Sex in Waimanalo
The most frequent times of departure to work in Waimanalo are 6:00 AM to 6:29 AM (263, 17.2%) for males and 7:00 AM to 7:29 AM (160, 16.8%) for females.
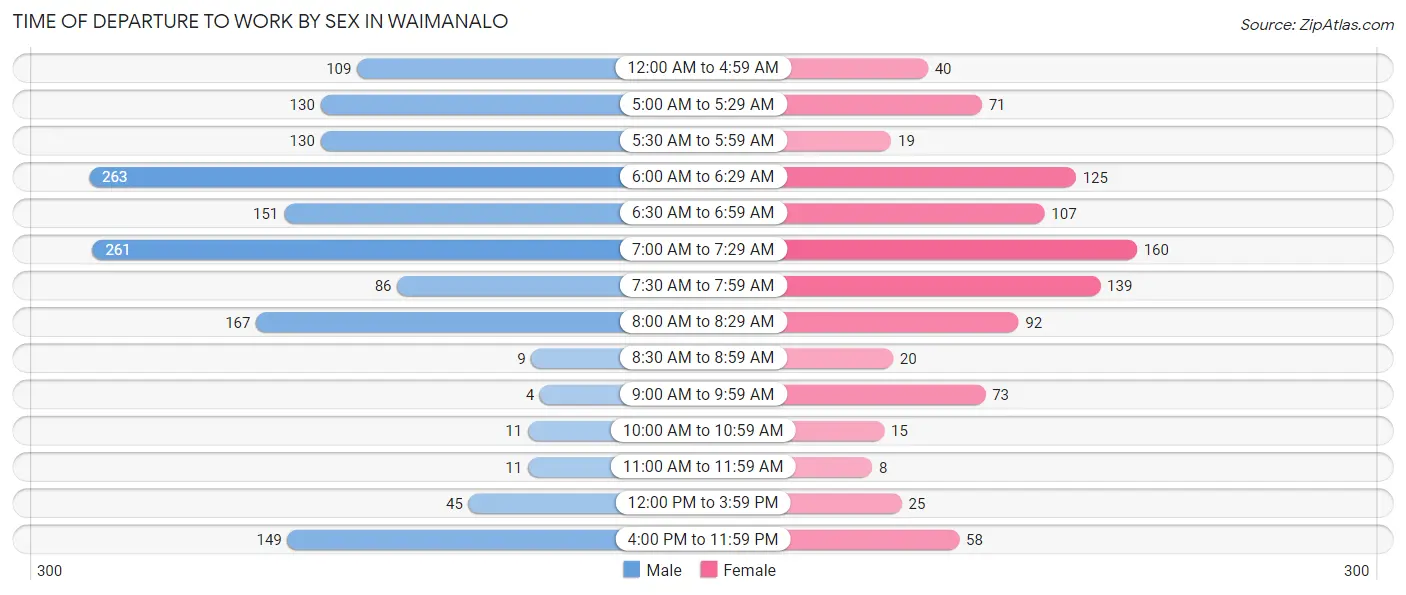
| Time of Departure | Male | Female |
| 12:00 AM to 4:59 AM | 109 (7.1%) | 40 (4.2%) |
| 5:00 AM to 5:29 AM | 130 (8.5%) | 71 (7.5%) |
| 5:30 AM to 5:59 AM | 130 (8.5%) | 19 (2.0%) |
| 6:00 AM to 6:29 AM | 263 (17.2%) | 125 (13.1%) |
| 6:30 AM to 6:59 AM | 151 (9.9%) | 107 (11.2%) |
| 7:00 AM to 7:29 AM | 261 (17.1%) | 160 (16.8%) |
| 7:30 AM to 7:59 AM | 86 (5.6%) | 139 (14.6%) |
| 8:00 AM to 8:29 AM | 167 (10.9%) | 92 (9.7%) |
| 8:30 AM to 8:59 AM | 9 (0.6%) | 20 (2.1%) |
| 9:00 AM to 9:59 AM | 4 (0.3%) | 73 (7.7%) |
| 10:00 AM to 10:59 AM | 11 (0.7%) | 15 (1.6%) |
| 11:00 AM to 11:59 AM | 11 (0.7%) | 8 (0.8%) |
| 12:00 PM to 3:59 PM | 45 (2.9%) | 25 (2.6%) |
| 4:00 PM to 11:59 PM | 149 (9.8%) | 58 (6.1%) |
| Total | 1,526 (100.0%) | 952 (100.0%) |
Housing Occupancy in Waimanalo
Occupancy by Ownership in Waimanalo
Of the total 1,242 dwellings in Waimanalo, owner-occupied units account for 937 (75.4%), while renter-occupied units make up 305 (24.6%).
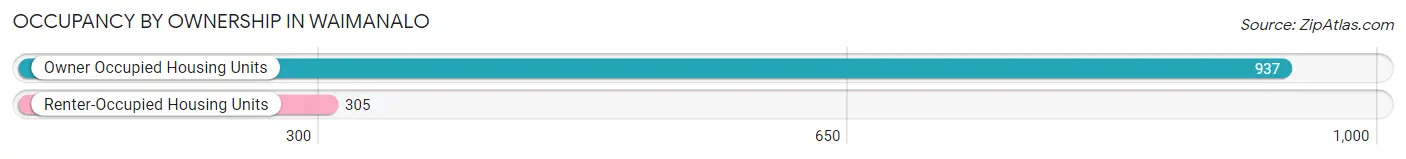
| Occupancy | # Housing Units | % Housing Units |
| Owner Occupied Housing Units | 937 | 75.4% |
| Renter-Occupied Housing Units | 305 | 24.6% |
| Total Occupied Housing Units | 1,242 | 100.0% |
Occupancy by Household Size in Waimanalo
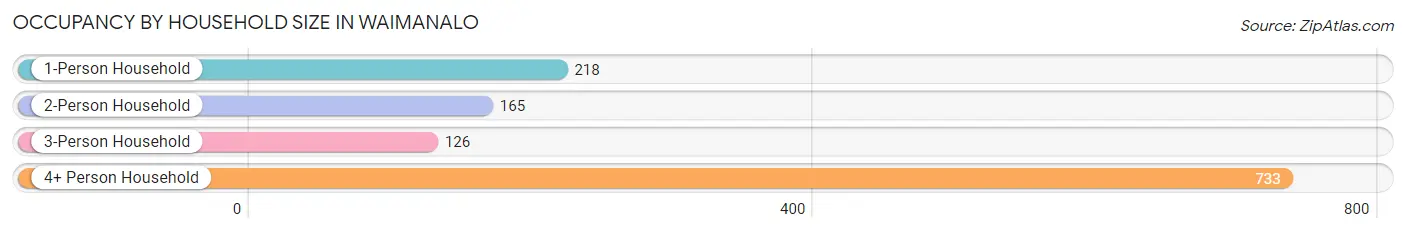
| Household Size | # Housing Units | % Housing Units |
| 1-Person Household | 218 | 17.5% |
| 2-Person Household | 165 | 13.3% |
| 3-Person Household | 126 | 10.1% |
| 4+ Person Household | 733 | 59.0% |
| Total Housing Units | 1,242 | 100.0% |
Occupancy by Ownership by Household Size in Waimanalo
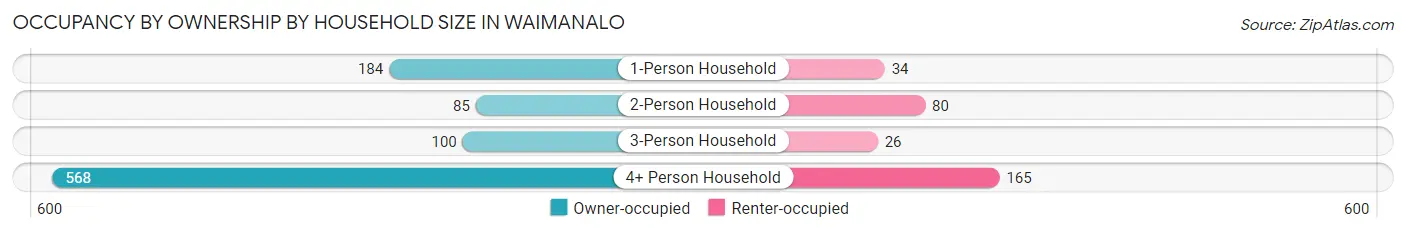
| Household Size | Owner-occupied | Renter-occupied |
| 1-Person Household | 184 (84.4%) | 34 (15.6%) |
| 2-Person Household | 85 (51.5%) | 80 (48.5%) |
| 3-Person Household | 100 (79.4%) | 26 (20.6%) |
| 4+ Person Household | 568 (77.5%) | 165 (22.5%) |
| Total Housing Units | 937 (75.4%) | 305 (24.6%) |
Occupancy by Educational Attainment in Waimanalo
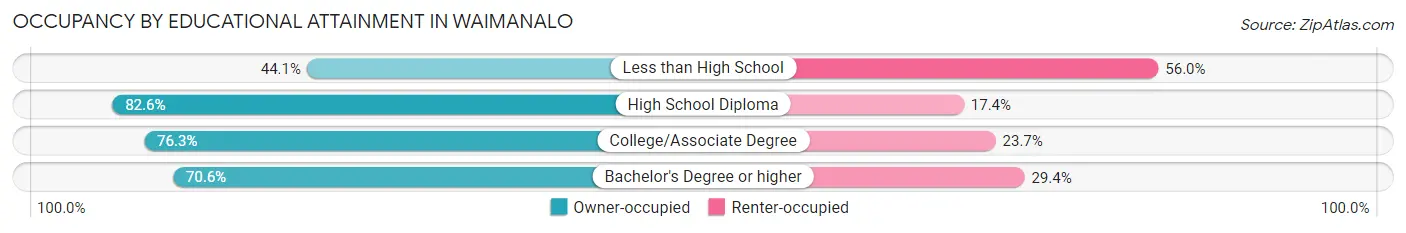
| Household Size | Owner-occupied | Renter-occupied |
| Less than High School | 37 (44.1%) | 47 (55.9%) |
| High School Diploma | 366 (82.6%) | 77 (17.4%) |
| College/Associate Degree | 390 (76.3%) | 121 (23.7%) |
| Bachelor's Degree or higher | 144 (70.6%) | 60 (29.4%) |
Occupancy by Age of Householder in Waimanalo
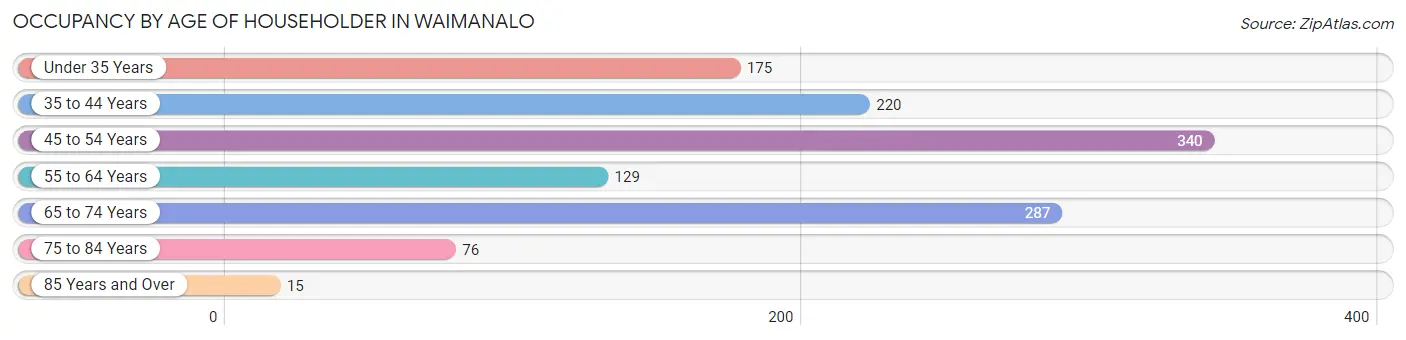
| Age Bracket | # Households | % Households |
| Under 35 Years | 175 | 14.1% |
| 35 to 44 Years | 220 | 17.7% |
| 45 to 54 Years | 340 | 27.4% |
| 55 to 64 Years | 129 | 10.4% |
| 65 to 74 Years | 287 | 23.1% |
| 75 to 84 Years | 76 | 6.1% |
| 85 Years and Over | 15 | 1.2% |
| Total | 1,242 | 100.0% |
Housing Finances in Waimanalo
Median Income by Occupancy in Waimanalo
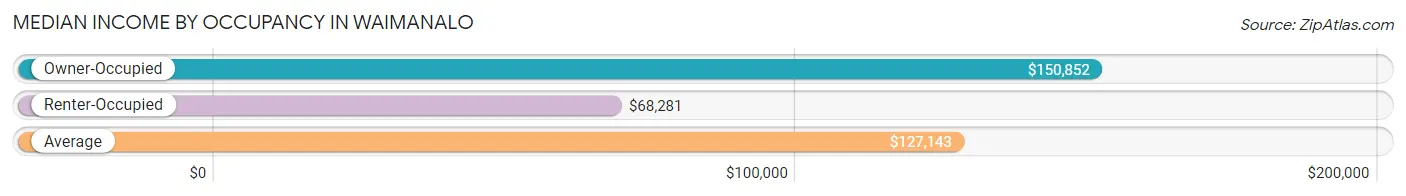
| Occupancy Type | # Households | Median Income |
| Owner-Occupied | 937 (75.4%) | $150,852 |
| Renter-Occupied | 305 (24.6%) | $68,281 |
| Average | 1,242 (100.0%) | $127,143 |
Occupancy by Householder Income Bracket in Waimanalo
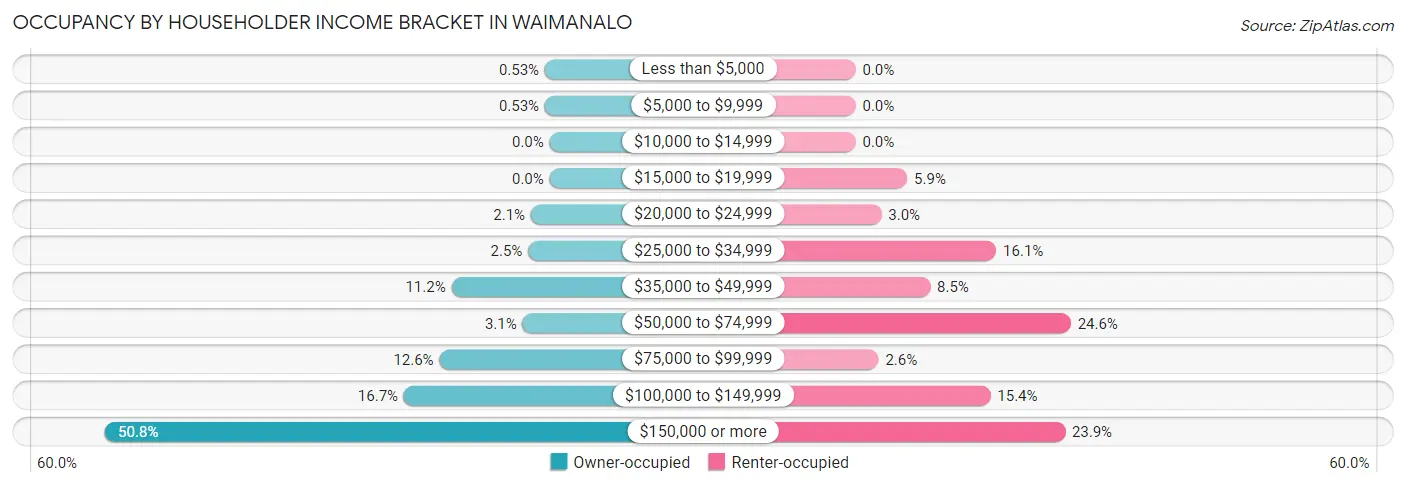
| Income Bracket | Owner-occupied | Renter-occupied |
| Less than $5,000 | 5 (0.5%) | 0 (0.0%) |
| $5,000 to $9,999 | 5 (0.5%) | 0 (0.0%) |
| $10,000 to $14,999 | 0 (0.0%) | 0 (0.0%) |
| $15,000 to $19,999 | 0 (0.0%) | 18 (5.9%) |
| $20,000 to $24,999 | 20 (2.1%) | 9 (2.9%) |
| $25,000 to $34,999 | 23 (2.5%) | 49 (16.1%) |
| $35,000 to $49,999 | 105 (11.2%) | 26 (8.5%) |
| $50,000 to $74,999 | 29 (3.1%) | 75 (24.6%) |
| $75,000 to $99,999 | 118 (12.6%) | 8 (2.6%) |
| $100,000 to $149,999 | 156 (16.7%) | 47 (15.4%) |
| $150,000 or more | 476 (50.8%) | 73 (23.9%) |
| Total | 937 (100.0%) | 305 (100.0%) |
Monthly Housing Cost Tiers in Waimanalo
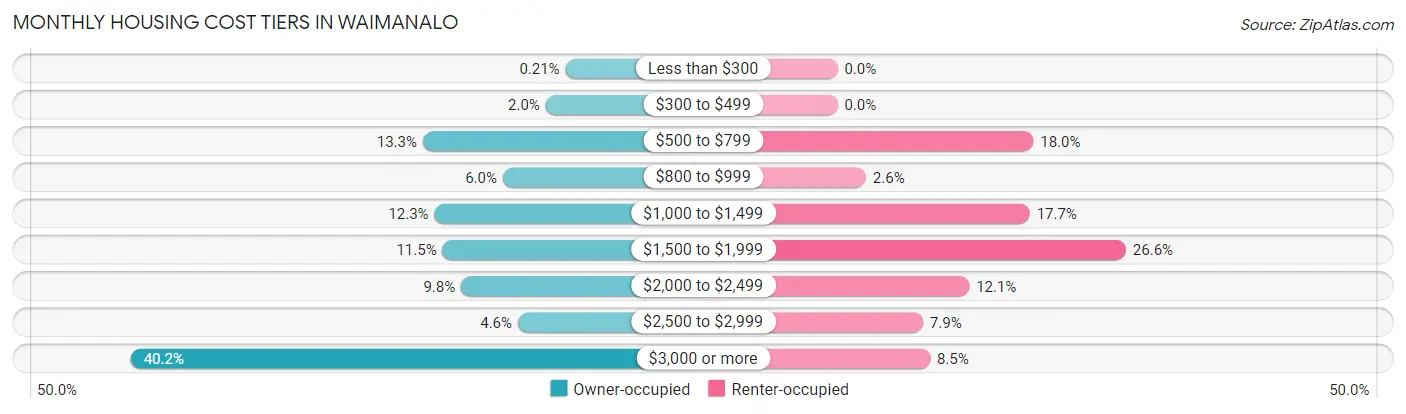
| Monthly Cost | Owner-occupied | Renter-occupied |
| Less than $300 | 2 (0.2%) | 0 (0.0%) |
| $300 to $499 | 19 (2.0%) | 0 (0.0%) |
| $500 to $799 | 125 (13.3%) | 55 (18.0%) |
| $800 to $999 | 56 (6.0%) | 8 (2.6%) |
| $1,000 to $1,499 | 115 (12.3%) | 54 (17.7%) |
| $1,500 to $1,999 | 108 (11.5%) | 81 (26.6%) |
| $2,000 to $2,499 | 92 (9.8%) | 37 (12.1%) |
| $2,500 to $2,999 | 43 (4.6%) | 24 (7.9%) |
| $3,000 or more | 377 (40.2%) | 26 (8.5%) |
| Total | 937 (100.0%) | 305 (100.0%) |
Physical Housing Characteristics in Waimanalo
Housing Structures in Waimanalo
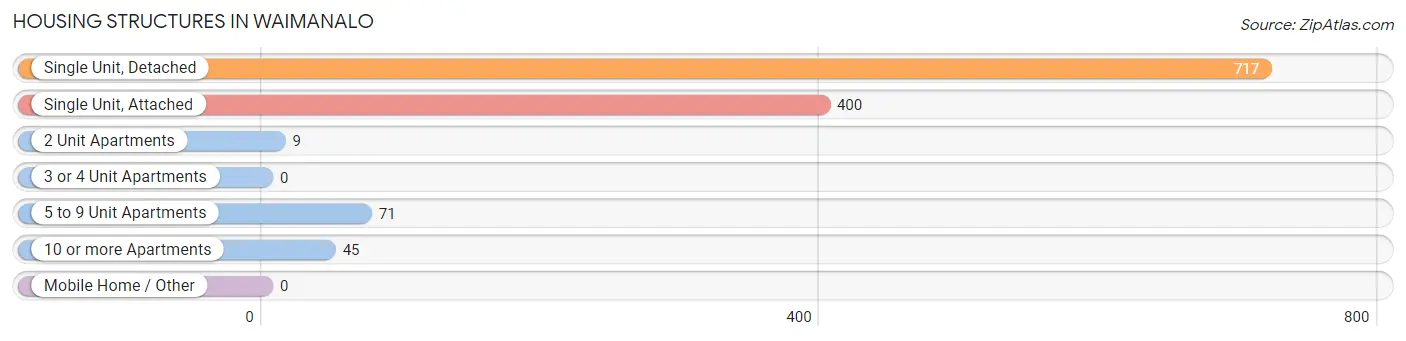
| Structure Type | # Housing Units | % Housing Units |
| Single Unit, Detached | 717 | 57.7% |
| Single Unit, Attached | 400 | 32.2% |
| 2 Unit Apartments | 9 | 0.7% |
| 3 or 4 Unit Apartments | 0 | 0.0% |
| 5 to 9 Unit Apartments | 71 | 5.7% |
| 10 or more Apartments | 45 | 3.6% |
| Mobile Home / Other | 0 | 0.0% |
| Total | 1,242 | 100.0% |
Housing Structures by Occupancy in Waimanalo
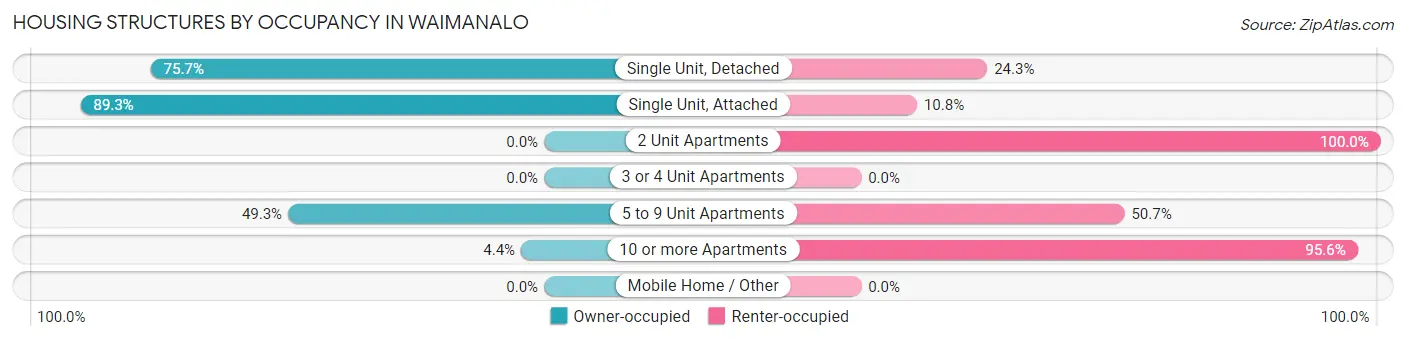
| Structure Type | Owner-occupied | Renter-occupied |
| Single Unit, Detached | 543 (75.7%) | 174 (24.3%) |
| Single Unit, Attached | 357 (89.2%) | 43 (10.7%) |
| 2 Unit Apartments | 0 (0.0%) | 9 (100.0%) |
| 3 or 4 Unit Apartments | 0 (0.0%) | 0 (0.0%) |
| 5 to 9 Unit Apartments | 35 (49.3%) | 36 (50.7%) |
| 10 or more Apartments | 2 (4.4%) | 43 (95.6%) |
| Mobile Home / Other | 0 (0.0%) | 0 (0.0%) |
| Total | 937 (75.4%) | 305 (24.6%) |
Housing Structures by Number of Rooms in Waimanalo
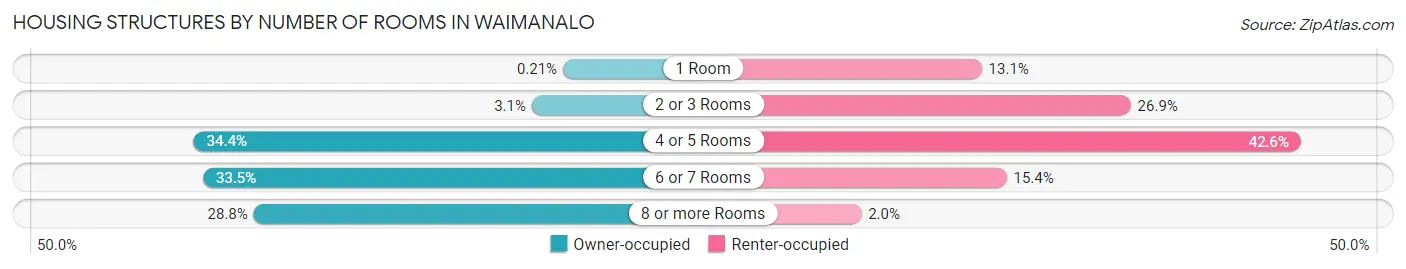
| Number of Rooms | Owner-occupied | Renter-occupied |
| 1 Room | 2 (0.2%) | 40 (13.1%) |
| 2 or 3 Rooms | 29 (3.1%) | 82 (26.9%) |
| 4 or 5 Rooms | 322 (34.4%) | 130 (42.6%) |
| 6 or 7 Rooms | 314 (33.5%) | 47 (15.4%) |
| 8 or more Rooms | 270 (28.8%) | 6 (2.0%) |
| Total | 937 (100.0%) | 305 (100.0%) |
Housing Structure by Heating Type in Waimanalo
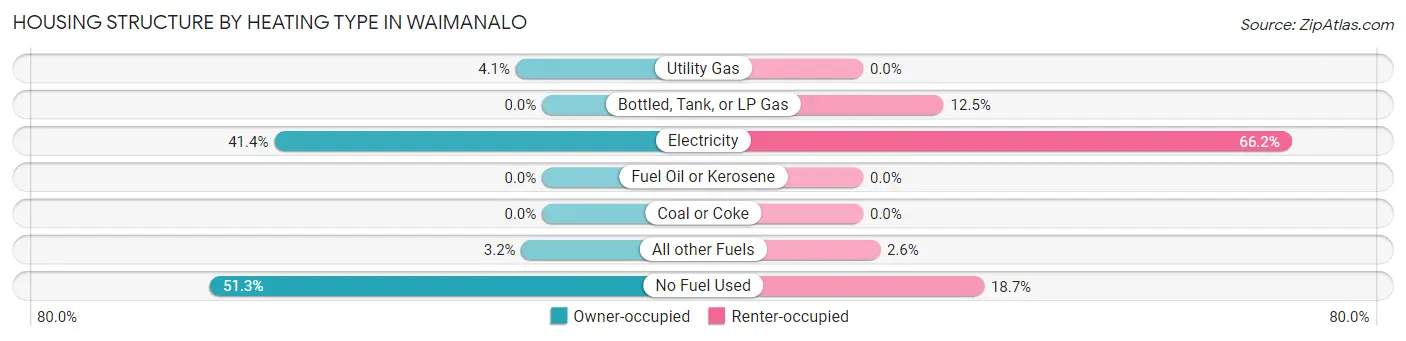
| Heating Type | Owner-occupied | Renter-occupied |
| Utility Gas | 38 (4.1%) | 0 (0.0%) |
| Bottled, Tank, or LP Gas | 0 (0.0%) | 38 (12.5%) |
| Electricity | 388 (41.4%) | 202 (66.2%) |
| Fuel Oil or Kerosene | 0 (0.0%) | 0 (0.0%) |
| Coal or Coke | 0 (0.0%) | 0 (0.0%) |
| All other Fuels | 30 (3.2%) | 8 (2.6%) |
| No Fuel Used | 481 (51.3%) | 57 (18.7%) |
| Total | 937 (100.0%) | 305 (100.0%) |
Household Vehicle Usage in Waimanalo
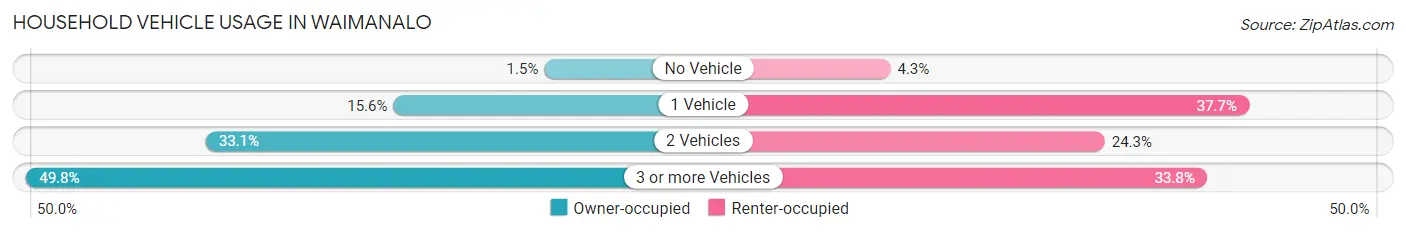
| Vehicles per Household | Owner-occupied | Renter-occupied |
| No Vehicle | 14 (1.5%) | 13 (4.3%) |
| 1 Vehicle | 146 (15.6%) | 115 (37.7%) |
| 2 Vehicles | 310 (33.1%) | 74 (24.3%) |
| 3 or more Vehicles | 467 (49.8%) | 103 (33.8%) |
| Total | 937 (100.0%) | 305 (100.0%) |
Real Estate & Mortgages in Waimanalo
Real Estate and Mortgage Overview in Waimanalo
| Characteristic | Without Mortgage | With Mortgage |
| Housing Units | 208 | 729 |
| Median Property Value | $683,200 | $673,300 |
| Median Household Income | $109,028 | $388 |
| Monthly Housing Costs | $733 | $377 |
| Real Estate Taxes | $2,162 | $35 |
Property Value by Mortgage Status in Waimanalo
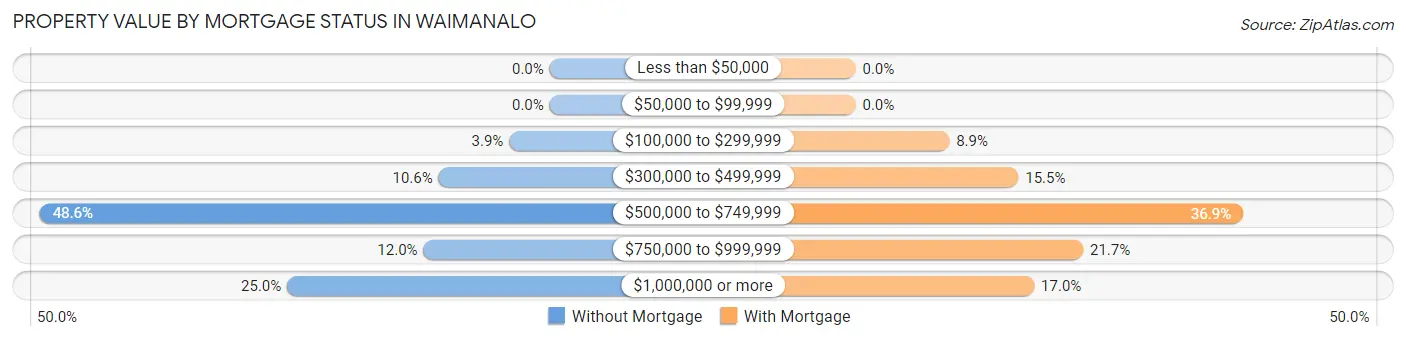
| Property Value | Without Mortgage | With Mortgage |
| Less than $50,000 | 0 (0.0%) | 0 (0.0%) |
| $50,000 to $99,999 | 0 (0.0%) | 0 (0.0%) |
| $100,000 to $299,999 | 8 (3.8%) | 65 (8.9%) |
| $300,000 to $499,999 | 22 (10.6%) | 113 (15.5%) |
| $500,000 to $749,999 | 101 (48.6%) | 269 (36.9%) |
| $750,000 to $999,999 | 25 (12.0%) | 158 (21.7%) |
| $1,000,000 or more | 52 (25.0%) | 124 (17.0%) |
| Total | 208 (100.0%) | 729 (100.0%) |
Household Income by Mortgage Status in Waimanalo
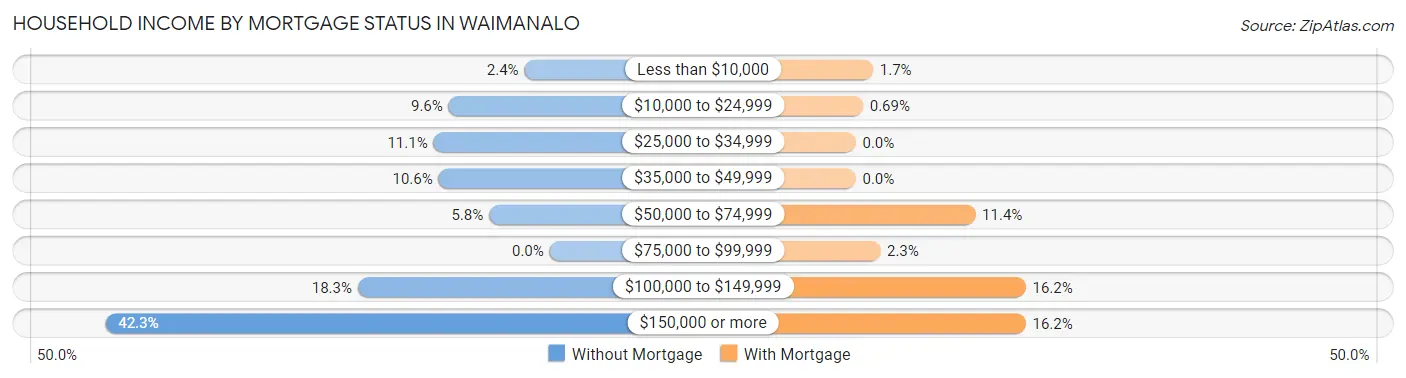
| Household Income | Without Mortgage | With Mortgage |
| Less than $10,000 | 5 (2.4%) | 12 (1.7%) |
| $10,000 to $24,999 | 20 (9.6%) | 5 (0.7%) |
| $25,000 to $34,999 | 23 (11.1%) | 0 (0.0%) |
| $35,000 to $49,999 | 22 (10.6%) | 0 (0.0%) |
| $50,000 to $74,999 | 12 (5.8%) | 83 (11.4%) |
| $75,000 to $99,999 | 0 (0.0%) | 17 (2.3%) |
| $100,000 to $149,999 | 38 (18.3%) | 118 (16.2%) |
| $150,000 or more | 88 (42.3%) | 118 (16.2%) |
| Total | 208 (100.0%) | 729 (100.0%) |
Property Value to Household Income Ratio in Waimanalo
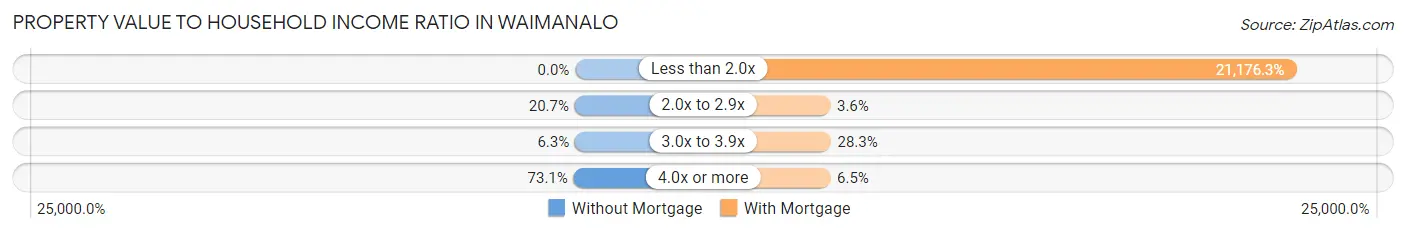
| Value-to-Income Ratio | Without Mortgage | With Mortgage |
| Less than 2.0x | 0 (0.0%) | 154,375 (21,176.3%) |
| 2.0x to 2.9x | 43 (20.7%) | 26 (3.6%) |
| 3.0x to 3.9x | 13 (6.2%) | 206 (28.3%) |
| 4.0x or more | 152 (73.1%) | 47 (6.5%) |
| Total | 208 (100.0%) | 729 (100.0%) |
Real Estate Taxes by Mortgage Status in Waimanalo
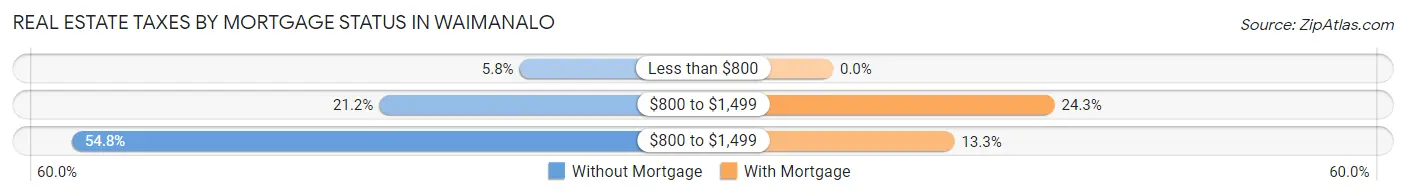
| Property Taxes | Without Mortgage | With Mortgage |
| Less than $800 | 12 (5.8%) | 0 (0.0%) |
| $800 to $1,499 | 44 (21.1%) | 177 (24.3%) |
| $800 to $1,499 | 114 (54.8%) | 97 (13.3%) |
| Total | 208 (100.0%) | 729 (100.0%) |
Health & Disability in Waimanalo
Health Insurance Coverage by Age in Waimanalo
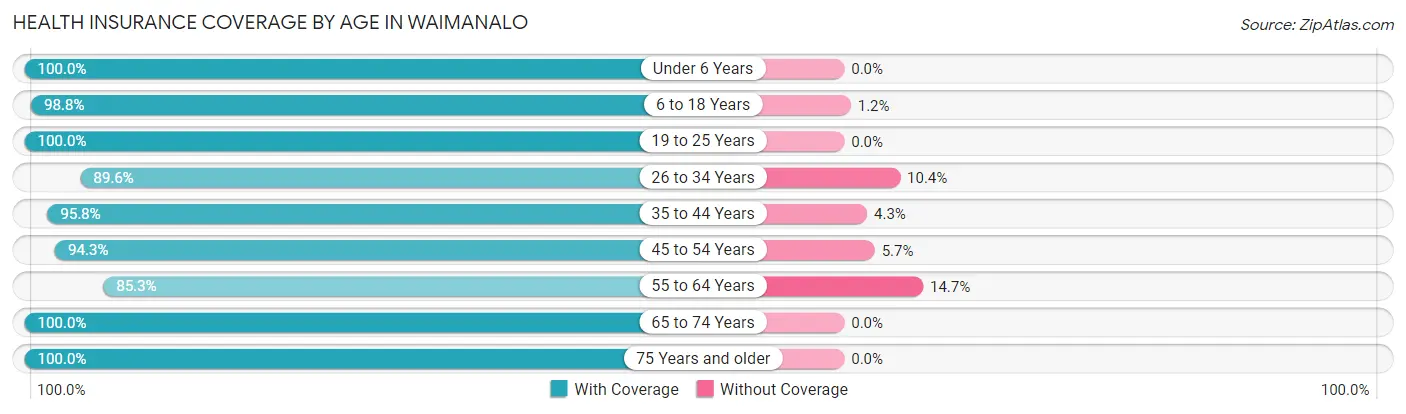
| Age Bracket | With Coverage | Without Coverage |
| Under 6 Years | 461 (100.0%) | 0 (0.0%) |
| 6 to 18 Years | 1,386 (98.8%) | 17 (1.2%) |
| 19 to 25 Years | 615 (100.0%) | 0 (0.0%) |
| 26 to 34 Years | 585 (89.6%) | 68 (10.4%) |
| 35 to 44 Years | 586 (95.8%) | 26 (4.3%) |
| 45 to 54 Years | 731 (94.3%) | 44 (5.7%) |
| 55 to 64 Years | 279 (85.3%) | 48 (14.7%) |
| 65 to 74 Years | 564 (100.0%) | 0 (0.0%) |
| 75 Years and older | 273 (100.0%) | 0 (0.0%) |
| Total | 5,480 (96.4%) | 203 (3.6%) |
Health Insurance Coverage by Citizenship Status in Waimanalo
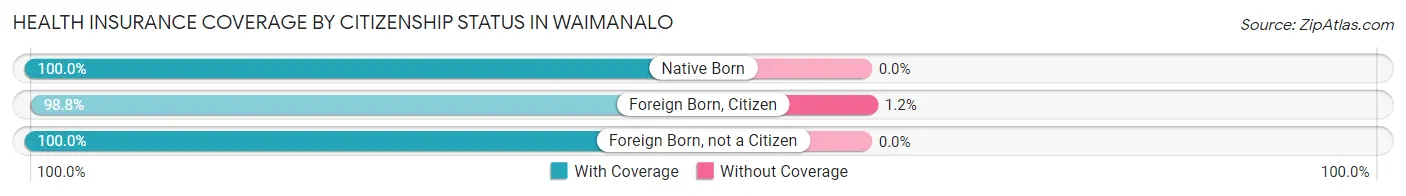
| Citizenship Status | With Coverage | Without Coverage |
| Native Born | 461 (100.0%) | 0 (0.0%) |
| Foreign Born, Citizen | 1,386 (98.8%) | 17 (1.2%) |
| Foreign Born, not a Citizen | 615 (100.0%) | 0 (0.0%) |
Health Insurance Coverage by Household Income in Waimanalo
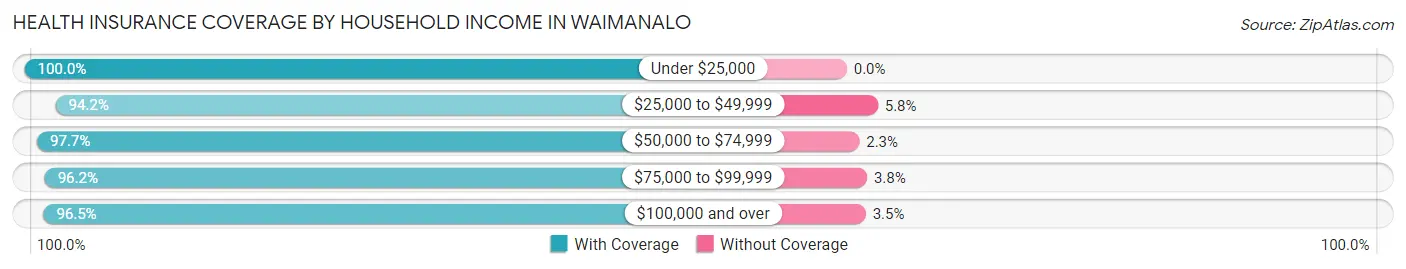
| Household Income | With Coverage | Without Coverage |
| Under $25,000 | 168 (100.0%) | 0 (0.0%) |
| $25,000 to $49,999 | 455 (94.2%) | 28 (5.8%) |
| $50,000 to $74,999 | 334 (97.7%) | 8 (2.3%) |
| $75,000 to $99,999 | 535 (96.2%) | 21 (3.8%) |
| $100,000 and over | 3,981 (96.5%) | 146 (3.5%) |
Public vs Private Health Insurance Coverage by Age in Waimanalo
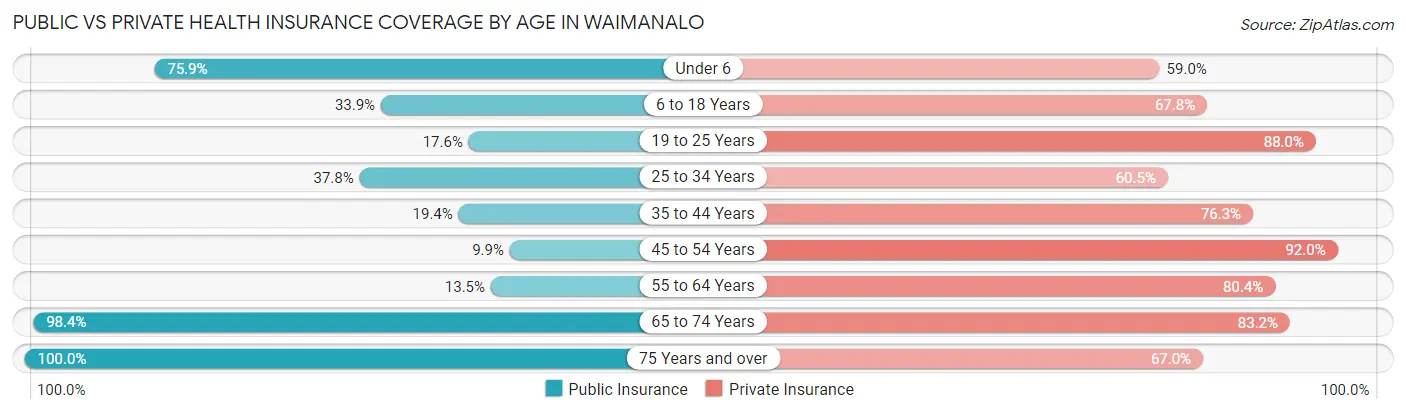
| Age Bracket | Public Insurance | Private Insurance |
| Under 6 | 350 (75.9%) | 272 (59.0%) |
| 6 to 18 Years | 475 (33.9%) | 951 (67.8%) |
| 19 to 25 Years | 108 (17.6%) | 541 (88.0%) |
| 25 to 34 Years | 247 (37.8%) | 395 (60.5%) |
| 35 to 44 Years | 119 (19.4%) | 467 (76.3%) |
| 45 to 54 Years | 77 (9.9%) | 713 (92.0%) |
| 55 to 64 Years | 44 (13.5%) | 263 (80.4%) |
| 65 to 74 Years | 555 (98.4%) | 469 (83.2%) |
| 75 Years and over | 273 (100.0%) | 183 (67.0%) |
| Total | 2,248 (39.6%) | 4,254 (74.9%) |
Disability Status by Sex by Age in Waimanalo
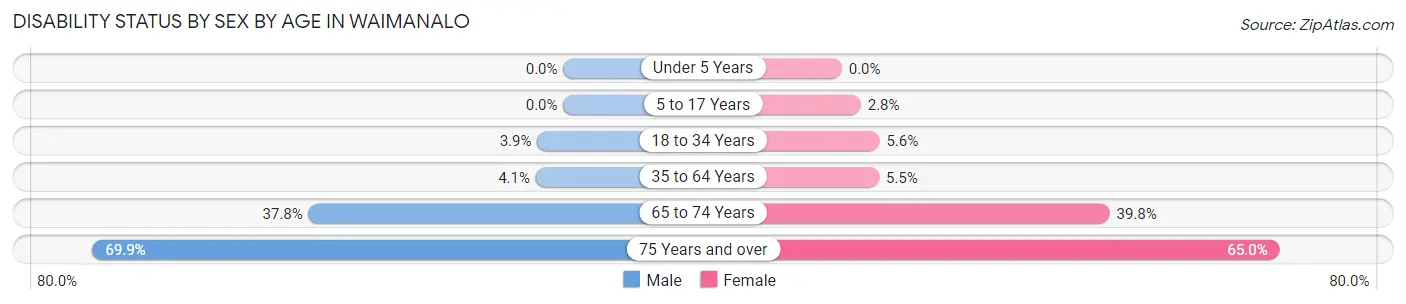
| Age Bracket | Male | Female |
| Under 5 Years | 0 (0.0%) | 0 (0.0%) |
| 5 to 17 Years | 0 (0.0%) | 20 (2.8%) |
| 18 to 34 Years | 24 (3.9%) | 41 (5.6%) |
| 35 to 64 Years | 42 (4.1%) | 38 (5.5%) |
| 65 to 74 Years | 84 (37.8%) | 136 (39.8%) |
| 75 Years and over | 107 (69.9%) | 78 (65.0%) |
Disability Class by Sex by Age in Waimanalo
Disability Class: Hearing Difficulty
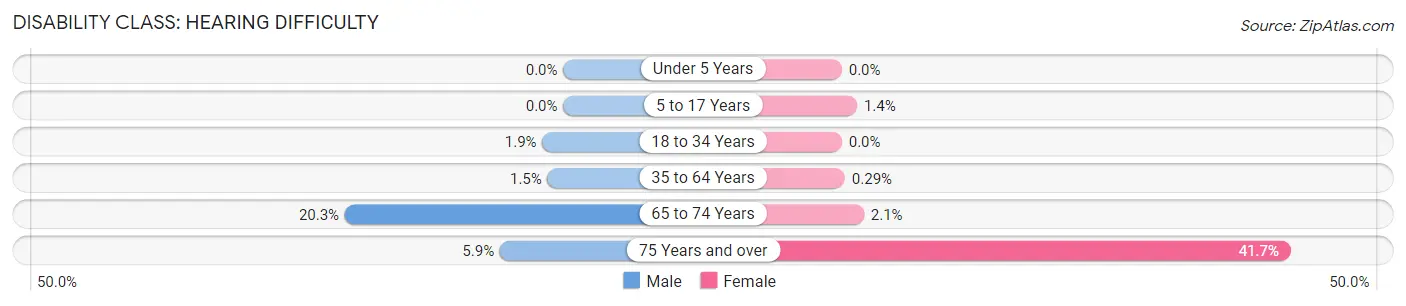
| Age Bracket | Male | Female |
| Under 5 Years | 0 (0.0%) | 0 (0.0%) |
| 5 to 17 Years | 0 (0.0%) | 10 (1.4%) |
| 18 to 34 Years | 12 (1.9%) | 0 (0.0%) |
| 35 to 64 Years | 15 (1.5%) | 2 (0.3%) |
| 65 to 74 Years | 45 (20.3%) | 7 (2.1%) |
| 75 Years and over | 9 (5.9%) | 50 (41.7%) |
Disability Class: Vision Difficulty
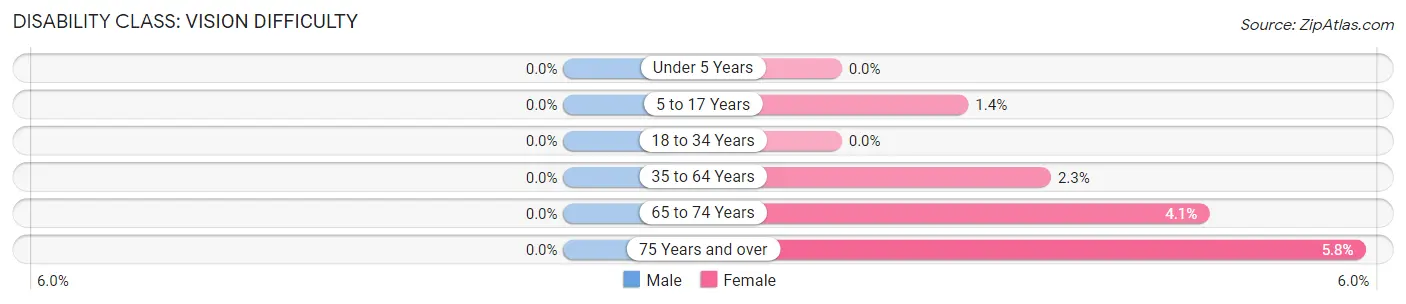
| Age Bracket | Male | Female |
| Under 5 Years | 0 (0.0%) | 0 (0.0%) |
| 5 to 17 Years | 0 (0.0%) | 10 (1.4%) |
| 18 to 34 Years | 0 (0.0%) | 0 (0.0%) |
| 35 to 64 Years | 0 (0.0%) | 16 (2.3%) |
| 65 to 74 Years | 0 (0.0%) | 14 (4.1%) |
| 75 Years and over | 0 (0.0%) | 7 (5.8%) |
Disability Class: Cognitive Difficulty
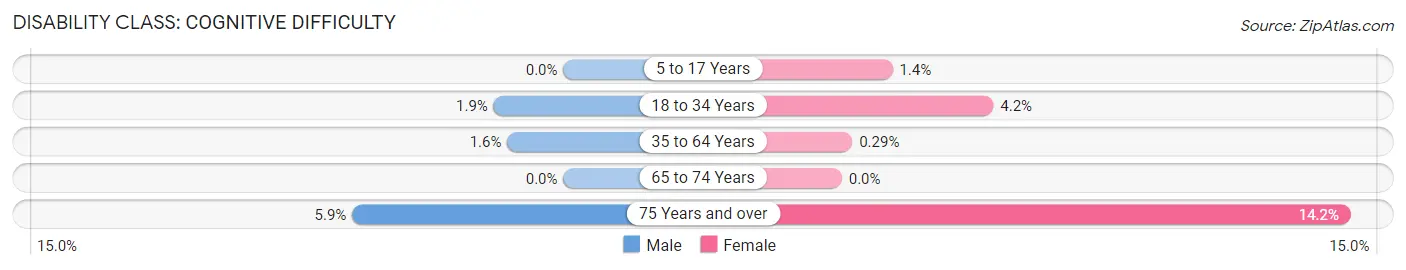
| Age Bracket | Male | Female |
| 5 to 17 Years | 0 (0.0%) | 10 (1.4%) |
| 18 to 34 Years | 12 (1.9%) | 31 (4.2%) |
| 35 to 64 Years | 16 (1.6%) | 2 (0.3%) |
| 65 to 74 Years | 0 (0.0%) | 0 (0.0%) |
| 75 Years and over | 9 (5.9%) | 17 (14.2%) |
Disability Class: Ambulatory Difficulty
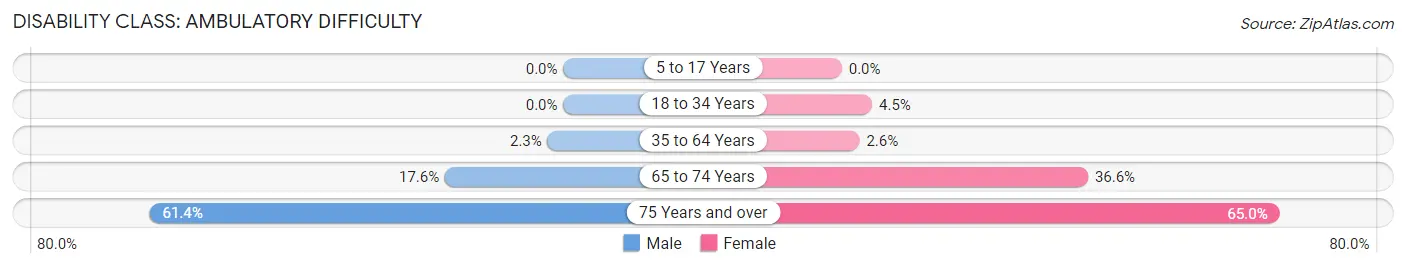
| Age Bracket | Male | Female |
| 5 to 17 Years | 0 (0.0%) | 0 (0.0%) |
| 18 to 34 Years | 0 (0.0%) | 33 (4.5%) |
| 35 to 64 Years | 24 (2.3%) | 18 (2.6%) |
| 65 to 74 Years | 39 (17.6%) | 125 (36.5%) |
| 75 Years and over | 94 (61.4%) | 78 (65.0%) |
Disability Class: Self-Care Difficulty
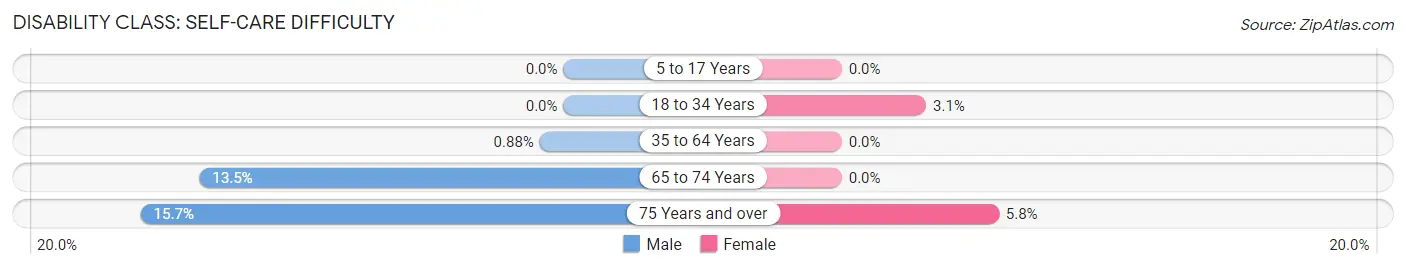
| Age Bracket | Male | Female |
| 5 to 17 Years | 0 (0.0%) | 0 (0.0%) |
| 18 to 34 Years | 0 (0.0%) | 23 (3.1%) |
| 35 to 64 Years | 9 (0.9%) | 0 (0.0%) |
| 65 to 74 Years | 30 (13.5%) | 0 (0.0%) |
| 75 Years and over | 24 (15.7%) | 7 (5.8%) |
Technology Access in Waimanalo
Computing Device Access in Waimanalo
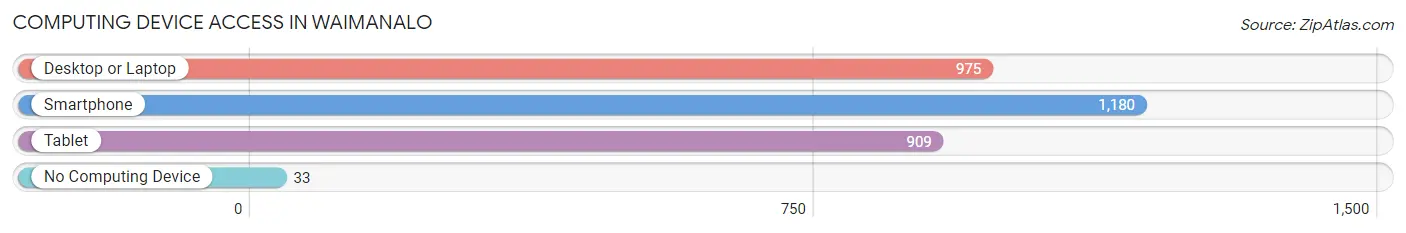
| Device Type | # Households | % Households |
| Desktop or Laptop | 975 | 78.5% |
| Smartphone | 1,180 | 95.0% |
| Tablet | 909 | 73.2% |
| No Computing Device | 33 | 2.7% |
| Total | 1,242 | 100.0% |
Internet Access in Waimanalo
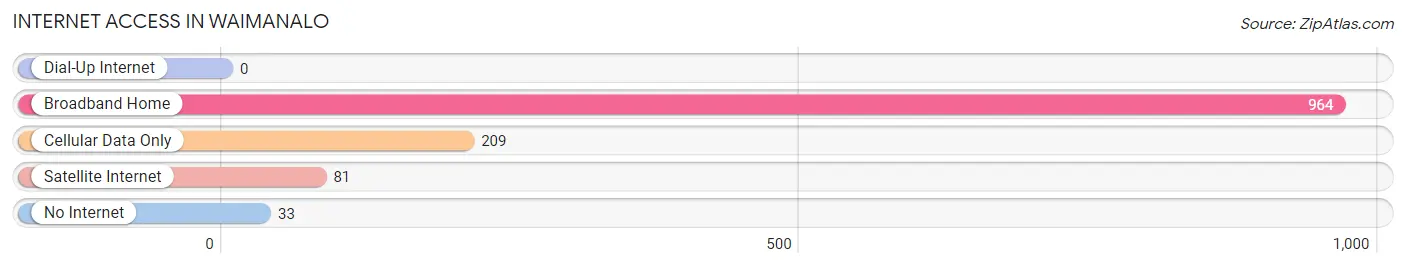
| Internet Type | # Households | % Households |
| Dial-Up Internet | 0 | 0.0% |
| Broadband Home | 964 | 77.6% |
| Cellular Data Only | 209 | 16.8% |
| Satellite Internet | 81 | 6.5% |
| No Internet | 33 | 2.7% |
| Total | 1,242 | 100.0% |
Waimanalo Summary
Waimanalo is a small town located on the eastern coast of the island of Oahu in the state of Hawaii. It is located about 20 miles east of Honolulu and is part of the City and County of Honolulu. The population of Waimanalo was 5,451 at the 2010 census.
History
The area now known as Waimanalo was originally inhabited by the Native Hawaiian people. The area was first settled by Europeans in the early 1800s. The first recorded European settler was John Palmer Parker, who arrived in 1809. He established a sugar plantation in the area and built a home, which is now a historic landmark.
In the late 1800s, the area was developed as a sugar plantation. The plantation was owned by the Waimanalo Sugar Company, which was founded in 1883. The company operated until the early 1900s, when it was sold to the Hawaiian Sugar Company.
The area was also home to a large Japanese population in the early 1900s. Many of the Japanese immigrants worked on the sugar plantations.
Geography
Waimanalo is located on the eastern coast of Oahu, about 20 miles east of Honolulu. The town is situated on a narrow strip of land between the Waimanalo Bay and the Ko’olau Mountains. The town is bordered by the towns of Kailua and Kaneohe to the north and east, and the town of Waimanalo Beach to the south.
The town has a total area of 4.2 square miles, of which 0.2 square miles is water. The terrain is mostly flat, with some hills in the northern part of the town.
Economy
The economy of Waimanalo is largely based on tourism and agriculture. The town is home to several tourist attractions, including the Waimanalo Beach Park, the Waimanalo Bay State Park, and the Waimanalo Country Club.
Agriculture is also an important part of the local economy. The town is home to several farms, which produce a variety of fruits and vegetables.
Demographics
As of the 2010 census, the population of Waimanalo was 5,451. The racial makeup of the town was 57.3% White, 11.2% Native Hawaiian or Pacific Islander, 8.2% Asian, 0.7% Black or African American, 0.3% American Indian or Alaska Native, and 22.5% from other races.
The median household income in Waimanalo was $60,945 in 2010. The per capita income was $25,945. The median age of the population was 38.7 years.
Conclusion
Waimanalo is a small town located on the eastern coast of Oahu in the state of Hawaii. The town has a rich history, with the first European settlers arriving in the early 1800s. The economy of Waimanalo is largely based on tourism and agriculture. The population of Waimanalo was 5,451 at the 2010 census. The town has a diverse population, with a median household income of $60,945 in 2010.
Common Questions
What is Per Capita Income in Waimanalo?
Per Capita income in Waimanalo is $41,610.
What is the Median Family Income in Waimanalo?
Median Family Income in Waimanalo is $147,200.
What is the Median Household income in Waimanalo?
Median Household Income in Waimanalo is $127,143.
What is Income or Wage Gap in Waimanalo?
Income or Wage Gap in Waimanalo is 37.0%.
Women in Waimanalo earn 63.0 cents for every dollar earned by a man.
What is Family Income Deficit in Waimanalo?
Family Income Deficit in Waimanalo is $8,176.
Families that are below poverty line in Waimanalo earn $8,176 less on average than the poverty threshold level.
What is Inequality or Gini Index in Waimanalo?
Inequality or Gini Index in Waimanalo is 0.45.
What is the Total Population of Waimanalo?
Total Population of Waimanalo is 5,743.
What is the Total Male Population of Waimanalo?
Total Male Population of Waimanalo is 2,952.
What is the Total Female Population of Waimanalo?
Total Female Population of Waimanalo is 2,791.
What is the Ratio of Males per 100 Females in Waimanalo?
There are 105.77 Males per 100 Females in Waimanalo.
What is the Ratio of Females per 100 Males in Waimanalo?
There are 94.55 Females per 100 Males in Waimanalo.
What is the Median Population Age in Waimanalo?
Median Population Age in Waimanalo is 31.3 Years.
What is the Average Family Size in Waimanalo
Average Family Size in Waimanalo is 5.1 People.
What is the Average Household Size in Waimanalo
Average Household Size in Waimanalo is 4.6 People.
How Large is the Labor Force in Waimanalo?
There are 2,800 People in the Labor Forcein in Waimanalo.
What is the Percentage of People in the Labor Force in Waimanalo?
68.2% of People are in the Labor Force in Waimanalo.
What is the Unemployment Rate in Waimanalo?
Unemployment Rate in Waimanalo is 4.2%.