Harmony, IN Map & Demographics
Harmony Map
Harmony Overview
$34,916
PER CAPITA INCOME
$68,500
AVG FAMILY INCOME
$59,375
AVG HOUSEHOLD INCOME
35.9%
WAGE / INCOME GAP [ % ]
64.1¢/ $1
WAGE / INCOME GAP [ $ ]
0.37
INEQUALITY / GINI INDEX
737
TOTAL POPULATION
329
MALE POPULATION
408
FEMALE POPULATION
80.64
MALES / 100 FEMALES
124.01
FEMALES / 100 MALES
42.4
MEDIAN AGE
2.6
AVG FAMILY SIZE
2.1
AVG HOUSEHOLD SIZE
338
LABOR FORCE [ PEOPLE ]
58.1%
PERCENT IN LABOR FORCE
Harmony Zip Codes
Harmony Area Codes
Income in Harmony
Income Overview in Harmony
Per Capita Income in Harmony is $34,916, while median incomes of families and households are $68,500 and $59,375 respectively.
| Characteristic | Number | Measure |
| Per Capita Income | 737 | $34,916 |
| Median Family Income | 204 | $68,500 |
| Mean Family Income | 204 | $74,538 |
| Median Household Income | 345 | $59,375 |
| Mean Household Income | 345 | $73,352 |
| Income Deficit | 204 | $0 |
| Wage / Income Gap (%) | 737 | 35.87% |
| Wage / Income Gap ($) | 737 | 64.13¢ per $1 |
| Gini / Inequality Index | 737 | 0.37 |
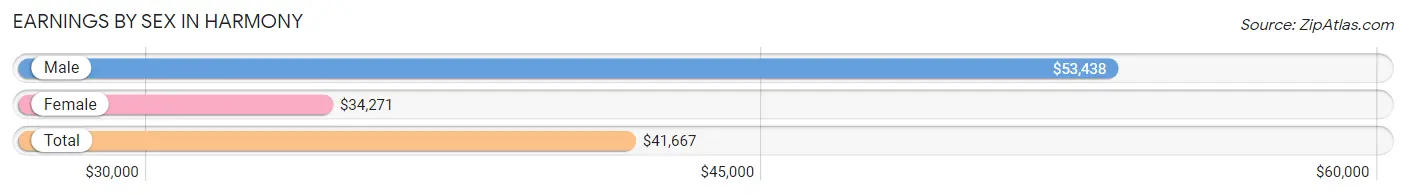
Earnings by Sex in Harmony
Average Earnings in Harmony are $41,667, $53,438 for men and $34,271 for women, a difference of 35.9%.
| Sex | Number | Average Earnings |
| Male | 131 (38.3%) | $53,438 |
| Female | 211 (61.7%) | $34,271 |
| Total | 342 (100.0%) | $41,667 |
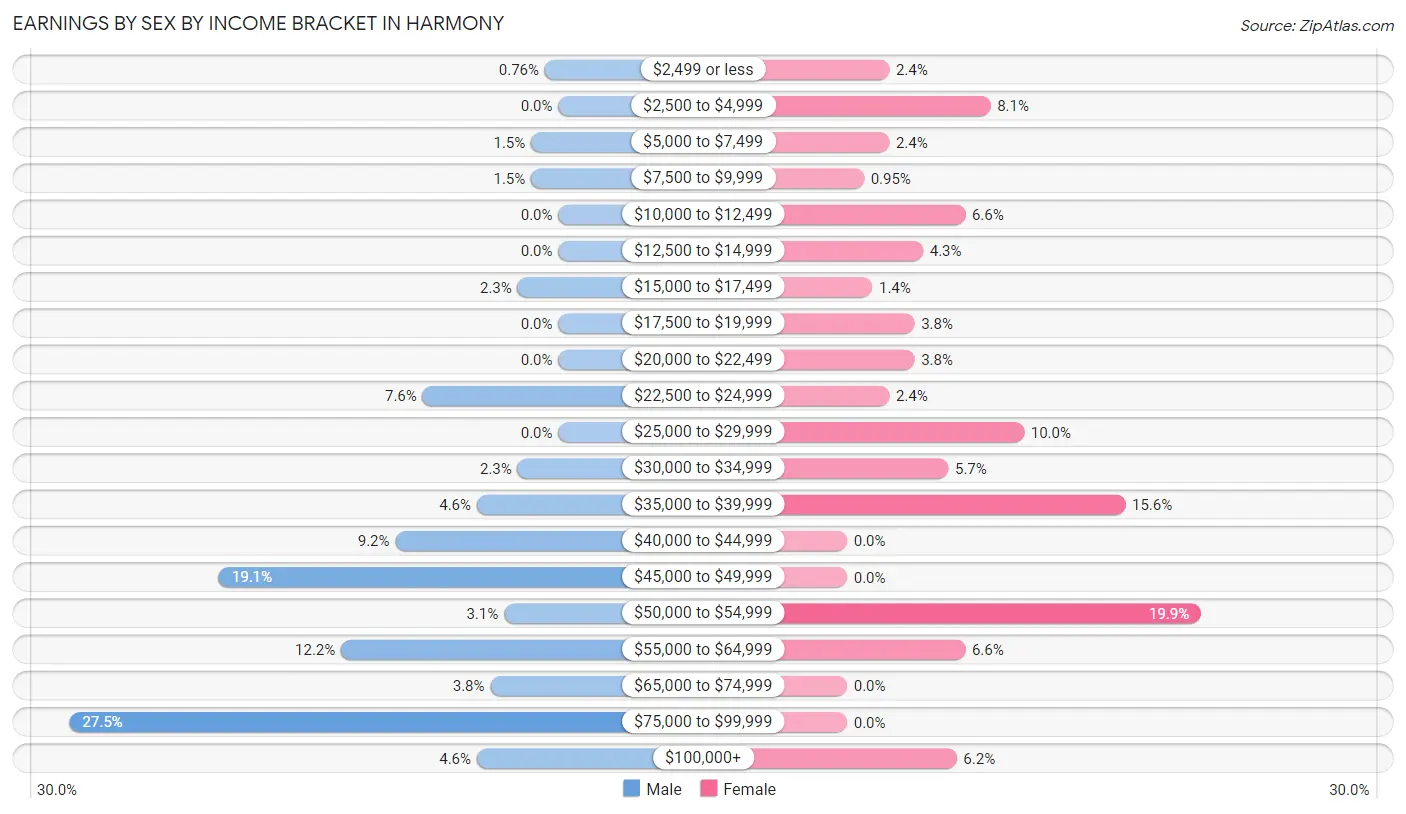
Earnings by Sex by Income Bracket in Harmony
The most common earnings brackets in Harmony are $75,000 to $99,999 for men (36 | 27.5%) and $50,000 to $54,999 for women (42 | 19.9%).
| Income | Male | Female |
| $2,499 or less | 1 (0.8%) | 5 (2.4%) |
| $2,500 to $4,999 | 0 (0.0%) | 17 (8.1%) |
| $5,000 to $7,499 | 2 (1.5%) | 5 (2.4%) |
| $7,500 to $9,999 | 2 (1.5%) | 2 (0.9%) |
| $10,000 to $12,499 | 0 (0.0%) | 14 (6.6%) |
| $12,500 to $14,999 | 0 (0.0%) | 9 (4.3%) |
| $15,000 to $17,499 | 3 (2.3%) | 3 (1.4%) |
| $17,500 to $19,999 | 0 (0.0%) | 8 (3.8%) |
| $20,000 to $22,499 | 0 (0.0%) | 8 (3.8%) |
| $22,500 to $24,999 | 10 (7.6%) | 5 (2.4%) |
| $25,000 to $29,999 | 0 (0.0%) | 21 (10.0%) |
| $30,000 to $34,999 | 3 (2.3%) | 12 (5.7%) |
| $35,000 to $39,999 | 6 (4.6%) | 33 (15.6%) |
| $40,000 to $44,999 | 12 (9.2%) | 0 (0.0%) |
| $45,000 to $49,999 | 25 (19.1%) | 0 (0.0%) |
| $50,000 to $54,999 | 4 (3.0%) | 42 (19.9%) |
| $55,000 to $64,999 | 16 (12.2%) | 14 (6.6%) |
| $65,000 to $74,999 | 5 (3.8%) | 0 (0.0%) |
| $75,000 to $99,999 | 36 (27.5%) | 0 (0.0%) |
| $100,000+ | 6 (4.6%) | 13 (6.2%) |
| Total | 131 (100.0%) | 211 (100.0%) |
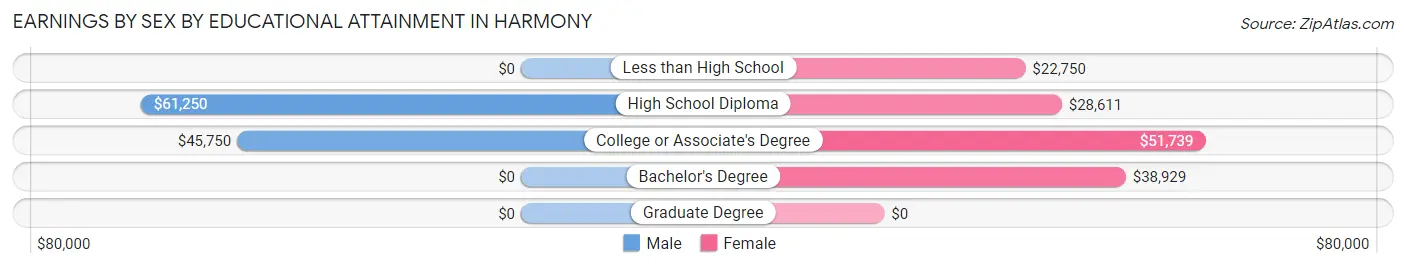
Earnings by Sex by Educational Attainment in Harmony
Average earnings in Harmony are $56,250 for men and $36,406 for women, a difference of 35.3%. Men with an educational attainment of high school diploma enjoy the highest average annual earnings of $61,250, while those with college or associate's degree education earn the least with $45,750. Women with an educational attainment of college or associate's degree earn the most with the average annual earnings of $51,739, while those with less than high school education have the smallest earnings of $22,750.
| Educational Attainment | Male Income | Female Income |
| Less than High School | - | - |
| High School Diploma | $61,250 | $28,611 |
| College or Associate's Degree | $45,750 | $51,739 |
| Bachelor's Degree | - | - |
| Graduate Degree | - | - |
| Total | $56,250 | $36,406 |
Family Income in Harmony
Family Income Brackets in Harmony
According to the Harmony family income data, there are 56 families falling into the $75,000 to $99,999 income range, which is the most common income bracket and makes up 27.5% of all families. Conversely, the $200,000+ income bracket is the least frequent group with only 2 families (1.0%) belonging to this category.
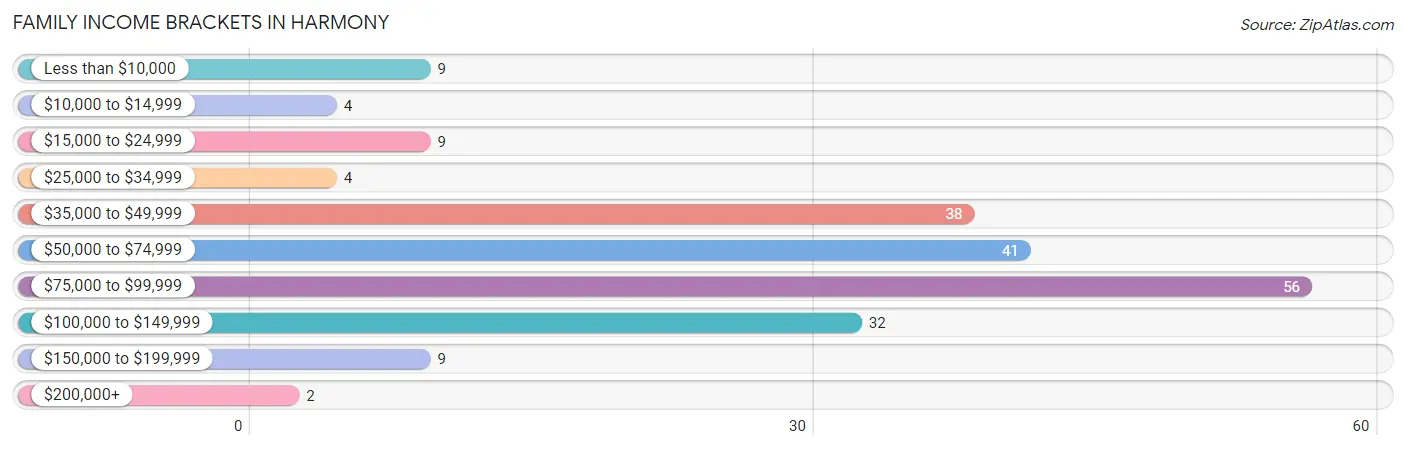
| Income Bracket | # Families | % Families |
| Less than $10,000 | 9 | 4.4% |
| $10,000 to $14,999 | 4 | 2.0% |
| $15,000 to $24,999 | 9 | 4.4% |
| $25,000 to $34,999 | 4 | 2.0% |
| $35,000 to $49,999 | 38 | 18.6% |
| $50,000 to $74,999 | 41 | 20.1% |
| $75,000 to $99,999 | 56 | 27.5% |
| $100,000 to $149,999 | 32 | 15.7% |
| $150,000 to $199,999 | 9 | 4.4% |
| $200,000+ | 2 | 1.0% |
Family Income by Famaliy Size in Harmony
4-person families (18 | 8.8%) account for the highest median family income in Harmony with $84,000 per family, while 3-person families (43 | 21.1%) have the highest median income of $26,302 per family member.
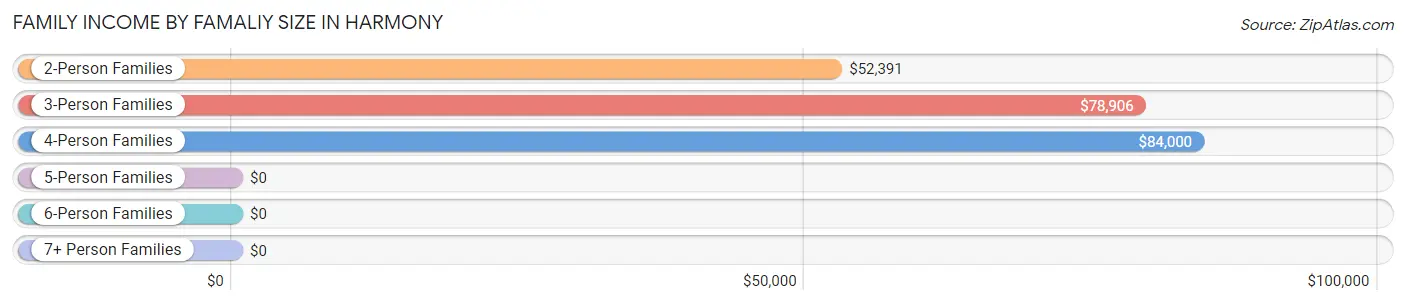
| Income Bracket | # Families | Median Income |
| 2-Person Families | 132 (64.7%) | $52,391 |
| 3-Person Families | 43 (21.1%) | $78,906 |
| 4-Person Families | 18 (8.8%) | $84,000 |
| 5-Person Families | 7 (3.4%) | $0 |
| 6-Person Families | 4 (2.0%) | $0 |
| 7+ Person Families | 0 (0.0%) | $0 |
| Total | 204 (100.0%) | $68,500 |
Family Income by Number of Earners in Harmony
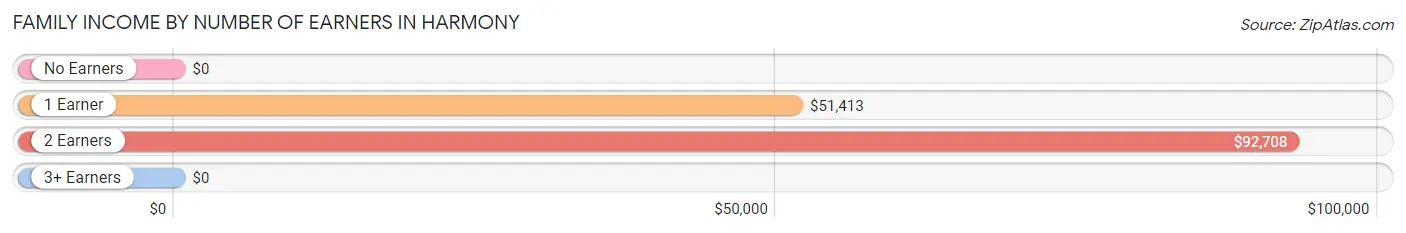
| Number of Earners | # Families | Median Income |
| No Earners | 31 (15.2%) | $0 |
| 1 Earner | 94 (46.1%) | $51,413 |
| 2 Earners | 66 (32.4%) | $92,708 |
| 3+ Earners | 13 (6.4%) | $0 |
| Total | 204 (100.0%) | $68,500 |
Household Income in Harmony
Household Income Brackets in Harmony
With 75 households falling in the category, the $50,000 to $74,999 income range is the most frequent in Harmony, accounting for 21.7% of all households. In contrast, only 3 households (0.9%) fall into the $200,000+ income bracket, making it the least populous group.
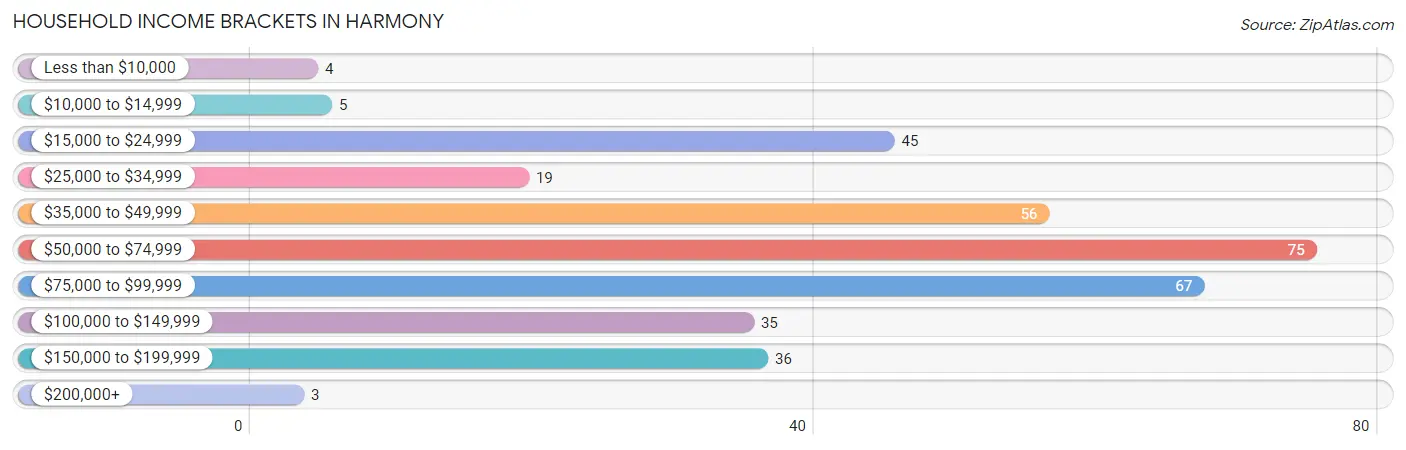
| Income Bracket | # Households | % Households |
| Less than $10,000 | 4 | 1.2% |
| $10,000 to $14,999 | 5 | 1.4% |
| $15,000 to $24,999 | 45 | 13.0% |
| $25,000 to $34,999 | 19 | 5.5% |
| $35,000 to $49,999 | 56 | 16.2% |
| $50,000 to $74,999 | 75 | 21.7% |
| $75,000 to $99,999 | 67 | 19.4% |
| $100,000 to $149,999 | 35 | 10.1% |
| $150,000 to $199,999 | 36 | 10.4% |
| $200,000+ | 3 | 0.9% |
Household Income by Householder Age in Harmony
The median household income in Harmony is $59,375, with the highest median household income of $78,250 found in the 25 to 44 years age bracket for the primary householder. A total of 107 households (31.0%) fall into this category. Meanwhile, the 15 to 24 years age bracket for the primary householder has the lowest median household income of $0, with 6 households (1.7%) in this group.
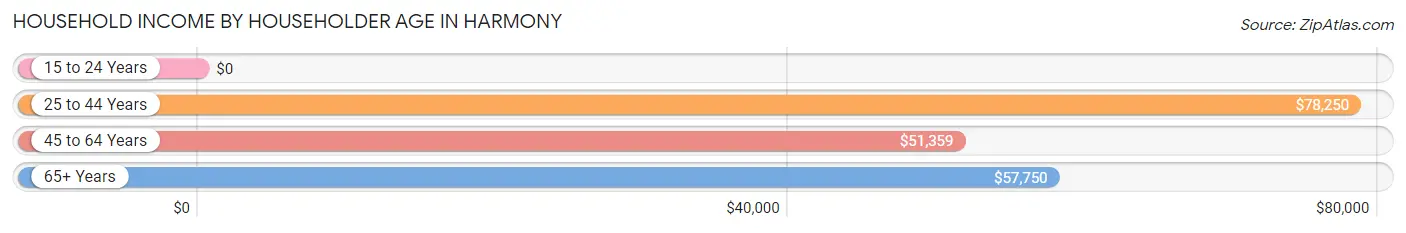
| Income Bracket | # Households | Median Income |
| 15 to 24 Years | 6 (1.7%) | $0 |
| 25 to 44 Years | 107 (31.0%) | $78,250 |
| 45 to 64 Years | 103 (29.9%) | $51,359 |
| 65+ Years | 129 (37.4%) | $57,750 |
| Total | 345 (100.0%) | $59,375 |
Poverty in Harmony
Income Below Poverty by Sex and Age in Harmony
With 9.2% poverty level for males and 12.6% for females among the residents of Harmony, 15 year old males and under 5 year old females are the most vulnerable to poverty, with 5 males (62.5%) and 10 females (76.9%) in their respective age groups living below the poverty level.
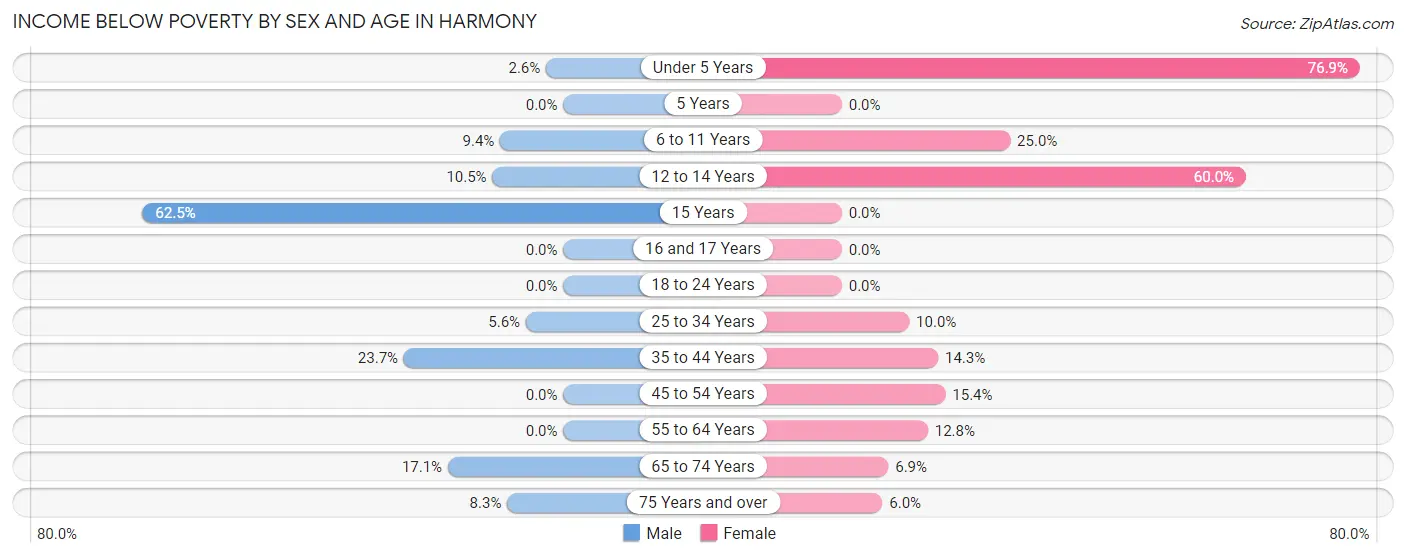
| Age Bracket | Male | Female |
| Under 5 Years | 1 (2.6%) | 10 (76.9%) |
| 5 Years | 0 (0.0%) | 0 (0.0%) |
| 6 to 11 Years | 3 (9.4%) | 2 (25.0%) |
| 12 to 14 Years | 2 (10.5%) | 3 (60.0%) |
| 15 Years | 5 (62.5%) | 0 (0.0%) |
| 16 and 17 Years | 0 (0.0%) | 0 (0.0%) |
| 18 to 24 Years | 0 (0.0%) | 0 (0.0%) |
| 25 to 34 Years | 1 (5.6%) | 5 (10.0%) |
| 35 to 44 Years | 9 (23.7%) | 10 (14.3%) |
| 45 to 54 Years | 0 (0.0%) | 8 (15.4%) |
| 55 to 64 Years | 0 (0.0%) | 6 (12.8%) |
| 65 to 74 Years | 6 (17.1%) | 2 (6.9%) |
| 75 Years and over | 2 (8.3%) | 5 (6.0%) |
| Total | 29 (9.2%) | 51 (12.6%) |
Income Above Poverty by Sex and Age in Harmony
According to the poverty statistics in Harmony, males aged 16 and 17 years and females aged 5 years are the age groups that are most secure financially, with 100.0% of males and 100.0% of females in these age groups living above the poverty line.
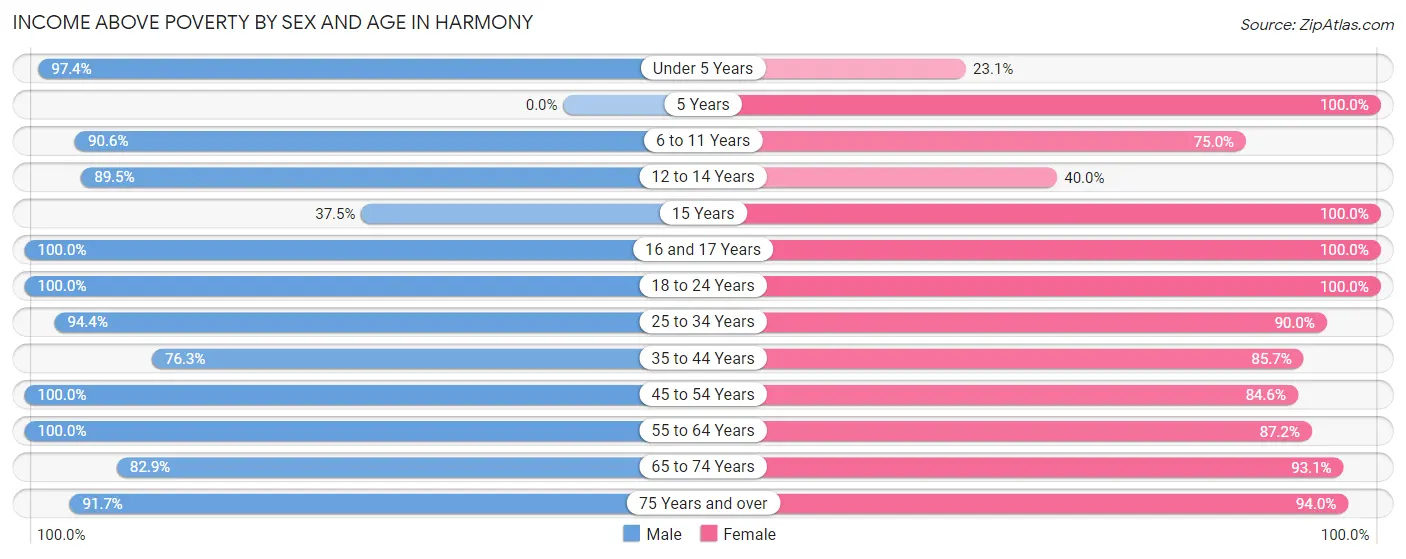
| Age Bracket | Male | Female |
| Under 5 Years | 38 (97.4%) | 3 (23.1%) |
| 5 Years | 0 (0.0%) | 6 (100.0%) |
| 6 to 11 Years | 29 (90.6%) | 6 (75.0%) |
| 12 to 14 Years | 17 (89.5%) | 2 (40.0%) |
| 15 Years | 3 (37.5%) | 8 (100.0%) |
| 16 and 17 Years | 10 (100.0%) | 3 (100.0%) |
| 18 to 24 Years | 9 (100.0%) | 30 (100.0%) |
| 25 to 34 Years | 17 (94.4%) | 45 (90.0%) |
| 35 to 44 Years | 29 (76.3%) | 60 (85.7%) |
| 45 to 54 Years | 63 (100.0%) | 44 (84.6%) |
| 55 to 64 Years | 21 (100.0%) | 41 (87.2%) |
| 65 to 74 Years | 29 (82.9%) | 27 (93.1%) |
| 75 Years and over | 22 (91.7%) | 78 (94.0%) |
| Total | 287 (90.8%) | 353 (87.4%) |
Income Below Poverty Among Married-Couple Families in Harmony
The poverty statistics for married-couple families in Harmony show that 6.7% or 8 of the total 119 families live below the poverty line. Families with no children have the highest poverty rate of 8.6%, comprising of 8 families. On the other hand, families with 1 or 2 children have the lowest poverty rate of 0.0%, which includes 0 families.
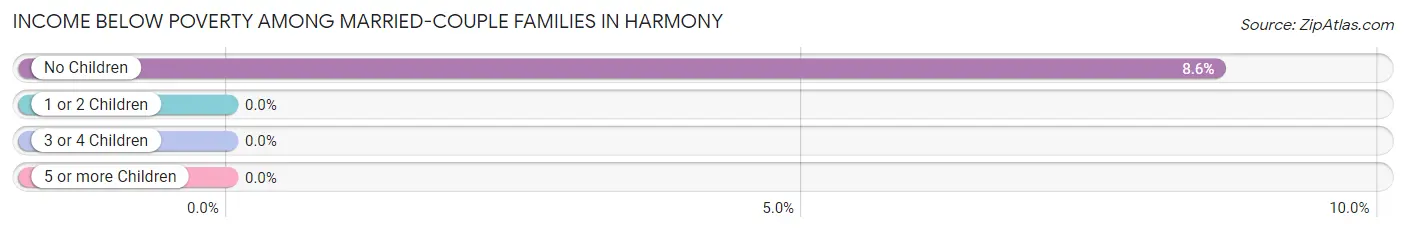
| Children | Above Poverty | Below Poverty |
| No Children | 85 (91.4%) | 8 (8.6%) |
| 1 or 2 Children | 22 (100.0%) | 0 (0.0%) |
| 3 or 4 Children | 4 (100.0%) | 0 (0.0%) |
| 5 or more Children | 0 (0.0%) | 0 (0.0%) |
| Total | 111 (93.3%) | 8 (6.7%) |
Income Below Poverty Among Single-Parent Households in Harmony
According to the poverty data in Harmony, 36.8% or 7 single-father households and 10.6% or 7 single-mother households are living below the poverty line. Among single-father households, those with 1 or 2 children have the highest poverty rate, with 7 households (36.8%) experiencing poverty. Likewise, among single-mother households, those with 3 or 4 children have the highest poverty rate, with 3 households (100.0%) falling below the poverty line.
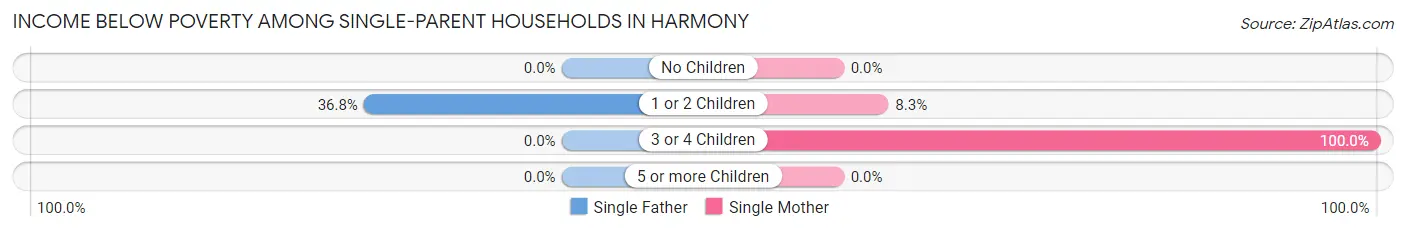
| Children | Single Father | Single Mother |
| No Children | 0 (0.0%) | 0 (0.0%) |
| 1 or 2 Children | 7 (36.8%) | 4 (8.3%) |
| 3 or 4 Children | 0 (0.0%) | 3 (100.0%) |
| 5 or more Children | 0 (0.0%) | 0 (0.0%) |
| Total | 7 (36.8%) | 7 (10.6%) |
Income Below Poverty Among Married-Couple vs Single-Parent Households in Harmony
The poverty data for Harmony shows that 8 of the married-couple family households (6.7%) and 14 of the single-parent households (16.5%) are living below the poverty level. Within the married-couple family households, those with no children have the highest poverty rate, with 8 households (8.6%) falling below the poverty line. Among the single-parent households, those with 3 or 4 children have the highest poverty rate, with 3 household (100.0%) living below poverty.
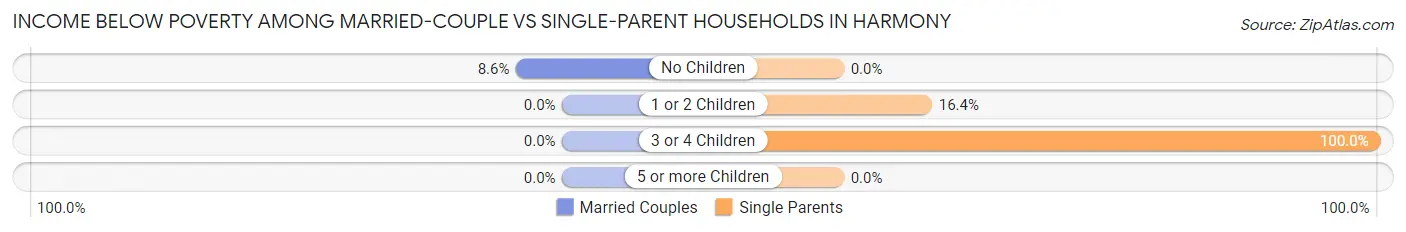
| Children | Married-Couple Families | Single-Parent Households |
| No Children | 8 (8.6%) | 0 (0.0%) |
| 1 or 2 Children | 0 (0.0%) | 11 (16.4%) |
| 3 or 4 Children | 0 (0.0%) | 3 (100.0%) |
| 5 or more Children | 0 (0.0%) | 0 (0.0%) |
| Total | 8 (6.7%) | 14 (16.5%) |
Race in Harmony
The most populous races in Harmony are White / Caucasian (682 | 92.5%), Two or more Races (42 | 5.7%), and Hispanic or Latino (16 | 2.2%).
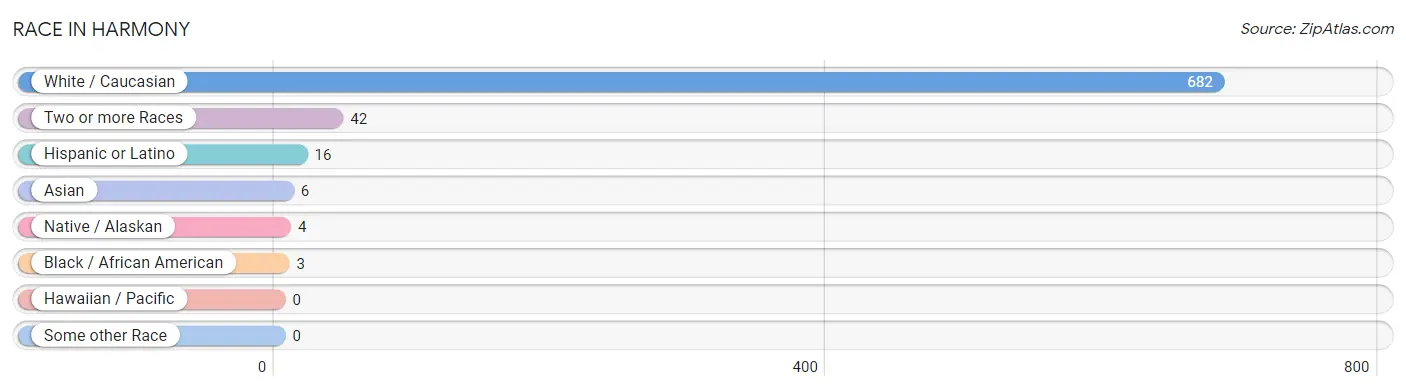
| Race | # Population | % Population |
| Asian | 6 | 0.8% |
| Black / African American | 3 | 0.4% |
| Hawaiian / Pacific | 0 | 0.0% |
| Hispanic or Latino | 16 | 2.2% |
| Native / Alaskan | 4 | 0.5% |
| White / Caucasian | 682 | 92.5% |
| Two or more Races | 42 | 5.7% |
| Some other Race | 0 | 0.0% |
| Total | 737 | 100.0% |
Ancestry in Harmony
The most populous ancestries reported in Harmony are German (153 | 20.8%), Irish (123 | 16.7%), American (108 | 14.6%), English (60 | 8.1%), and Scottish (33 | 4.5%), together accounting for 64.7% of all Harmony residents.
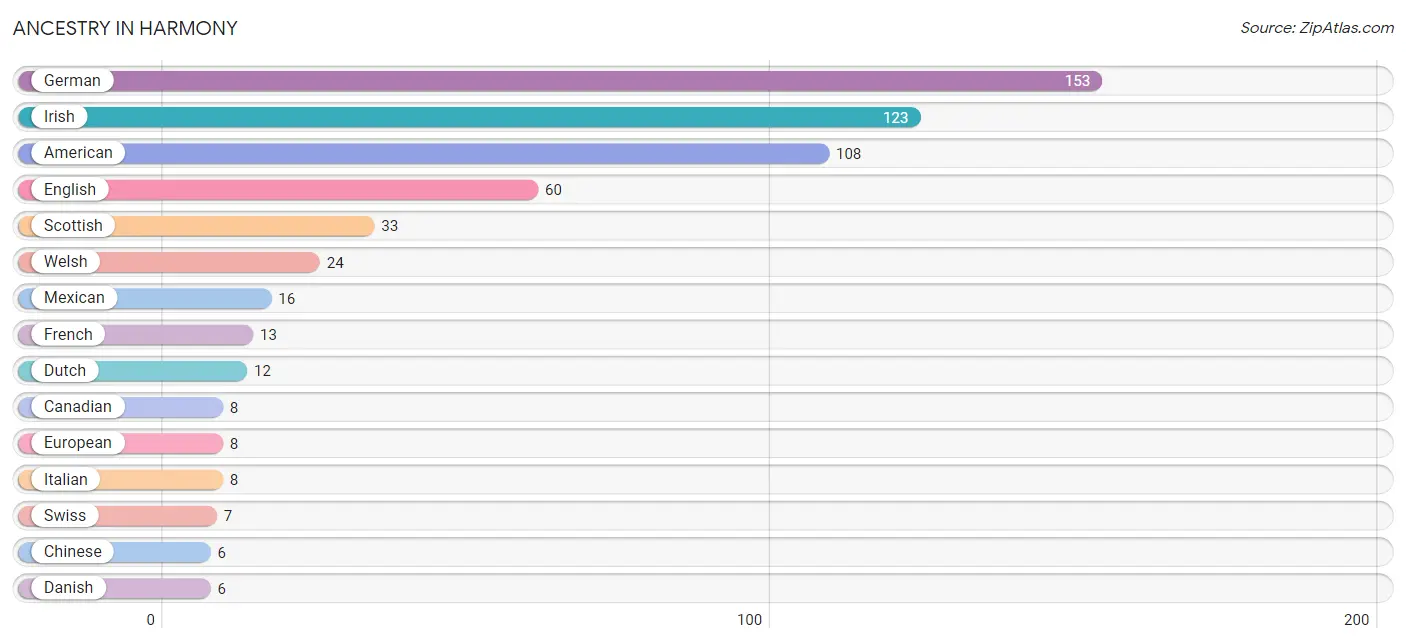
| Ancestry | # Population | % Population |
| American | 108 | 14.6% |
| British | 2 | 0.3% |
| Canadian | 8 | 1.1% |
| Chinese | 6 | 0.8% |
| Cree | 3 | 0.4% |
| Czechoslovakian | 3 | 0.4% |
| Danish | 6 | 0.8% |
| Dutch | 12 | 1.6% |
| English | 60 | 8.1% |
| European | 8 | 1.1% |
| French | 13 | 1.8% |
| German | 153 | 20.8% |
| Icelander | 4 | 0.5% |
| Irish | 123 | 16.7% |
| Italian | 8 | 1.1% |
| Korean | 4 | 0.5% |
| Mexican | 16 | 2.2% |
| Scandinavian | 2 | 0.3% |
| Scotch-Irish | 3 | 0.4% |
| Scottish | 33 | 4.5% |
| Swiss | 7 | 0.9% |
| Thai | 4 | 0.5% |
| Welsh | 24 | 3.3% | View All 23 Rows |
Immigrants in Harmony
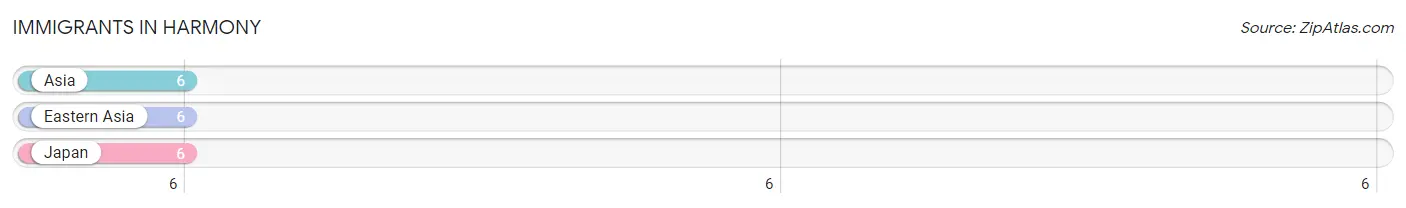
The most numerous immigrant groups reported in Harmony came from Asia (6 | 0.8%), Eastern Asia (6 | 0.8%), and Japan (6 | 0.8%), together accounting for 2.4% of all Harmony residents.
| Immigration Origin | # Population | % Population |
| Asia | 6 | 0.8% |
| Eastern Asia | 6 | 0.8% |
| Japan | 6 | 0.8% | View All 3 Rows |
Sex and Age in Harmony
Sex and Age in Harmony
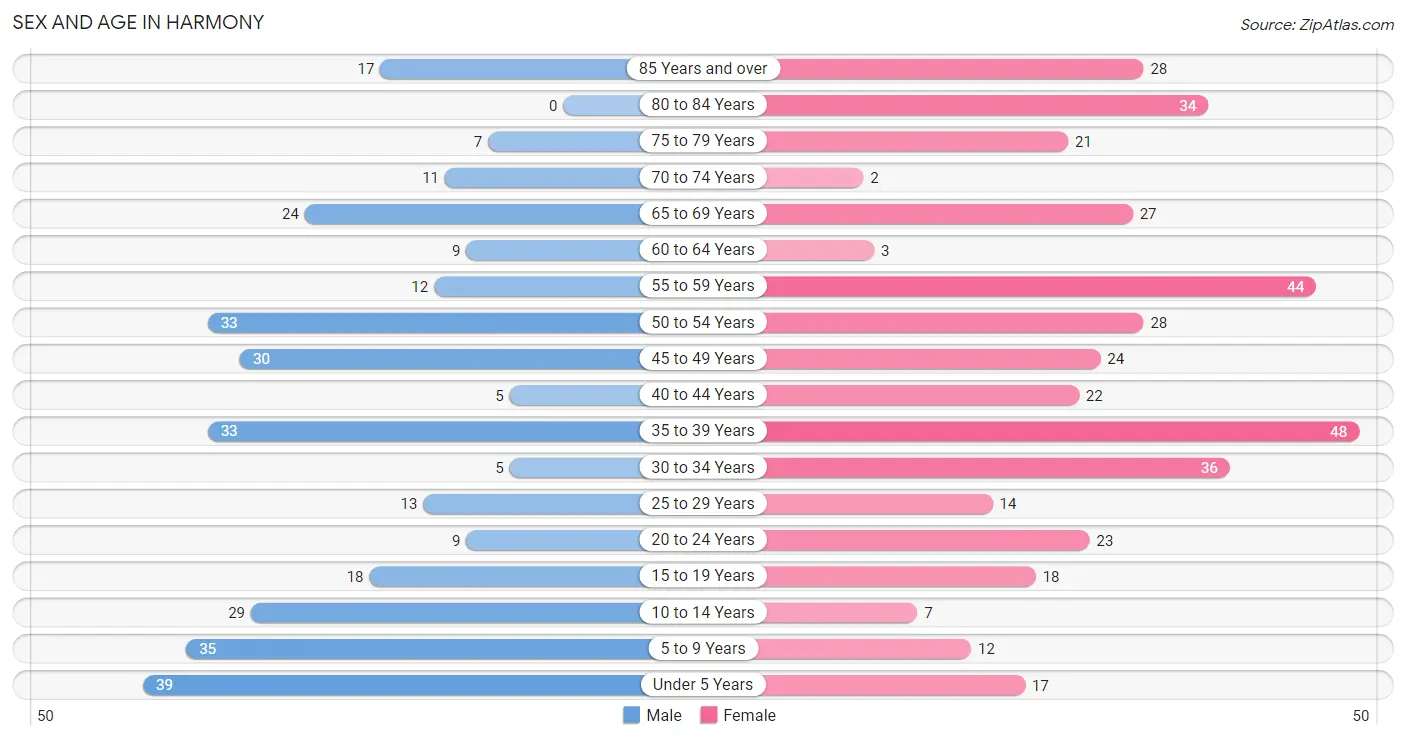
The most populous age groups in Harmony are Under 5 Years (39 | 11.8%) for men and 35 to 39 Years (48 | 11.8%) for women.
| Age Bracket | Male | Female |
| Under 5 Years | 39 (11.8%) | 17 (4.2%) |
| 5 to 9 Years | 35 (10.6%) | 12 (2.9%) |
| 10 to 14 Years | 29 (8.8%) | 7 (1.7%) |
| 15 to 19 Years | 18 (5.5%) | 18 (4.4%) |
| 20 to 24 Years | 9 (2.7%) | 23 (5.6%) |
| 25 to 29 Years | 13 (4.0%) | 14 (3.4%) |
| 30 to 34 Years | 5 (1.5%) | 36 (8.8%) |
| 35 to 39 Years | 33 (10.0%) | 48 (11.8%) |
| 40 to 44 Years | 5 (1.5%) | 22 (5.4%) |
| 45 to 49 Years | 30 (9.1%) | 24 (5.9%) |
| 50 to 54 Years | 33 (10.0%) | 28 (6.9%) |
| 55 to 59 Years | 12 (3.6%) | 44 (10.8%) |
| 60 to 64 Years | 9 (2.7%) | 3 (0.7%) |
| 65 to 69 Years | 24 (7.3%) | 27 (6.6%) |
| 70 to 74 Years | 11 (3.3%) | 2 (0.5%) |
| 75 to 79 Years | 7 (2.1%) | 21 (5.1%) |
| 80 to 84 Years | 0 (0.0%) | 34 (8.3%) |
| 85 Years and over | 17 (5.2%) | 28 (6.9%) |
| Total | 329 (100.0%) | 408 (100.0%) |
Families and Households in Harmony
Median Family Size in Harmony
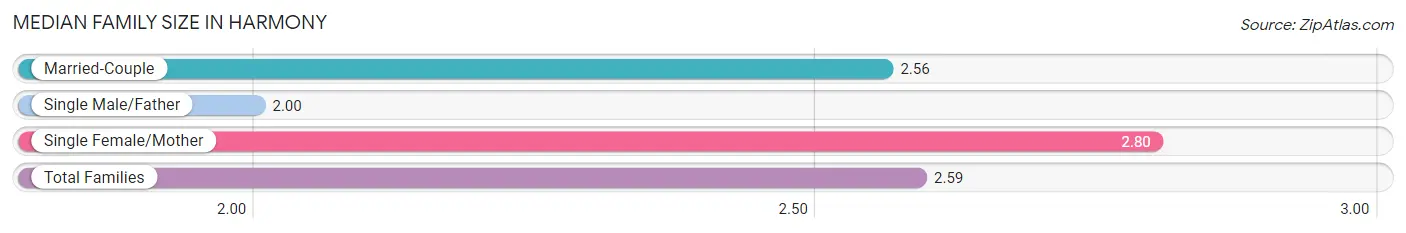
The median family size in Harmony is 2.59 persons per family, with single female/mother families (66 | 32.4%) accounting for the largest median family size of 2.8 persons per family. On the other hand, single male/father families (19 | 9.3%) represent the smallest median family size with 2.00 persons per family.
| Family Type | # Families | Family Size |
| Married-Couple | 119 (58.3%) | 2.56 |
| Single Male/Father | 19 (9.3%) | 2.00 |
| Single Female/Mother | 66 (32.4%) | 2.80 |
| Total Families | 204 (100.0%) | 2.59 |
Median Household Size in Harmony
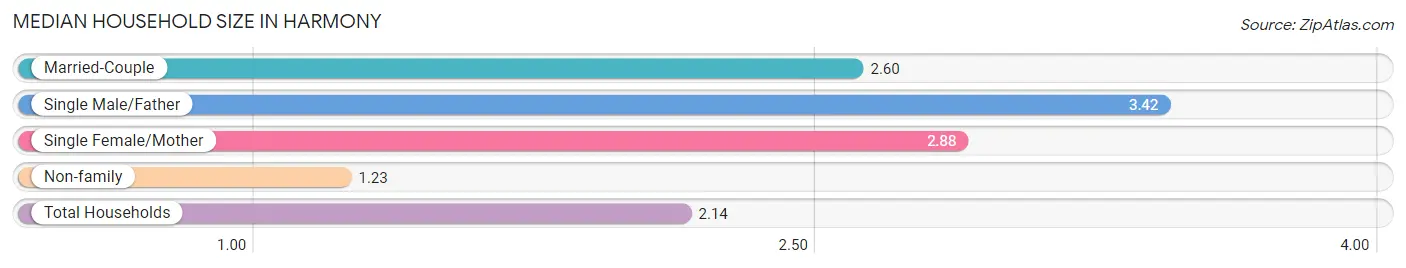
The median household size in Harmony is 2.14 persons per household, with single male/father households (19 | 5.5%) accounting for the largest median household size of 3.42 persons per household. non-family households (141 | 40.9%) represent the smallest median household size with 1.23 persons per household.
| Household Type | # Households | Household Size |
| Married-Couple | 119 (34.5%) | 2.60 |
| Single Male/Father | 19 (5.5%) | 3.42 |
| Single Female/Mother | 66 (19.1%) | 2.88 |
| Non-family | 141 (40.9%) | 1.23 |
| Total Households | 345 (100.0%) | 2.14 |
Household Size by Marriage Status in Harmony
Out of a total of 345 households in Harmony, 204 (59.1%) are family households, while 141 (40.9%) are nonfamily households. The most numerous type of family households are 2-person households, comprising 111, and the most common type of nonfamily households are 1-person households, comprising 119.
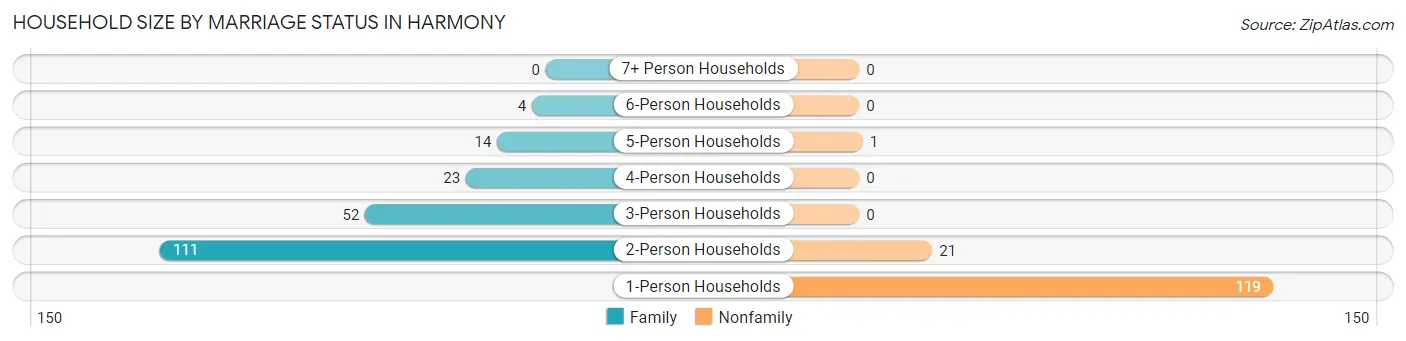
| Household Size | Family Households | Nonfamily Households |
| 1-Person Households | - | 119 (34.5%) |
| 2-Person Households | 111 (32.2%) | 21 (6.1%) |
| 3-Person Households | 52 (15.1%) | 0 (0.0%) |
| 4-Person Households | 23 (6.7%) | 0 (0.0%) |
| 5-Person Households | 14 (4.1%) | 1 (0.3%) |
| 6-Person Households | 4 (1.2%) | 0 (0.0%) |
| 7+ Person Households | 0 (0.0%) | 0 (0.0%) |
| Total | 204 (59.1%) | 141 (40.9%) |
Female Fertility in Harmony
Fertility by Age in Harmony
Average fertility rate in Harmony is 26.0 births per 1,000 women. Women in the age bracket of 20 to 34 years have the highest fertility rate with 68.0 births per 1,000 women. Women in the age bracket of 20 to 34 years acount for 100.0% of all women with births.
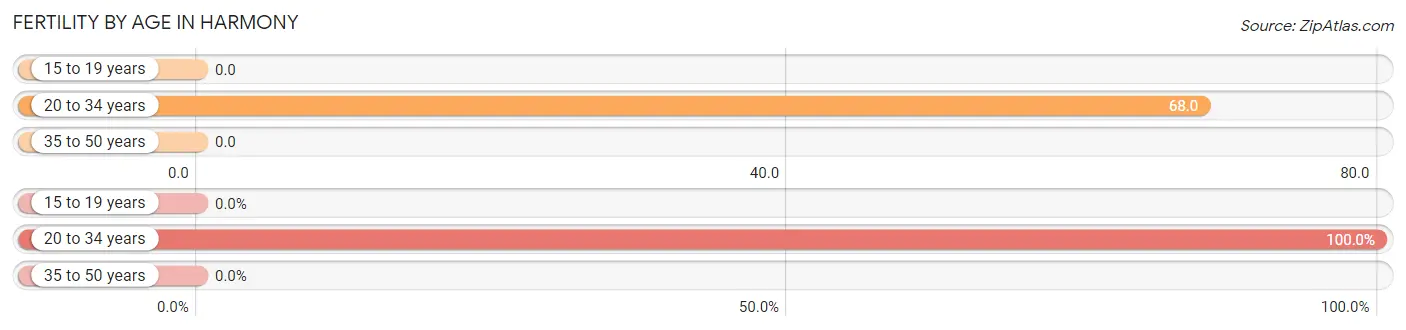
| Age Bracket | Women with Births | Births / 1,000 Women |
| 15 to 19 years | 0 (0.0%) | 0.0 |
| 20 to 34 years | 5 (100.0%) | 68.0 |
| 35 to 50 years | 0 (0.0%) | 0.0 |
| Total | 5 (100.0%) | 26.0 |
Fertility by Age by Marriage Status in Harmony
60.0% of women with births (5) in Harmony are married. The highest percentage of unmarried women with births falls into 20 to 34 years age bracket with 40.0% of them unmarried at the time of birth, while the lowest percentage of unmarried women with births belong to 20 to 34 years age bracket with 40.0% of them unmarried.
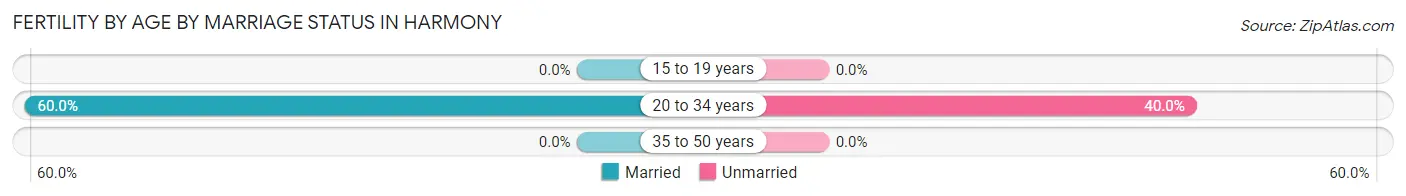
| Age Bracket | Married | Unmarried |
| 15 to 19 years | 0 (0.0%) | 0 (0.0%) |
| 20 to 34 years | 3 (60.0%) | 2 (40.0%) |
| 35 to 50 years | 0 (0.0%) | 0 (0.0%) |
| Total | 3 (60.0%) | 2 (40.0%) |
Fertility by Education in Harmony
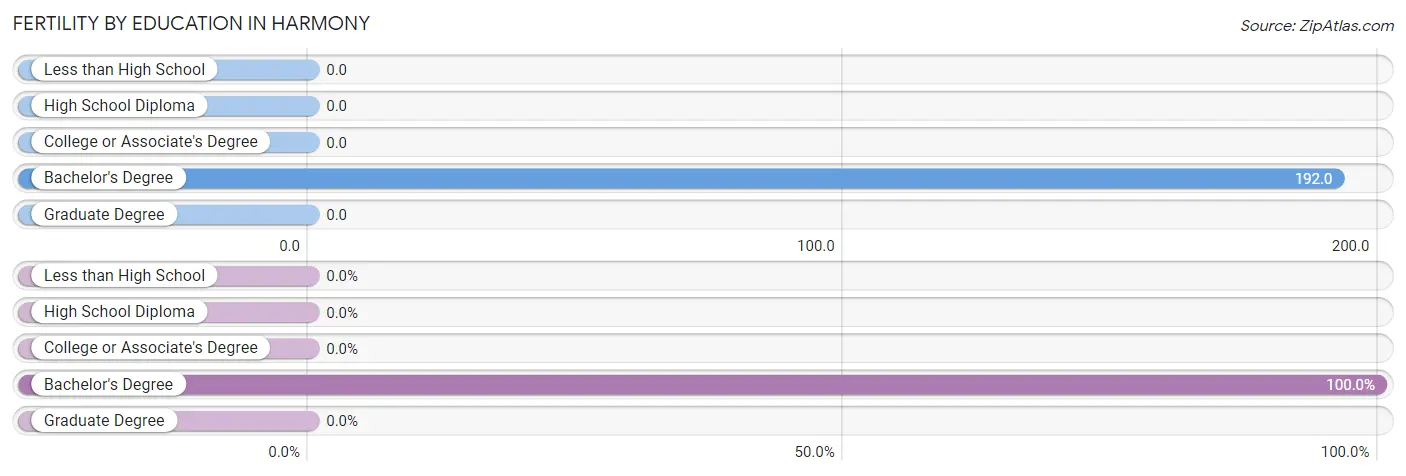
| Educational Attainment | Women with Births | Births / 1,000 Women |
| Less than High School | 0 (0.0%) | 0.0 |
| High School Diploma | 0 (0.0%) | 0.0 |
| College or Associate's Degree | 0 (0.0%) | 0.0 |
| Bachelor's Degree | 5 (100.0%) | 192.0 |
| Graduate Degree | 0 (0.0%) | 0.0 |
| Total | 5 (100.0%) | 26.0 |
Fertility by Education by Marriage Status in Harmony
40.0% of women with births in Harmony are unmarried. Women with the educational attainment of bachelor's degree are most likely to be married with 60.0% of them married at childbirth, while women with the educational attainment of bachelor's degree are least likely to be married with 40.0% of them unmarried at childbirth.
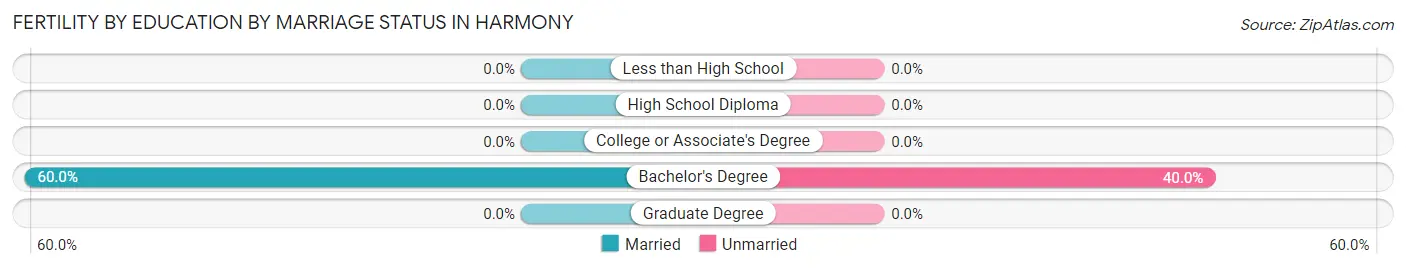
| Educational Attainment | Married | Unmarried |
| Less than High School | 0 (0.0%) | 0 (0.0%) |
| High School Diploma | 0 (0.0%) | 0 (0.0%) |
| College or Associate's Degree | 0 (0.0%) | 0 (0.0%) |
| Bachelor's Degree | 3 (60.0%) | 2 (40.0%) |
| Graduate Degree | 0 (0.0%) | 0 (0.0%) |
| Total | 3 (60.0%) | 2 (40.0%) |
Employment Characteristics in Harmony
Employment by Class of Employer in Harmony
Among the 334 employed individuals in Harmony, private company employees (237 | 71.0%), not-for-profit organizations (25 | 7.5%), and local government employees (24 | 7.2%) make up the most common classes of employment.
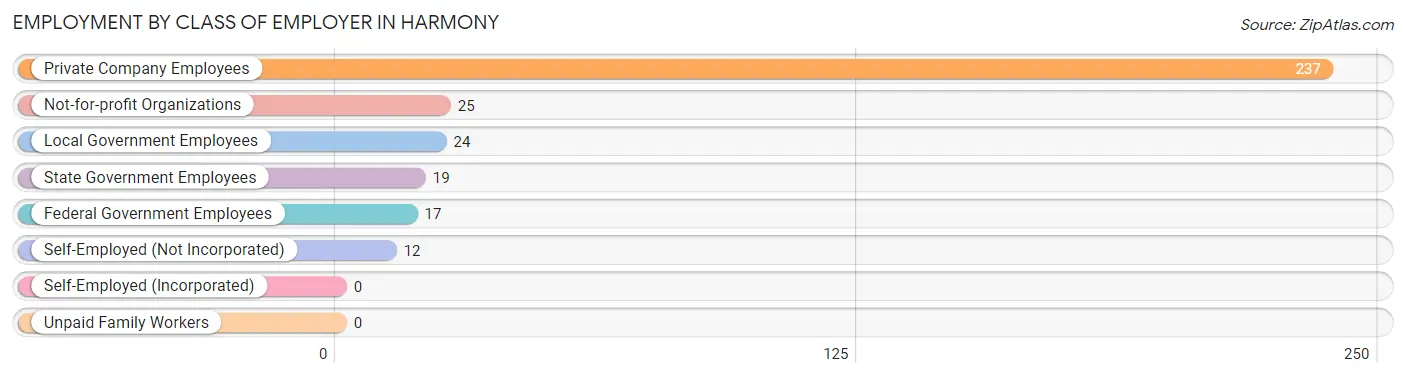
| Employer Class | # Employees | % Employees |
| Private Company Employees | 237 | 71.0% |
| Self-Employed (Incorporated) | 0 | 0.0% |
| Self-Employed (Not Incorporated) | 12 | 3.6% |
| Not-for-profit Organizations | 25 | 7.5% |
| Local Government Employees | 24 | 7.2% |
| State Government Employees | 19 | 5.7% |
| Federal Government Employees | 17 | 5.1% |
| Unpaid Family Workers | 0 | 0.0% |
| Total | 334 | 100.0% |
Employment Status by Age in Harmony
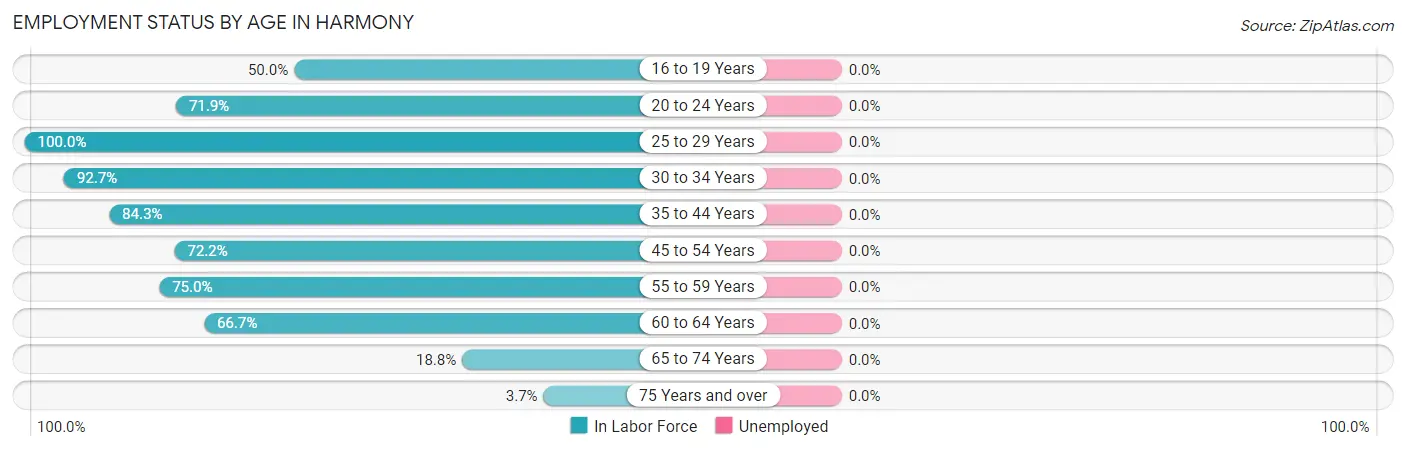
| Age Bracket | In Labor Force | Unemployed |
| 16 to 19 Years | 10 (50.0%) | 0 (0.0%) |
| 20 to 24 Years | 23 (71.9%) | 0 (0.0%) |
| 25 to 29 Years | 27 (100.0%) | 0 (0.0%) |
| 30 to 34 Years | 38 (92.7%) | 0 (0.0%) |
| 35 to 44 Years | 91 (84.3%) | 0 (0.0%) |
| 45 to 54 Years | 83 (72.2%) | 0 (0.0%) |
| 55 to 59 Years | 42 (75.0%) | 0 (0.0%) |
| 60 to 64 Years | 8 (66.7%) | 0 (0.0%) |
| 65 to 74 Years | 12 (18.8%) | 0 (0.0%) |
| 75 Years and over | 4 (3.7%) | 0 (0.0%) |
| Total | 338 (58.1%) | 0 (0.0%) |
Employment Status by Educational Attainment in Harmony
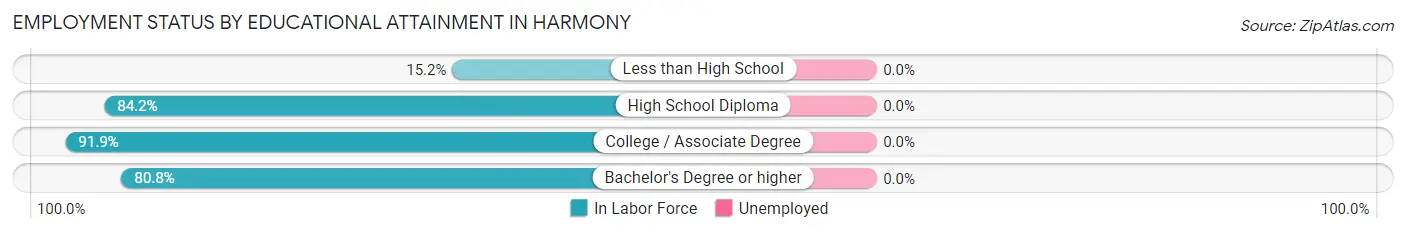
| Educational Attainment | In Labor Force | Unemployed |
| Less than High School | 5 (15.2%) | 0 (0.0%) |
| High School Diploma | 139 (84.2%) | 0 (0.0%) |
| College / Associate Degree | 124 (91.9%) | 0 (0.0%) |
| Bachelor's Degree or higher | 21 (80.8%) | 0 (0.0%) |
| Total | 289 (80.5%) | 0 (0.0%) |
Employment Occupations by Sex in Harmony
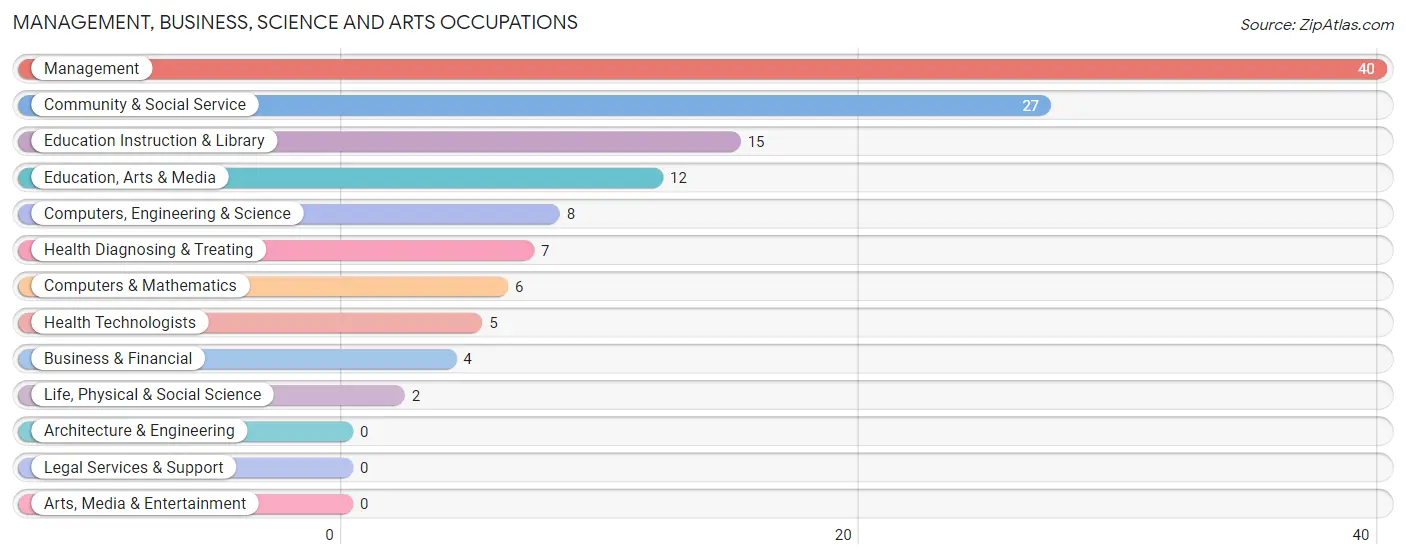
Management, Business, Science and Arts Occupations
The most common Management, Business, Science and Arts occupations in Harmony are Management (40 | 12.0%), Community & Social Service (27 | 8.1%), Education Instruction & Library (15 | 4.5%), Education, Arts & Media (12 | 3.6%), and Computers, Engineering & Science (8 | 2.4%).
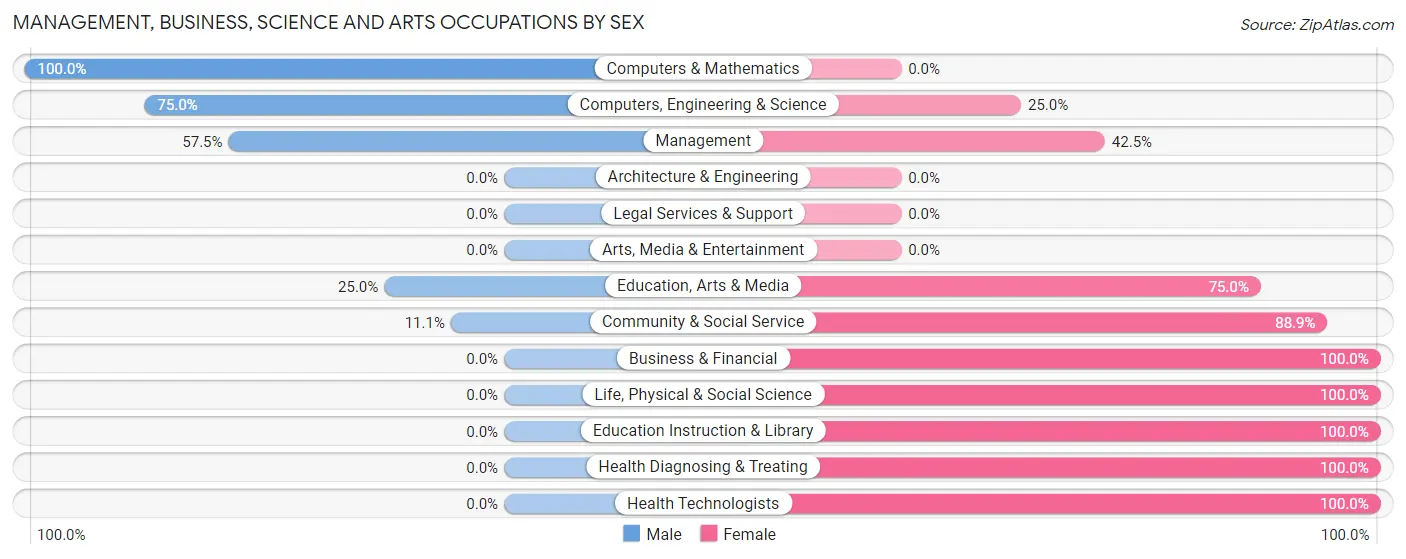
Management, Business, Science and Arts Occupations by Sex
Within the Management, Business, Science and Arts occupations in Harmony, the most male-oriented occupations are Computers & Mathematics (100.0%), Computers, Engineering & Science (75.0%), and Management (57.5%), while the most female-oriented occupations are Business & Financial (100.0%), Life, Physical & Social Science (100.0%), and Education Instruction & Library (100.0%).
| Occupation | Male | Female |
| Management | 23 (57.5%) | 17 (42.5%) |
| Business & Financial | 0 (0.0%) | 4 (100.0%) |
| Computers, Engineering & Science | 6 (75.0%) | 2 (25.0%) |
| Computers & Mathematics | 6 (100.0%) | 0 (0.0%) |
| Architecture & Engineering | 0 (0.0%) | 0 (0.0%) |
| Life, Physical & Social Science | 0 (0.0%) | 2 (100.0%) |
| Community & Social Service | 3 (11.1%) | 24 (88.9%) |
| Education, Arts & Media | 3 (25.0%) | 9 (75.0%) |
| Legal Services & Support | 0 (0.0%) | 0 (0.0%) |
| Education Instruction & Library | 0 (0.0%) | 15 (100.0%) |
| Arts, Media & Entertainment | 0 (0.0%) | 0 (0.0%) |
| Health Diagnosing & Treating | 0 (0.0%) | 7 (100.0%) |
| Health Technologists | 0 (0.0%) | 5 (100.0%) |
| Total (Category) | 32 (37.2%) | 54 (62.8%) |
| Total (Overall) | 127 (38.0%) | 207 (62.0%) |
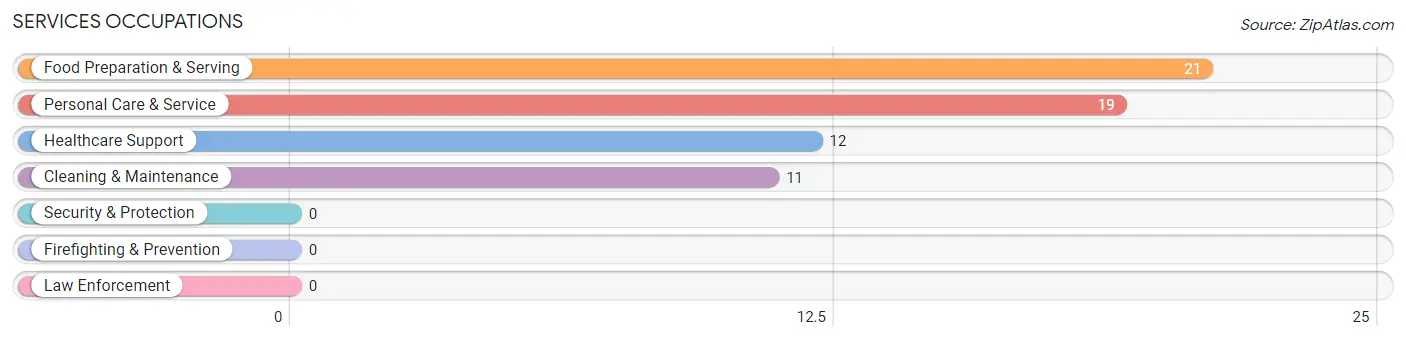
Services Occupations
The most common Services occupations in Harmony are Food Preparation & Serving (21 | 6.3%), Personal Care & Service (19 | 5.7%), Healthcare Support (12 | 3.6%), and Cleaning & Maintenance (11 | 3.3%).
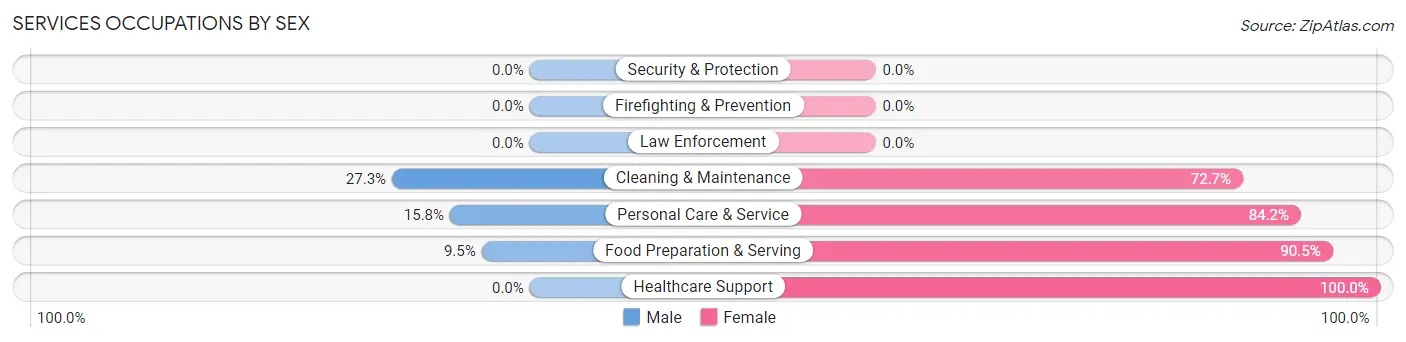
Services Occupations by Sex
Within the Services occupations in Harmony, the most male-oriented occupations are Cleaning & Maintenance (27.3%), Personal Care & Service (15.8%), and Food Preparation & Serving (9.5%), while the most female-oriented occupations are Healthcare Support (100.0%), Food Preparation & Serving (90.5%), and Personal Care & Service (84.2%).
| Occupation | Male | Female |
| Healthcare Support | 0 (0.0%) | 12 (100.0%) |
| Security & Protection | 0 (0.0%) | 0 (0.0%) |
| Firefighting & Prevention | 0 (0.0%) | 0 (0.0%) |
| Law Enforcement | 0 (0.0%) | 0 (0.0%) |
| Food Preparation & Serving | 2 (9.5%) | 19 (90.5%) |
| Cleaning & Maintenance | 3 (27.3%) | 8 (72.7%) |
| Personal Care & Service | 3 (15.8%) | 16 (84.2%) |
| Total (Category) | 8 (12.7%) | 55 (87.3%) |
| Total (Overall) | 127 (38.0%) | 207 (62.0%) |
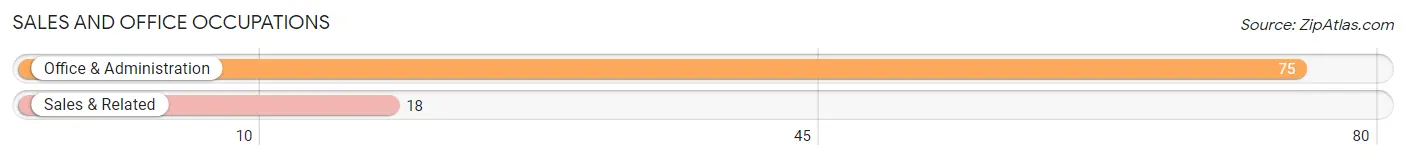
Sales and Office Occupations
The most common Sales and Office occupations in Harmony are Office & Administration (75 | 22.5%), and Sales & Related (18 | 5.4%).
Sales and Office Occupations by Sex
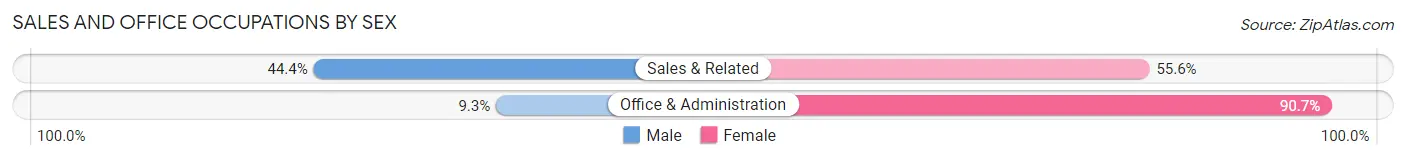
| Occupation | Male | Female |
| Sales & Related | 8 (44.4%) | 10 (55.6%) |
| Office & Administration | 7 (9.3%) | 68 (90.7%) |
| Total (Category) | 15 (16.1%) | 78 (83.9%) |
| Total (Overall) | 127 (38.0%) | 207 (62.0%) |
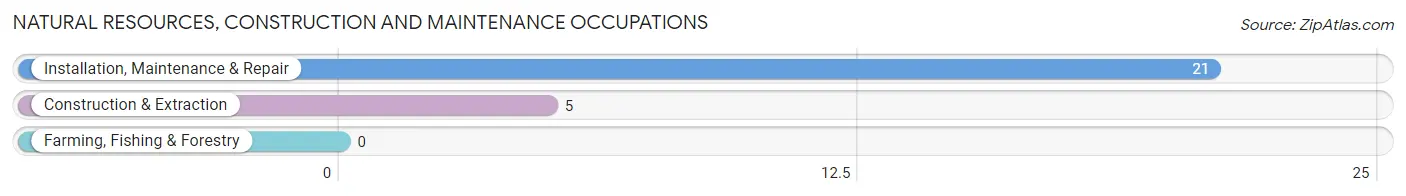
Natural Resources, Construction and Maintenance Occupations
The most common Natural Resources, Construction and Maintenance occupations in Harmony are Installation, Maintenance & Repair (21 | 6.3%), and Construction & Extraction (5 | 1.5%).
Natural Resources, Construction and Maintenance Occupations by Sex
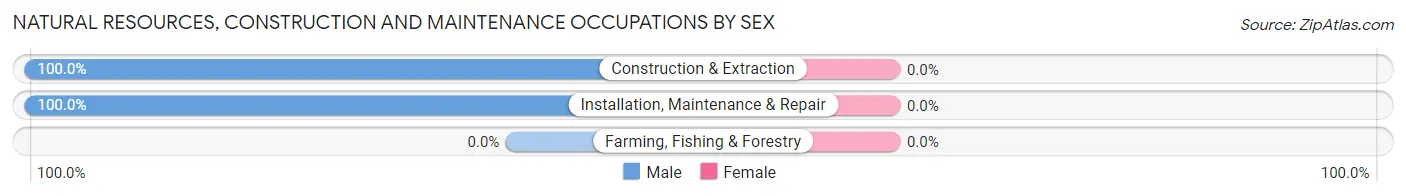
| Occupation | Male | Female |
| Farming, Fishing & Forestry | 0 (0.0%) | 0 (0.0%) |
| Construction & Extraction | 5 (100.0%) | 0 (0.0%) |
| Installation, Maintenance & Repair | 21 (100.0%) | 0 (0.0%) |
| Total (Category) | 26 (100.0%) | 0 (0.0%) |
| Total (Overall) | 127 (38.0%) | 207 (62.0%) |
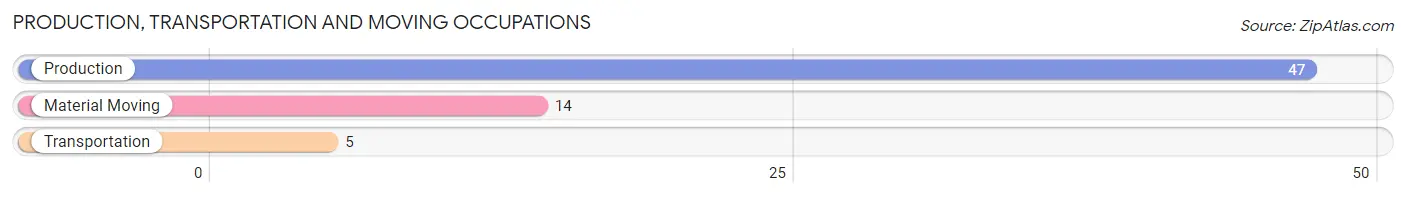
Production, Transportation and Moving Occupations
The most common Production, Transportation and Moving occupations in Harmony are Production (47 | 14.1%), Material Moving (14 | 4.2%), and Transportation (5 | 1.5%).
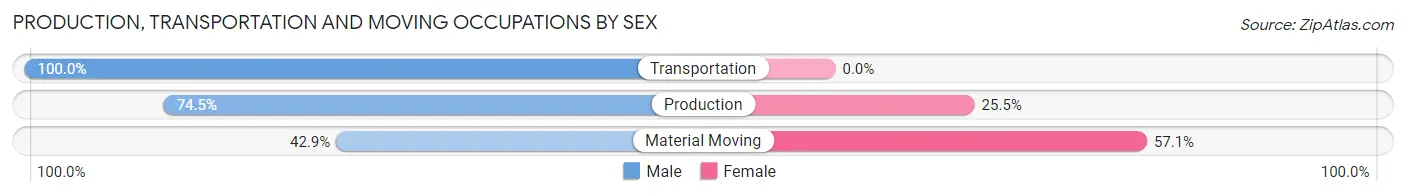
Production, Transportation and Moving Occupations by Sex
| Occupation | Male | Female |
| Production | 35 (74.5%) | 12 (25.5%) |
| Transportation | 5 (100.0%) | 0 (0.0%) |
| Material Moving | 6 (42.9%) | 8 (57.1%) |
| Total (Category) | 46 (69.7%) | 20 (30.3%) |
| Total (Overall) | 127 (38.0%) | 207 (62.0%) |
Employment Industries by Sex in Harmony
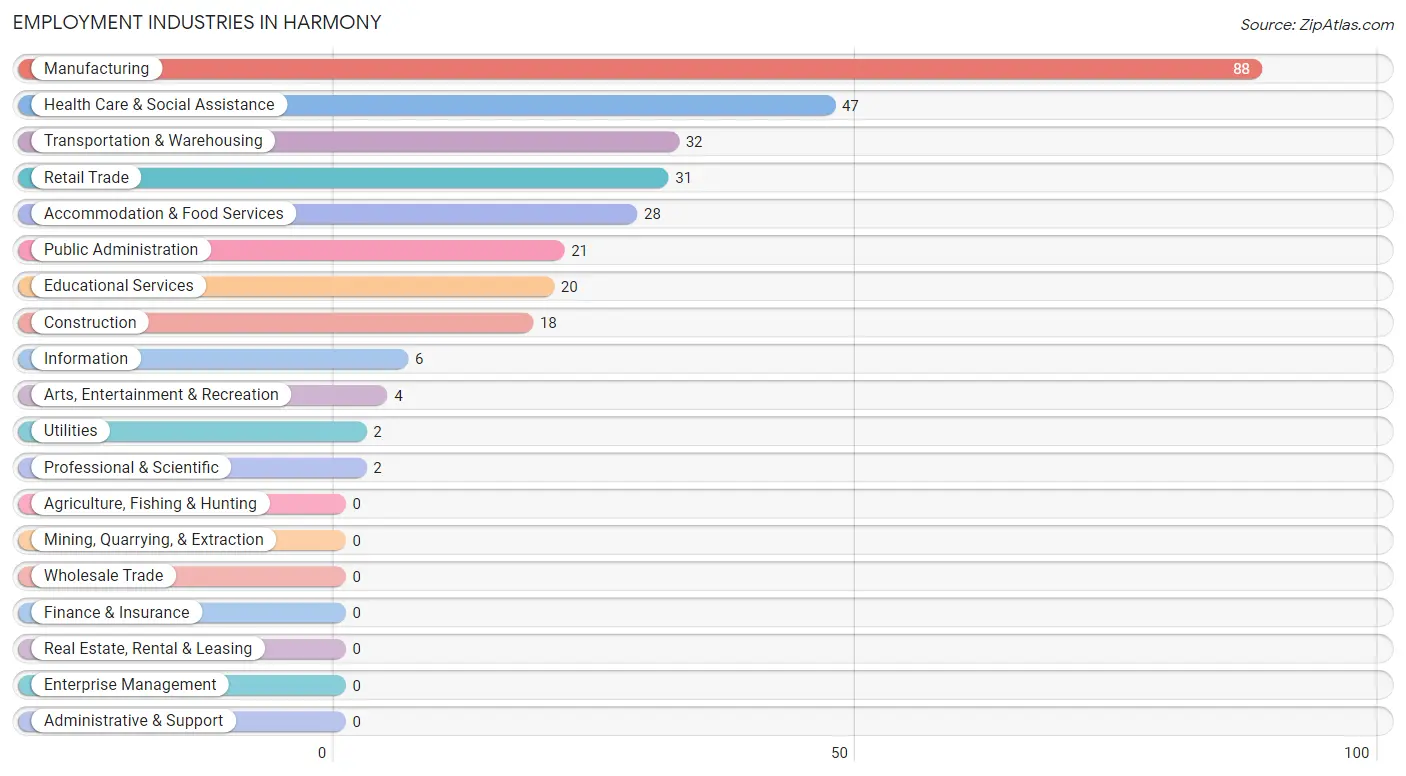
Employment Industries in Harmony
The major employment industries in Harmony include Manufacturing (88 | 26.4%), Health Care & Social Assistance (47 | 14.1%), Transportation & Warehousing (32 | 9.6%), Retail Trade (31 | 9.3%), and Accommodation & Food Services (28 | 8.4%).
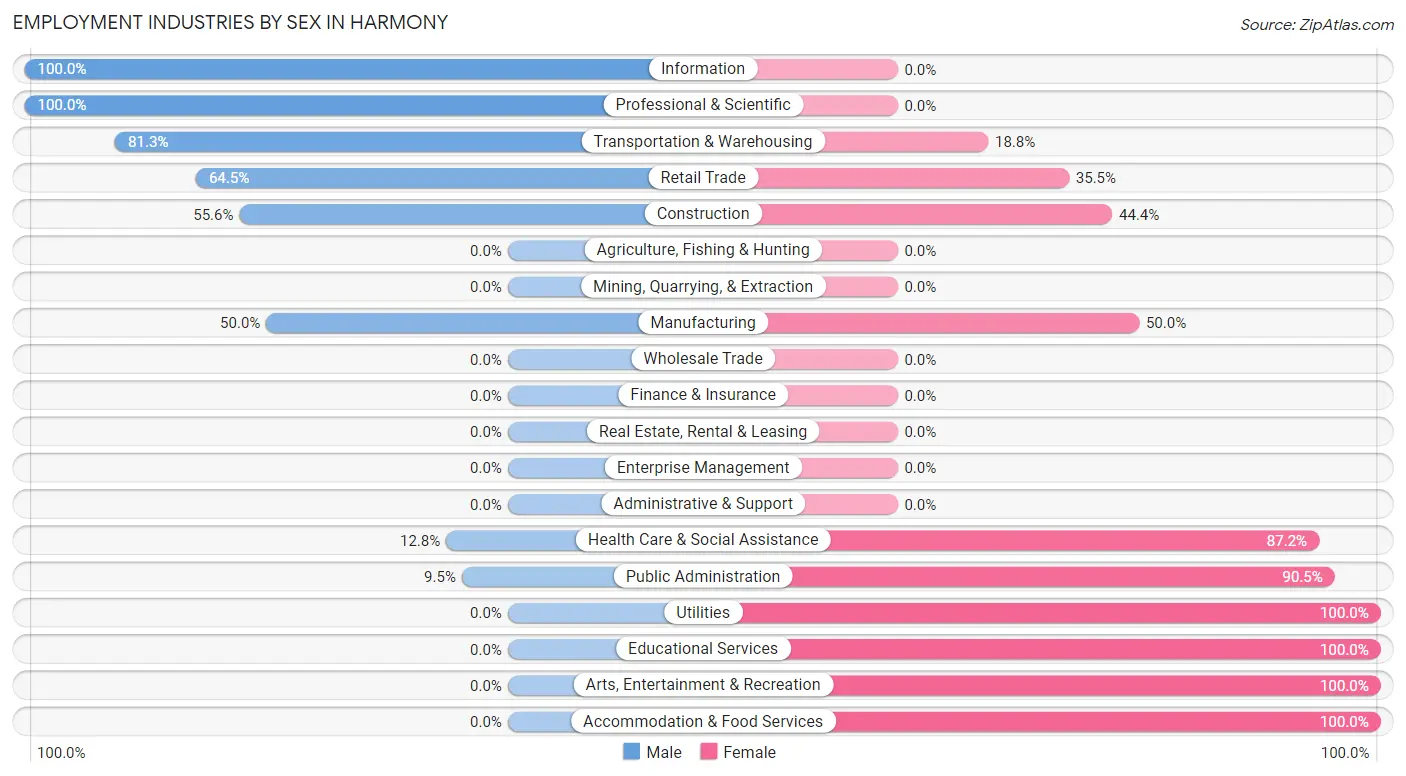
Employment Industries by Sex in Harmony
The Harmony industries that see more men than women are Information (100.0%), Professional & Scientific (100.0%), and Transportation & Warehousing (81.2%), whereas the industries that tend to have a higher number of women are Utilities (100.0%), Educational Services (100.0%), and Arts, Entertainment & Recreation (100.0%).
| Industry | Male | Female |
| Agriculture, Fishing & Hunting | 0 (0.0%) | 0 (0.0%) |
| Mining, Quarrying, & Extraction | 0 (0.0%) | 0 (0.0%) |
| Construction | 10 (55.6%) | 8 (44.4%) |
| Manufacturing | 44 (50.0%) | 44 (50.0%) |
| Wholesale Trade | 0 (0.0%) | 0 (0.0%) |
| Retail Trade | 20 (64.5%) | 11 (35.5%) |
| Transportation & Warehousing | 26 (81.2%) | 6 (18.8%) |
| Utilities | 0 (0.0%) | 2 (100.0%) |
| Information | 6 (100.0%) | 0 (0.0%) |
| Finance & Insurance | 0 (0.0%) | 0 (0.0%) |
| Real Estate, Rental & Leasing | 0 (0.0%) | 0 (0.0%) |
| Professional & Scientific | 2 (100.0%) | 0 (0.0%) |
| Enterprise Management | 0 (0.0%) | 0 (0.0%) |
| Administrative & Support | 0 (0.0%) | 0 (0.0%) |
| Educational Services | 0 (0.0%) | 20 (100.0%) |
| Health Care & Social Assistance | 6 (12.8%) | 41 (87.2%) |
| Arts, Entertainment & Recreation | 0 (0.0%) | 4 (100.0%) |
| Accommodation & Food Services | 0 (0.0%) | 28 (100.0%) |
| Public Administration | 2 (9.5%) | 19 (90.5%) |
| Total | 127 (38.0%) | 207 (62.0%) |
Education in Harmony
School Enrollment in Harmony
The most common levels of schooling among the 171 students in Harmony are elementary school (48 | 28.1%), nursery / preschool (35 | 20.5%), and high school (30 | 17.5%).
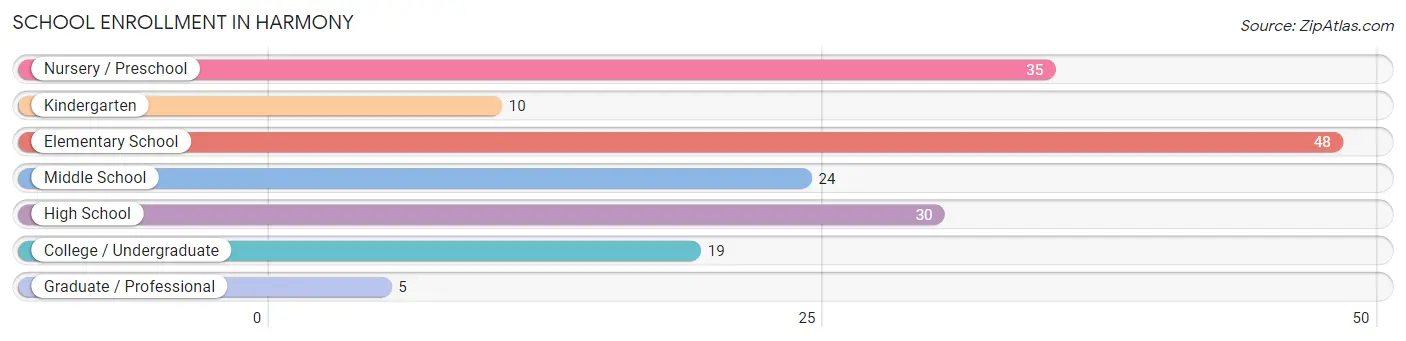
| School Level | # Students | % Students |
| Nursery / Preschool | 35 | 20.5% |
| Kindergarten | 10 | 5.9% |
| Elementary School | 48 | 28.1% |
| Middle School | 24 | 14.0% |
| High School | 30 | 17.5% |
| College / Undergraduate | 19 | 11.1% |
| Graduate / Professional | 5 | 2.9% |
| Total | 171 | 100.0% |
School Enrollment by Age by Funding Source in Harmony
Out of a total of 171 students who are enrolled in schools in Harmony, 43 (25.1%) attend a private institution, while the remaining 128 (74.9%) are enrolled in public schools. The age group of 3 to 4 year olds has the highest likelihood of being enrolled in private schools, with 35 (100.0% in the age bracket) enrolled. Conversely, the age group of 5 to 9 year old has the lowest likelihood of being enrolled in a private school, with 47 (100.0% in the age bracket) attending a public institution.
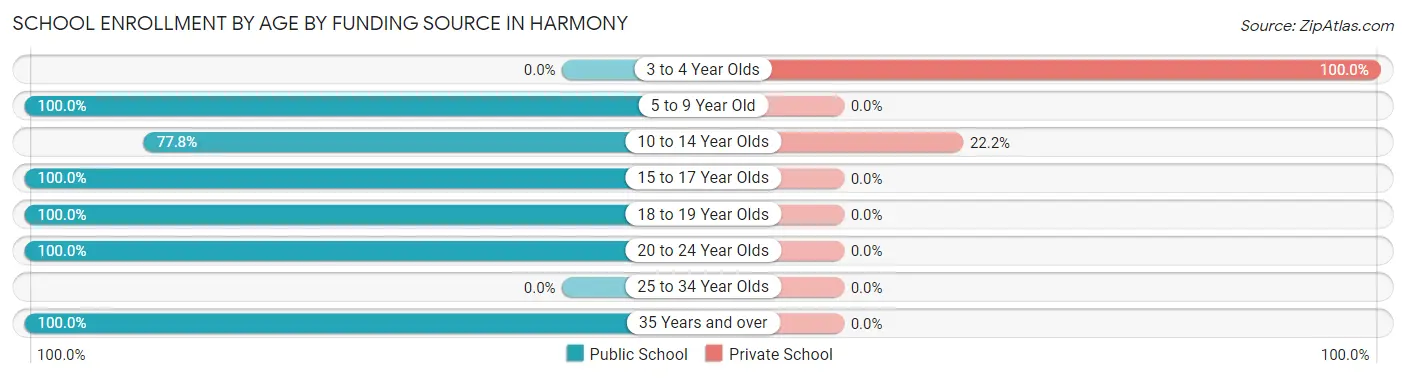
| Age Bracket | Public School | Private School |
| 3 to 4 Year Olds | 0 (0.0%) | 35 (100.0%) |
| 5 to 9 Year Old | 47 (100.0%) | 0 (0.0%) |
| 10 to 14 Year Olds | 28 (77.8%) | 8 (22.2%) |
| 15 to 17 Year Olds | 29 (100.0%) | 0 (0.0%) |
| 18 to 19 Year Olds | 7 (100.0%) | 0 (0.0%) |
| 20 to 24 Year Olds | 13 (100.0%) | 0 (0.0%) |
| 25 to 34 Year Olds | 0 (0.0%) | 0 (0.0%) |
| 35 Years and over | 4 (100.0%) | 0 (0.0%) |
| Total | 128 (74.9%) | 43 (25.1%) |
Educational Attainment by Field of Study in Harmony
Education (14 | 31.1%), arts & humanities (11 | 24.4%), business (7 | 15.6%), science & technology (5 | 11.1%), and social sciences (3 | 6.7%) are the most common fields of study among 45 individuals in Harmony who have obtained a bachelor's degree or higher.
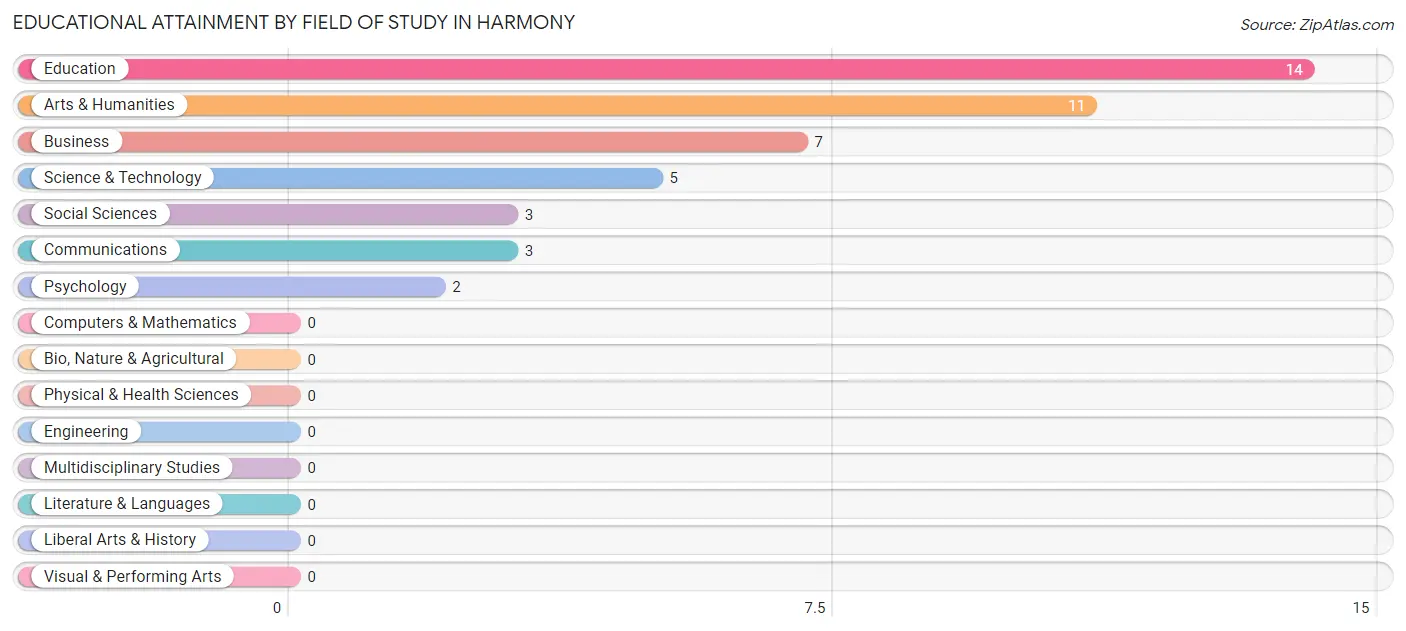
| Field of Study | # Graduates | % Graduates |
| Computers & Mathematics | 0 | 0.0% |
| Bio, Nature & Agricultural | 0 | 0.0% |
| Physical & Health Sciences | 0 | 0.0% |
| Psychology | 2 | 4.4% |
| Social Sciences | 3 | 6.7% |
| Engineering | 0 | 0.0% |
| Multidisciplinary Studies | 0 | 0.0% |
| Science & Technology | 5 | 11.1% |
| Business | 7 | 15.6% |
| Education | 14 | 31.1% |
| Literature & Languages | 0 | 0.0% |
| Liberal Arts & History | 0 | 0.0% |
| Visual & Performing Arts | 0 | 0.0% |
| Communications | 3 | 6.7% |
| Arts & Humanities | 11 | 24.4% |
| Total | 45 | 100.0% |
Transportation & Commute in Harmony
Vehicle Availability by Sex in Harmony
The most prevalent vehicle ownership categories in Harmony are males with 3 vehicles (56, accounting for 44.1%) and females with 3 vehicles (62, making up 27.1%).
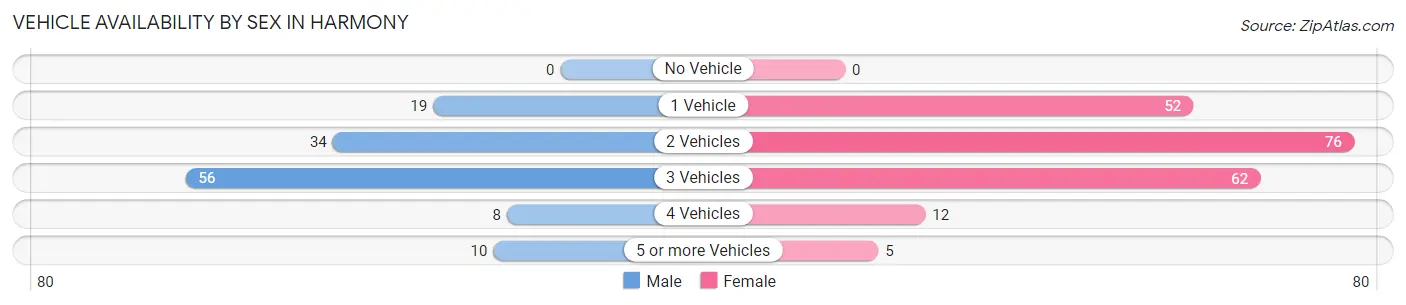
| Vehicles Available | Male | Female |
| No Vehicle | 0 (0.0%) | 0 (0.0%) |
| 1 Vehicle | 19 (15.0%) | 52 (25.1%) |
| 2 Vehicles | 34 (26.8%) | 76 (36.7%) |
| 3 Vehicles | 56 (44.1%) | 62 (29.9%) |
| 4 Vehicles | 8 (6.3%) | 12 (5.8%) |
| 5 or more Vehicles | 10 (7.9%) | 5 (2.4%) |
| Total | 127 (100.0%) | 207 (100.0%) |
Commute Time in Harmony
The most frequently occuring commute durations in Harmony are 5 to 9 minutes (84 commuters, 25.2%), 30 to 34 minutes (45 commuters, 13.5%), and 35 to 39 minutes (34 commuters, 10.2%).
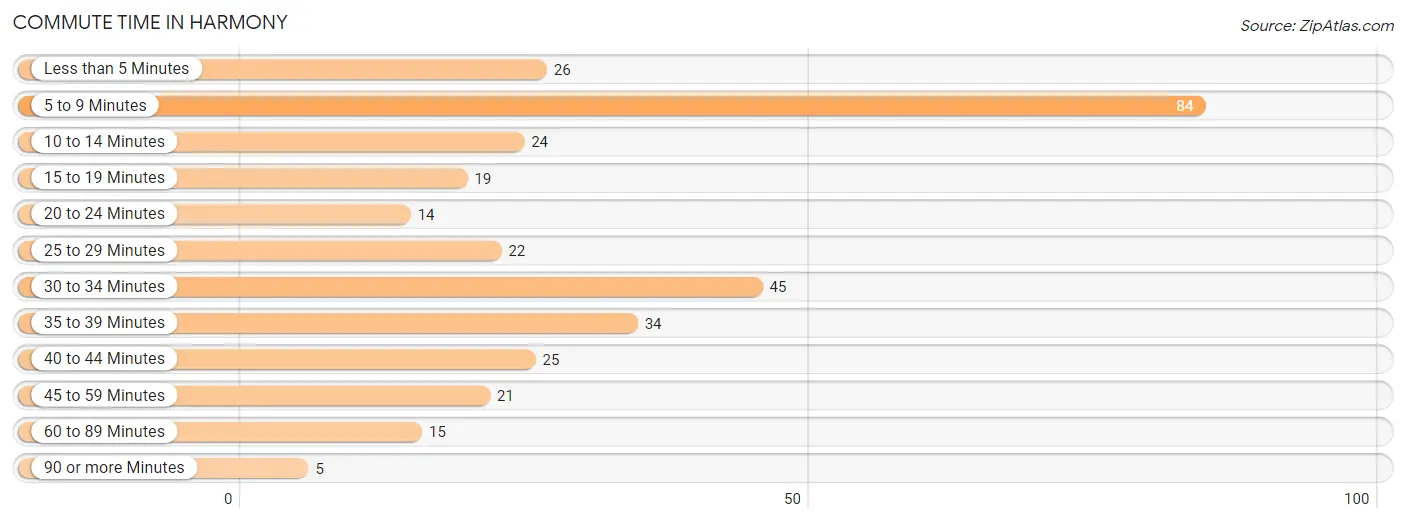
| Commute Time | # Commuters | % Commuters |
| Less than 5 Minutes | 26 | 7.8% |
| 5 to 9 Minutes | 84 | 25.2% |
| 10 to 14 Minutes | 24 | 7.2% |
| 15 to 19 Minutes | 19 | 5.7% |
| 20 to 24 Minutes | 14 | 4.2% |
| 25 to 29 Minutes | 22 | 6.6% |
| 30 to 34 Minutes | 45 | 13.5% |
| 35 to 39 Minutes | 34 | 10.2% |
| 40 to 44 Minutes | 25 | 7.5% |
| 45 to 59 Minutes | 21 | 6.3% |
| 60 to 89 Minutes | 15 | 4.5% |
| 90 or more Minutes | 5 | 1.5% |
Commute Time by Sex in Harmony
The most common commute times in Harmony are 30 to 34 minutes (35 commuters, 27.6%) for males and 5 to 9 minutes (55 commuters, 26.6%) for females.
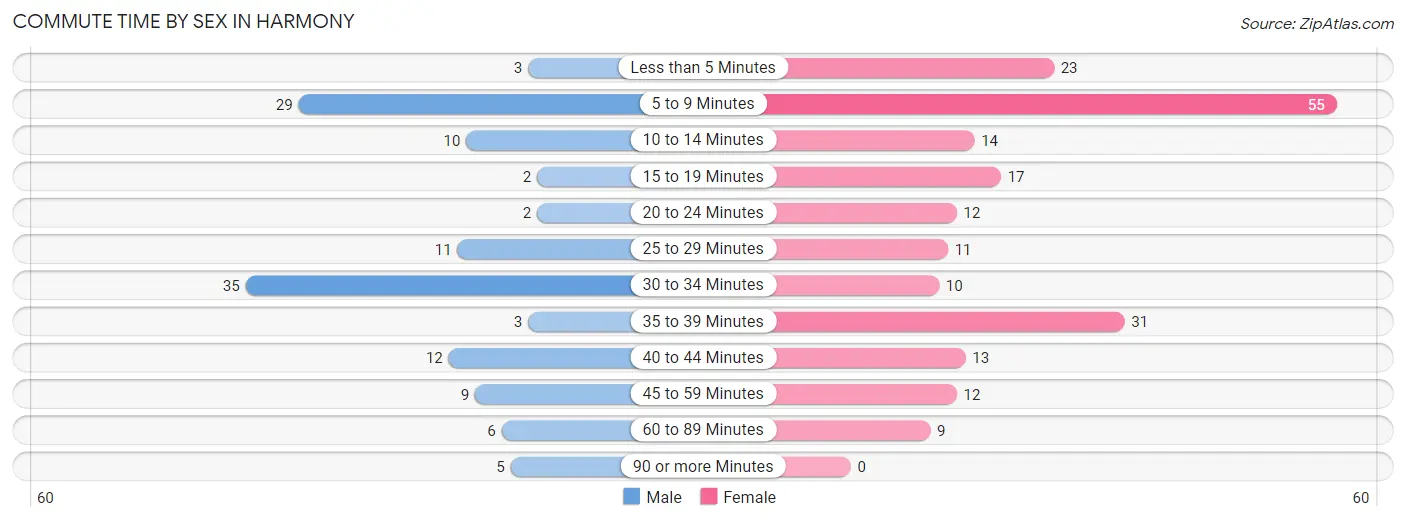
| Commute Time | Male | Female |
| Less than 5 Minutes | 3 (2.4%) | 23 (11.1%) |
| 5 to 9 Minutes | 29 (22.8%) | 55 (26.6%) |
| 10 to 14 Minutes | 10 (7.9%) | 14 (6.8%) |
| 15 to 19 Minutes | 2 (1.6%) | 17 (8.2%) |
| 20 to 24 Minutes | 2 (1.6%) | 12 (5.8%) |
| 25 to 29 Minutes | 11 (8.7%) | 11 (5.3%) |
| 30 to 34 Minutes | 35 (27.6%) | 10 (4.8%) |
| 35 to 39 Minutes | 3 (2.4%) | 31 (15.0%) |
| 40 to 44 Minutes | 12 (9.5%) | 13 (6.3%) |
| 45 to 59 Minutes | 9 (7.1%) | 12 (5.8%) |
| 60 to 89 Minutes | 6 (4.7%) | 9 (4.3%) |
| 90 or more Minutes | 5 (3.9%) | 0 (0.0%) |
Time of Departure to Work by Sex in Harmony
The most frequent times of departure to work in Harmony are 9:00 AM to 9:59 AM (22, 17.3%) for males and 7:30 AM to 7:59 AM (55, 26.6%) for females.
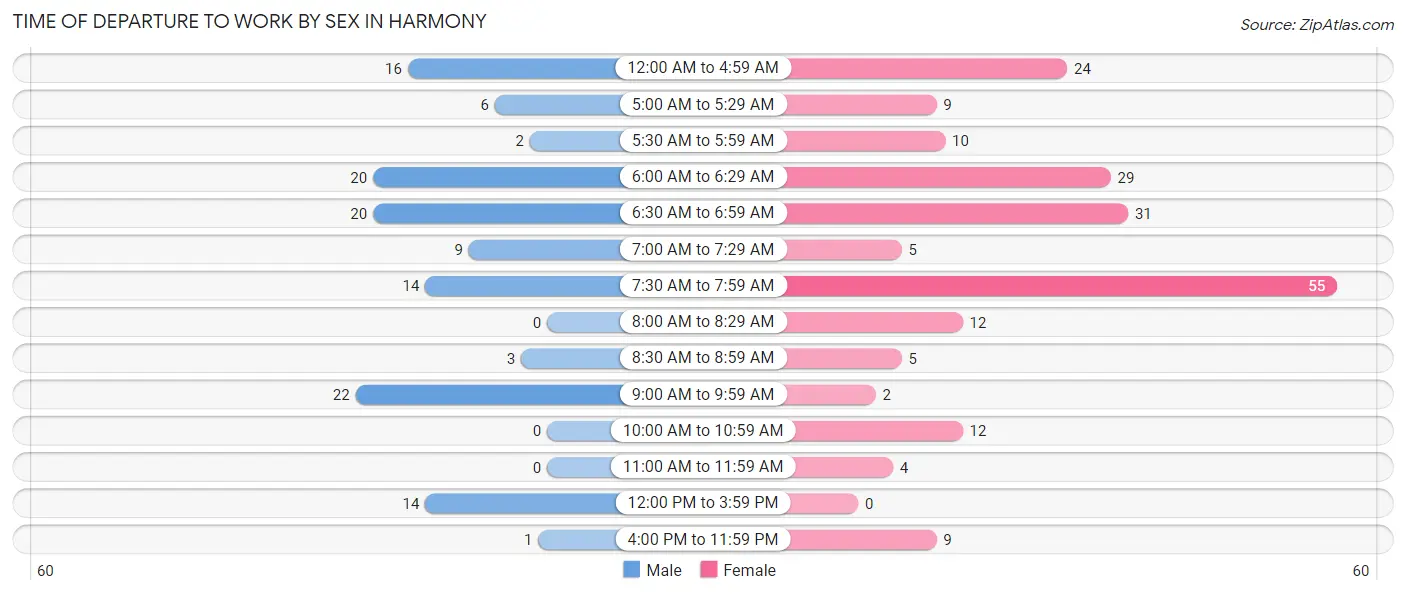
| Time of Departure | Male | Female |
| 12:00 AM to 4:59 AM | 16 (12.6%) | 24 (11.6%) |
| 5:00 AM to 5:29 AM | 6 (4.7%) | 9 (4.3%) |
| 5:30 AM to 5:59 AM | 2 (1.6%) | 10 (4.8%) |
| 6:00 AM to 6:29 AM | 20 (15.8%) | 29 (14.0%) |
| 6:30 AM to 6:59 AM | 20 (15.8%) | 31 (15.0%) |
| 7:00 AM to 7:29 AM | 9 (7.1%) | 5 (2.4%) |
| 7:30 AM to 7:59 AM | 14 (11.0%) | 55 (26.6%) |
| 8:00 AM to 8:29 AM | 0 (0.0%) | 12 (5.8%) |
| 8:30 AM to 8:59 AM | 3 (2.4%) | 5 (2.4%) |
| 9:00 AM to 9:59 AM | 22 (17.3%) | 2 (1.0%) |
| 10:00 AM to 10:59 AM | 0 (0.0%) | 12 (5.8%) |
| 11:00 AM to 11:59 AM | 0 (0.0%) | 4 (1.9%) |
| 12:00 PM to 3:59 PM | 14 (11.0%) | 0 (0.0%) |
| 4:00 PM to 11:59 PM | 1 (0.8%) | 9 (4.3%) |
| Total | 127 (100.0%) | 207 (100.0%) |
Housing Occupancy in Harmony
Occupancy by Ownership in Harmony
Of the total 345 dwellings in Harmony, owner-occupied units account for 240 (69.6%), while renter-occupied units make up 105 (30.4%).
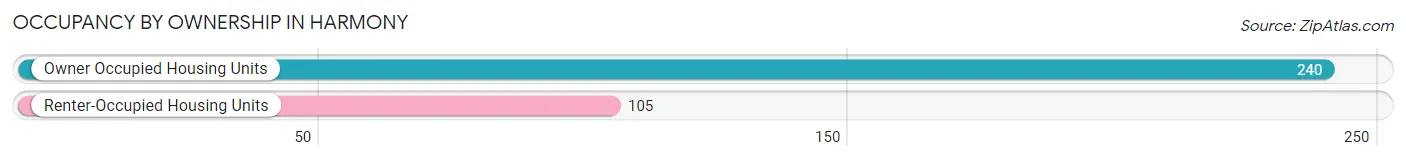
| Occupancy | # Housing Units | % Housing Units |
| Owner Occupied Housing Units | 240 | 69.6% |
| Renter-Occupied Housing Units | 105 | 30.4% |
| Total Occupied Housing Units | 345 | 100.0% |
Occupancy by Household Size in Harmony
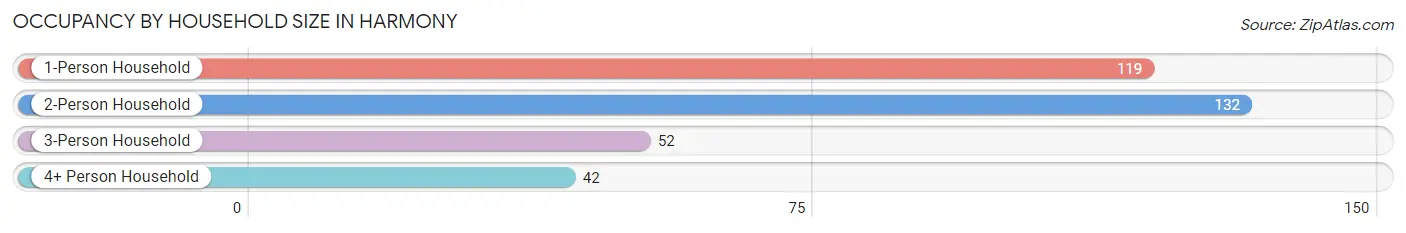
| Household Size | # Housing Units | % Housing Units |
| 1-Person Household | 119 | 34.5% |
| 2-Person Household | 132 | 38.3% |
| 3-Person Household | 52 | 15.1% |
| 4+ Person Household | 42 | 12.2% |
| Total Housing Units | 345 | 100.0% |
Occupancy by Ownership by Household Size in Harmony
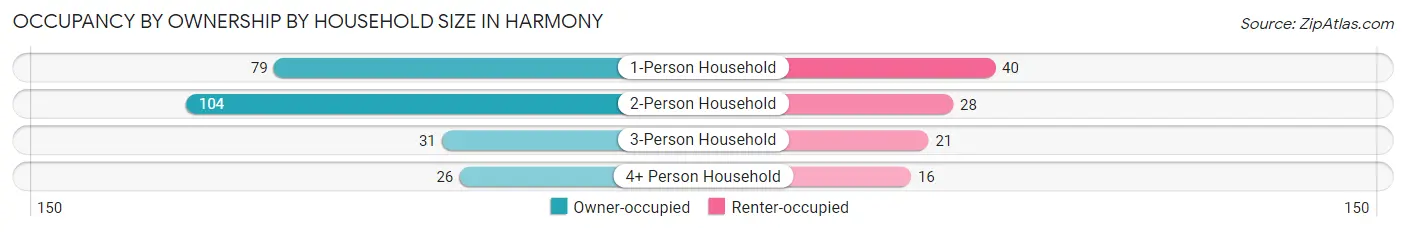
| Household Size | Owner-occupied | Renter-occupied |
| 1-Person Household | 79 (66.4%) | 40 (33.6%) |
| 2-Person Household | 104 (78.8%) | 28 (21.2%) |
| 3-Person Household | 31 (59.6%) | 21 (40.4%) |
| 4+ Person Household | 26 (61.9%) | 16 (38.1%) |
| Total Housing Units | 240 (69.6%) | 105 (30.4%) |
Occupancy by Educational Attainment in Harmony
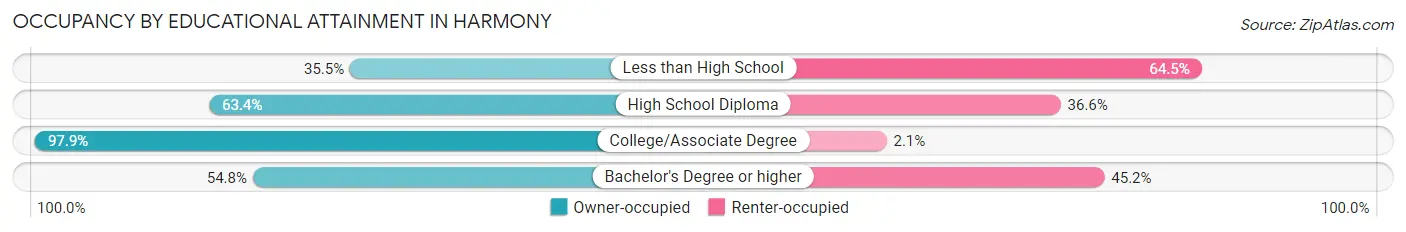
| Household Size | Owner-occupied | Renter-occupied |
| Less than High School | 11 (35.5%) | 20 (64.5%) |
| High School Diploma | 111 (63.4%) | 64 (36.6%) |
| College/Associate Degree | 95 (97.9%) | 2 (2.1%) |
| Bachelor's Degree or higher | 23 (54.8%) | 19 (45.2%) |
Occupancy by Age of Householder in Harmony
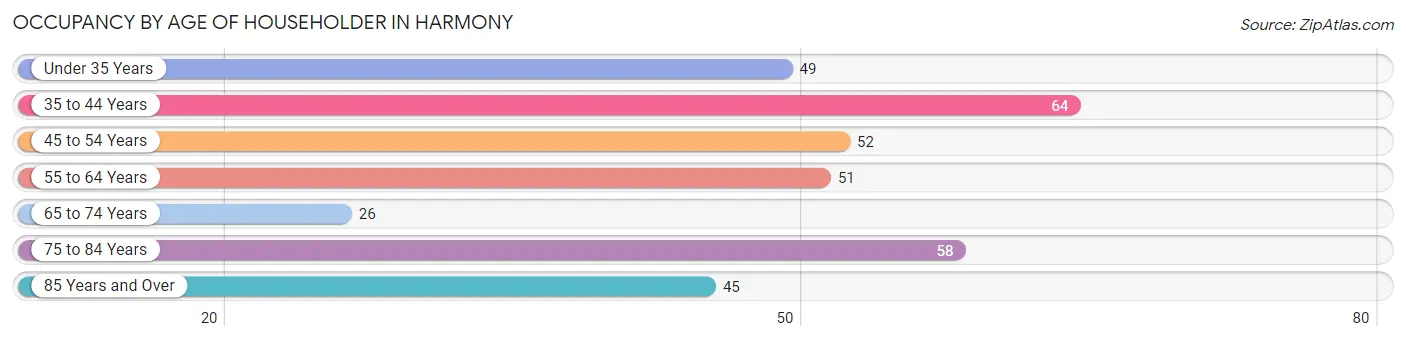
| Age Bracket | # Households | % Households |
| Under 35 Years | 49 | 14.2% |
| 35 to 44 Years | 64 | 18.5% |
| 45 to 54 Years | 52 | 15.1% |
| 55 to 64 Years | 51 | 14.8% |
| 65 to 74 Years | 26 | 7.5% |
| 75 to 84 Years | 58 | 16.8% |
| 85 Years and Over | 45 | 13.0% |
| Total | 345 | 100.0% |
Housing Finances in Harmony
Median Income by Occupancy in Harmony
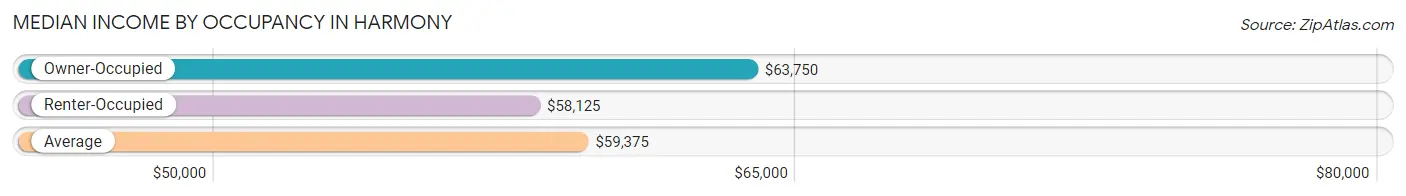
| Occupancy Type | # Households | Median Income |
| Owner-Occupied | 240 (69.6%) | $63,750 |
| Renter-Occupied | 105 (30.4%) | $58,125 |
| Average | 345 (100.0%) | $59,375 |
Occupancy by Householder Income Bracket in Harmony
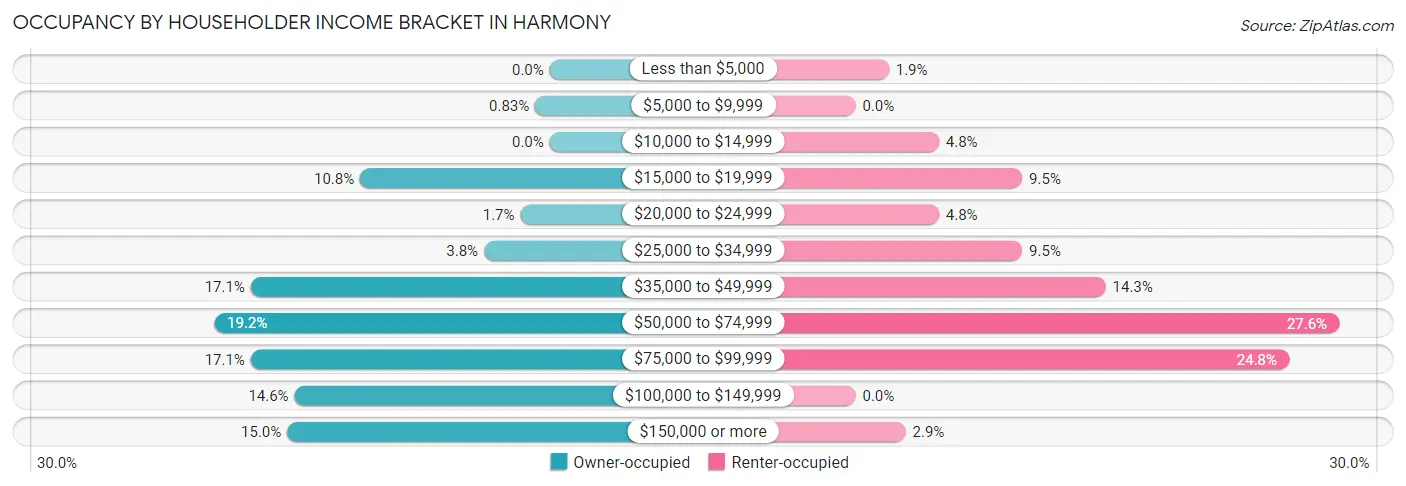
| Income Bracket | Owner-occupied | Renter-occupied |
| Less than $5,000 | 0 (0.0%) | 2 (1.9%) |
| $5,000 to $9,999 | 2 (0.8%) | 0 (0.0%) |
| $10,000 to $14,999 | 0 (0.0%) | 5 (4.8%) |
| $15,000 to $19,999 | 26 (10.8%) | 10 (9.5%) |
| $20,000 to $24,999 | 4 (1.7%) | 5 (4.8%) |
| $25,000 to $34,999 | 9 (3.7%) | 10 (9.5%) |
| $35,000 to $49,999 | 41 (17.1%) | 15 (14.3%) |
| $50,000 to $74,999 | 46 (19.2%) | 29 (27.6%) |
| $75,000 to $99,999 | 41 (17.1%) | 26 (24.8%) |
| $100,000 to $149,999 | 35 (14.6%) | 0 (0.0%) |
| $150,000 or more | 36 (15.0%) | 3 (2.9%) |
| Total | 240 (100.0%) | 105 (100.0%) |
Monthly Housing Cost Tiers in Harmony
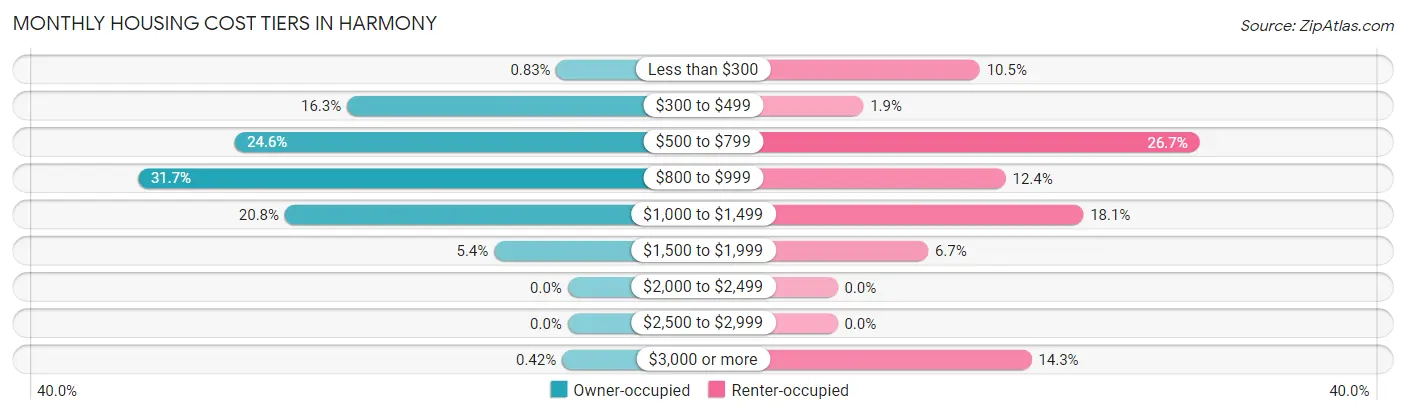
| Monthly Cost | Owner-occupied | Renter-occupied |
| Less than $300 | 2 (0.8%) | 11 (10.5%) |
| $300 to $499 | 39 (16.3%) | 2 (1.9%) |
| $500 to $799 | 59 (24.6%) | 28 (26.7%) |
| $800 to $999 | 76 (31.7%) | 13 (12.4%) |
| $1,000 to $1,499 | 50 (20.8%) | 19 (18.1%) |
| $1,500 to $1,999 | 13 (5.4%) | 7 (6.7%) |
| $2,000 to $2,499 | 0 (0.0%) | 0 (0.0%) |
| $2,500 to $2,999 | 0 (0.0%) | 0 (0.0%) |
| $3,000 or more | 1 (0.4%) | 15 (14.3%) |
| Total | 240 (100.0%) | 105 (100.0%) |
Physical Housing Characteristics in Harmony
Housing Structures in Harmony
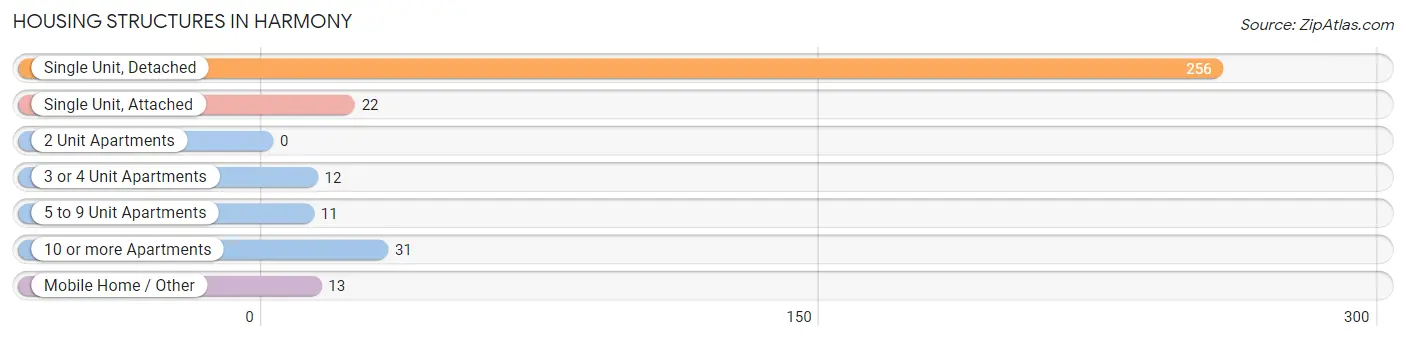
| Structure Type | # Housing Units | % Housing Units |
| Single Unit, Detached | 256 | 74.2% |
| Single Unit, Attached | 22 | 6.4% |
| 2 Unit Apartments | 0 | 0.0% |
| 3 or 4 Unit Apartments | 12 | 3.5% |
| 5 to 9 Unit Apartments | 11 | 3.2% |
| 10 or more Apartments | 31 | 9.0% |
| Mobile Home / Other | 13 | 3.8% |
| Total | 345 | 100.0% |
Housing Structures by Occupancy in Harmony
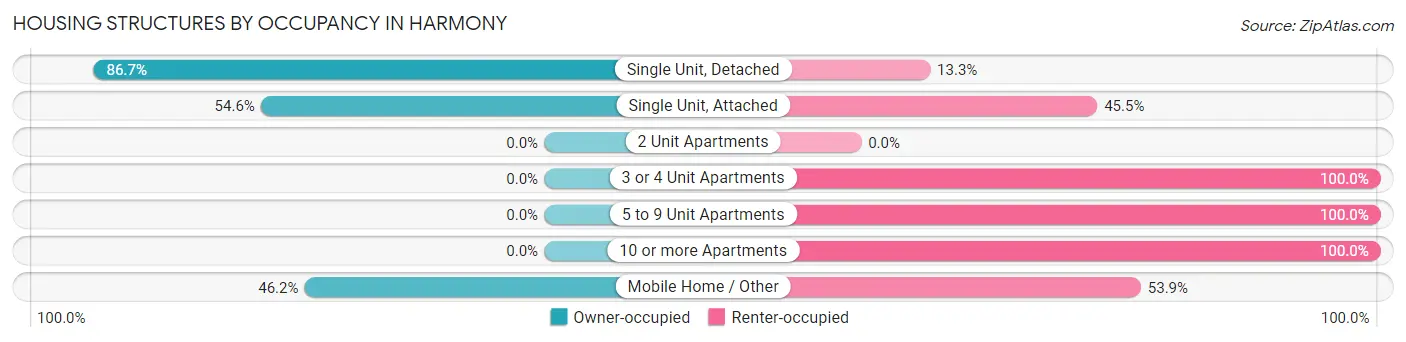
| Structure Type | Owner-occupied | Renter-occupied |
| Single Unit, Detached | 222 (86.7%) | 34 (13.3%) |
| Single Unit, Attached | 12 (54.5%) | 10 (45.5%) |
| 2 Unit Apartments | 0 (0.0%) | 0 (0.0%) |
| 3 or 4 Unit Apartments | 0 (0.0%) | 12 (100.0%) |
| 5 to 9 Unit Apartments | 0 (0.0%) | 11 (100.0%) |
| 10 or more Apartments | 0 (0.0%) | 31 (100.0%) |
| Mobile Home / Other | 6 (46.2%) | 7 (53.8%) |
| Total | 240 (69.6%) | 105 (30.4%) |
Housing Structures by Number of Rooms in Harmony
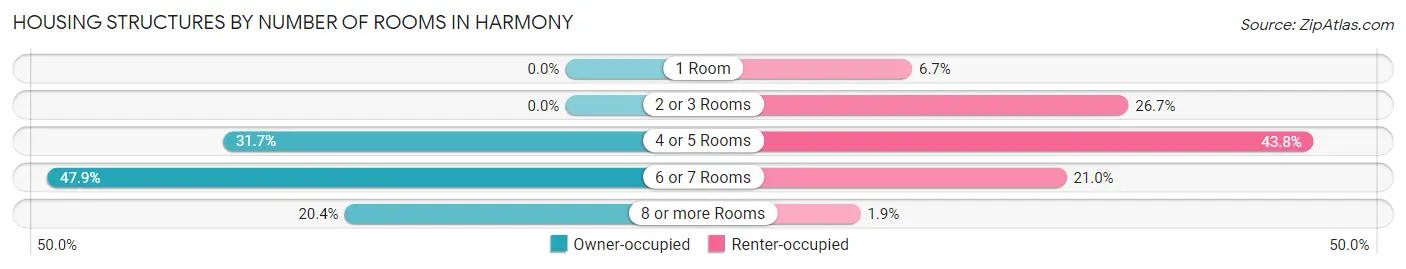
| Number of Rooms | Owner-occupied | Renter-occupied |
| 1 Room | 0 (0.0%) | 7 (6.7%) |
| 2 or 3 Rooms | 0 (0.0%) | 28 (26.7%) |
| 4 or 5 Rooms | 76 (31.7%) | 46 (43.8%) |
| 6 or 7 Rooms | 115 (47.9%) | 22 (20.9%) |
| 8 or more Rooms | 49 (20.4%) | 2 (1.9%) |
| Total | 240 (100.0%) | 105 (100.0%) |
Housing Structure by Heating Type in Harmony
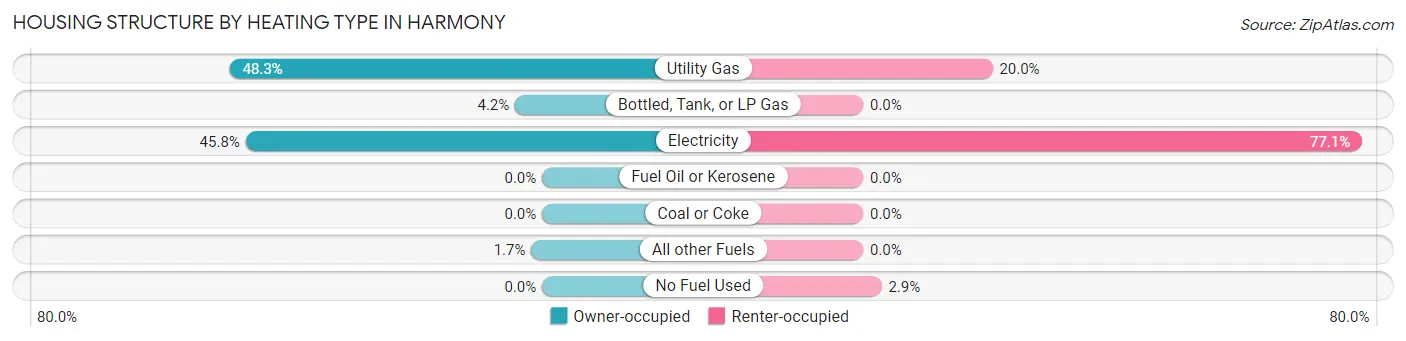
| Heating Type | Owner-occupied | Renter-occupied |
| Utility Gas | 116 (48.3%) | 21 (20.0%) |
| Bottled, Tank, or LP Gas | 10 (4.2%) | 0 (0.0%) |
| Electricity | 110 (45.8%) | 81 (77.1%) |
| Fuel Oil or Kerosene | 0 (0.0%) | 0 (0.0%) |
| Coal or Coke | 0 (0.0%) | 0 (0.0%) |
| All other Fuels | 4 (1.7%) | 0 (0.0%) |
| No Fuel Used | 0 (0.0%) | 3 (2.9%) |
| Total | 240 (100.0%) | 105 (100.0%) |
Household Vehicle Usage in Harmony
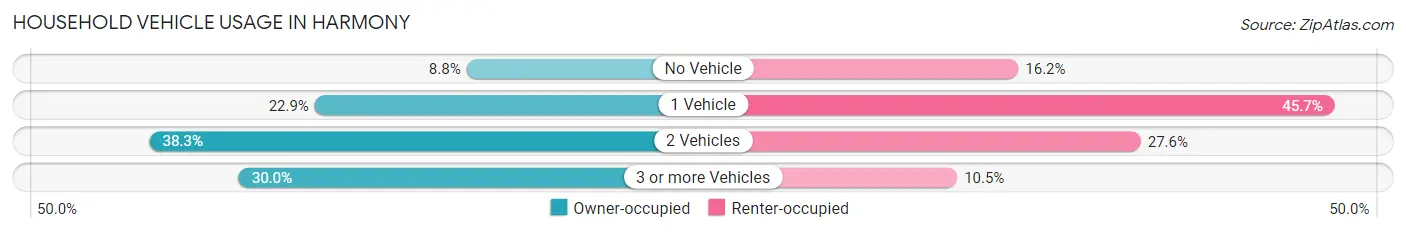
| Vehicles per Household | Owner-occupied | Renter-occupied |
| No Vehicle | 21 (8.7%) | 17 (16.2%) |
| 1 Vehicle | 55 (22.9%) | 48 (45.7%) |
| 2 Vehicles | 92 (38.3%) | 29 (27.6%) |
| 3 or more Vehicles | 72 (30.0%) | 11 (10.5%) |
| Total | 240 (100.0%) | 105 (100.0%) |
Real Estate & Mortgages in Harmony
Real Estate and Mortgage Overview in Harmony
| Characteristic | Without Mortgage | With Mortgage |
| Housing Units | 79 | 161 |
| Median Property Value | $123,800 | $110,400 |
| Median Household Income | - | - |
| Monthly Housing Costs | $490 | $1 |
| Real Estate Taxes | $569 | $0 |
Property Value by Mortgage Status in Harmony
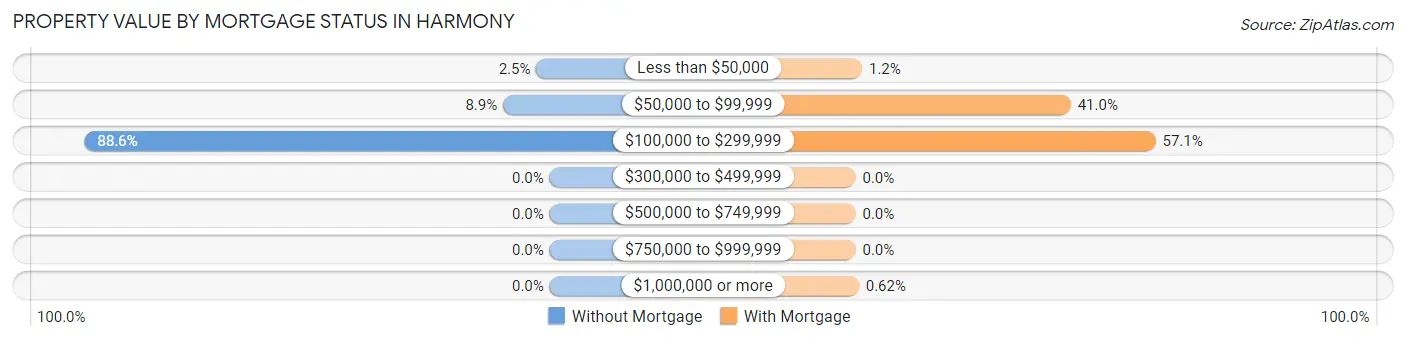
| Property Value | Without Mortgage | With Mortgage |
| Less than $50,000 | 2 (2.5%) | 2 (1.2%) |
| $50,000 to $99,999 | 7 (8.9%) | 66 (41.0%) |
| $100,000 to $299,999 | 70 (88.6%) | 92 (57.1%) |
| $300,000 to $499,999 | 0 (0.0%) | 0 (0.0%) |
| $500,000 to $749,999 | 0 (0.0%) | 0 (0.0%) |
| $750,000 to $999,999 | 0 (0.0%) | 0 (0.0%) |
| $1,000,000 or more | 0 (0.0%) | 1 (0.6%) |
| Total | 79 (100.0%) | 161 (100.0%) |
Household Income by Mortgage Status in Harmony
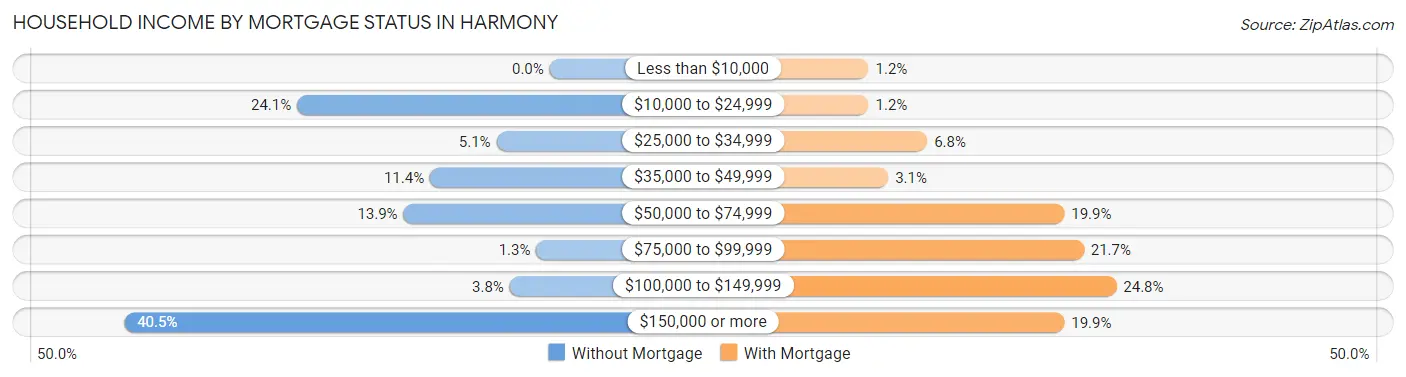
| Household Income | Without Mortgage | With Mortgage |
| Less than $10,000 | 0 (0.0%) | 2 (1.2%) |
| $10,000 to $24,999 | 19 (24.0%) | 2 (1.2%) |
| $25,000 to $34,999 | 4 (5.1%) | 11 (6.8%) |
| $35,000 to $49,999 | 9 (11.4%) | 5 (3.1%) |
| $50,000 to $74,999 | 11 (13.9%) | 32 (19.9%) |
| $75,000 to $99,999 | 1 (1.3%) | 35 (21.7%) |
| $100,000 to $149,999 | 3 (3.8%) | 40 (24.8%) |
| $150,000 or more | 32 (40.5%) | 32 (19.9%) |
| Total | 79 (100.0%) | 161 (100.0%) |
Property Value to Household Income Ratio in Harmony
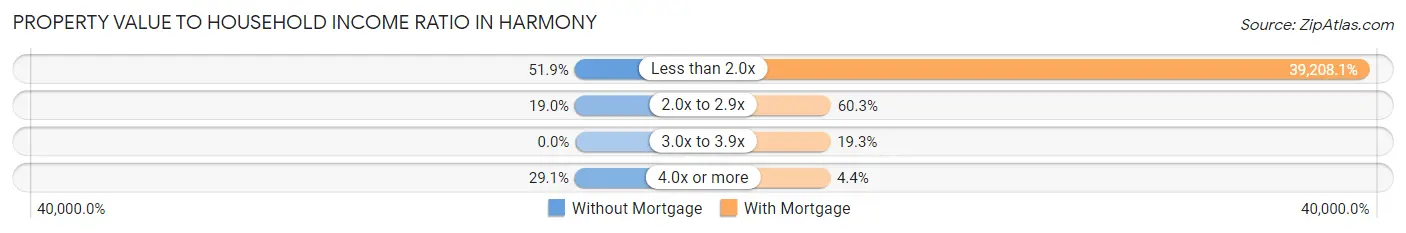
| Value-to-Income Ratio | Without Mortgage | With Mortgage |
| Less than 2.0x | 41 (51.9%) | 63,125 (39,208.1%) |
| 2.0x to 2.9x | 15 (19.0%) | 97 (60.3%) |
| 3.0x to 3.9x | 0 (0.0%) | 31 (19.3%) |
| 4.0x or more | 23 (29.1%) | 7 (4.3%) |
| Total | 79 (100.0%) | 161 (100.0%) |
Real Estate Taxes by Mortgage Status in Harmony
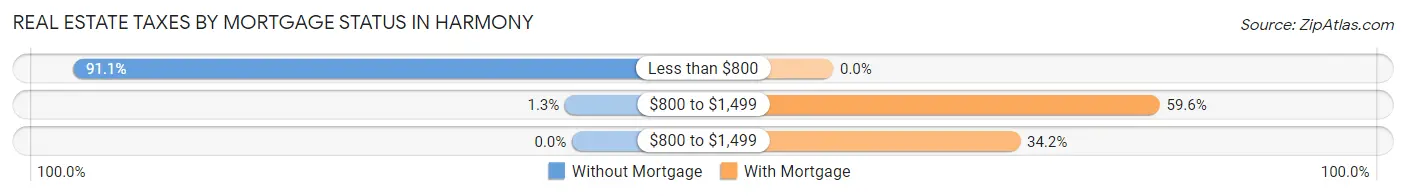
| Property Taxes | Without Mortgage | With Mortgage |
| Less than $800 | 72 (91.1%) | 0 (0.0%) |
| $800 to $1,499 | 1 (1.3%) | 96 (59.6%) |
| $800 to $1,499 | 0 (0.0%) | 55 (34.2%) |
| Total | 79 (100.0%) | 161 (100.0%) |
Health & Disability in Harmony
Health Insurance Coverage by Age in Harmony
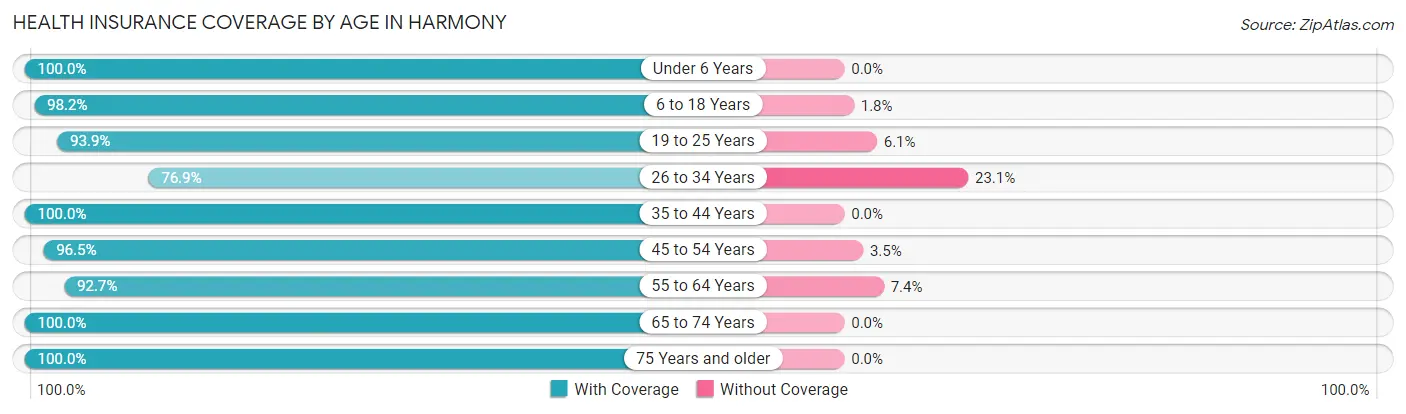
| Age Bracket | With Coverage | Without Coverage |
| Under 6 Years | 62 (100.0%) | 0 (0.0%) |
| 6 to 18 Years | 111 (98.2%) | 2 (1.8%) |
| 19 to 25 Years | 31 (93.9%) | 2 (6.1%) |
| 26 to 34 Years | 50 (76.9%) | 15 (23.1%) |
| 35 to 44 Years | 106 (100.0%) | 0 (0.0%) |
| 45 to 54 Years | 111 (96.5%) | 4 (3.5%) |
| 55 to 64 Years | 63 (92.6%) | 5 (7.3%) |
| 65 to 74 Years | 64 (100.0%) | 0 (0.0%) |
| 75 Years and older | 107 (100.0%) | 0 (0.0%) |
| Total | 705 (96.2%) | 28 (3.8%) |
Health Insurance Coverage by Citizenship Status in Harmony
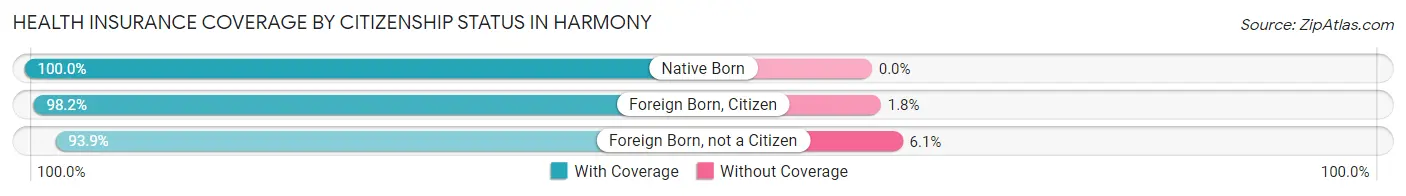
| Citizenship Status | With Coverage | Without Coverage |
| Native Born | 62 (100.0%) | 0 (0.0%) |
| Foreign Born, Citizen | 111 (98.2%) | 2 (1.8%) |
| Foreign Born, not a Citizen | 31 (93.9%) | 2 (6.1%) |
Health Insurance Coverage by Household Income in Harmony
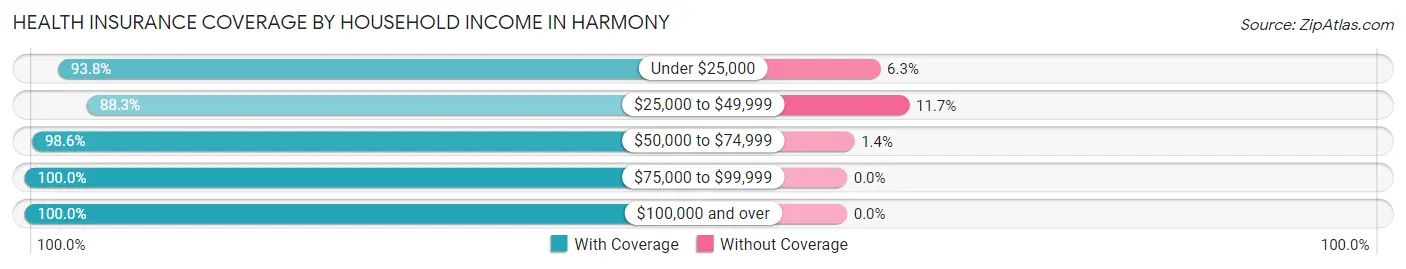
| Household Income | With Coverage | Without Coverage |
| Under $25,000 | 75 (93.8%) | 5 (6.2%) |
| $25,000 to $49,999 | 159 (88.3%) | 21 (11.7%) |
| $50,000 to $74,999 | 142 (98.6%) | 2 (1.4%) |
| $75,000 to $99,999 | 180 (100.0%) | 0 (0.0%) |
| $100,000 and over | 149 (100.0%) | 0 (0.0%) |
Public vs Private Health Insurance Coverage by Age in Harmony
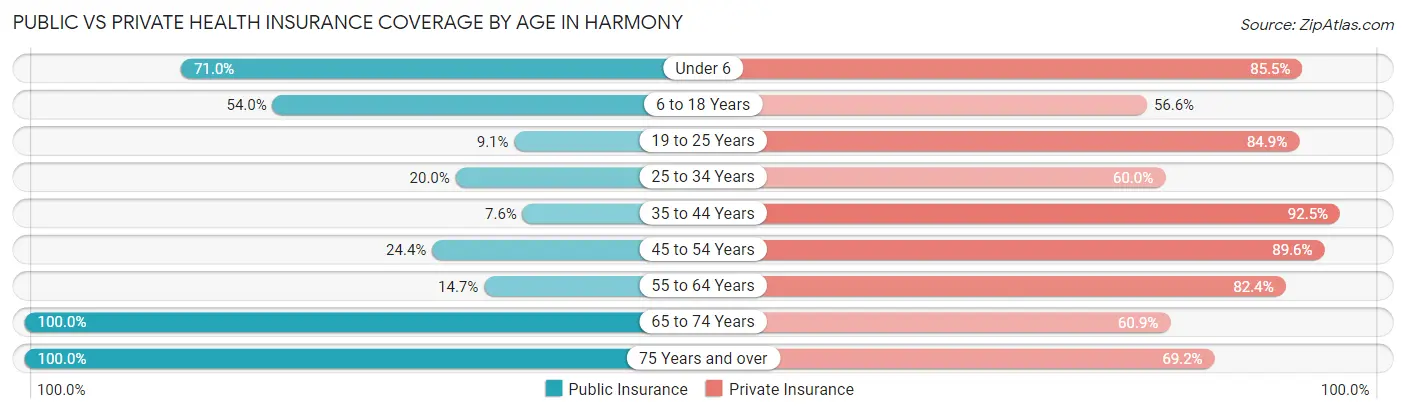
| Age Bracket | Public Insurance | Private Insurance |
| Under 6 | 44 (71.0%) | 53 (85.5%) |
| 6 to 18 Years | 61 (54.0%) | 64 (56.6%) |
| 19 to 25 Years | 3 (9.1%) | 28 (84.9%) |
| 25 to 34 Years | 13 (20.0%) | 39 (60.0%) |
| 35 to 44 Years | 8 (7.5%) | 98 (92.4%) |
| 45 to 54 Years | 28 (24.3%) | 103 (89.6%) |
| 55 to 64 Years | 10 (14.7%) | 56 (82.4%) |
| 65 to 74 Years | 64 (100.0%) | 39 (60.9%) |
| 75 Years and over | 107 (100.0%) | 74 (69.2%) |
| Total | 338 (46.1%) | 554 (75.6%) |
Disability Status by Sex by Age in Harmony
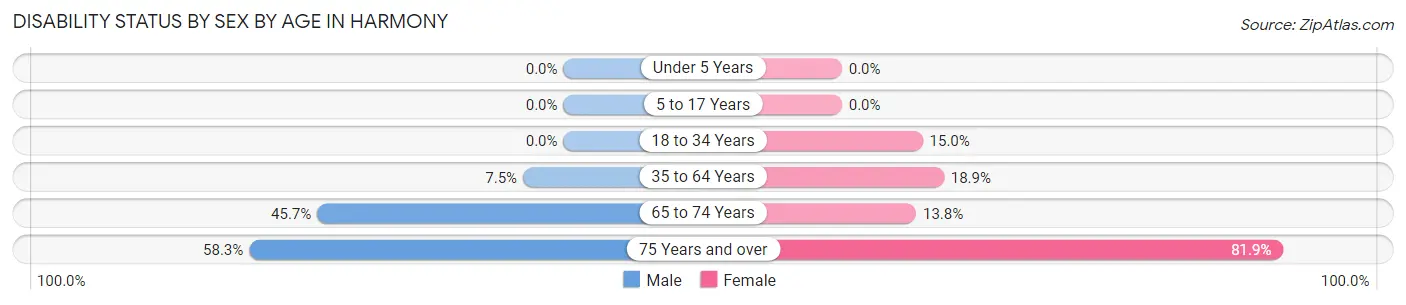
| Age Bracket | Male | Female |
| Under 5 Years | 0 (0.0%) | 0 (0.0%) |
| 5 to 17 Years | 0 (0.0%) | 0 (0.0%) |
| 18 to 34 Years | 0 (0.0%) | 12 (15.0%) |
| 35 to 64 Years | 9 (7.5%) | 32 (18.9%) |
| 65 to 74 Years | 16 (45.7%) | 4 (13.8%) |
| 75 Years and over | 14 (58.3%) | 68 (81.9%) |
Disability Class by Sex by Age in Harmony
Disability Class: Hearing Difficulty
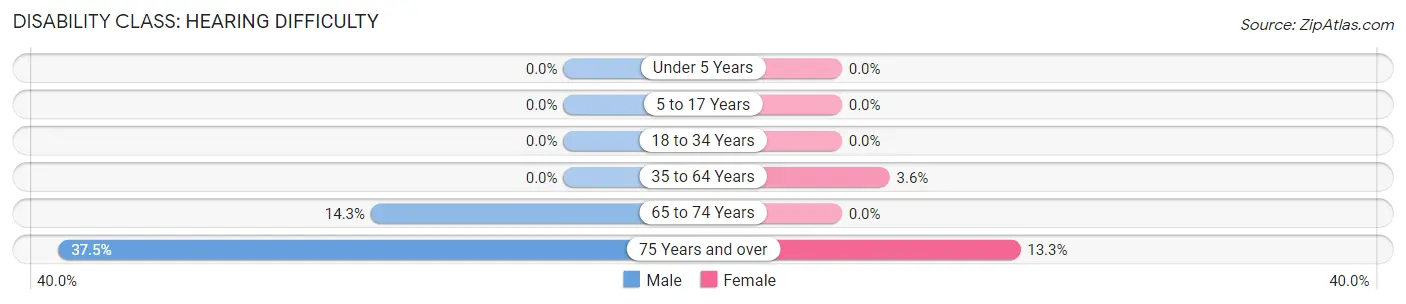
| Age Bracket | Male | Female |
| Under 5 Years | 0 (0.0%) | 0 (0.0%) |
| 5 to 17 Years | 0 (0.0%) | 0 (0.0%) |
| 18 to 34 Years | 0 (0.0%) | 0 (0.0%) |
| 35 to 64 Years | 0 (0.0%) | 6 (3.5%) |
| 65 to 74 Years | 5 (14.3%) | 0 (0.0%) |
| 75 Years and over | 9 (37.5%) | 11 (13.3%) |
Disability Class: Vision Difficulty
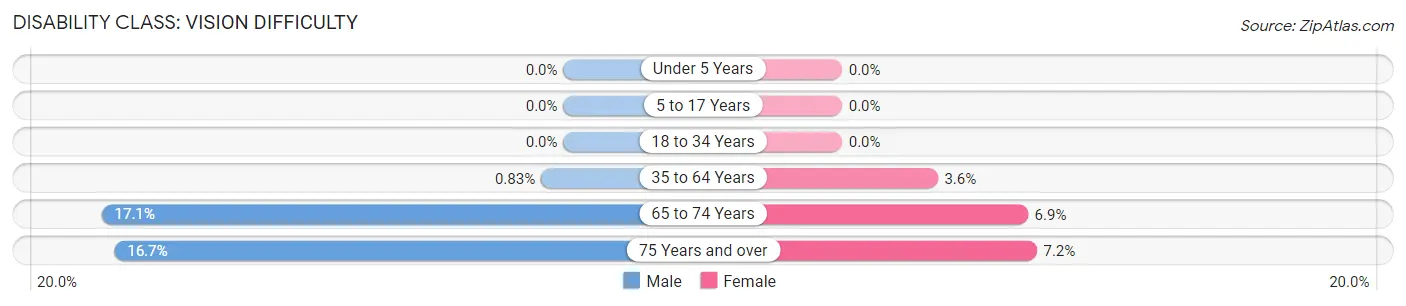
| Age Bracket | Male | Female |
| Under 5 Years | 0 (0.0%) | 0 (0.0%) |
| 5 to 17 Years | 0 (0.0%) | 0 (0.0%) |
| 18 to 34 Years | 0 (0.0%) | 0 (0.0%) |
| 35 to 64 Years | 1 (0.8%) | 6 (3.5%) |
| 65 to 74 Years | 6 (17.1%) | 2 (6.9%) |
| 75 Years and over | 4 (16.7%) | 6 (7.2%) |
Disability Class: Cognitive Difficulty
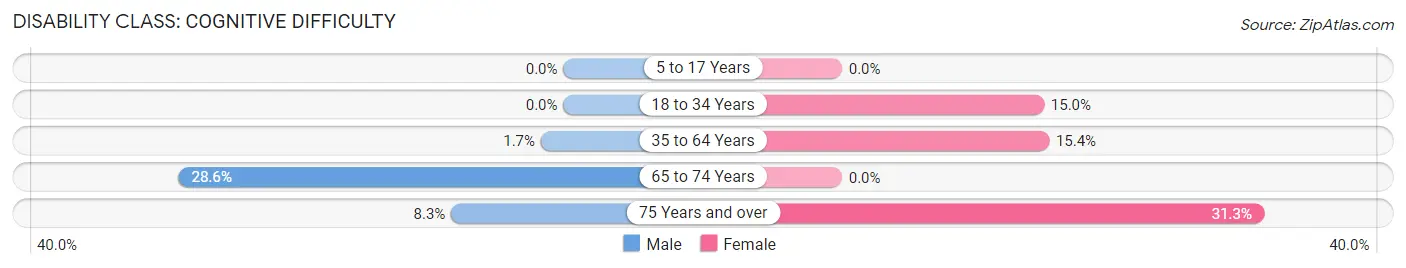
| Age Bracket | Male | Female |
| 5 to 17 Years | 0 (0.0%) | 0 (0.0%) |
| 18 to 34 Years | 0 (0.0%) | 12 (15.0%) |
| 35 to 64 Years | 2 (1.7%) | 26 (15.4%) |
| 65 to 74 Years | 10 (28.6%) | 0 (0.0%) |
| 75 Years and over | 2 (8.3%) | 26 (31.3%) |
Disability Class: Ambulatory Difficulty
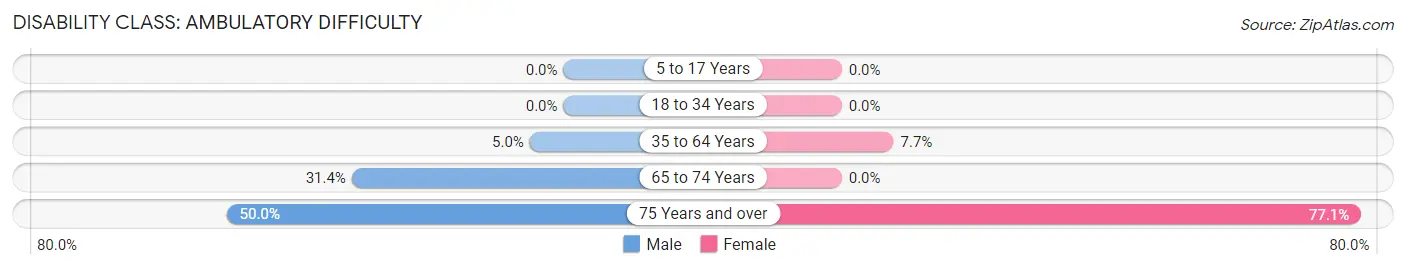
| Age Bracket | Male | Female |
| 5 to 17 Years | 0 (0.0%) | 0 (0.0%) |
| 18 to 34 Years | 0 (0.0%) | 0 (0.0%) |
| 35 to 64 Years | 6 (5.0%) | 13 (7.7%) |
| 65 to 74 Years | 11 (31.4%) | 0 (0.0%) |
| 75 Years and over | 12 (50.0%) | 64 (77.1%) |
Disability Class: Self-Care Difficulty
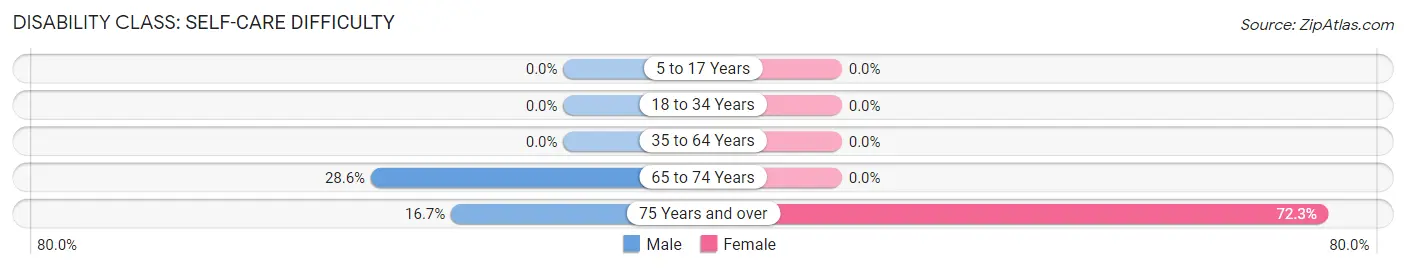
| Age Bracket | Male | Female |
| 5 to 17 Years | 0 (0.0%) | 0 (0.0%) |
| 18 to 34 Years | 0 (0.0%) | 0 (0.0%) |
| 35 to 64 Years | 0 (0.0%) | 0 (0.0%) |
| 65 to 74 Years | 10 (28.6%) | 0 (0.0%) |
| 75 Years and over | 4 (16.7%) | 60 (72.3%) |
Technology Access in Harmony
Computing Device Access in Harmony
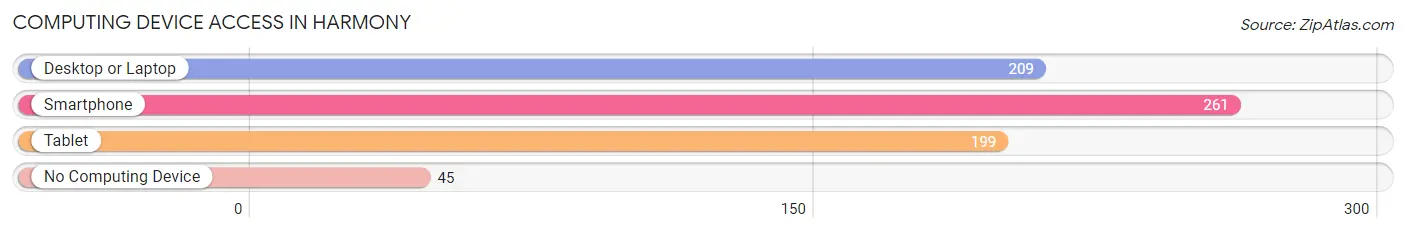
| Device Type | # Households | % Households |
| Desktop or Laptop | 209 | 60.6% |
| Smartphone | 261 | 75.6% |
| Tablet | 199 | 57.7% |
| No Computing Device | 45 | 13.0% |
| Total | 345 | 100.0% |
Internet Access in Harmony
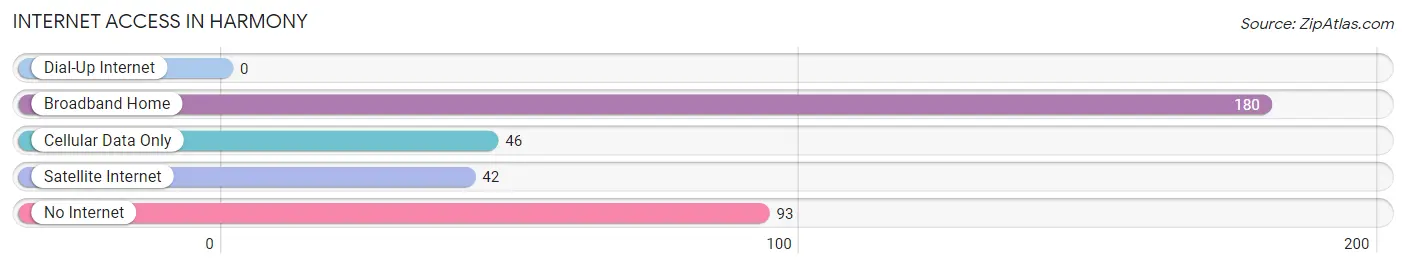
| Internet Type | # Households | % Households |
| Dial-Up Internet | 0 | 0.0% |
| Broadband Home | 180 | 52.2% |
| Cellular Data Only | 46 | 13.3% |
| Satellite Internet | 42 | 12.2% |
| No Internet | 93 | 27.0% |
| Total | 345 | 100.0% |
Harmony Summary
Harmony is a small town located in the state of Indiana in the United States. It is situated in the southwestern part of the state, in the county of Posey. The town has a population of approximately 1,000 people, and is located on the banks of the Wabash River.
History
Harmony was founded in 1814 by a group of settlers from Kentucky. The town was named after the harmony that the settlers found in the area. The settlers were attracted to the area due to its fertile soil and abundant natural resources. The town quickly grew and became a thriving agricultural community.
In 1818, the first school was established in Harmony. The school was a one-room schoolhouse, and it served as the primary educational institution for the town until the early 1900s.
In 1820, the first church was built in Harmony. The church was a Methodist church, and it served as the primary religious institution for the town until the early 1900s.
In 1821, the first post office was established in Harmony. The post office served as the primary communication center for the town until the early 1900s.
In 1822, the first newspaper was established in Harmony. The newspaper was called the Harmony Herald, and it served as the primary source of news for the town until the early 1900s.
In 1823, the first bank was established in Harmony. The bank served as the primary financial institution for the town until the early 1900s.
In 1824, the first railroad was built in Harmony. The railroad connected the town to the larger cities of Evansville and Terre Haute.
In 1825, the first hotel was built in Harmony. The hotel served as the primary lodging facility for the town until the early 1900s.
In 1826, the first library was established in Harmony. The library served as the primary source of books and other reading materials for the town until the early 1900s.
In 1827, the first newspaper was established in Harmony. The newspaper was called the Harmony Herald, and it served as the primary source of news for the town until the early 1900s.
In 1828, the first fire department was established in Harmony. The fire department served as the primary emergency response organization for the town until the early 1900s.
In 1829, the first telephone was installed in Harmony. The telephone served as the primary communication device for the town until the early 1900s.
In 1831, the first hospital was established in Harmony. The hospital served as the primary medical facility for the town until the early 1900s.
Geography
Harmony is located in the southwestern part of the state of Indiana, in the county of Posey. The town is situated on the banks of the Wabash River. The town is surrounded by rolling hills and lush farmland. The town is located approximately 30 miles from the city of Evansville and approximately 40 miles from the city of Terre Haute.
Economy
Harmony’s economy is primarily based on agriculture. The town is home to several farms, which produce a variety of crops, including corn, soybeans, wheat, and hay. The town also has several small businesses, including a grocery store, a hardware store, and a restaurant.
Demographics
As of the 2010 census, the population of Harmony was 1,000 people. The racial makeup of the town was 97.2% White, 0.7% African American, 0.3% Native American, 0.2% Asian, 0.1% Pacific Islander, 0.7% from other races, and 0.9% from two or more races. Hispanic or Latino of any race were 1.3% of the population.
The median household income in Harmony was $37,500, and the median family income was $45,000. The per capita income for the town was $17,000. About 11.2% of families and 14.2% of the population were below the poverty line, including 18.2% of those under age 18 and 8.3% of those age 65 or over.
Common Questions
What is Per Capita Income in Harmony?
Per Capita income in Harmony is $34,916.
What is the Median Family Income in Harmony?
Median Family Income in Harmony is $68,500.
What is the Median Household income in Harmony?
Median Household Income in Harmony is $59,375.
What is Income or Wage Gap in Harmony?
Income or Wage Gap in Harmony is 35.9%.
Women in Harmony earn 64.1 cents for every dollar earned by a man.
What is Inequality or Gini Index in Harmony?
Inequality or Gini Index in Harmony is 0.37.
What is the Total Population of Harmony?
Total Population of Harmony is 737.
What is the Total Male Population of Harmony?
Total Male Population of Harmony is 329.
What is the Total Female Population of Harmony?
Total Female Population of Harmony is 408.
What is the Ratio of Males per 100 Females in Harmony?
There are 80.64 Males per 100 Females in Harmony.
What is the Ratio of Females per 100 Males in Harmony?
There are 124.01 Females per 100 Males in Harmony.
What is the Median Population Age in Harmony?
Median Population Age in Harmony is 42.4 Years.
What is the Average Family Size in Harmony
Average Family Size in Harmony is 2.6 People.
What is the Average Household Size in Harmony
Average Household Size in Harmony is 2.1 People.
How Large is the Labor Force in Harmony?
There are 338 People in the Labor Forcein in Harmony.
What is the Percentage of People in the Labor Force in Harmony?
58.1% of People are in the Labor Force in Harmony.