Mountain View, HI Map & Demographics
Mountain View Map
Mountain View Overview
$23,168
PER CAPITA INCOME
$57,159
AVG FAMILY INCOME
$60,057
AVG HOUSEHOLD INCOME
60.0%
WAGE / INCOME GAP [ % ]
40.0¢/ $1
WAGE / INCOME GAP [ $ ]
0.41
INEQUALITY / GINI INDEX
3,627
TOTAL POPULATION
1,560
MALE POPULATION
2,067
FEMALE POPULATION
75.47
MALES / 100 FEMALES
132.50
FEMALES / 100 MALES
37.2
MEDIAN AGE
3.9
AVG FAMILY SIZE
3.1
AVG HOUSEHOLD SIZE
1,435
LABOR FORCE [ PEOPLE ]
52.5%
PERCENT IN LABOR FORCE
8.2%
UNEMPLOYMENT RATE
Mountain View Zip Codes
Mountain View Area Codes
Income in Mountain View
Income Overview in Mountain View
Per Capita Income in Mountain View is $23,168, while median incomes of families and households are $57,159 and $60,057 respectively.
| Characteristic | Number | Measure |
| Per Capita Income | 3,627 | $23,168 |
| Median Family Income | 798 | $57,159 |
| Mean Family Income | 798 | $79,740 |
| Median Household Income | 1,150 | $60,057 |
| Mean Household Income | 1,150 | $73,901 |
| Income Deficit | 798 | $0 |
| Wage / Income Gap (%) | 3,627 | 60.00% |
| Wage / Income Gap ($) | 3,627 | 40.00¢ per $1 |
| Gini / Inequality Index | 3,627 | 0.41 |
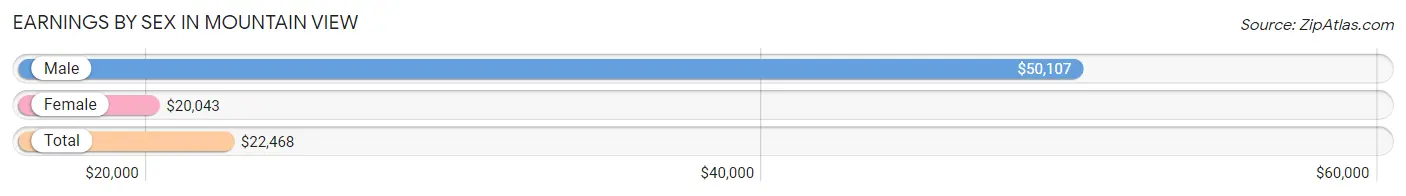
Earnings by Sex in Mountain View
Average Earnings in Mountain View are $22,468, $50,107 for men and $20,043 for women, a difference of 60.0%.
| Sex | Number | Average Earnings |
| Male | 669 (45.2%) | $50,107 |
| Female | 810 (54.8%) | $20,043 |
| Total | 1,479 (100.0%) | $22,468 |
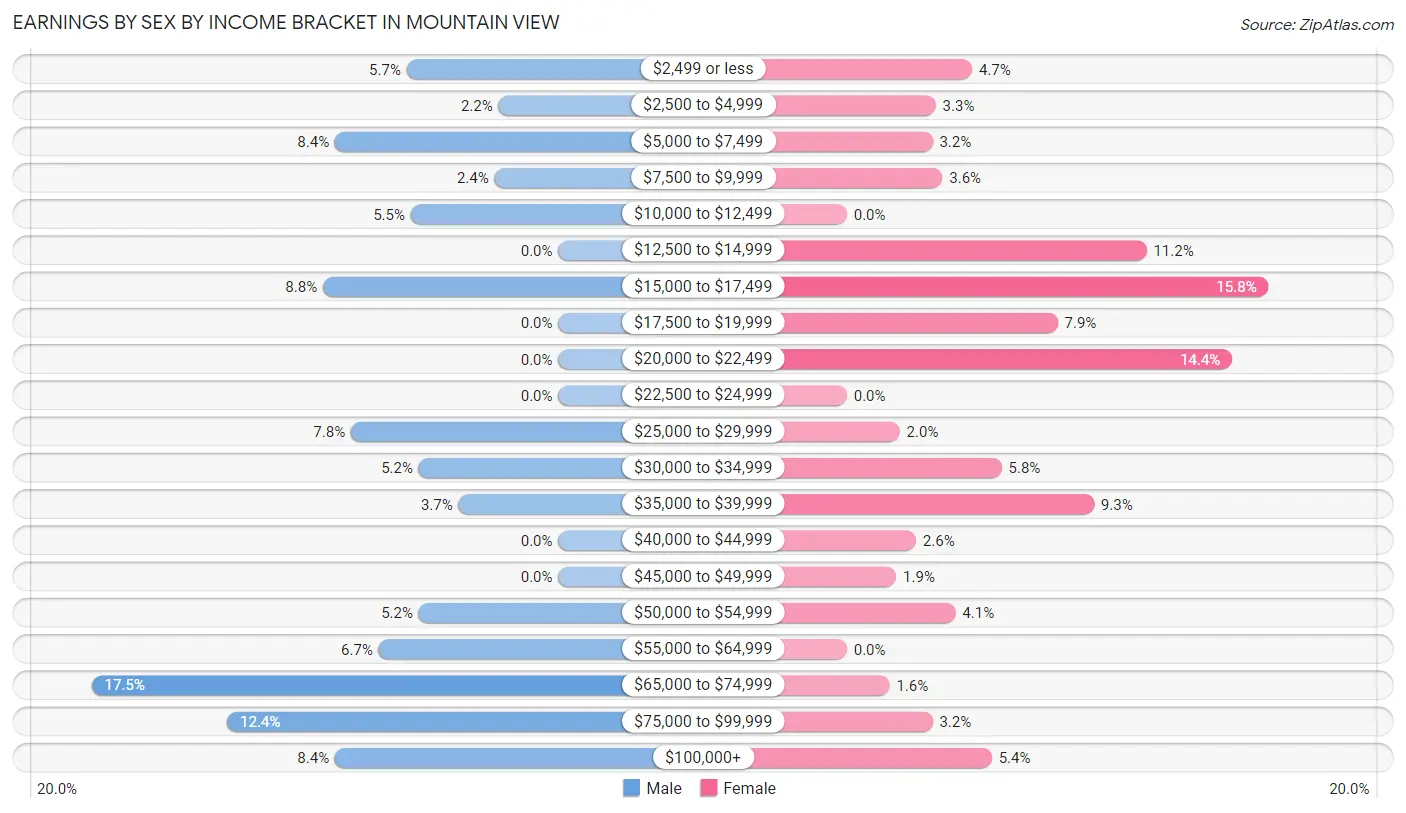
Earnings by Sex by Income Bracket in Mountain View
The most common earnings brackets in Mountain View are $65,000 to $74,999 for men (117 | 17.5%) and $15,000 to $17,499 for women (128 | 15.8%).
| Income | Male | Female |
| $2,499 or less | 38 (5.7%) | 38 (4.7%) |
| $2,500 to $4,999 | 15 (2.2%) | 27 (3.3%) |
| $5,000 to $7,499 | 56 (8.4%) | 26 (3.2%) |
| $7,500 to $9,999 | 16 (2.4%) | 29 (3.6%) |
| $10,000 to $12,499 | 37 (5.5%) | 0 (0.0%) |
| $12,500 to $14,999 | 0 (0.0%) | 91 (11.2%) |
| $15,000 to $17,499 | 59 (8.8%) | 128 (15.8%) |
| $17,500 to $19,999 | 0 (0.0%) | 64 (7.9%) |
| $20,000 to $22,499 | 0 (0.0%) | 117 (14.4%) |
| $22,500 to $24,999 | 0 (0.0%) | 0 (0.0%) |
| $25,000 to $29,999 | 52 (7.8%) | 16 (2.0%) |
| $30,000 to $34,999 | 35 (5.2%) | 47 (5.8%) |
| $35,000 to $39,999 | 25 (3.7%) | 75 (9.3%) |
| $40,000 to $44,999 | 0 (0.0%) | 21 (2.6%) |
| $45,000 to $49,999 | 0 (0.0%) | 15 (1.8%) |
| $50,000 to $54,999 | 35 (5.2%) | 33 (4.1%) |
| $55,000 to $64,999 | 45 (6.7%) | 0 (0.0%) |
| $65,000 to $74,999 | 117 (17.5%) | 13 (1.6%) |
| $75,000 to $99,999 | 83 (12.4%) | 26 (3.2%) |
| $100,000+ | 56 (8.4%) | 44 (5.4%) |
| Total | 669 (100.0%) | 810 (100.0%) |
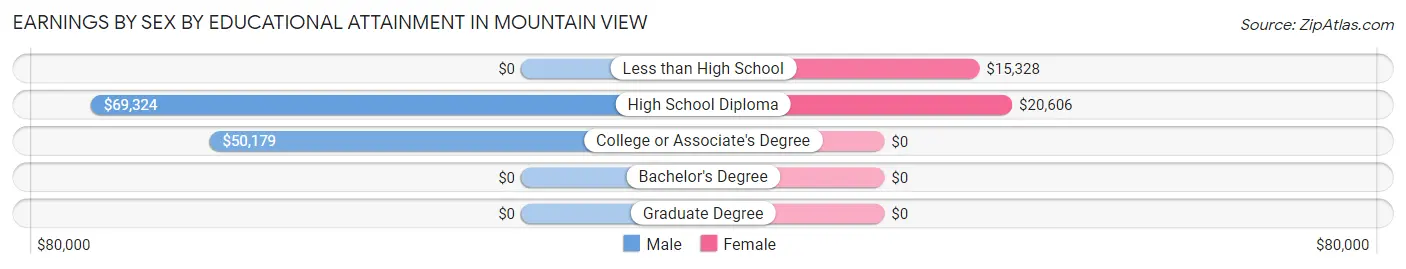
Earnings by Sex by Educational Attainment in Mountain View
Average earnings in Mountain View are $62,586 for men and $18,320 for women, a difference of 70.7%. Men with an educational attainment of high school diploma enjoy the highest average annual earnings of $69,324, while those with college or associate's degree education earn the least with $50,179. Women with an educational attainment of high school diploma earn the most with the average annual earnings of $20,606, while those with less than high school education have the smallest earnings of $15,328.
| Educational Attainment | Male Income | Female Income |
| Less than High School | - | - |
| High School Diploma | $69,324 | $20,606 |
| College or Associate's Degree | $50,179 | $0 |
| Bachelor's Degree | - | - |
| Graduate Degree | - | - |
| Total | $62,586 | $18,320 |
Family Income in Mountain View
Family Income Brackets in Mountain View
According to the Mountain View family income data, there are 172 families falling into the $100,000 to $149,999 income range, which is the most common income bracket and makes up 21.5% of all families. Conversely, the $200,000+ income bracket is the least frequent group with only 26 families (3.3%) belonging to this category.
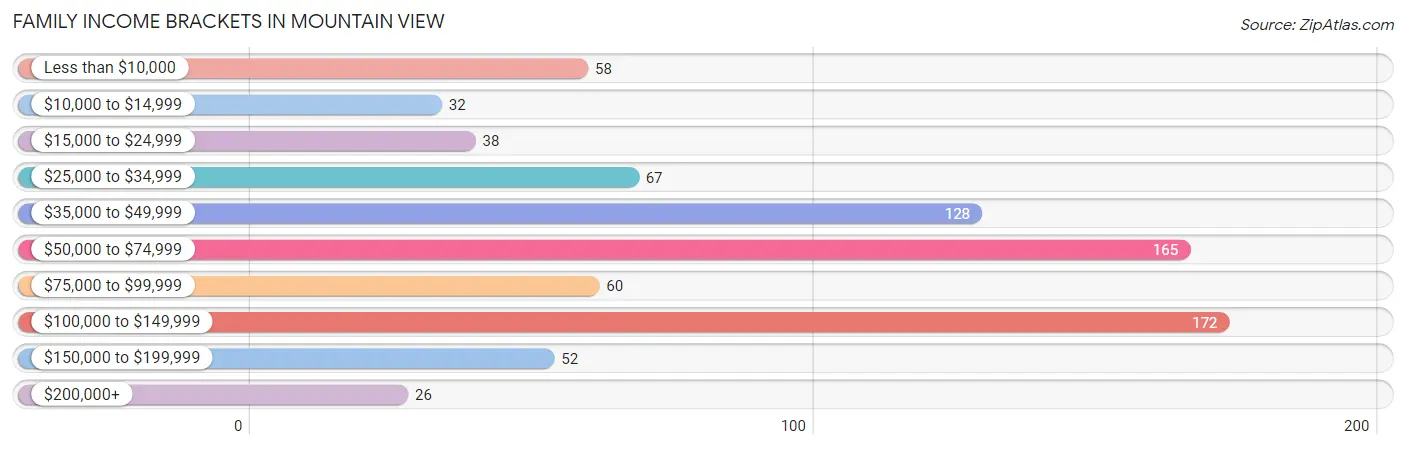
| Income Bracket | # Families | % Families |
| Less than $10,000 | 58 | 7.3% |
| $10,000 to $14,999 | 32 | 4.0% |
| $15,000 to $24,999 | 38 | 4.8% |
| $25,000 to $34,999 | 67 | 8.4% |
| $35,000 to $49,999 | 128 | 16.0% |
| $50,000 to $74,999 | 165 | 20.7% |
| $75,000 to $99,999 | 60 | 7.5% |
| $100,000 to $149,999 | 172 | 21.6% |
| $150,000 to $199,999 | 52 | 6.5% |
| $200,000+ | 26 | 3.3% |
Family Income by Famaliy Size in Mountain View
2-person families (289 | 36.2%) account for the highest median family income in Mountain View with $76,367 per family, while 2-person families (289 | 36.2%) have the highest median income of $38,184 per family member.
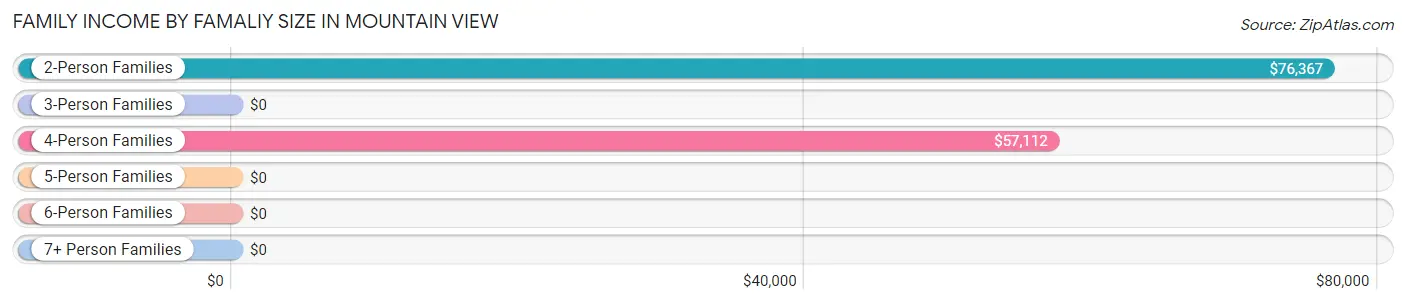
| Income Bracket | # Families | Median Income |
| 2-Person Families | 289 (36.2%) | $76,367 |
| 3-Person Families | 54 (6.8%) | $0 |
| 4-Person Families | 219 (27.4%) | $57,112 |
| 5-Person Families | 103 (12.9%) | $0 |
| 6-Person Families | 107 (13.4%) | $0 |
| 7+ Person Families | 26 (3.3%) | $0 |
| Total | 798 (100.0%) | $57,159 |
Family Income by Number of Earners in Mountain View
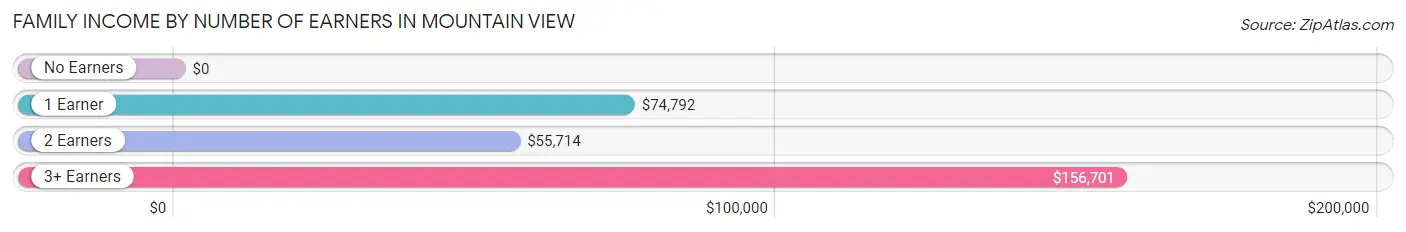
| Number of Earners | # Families | Median Income |
| No Earners | 111 (13.9%) | $0 |
| 1 Earner | 306 (38.4%) | $74,792 |
| 2 Earners | 274 (34.3%) | $55,714 |
| 3+ Earners | 107 (13.4%) | $156,701 |
| Total | 798 (100.0%) | $57,159 |
Household Income in Mountain View
Household Income Brackets in Mountain View
With 238 households falling in the category, the $100,000 to $149,999 income range is the most frequent in Mountain View, accounting for 20.7% of all households. In contrast, only 26 households (2.3%) fall into the $200,000+ income bracket, making it the least populous group.
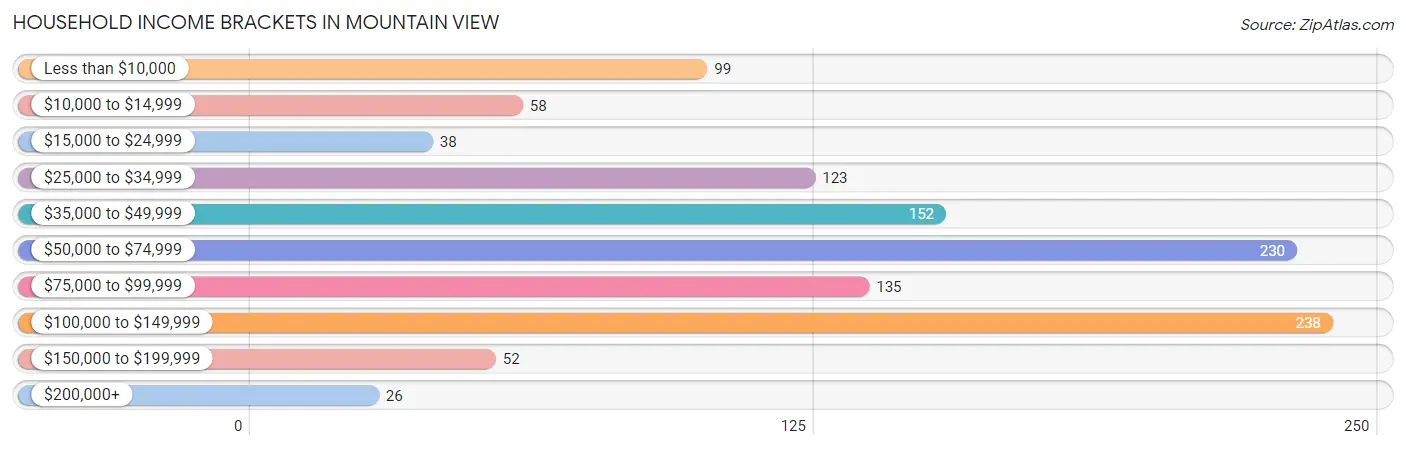
| Income Bracket | # Households | % Households |
| Less than $10,000 | 99 | 8.6% |
| $10,000 to $14,999 | 58 | 5.0% |
| $15,000 to $24,999 | 38 | 3.3% |
| $25,000 to $34,999 | 123 | 10.7% |
| $35,000 to $49,999 | 152 | 13.2% |
| $50,000 to $74,999 | 230 | 20.0% |
| $75,000 to $99,999 | 135 | 11.7% |
| $100,000 to $149,999 | 238 | 20.7% |
| $150,000 to $199,999 | 52 | 4.5% |
| $200,000+ | 26 | 2.3% |
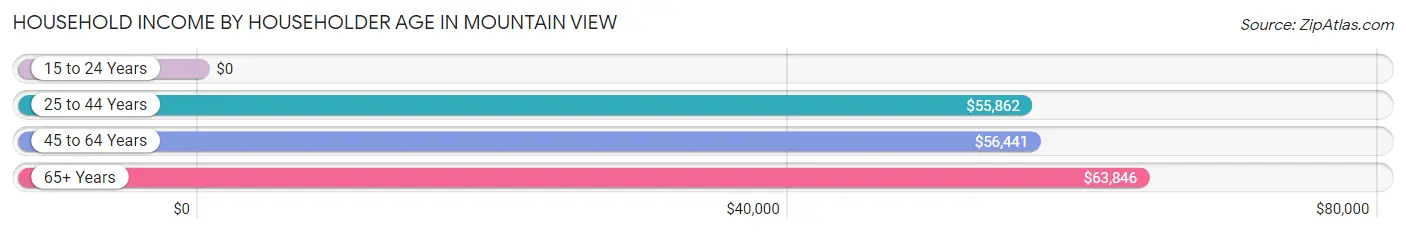
Household Income by Householder Age in Mountain View
The median household income in Mountain View is $60,057, with the highest median household income of $63,846 found in the 65+ years age bracket for the primary householder. A total of 340 households (29.6%) fall into this category. Meanwhile, the 15 to 24 years age bracket for the primary householder has the lowest median household income of $0, with 34 households (3.0%) in this group.
| Income Bracket | # Households | Median Income |
| 15 to 24 Years | 34 (3.0%) | $0 |
| 25 to 44 Years | 374 (32.5%) | $55,862 |
| 45 to 64 Years | 402 (35.0%) | $56,441 |
| 65+ Years | 340 (29.6%) | $63,846 |
| Total | 1,150 (100.0%) | $60,057 |
Poverty in Mountain View
Income Below Poverty by Sex and Age in Mountain View
With 23.9% poverty level for males and 25.9% for females among the residents of Mountain View, under 5 year old males and 15 year old females are the most vulnerable to poverty, with 64 males (50.8%) and 34 females (100.0%) in their respective age groups living below the poverty level.
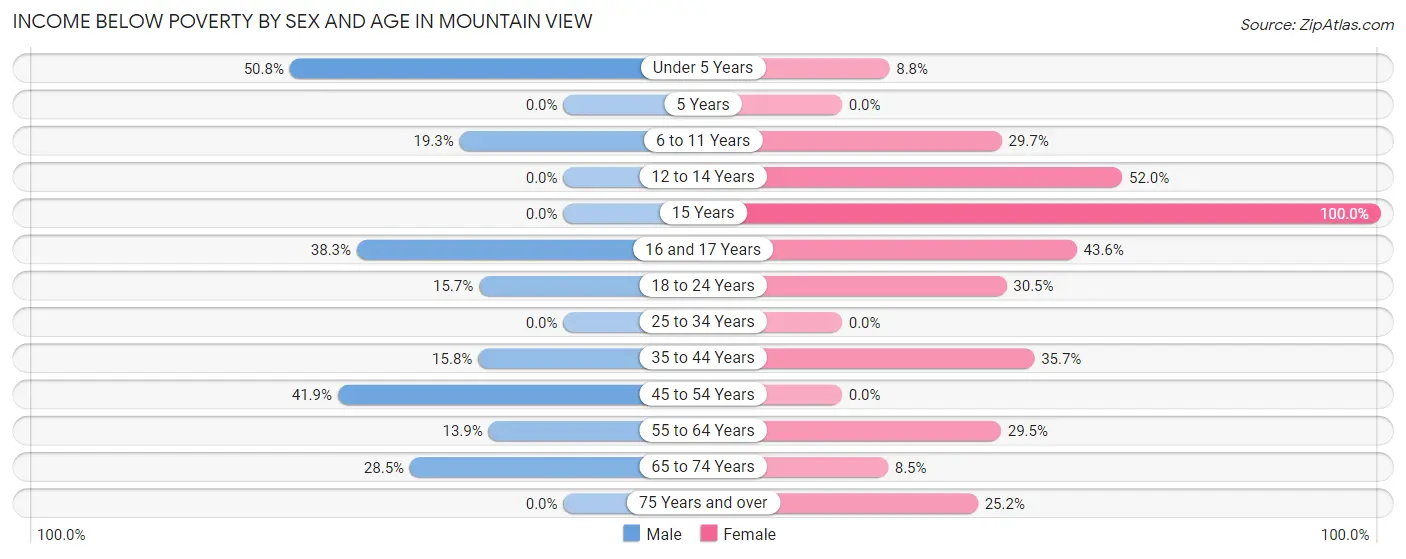
| Age Bracket | Male | Female |
| Under 5 Years | 64 (50.8%) | 18 (8.8%) |
| 5 Years | 0 (0.0%) | 0 (0.0%) |
| 6 to 11 Years | 21 (19.3%) | 67 (29.6%) |
| 12 to 14 Years | 0 (0.0%) | 64 (52.0%) |
| 15 Years | 0 (0.0%) | 34 (100.0%) |
| 16 and 17 Years | 23 (38.3%) | 68 (43.6%) |
| 18 to 24 Years | 41 (15.7%) | 73 (30.5%) |
| 25 to 34 Years | 0 (0.0%) | 0 (0.0%) |
| 35 to 44 Years | 43 (15.8%) | 105 (35.7%) |
| 45 to 54 Years | 121 (41.9%) | 0 (0.0%) |
| 55 to 64 Years | 15 (13.9%) | 62 (29.5%) |
| 65 to 74 Years | 45 (28.5%) | 17 (8.5%) |
| 75 Years and over | 0 (0.0%) | 28 (25.2%) |
| Total | 373 (23.9%) | 536 (25.9%) |
Income Above Poverty by Sex and Age in Mountain View
According to the poverty statistics in Mountain View, males aged 5 years and females aged 25 to 34 years are the age groups that are most secure financially, with 100.0% of males and 100.0% of females in these age groups living above the poverty line.
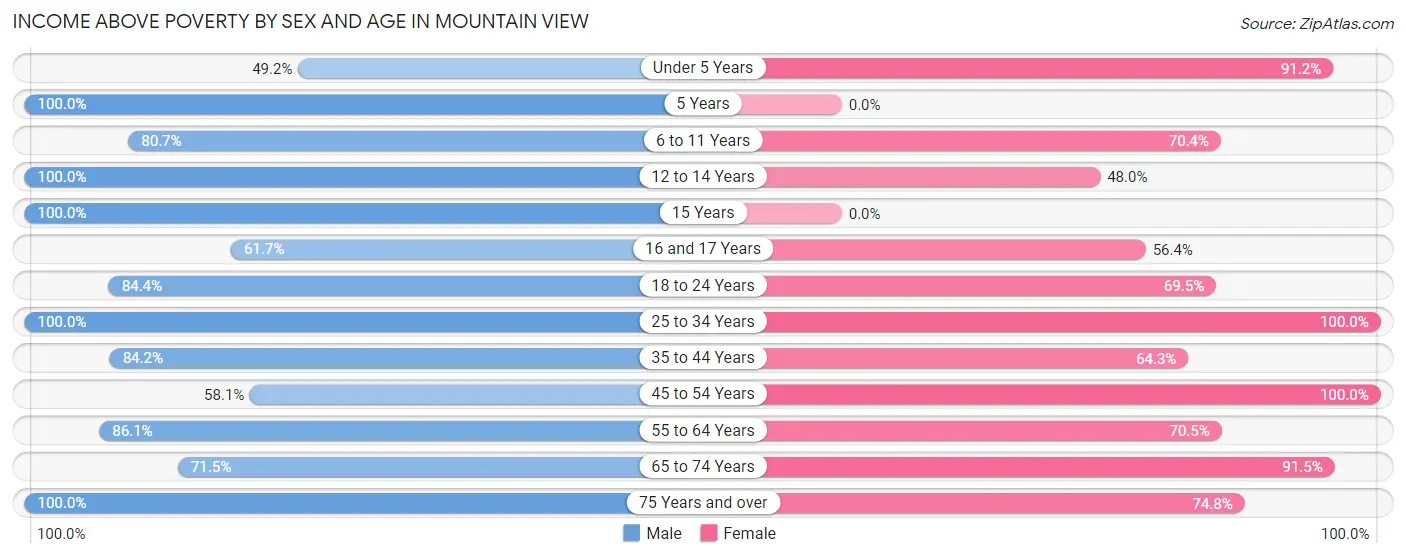
| Age Bracket | Male | Female |
| Under 5 Years | 62 (49.2%) | 186 (91.2%) |
| 5 Years | 4 (100.0%) | 0 (0.0%) |
| 6 to 11 Years | 88 (80.7%) | 159 (70.4%) |
| 12 to 14 Years | 6 (100.0%) | 59 (48.0%) |
| 15 Years | 62 (100.0%) | 0 (0.0%) |
| 16 and 17 Years | 37 (61.7%) | 88 (56.4%) |
| 18 to 24 Years | 221 (84.4%) | 166 (69.5%) |
| 25 to 34 Years | 45 (100.0%) | 117 (100.0%) |
| 35 to 44 Years | 229 (84.2%) | 189 (64.3%) |
| 45 to 54 Years | 168 (58.1%) | 154 (100.0%) |
| 55 to 64 Years | 93 (86.1%) | 148 (70.5%) |
| 65 to 74 Years | 113 (71.5%) | 182 (91.5%) |
| 75 Years and over | 59 (100.0%) | 83 (74.8%) |
| Total | 1,187 (76.1%) | 1,531 (74.1%) |
Income Below Poverty Among Married-Couple Families in Mountain View
The poverty statistics for married-couple families in Mountain View show that 21.4% or 87 of the total 406 families live below the poverty line. Families with 3 or 4 children have the highest poverty rate of 58.1%, comprising of 36 families. On the other hand, families with no children have the lowest poverty rate of 10.6%, which includes 23 families.
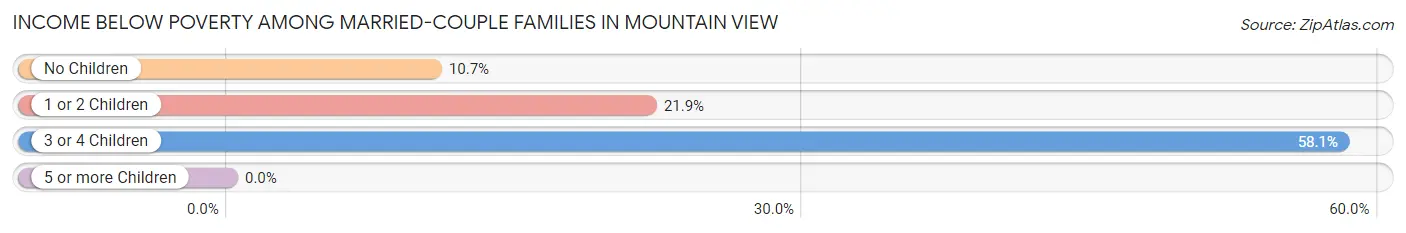
| Children | Above Poverty | Below Poverty |
| No Children | 193 (89.3%) | 23 (10.6%) |
| 1 or 2 Children | 100 (78.1%) | 28 (21.9%) |
| 3 or 4 Children | 26 (41.9%) | 36 (58.1%) |
| 5 or more Children | 0 (0.0%) | 0 (0.0%) |
| Total | 319 (78.6%) | 87 (21.4%) |
Income Below Poverty Among Single-Parent Households in Mountain View
According to the poverty data in Mountain View, 11.6% or 17 single-father households and 29.8% or 73 single-mother households are living below the poverty line. Among single-father households, those with 1 or 2 children have the highest poverty rate, with 17 households (100.0%) experiencing poverty. Likewise, among single-mother households, those with 3 or 4 children have the highest poverty rate, with 73 households (67.6%) falling below the poverty line.
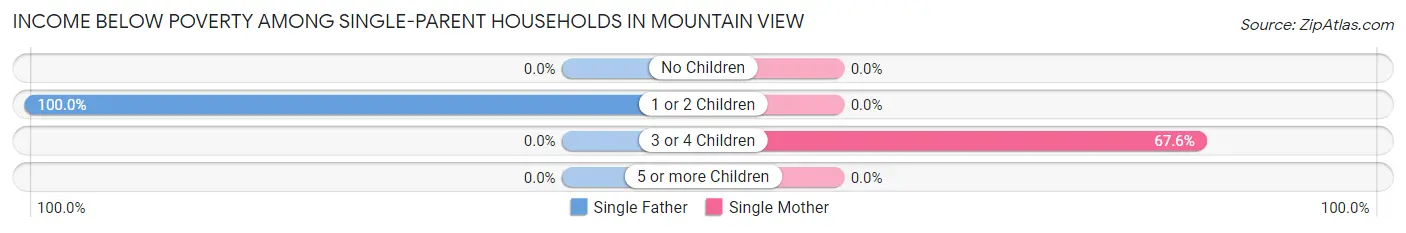
| Children | Single Father | Single Mother |
| No Children | 0 (0.0%) | 0 (0.0%) |
| 1 or 2 Children | 17 (100.0%) | 0 (0.0%) |
| 3 or 4 Children | 0 (0.0%) | 73 (67.6%) |
| 5 or more Children | 0 (0.0%) | 0 (0.0%) |
| Total | 17 (11.6%) | 73 (29.8%) |
Income Below Poverty Among Married-Couple vs Single-Parent Households in Mountain View
The poverty data for Mountain View shows that 87 of the married-couple family households (21.4%) and 90 of the single-parent households (23.0%) are living below the poverty level. Within the married-couple family households, those with 3 or 4 children have the highest poverty rate, with 36 households (58.1%) falling below the poverty line. Among the single-parent households, those with 3 or 4 children have the highest poverty rate, with 73 household (46.8%) living below poverty.
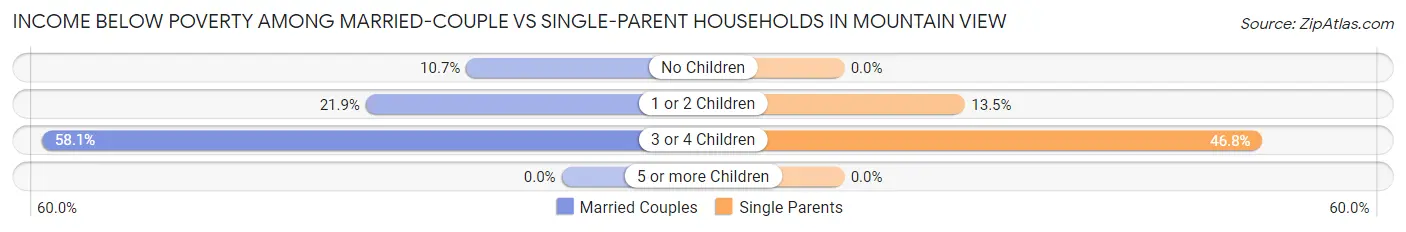
| Children | Married-Couple Families | Single-Parent Households |
| No Children | 23 (10.6%) | 0 (0.0%) |
| 1 or 2 Children | 28 (21.9%) | 17 (13.5%) |
| 3 or 4 Children | 36 (58.1%) | 73 (46.8%) |
| 5 or more Children | 0 (0.0%) | 0 (0.0%) |
| Total | 87 (21.4%) | 90 (23.0%) |
Race in Mountain View
The most populous races in Mountain View are Two or more Races (2,033 | 56.0%), White / Caucasian (641 | 17.7%), and Hawaiian / Pacific (533 | 14.7%).
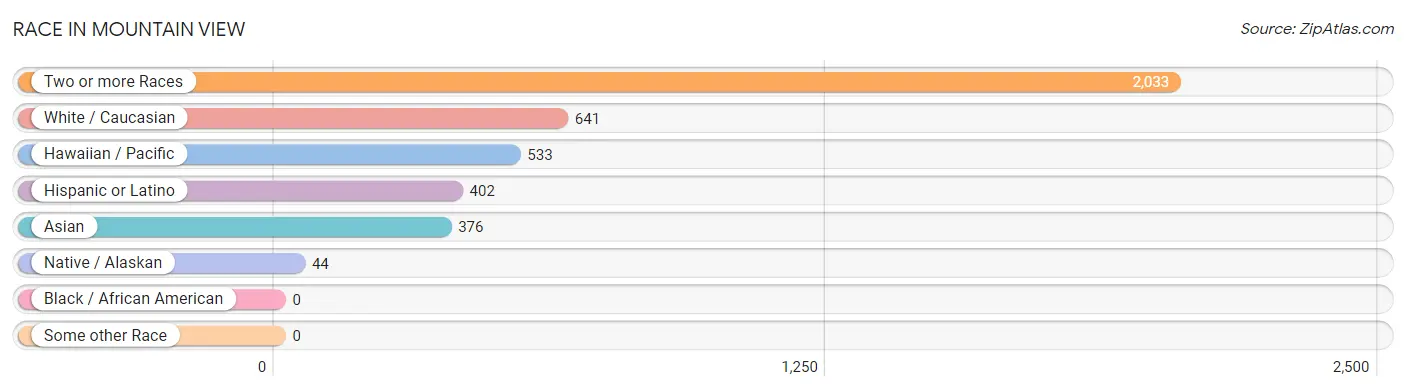
| Race | # Population | % Population |
| Asian | 376 | 10.4% |
| Black / African American | 0 | 0.0% |
| Hawaiian / Pacific | 533 | 14.7% |
| Hispanic or Latino | 402 | 11.1% |
| Native / Alaskan | 44 | 1.2% |
| White / Caucasian | 641 | 17.7% |
| Two or more Races | 2,033 | 56.0% |
| Some other Race | 0 | 0.0% |
| Total | 3,627 | 100.0% |
Ancestry in Mountain View
The most populous ancestries reported in Mountain View are Native Hawaiian (1,879 | 51.8%), Korean (1,215 | 33.5%), Indian (Asian) (1,149 | 31.7%), Bhutanese (685 | 18.9%), and Portuguese (605 | 16.7%), together accounting for 152.6% of all Mountain View residents.
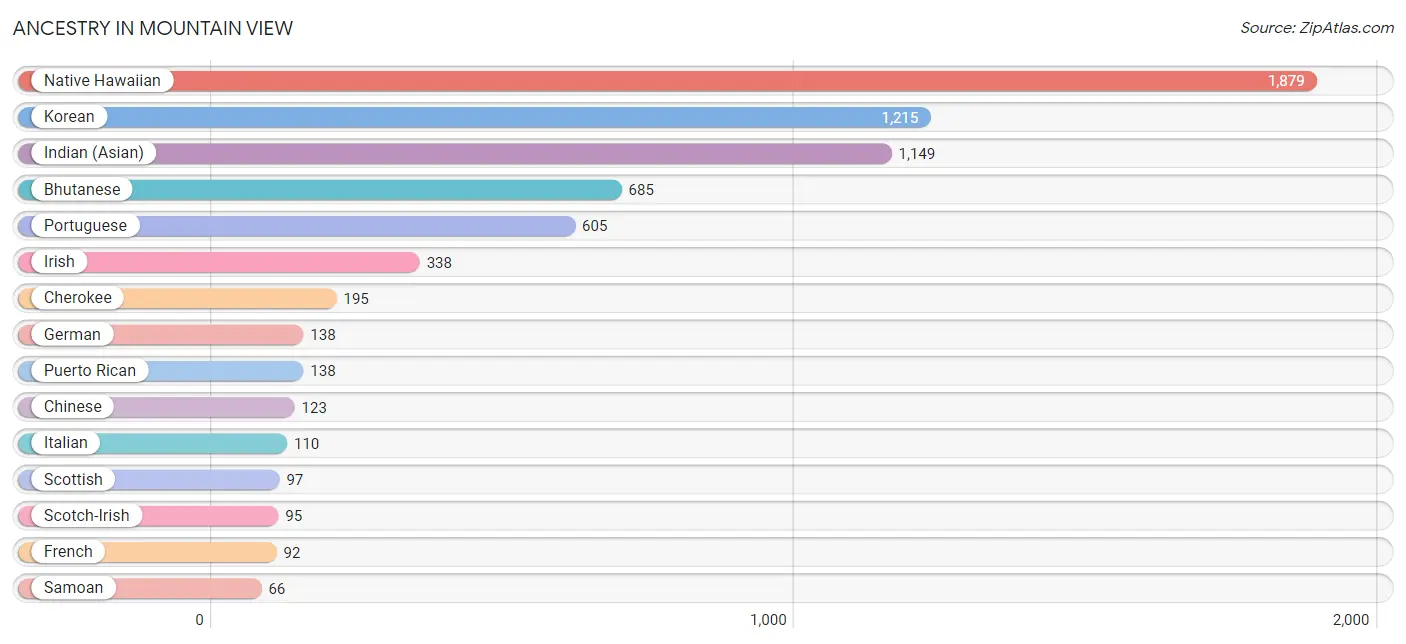
| Ancestry | # Population | % Population |
| Bhutanese | 685 | 18.9% |
| British | 18 | 0.5% |
| Cherokee | 195 | 5.4% |
| Chinese | 123 | 3.4% |
| European | 24 | 0.7% |
| French | 92 | 2.5% |
| German | 138 | 3.8% |
| Indian (Asian) | 1,149 | 31.7% |
| Irish | 338 | 9.3% |
| Italian | 110 | 3.0% |
| Korean | 1,215 | 33.5% |
| Mexican | 59 | 1.6% |
| Native Hawaiian | 1,879 | 51.8% |
| Polish | 17 | 0.5% |
| Portuguese | 605 | 16.7% |
| Puerto Rican | 138 | 3.8% |
| Russian | 26 | 0.7% |
| Samoan | 66 | 1.8% |
| Scotch-Irish | 95 | 2.6% |
| Scottish | 97 | 2.7% |
| Spanish | 44 | 1.2% | View All 21 Rows |
Immigrants in Mountain View
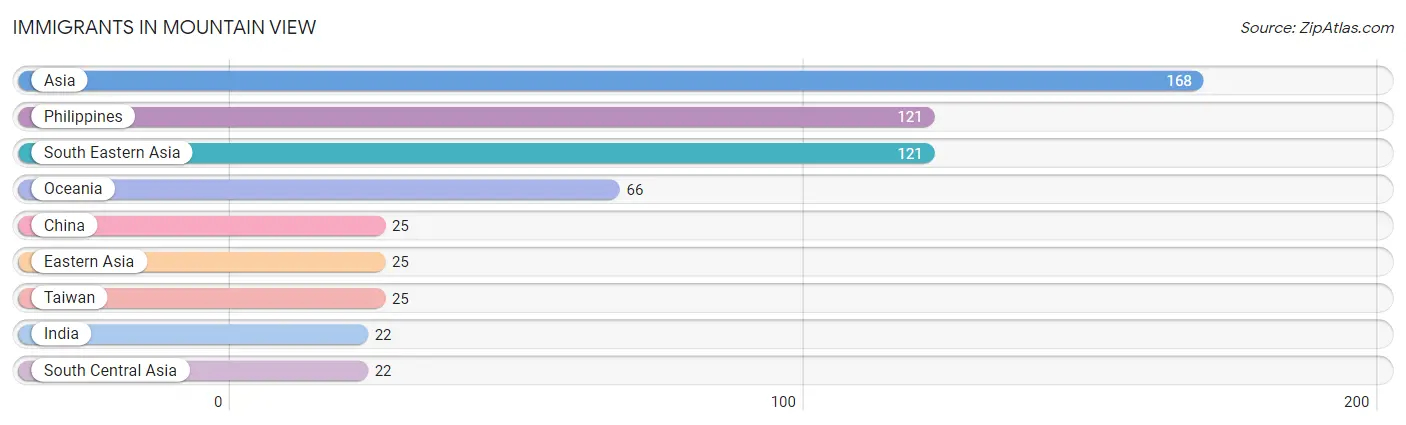
The most numerous immigrant groups reported in Mountain View came from Asia (168 | 4.6%), Philippines (121 | 3.3%), South Eastern Asia (121 | 3.3%), Oceania (66 | 1.8%), and China (25 | 0.7%), together accounting for 13.8% of all Mountain View residents.
| Immigration Origin | # Population | % Population |
| Asia | 168 | 4.6% |
| China | 25 | 0.7% |
| Eastern Asia | 25 | 0.7% |
| India | 22 | 0.6% |
| Oceania | 66 | 1.8% |
| Philippines | 121 | 3.3% |
| South Central Asia | 22 | 0.6% |
| South Eastern Asia | 121 | 3.3% |
| Taiwan | 25 | 0.7% | View All 9 Rows |
Sex and Age in Mountain View
Sex and Age in Mountain View
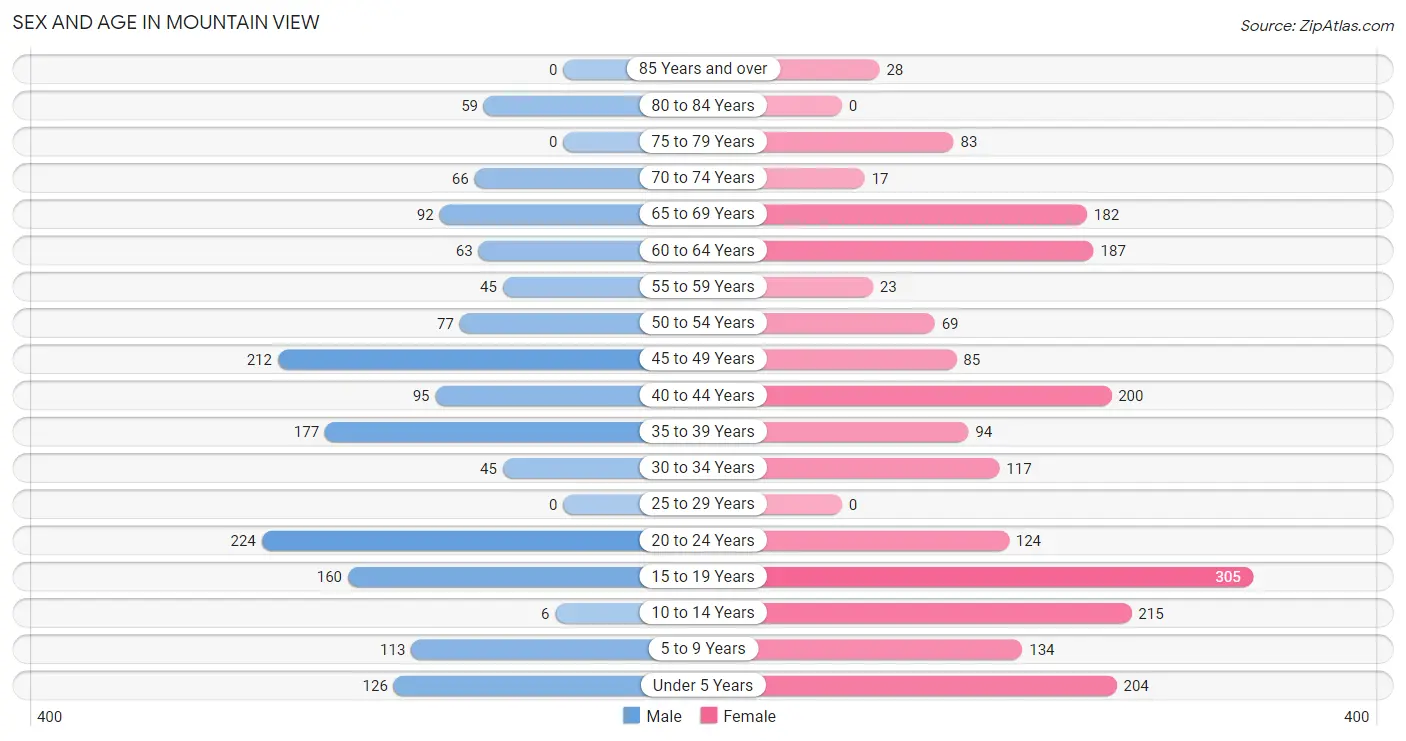
The most populous age groups in Mountain View are 20 to 24 Years (224 | 14.4%) for men and 15 to 19 Years (305 | 14.8%) for women.
| Age Bracket | Male | Female |
| Under 5 Years | 126 (8.1%) | 204 (9.9%) |
| 5 to 9 Years | 113 (7.2%) | 134 (6.5%) |
| 10 to 14 Years | 6 (0.4%) | 215 (10.4%) |
| 15 to 19 Years | 160 (10.3%) | 305 (14.8%) |
| 20 to 24 Years | 224 (14.4%) | 124 (6.0%) |
| 25 to 29 Years | 0 (0.0%) | 0 (0.0%) |
| 30 to 34 Years | 45 (2.9%) | 117 (5.7%) |
| 35 to 39 Years | 177 (11.4%) | 94 (4.5%) |
| 40 to 44 Years | 95 (6.1%) | 200 (9.7%) |
| 45 to 49 Years | 212 (13.6%) | 85 (4.1%) |
| 50 to 54 Years | 77 (4.9%) | 69 (3.3%) |
| 55 to 59 Years | 45 (2.9%) | 23 (1.1%) |
| 60 to 64 Years | 63 (4.0%) | 187 (9.0%) |
| 65 to 69 Years | 92 (5.9%) | 182 (8.8%) |
| 70 to 74 Years | 66 (4.2%) | 17 (0.8%) |
| 75 to 79 Years | 0 (0.0%) | 83 (4.0%) |
| 80 to 84 Years | 59 (3.8%) | 0 (0.0%) |
| 85 Years and over | 0 (0.0%) | 28 (1.3%) |
| Total | 1,560 (100.0%) | 2,067 (100.0%) |
Families and Households in Mountain View
Median Family Size in Mountain View
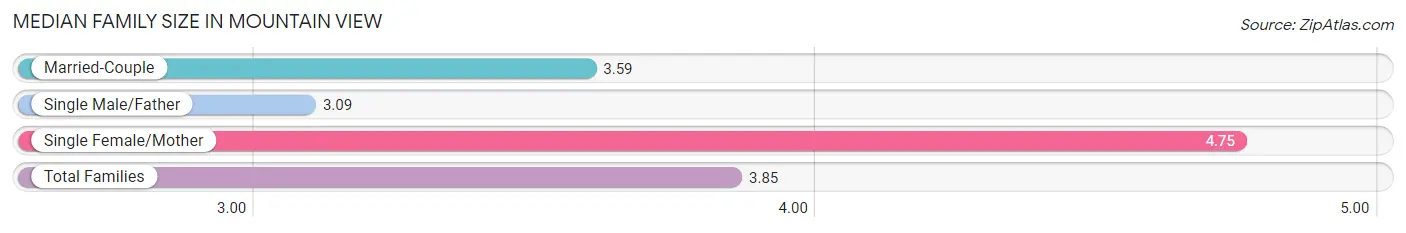
The median family size in Mountain View is 3.85 persons per family, with single female/mother families (245 | 30.7%) accounting for the largest median family size of 4.75 persons per family. On the other hand, single male/father families (147 | 18.4%) represent the smallest median family size with 3.09 persons per family.
| Family Type | # Families | Family Size |
| Married-Couple | 406 (50.9%) | 3.59 |
| Single Male/Father | 147 (18.4%) | 3.09 |
| Single Female/Mother | 245 (30.7%) | 4.75 |
| Total Families | 798 (100.0%) | 3.85 |
Median Household Size in Mountain View
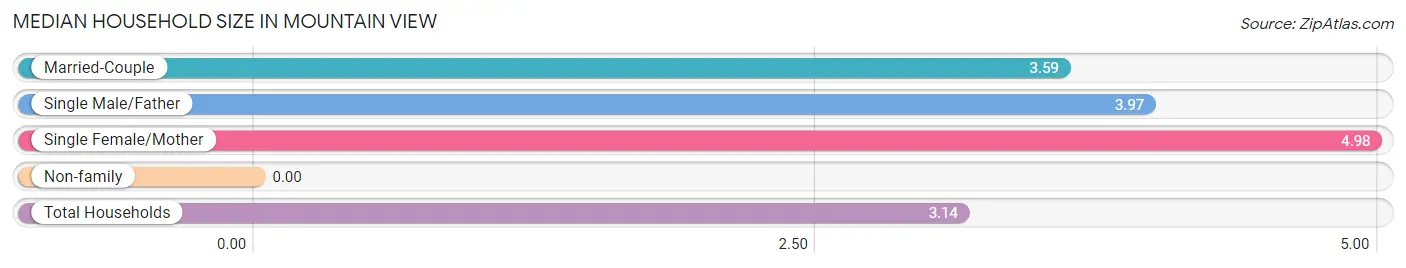
| Household Type | # Households | Household Size |
| Married-Couple | 406 (35.3%) | 3.59 |
| Single Male/Father | 147 (12.8%) | 3.97 |
| Single Female/Mother | 245 (21.3%) | 4.98 |
| Non-family | 352 (30.6%) | - |
| Total Households | 1,150 (100.0%) | 3.14 |
Household Size by Marriage Status in Mountain View
Out of a total of 1,150 households in Mountain View, 798 (69.4%) are family households, while 352 (30.6%) are nonfamily households. The most numerous type of family households are 2-person households, comprising 225, and the most common type of nonfamily households are 1-person households, comprising 352.

| Household Size | Family Households | Nonfamily Households |
| 1-Person Households | - | 352 (30.6%) |
| 2-Person Households | 225 (19.6%) | 0 (0.0%) |
| 3-Person Households | 118 (10.3%) | 0 (0.0%) |
| 4-Person Households | 171 (14.9%) | 0 (0.0%) |
| 5-Person Households | 107 (9.3%) | 0 (0.0%) |
| 6-Person Households | 151 (13.1%) | 0 (0.0%) |
| 7+ Person Households | 26 (2.3%) | 0 (0.0%) |
| Total | 798 (69.4%) | 352 (30.6%) |
Female Fertility in Mountain View
Fertility by Age in Mountain View
Average fertility rate in Mountain View is 83.0 births per 1,000 women. Women in the age bracket of 20 to 34 years have the highest fertility rate with 332.0 births per 1,000 women. Women in the age bracket of 20 to 34 years acount for 100.0% of all women with births.
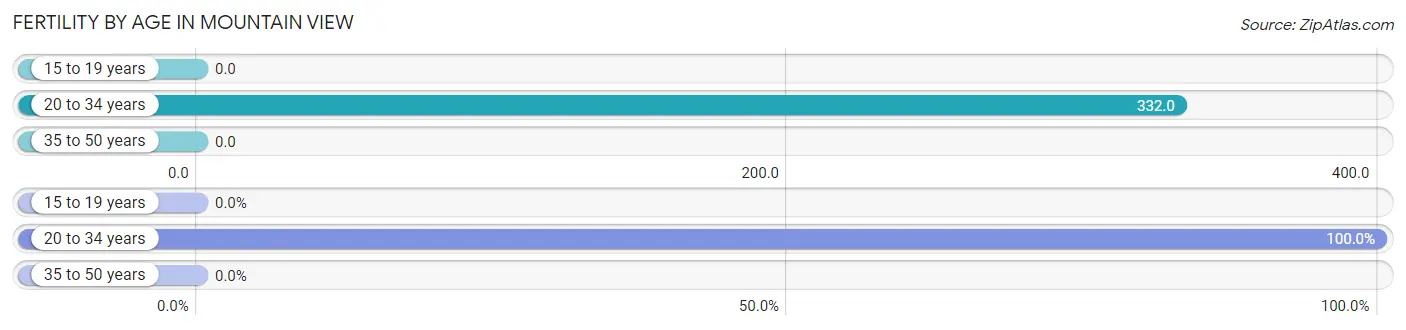
| Age Bracket | Women with Births | Births / 1,000 Women |
| 15 to 19 years | 0 (0.0%) | 0.0 |
| 20 to 34 years | 80 (100.0%) | 332.0 |
| 35 to 50 years | 0 (0.0%) | 0.0 |
| Total | 80 (100.0%) | 83.0 |
Fertility by Age by Marriage Status in Mountain View
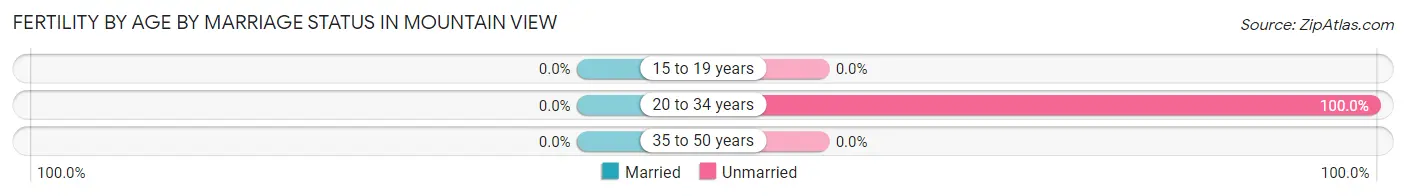
| Age Bracket | Married | Unmarried |
| 15 to 19 years | 0 (0.0%) | 0 (0.0%) |
| 20 to 34 years | 0 (0.0%) | 80 (100.0%) |
| 35 to 50 years | 0 (0.0%) | 0 (0.0%) |
| Total | 0 (0.0%) | 80 (100.0%) |
Fertility by Education in Mountain View
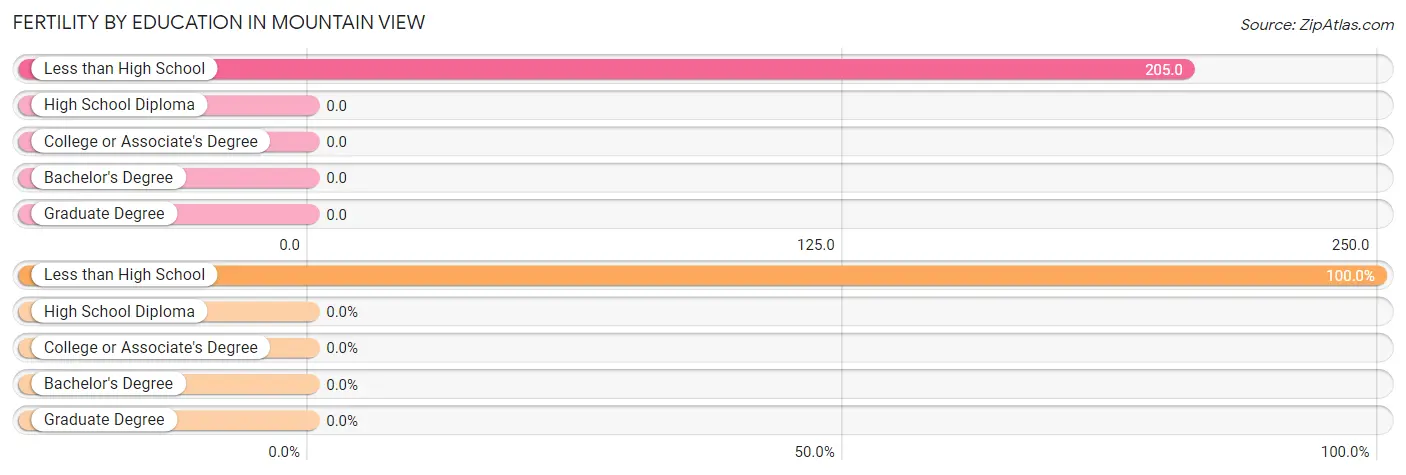
| Educational Attainment | Women with Births | Births / 1,000 Women |
| Less than High School | 80 (100.0%) | 205.0 |
| High School Diploma | 0 (0.0%) | 0.0 |
| College or Associate's Degree | 0 (0.0%) | 0.0 |
| Bachelor's Degree | 0 (0.0%) | 0.0 |
| Graduate Degree | 0 (0.0%) | 0.0 |
| Total | 80 (100.0%) | 83.0 |
Fertility by Education by Marriage Status in Mountain View
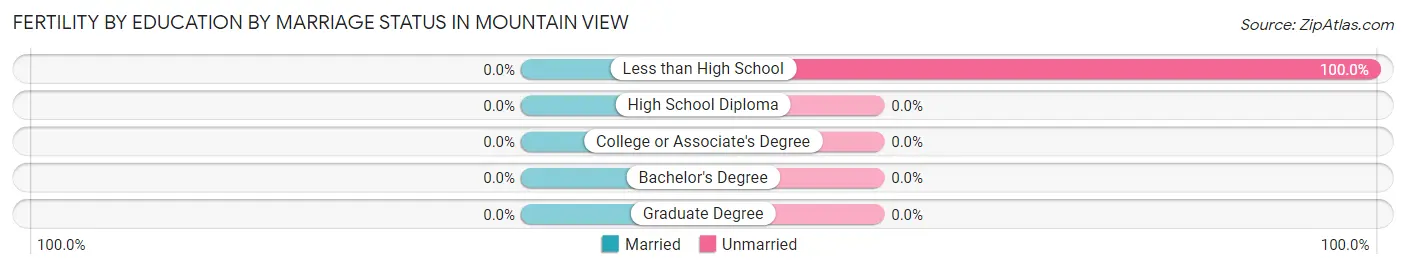
| Educational Attainment | Married | Unmarried |
| Less than High School | 0 (0.0%) | 80 (100.0%) |
| High School Diploma | 0 (0.0%) | 0 (0.0%) |
| College or Associate's Degree | 0 (0.0%) | 0 (0.0%) |
| Bachelor's Degree | 0 (0.0%) | 0 (0.0%) |
| Graduate Degree | 0 (0.0%) | 0 (0.0%) |
| Total | 0 (0.0%) | 80 (100.0%) |
Employment Characteristics in Mountain View
Employment by Class of Employer in Mountain View
Among the 1,261 employed individuals in Mountain View, private company employees (582 | 46.2%), state government employees (264 | 20.9%), and self-employed (not incorporated) (201 | 15.9%) make up the most common classes of employment.
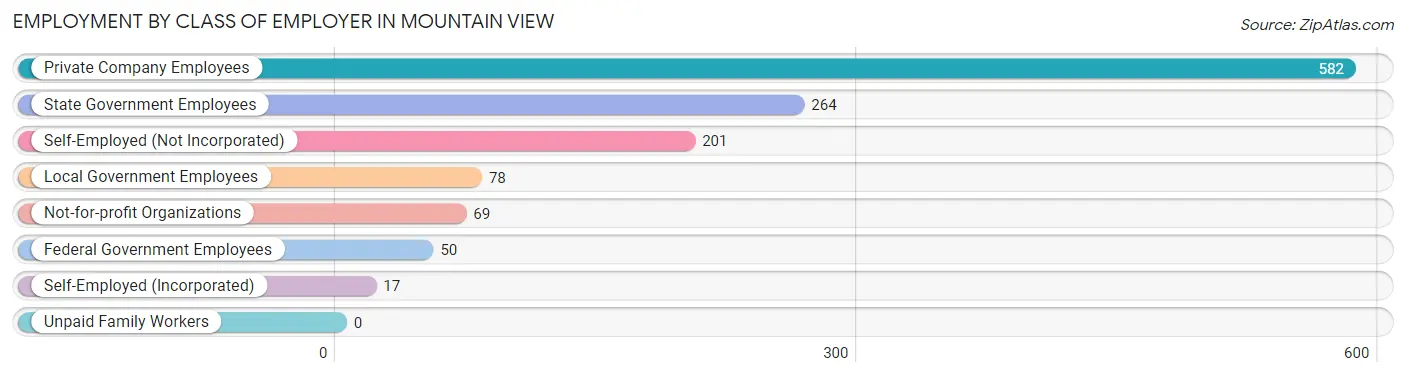
| Employer Class | # Employees | % Employees |
| Private Company Employees | 582 | 46.2% |
| Self-Employed (Incorporated) | 17 | 1.3% |
| Self-Employed (Not Incorporated) | 201 | 15.9% |
| Not-for-profit Organizations | 69 | 5.5% |
| Local Government Employees | 78 | 6.2% |
| State Government Employees | 264 | 20.9% |
| Federal Government Employees | 50 | 4.0% |
| Unpaid Family Workers | 0 | 0.0% |
| Total | 1,261 | 100.0% |
Employment Status by Age in Mountain View
According to the labor force statistics for Mountain View, out of the total population over 16 years of age (2,733), 52.5% or 1,435 individuals are in the labor force, with 8.2% or 118 of them unemployed. The age group with the highest labor force participation rate is 55 to 59 years, with 100.0% or 68 individuals in the labor force. Within the labor force, the 16 to 19 years age range has the highest percentage of unemployed individuals, with 29.4% or 45 of them being unemployed.
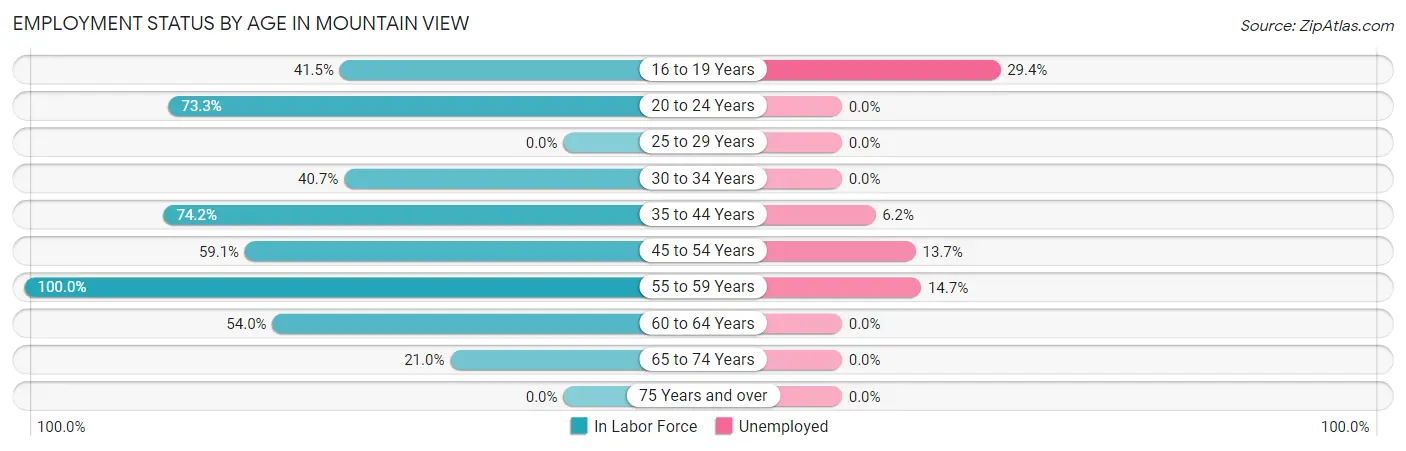
| Age Bracket | In Labor Force | Unemployed |
| 16 to 19 Years | 153 (41.5%) | 45 (29.4%) |
| 20 to 24 Years | 255 (73.3%) | 0 (0.0%) |
| 25 to 29 Years | 0 (0.0%) | 0 (0.0%) |
| 30 to 34 Years | 66 (40.7%) | 0 (0.0%) |
| 35 to 44 Years | 420 (74.2%) | 26 (6.2%) |
| 45 to 54 Years | 262 (59.1%) | 36 (13.7%) |
| 55 to 59 Years | 68 (100.0%) | 10 (14.7%) |
| 60 to 64 Years | 135 (54.0%) | 0 (0.0%) |
| 65 to 74 Years | 75 (21.0%) | 0 (0.0%) |
| 75 Years and over | 0 (0.0%) | 0 (0.0%) |
| Total | 1,435 (52.5%) | 118 (8.2%) |
Employment Status by Educational Attainment in Mountain View
According to labor force statistics for Mountain View, 63.9% of individuals (951) out of the total population between 25 and 64 years of age (1,489) are in the labor force, with 7.6% or 72 of them being unemployed. The group with the highest labor force participation rate are those with the educational attainment of bachelor's degree or higher, with 81.1% or 107 individuals in the labor force. Within the labor force, individuals with college / associate degree education have the highest percentage of unemployment, with 19.8% or 62 of them being unemployed.
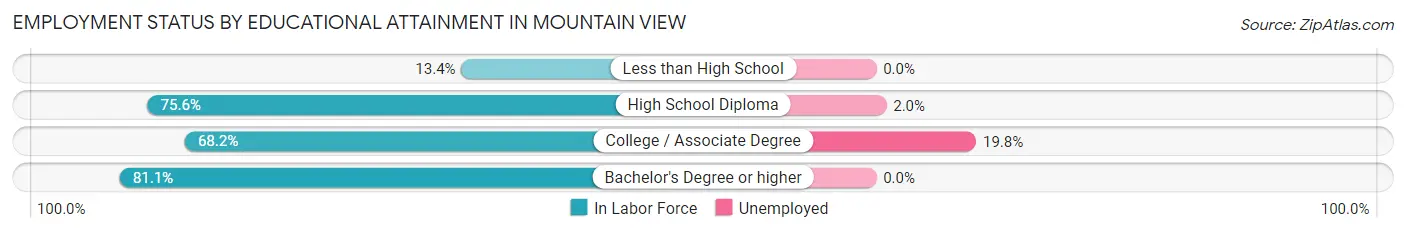
| Educational Attainment | In Labor Force | Unemployed |
| Less than High School | 32 (13.4%) | 0 (0.0%) |
| High School Diploma | 499 (75.6%) | 13 (2.0%) |
| College / Associate Degree | 313 (68.2%) | 91 (19.8%) |
| Bachelor's Degree or higher | 107 (81.1%) | 0 (0.0%) |
| Total | 951 (63.9%) | 113 (7.6%) |
Employment Occupations by Sex in Mountain View
Management, Business, Science and Arts Occupations
The most common Management, Business, Science and Arts occupations in Mountain View are Community & Social Service (122 | 9.3%), Education Instruction & Library (69 | 5.2%), Education, Arts & Media (53 | 4.0%), Management (48 | 3.6%), and Business & Financial (46 | 3.5%).
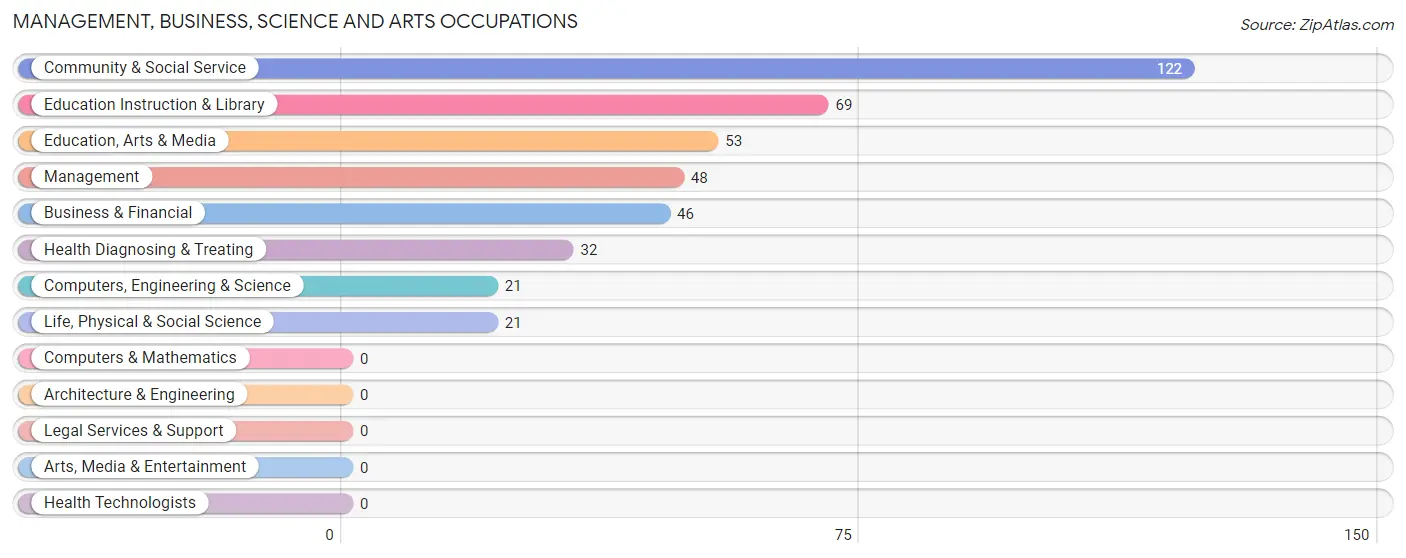
Management, Business, Science and Arts Occupations by Sex
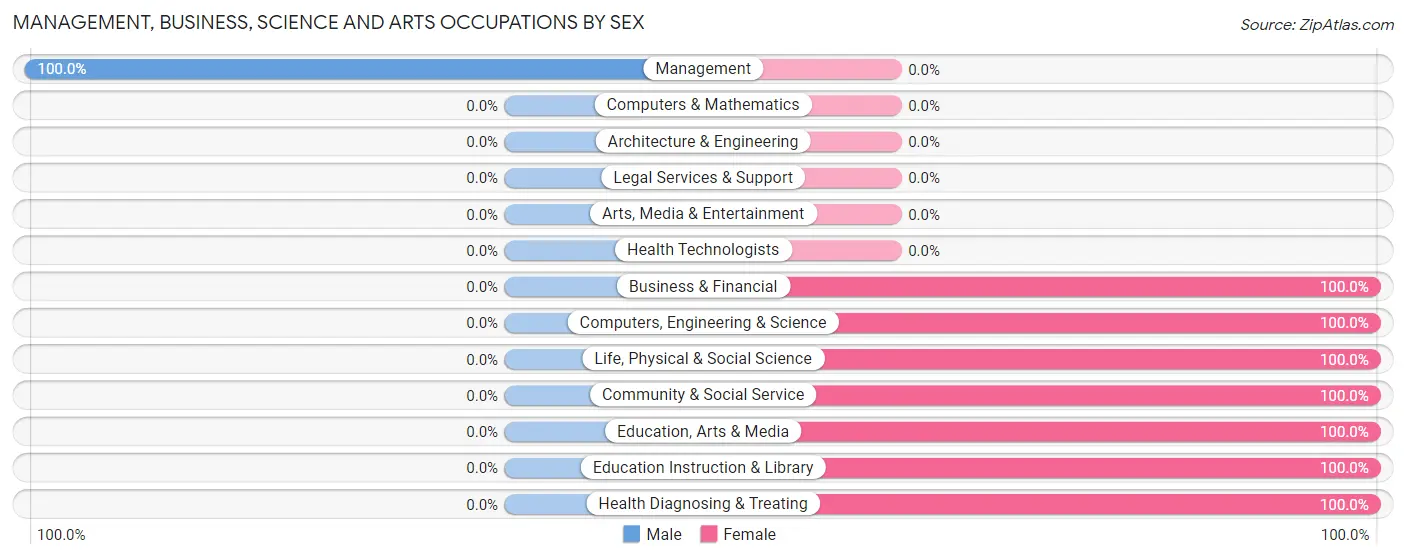
| Occupation | Male | Female |
| Management | 48 (100.0%) | 0 (0.0%) |
| Business & Financial | 0 (0.0%) | 46 (100.0%) |
| Computers, Engineering & Science | 0 (0.0%) | 21 (100.0%) |
| Computers & Mathematics | 0 (0.0%) | 0 (0.0%) |
| Architecture & Engineering | 0 (0.0%) | 0 (0.0%) |
| Life, Physical & Social Science | 0 (0.0%) | 21 (100.0%) |
| Community & Social Service | 0 (0.0%) | 122 (100.0%) |
| Education, Arts & Media | 0 (0.0%) | 53 (100.0%) |
| Legal Services & Support | 0 (0.0%) | 0 (0.0%) |
| Education Instruction & Library | 0 (0.0%) | 69 (100.0%) |
| Arts, Media & Entertainment | 0 (0.0%) | 0 (0.0%) |
| Health Diagnosing & Treating | 0 (0.0%) | 32 (100.0%) |
| Health Technologists | 0 (0.0%) | 0 (0.0%) |
| Total (Category) | 48 (17.8%) | 221 (82.2%) |
| Total (Overall) | 669 (50.8%) | 648 (49.2%) |
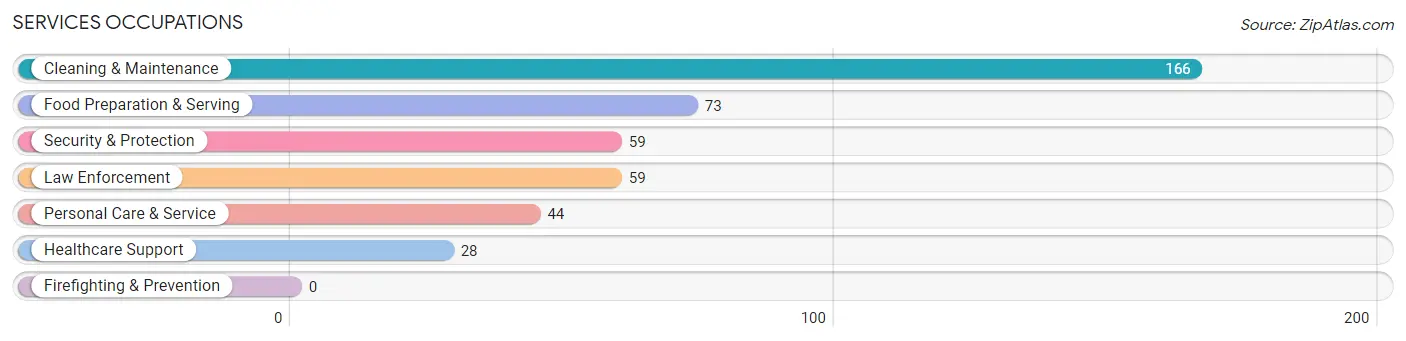
Services Occupations
The most common Services occupations in Mountain View are Cleaning & Maintenance (166 | 12.6%), Food Preparation & Serving (73 | 5.5%), Security & Protection (59 | 4.5%), Law Enforcement (59 | 4.5%), and Personal Care & Service (44 | 3.3%).
Services Occupations by Sex
Within the Services occupations in Mountain View, the most male-oriented occupations are Security & Protection (100.0%), Law Enforcement (100.0%), and Cleaning & Maintenance (64.5%), while the most female-oriented occupations are Healthcare Support (100.0%), Personal Care & Service (100.0%), and Food Preparation & Serving (79.4%).
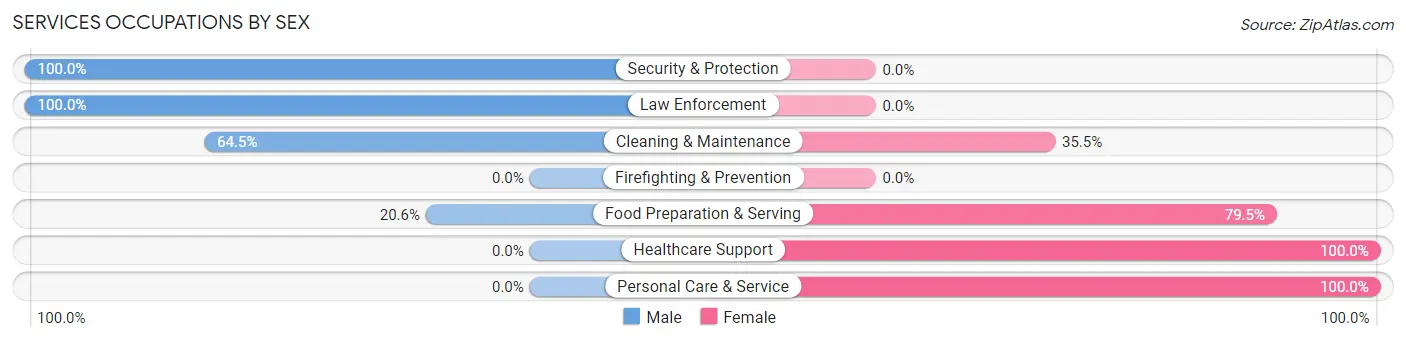
| Occupation | Male | Female |
| Healthcare Support | 0 (0.0%) | 28 (100.0%) |
| Security & Protection | 59 (100.0%) | 0 (0.0%) |
| Firefighting & Prevention | 0 (0.0%) | 0 (0.0%) |
| Law Enforcement | 59 (100.0%) | 0 (0.0%) |
| Food Preparation & Serving | 15 (20.5%) | 58 (79.4%) |
| Cleaning & Maintenance | 107 (64.5%) | 59 (35.5%) |
| Personal Care & Service | 0 (0.0%) | 44 (100.0%) |
| Total (Category) | 181 (48.9%) | 189 (51.1%) |
| Total (Overall) | 669 (50.8%) | 648 (49.2%) |
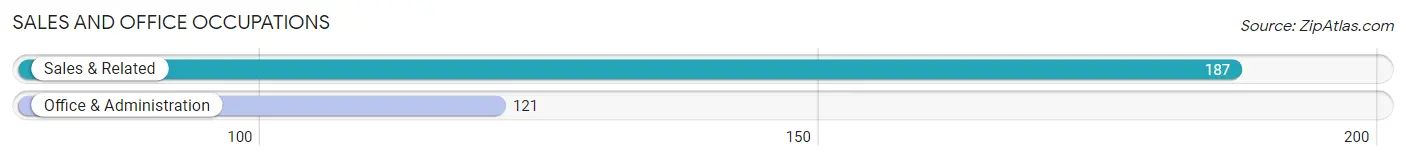
Sales and Office Occupations
The most common Sales and Office occupations in Mountain View are Sales & Related (187 | 14.2%), and Office & Administration (121 | 9.2%).
Sales and Office Occupations by Sex
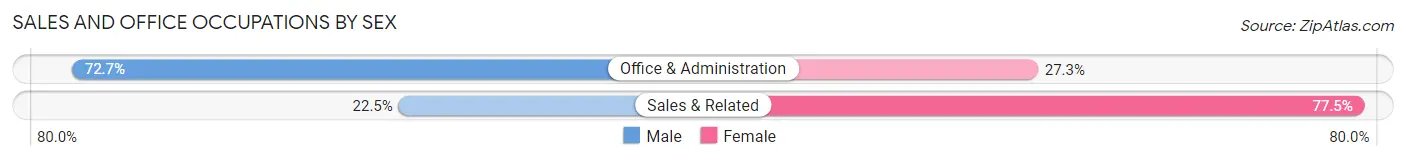
| Occupation | Male | Female |
| Sales & Related | 42 (22.5%) | 145 (77.5%) |
| Office & Administration | 88 (72.7%) | 33 (27.3%) |
| Total (Category) | 130 (42.2%) | 178 (57.8%) |
| Total (Overall) | 669 (50.8%) | 648 (49.2%) |
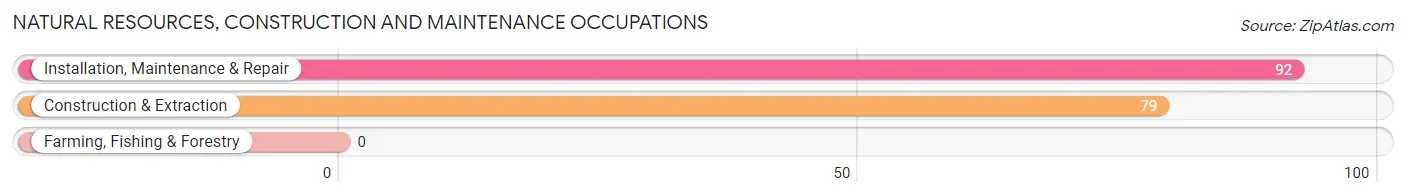
Natural Resources, Construction and Maintenance Occupations
The most common Natural Resources, Construction and Maintenance occupations in Mountain View are Installation, Maintenance & Repair (92 | 7.0%), and Construction & Extraction (79 | 6.0%).
Natural Resources, Construction and Maintenance Occupations by Sex
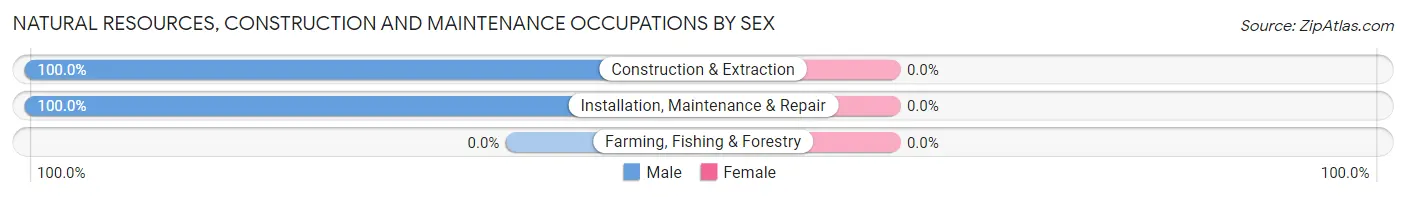
| Occupation | Male | Female |
| Farming, Fishing & Forestry | 0 (0.0%) | 0 (0.0%) |
| Construction & Extraction | 79 (100.0%) | 0 (0.0%) |
| Installation, Maintenance & Repair | 92 (100.0%) | 0 (0.0%) |
| Total (Category) | 171 (100.0%) | 0 (0.0%) |
| Total (Overall) | 669 (50.8%) | 648 (49.2%) |
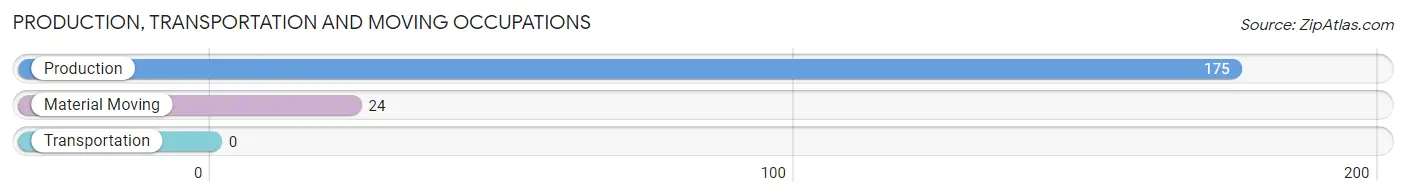
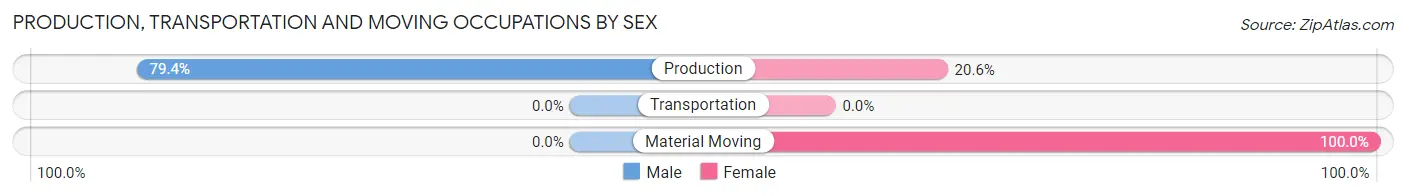
Production, Transportation and Moving Occupations
The most common Production, Transportation and Moving occupations in Mountain View are Production (175 | 13.3%), and Material Moving (24 | 1.8%).
Production, Transportation and Moving Occupations by Sex
| Occupation | Male | Female |
| Production | 139 (79.4%) | 36 (20.6%) |
| Transportation | 0 (0.0%) | 0 (0.0%) |
| Material Moving | 0 (0.0%) | 24 (100.0%) |
| Total (Category) | 139 (69.9%) | 60 (30.1%) |
| Total (Overall) | 669 (50.8%) | 648 (49.2%) |
Employment Industries by Sex in Mountain View
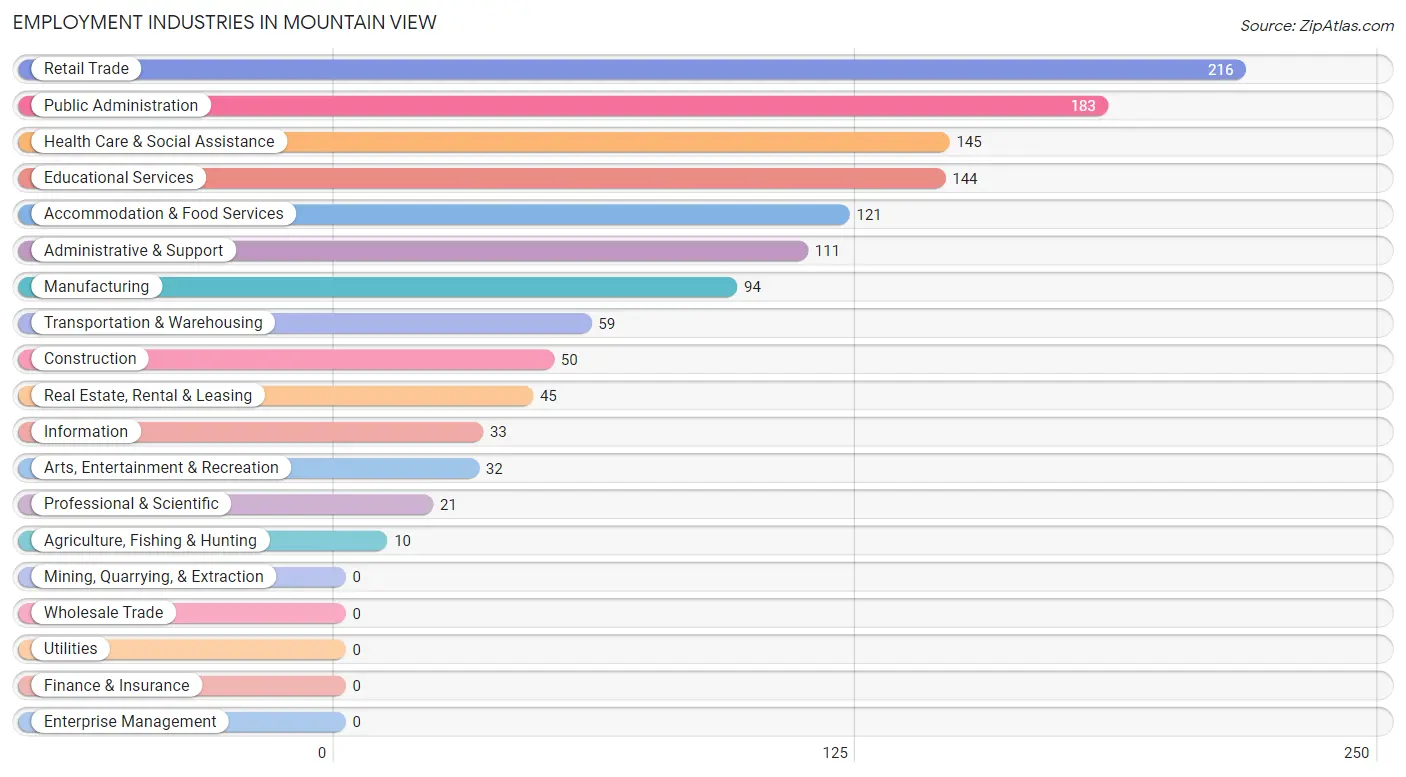
Employment Industries in Mountain View
The major employment industries in Mountain View include Retail Trade (216 | 16.4%), Public Administration (183 | 13.9%), Health Care & Social Assistance (145 | 11.0%), Educational Services (144 | 10.9%), and Accommodation & Food Services (121 | 9.2%).
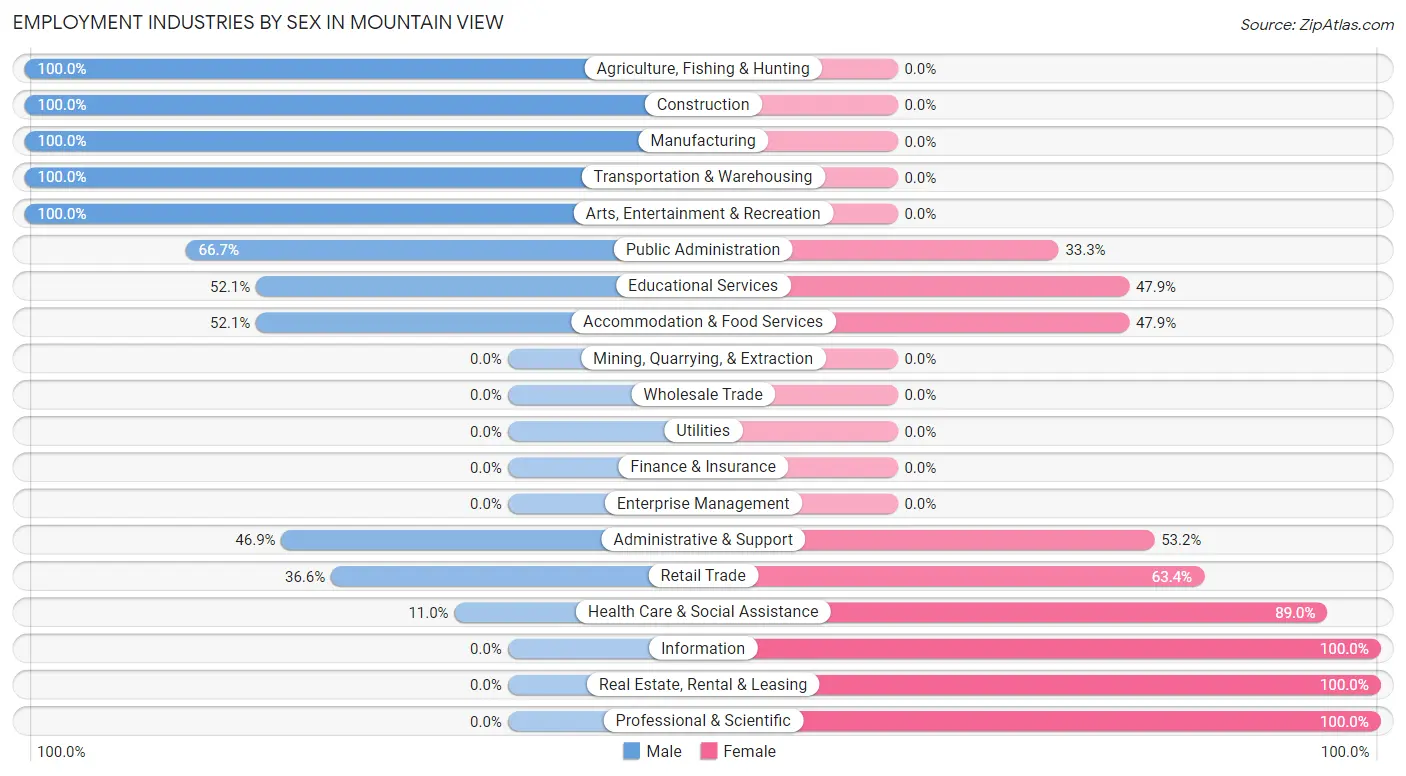
Employment Industries by Sex in Mountain View
The Mountain View industries that see more men than women are Agriculture, Fishing & Hunting (100.0%), Construction (100.0%), and Manufacturing (100.0%), whereas the industries that tend to have a higher number of women are Information (100.0%), Real Estate, Rental & Leasing (100.0%), and Professional & Scientific (100.0%).
| Industry | Male | Female |
| Agriculture, Fishing & Hunting | 10 (100.0%) | 0 (0.0%) |
| Mining, Quarrying, & Extraction | 0 (0.0%) | 0 (0.0%) |
| Construction | 50 (100.0%) | 0 (0.0%) |
| Manufacturing | 94 (100.0%) | 0 (0.0%) |
| Wholesale Trade | 0 (0.0%) | 0 (0.0%) |
| Retail Trade | 79 (36.6%) | 137 (63.4%) |
| Transportation & Warehousing | 59 (100.0%) | 0 (0.0%) |
| Utilities | 0 (0.0%) | 0 (0.0%) |
| Information | 0 (0.0%) | 33 (100.0%) |
| Finance & Insurance | 0 (0.0%) | 0 (0.0%) |
| Real Estate, Rental & Leasing | 0 (0.0%) | 45 (100.0%) |
| Professional & Scientific | 0 (0.0%) | 21 (100.0%) |
| Enterprise Management | 0 (0.0%) | 0 (0.0%) |
| Administrative & Support | 52 (46.9%) | 59 (53.1%) |
| Educational Services | 75 (52.1%) | 69 (47.9%) |
| Health Care & Social Assistance | 16 (11.0%) | 129 (89.0%) |
| Arts, Entertainment & Recreation | 32 (100.0%) | 0 (0.0%) |
| Accommodation & Food Services | 63 (52.1%) | 58 (47.9%) |
| Public Administration | 122 (66.7%) | 61 (33.3%) |
| Total | 669 (50.8%) | 648 (49.2%) |
Education in Mountain View
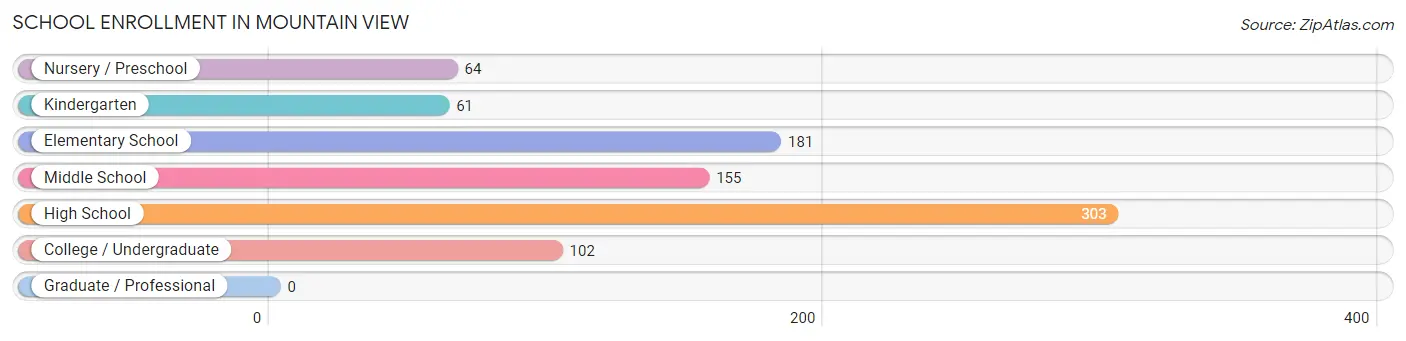
School Enrollment in Mountain View
The most common levels of schooling among the 866 students in Mountain View are high school (303 | 35.0%), elementary school (181 | 20.9%), and middle school (155 | 17.9%).
| School Level | # Students | % Students |
| Nursery / Preschool | 64 | 7.4% |
| Kindergarten | 61 | 7.0% |
| Elementary School | 181 | 20.9% |
| Middle School | 155 | 17.9% |
| High School | 303 | 35.0% |
| College / Undergraduate | 102 | 11.8% |
| Graduate / Professional | 0 | 0.0% |
| Total | 866 | 100.0% |
School Enrollment by Age by Funding Source in Mountain View
Out of a total of 866 students who are enrolled in schools in Mountain View, 194 (22.4%) attend a private institution, while the remaining 672 (77.6%) are enrolled in public schools. The age group of 18 to 19 year olds has the highest likelihood of being enrolled in private schools, with 38 (61.3% in the age bracket) enrolled. Conversely, the age group of 15 to 17 year olds has the lowest likelihood of being enrolled in a private school, with 265 (100.0% in the age bracket) attending a public institution.
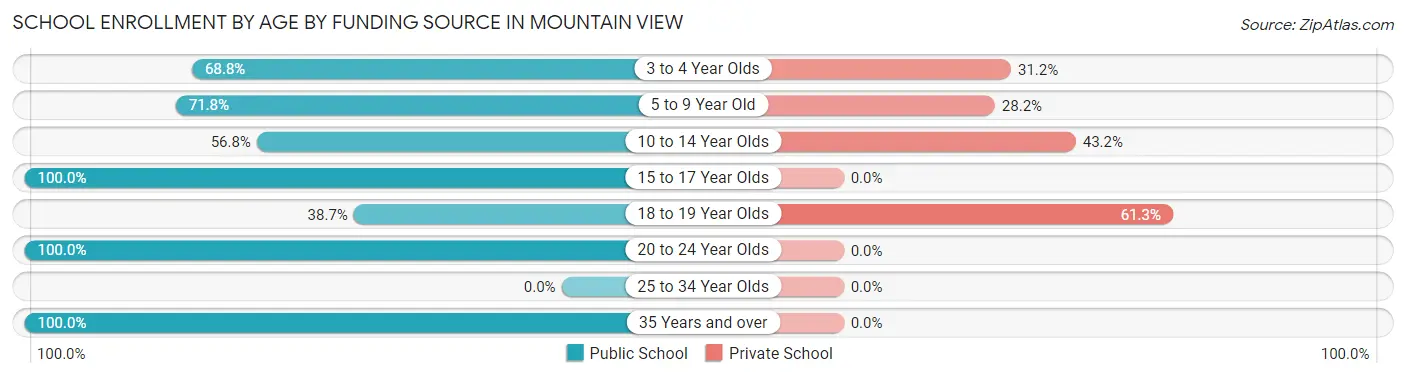
| Age Bracket | Public School | Private School |
| 3 to 4 Year Olds | 64 (68.8%) | 29 (31.2%) |
| 5 to 9 Year Old | 153 (71.8%) | 60 (28.2%) |
| 10 to 14 Year Olds | 88 (56.8%) | 67 (43.2%) |
| 15 to 17 Year Olds | 265 (100.0%) | 0 (0.0%) |
| 18 to 19 Year Olds | 24 (38.7%) | 38 (61.3%) |
| 20 to 24 Year Olds | 65 (100.0%) | 0 (0.0%) |
| 25 to 34 Year Olds | 0 (0.0%) | 0 (0.0%) |
| 35 Years and over | 13 (100.0%) | 0 (0.0%) |
| Total | 672 (77.6%) | 194 (22.4%) |
Educational Attainment by Field of Study in Mountain View
Education (51 | 26.2%), multidisciplinary studies (29 | 14.9%), bio, nature & agricultural (27 | 13.9%), science & technology (26 | 13.3%), and visual & performing arts (25 | 12.8%) are the most common fields of study among 195 individuals in Mountain View who have obtained a bachelor's degree or higher.
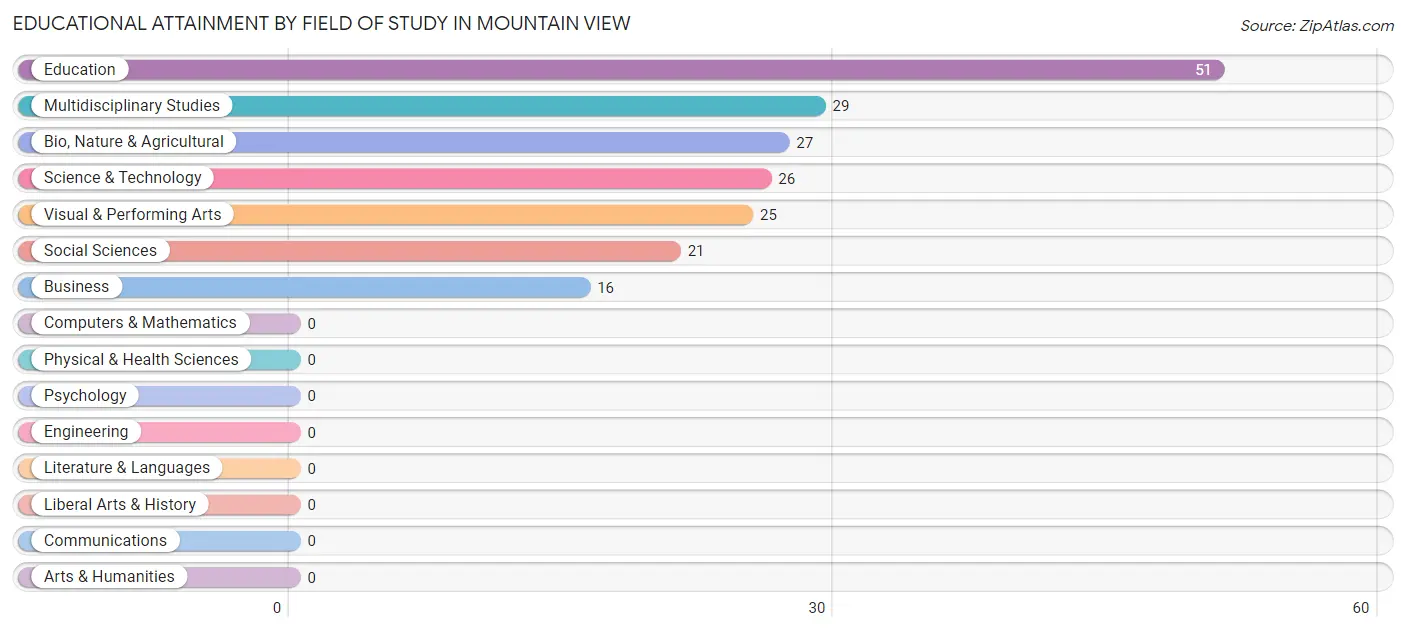
| Field of Study | # Graduates | % Graduates |
| Computers & Mathematics | 0 | 0.0% |
| Bio, Nature & Agricultural | 27 | 13.9% |
| Physical & Health Sciences | 0 | 0.0% |
| Psychology | 0 | 0.0% |
| Social Sciences | 21 | 10.8% |
| Engineering | 0 | 0.0% |
| Multidisciplinary Studies | 29 | 14.9% |
| Science & Technology | 26 | 13.3% |
| Business | 16 | 8.2% |
| Education | 51 | 26.2% |
| Literature & Languages | 0 | 0.0% |
| Liberal Arts & History | 0 | 0.0% |
| Visual & Performing Arts | 25 | 12.8% |
| Communications | 0 | 0.0% |
| Arts & Humanities | 0 | 0.0% |
| Total | 195 | 100.0% |
Transportation & Commute in Mountain View
Vehicle Availability by Sex in Mountain View
The most prevalent vehicle ownership categories in Mountain View are males with 2 vehicles (304, accounting for 45.4%) and females with 2 vehicles (213, making up 51.3%).
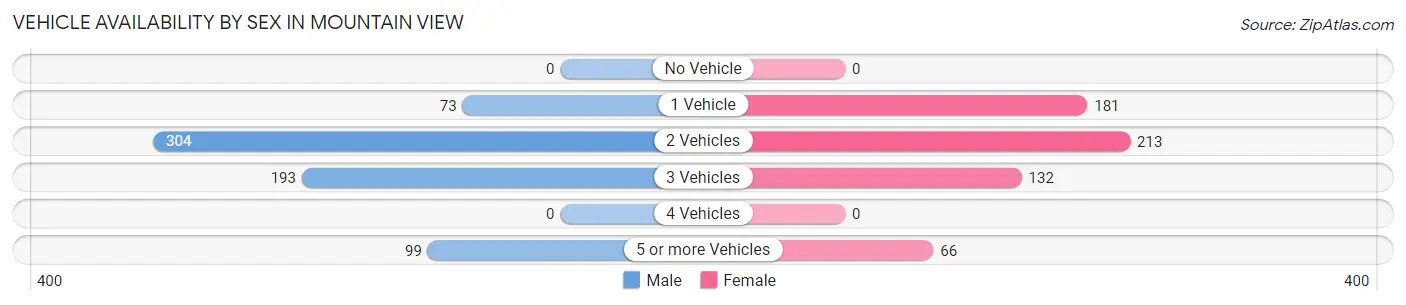
| Vehicles Available | Male | Female |
| No Vehicle | 0 (0.0%) | 0 (0.0%) |
| 1 Vehicle | 73 (10.9%) | 181 (30.6%) |
| 2 Vehicles | 304 (45.4%) | 213 (36.0%) |
| 3 Vehicles | 193 (28.8%) | 132 (22.3%) |
| 4 Vehicles | 0 (0.0%) | 0 (0.0%) |
| 5 or more Vehicles | 99 (14.8%) | 66 (11.2%) |
| Total | 669 (100.0%) | 592 (100.0%) |
Commute Time in Mountain View
The most frequently occuring commute durations in Mountain View are 30 to 34 minutes (410 commuters, 35.4%), 25 to 29 minutes (207 commuters, 17.9%), and 90 or more minutes (134 commuters, 11.6%).
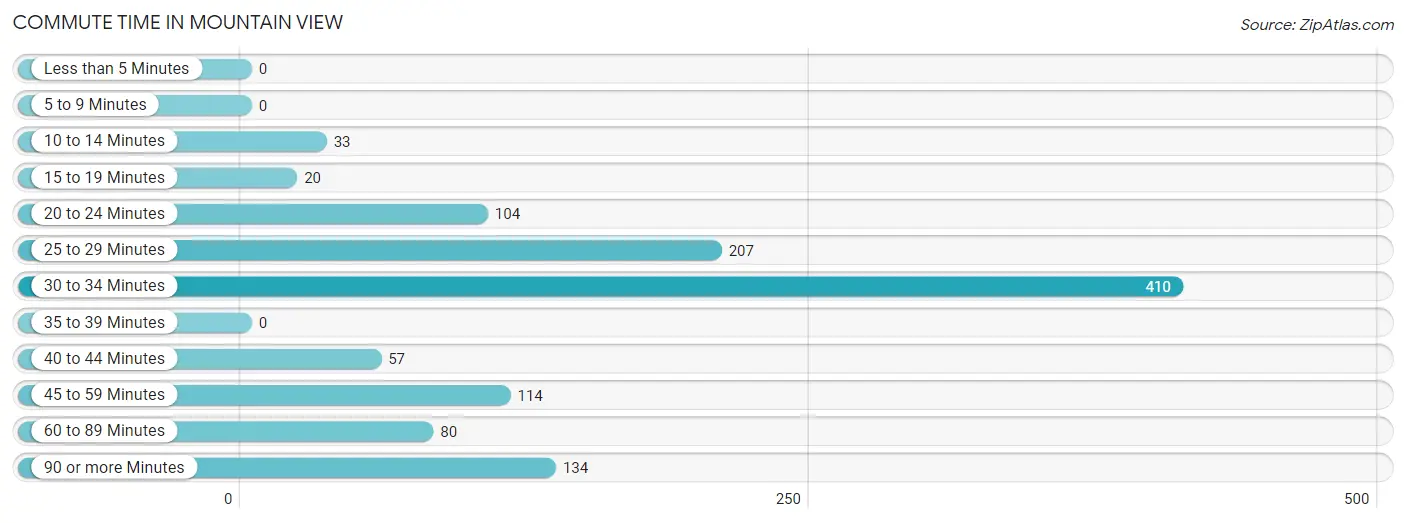
| Commute Time | # Commuters | % Commuters |
| Less than 5 Minutes | 0 | 0.0% |
| 5 to 9 Minutes | 0 | 0.0% |
| 10 to 14 Minutes | 33 | 2.9% |
| 15 to 19 Minutes | 20 | 1.7% |
| 20 to 24 Minutes | 104 | 9.0% |
| 25 to 29 Minutes | 207 | 17.9% |
| 30 to 34 Minutes | 410 | 35.4% |
| 35 to 39 Minutes | 0 | 0.0% |
| 40 to 44 Minutes | 57 | 4.9% |
| 45 to 59 Minutes | 114 | 9.8% |
| 60 to 89 Minutes | 80 | 6.9% |
| 90 or more Minutes | 134 | 11.6% |
Commute Time by Sex in Mountain View
The most common commute times in Mountain View are 30 to 34 minutes (225 commuters, 36.8%) for males and 30 to 34 minutes (185 commuters, 33.8%) for females.
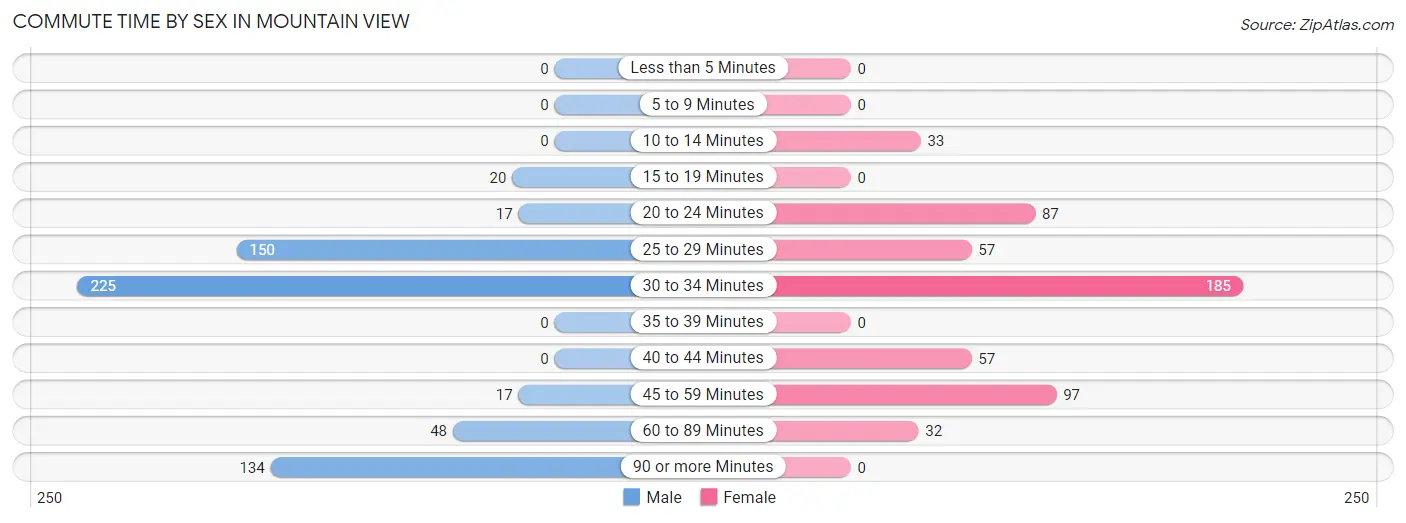
| Commute Time | Male | Female |
| Less than 5 Minutes | 0 (0.0%) | 0 (0.0%) |
| 5 to 9 Minutes | 0 (0.0%) | 0 (0.0%) |
| 10 to 14 Minutes | 0 (0.0%) | 33 (6.0%) |
| 15 to 19 Minutes | 20 (3.3%) | 0 (0.0%) |
| 20 to 24 Minutes | 17 (2.8%) | 87 (15.9%) |
| 25 to 29 Minutes | 150 (24.5%) | 57 (10.4%) |
| 30 to 34 Minutes | 225 (36.8%) | 185 (33.8%) |
| 35 to 39 Minutes | 0 (0.0%) | 0 (0.0%) |
| 40 to 44 Minutes | 0 (0.0%) | 57 (10.4%) |
| 45 to 59 Minutes | 17 (2.8%) | 97 (17.7%) |
| 60 to 89 Minutes | 48 (7.9%) | 32 (5.8%) |
| 90 or more Minutes | 134 (21.9%) | 0 (0.0%) |
Time of Departure to Work by Sex in Mountain View
The most frequent times of departure to work in Mountain View are 4:00 PM to 11:59 PM (201, 32.9%) for males and 9:00 AM to 9:59 AM (153, 27.9%) for females.
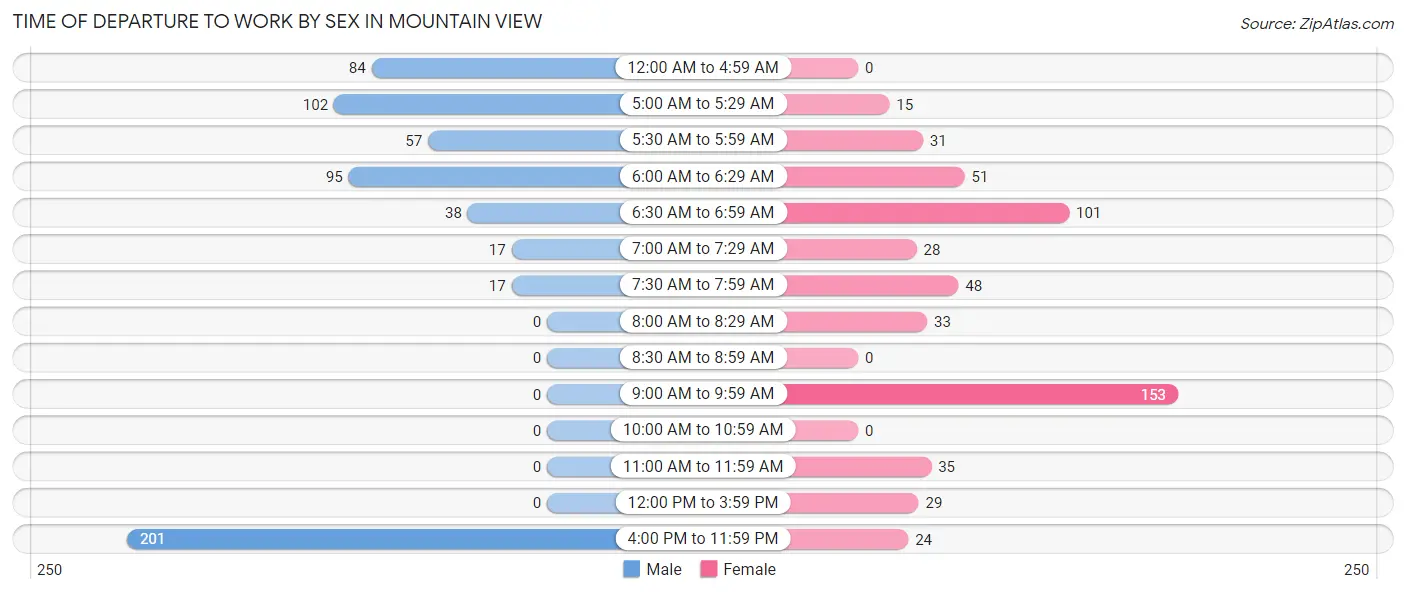
| Time of Departure | Male | Female |
| 12:00 AM to 4:59 AM | 84 (13.8%) | 0 (0.0%) |
| 5:00 AM to 5:29 AM | 102 (16.7%) | 15 (2.7%) |
| 5:30 AM to 5:59 AM | 57 (9.3%) | 31 (5.7%) |
| 6:00 AM to 6:29 AM | 95 (15.5%) | 51 (9.3%) |
| 6:30 AM to 6:59 AM | 38 (6.2%) | 101 (18.4%) |
| 7:00 AM to 7:29 AM | 17 (2.8%) | 28 (5.1%) |
| 7:30 AM to 7:59 AM | 17 (2.8%) | 48 (8.8%) |
| 8:00 AM to 8:29 AM | 0 (0.0%) | 33 (6.0%) |
| 8:30 AM to 8:59 AM | 0 (0.0%) | 0 (0.0%) |
| 9:00 AM to 9:59 AM | 0 (0.0%) | 153 (27.9%) |
| 10:00 AM to 10:59 AM | 0 (0.0%) | 0 (0.0%) |
| 11:00 AM to 11:59 AM | 0 (0.0%) | 35 (6.4%) |
| 12:00 PM to 3:59 PM | 0 (0.0%) | 29 (5.3%) |
| 4:00 PM to 11:59 PM | 201 (32.9%) | 24 (4.4%) |
| Total | 611 (100.0%) | 548 (100.0%) |
Housing Occupancy in Mountain View
Occupancy by Ownership in Mountain View
Of the total 1,150 dwellings in Mountain View, owner-occupied units account for 740 (64.3%), while renter-occupied units make up 410 (35.6%).
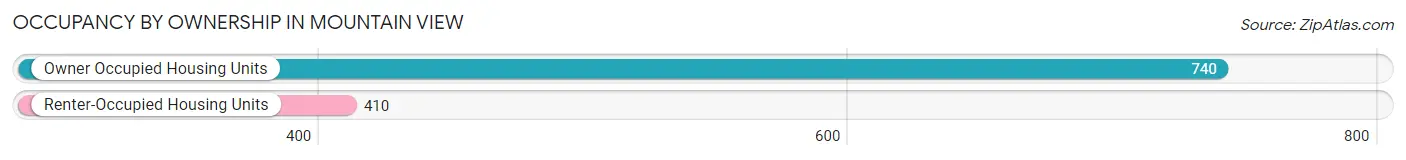
| Occupancy | # Housing Units | % Housing Units |
| Owner Occupied Housing Units | 740 | 64.3% |
| Renter-Occupied Housing Units | 410 | 35.6% |
| Total Occupied Housing Units | 1,150 | 100.0% |
Occupancy by Household Size in Mountain View
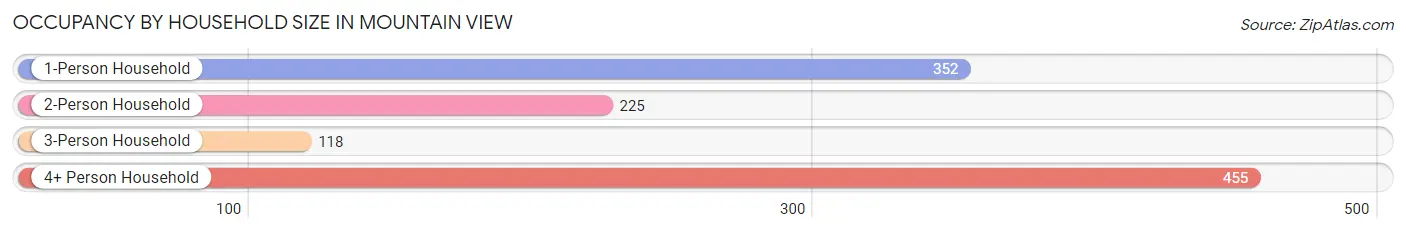
| Household Size | # Housing Units | % Housing Units |
| 1-Person Household | 352 | 30.6% |
| 2-Person Household | 225 | 19.6% |
| 3-Person Household | 118 | 10.3% |
| 4+ Person Household | 455 | 39.6% |
| Total Housing Units | 1,150 | 100.0% |
Occupancy by Ownership by Household Size in Mountain View
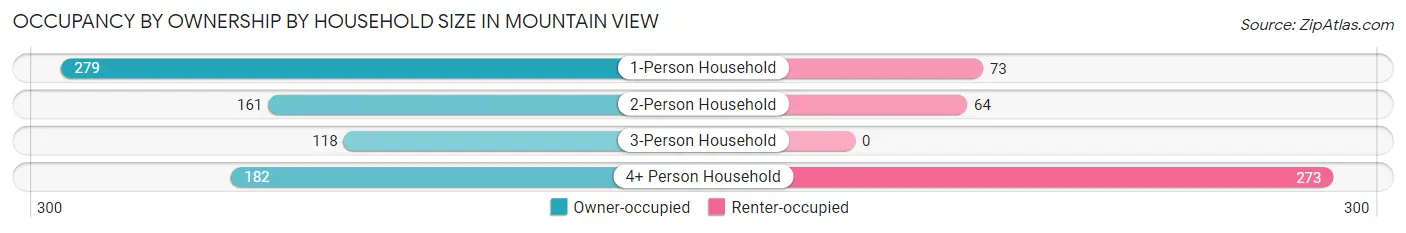
| Household Size | Owner-occupied | Renter-occupied |
| 1-Person Household | 279 (79.3%) | 73 (20.7%) |
| 2-Person Household | 161 (71.6%) | 64 (28.4%) |
| 3-Person Household | 118 (100.0%) | 0 (0.0%) |
| 4+ Person Household | 182 (40.0%) | 273 (60.0%) |
| Total Housing Units | 740 (64.3%) | 410 (35.6%) |
Occupancy by Educational Attainment in Mountain View
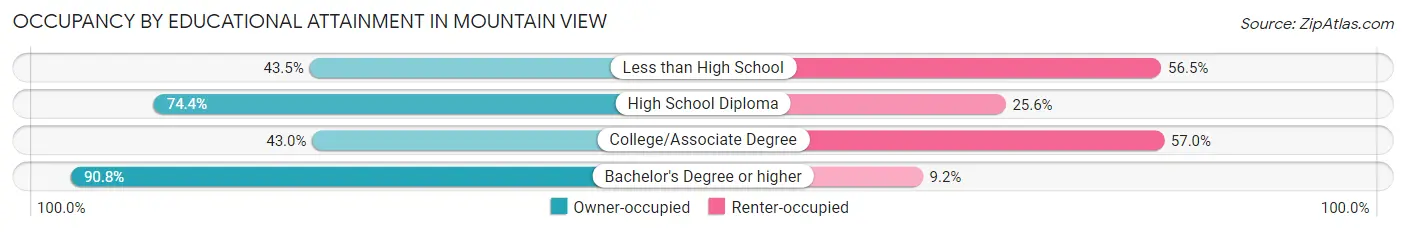
| Household Size | Owner-occupied | Renter-occupied |
| Less than High School | 77 (43.5%) | 100 (56.5%) |
| High School Diploma | 383 (74.4%) | 132 (25.6%) |
| College/Associate Degree | 122 (43.0%) | 162 (57.0%) |
| Bachelor's Degree or higher | 158 (90.8%) | 16 (9.2%) |
Occupancy by Age of Householder in Mountain View
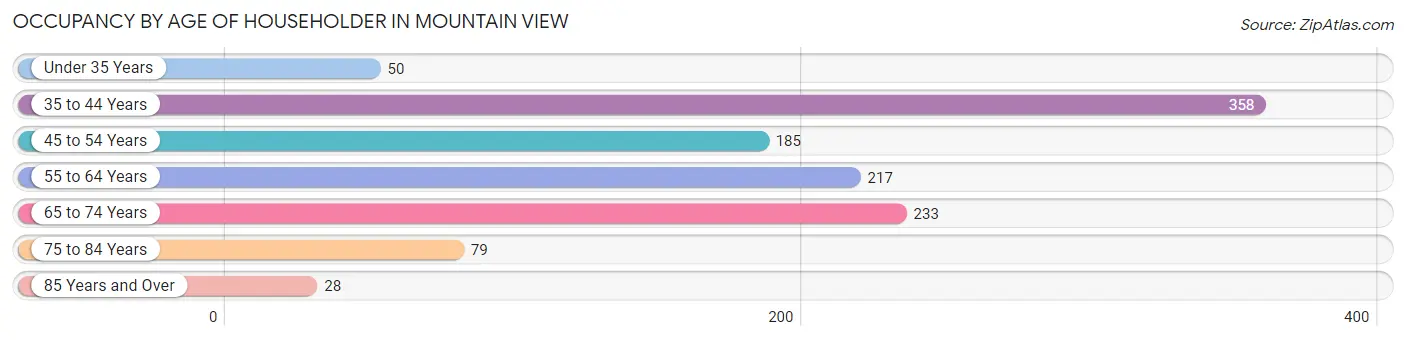
| Age Bracket | # Households | % Households |
| Under 35 Years | 50 | 4.3% |
| 35 to 44 Years | 358 | 31.1% |
| 45 to 54 Years | 185 | 16.1% |
| 55 to 64 Years | 217 | 18.9% |
| 65 to 74 Years | 233 | 20.3% |
| 75 to 84 Years | 79 | 6.9% |
| 85 Years and Over | 28 | 2.4% |
| Total | 1,150 | 100.0% |
Housing Finances in Mountain View
Median Income by Occupancy in Mountain View
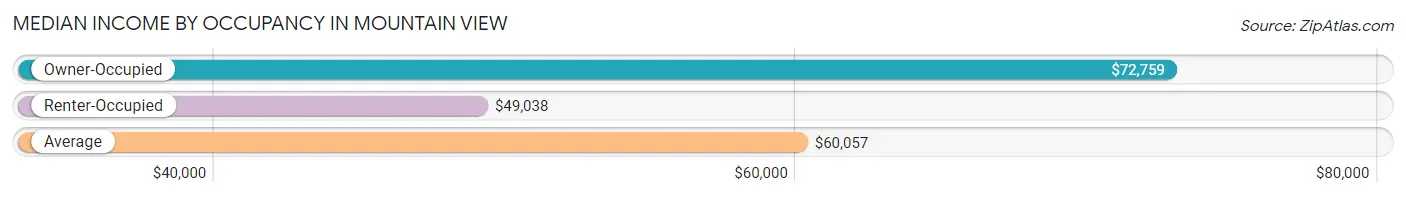
| Occupancy Type | # Households | Median Income |
| Owner-Occupied | 740 (64.3%) | $72,759 |
| Renter-Occupied | 410 (35.6%) | $49,038 |
| Average | 1,150 (100.0%) | $60,057 |
Occupancy by Householder Income Bracket in Mountain View
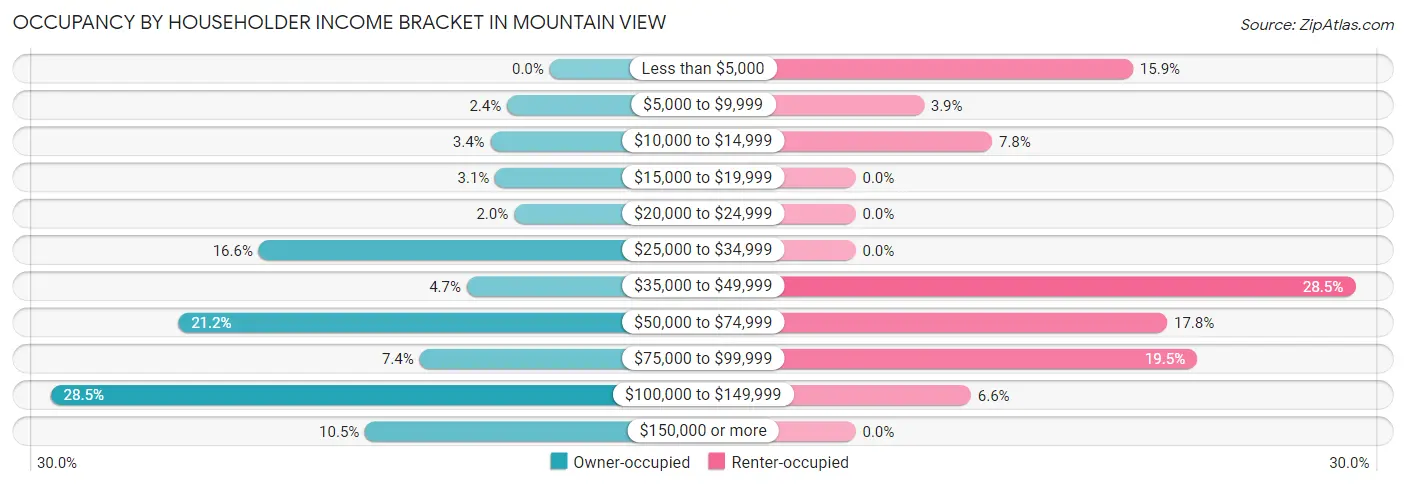
| Income Bracket | Owner-occupied | Renter-occupied |
| Less than $5,000 | 0 (0.0%) | 65 (15.9%) |
| $5,000 to $9,999 | 18 (2.4%) | 16 (3.9%) |
| $10,000 to $14,999 | 25 (3.4%) | 32 (7.8%) |
| $15,000 to $19,999 | 23 (3.1%) | 0 (0.0%) |
| $20,000 to $24,999 | 15 (2.0%) | 0 (0.0%) |
| $25,000 to $34,999 | 123 (16.6%) | 0 (0.0%) |
| $35,000 to $49,999 | 35 (4.7%) | 117 (28.5%) |
| $50,000 to $74,999 | 157 (21.2%) | 73 (17.8%) |
| $75,000 to $99,999 | 55 (7.4%) | 80 (19.5%) |
| $100,000 to $149,999 | 211 (28.5%) | 27 (6.6%) |
| $150,000 or more | 78 (10.5%) | 0 (0.0%) |
| Total | 740 (100.0%) | 410 (100.0%) |
Monthly Housing Cost Tiers in Mountain View
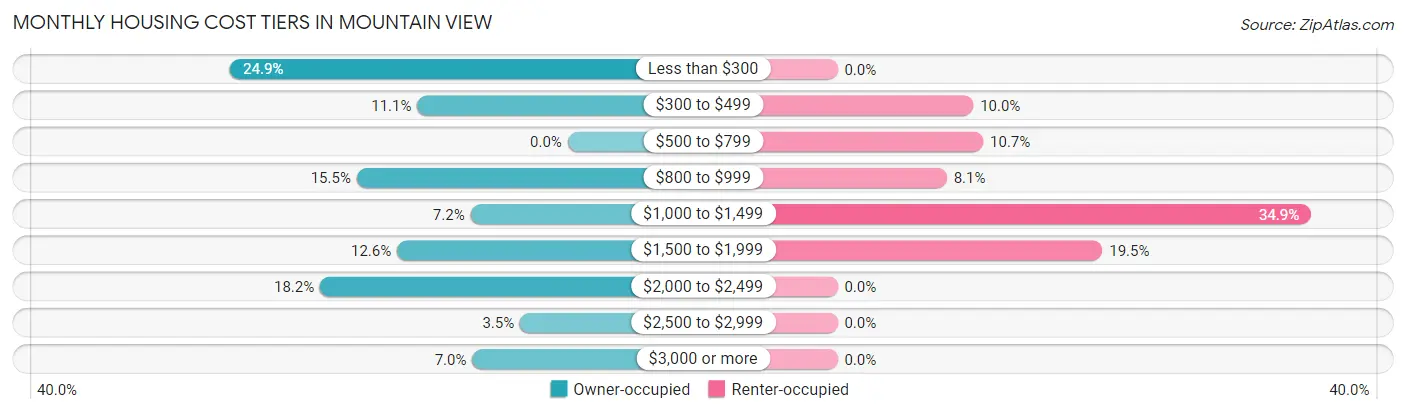
| Monthly Cost | Owner-occupied | Renter-occupied |
| Less than $300 | 184 (24.9%) | 0 (0.0%) |
| $300 to $499 | 82 (11.1%) | 41 (10.0%) |
| $500 to $799 | 0 (0.0%) | 44 (10.7%) |
| $800 to $999 | 115 (15.5%) | 33 (8.1%) |
| $1,000 to $1,499 | 53 (7.2%) | 143 (34.9%) |
| $1,500 to $1,999 | 93 (12.6%) | 80 (19.5%) |
| $2,000 to $2,499 | 135 (18.2%) | 0 (0.0%) |
| $2,500 to $2,999 | 26 (3.5%) | 0 (0.0%) |
| $3,000 or more | 52 (7.0%) | 0 (0.0%) |
| Total | 740 (100.0%) | 410 (100.0%) |
Physical Housing Characteristics in Mountain View
Housing Structures in Mountain View
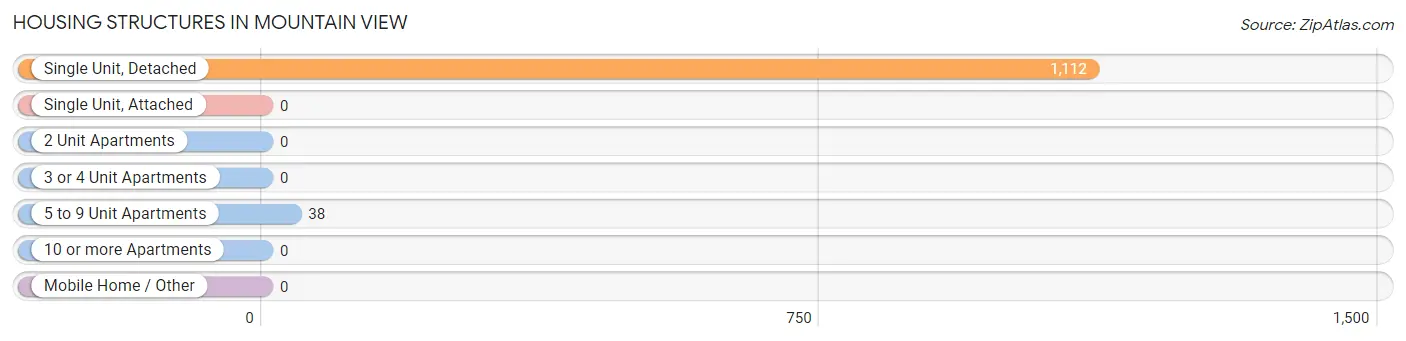
| Structure Type | # Housing Units | % Housing Units |
| Single Unit, Detached | 1,112 | 96.7% |
| Single Unit, Attached | 0 | 0.0% |
| 2 Unit Apartments | 0 | 0.0% |
| 3 or 4 Unit Apartments | 0 | 0.0% |
| 5 to 9 Unit Apartments | 38 | 3.3% |
| 10 or more Apartments | 0 | 0.0% |
| Mobile Home / Other | 0 | 0.0% |
| Total | 1,150 | 100.0% |
Housing Structures by Occupancy in Mountain View
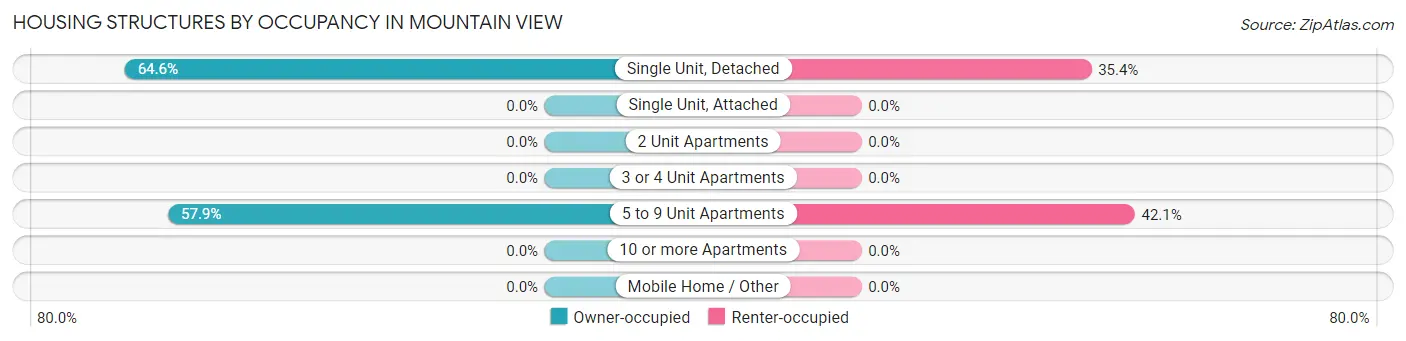
| Structure Type | Owner-occupied | Renter-occupied |
| Single Unit, Detached | 718 (64.6%) | 394 (35.4%) |
| Single Unit, Attached | 0 (0.0%) | 0 (0.0%) |
| 2 Unit Apartments | 0 (0.0%) | 0 (0.0%) |
| 3 or 4 Unit Apartments | 0 (0.0%) | 0 (0.0%) |
| 5 to 9 Unit Apartments | 22 (57.9%) | 16 (42.1%) |
| 10 or more Apartments | 0 (0.0%) | 0 (0.0%) |
| Mobile Home / Other | 0 (0.0%) | 0 (0.0%) |
| Total | 740 (64.3%) | 410 (35.6%) |
Housing Structures by Number of Rooms in Mountain View
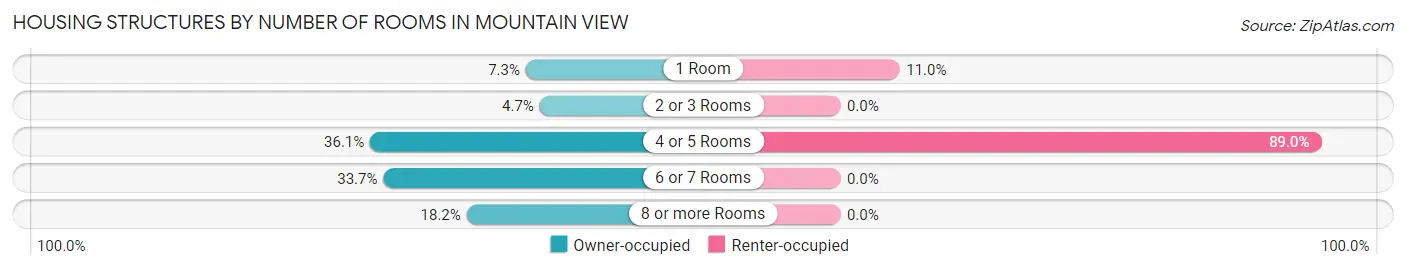
| Number of Rooms | Owner-occupied | Renter-occupied |
| 1 Room | 54 (7.3%) | 45 (11.0%) |
| 2 or 3 Rooms | 35 (4.7%) | 0 (0.0%) |
| 4 or 5 Rooms | 267 (36.1%) | 365 (89.0%) |
| 6 or 7 Rooms | 249 (33.7%) | 0 (0.0%) |
| 8 or more Rooms | 135 (18.2%) | 0 (0.0%) |
| Total | 740 (100.0%) | 410 (100.0%) |
Housing Structure by Heating Type in Mountain View
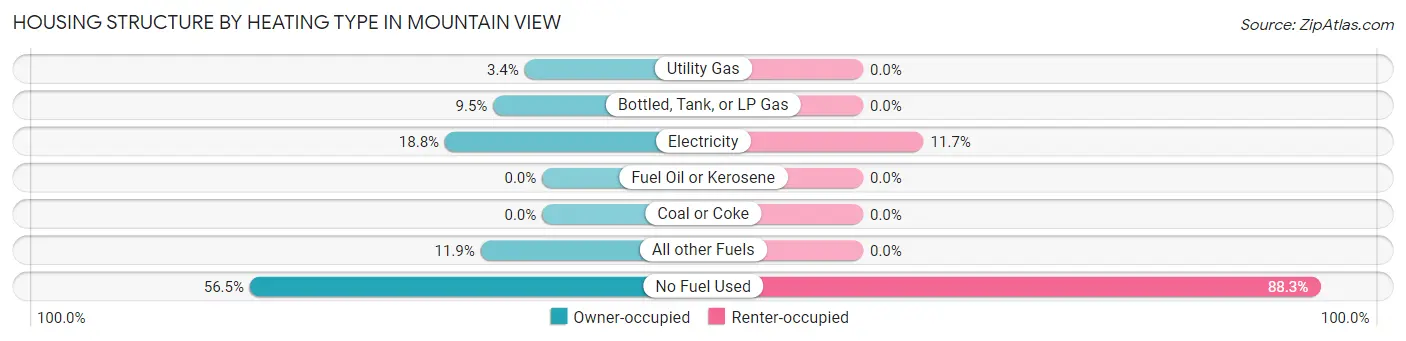
| Heating Type | Owner-occupied | Renter-occupied |
| Utility Gas | 25 (3.4%) | 0 (0.0%) |
| Bottled, Tank, or LP Gas | 70 (9.5%) | 0 (0.0%) |
| Electricity | 139 (18.8%) | 48 (11.7%) |
| Fuel Oil or Kerosene | 0 (0.0%) | 0 (0.0%) |
| Coal or Coke | 0 (0.0%) | 0 (0.0%) |
| All other Fuels | 88 (11.9%) | 0 (0.0%) |
| No Fuel Used | 418 (56.5%) | 362 (88.3%) |
| Total | 740 (100.0%) | 410 (100.0%) |
Household Vehicle Usage in Mountain View
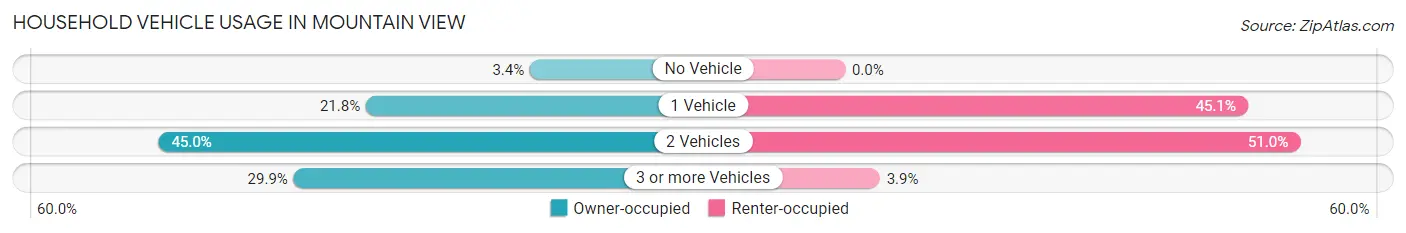
| Vehicles per Household | Owner-occupied | Renter-occupied |
| No Vehicle | 25 (3.4%) | 0 (0.0%) |
| 1 Vehicle | 161 (21.8%) | 185 (45.1%) |
| 2 Vehicles | 333 (45.0%) | 209 (51.0%) |
| 3 or more Vehicles | 221 (29.9%) | 16 (3.9%) |
| Total | 740 (100.0%) | 410 (100.0%) |
Real Estate & Mortgages in Mountain View
Real Estate and Mortgage Overview in Mountain View
| Characteristic | Without Mortgage | With Mortgage |
| Housing Units | 288 | 452 |
| Median Property Value | $234,000 | $308,100 |
| Median Household Income | $30,435 | $78 |
| Monthly Housing Costs | $255 | $52 |
| Real Estate Taxes | $543 | $0 |
Property Value by Mortgage Status in Mountain View
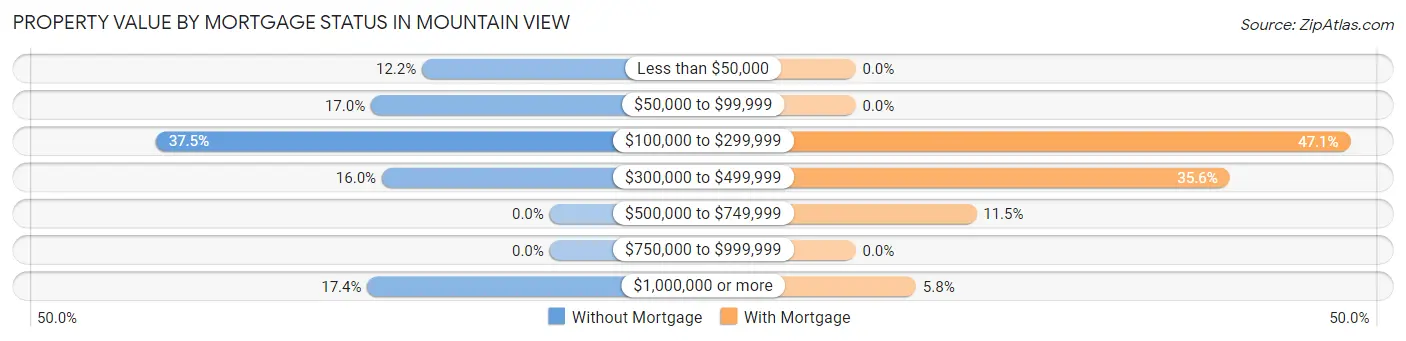
| Property Value | Without Mortgage | With Mortgage |
| Less than $50,000 | 35 (12.1%) | 0 (0.0%) |
| $50,000 to $99,999 | 49 (17.0%) | 0 (0.0%) |
| $100,000 to $299,999 | 108 (37.5%) | 213 (47.1%) |
| $300,000 to $499,999 | 46 (16.0%) | 161 (35.6%) |
| $500,000 to $749,999 | 0 (0.0%) | 52 (11.5%) |
| $750,000 to $999,999 | 0 (0.0%) | 0 (0.0%) |
| $1,000,000 or more | 50 (17.4%) | 26 (5.8%) |
| Total | 288 (100.0%) | 452 (100.0%) |
Household Income by Mortgage Status in Mountain View
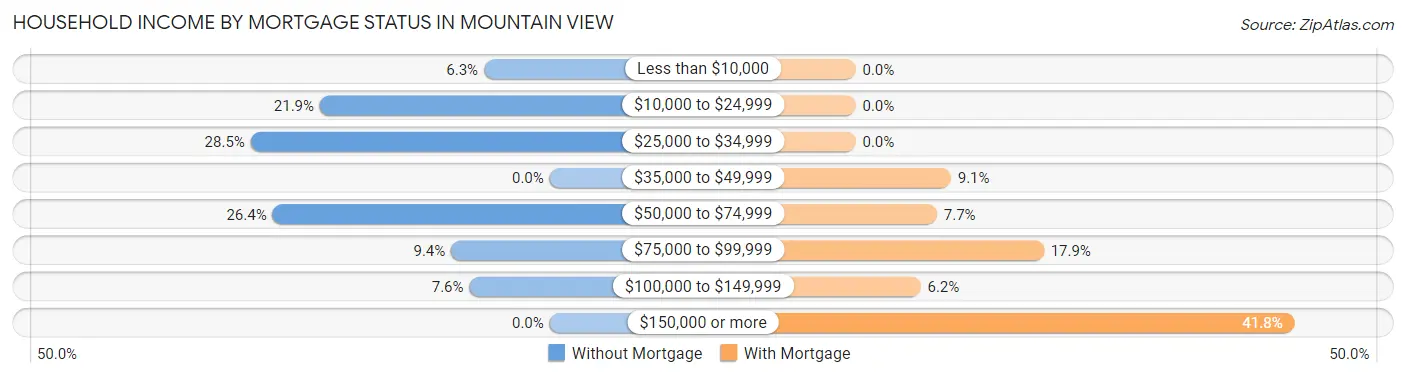
| Household Income | Without Mortgage | With Mortgage |
| Less than $10,000 | 18 (6.2%) | 0 (0.0%) |
| $10,000 to $24,999 | 63 (21.9%) | 0 (0.0%) |
| $25,000 to $34,999 | 82 (28.5%) | 0 (0.0%) |
| $35,000 to $49,999 | 0 (0.0%) | 41 (9.1%) |
| $50,000 to $74,999 | 76 (26.4%) | 35 (7.7%) |
| $75,000 to $99,999 | 27 (9.4%) | 81 (17.9%) |
| $100,000 to $149,999 | 22 (7.6%) | 28 (6.2%) |
| $150,000 or more | 0 (0.0%) | 189 (41.8%) |
| Total | 288 (100.0%) | 452 (100.0%) |
Property Value to Household Income Ratio in Mountain View
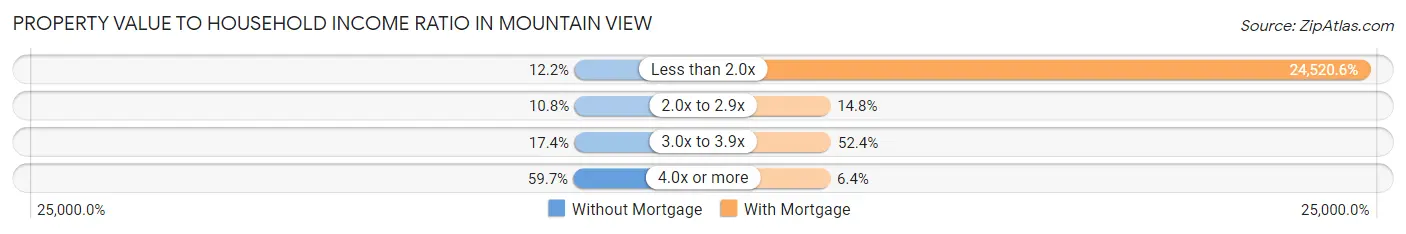
| Value-to-Income Ratio | Without Mortgage | With Mortgage |
| Less than 2.0x | 35 (12.1%) | 110,833 (24,520.6%) |
| 2.0x to 2.9x | 31 (10.8%) | 67 (14.8%) |
| 3.0x to 3.9x | 50 (17.4%) | 237 (52.4%) |
| 4.0x or more | 172 (59.7%) | 29 (6.4%) |
| Total | 288 (100.0%) | 452 (100.0%) |
Real Estate Taxes by Mortgage Status in Mountain View
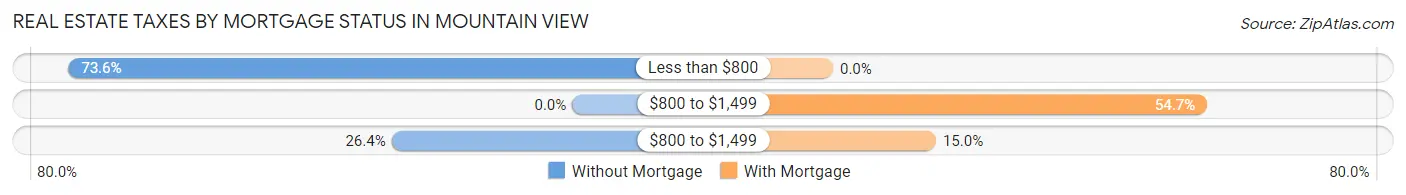
| Property Taxes | Without Mortgage | With Mortgage |
| Less than $800 | 212 (73.6%) | 0 (0.0%) |
| $800 to $1,499 | 0 (0.0%) | 247 (54.6%) |
| $800 to $1,499 | 76 (26.4%) | 68 (15.0%) |
| Total | 288 (100.0%) | 452 (100.0%) |
Health & Disability in Mountain View
Health Insurance Coverage by Age in Mountain View
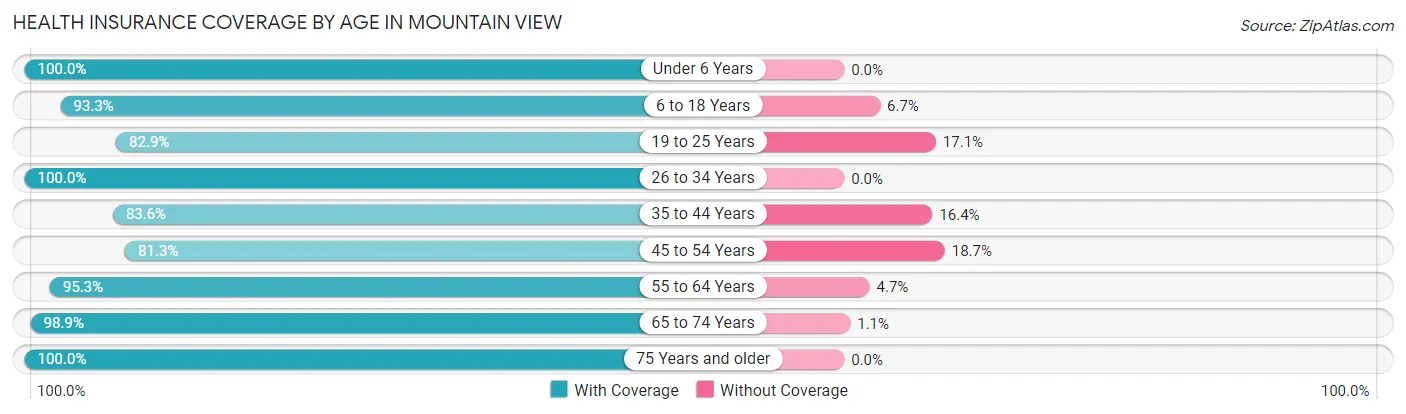
| Age Bracket | With Coverage | Without Coverage |
| Under 6 Years | 334 (100.0%) | 0 (0.0%) |
| 6 to 18 Years | 782 (93.3%) | 56 (6.7%) |
| 19 to 25 Years | 364 (82.9%) | 75 (17.1%) |
| 26 to 34 Years | 162 (100.0%) | 0 (0.0%) |
| 35 to 44 Years | 473 (83.6%) | 93 (16.4%) |
| 45 to 54 Years | 360 (81.3%) | 83 (18.7%) |
| 55 to 64 Years | 303 (95.3%) | 15 (4.7%) |
| 65 to 74 Years | 353 (98.9%) | 4 (1.1%) |
| 75 Years and older | 170 (100.0%) | 0 (0.0%) |
| Total | 3,301 (91.0%) | 326 (9.0%) |
Health Insurance Coverage by Citizenship Status in Mountain View
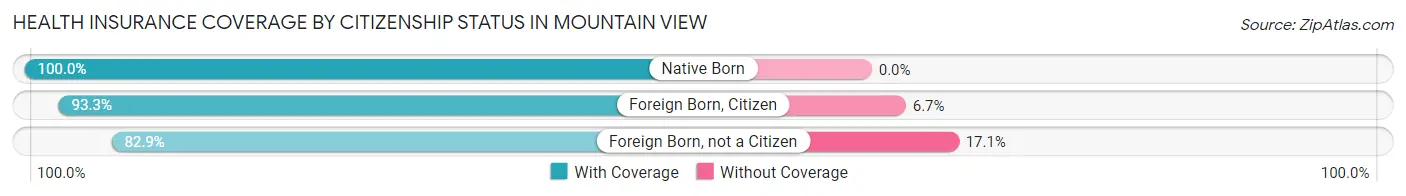
| Citizenship Status | With Coverage | Without Coverage |
| Native Born | 334 (100.0%) | 0 (0.0%) |
| Foreign Born, Citizen | 782 (93.3%) | 56 (6.7%) |
| Foreign Born, not a Citizen | 364 (82.9%) | 75 (17.1%) |
Health Insurance Coverage by Household Income in Mountain View
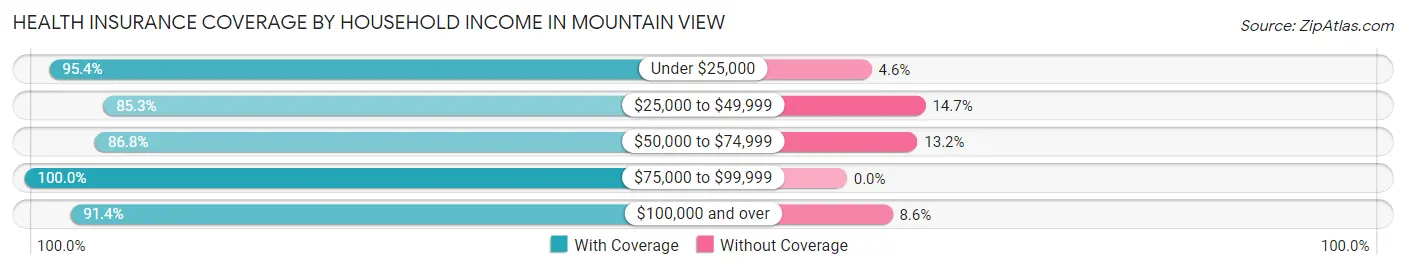
| Household Income | With Coverage | Without Coverage |
| Under $25,000 | 493 (95.4%) | 24 (4.6%) |
| $25,000 to $49,999 | 509 (85.3%) | 88 (14.7%) |
| $50,000 to $74,999 | 768 (86.8%) | 117 (13.2%) |
| $75,000 to $99,999 | 527 (100.0%) | 0 (0.0%) |
| $100,000 and over | 994 (91.4%) | 93 (8.6%) |
Public vs Private Health Insurance Coverage by Age in Mountain View
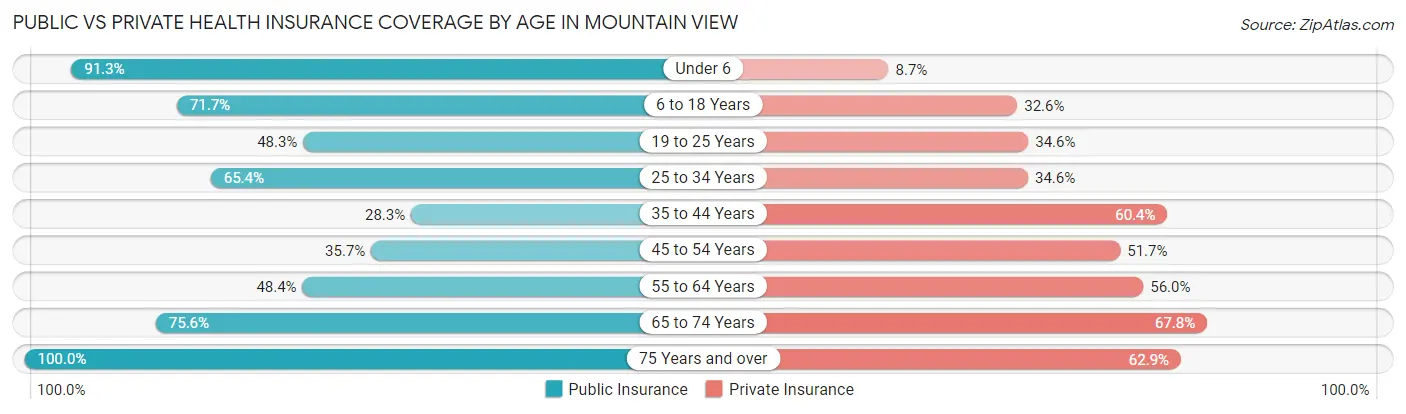
| Age Bracket | Public Insurance | Private Insurance |
| Under 6 | 305 (91.3%) | 29 (8.7%) |
| 6 to 18 Years | 601 (71.7%) | 273 (32.6%) |
| 19 to 25 Years | 212 (48.3%) | 152 (34.6%) |
| 25 to 34 Years | 106 (65.4%) | 56 (34.6%) |
| 35 to 44 Years | 160 (28.3%) | 342 (60.4%) |
| 45 to 54 Years | 158 (35.7%) | 229 (51.7%) |
| 55 to 64 Years | 154 (48.4%) | 178 (56.0%) |
| 65 to 74 Years | 270 (75.6%) | 242 (67.8%) |
| 75 Years and over | 170 (100.0%) | 107 (62.9%) |
| Total | 2,136 (58.9%) | 1,608 (44.3%) |
Disability Status by Sex by Age in Mountain View
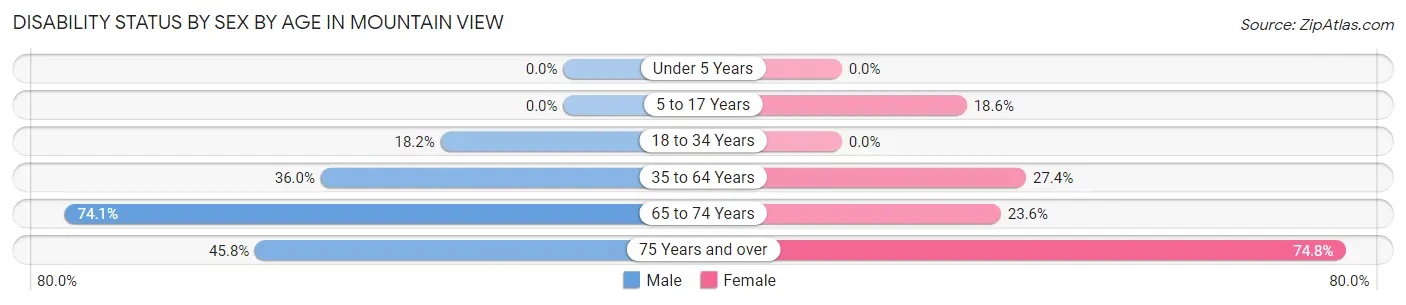
| Age Bracket | Male | Female |
| Under 5 Years | 0 (0.0%) | 0 (0.0%) |
| 5 to 17 Years | 0 (0.0%) | 100 (18.5%) |
| 18 to 34 Years | 56 (18.2%) | 0 (0.0%) |
| 35 to 64 Years | 241 (36.0%) | 180 (27.4%) |
| 65 to 74 Years | 117 (74.1%) | 47 (23.6%) |
| 75 Years and over | 27 (45.8%) | 83 (74.8%) |
Disability Class by Sex by Age in Mountain View
Disability Class: Hearing Difficulty
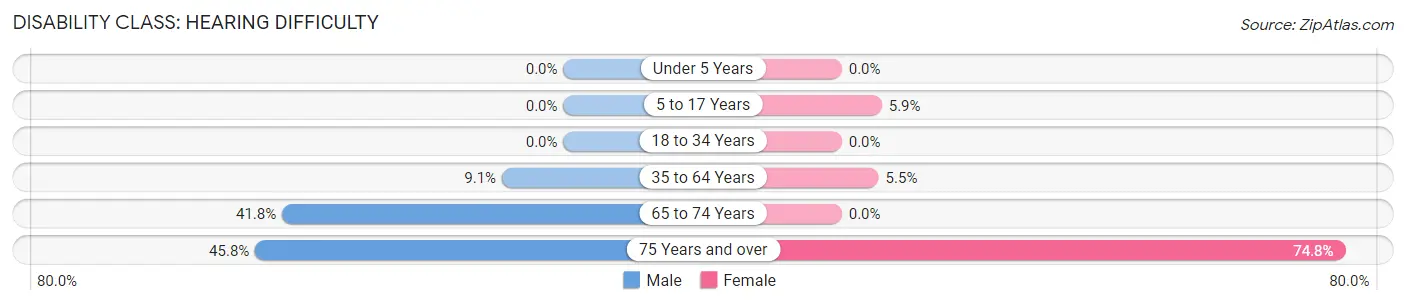
| Age Bracket | Male | Female |
| Under 5 Years | 0 (0.0%) | 0 (0.0%) |
| 5 to 17 Years | 0 (0.0%) | 32 (5.9%) |
| 18 to 34 Years | 0 (0.0%) | 0 (0.0%) |
| 35 to 64 Years | 61 (9.1%) | 36 (5.5%) |
| 65 to 74 Years | 66 (41.8%) | 0 (0.0%) |
| 75 Years and over | 27 (45.8%) | 83 (74.8%) |
Disability Class: Vision Difficulty
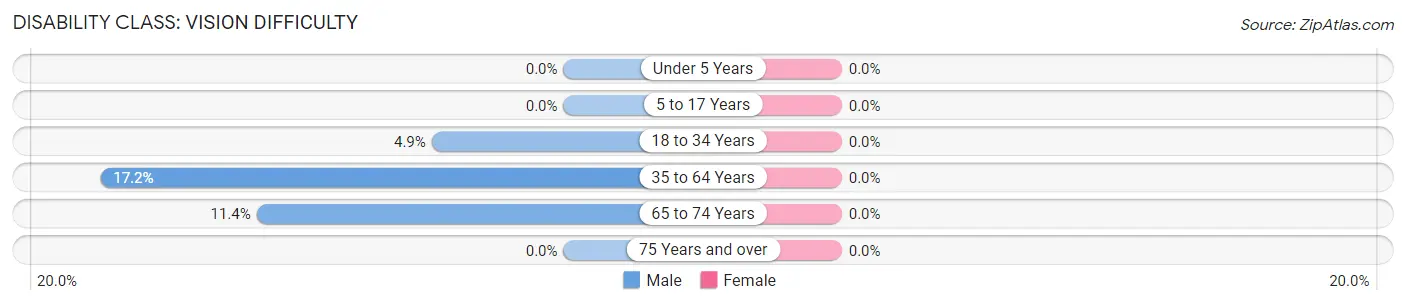
| Age Bracket | Male | Female |
| Under 5 Years | 0 (0.0%) | 0 (0.0%) |
| 5 to 17 Years | 0 (0.0%) | 0 (0.0%) |
| 18 to 34 Years | 15 (4.9%) | 0 (0.0%) |
| 35 to 64 Years | 115 (17.2%) | 0 (0.0%) |
| 65 to 74 Years | 18 (11.4%) | 0 (0.0%) |
| 75 Years and over | 0 (0.0%) | 0 (0.0%) |
Disability Class: Cognitive Difficulty
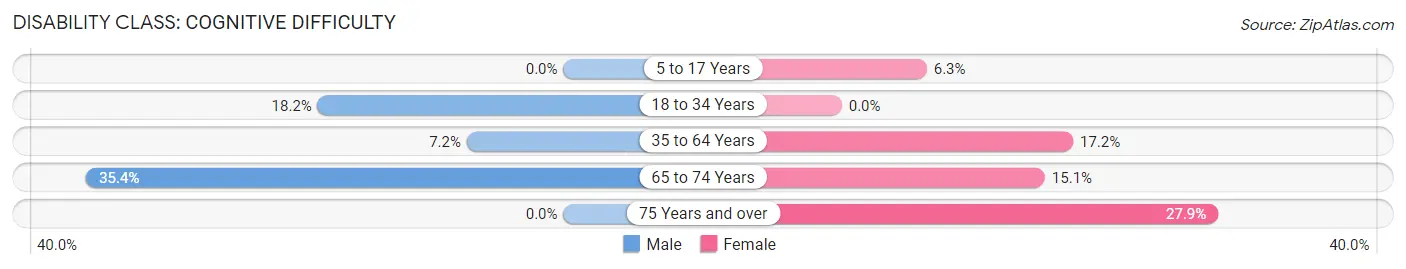
| Age Bracket | Male | Female |
| 5 to 17 Years | 0 (0.0%) | 34 (6.3%) |
| 18 to 34 Years | 56 (18.2%) | 0 (0.0%) |
| 35 to 64 Years | 48 (7.2%) | 113 (17.2%) |
| 65 to 74 Years | 56 (35.4%) | 30 (15.1%) |
| 75 Years and over | 0 (0.0%) | 31 (27.9%) |
Disability Class: Ambulatory Difficulty
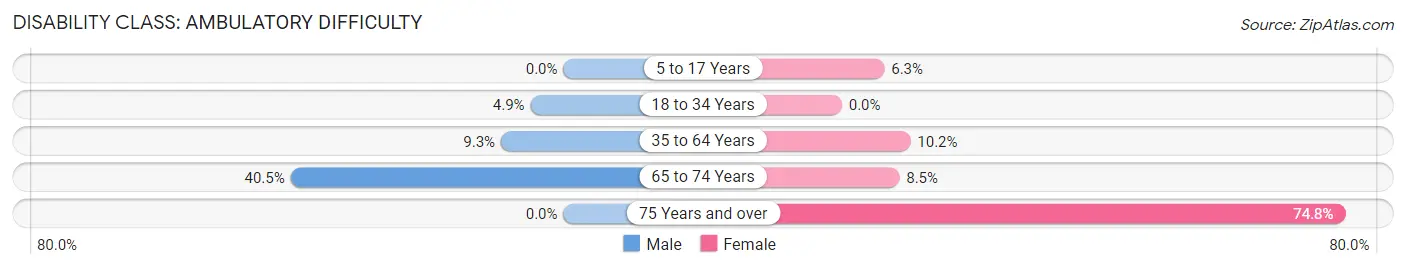
| Age Bracket | Male | Female |
| 5 to 17 Years | 0 (0.0%) | 34 (6.3%) |
| 18 to 34 Years | 15 (4.9%) | 0 (0.0%) |
| 35 to 64 Years | 62 (9.3%) | 67 (10.2%) |
| 65 to 74 Years | 64 (40.5%) | 17 (8.5%) |
| 75 Years and over | 0 (0.0%) | 83 (74.8%) |
Disability Class: Self-Care Difficulty
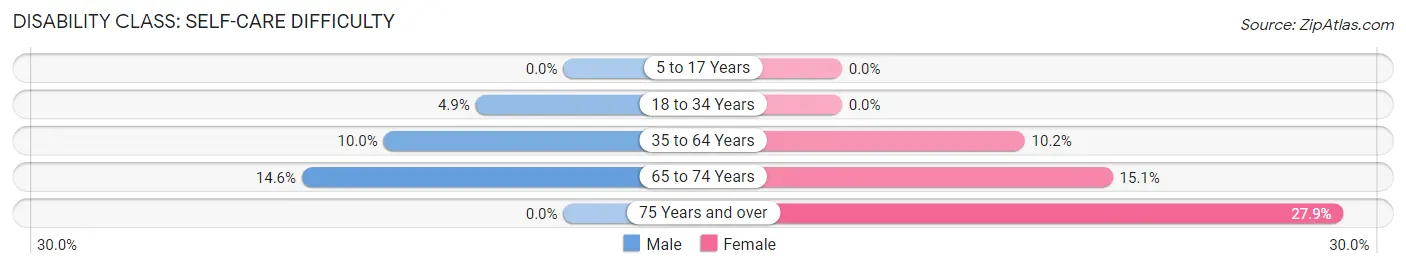
| Age Bracket | Male | Female |
| 5 to 17 Years | 0 (0.0%) | 0 (0.0%) |
| 18 to 34 Years | 15 (4.9%) | 0 (0.0%) |
| 35 to 64 Years | 67 (10.0%) | 67 (10.2%) |
| 65 to 74 Years | 23 (14.6%) | 30 (15.1%) |
| 75 Years and over | 0 (0.0%) | 31 (27.9%) |
Technology Access in Mountain View
Computing Device Access in Mountain View
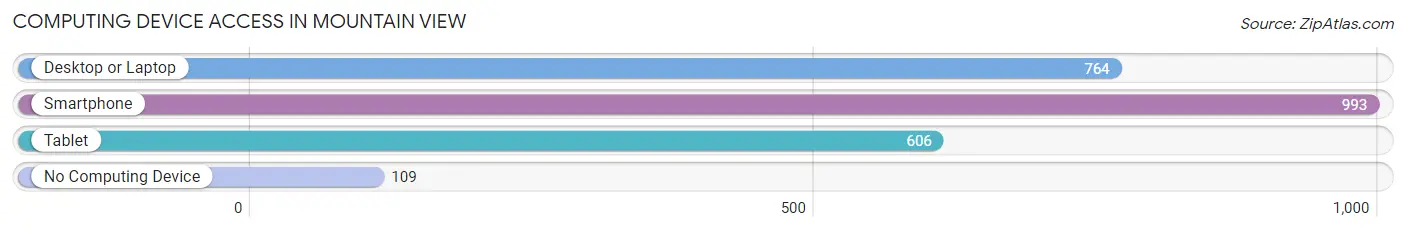
| Device Type | # Households | % Households |
| Desktop or Laptop | 764 | 66.4% |
| Smartphone | 993 | 86.4% |
| Tablet | 606 | 52.7% |
| No Computing Device | 109 | 9.5% |
| Total | 1,150 | 100.0% |
Internet Access in Mountain View
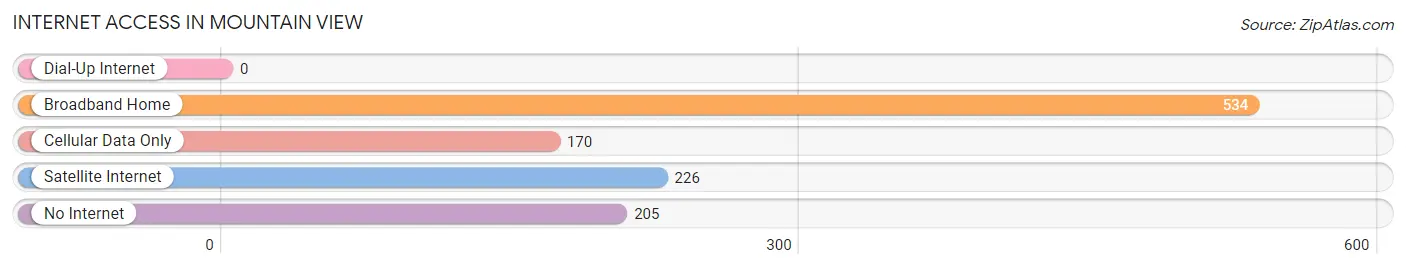
| Internet Type | # Households | % Households |
| Dial-Up Internet | 0 | 0.0% |
| Broadband Home | 534 | 46.4% |
| Cellular Data Only | 170 | 14.8% |
| Satellite Internet | 226 | 19.7% |
| No Internet | 205 | 17.8% |
| Total | 1,150 | 100.0% |
Mountain View Summary
Mountain View is a census-designated place (CDP) located in the state of Hawaii, United States. It is located in the City and County of Honolulu, on the island of Oahu. As of the 2010 census, the population of Mountain View was 8,931.
Geography
Mountain View is located at 21°25'17" North, 157°59'45" West (21.4214, -157.9958). It is situated at an elevation of 645 feet (197 m) above sea level. The CDP has a total area of 2.2 square miles (5.7 km2), all of which is land.
History
Mountain View was originally a small agricultural community, with a population of just over 1,000 in the 1950s. The area was primarily used for growing sugar cane and pineapple. In the 1960s, the area began to experience rapid growth as the population of Honolulu increased. The area was annexed by the City and County of Honolulu in 1968.
Since then, Mountain View has become a residential area, with many homes and businesses. The area is also home to several schools, including Mountain View Elementary School, Mountain View Middle School, and Mountain View High School.
Economy
Mountain View is primarily a residential area, with many homes and businesses. The area is also home to several schools, including Mountain View Elementary School, Mountain View Middle School, and Mountain View High School.
The economy of Mountain View is largely driven by the tourism industry. The area is home to several hotels and resorts, as well as a variety of restaurants and shops. The area is also home to several parks and recreational areas, including the popular Kualoa Regional Park.
Demographics
As of the 2010 census, there were 8,931 people, 2,945 households, and 2,072 families residing in the CDP. The population density was 4,068.3 people per square mile (1,569.2/km2). There were 3,095 housing units at an average density of 1,400.3 per square mile (540.3/km2). The racial makeup of the CDP was 33.2% White, 0.7% African American, 0.3% Native American, 28.2% Asian, 8.2% Pacific Islander, 0.7% from other races, and 28.7% from two or more races. Hispanic or Latino of any race were 8.2% of the population.
There were 2,945 households, out of which 33.2% had children under the age of 18 living with them, 51.2% were married couples living together, 11.7% had a female householder with no husband present, and 30.7% were non-families. 24.2% of all households were made up of individuals, and 8.2% had someone living alone who was 65 years of age or older. The average household size was 2.99 and the average family size was 3.54.
In the CDP, the population was spread out, with 25.2% under the age of 18, 8.2% from 18 to 24, 28.2% from 25 to 44, 25.2% from 45 to 64, and 13.2% who were 65 years of age or older. The median age was 37 years. For every 100 females, there were 99.2 males. For every 100 females age 18 and over, there were 97.2 males.
The median income for a household in the CDP was $50,938, and the median income for a family was $56,938. Males had a median income of $37,938 versus $30,938 for females. The per capita income for the CDP was $20,938. About 8.2% of families and 11.7% of the population were below the poverty line, including 15.2% of those under age 18 and 8.2% of those age 65 or over.
Common Questions
What is Per Capita Income in Mountain View?
Per Capita income in Mountain View is $23,168.
What is the Median Family Income in Mountain View?
Median Family Income in Mountain View is $57,159.
What is the Median Household income in Mountain View?
Median Household Income in Mountain View is $60,057.
What is Income or Wage Gap in Mountain View?
Income or Wage Gap in Mountain View is 60.0%.
Women in Mountain View earn 40.0 cents for every dollar earned by a man.
What is Inequality or Gini Index in Mountain View?
Inequality or Gini Index in Mountain View is 0.41.
What is the Total Population of Mountain View?
Total Population of Mountain View is 3,627.
What is the Total Male Population of Mountain View?
Total Male Population of Mountain View is 1,560.
What is the Total Female Population of Mountain View?
Total Female Population of Mountain View is 2,067.
What is the Ratio of Males per 100 Females in Mountain View?
There are 75.47 Males per 100 Females in Mountain View.
What is the Ratio of Females per 100 Males in Mountain View?
There are 132.50 Females per 100 Males in Mountain View.
What is the Median Population Age in Mountain View?
Median Population Age in Mountain View is 37.2 Years.
What is the Average Family Size in Mountain View
Average Family Size in Mountain View is 3.9 People.
What is the Average Household Size in Mountain View
Average Household Size in Mountain View is 3.1 People.
How Large is the Labor Force in Mountain View?
There are 1,435 People in the Labor Forcein in Mountain View.
What is the Percentage of People in the Labor Force in Mountain View?
52.5% of People are in the Labor Force in Mountain View.
What is the Unemployment Rate in Mountain View?
Unemployment Rate in Mountain View is 8.2%.