Chester, MD Map & Demographics
Chester Map
Chester Overview
$57,878
PER CAPITA INCOME
$114,250
AVG FAMILY INCOME
$90,201
AVG HOUSEHOLD INCOME
56.7%
WAGE / INCOME GAP [ % ]
43.3¢/ $1
WAGE / INCOME GAP [ $ ]
0.49
INEQUALITY / GINI INDEX
4,456
TOTAL POPULATION
2,096
MALE POPULATION
2,360
FEMALE POPULATION
88.81
MALES / 100 FEMALES
112.60
FEMALES / 100 MALES
43.8
MEDIAN AGE
2.9
AVG FAMILY SIZE
2.4
AVG HOUSEHOLD SIZE
2,459
LABOR FORCE [ PEOPLE ]
66.6%
PERCENT IN LABOR FORCE
2.4%
UNEMPLOYMENT RATE
Chester Zip Codes
Chester Area Codes
Income in Chester
Income Overview in Chester
Per Capita Income in Chester is $57,878, while median incomes of families and households are $114,250 and $90,201 respectively.
| Characteristic | Number | Measure |
| Per Capita Income | 4,456 | $57,878 |
| Median Family Income | 1,166 | $114,250 |
| Mean Family Income | 1,166 | $163,935 |
| Median Household Income | 1,881 | $90,201 |
| Mean Household Income | 1,881 | $134,467 |
| Income Deficit | 1,166 | $0 |
| Wage / Income Gap (%) | 4,456 | 56.69% |
| Wage / Income Gap ($) | 4,456 | 43.31¢ per $1 |
| Gini / Inequality Index | 4,456 | 0.49 |
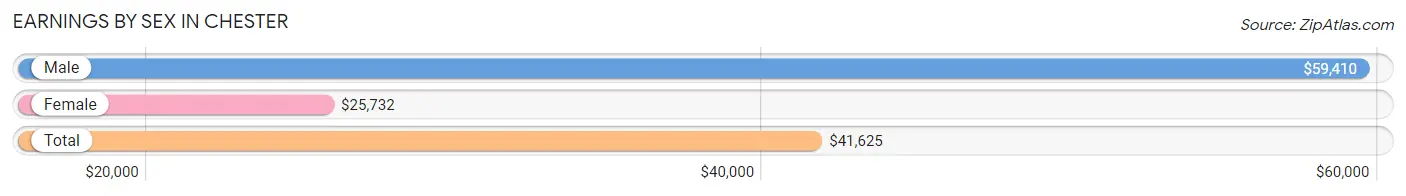
Earnings by Sex in Chester
Average Earnings in Chester are $41,625, $59,410 for men and $25,732 for women, a difference of 56.7%.
| Sex | Number | Average Earnings |
| Male | 1,283 (47.9%) | $59,410 |
| Female | 1,394 (52.1%) | $25,732 |
| Total | 2,677 (100.0%) | $41,625 |
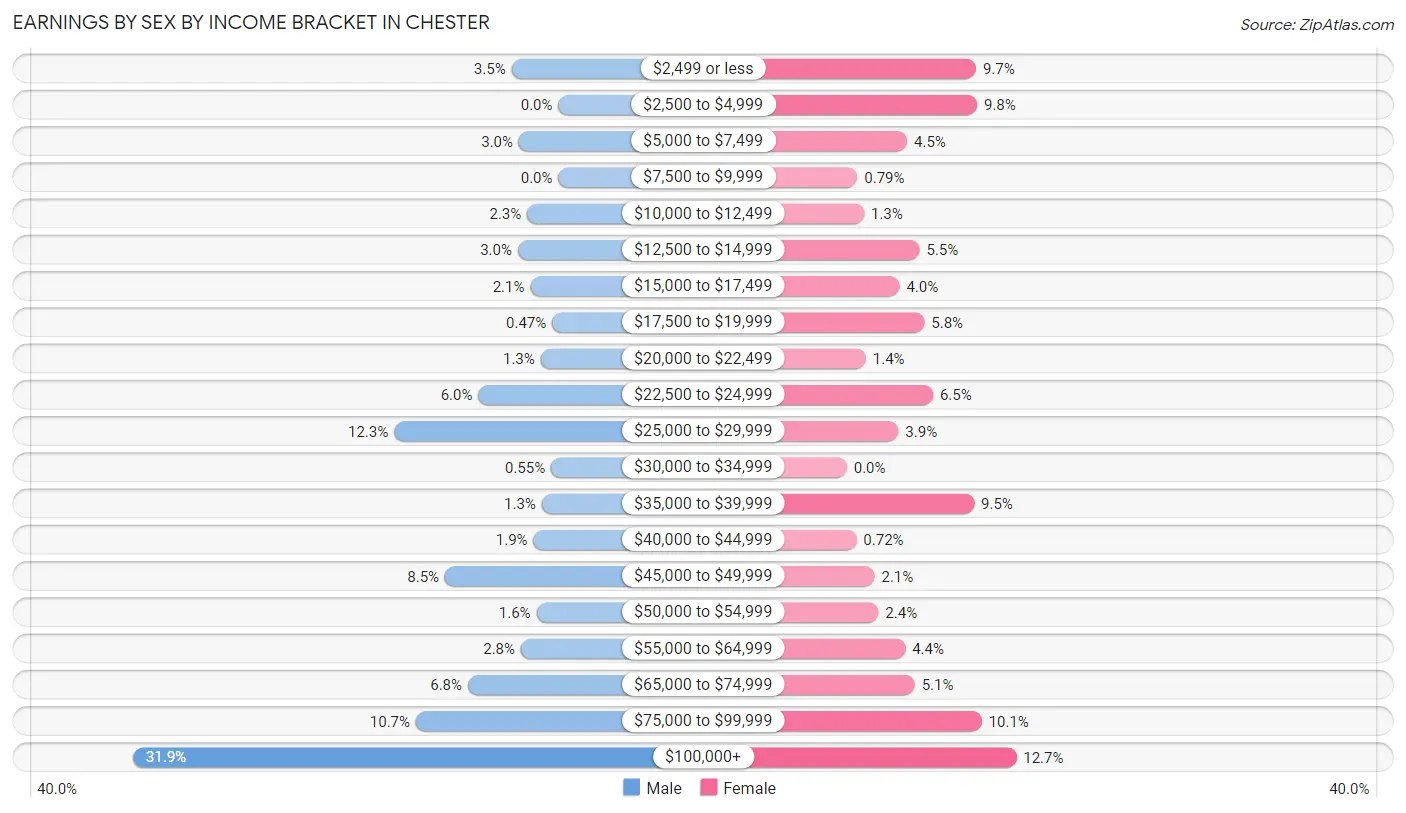
Earnings by Sex by Income Bracket in Chester
The most common earnings brackets in Chester are $100,000+ for men (409 | 31.9%) and $100,000+ for women (177 | 12.7%).
| Income | Male | Female |
| $2,499 or less | 45 (3.5%) | 135 (9.7%) |
| $2,500 to $4,999 | 0 (0.0%) | 136 (9.8%) |
| $5,000 to $7,499 | 38 (3.0%) | 63 (4.5%) |
| $7,500 to $9,999 | 0 (0.0%) | 11 (0.8%) |
| $10,000 to $12,499 | 30 (2.3%) | 18 (1.3%) |
| $12,500 to $14,999 | 39 (3.0%) | 76 (5.4%) |
| $15,000 to $17,499 | 27 (2.1%) | 55 (4.0%) |
| $17,500 to $19,999 | 6 (0.5%) | 81 (5.8%) |
| $20,000 to $22,499 | 17 (1.3%) | 20 (1.4%) |
| $22,500 to $24,999 | 77 (6.0%) | 90 (6.5%) |
| $25,000 to $29,999 | 158 (12.3%) | 54 (3.9%) |
| $30,000 to $34,999 | 7 (0.5%) | 0 (0.0%) |
| $35,000 to $39,999 | 16 (1.3%) | 133 (9.5%) |
| $40,000 to $44,999 | 24 (1.9%) | 10 (0.7%) |
| $45,000 to $49,999 | 109 (8.5%) | 29 (2.1%) |
| $50,000 to $54,999 | 21 (1.6%) | 33 (2.4%) |
| $55,000 to $64,999 | 36 (2.8%) | 61 (4.4%) |
| $65,000 to $74,999 | 87 (6.8%) | 71 (5.1%) |
| $75,000 to $99,999 | 137 (10.7%) | 141 (10.1%) |
| $100,000+ | 409 (31.9%) | 177 (12.7%) |
| Total | 1,283 (100.0%) | 1,394 (100.0%) |
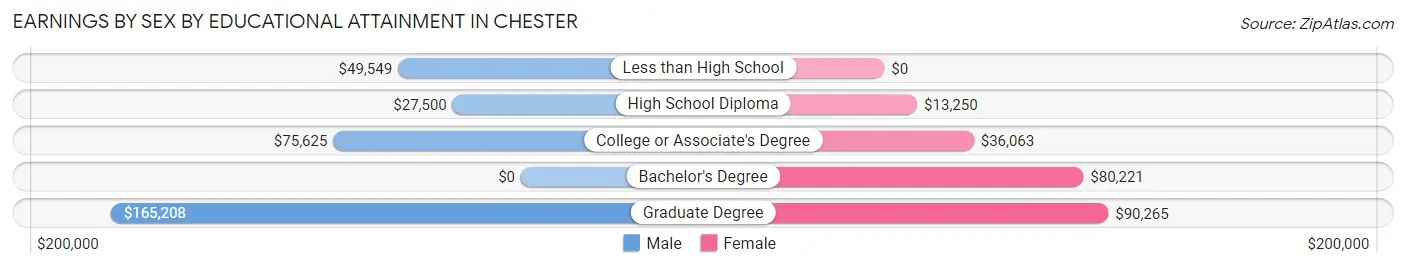
Earnings by Sex by Educational Attainment in Chester
Average earnings in Chester are $71,273 for men and $36,531 for women, a difference of 48.7%. Men with an educational attainment of graduate degree enjoy the highest average annual earnings of $165,208, while those with high school diploma education earn the least with $27,500. Women with an educational attainment of graduate degree earn the most with the average annual earnings of $90,265, while those with high school diploma education have the smallest earnings of $13,250.
| Educational Attainment | Male Income | Female Income |
| Less than High School | $49,549 | $0 |
| High School Diploma | $27,500 | $13,250 |
| College or Associate's Degree | $75,625 | $36,063 |
| Bachelor's Degree | - | - |
| Graduate Degree | $165,208 | $90,265 |
| Total | $71,273 | $36,531 |
Family Income in Chester
Family Income Brackets in Chester
According to the Chester family income data, there are 255 families falling into the $200,000+ income range, which is the most common income bracket and makes up 21.9% of all families.
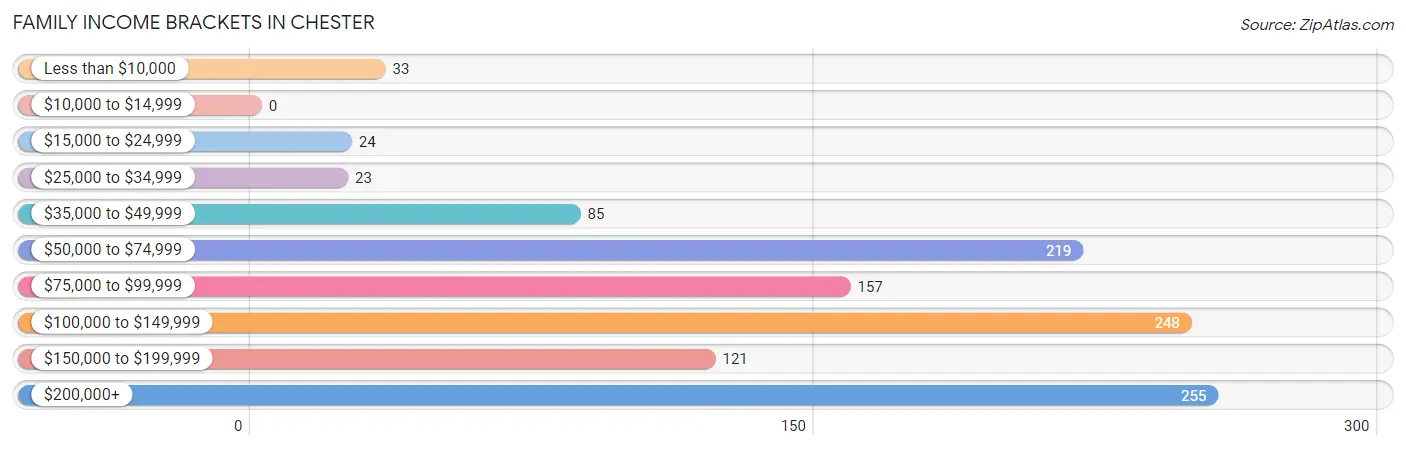
| Income Bracket | # Families | % Families |
| Less than $10,000 | 33 | 2.8% |
| $10,000 to $14,999 | 0 | 0.0% |
| $15,000 to $24,999 | 24 | 2.1% |
| $25,000 to $34,999 | 23 | 2.0% |
| $35,000 to $49,999 | 85 | 7.3% |
| $50,000 to $74,999 | 219 | 18.8% |
| $75,000 to $99,999 | 157 | 13.5% |
| $100,000 to $149,999 | 248 | 21.3% |
| $150,000 to $199,999 | 121 | 10.4% |
| $200,000+ | 255 | 21.9% |
Family Income by Famaliy Size in Chester
4-person families (123 | 10.5%) account for the highest median family income in Chester with $174,688 per family, while 2-person families (676 | 58.0%) have the highest median income of $47,812 per family member.
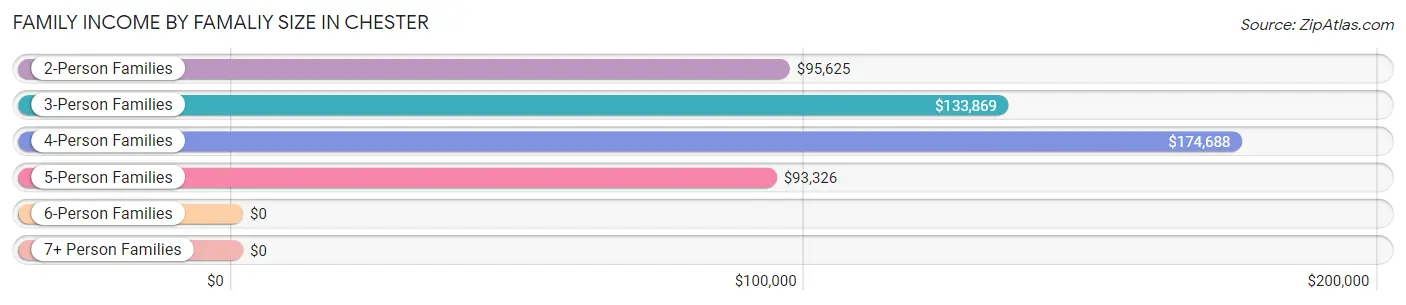
| Income Bracket | # Families | Median Income |
| 2-Person Families | 676 (58.0%) | $95,625 |
| 3-Person Families | 245 (21.0%) | $133,869 |
| 4-Person Families | 123 (10.5%) | $174,688 |
| 5-Person Families | 93 (8.0%) | $93,326 |
| 6-Person Families | 6 (0.5%) | $0 |
| 7+ Person Families | 23 (2.0%) | $0 |
| Total | 1,166 (100.0%) | $114,250 |
Family Income by Number of Earners in Chester
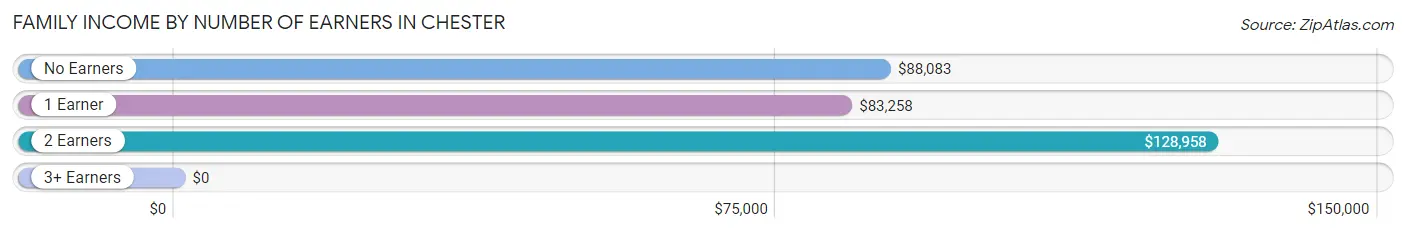
| Number of Earners | # Families | Median Income |
| No Earners | 151 (13.0%) | $88,083 |
| 1 Earner | 264 (22.6%) | $83,258 |
| 2 Earners | 679 (58.2%) | $128,958 |
| 3+ Earners | 72 (6.2%) | $0 |
| Total | 1,166 (100.0%) | $114,250 |
Household Income in Chester
Household Income Brackets in Chester
With 372 households falling in the category, the $50,000 to $74,999 income range is the most frequent in Chester, accounting for 19.8% of all households. In contrast, only 30 households (1.6%) fall into the $10,000 to $14,999 income bracket, making it the least populous group.
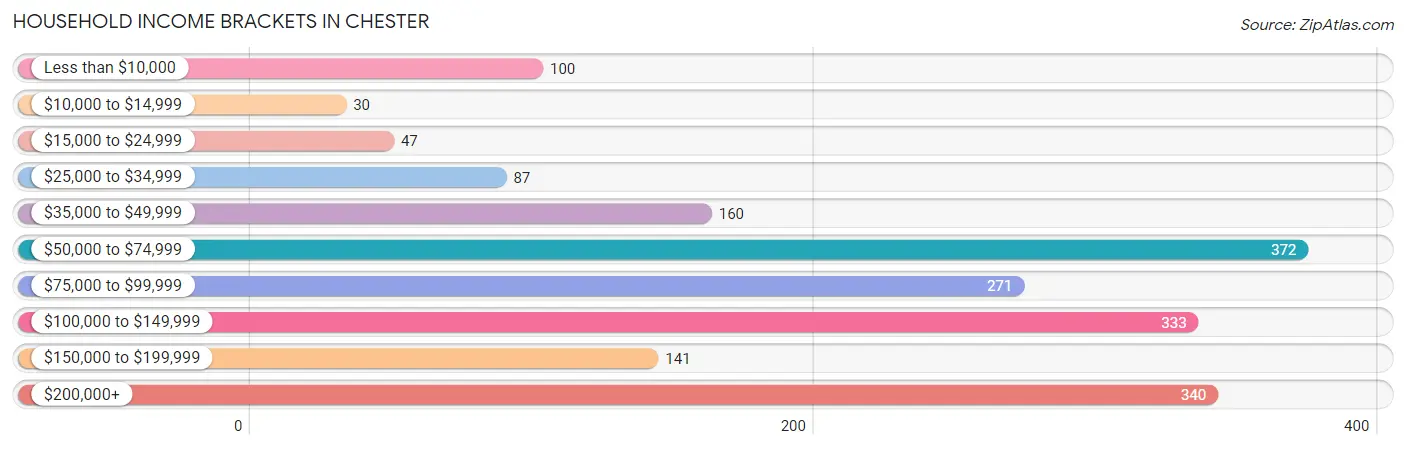
| Income Bracket | # Households | % Households |
| Less than $10,000 | 100 | 5.3% |
| $10,000 to $14,999 | 30 | 1.6% |
| $15,000 to $24,999 | 47 | 2.5% |
| $25,000 to $34,999 | 87 | 4.6% |
| $35,000 to $49,999 | 160 | 8.5% |
| $50,000 to $74,999 | 372 | 19.8% |
| $75,000 to $99,999 | 271 | 14.4% |
| $100,000 to $149,999 | 333 | 17.7% |
| $150,000 to $199,999 | 141 | 7.5% |
| $200,000+ | 340 | 18.1% |
Household Income by Householder Age in Chester
The median household income in Chester is $90,201, with the highest median household income of $93,968 found in the 25 to 44 years age bracket for the primary householder. A total of 528 households (28.1%) fall into this category. Meanwhile, the 15 to 24 years age bracket for the primary householder has the lowest median household income of $0, with 30 households (1.6%) in this group.
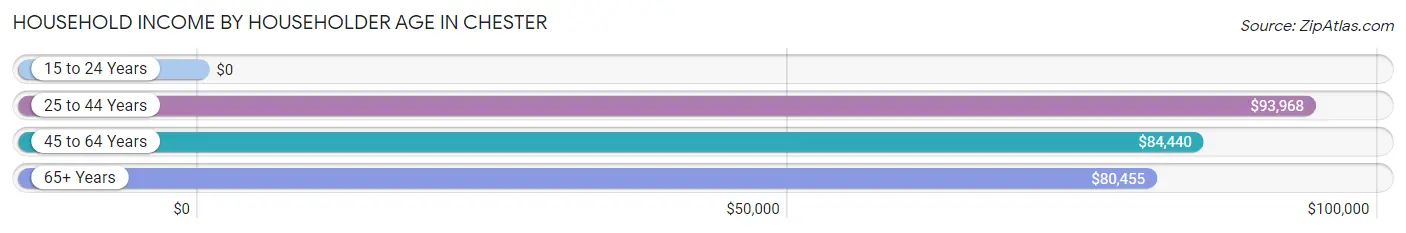
| Income Bracket | # Households | Median Income |
| 15 to 24 Years | 30 (1.6%) | $0 |
| 25 to 44 Years | 528 (28.1%) | $93,968 |
| 45 to 64 Years | 791 (42.0%) | $84,440 |
| 65+ Years | 532 (28.3%) | $80,455 |
| Total | 1,881 (100.0%) | $90,201 |
Poverty in Chester
Income Below Poverty by Sex and Age in Chester
With 7.0% poverty level for males and 14.0% for females among the residents of Chester, 6 to 11 year old males and 12 to 14 year old females are the most vulnerable to poverty, with 42 males (49.4%) and 48 females (75.0%) in their respective age groups living below the poverty level.
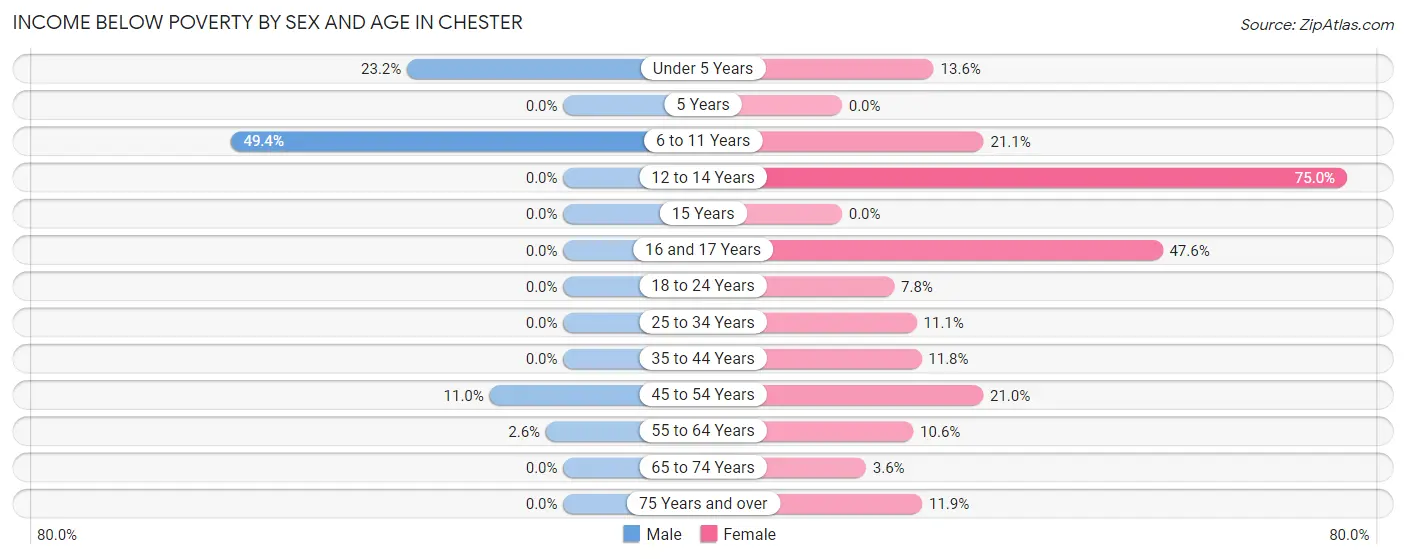
| Age Bracket | Male | Female |
| Under 5 Years | 71 (23.2%) | 9 (13.6%) |
| 5 Years | 0 (0.0%) | 0 (0.0%) |
| 6 to 11 Years | 42 (49.4%) | 24 (21.0%) |
| 12 to 14 Years | 0 (0.0%) | 48 (75.0%) |
| 15 Years | 0 (0.0%) | 0 (0.0%) |
| 16 and 17 Years | 0 (0.0%) | 10 (47.6%) |
| 18 to 24 Years | 0 (0.0%) | 15 (7.8%) |
| 25 to 34 Years | 0 (0.0%) | 40 (11.1%) |
| 35 to 44 Years | 0 (0.0%) | 32 (11.8%) |
| 45 to 54 Years | 22 (11.0%) | 64 (21.0%) |
| 55 to 64 Years | 9 (2.6%) | 60 (10.6%) |
| 65 to 74 Years | 0 (0.0%) | 7 (3.6%) |
| 75 Years and over | 0 (0.0%) | 18 (11.9%) |
| Total | 144 (7.0%) | 327 (14.0%) |
Income Above Poverty by Sex and Age in Chester
According to the poverty statistics in Chester, males aged 12 to 14 years and females aged 5 years are the age groups that are most secure financially, with 100.0% of males and 100.0% of females in these age groups living above the poverty line.
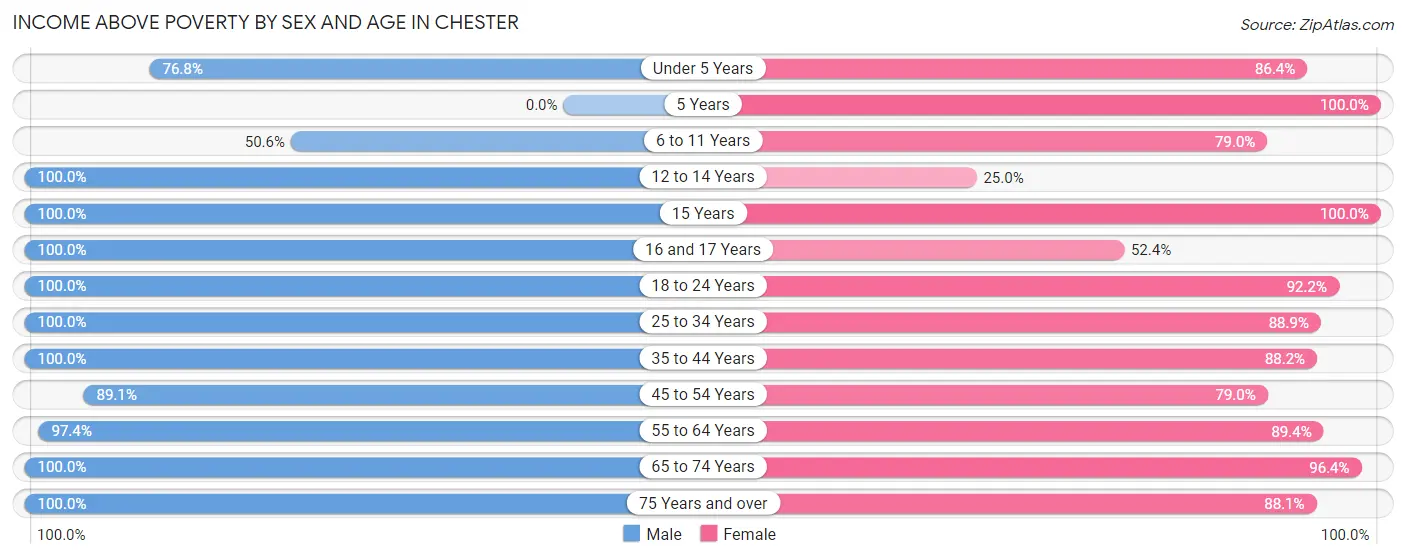
| Age Bracket | Male | Female |
| Under 5 Years | 235 (76.8%) | 57 (86.4%) |
| 5 Years | 0 (0.0%) | 23 (100.0%) |
| 6 to 11 Years | 43 (50.6%) | 90 (78.9%) |
| 12 to 14 Years | 11 (100.0%) | 16 (25.0%) |
| 15 Years | 43 (100.0%) | 9 (100.0%) |
| 16 and 17 Years | 24 (100.0%) | 11 (52.4%) |
| 18 to 24 Years | 138 (100.0%) | 178 (92.2%) |
| 25 to 34 Years | 311 (100.0%) | 320 (88.9%) |
| 35 to 44 Years | 180 (100.0%) | 239 (88.2%) |
| 45 to 54 Years | 179 (89.0%) | 241 (79.0%) |
| 55 to 64 Years | 338 (97.4%) | 506 (89.4%) |
| 65 to 74 Years | 317 (100.0%) | 189 (96.4%) |
| 75 Years and over | 110 (100.0%) | 133 (88.1%) |
| Total | 1,929 (93.0%) | 2,012 (86.0%) |
Income Below Poverty Among Married-Couple Families in Chester
The poverty statistics for married-couple families in Chester show that 1.1% or 9 of the total 841 families live below the poverty line. Families with no children have the highest poverty rate of 1.5%, comprising of 9 families. On the other hand, families with 1 or 2 children have the lowest poverty rate of 0.0%, which includes 0 families.
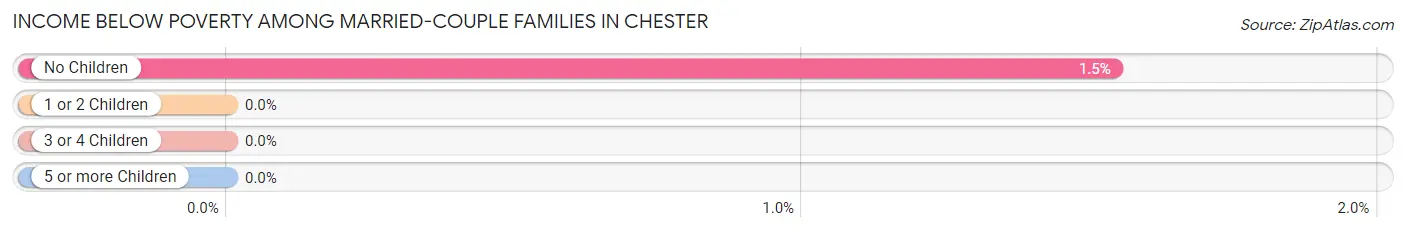
| Children | Above Poverty | Below Poverty |
| No Children | 576 (98.5%) | 9 (1.5%) |
| 1 or 2 Children | 197 (100.0%) | 0 (0.0%) |
| 3 or 4 Children | 59 (100.0%) | 0 (0.0%) |
| 5 or more Children | 0 (0.0%) | 0 (0.0%) |
| Total | 832 (98.9%) | 9 (1.1%) |
Income Below Poverty Among Single-Parent Households in Chester
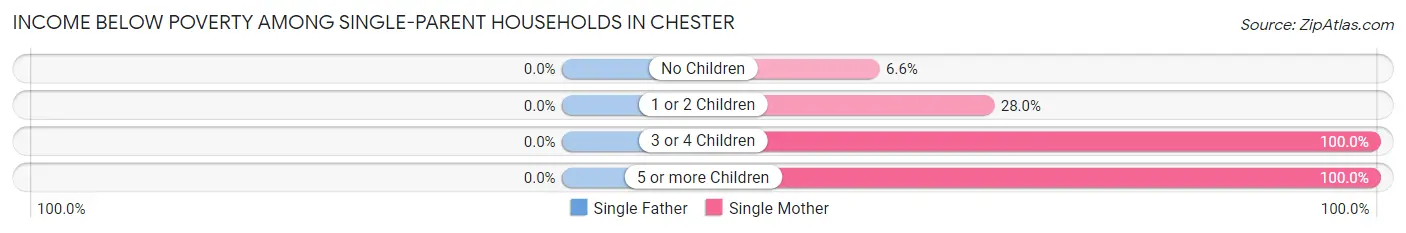
| Children | Single Father | Single Mother |
| No Children | 0 (0.0%) | 7 (6.6%) |
| 1 or 2 Children | 0 (0.0%) | 26 (28.0%) |
| 3 or 4 Children | 0 (0.0%) | 9 (100.0%) |
| 5 or more Children | 0 (0.0%) | 23 (100.0%) |
| Total | 0 (0.0%) | 65 (28.1%) |
Income Below Poverty Among Married-Couple vs Single-Parent Households in Chester
The poverty data for Chester shows that 9 of the married-couple family households (1.1%) and 65 of the single-parent households (20.0%) are living below the poverty level. Within the married-couple family households, those with no children have the highest poverty rate, with 9 households (1.5%) falling below the poverty line. Among the single-parent households, those with 3 or 4 children have the highest poverty rate, with 9 household (100.0%) living below poverty.
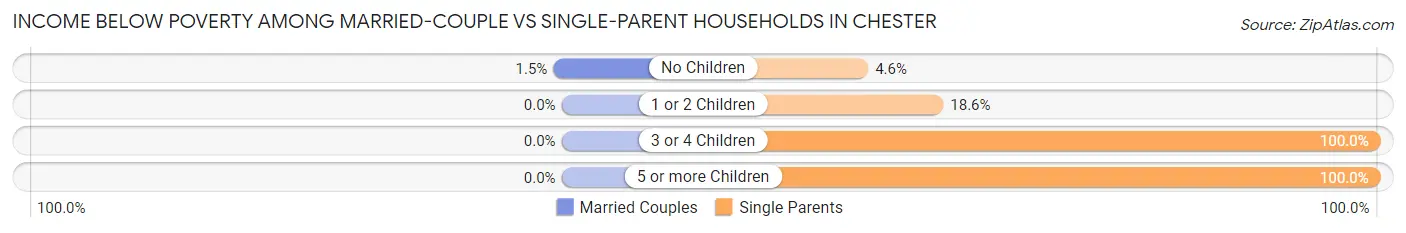
| Children | Married-Couple Families | Single-Parent Households |
| No Children | 9 (1.5%) | 7 (4.6%) |
| 1 or 2 Children | 0 (0.0%) | 26 (18.6%) |
| 3 or 4 Children | 0 (0.0%) | 9 (100.0%) |
| 5 or more Children | 0 (0.0%) | 23 (100.0%) |
| Total | 9 (1.1%) | 65 (20.0%) |
Race in Chester
The most populous races in Chester are White / Caucasian (3,692 | 82.9%), Black / African American (310 | 7.0%), and Hispanic or Latino (226 | 5.1%).
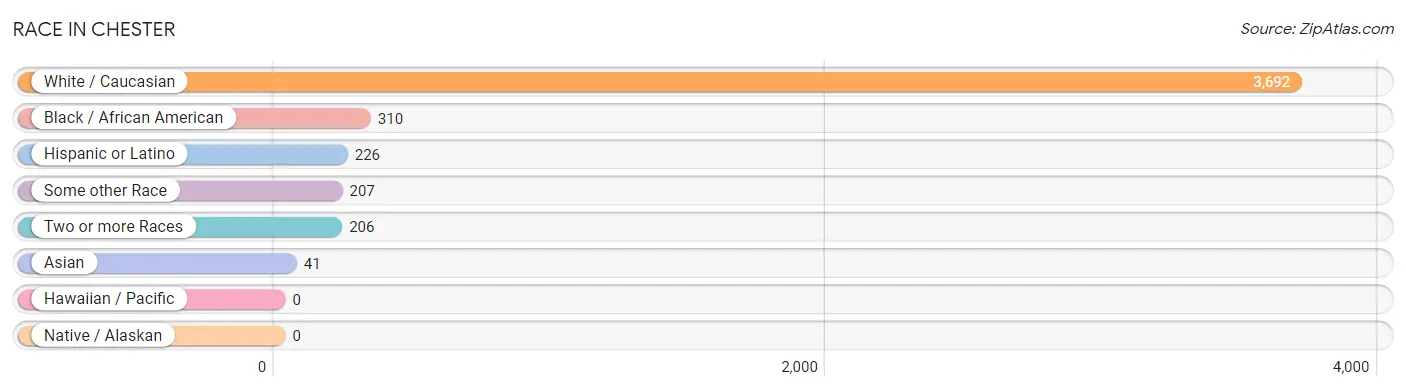
| Race | # Population | % Population |
| Asian | 41 | 0.9% |
| Black / African American | 310 | 7.0% |
| Hawaiian / Pacific | 0 | 0.0% |
| Hispanic or Latino | 226 | 5.1% |
| Native / Alaskan | 0 | 0.0% |
| White / Caucasian | 3,692 | 82.9% |
| Two or more Races | 206 | 4.6% |
| Some other Race | 207 | 4.6% |
| Total | 4,456 | 100.0% |
Ancestry in Chester
The most populous ancestries reported in Chester are Irish (1,059 | 23.8%), English (888 | 19.9%), German (717 | 16.1%), Italian (609 | 13.7%), and American (240 | 5.4%), together accounting for 78.8% of all Chester residents.
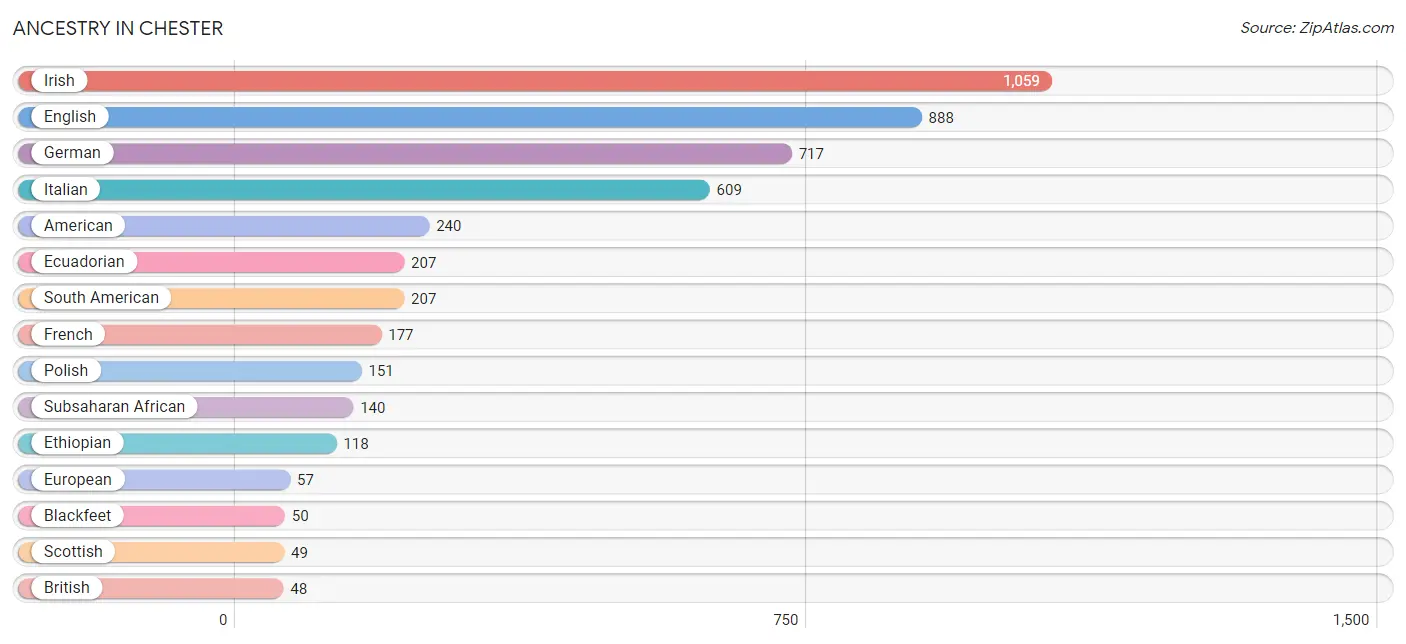
| Ancestry | # Population | % Population |
| African | 22 | 0.5% |
| Albanian | 11 | 0.3% |
| American | 240 | 5.4% |
| Austrian | 5 | 0.1% |
| Bhutanese | 16 | 0.4% |
| Blackfeet | 50 | 1.1% |
| British | 48 | 1.1% |
| Chinese | 25 | 0.6% |
| Czech | 7 | 0.2% |
| Dutch | 8 | 0.2% |
| Eastern European | 26 | 0.6% |
| Ecuadorian | 207 | 4.6% |
| English | 888 | 19.9% |
| Ethiopian | 118 | 2.6% |
| European | 57 | 1.3% |
| French | 177 | 4.0% |
| French Canadian | 10 | 0.2% |
| German | 717 | 16.1% |
| Greek | 13 | 0.3% |
| Hungarian | 15 | 0.3% |
| Irish | 1,059 | 23.8% |
| Italian | 609 | 13.7% |
| Laotian | 31 | 0.7% |
| Mexican | 16 | 0.4% |
| Norwegian | 45 | 1.0% |
| Polish | 151 | 3.4% |
| Russian | 27 | 0.6% |
| Scottish | 49 | 1.1% |
| South American | 207 | 4.6% |
| Subsaharan African | 140 | 3.1% |
| Swedish | 7 | 0.2% |
| Thai | 10 | 0.2% |
| Welsh | 35 | 0.8% | View All 33 Rows |
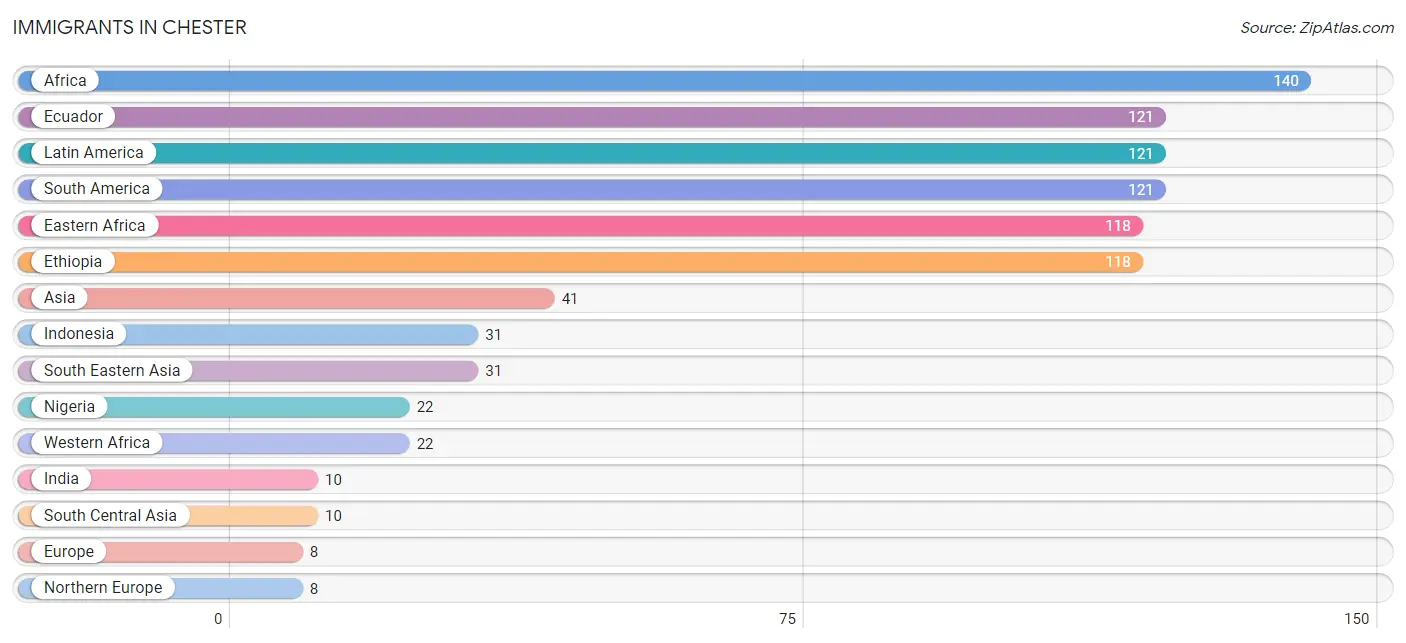
Immigrants in Chester
The most numerous immigrant groups reported in Chester came from Africa (140 | 3.1%), Ecuador (121 | 2.7%), Latin America (121 | 2.7%), South America (121 | 2.7%), and Eastern Africa (118 | 2.6%), together accounting for 14.0% of all Chester residents.
| Immigration Origin | # Population | % Population |
| Africa | 140 | 3.1% |
| Asia | 41 | 0.9% |
| Eastern Africa | 118 | 2.6% |
| Ecuador | 121 | 2.7% |
| Ethiopia | 118 | 2.6% |
| Europe | 8 | 0.2% |
| India | 10 | 0.2% |
| Indonesia | 31 | 0.7% |
| Latin America | 121 | 2.7% |
| Nigeria | 22 | 0.5% |
| Northern Europe | 8 | 0.2% |
| South America | 121 | 2.7% |
| South Central Asia | 10 | 0.2% |
| South Eastern Asia | 31 | 0.7% |
| Western Africa | 22 | 0.5% | View All 15 Rows |
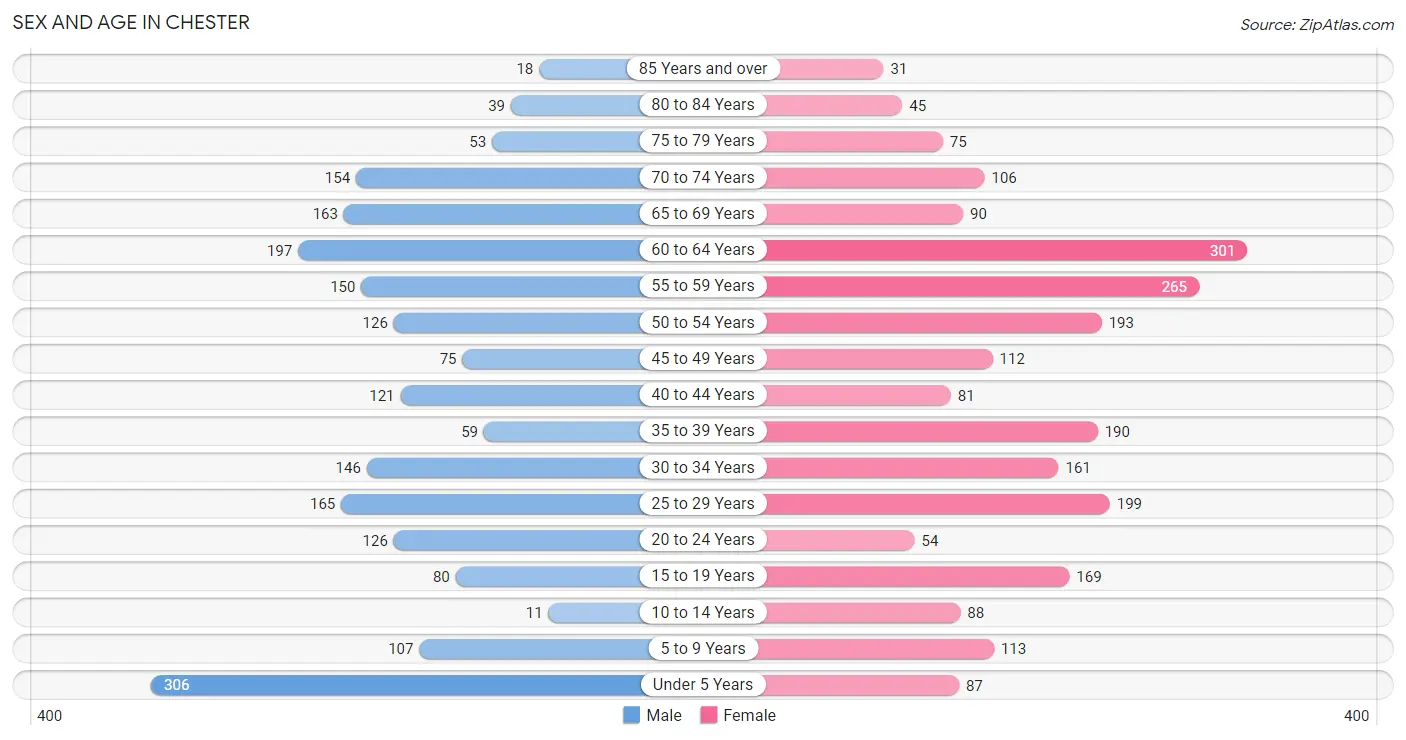
Sex and Age in Chester
Sex and Age in Chester
The most populous age groups in Chester are Under 5 Years (306 | 14.6%) for men and 60 to 64 Years (301 | 12.8%) for women.
| Age Bracket | Male | Female |
| Under 5 Years | 306 (14.6%) | 87 (3.7%) |
| 5 to 9 Years | 107 (5.1%) | 113 (4.8%) |
| 10 to 14 Years | 11 (0.5%) | 88 (3.7%) |
| 15 to 19 Years | 80 (3.8%) | 169 (7.2%) |
| 20 to 24 Years | 126 (6.0%) | 54 (2.3%) |
| 25 to 29 Years | 165 (7.9%) | 199 (8.4%) |
| 30 to 34 Years | 146 (7.0%) | 161 (6.8%) |
| 35 to 39 Years | 59 (2.8%) | 190 (8.1%) |
| 40 to 44 Years | 121 (5.8%) | 81 (3.4%) |
| 45 to 49 Years | 75 (3.6%) | 112 (4.8%) |
| 50 to 54 Years | 126 (6.0%) | 193 (8.2%) |
| 55 to 59 Years | 150 (7.2%) | 265 (11.2%) |
| 60 to 64 Years | 197 (9.4%) | 301 (12.8%) |
| 65 to 69 Years | 163 (7.8%) | 90 (3.8%) |
| 70 to 74 Years | 154 (7.3%) | 106 (4.5%) |
| 75 to 79 Years | 53 (2.5%) | 75 (3.2%) |
| 80 to 84 Years | 39 (1.9%) | 45 (1.9%) |
| 85 Years and over | 18 (0.9%) | 31 (1.3%) |
| Total | 2,096 (100.0%) | 2,360 (100.0%) |
Families and Households in Chester
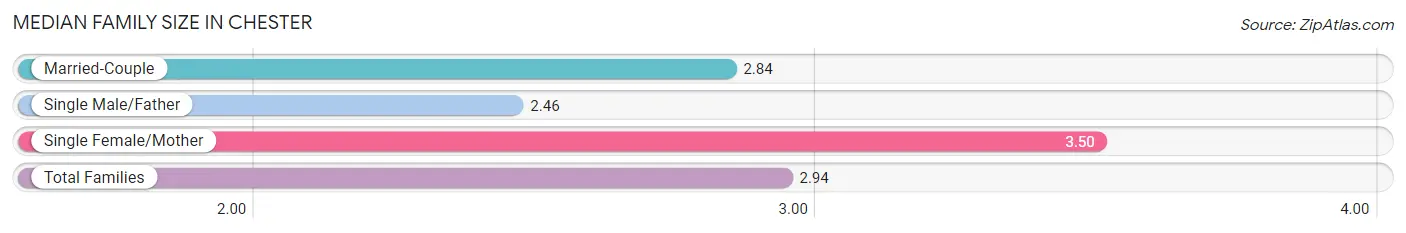
Median Family Size in Chester
The median family size in Chester is 2.94 persons per family, with single female/mother families (231 | 19.8%) accounting for the largest median family size of 3.5 persons per family. On the other hand, single male/father families (94 | 8.1%) represent the smallest median family size with 2.46 persons per family.
| Family Type | # Families | Family Size |
| Married-Couple | 841 (72.1%) | 2.84 |
| Single Male/Father | 94 (8.1%) | 2.46 |
| Single Female/Mother | 231 (19.8%) | 3.50 |
| Total Families | 1,166 (100.0%) | 2.94 |
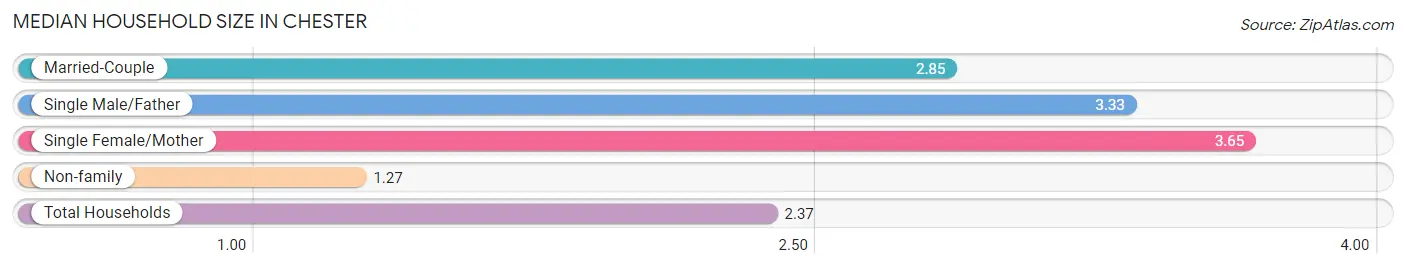
Median Household Size in Chester
The median household size in Chester is 2.37 persons per household, with single female/mother households (231 | 12.3%) accounting for the largest median household size of 3.65 persons per household. non-family households (715 | 38.0%) represent the smallest median household size with 1.27 persons per household.
| Household Type | # Households | Household Size |
| Married-Couple | 841 (44.7%) | 2.85 |
| Single Male/Father | 94 (5.0%) | 3.33 |
| Single Female/Mother | 231 (12.3%) | 3.65 |
| Non-family | 715 (38.0%) | 1.27 |
| Total Households | 1,881 (100.0%) | 2.37 |
Household Size by Marriage Status in Chester
Out of a total of 1,881 households in Chester, 1,166 (62.0%) are family households, while 715 (38.0%) are nonfamily households. The most numerous type of family households are 2-person households, comprising 628, and the most common type of nonfamily households are 1-person households, comprising 592.
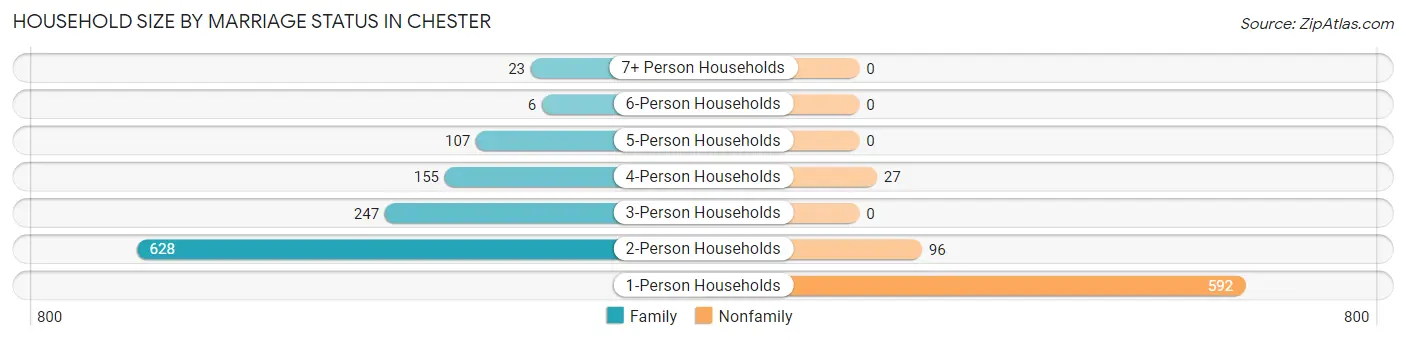
| Household Size | Family Households | Nonfamily Households |
| 1-Person Households | - | 592 (31.5%) |
| 2-Person Households | 628 (33.4%) | 96 (5.1%) |
| 3-Person Households | 247 (13.1%) | 0 (0.0%) |
| 4-Person Households | 155 (8.2%) | 27 (1.4%) |
| 5-Person Households | 107 (5.7%) | 0 (0.0%) |
| 6-Person Households | 6 (0.3%) | 0 (0.0%) |
| 7+ Person Households | 23 (1.2%) | 0 (0.0%) |
| Total | 1,166 (62.0%) | 715 (38.0%) |
Female Fertility in Chester
Fertility by Age in Chester
Average fertility rate in Chester is 31.0 births per 1,000 women. Women in the age bracket of 20 to 34 years have the highest fertility rate with 77.0 births per 1,000 women. Women in the age bracket of 20 to 34 years acount for 100.0% of all women with births.
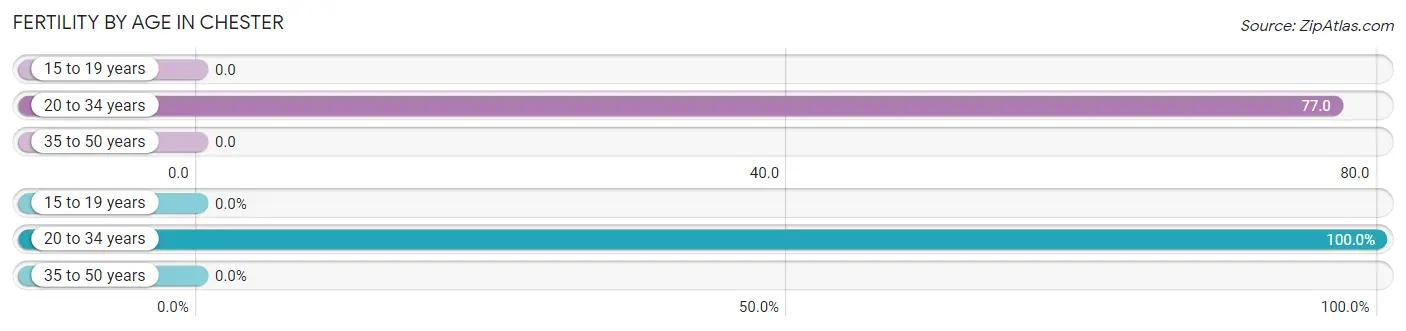
| Age Bracket | Women with Births | Births / 1,000 Women |
| 15 to 19 years | 0 (0.0%) | 0.0 |
| 20 to 34 years | 32 (100.0%) | 77.0 |
| 35 to 50 years | 0 (0.0%) | 0.0 |
| Total | 32 (100.0%) | 31.0 |
Fertility by Age by Marriage Status in Chester
71.9% of women with births (32) in Chester are married. The highest percentage of unmarried women with births falls into 20 to 34 years age bracket with 28.1% of them unmarried at the time of birth, while the lowest percentage of unmarried women with births belong to 20 to 34 years age bracket with 28.1% of them unmarried.
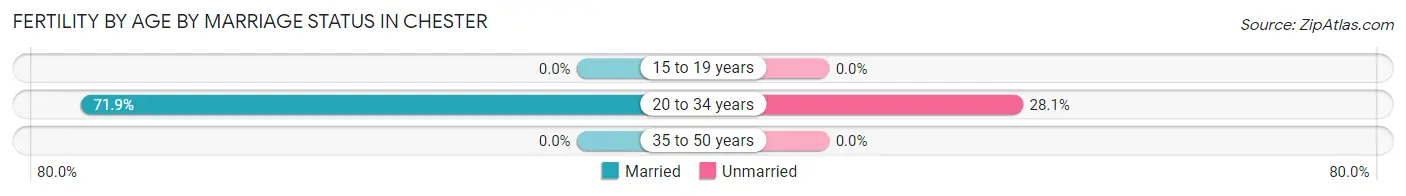
| Age Bracket | Married | Unmarried |
| 15 to 19 years | 0 (0.0%) | 0 (0.0%) |
| 20 to 34 years | 23 (71.9%) | 9 (28.1%) |
| 35 to 50 years | 0 (0.0%) | 0 (0.0%) |
| Total | 23 (71.9%) | 9 (28.1%) |
Fertility by Education in Chester
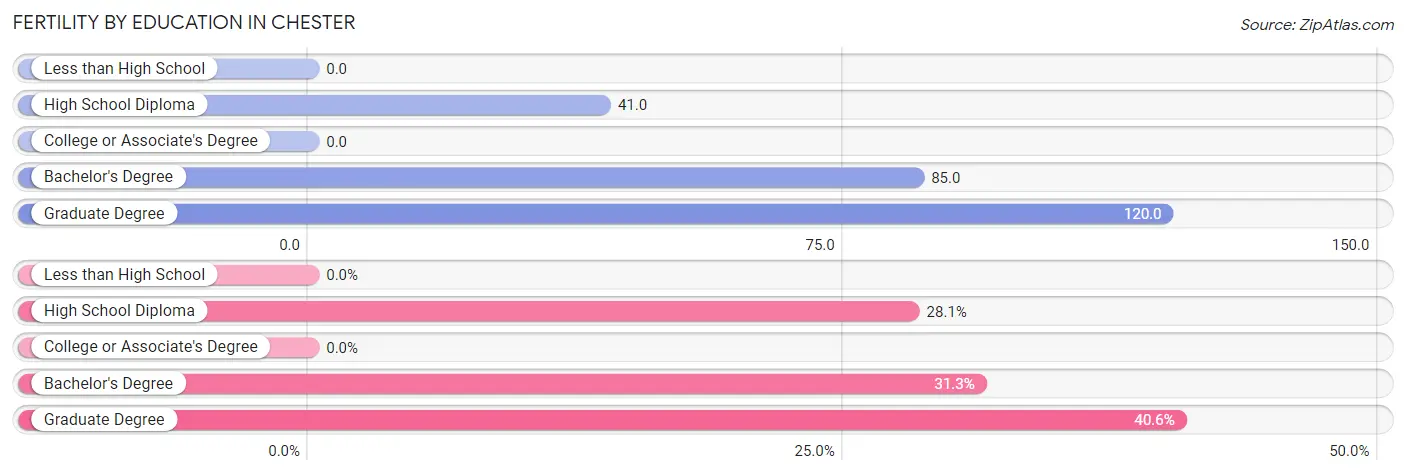
| Educational Attainment | Women with Births | Births / 1,000 Women |
| Less than High School | 0 (0.0%) | 0.0 |
| High School Diploma | 9 (28.1%) | 41.0 |
| College or Associate's Degree | 0 (0.0%) | 0.0 |
| Bachelor's Degree | 10 (31.2%) | 85.0 |
| Graduate Degree | 13 (40.6%) | 120.0 |
| Total | 32 (100.0%) | 31.0 |
Fertility by Education by Marriage Status in Chester
28.1% of women with births in Chester are unmarried. Women with the educational attainment of bachelor's degree are most likely to be married with 100.0% of them married at childbirth, while women with the educational attainment of high school diploma are least likely to be married with 100.0% of them unmarried at childbirth.
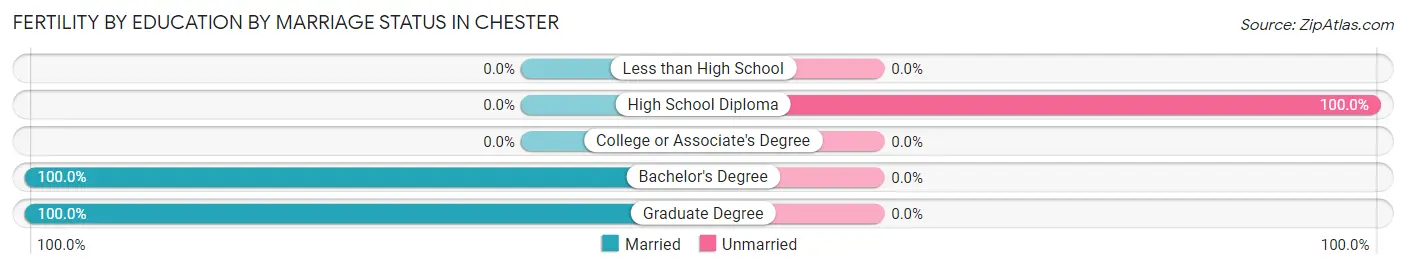
| Educational Attainment | Married | Unmarried |
| Less than High School | 0 (0.0%) | 0 (0.0%) |
| High School Diploma | 0 (0.0%) | 9 (100.0%) |
| College or Associate's Degree | 0 (0.0%) | 0 (0.0%) |
| Bachelor's Degree | 10 (100.0%) | 0 (0.0%) |
| Graduate Degree | 13 (100.0%) | 0 (0.0%) |
| Total | 23 (71.9%) | 9 (28.1%) |
Employment Characteristics in Chester
Employment by Class of Employer in Chester
Among the 2,383 employed individuals in Chester, private company employees (1,502 | 63.0%), self-employed (not incorporated) (297 | 12.5%), and local government employees (191 | 8.0%) make up the most common classes of employment.
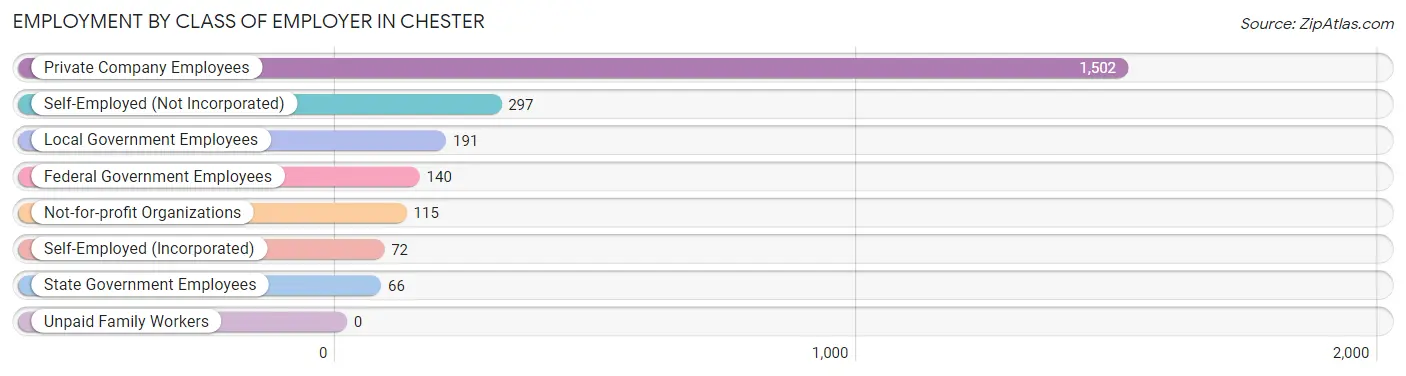
| Employer Class | # Employees | % Employees |
| Private Company Employees | 1,502 | 63.0% |
| Self-Employed (Incorporated) | 72 | 3.0% |
| Self-Employed (Not Incorporated) | 297 | 12.5% |
| Not-for-profit Organizations | 115 | 4.8% |
| Local Government Employees | 191 | 8.0% |
| State Government Employees | 66 | 2.8% |
| Federal Government Employees | 140 | 5.9% |
| Unpaid Family Workers | 0 | 0.0% |
| Total | 2,383 | 100.0% |
Employment Status by Age in Chester
According to the labor force statistics for Chester, out of the total population over 16 years of age (3,692), 66.6% or 2,459 individuals are in the labor force, with 2.4% or 59 of them unemployed. The age group with the highest labor force participation rate is 20 to 24 years, with 100.0% or 180 individuals in the labor force. Within the labor force, the 35 to 44 years age range has the highest percentage of unemployed individuals, with 16.5% or 59 of them being unemployed.
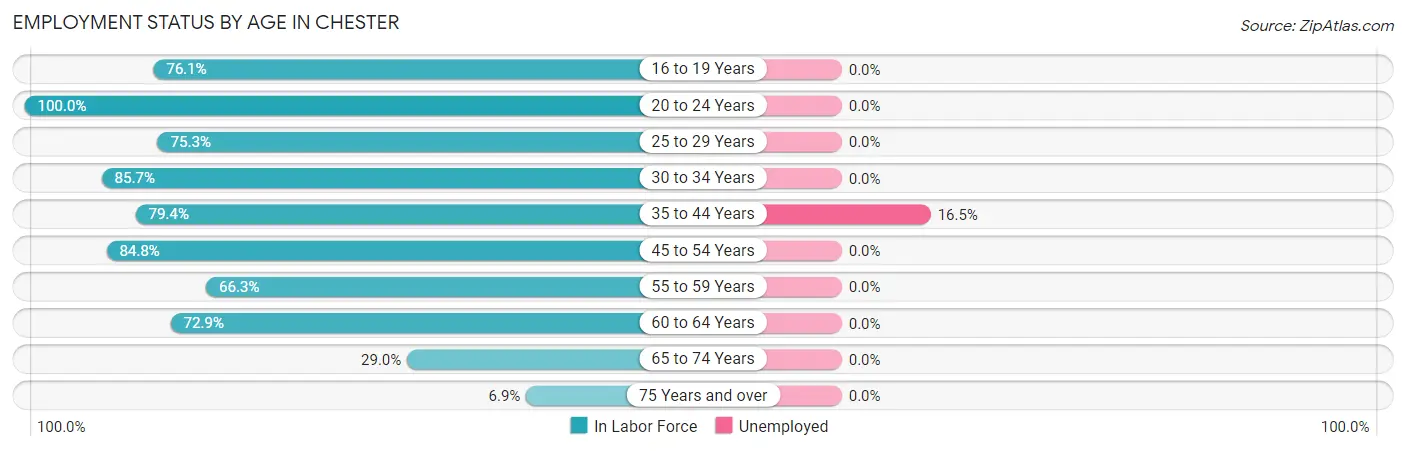
| Age Bracket | In Labor Force | Unemployed |
| 16 to 19 Years | 150 (76.1%) | 0 (0.0%) |
| 20 to 24 Years | 180 (100.0%) | 0 (0.0%) |
| 25 to 29 Years | 274 (75.3%) | 0 (0.0%) |
| 30 to 34 Years | 263 (85.7%) | 0 (0.0%) |
| 35 to 44 Years | 358 (79.4%) | 59 (16.5%) |
| 45 to 54 Years | 429 (84.8%) | 0 (0.0%) |
| 55 to 59 Years | 275 (66.3%) | 0 (0.0%) |
| 60 to 64 Years | 363 (72.9%) | 0 (0.0%) |
| 65 to 74 Years | 149 (29.0%) | 0 (0.0%) |
| 75 Years and over | 18 (6.9%) | 0 (0.0%) |
| Total | 2,459 (66.6%) | 59 (2.4%) |
Employment Status by Educational Attainment in Chester
According to labor force statistics for Chester, 77.2% of individuals (1,962) out of the total population between 25 and 64 years of age (2,541) are in the labor force, with 3.0% or 59 of them being unemployed. The group with the highest labor force participation rate are those with the educational attainment of bachelor's degree or higher, with 86.8% or 726 individuals in the labor force. Within the labor force, individuals with high school diploma education have the highest percentage of unemployment, with 15.4% or 59 of them being unemployed.
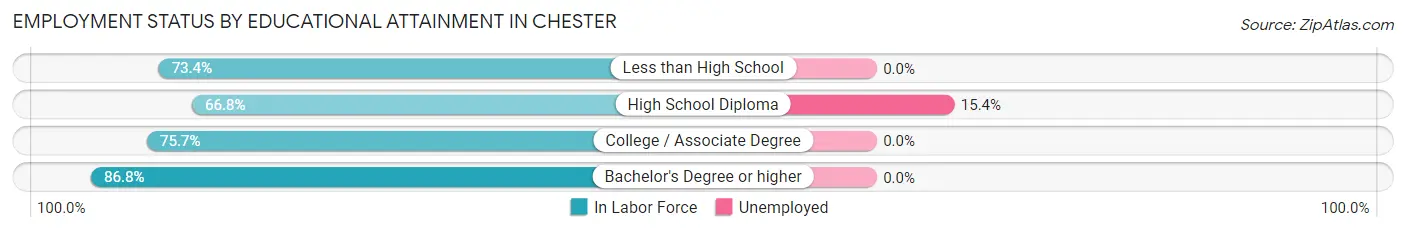
| Educational Attainment | In Labor Force | Unemployed |
| Less than High School | 102 (73.4%) | 0 (0.0%) |
| High School Diploma | 384 (66.8%) | 89 (15.4%) |
| College / Associate Degree | 750 (75.7%) | 0 (0.0%) |
| Bachelor's Degree or higher | 726 (86.8%) | 0 (0.0%) |
| Total | 1,962 (77.2%) | 76 (3.0%) |
Employment Occupations by Sex in Chester
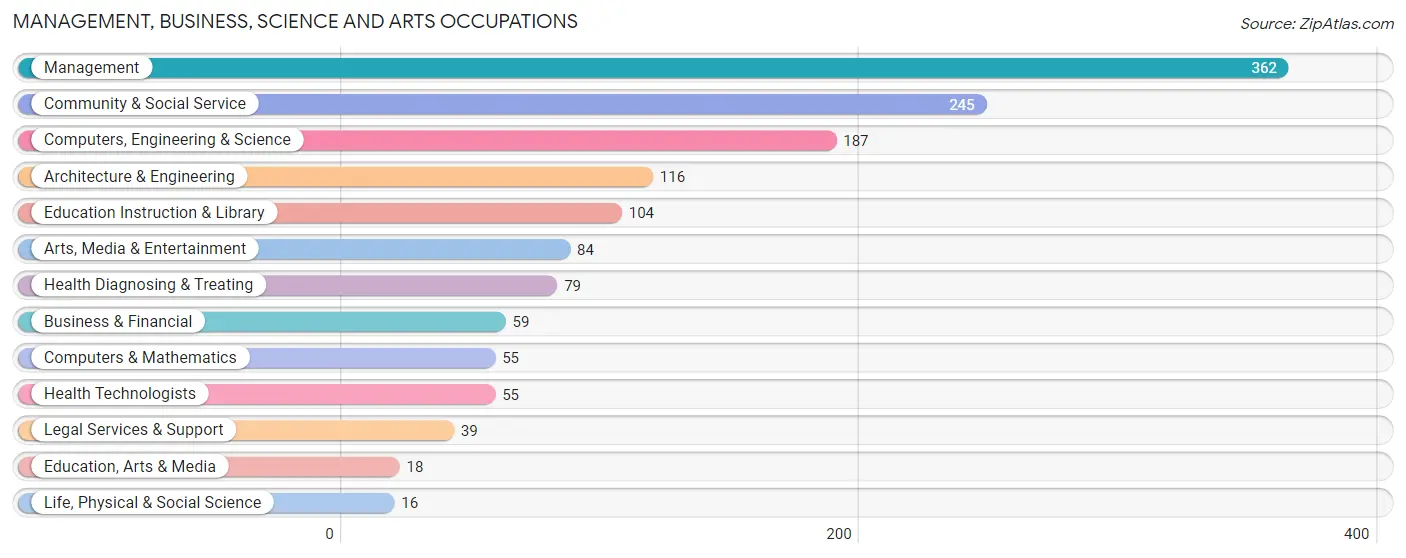
Management, Business, Science and Arts Occupations
The most common Management, Business, Science and Arts occupations in Chester are Management (362 | 15.1%), Community & Social Service (245 | 10.2%), Computers, Engineering & Science (187 | 7.8%), Architecture & Engineering (116 | 4.8%), and Education Instruction & Library (104 | 4.3%).
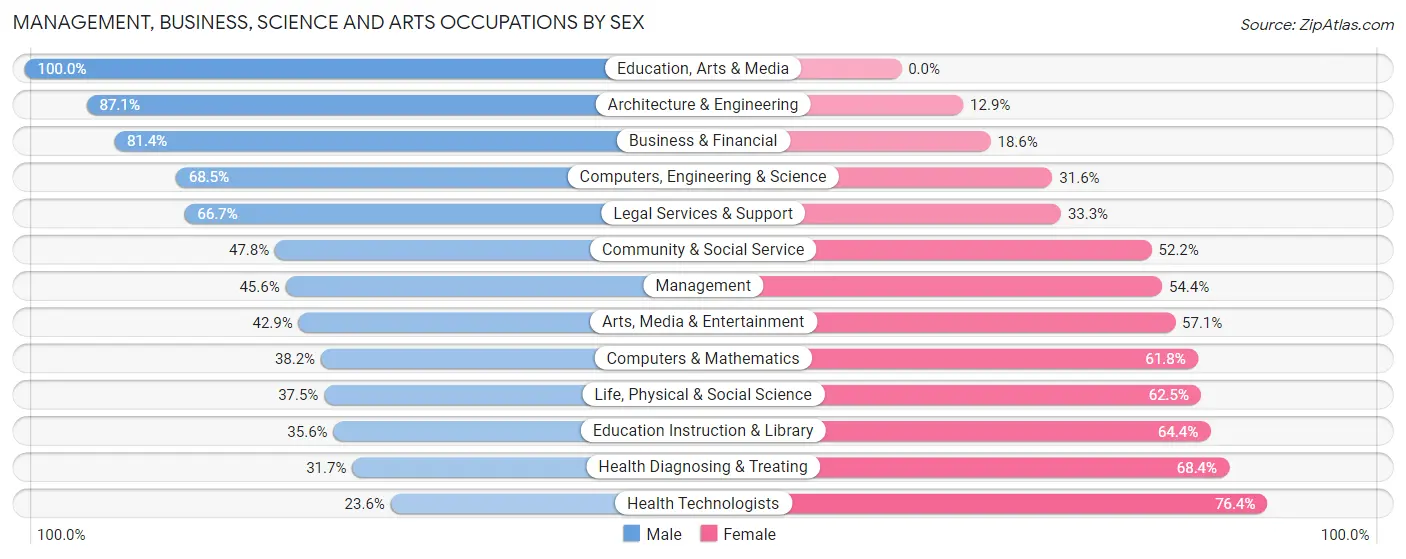
Management, Business, Science and Arts Occupations by Sex
Within the Management, Business, Science and Arts occupations in Chester, the most male-oriented occupations are Education, Arts & Media (100.0%), Architecture & Engineering (87.1%), and Business & Financial (81.4%), while the most female-oriented occupations are Health Technologists (76.4%), Health Diagnosing & Treating (68.3%), and Education Instruction & Library (64.4%).
| Occupation | Male | Female |
| Management | 165 (45.6%) | 197 (54.4%) |
| Business & Financial | 48 (81.4%) | 11 (18.6%) |
| Computers, Engineering & Science | 128 (68.4%) | 59 (31.6%) |
| Computers & Mathematics | 21 (38.2%) | 34 (61.8%) |
| Architecture & Engineering | 101 (87.1%) | 15 (12.9%) |
| Life, Physical & Social Science | 6 (37.5%) | 10 (62.5%) |
| Community & Social Service | 117 (47.8%) | 128 (52.2%) |
| Education, Arts & Media | 18 (100.0%) | 0 (0.0%) |
| Legal Services & Support | 26 (66.7%) | 13 (33.3%) |
| Education Instruction & Library | 37 (35.6%) | 67 (64.4%) |
| Arts, Media & Entertainment | 36 (42.9%) | 48 (57.1%) |
| Health Diagnosing & Treating | 25 (31.7%) | 54 (68.3%) |
| Health Technologists | 13 (23.6%) | 42 (76.4%) |
| Total (Category) | 483 (51.8%) | 449 (48.2%) |
| Total (Overall) | 1,125 (46.9%) | 1,275 (53.1%) |
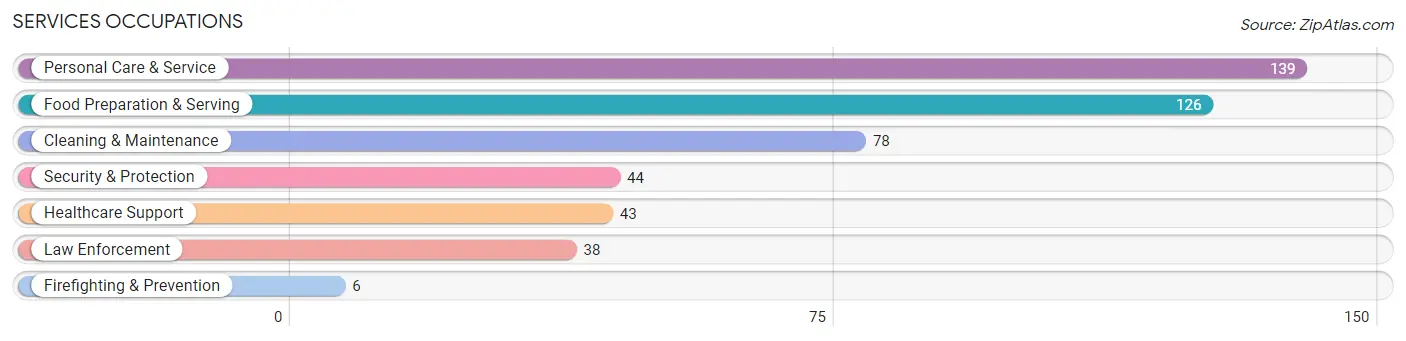
Services Occupations
The most common Services occupations in Chester are Personal Care & Service (139 | 5.8%), Food Preparation & Serving (126 | 5.2%), Cleaning & Maintenance (78 | 3.3%), Security & Protection (44 | 1.8%), and Healthcare Support (43 | 1.8%).
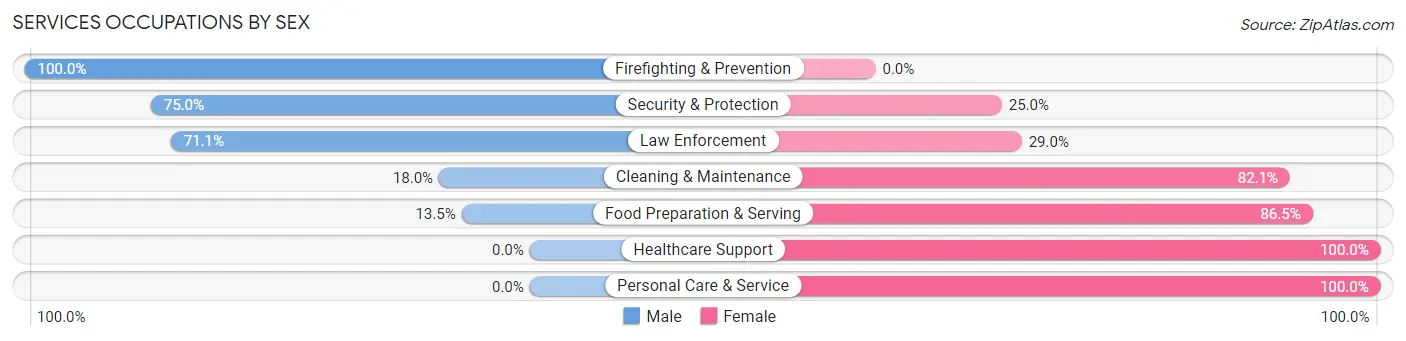
Services Occupations by Sex
Within the Services occupations in Chester, the most male-oriented occupations are Firefighting & Prevention (100.0%), Security & Protection (75.0%), and Law Enforcement (71.1%), while the most female-oriented occupations are Healthcare Support (100.0%), Personal Care & Service (100.0%), and Food Preparation & Serving (86.5%).
| Occupation | Male | Female |
| Healthcare Support | 0 (0.0%) | 43 (100.0%) |
| Security & Protection | 33 (75.0%) | 11 (25.0%) |
| Firefighting & Prevention | 6 (100.0%) | 0 (0.0%) |
| Law Enforcement | 27 (71.1%) | 11 (28.9%) |
| Food Preparation & Serving | 17 (13.5%) | 109 (86.5%) |
| Cleaning & Maintenance | 14 (17.9%) | 64 (82.1%) |
| Personal Care & Service | 0 (0.0%) | 139 (100.0%) |
| Total (Category) | 64 (14.9%) | 366 (85.1%) |
| Total (Overall) | 1,125 (46.9%) | 1,275 (53.1%) |
Sales and Office Occupations
The most common Sales and Office occupations in Chester are Sales & Related (344 | 14.3%), and Office & Administration (308 | 12.8%).
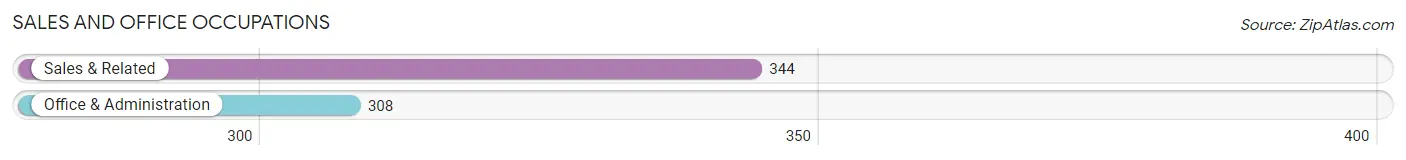
Sales and Office Occupations by Sex

| Occupation | Male | Female |
| Sales & Related | 175 (50.9%) | 169 (49.1%) |
| Office & Administration | 49 (15.9%) | 259 (84.1%) |
| Total (Category) | 224 (34.4%) | 428 (65.6%) |
| Total (Overall) | 1,125 (46.9%) | 1,275 (53.1%) |
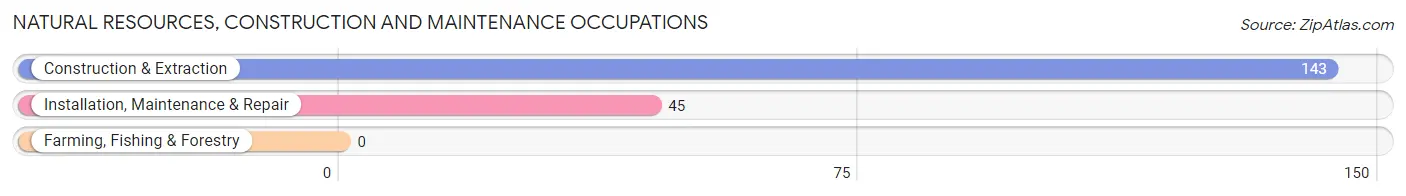
Natural Resources, Construction and Maintenance Occupations
The most common Natural Resources, Construction and Maintenance occupations in Chester are Construction & Extraction (143 | 6.0%), and Installation, Maintenance & Repair (45 | 1.9%).
Natural Resources, Construction and Maintenance Occupations by Sex
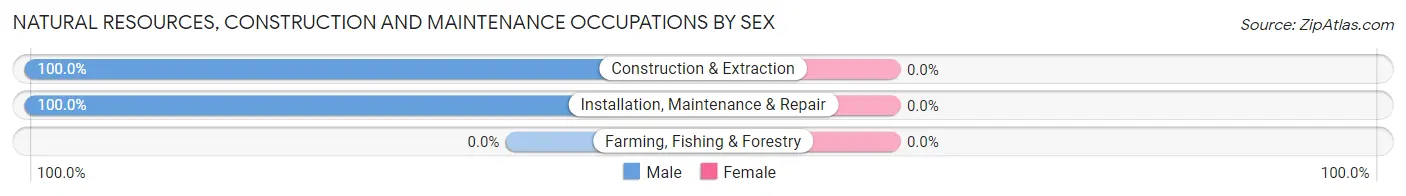
| Occupation | Male | Female |
| Farming, Fishing & Forestry | 0 (0.0%) | 0 (0.0%) |
| Construction & Extraction | 143 (100.0%) | 0 (0.0%) |
| Installation, Maintenance & Repair | 45 (100.0%) | 0 (0.0%) |
| Total (Category) | 188 (100.0%) | 0 (0.0%) |
| Total (Overall) | 1,125 (46.9%) | 1,275 (53.1%) |
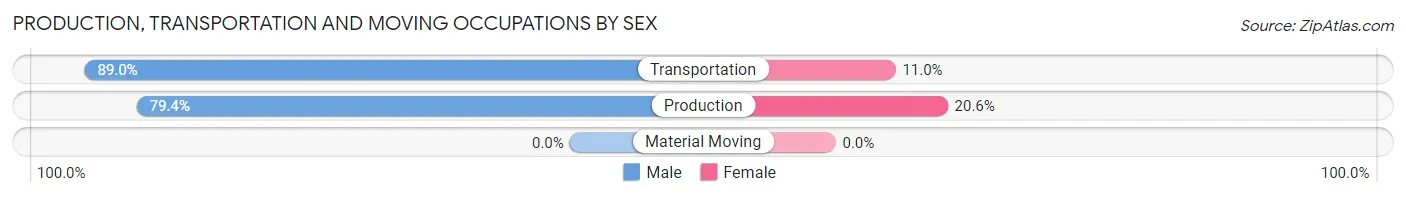
Production, Transportation and Moving Occupations
The most common Production, Transportation and Moving occupations in Chester are Production (107 | 4.5%), and Transportation (91 | 3.8%).
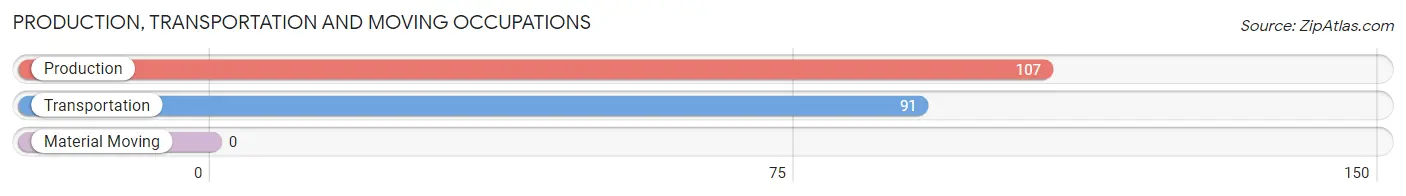
Production, Transportation and Moving Occupations by Sex
| Occupation | Male | Female |
| Production | 85 (79.4%) | 22 (20.6%) |
| Transportation | 81 (89.0%) | 10 (11.0%) |
| Material Moving | 0 (0.0%) | 0 (0.0%) |
| Total (Category) | 166 (83.8%) | 32 (16.2%) |
| Total (Overall) | 1,125 (46.9%) | 1,275 (53.1%) |
Employment Industries by Sex in Chester
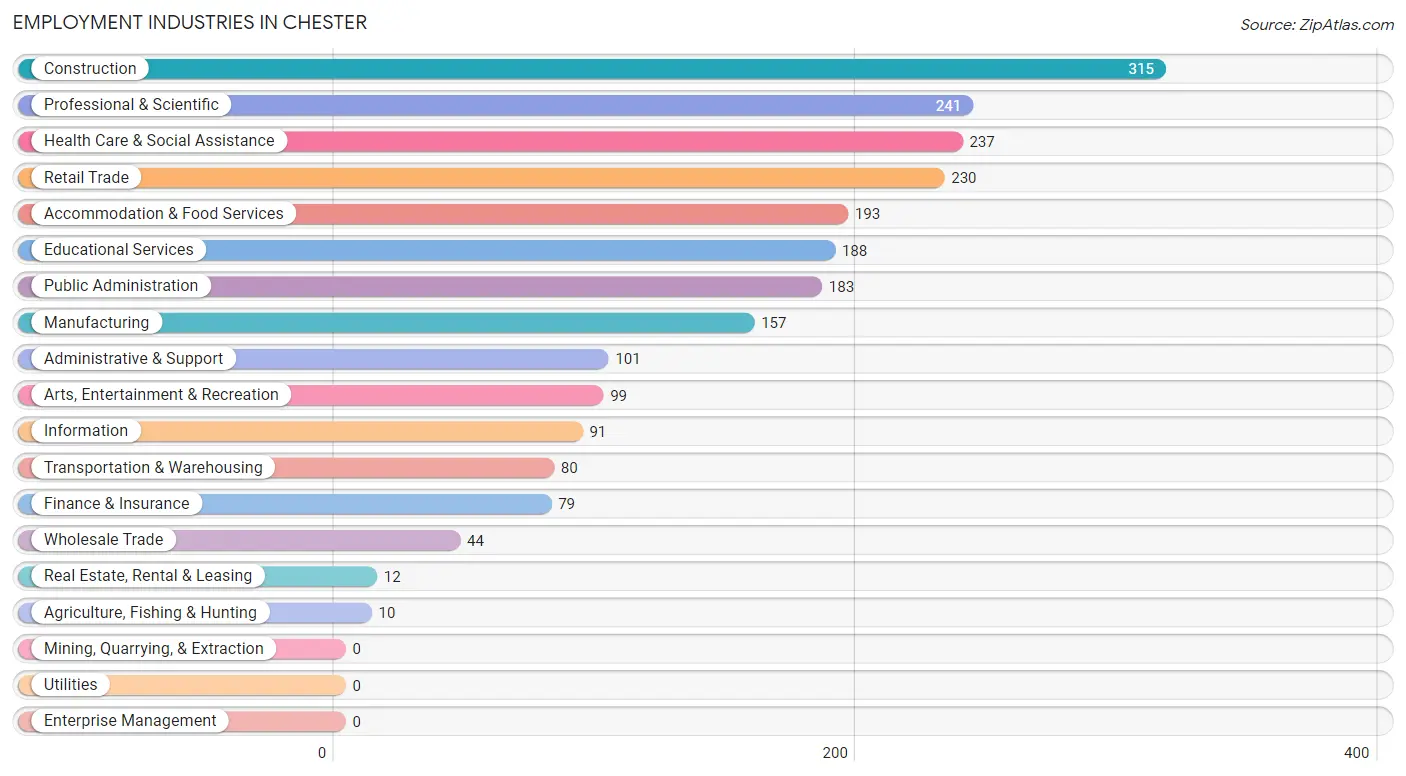
Employment Industries in Chester
The major employment industries in Chester include Construction (315 | 13.1%), Professional & Scientific (241 | 10.0%), Health Care & Social Assistance (237 | 9.9%), Retail Trade (230 | 9.6%), and Accommodation & Food Services (193 | 8.0%).
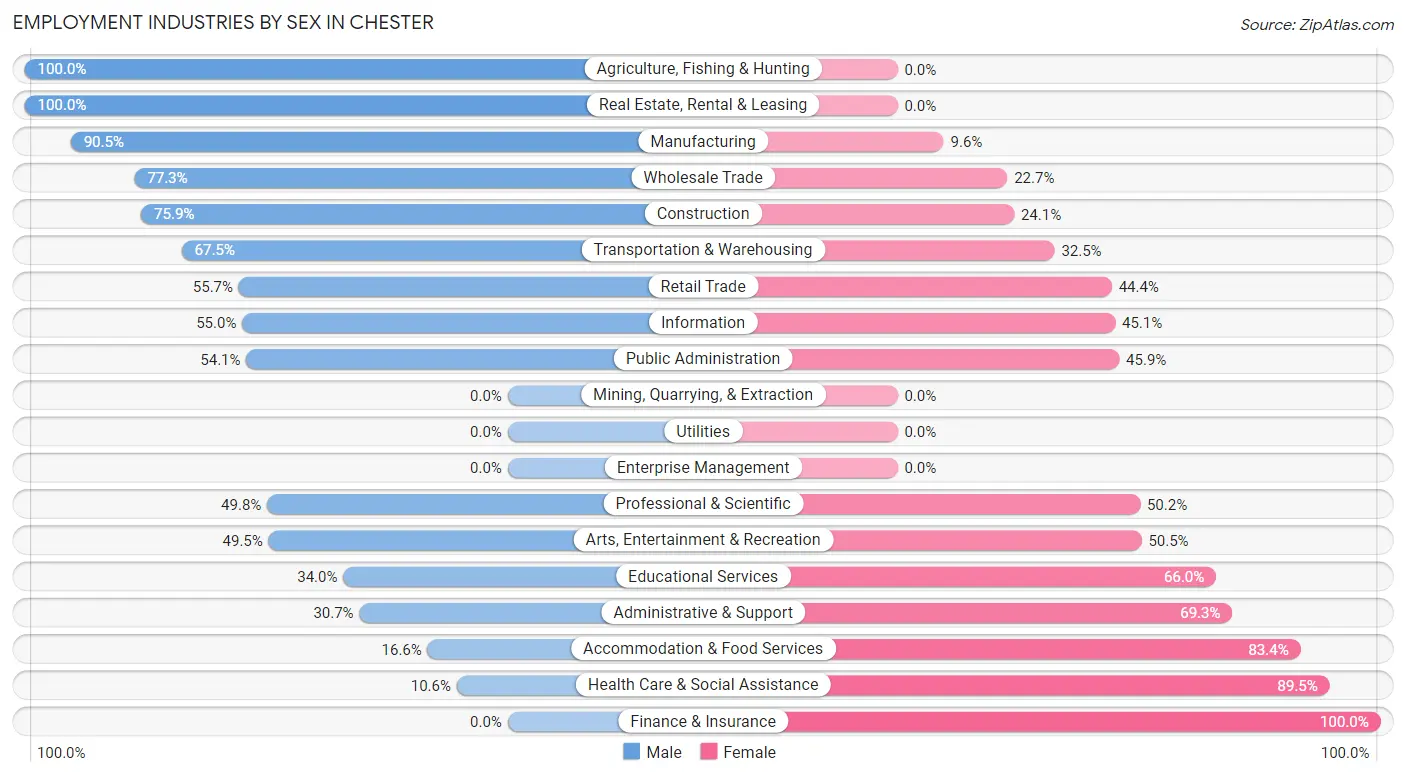
Employment Industries by Sex in Chester
The Chester industries that see more men than women are Agriculture, Fishing & Hunting (100.0%), Real Estate, Rental & Leasing (100.0%), and Manufacturing (90.4%), whereas the industries that tend to have a higher number of women are Finance & Insurance (100.0%), Health Care & Social Assistance (89.4%), and Accommodation & Food Services (83.4%).
| Industry | Male | Female |
| Agriculture, Fishing & Hunting | 10 (100.0%) | 0 (0.0%) |
| Mining, Quarrying, & Extraction | 0 (0.0%) | 0 (0.0%) |
| Construction | 239 (75.9%) | 76 (24.1%) |
| Manufacturing | 142 (90.4%) | 15 (9.6%) |
| Wholesale Trade | 34 (77.3%) | 10 (22.7%) |
| Retail Trade | 128 (55.6%) | 102 (44.4%) |
| Transportation & Warehousing | 54 (67.5%) | 26 (32.5%) |
| Utilities | 0 (0.0%) | 0 (0.0%) |
| Information | 50 (54.9%) | 41 (45.1%) |
| Finance & Insurance | 0 (0.0%) | 79 (100.0%) |
| Real Estate, Rental & Leasing | 12 (100.0%) | 0 (0.0%) |
| Professional & Scientific | 120 (49.8%) | 121 (50.2%) |
| Enterprise Management | 0 (0.0%) | 0 (0.0%) |
| Administrative & Support | 31 (30.7%) | 70 (69.3%) |
| Educational Services | 64 (34.0%) | 124 (66.0%) |
| Health Care & Social Assistance | 25 (10.5%) | 212 (89.4%) |
| Arts, Entertainment & Recreation | 49 (49.5%) | 50 (50.5%) |
| Accommodation & Food Services | 32 (16.6%) | 161 (83.4%) |
| Public Administration | 99 (54.1%) | 84 (45.9%) |
| Total | 1,125 (46.9%) | 1,275 (53.1%) |
Education in Chester
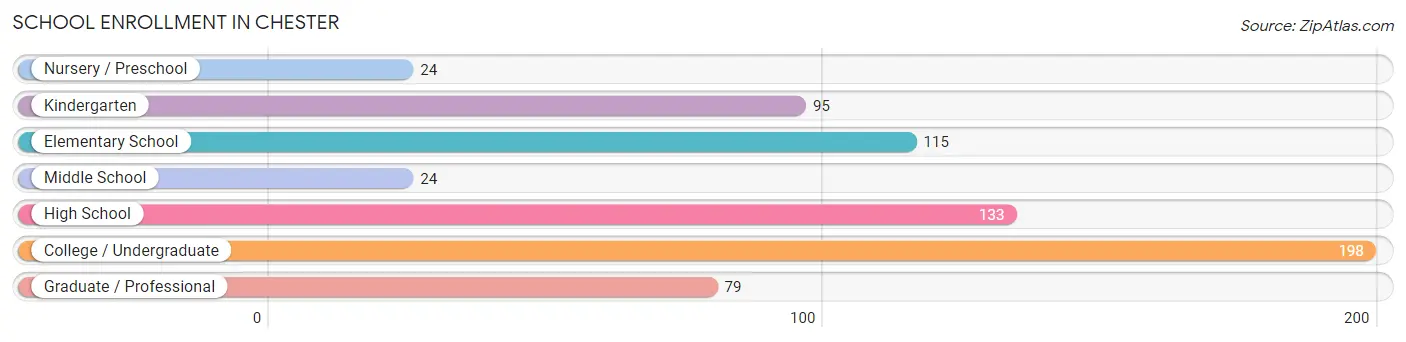
School Enrollment in Chester
The most common levels of schooling among the 668 students in Chester are college / undergraduate (198 | 29.6%), high school (133 | 19.9%), and elementary school (115 | 17.2%).
| School Level | # Students | % Students |
| Nursery / Preschool | 24 | 3.6% |
| Kindergarten | 95 | 14.2% |
| Elementary School | 115 | 17.2% |
| Middle School | 24 | 3.6% |
| High School | 133 | 19.9% |
| College / Undergraduate | 198 | 29.6% |
| Graduate / Professional | 79 | 11.8% |
| Total | 668 | 100.0% |
School Enrollment by Age by Funding Source in Chester
Out of a total of 668 students who are enrolled in schools in Chester, 155 (23.2%) attend a private institution, while the remaining 513 (76.8%) are enrolled in public schools. The age group of 3 to 4 year olds has the highest likelihood of being enrolled in private schools, with 13 (100.0% in the age bracket) enrolled. Conversely, the age group of 18 to 19 year olds has the lowest likelihood of being enrolled in a private school, with 93 (100.0% in the age bracket) attending a public institution.
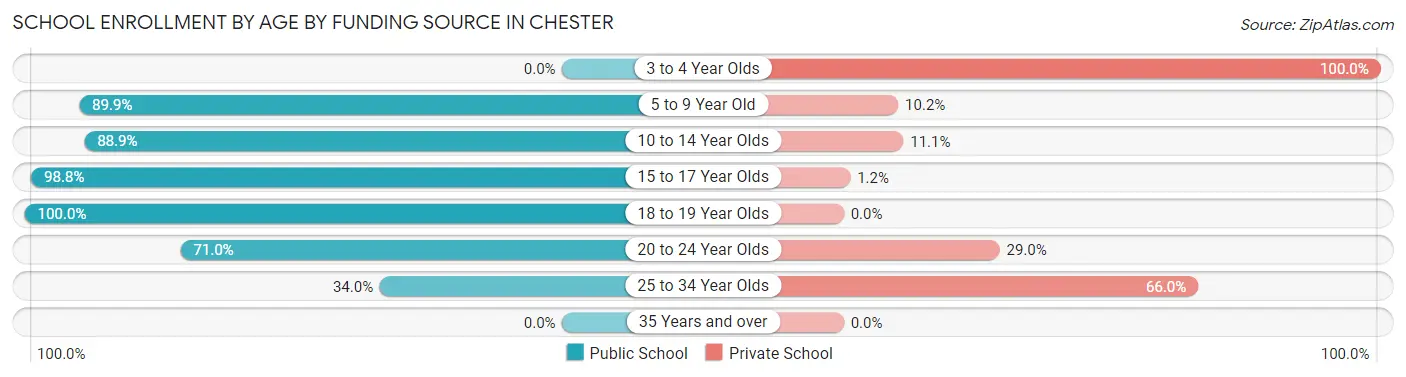
| Age Bracket | Public School | Private School |
| 3 to 4 Year Olds | 0 (0.0%) | 13 (100.0%) |
| 5 to 9 Year Old | 177 (89.8%) | 20 (10.2%) |
| 10 to 14 Year Olds | 88 (88.9%) | 11 (11.1%) |
| 15 to 17 Year Olds | 81 (98.8%) | 1 (1.2%) |
| 18 to 19 Year Olds | 93 (100.0%) | 0 (0.0%) |
| 20 to 24 Year Olds | 22 (71.0%) | 9 (29.0%) |
| 25 to 34 Year Olds | 52 (34.0%) | 101 (66.0%) |
| 35 Years and over | 0 (0.0%) | 0 (0.0%) |
| Total | 513 (76.8%) | 155 (23.2%) |
Educational Attainment by Field of Study in Chester
Business (225 | 18.3%), social sciences (128 | 10.4%), engineering (128 | 10.4%), bio, nature & agricultural (121 | 9.8%), and liberal arts & history (111 | 9.0%) are the most common fields of study among 1,232 individuals in Chester who have obtained a bachelor's degree or higher.
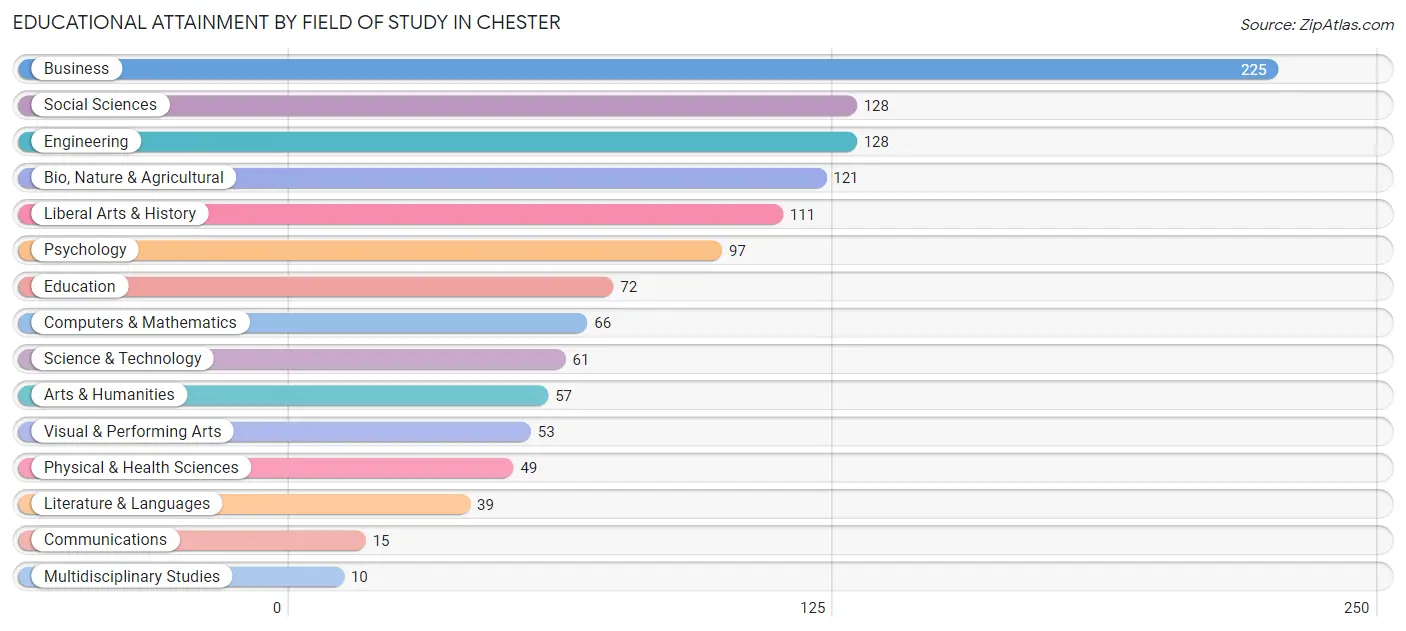
| Field of Study | # Graduates | % Graduates |
| Computers & Mathematics | 66 | 5.4% |
| Bio, Nature & Agricultural | 121 | 9.8% |
| Physical & Health Sciences | 49 | 4.0% |
| Psychology | 97 | 7.9% |
| Social Sciences | 128 | 10.4% |
| Engineering | 128 | 10.4% |
| Multidisciplinary Studies | 10 | 0.8% |
| Science & Technology | 61 | 5.0% |
| Business | 225 | 18.3% |
| Education | 72 | 5.8% |
| Literature & Languages | 39 | 3.2% |
| Liberal Arts & History | 111 | 9.0% |
| Visual & Performing Arts | 53 | 4.3% |
| Communications | 15 | 1.2% |
| Arts & Humanities | 57 | 4.6% |
| Total | 1,232 | 100.0% |
Transportation & Commute in Chester
Vehicle Availability by Sex in Chester
The most prevalent vehicle ownership categories in Chester are males with 2 vehicles (500, accounting for 44.4%) and females with 2 vehicles (529, making up 39.8%).
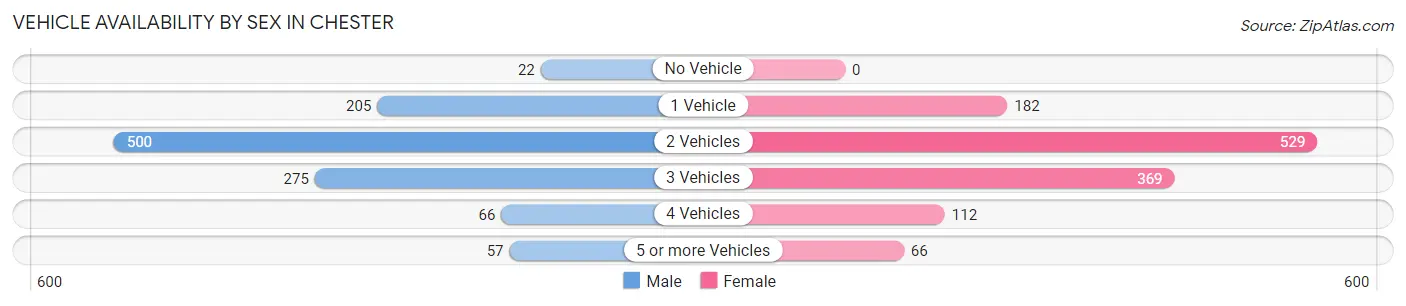
| Vehicles Available | Male | Female |
| No Vehicle | 22 (2.0%) | 0 (0.0%) |
| 1 Vehicle | 205 (18.2%) | 182 (14.5%) |
| 2 Vehicles | 500 (44.4%) | 529 (42.0%) |
| 3 Vehicles | 275 (24.4%) | 369 (29.3%) |
| 4 Vehicles | 66 (5.9%) | 112 (8.9%) |
| 5 or more Vehicles | 57 (5.1%) | 66 (5.2%) |
| Total | 1,125 (100.0%) | 1,258 (100.0%) |
Commute Time in Chester
The most frequently occuring commute durations in Chester are 45 to 59 minutes (358 commuters, 16.1%), 10 to 14 minutes (268 commuters, 12.0%), and 15 to 19 minutes (265 commuters, 11.9%).
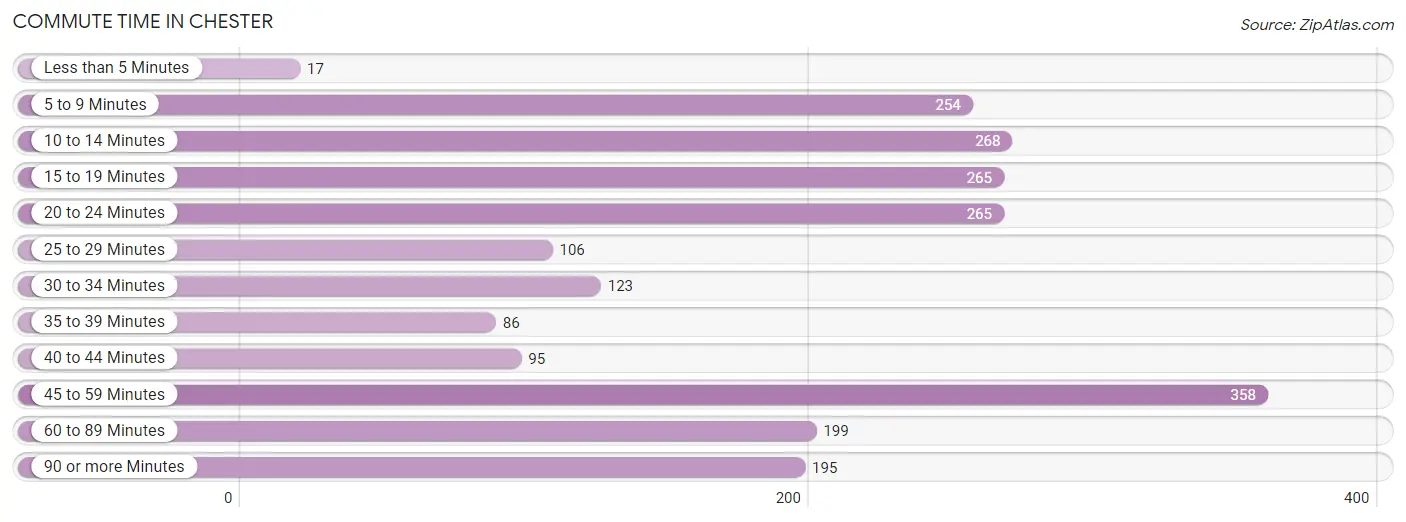
| Commute Time | # Commuters | % Commuters |
| Less than 5 Minutes | 17 | 0.8% |
| 5 to 9 Minutes | 254 | 11.4% |
| 10 to 14 Minutes | 268 | 12.0% |
| 15 to 19 Minutes | 265 | 11.9% |
| 20 to 24 Minutes | 265 | 11.9% |
| 25 to 29 Minutes | 106 | 4.8% |
| 30 to 34 Minutes | 123 | 5.5% |
| 35 to 39 Minutes | 86 | 3.8% |
| 40 to 44 Minutes | 95 | 4.3% |
| 45 to 59 Minutes | 358 | 16.1% |
| 60 to 89 Minutes | 199 | 8.9% |
| 90 or more Minutes | 195 | 8.7% |
Commute Time by Sex in Chester
The most common commute times in Chester are 15 to 19 minutes (175 commuters, 16.7%) for males and 20 to 24 minutes (239 commuters, 20.2%) for females.
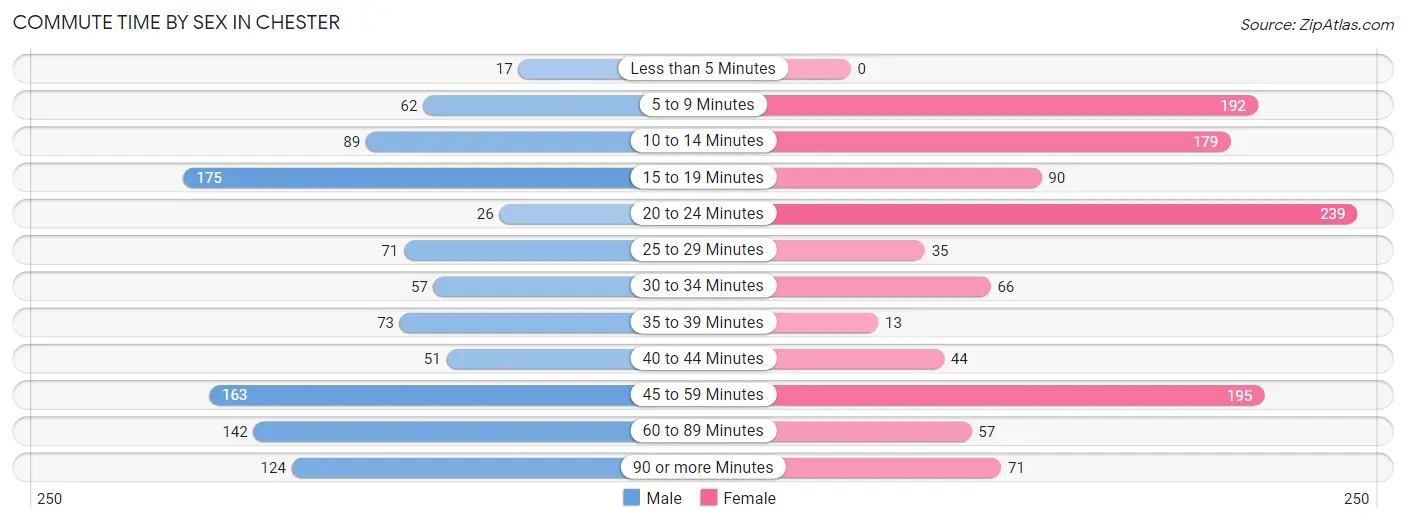
| Commute Time | Male | Female |
| Less than 5 Minutes | 17 (1.6%) | 0 (0.0%) |
| 5 to 9 Minutes | 62 (5.9%) | 192 (16.3%) |
| 10 to 14 Minutes | 89 (8.5%) | 179 (15.2%) |
| 15 to 19 Minutes | 175 (16.7%) | 90 (7.6%) |
| 20 to 24 Minutes | 26 (2.5%) | 239 (20.2%) |
| 25 to 29 Minutes | 71 (6.8%) | 35 (3.0%) |
| 30 to 34 Minutes | 57 (5.4%) | 66 (5.6%) |
| 35 to 39 Minutes | 73 (7.0%) | 13 (1.1%) |
| 40 to 44 Minutes | 51 (4.9%) | 44 (3.7%) |
| 45 to 59 Minutes | 163 (15.5%) | 195 (16.5%) |
| 60 to 89 Minutes | 142 (13.5%) | 57 (4.8%) |
| 90 or more Minutes | 124 (11.8%) | 71 (6.0%) |
Time of Departure to Work by Sex in Chester
The most frequent times of departure to work in Chester are 6:00 AM to 6:29 AM (203, 19.3%) for males and 7:00 AM to 7:29 AM (227, 19.2%) for females.
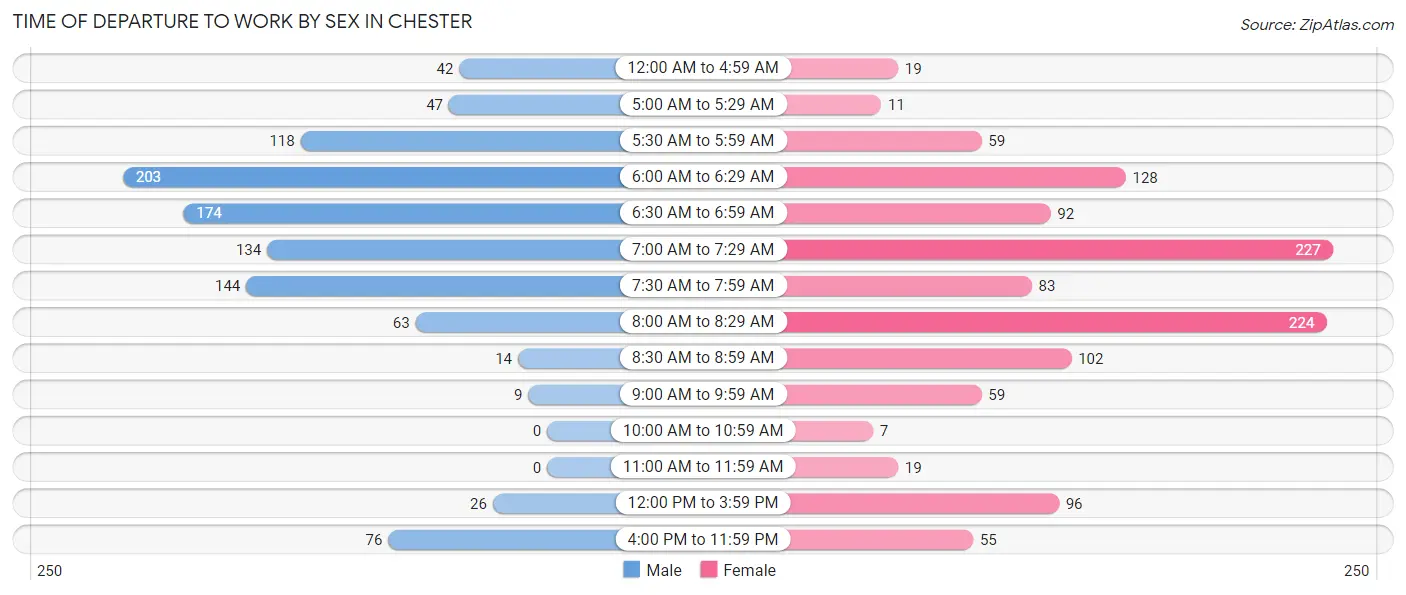
| Time of Departure | Male | Female |
| 12:00 AM to 4:59 AM | 42 (4.0%) | 19 (1.6%) |
| 5:00 AM to 5:29 AM | 47 (4.5%) | 11 (0.9%) |
| 5:30 AM to 5:59 AM | 118 (11.2%) | 59 (5.0%) |
| 6:00 AM to 6:29 AM | 203 (19.3%) | 128 (10.8%) |
| 6:30 AM to 6:59 AM | 174 (16.6%) | 92 (7.8%) |
| 7:00 AM to 7:29 AM | 134 (12.8%) | 227 (19.2%) |
| 7:30 AM to 7:59 AM | 144 (13.7%) | 83 (7.0%) |
| 8:00 AM to 8:29 AM | 63 (6.0%) | 224 (19.0%) |
| 8:30 AM to 8:59 AM | 14 (1.3%) | 102 (8.6%) |
| 9:00 AM to 9:59 AM | 9 (0.9%) | 59 (5.0%) |
| 10:00 AM to 10:59 AM | 0 (0.0%) | 7 (0.6%) |
| 11:00 AM to 11:59 AM | 0 (0.0%) | 19 (1.6%) |
| 12:00 PM to 3:59 PM | 26 (2.5%) | 96 (8.1%) |
| 4:00 PM to 11:59 PM | 76 (7.2%) | 55 (4.7%) |
| Total | 1,050 (100.0%) | 1,181 (100.0%) |
Housing Occupancy in Chester
Occupancy by Ownership in Chester
Of the total 1,881 dwellings in Chester, owner-occupied units account for 1,274 (67.7%), while renter-occupied units make up 607 (32.3%).
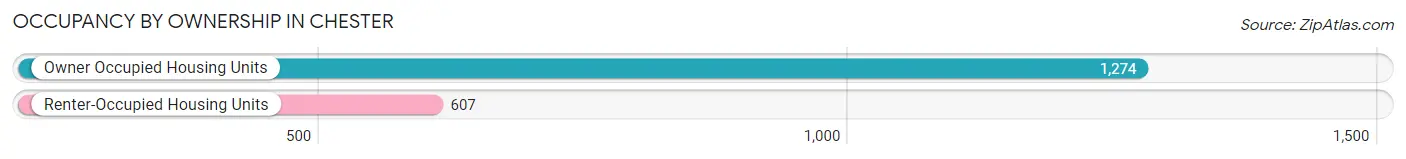
| Occupancy | # Housing Units | % Housing Units |
| Owner Occupied Housing Units | 1,274 | 67.7% |
| Renter-Occupied Housing Units | 607 | 32.3% |
| Total Occupied Housing Units | 1,881 | 100.0% |
Occupancy by Household Size in Chester
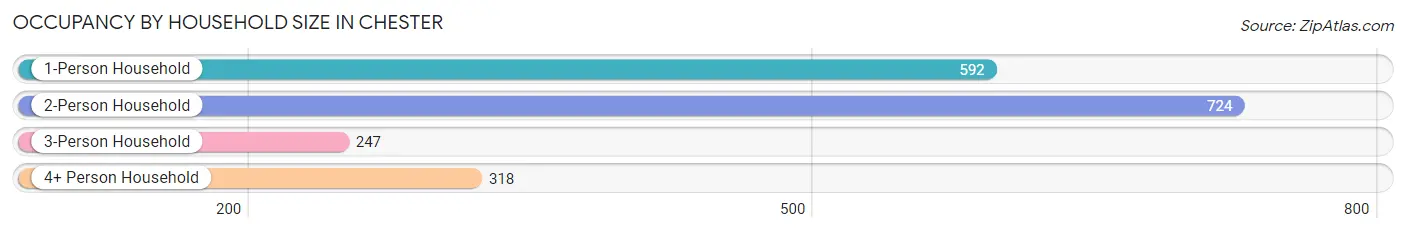
| Household Size | # Housing Units | % Housing Units |
| 1-Person Household | 592 | 31.5% |
| 2-Person Household | 724 | 38.5% |
| 3-Person Household | 247 | 13.1% |
| 4+ Person Household | 318 | 16.9% |
| Total Housing Units | 1,881 | 100.0% |
Occupancy by Ownership by Household Size in Chester
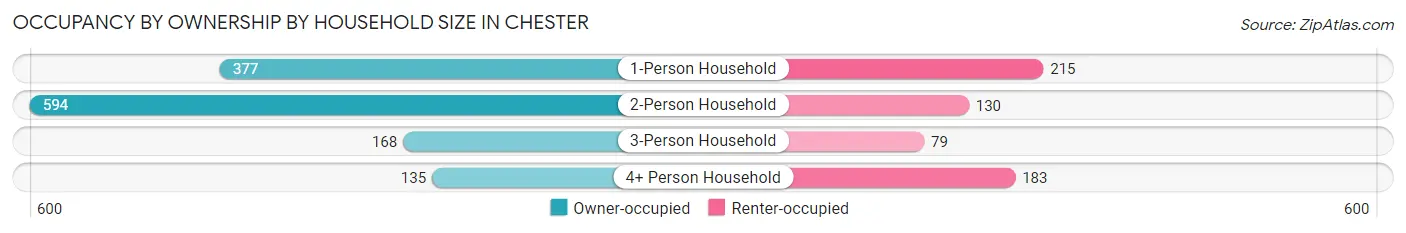
| Household Size | Owner-occupied | Renter-occupied |
| 1-Person Household | 377 (63.7%) | 215 (36.3%) |
| 2-Person Household | 594 (82.0%) | 130 (18.0%) |
| 3-Person Household | 168 (68.0%) | 79 (32.0%) |
| 4+ Person Household | 135 (42.4%) | 183 (57.6%) |
| Total Housing Units | 1,274 (67.7%) | 607 (32.3%) |
Occupancy by Educational Attainment in Chester
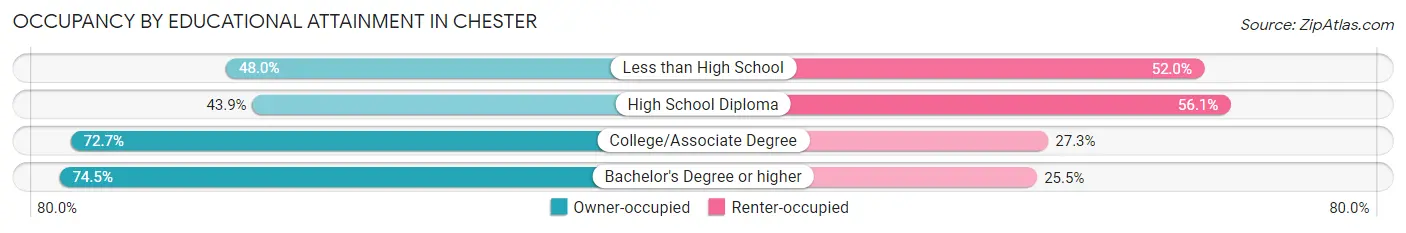
| Household Size | Owner-occupied | Renter-occupied |
| Less than High School | 49 (48.0%) | 53 (52.0%) |
| High School Diploma | 125 (43.9%) | 160 (56.1%) |
| College/Associate Degree | 511 (72.7%) | 192 (27.3%) |
| Bachelor's Degree or higher | 589 (74.5%) | 202 (25.5%) |
Occupancy by Age of Householder in Chester
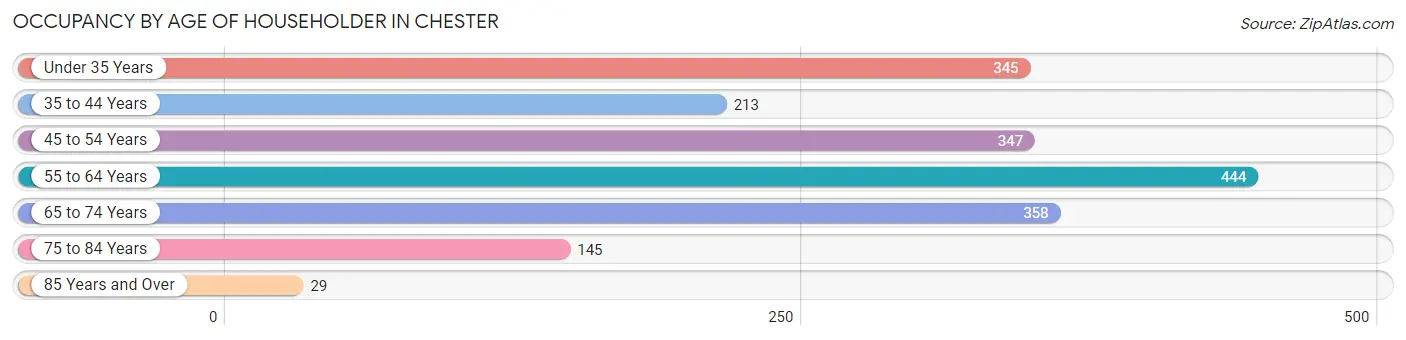
| Age Bracket | # Households | % Households |
| Under 35 Years | 345 | 18.3% |
| 35 to 44 Years | 213 | 11.3% |
| 45 to 54 Years | 347 | 18.4% |
| 55 to 64 Years | 444 | 23.6% |
| 65 to 74 Years | 358 | 19.0% |
| 75 to 84 Years | 145 | 7.7% |
| 85 Years and Over | 29 | 1.5% |
| Total | 1,881 | 100.0% |
Housing Finances in Chester
Median Income by Occupancy in Chester
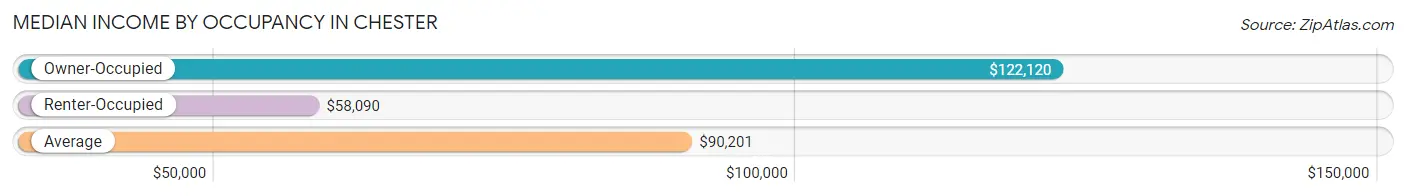
| Occupancy Type | # Households | Median Income |
| Owner-Occupied | 1,274 (67.7%) | $122,120 |
| Renter-Occupied | 607 (32.3%) | $58,090 |
| Average | 1,881 (100.0%) | $90,201 |
Occupancy by Householder Income Bracket in Chester
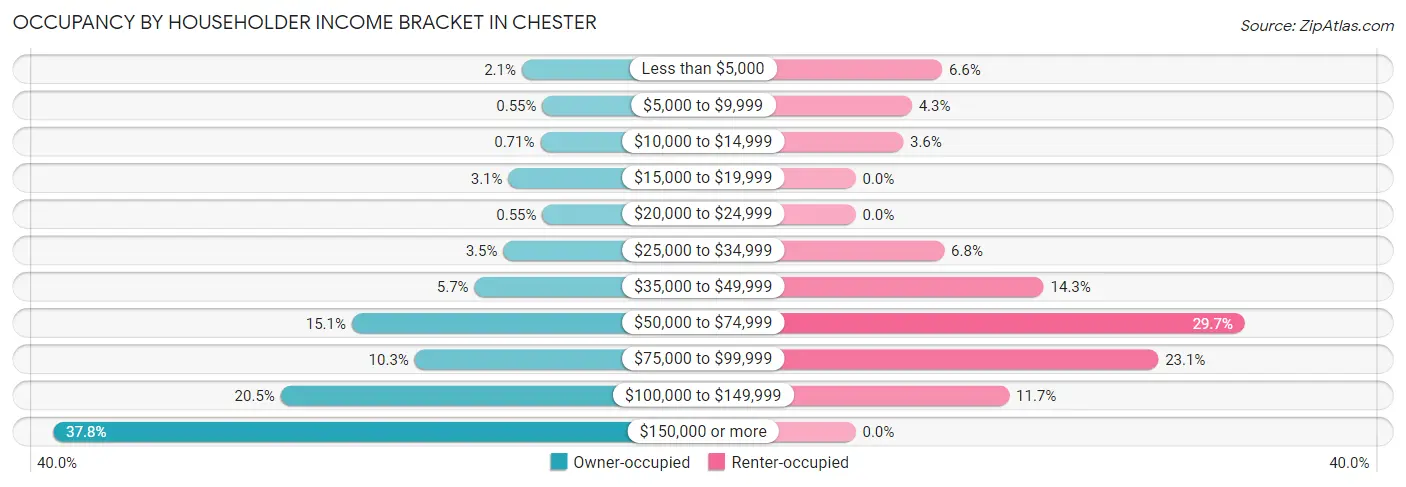
| Income Bracket | Owner-occupied | Renter-occupied |
| Less than $5,000 | 27 (2.1%) | 40 (6.6%) |
| $5,000 to $9,999 | 7 (0.5%) | 26 (4.3%) |
| $10,000 to $14,999 | 9 (0.7%) | 22 (3.6%) |
| $15,000 to $19,999 | 40 (3.1%) | 0 (0.0%) |
| $20,000 to $24,999 | 7 (0.5%) | 0 (0.0%) |
| $25,000 to $34,999 | 45 (3.5%) | 41 (6.8%) |
| $35,000 to $49,999 | 73 (5.7%) | 87 (14.3%) |
| $50,000 to $74,999 | 192 (15.1%) | 180 (29.6%) |
| $75,000 to $99,999 | 131 (10.3%) | 140 (23.1%) |
| $100,000 to $149,999 | 261 (20.5%) | 71 (11.7%) |
| $150,000 or more | 482 (37.8%) | 0 (0.0%) |
| Total | 1,274 (100.0%) | 607 (100.0%) |
Monthly Housing Cost Tiers in Chester
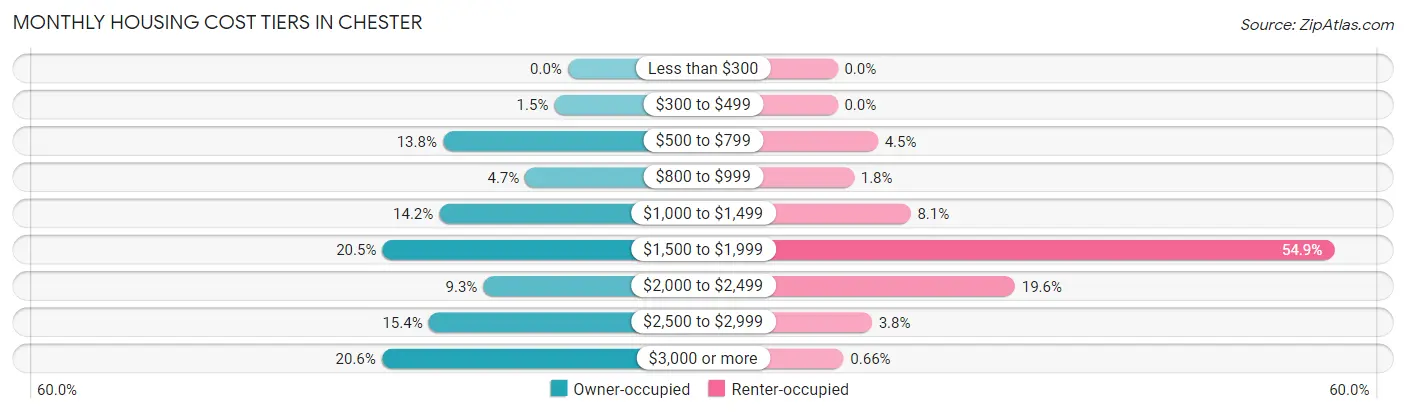
| Monthly Cost | Owner-occupied | Renter-occupied |
| Less than $300 | 0 (0.0%) | 0 (0.0%) |
| $300 to $499 | 19 (1.5%) | 0 (0.0%) |
| $500 to $799 | 176 (13.8%) | 27 (4.4%) |
| $800 to $999 | 60 (4.7%) | 11 (1.8%) |
| $1,000 to $1,499 | 181 (14.2%) | 49 (8.1%) |
| $1,500 to $1,999 | 261 (20.5%) | 333 (54.9%) |
| $2,000 to $2,499 | 119 (9.3%) | 119 (19.6%) |
| $2,500 to $2,999 | 196 (15.4%) | 23 (3.8%) |
| $3,000 or more | 262 (20.6%) | 4 (0.7%) |
| Total | 1,274 (100.0%) | 607 (100.0%) |
Physical Housing Characteristics in Chester
Housing Structures in Chester
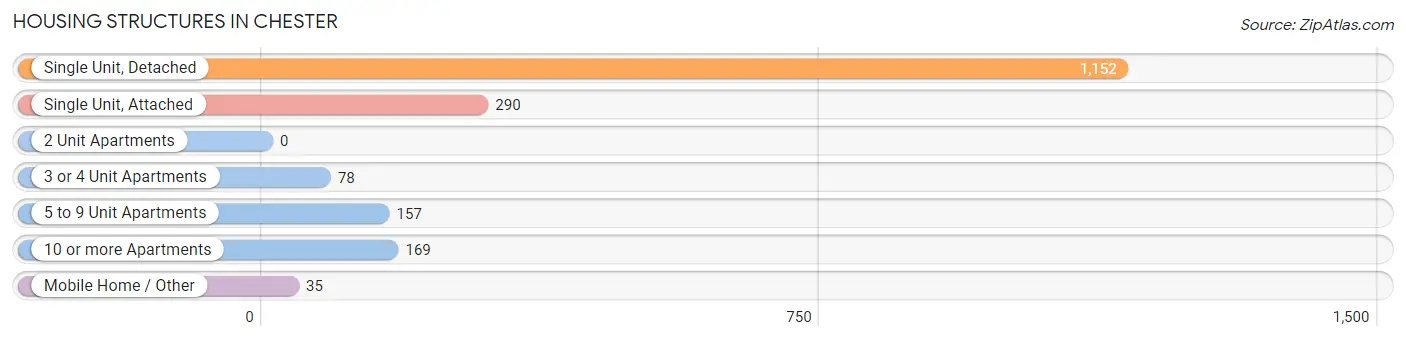
| Structure Type | # Housing Units | % Housing Units |
| Single Unit, Detached | 1,152 | 61.2% |
| Single Unit, Attached | 290 | 15.4% |
| 2 Unit Apartments | 0 | 0.0% |
| 3 or 4 Unit Apartments | 78 | 4.2% |
| 5 to 9 Unit Apartments | 157 | 8.4% |
| 10 or more Apartments | 169 | 9.0% |
| Mobile Home / Other | 35 | 1.9% |
| Total | 1,881 | 100.0% |
Housing Structures by Occupancy in Chester
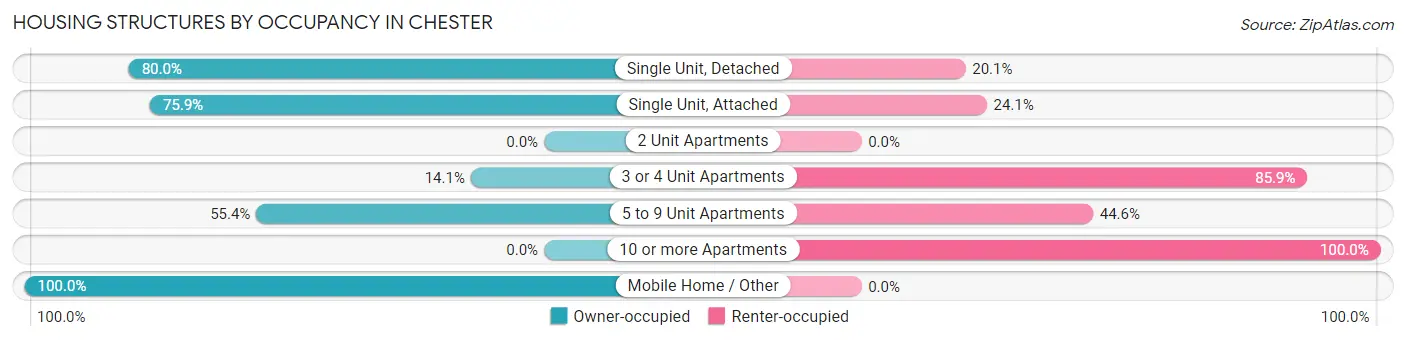
| Structure Type | Owner-occupied | Renter-occupied |
| Single Unit, Detached | 921 (79.9%) | 231 (20.1%) |
| Single Unit, Attached | 220 (75.9%) | 70 (24.1%) |
| 2 Unit Apartments | 0 (0.0%) | 0 (0.0%) |
| 3 or 4 Unit Apartments | 11 (14.1%) | 67 (85.9%) |
| 5 to 9 Unit Apartments | 87 (55.4%) | 70 (44.6%) |
| 10 or more Apartments | 0 (0.0%) | 169 (100.0%) |
| Mobile Home / Other | 35 (100.0%) | 0 (0.0%) |
| Total | 1,274 (67.7%) | 607 (32.3%) |
Housing Structures by Number of Rooms in Chester
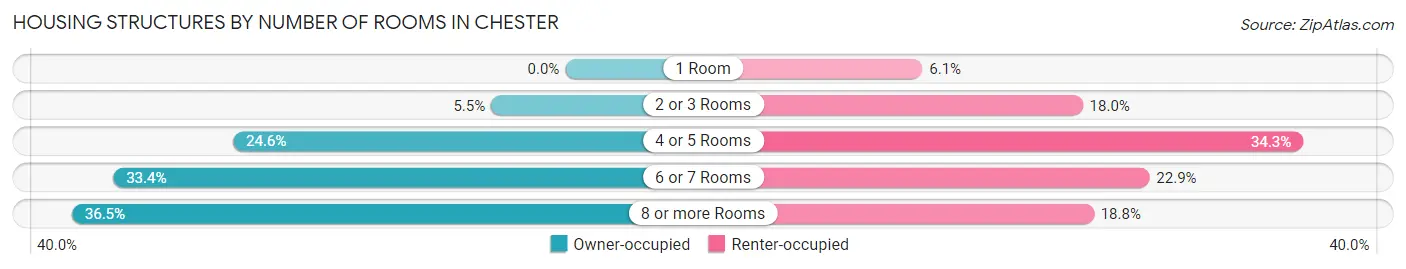
| Number of Rooms | Owner-occupied | Renter-occupied |
| 1 Room | 0 (0.0%) | 37 (6.1%) |
| 2 or 3 Rooms | 70 (5.5%) | 109 (18.0%) |
| 4 or 5 Rooms | 313 (24.6%) | 208 (34.3%) |
| 6 or 7 Rooms | 426 (33.4%) | 139 (22.9%) |
| 8 or more Rooms | 465 (36.5%) | 114 (18.8%) |
| Total | 1,274 (100.0%) | 607 (100.0%) |
Housing Structure by Heating Type in Chester
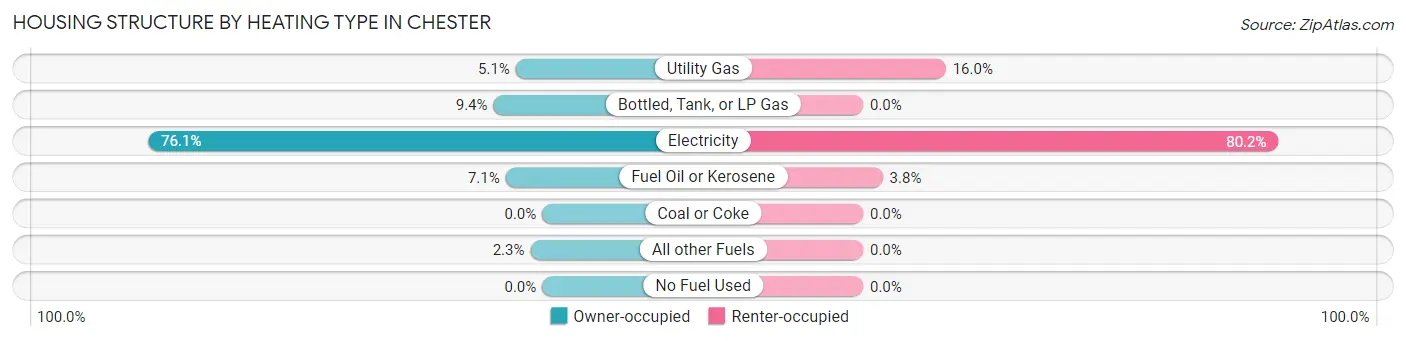
| Heating Type | Owner-occupied | Renter-occupied |
| Utility Gas | 65 (5.1%) | 97 (16.0%) |
| Bottled, Tank, or LP Gas | 120 (9.4%) | 0 (0.0%) |
| Electricity | 970 (76.1%) | 487 (80.2%) |
| Fuel Oil or Kerosene | 90 (7.1%) | 23 (3.8%) |
| Coal or Coke | 0 (0.0%) | 0 (0.0%) |
| All other Fuels | 29 (2.3%) | 0 (0.0%) |
| No Fuel Used | 0 (0.0%) | 0 (0.0%) |
| Total | 1,274 (100.0%) | 607 (100.0%) |
Household Vehicle Usage in Chester
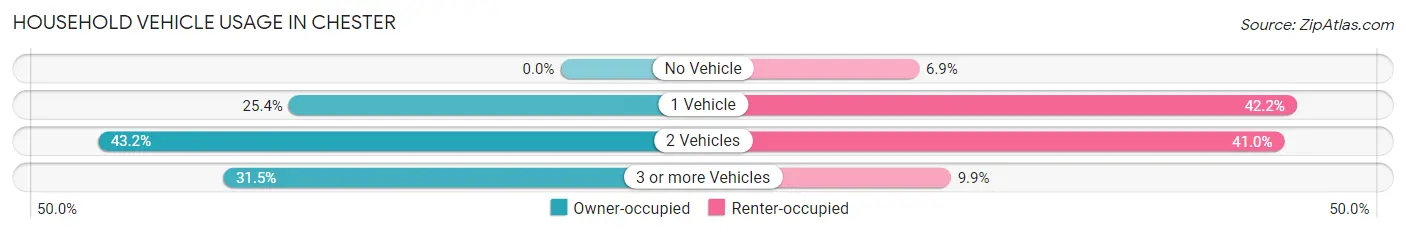
| Vehicles per Household | Owner-occupied | Renter-occupied |
| No Vehicle | 0 (0.0%) | 42 (6.9%) |
| 1 Vehicle | 323 (25.4%) | 256 (42.2%) |
| 2 Vehicles | 550 (43.2%) | 249 (41.0%) |
| 3 or more Vehicles | 401 (31.5%) | 60 (9.9%) |
| Total | 1,274 (100.0%) | 607 (100.0%) |
Real Estate & Mortgages in Chester
Real Estate and Mortgage Overview in Chester
| Characteristic | Without Mortgage | With Mortgage |
| Housing Units | 264 | 1,010 |
| Median Property Value | $435,100 | $411,900 |
| Median Household Income | $88,026 | $392 |
| Monthly Housing Costs | $750 | $262 |
| Real Estate Taxes | $3,944 | $61 |
Property Value by Mortgage Status in Chester
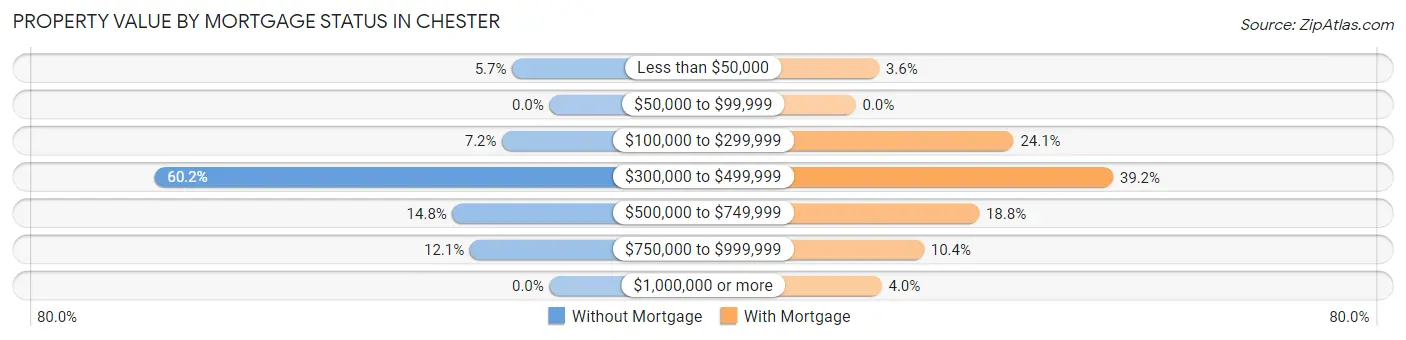
| Property Value | Without Mortgage | With Mortgage |
| Less than $50,000 | 15 (5.7%) | 36 (3.6%) |
| $50,000 to $99,999 | 0 (0.0%) | 0 (0.0%) |
| $100,000 to $299,999 | 19 (7.2%) | 243 (24.1%) |
| $300,000 to $499,999 | 159 (60.2%) | 396 (39.2%) |
| $500,000 to $749,999 | 39 (14.8%) | 190 (18.8%) |
| $750,000 to $999,999 | 32 (12.1%) | 105 (10.4%) |
| $1,000,000 or more | 0 (0.0%) | 40 (4.0%) |
| Total | 264 (100.0%) | 1,010 (100.0%) |
Household Income by Mortgage Status in Chester
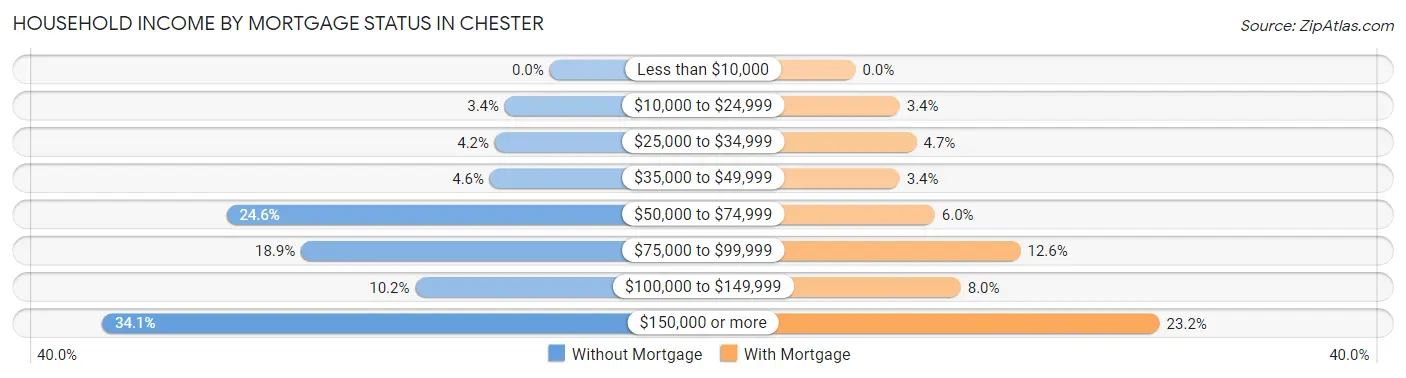
| Household Income | Without Mortgage | With Mortgage |
| Less than $10,000 | 0 (0.0%) | 0 (0.0%) |
| $10,000 to $24,999 | 9 (3.4%) | 34 (3.4%) |
| $25,000 to $34,999 | 11 (4.2%) | 47 (4.6%) |
| $35,000 to $49,999 | 12 (4.5%) | 34 (3.4%) |
| $50,000 to $74,999 | 65 (24.6%) | 61 (6.0%) |
| $75,000 to $99,999 | 50 (18.9%) | 127 (12.6%) |
| $100,000 to $149,999 | 27 (10.2%) | 81 (8.0%) |
| $150,000 or more | 90 (34.1%) | 234 (23.2%) |
| Total | 264 (100.0%) | 1,010 (100.0%) |
Property Value to Household Income Ratio in Chester
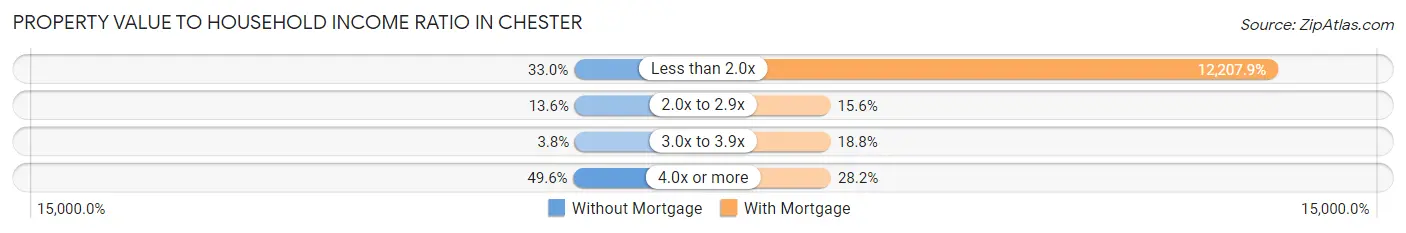
| Value-to-Income Ratio | Without Mortgage | With Mortgage |
| Less than 2.0x | 87 (33.0%) | 123,300 (12,207.9%) |
| 2.0x to 2.9x | 36 (13.6%) | 158 (15.6%) |
| 3.0x to 3.9x | 10 (3.8%) | 190 (18.8%) |
| 4.0x or more | 131 (49.6%) | 285 (28.2%) |
| Total | 264 (100.0%) | 1,010 (100.0%) |
Real Estate Taxes by Mortgage Status in Chester
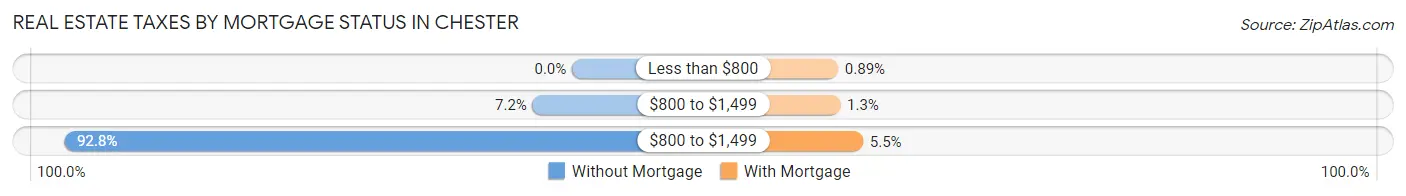
| Property Taxes | Without Mortgage | With Mortgage |
| Less than $800 | 0 (0.0%) | 9 (0.9%) |
| $800 to $1,499 | 19 (7.2%) | 13 (1.3%) |
| $800 to $1,499 | 245 (92.8%) | 55 (5.4%) |
| Total | 264 (100.0%) | 1,010 (100.0%) |
Health & Disability in Chester
Health Insurance Coverage by Age in Chester
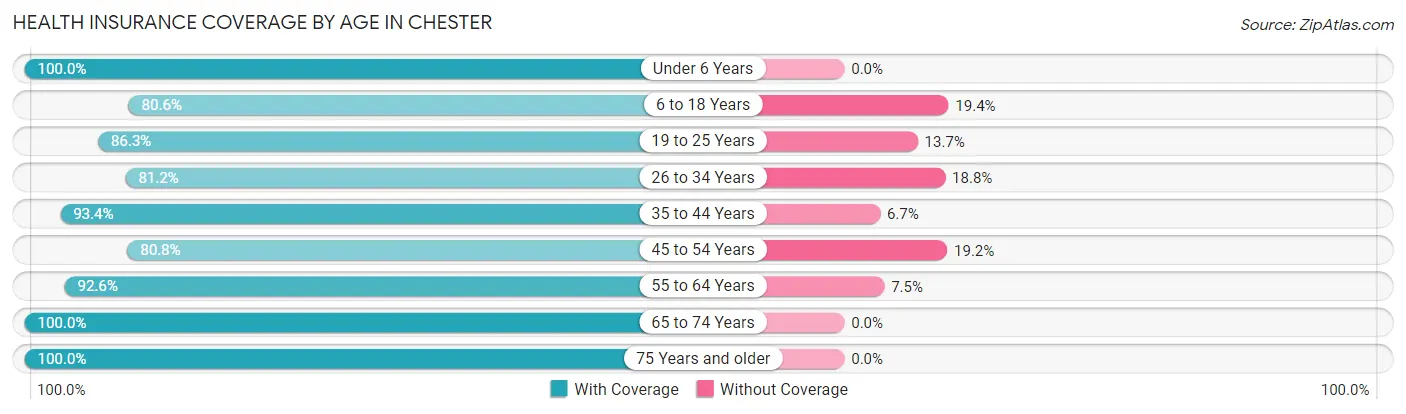
| Age Bracket | With Coverage | Without Coverage |
| Under 6 Years | 438 (100.0%) | 0 (0.0%) |
| 6 to 18 Years | 299 (80.6%) | 72 (19.4%) |
| 19 to 25 Years | 328 (86.3%) | 52 (13.7%) |
| 26 to 34 Years | 505 (81.2%) | 117 (18.8%) |
| 35 to 44 Years | 421 (93.3%) | 30 (6.7%) |
| 45 to 54 Years | 409 (80.8%) | 97 (19.2%) |
| 55 to 64 Years | 845 (92.5%) | 68 (7.4%) |
| 65 to 74 Years | 513 (100.0%) | 0 (0.0%) |
| 75 Years and older | 261 (100.0%) | 0 (0.0%) |
| Total | 4,019 (90.2%) | 436 (9.8%) |
Health Insurance Coverage by Citizenship Status in Chester
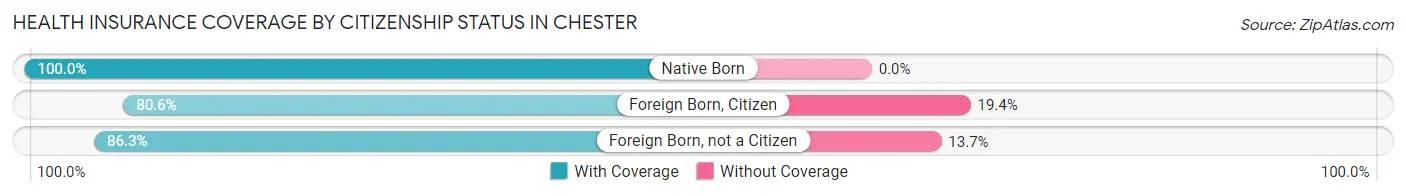
| Citizenship Status | With Coverage | Without Coverage |
| Native Born | 438 (100.0%) | 0 (0.0%) |
| Foreign Born, Citizen | 299 (80.6%) | 72 (19.4%) |
| Foreign Born, not a Citizen | 328 (86.3%) | 52 (13.7%) |
Health Insurance Coverage by Household Income in Chester
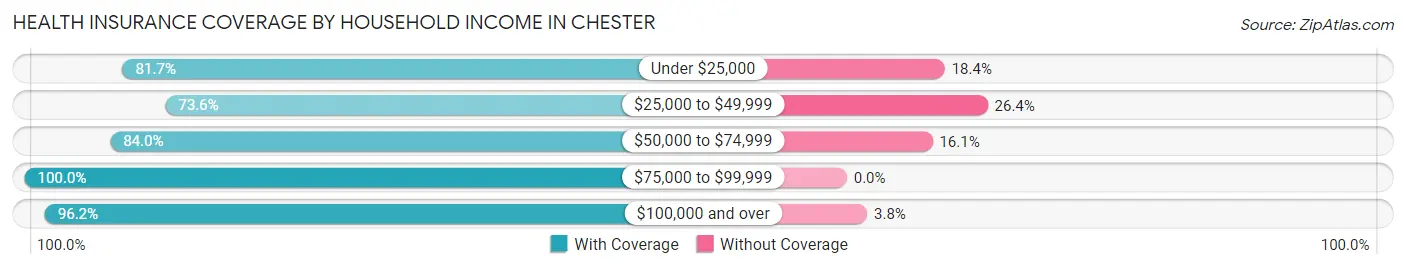
| Household Income | With Coverage | Without Coverage |
| Under $25,000 | 178 (81.7%) | 40 (18.3%) |
| $25,000 to $49,999 | 455 (73.6%) | 163 (26.4%) |
| $50,000 to $74,999 | 790 (84.0%) | 151 (16.1%) |
| $75,000 to $99,999 | 519 (100.0%) | 0 (0.0%) |
| $100,000 and over | 2,077 (96.2%) | 82 (3.8%) |
Public vs Private Health Insurance Coverage by Age in Chester
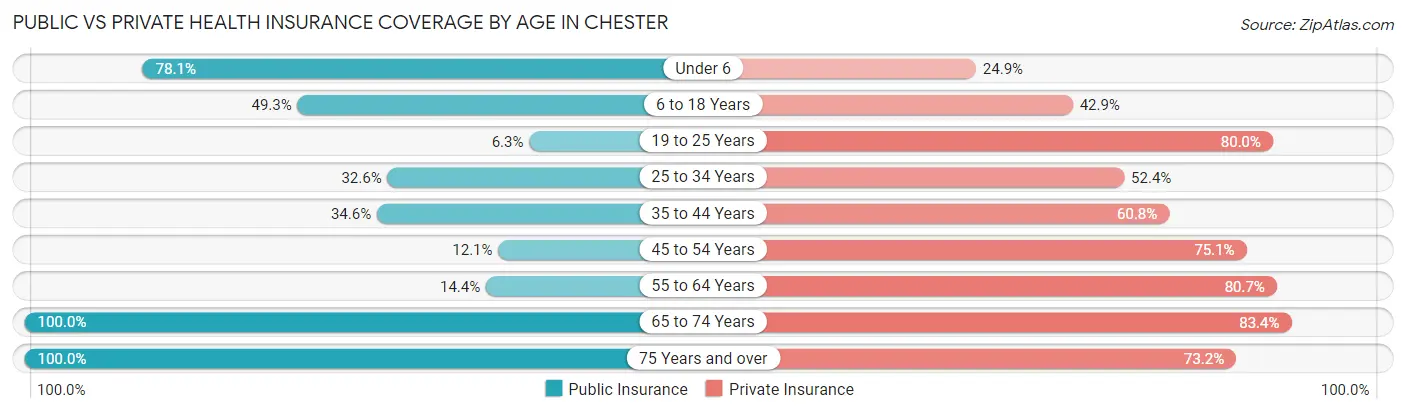
| Age Bracket | Public Insurance | Private Insurance |
| Under 6 | 342 (78.1%) | 109 (24.9%) |
| 6 to 18 Years | 183 (49.3%) | 159 (42.9%) |
| 19 to 25 Years | 24 (6.3%) | 304 (80.0%) |
| 25 to 34 Years | 203 (32.6%) | 326 (52.4%) |
| 35 to 44 Years | 156 (34.6%) | 274 (60.8%) |
| 45 to 54 Years | 61 (12.1%) | 380 (75.1%) |
| 55 to 64 Years | 131 (14.3%) | 737 (80.7%) |
| 65 to 74 Years | 513 (100.0%) | 428 (83.4%) |
| 75 Years and over | 261 (100.0%) | 191 (73.2%) |
| Total | 1,874 (42.1%) | 2,908 (65.3%) |
Disability Status by Sex by Age in Chester
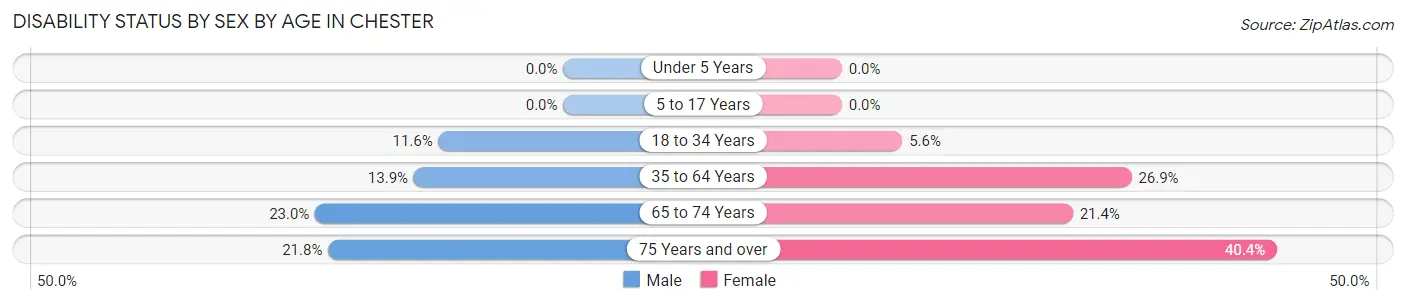
| Age Bracket | Male | Female |
| Under 5 Years | 0 (0.0%) | 0 (0.0%) |
| 5 to 17 Years | 0 (0.0%) | 0 (0.0%) |
| 18 to 34 Years | 52 (11.6%) | 31 (5.6%) |
| 35 to 64 Years | 101 (13.9%) | 307 (26.9%) |
| 65 to 74 Years | 73 (23.0%) | 42 (21.4%) |
| 75 Years and over | 24 (21.8%) | 61 (40.4%) |
Disability Class by Sex by Age in Chester
Disability Class: Hearing Difficulty
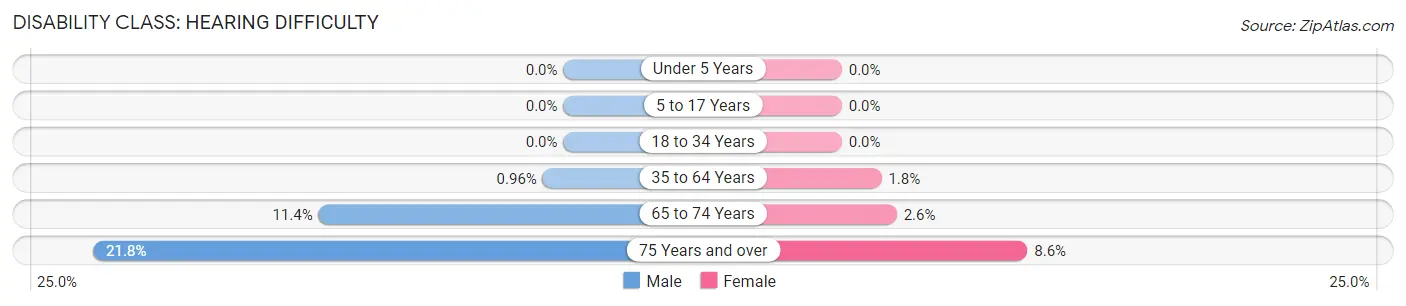
| Age Bracket | Male | Female |
| Under 5 Years | 0 (0.0%) | 0 (0.0%) |
| 5 to 17 Years | 0 (0.0%) | 0 (0.0%) |
| 18 to 34 Years | 0 (0.0%) | 0 (0.0%) |
| 35 to 64 Years | 7 (1.0%) | 21 (1.8%) |
| 65 to 74 Years | 36 (11.4%) | 5 (2.5%) |
| 75 Years and over | 24 (21.8%) | 13 (8.6%) |
Disability Class: Vision Difficulty
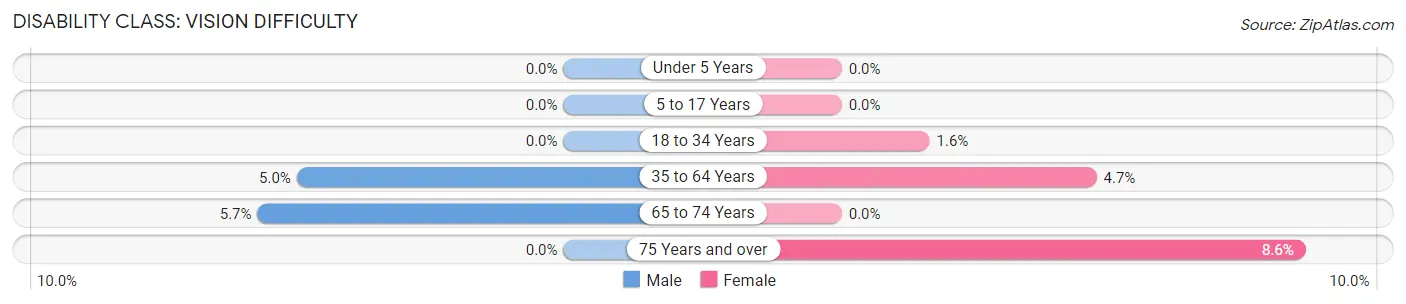
| Age Bracket | Male | Female |
| Under 5 Years | 0 (0.0%) | 0 (0.0%) |
| 5 to 17 Years | 0 (0.0%) | 0 (0.0%) |
| 18 to 34 Years | 0 (0.0%) | 9 (1.6%) |
| 35 to 64 Years | 36 (5.0%) | 54 (4.7%) |
| 65 to 74 Years | 18 (5.7%) | 0 (0.0%) |
| 75 Years and over | 0 (0.0%) | 13 (8.6%) |
Disability Class: Cognitive Difficulty
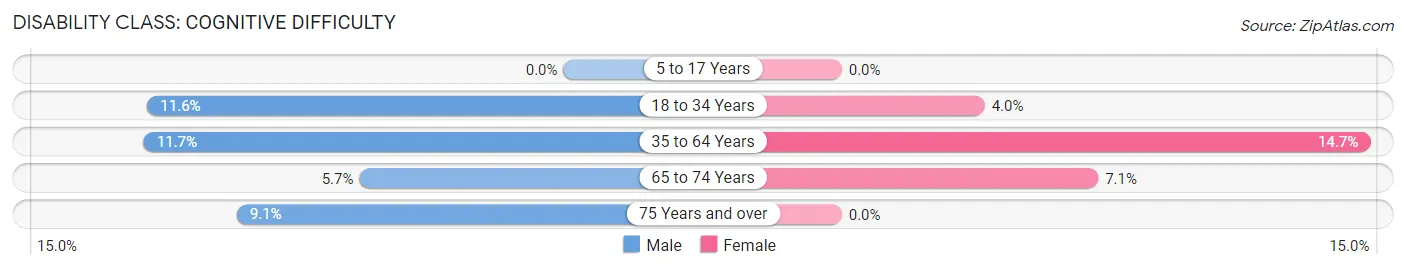
| Age Bracket | Male | Female |
| 5 to 17 Years | 0 (0.0%) | 0 (0.0%) |
| 18 to 34 Years | 52 (11.6%) | 22 (4.0%) |
| 35 to 64 Years | 85 (11.7%) | 168 (14.7%) |
| 65 to 74 Years | 18 (5.7%) | 14 (7.1%) |
| 75 Years and over | 10 (9.1%) | 0 (0.0%) |
Disability Class: Ambulatory Difficulty
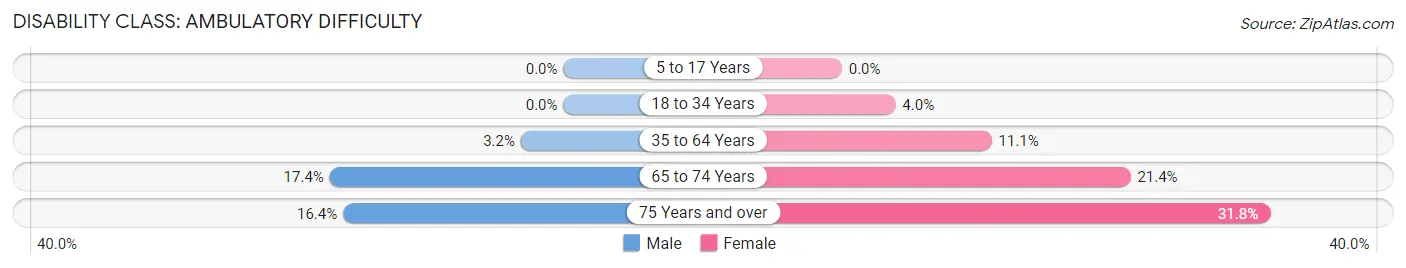
| Age Bracket | Male | Female |
| 5 to 17 Years | 0 (0.0%) | 0 (0.0%) |
| 18 to 34 Years | 0 (0.0%) | 22 (4.0%) |
| 35 to 64 Years | 23 (3.2%) | 127 (11.1%) |
| 65 to 74 Years | 55 (17.3%) | 42 (21.4%) |
| 75 Years and over | 18 (16.4%) | 48 (31.8%) |
Disability Class: Self-Care Difficulty
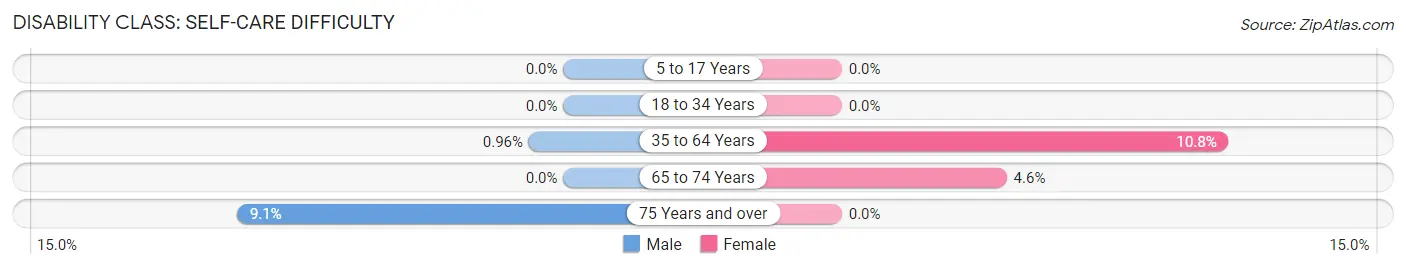
| Age Bracket | Male | Female |
| 5 to 17 Years | 0 (0.0%) | 0 (0.0%) |
| 18 to 34 Years | 0 (0.0%) | 0 (0.0%) |
| 35 to 64 Years | 7 (1.0%) | 123 (10.8%) |
| 65 to 74 Years | 0 (0.0%) | 9 (4.6%) |
| 75 Years and over | 10 (9.1%) | 0 (0.0%) |
Technology Access in Chester
Computing Device Access in Chester
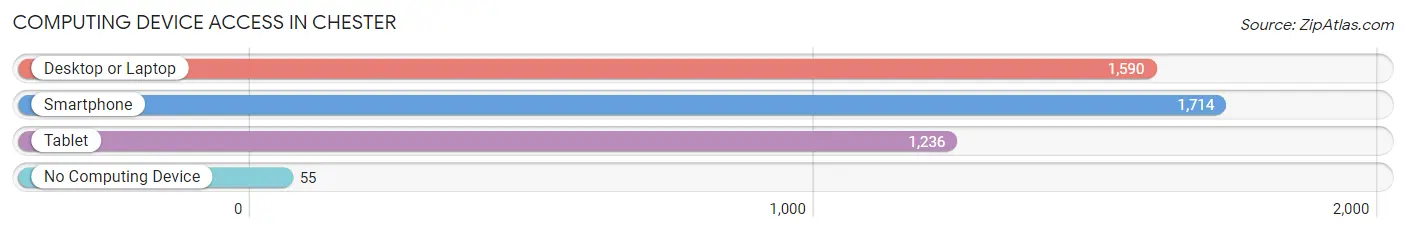
| Device Type | # Households | % Households |
| Desktop or Laptop | 1,590 | 84.5% |
| Smartphone | 1,714 | 91.1% |
| Tablet | 1,236 | 65.7% |
| No Computing Device | 55 | 2.9% |
| Total | 1,881 | 100.0% |
Internet Access in Chester
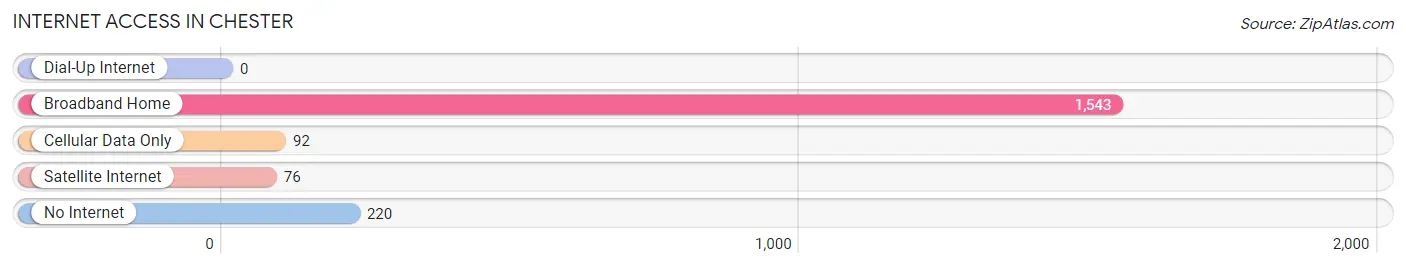
| Internet Type | # Households | % Households |
| Dial-Up Internet | 0 | 0.0% |
| Broadband Home | 1,543 | 82.0% |
| Cellular Data Only | 92 | 4.9% |
| Satellite Internet | 76 | 4.0% |
| No Internet | 220 | 11.7% |
| Total | 1,881 | 100.0% |
Chester Summary
Chester, Maryland is a small town located in Queen Anne’s County on the Eastern Shore of Maryland. It is situated on the Chester River, which is a tributary of the Chesapeake Bay. The town was founded in 1706 and has a population of approximately 1,500 people.
History
Chester was founded in 1706 by a group of English settlers who were granted a land patent from the Lord Proprietary of Maryland. The town was named after the nearby Chester River, which was named after the English city of Chester. The town was originally a farming community, but it soon developed into a bustling port town. The town was a major trading center for tobacco, grain, and other goods.
In the late 1700s, the town was a major stop on the Underground Railroad, with many slaves escaping to freedom in the North. During the Civil War, the town was occupied by Union forces and served as a supply depot. After the war, the town continued to grow and prosper.
Geography
Chester is located in Queen Anne’s County on the Eastern Shore of Maryland. It is situated on the Chester River, which is a tributary of the Chesapeake Bay. The town is located about 25 miles south of Annapolis and about 50 miles east of Washington, D.C. The town is surrounded by farmland and is bordered by the towns of Centreville, Grasonville, and Queenstown.
The town is located in a humid subtropical climate zone, with hot, humid summers and mild winters. The average annual temperature is around 60 degrees Fahrenheit. The town receives an average of 45 inches of precipitation per year, with most of it falling in the summer months.
Economy
The economy of Chester is largely based on agriculture and tourism. The town is home to several farms, which produce a variety of crops, including corn, soybeans, and wheat. The town is also home to several seafood processing plants, which process and package seafood for local restaurants and markets.
The town is also a popular tourist destination, with many visitors coming to enjoy the town’s historic sites, scenic views, and outdoor activities. The town is home to several marinas, which offer boat rentals and fishing charters. The town also has several restaurants, shops, and galleries.
Demographics
As of the 2010 census, the population of Chester was 1,500 people. The town is predominantly white, with about 90% of the population being white. The town also has a small African American population, with about 5% of the population being African American. The town also has a small Hispanic population, with about 2% of the population being Hispanic. The median household income in the town is around $50,000.
Common Questions
What is Per Capita Income in Chester?
Per Capita income in Chester is $57,878.
What is the Median Family Income in Chester?
Median Family Income in Chester is $114,250.
What is the Median Household income in Chester?
Median Household Income in Chester is $90,201.
What is Income or Wage Gap in Chester?
Income or Wage Gap in Chester is 56.7%.
Women in Chester earn 43.3 cents for every dollar earned by a man.
What is Inequality or Gini Index in Chester?
Inequality or Gini Index in Chester is 0.49.
What is the Total Population of Chester?
Total Population of Chester is 4,456.
What is the Total Male Population of Chester?
Total Male Population of Chester is 2,096.
What is the Total Female Population of Chester?
Total Female Population of Chester is 2,360.
What is the Ratio of Males per 100 Females in Chester?
There are 88.81 Males per 100 Females in Chester.
What is the Ratio of Females per 100 Males in Chester?
There are 112.60 Females per 100 Males in Chester.
What is the Median Population Age in Chester?
Median Population Age in Chester is 43.8 Years.
What is the Average Family Size in Chester
Average Family Size in Chester is 2.9 People.
What is the Average Household Size in Chester
Average Household Size in Chester is 2.4 People.
How Large is the Labor Force in Chester?
There are 2,459 People in the Labor Forcein in Chester.
What is the Percentage of People in the Labor Force in Chester?
66.6% of People are in the Labor Force in Chester.
What is the Unemployment Rate in Chester?
Unemployment Rate in Chester is 2.4%.