Hawi, HI Map & Demographics
Hawi Map
Hawi Overview
$36,445
PER CAPITA INCOME
$74,828
AVG FAMILY INCOME
$77,589
AVG HOUSEHOLD INCOME
20.1%
WAGE / INCOME GAP [ % ]
79.9¢/ $1
WAGE / INCOME GAP [ $ ]
$6,130
FAMILY INCOME DEFICIT
0.37
INEQUALITY / GINI INDEX
1,383
TOTAL POPULATION
593
MALE POPULATION
790
FEMALE POPULATION
75.06
MALES / 100 FEMALES
133.22
FEMALES / 100 MALES
44.0
MEDIAN AGE
3.5
AVG FAMILY SIZE
3.0
AVG HOUSEHOLD SIZE
710
LABOR FORCE [ PEOPLE ]
63.1%
PERCENT IN LABOR FORCE
13.7%
UNEMPLOYMENT RATE
Hawi Zip Codes
Hawi Area Codes
Income in Hawi
Income Overview in Hawi
Per Capita Income in Hawi is $36,445, while median incomes of families and households are $74,828 and $77,589 respectively.
| Characteristic | Number | Measure |
| Per Capita Income | 1,383 | $36,445 |
| Median Family Income | 304 | $74,828 |
| Mean Family Income | 304 | $96,371 |
| Median Household Income | 455 | $77,589 |
| Mean Household Income | 455 | $103,329 |
| Income Deficit | 304 | $6,130 |
| Wage / Income Gap (%) | 1,383 | 20.14% |
| Wage / Income Gap ($) | 1,383 | 79.86¢ per $1 |
| Gini / Inequality Index | 1,383 | 0.37 |
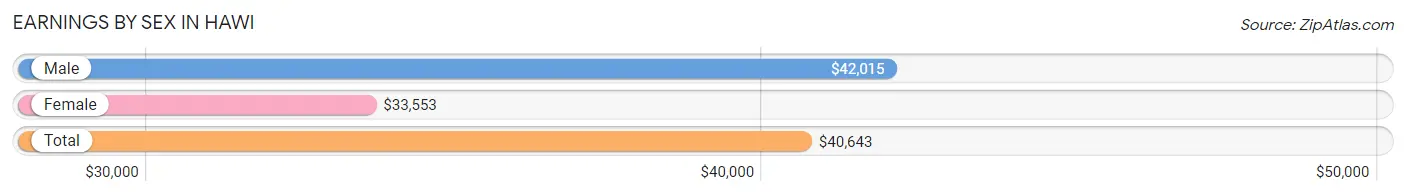
Earnings by Sex in Hawi
Average Earnings in Hawi are $40,643, $42,015 for men and $33,553 for women, a difference of 20.1%.
| Sex | Number | Average Earnings |
| Male | 345 (47.6%) | $42,015 |
| Female | 380 (52.4%) | $33,553 |
| Total | 725 (100.0%) | $40,643 |
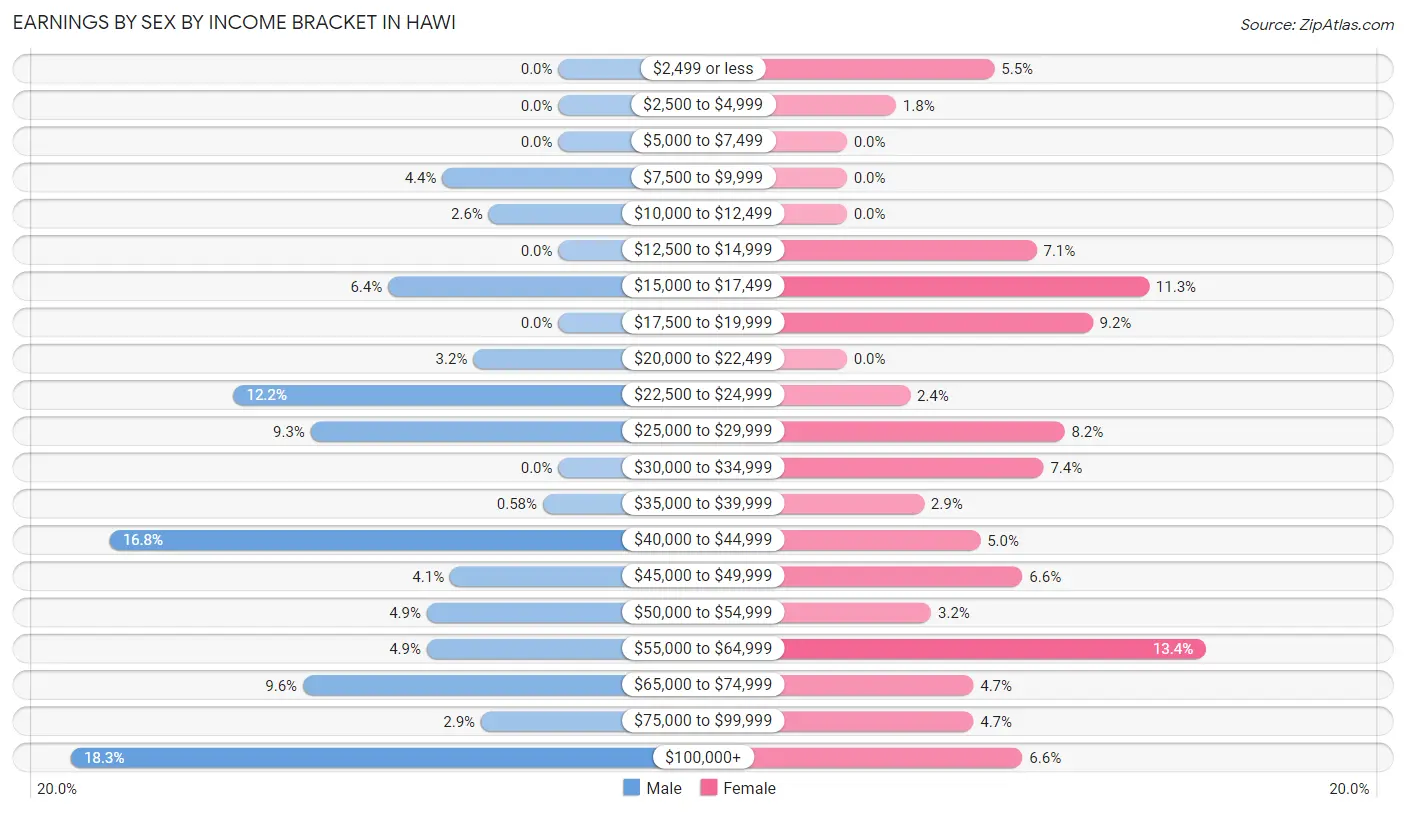
Earnings by Sex by Income Bracket in Hawi
The most common earnings brackets in Hawi are $100,000+ for men (63 | 18.3%) and $55,000 to $64,999 for women (51 | 13.4%).
| Income | Male | Female |
| $2,499 or less | 0 (0.0%) | 21 (5.5%) |
| $2,500 to $4,999 | 0 (0.0%) | 7 (1.8%) |
| $5,000 to $7,499 | 0 (0.0%) | 0 (0.0%) |
| $7,500 to $9,999 | 15 (4.3%) | 0 (0.0%) |
| $10,000 to $12,499 | 9 (2.6%) | 0 (0.0%) |
| $12,500 to $14,999 | 0 (0.0%) | 27 (7.1%) |
| $15,000 to $17,499 | 22 (6.4%) | 43 (11.3%) |
| $17,500 to $19,999 | 0 (0.0%) | 35 (9.2%) |
| $20,000 to $22,499 | 11 (3.2%) | 0 (0.0%) |
| $22,500 to $24,999 | 42 (12.2%) | 9 (2.4%) |
| $25,000 to $29,999 | 32 (9.3%) | 31 (8.2%) |
| $30,000 to $34,999 | 0 (0.0%) | 28 (7.4%) |
| $35,000 to $39,999 | 2 (0.6%) | 11 (2.9%) |
| $40,000 to $44,999 | 58 (16.8%) | 19 (5.0%) |
| $45,000 to $49,999 | 14 (4.1%) | 25 (6.6%) |
| $50,000 to $54,999 | 17 (4.9%) | 12 (3.2%) |
| $55,000 to $64,999 | 17 (4.9%) | 51 (13.4%) |
| $65,000 to $74,999 | 33 (9.6%) | 18 (4.7%) |
| $75,000 to $99,999 | 10 (2.9%) | 18 (4.7%) |
| $100,000+ | 63 (18.3%) | 25 (6.6%) |
| Total | 345 (100.0%) | 380 (100.0%) |
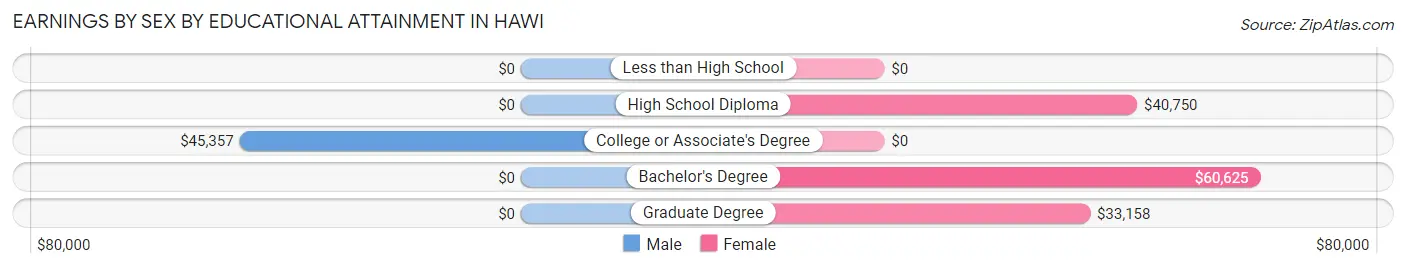
Earnings by Sex by Educational Attainment in Hawi
Average earnings in Hawi are $45,000 for men and $38,750 for women, a difference of 13.9%. Men with an educational attainment of college or associate's degree enjoy the highest average annual earnings of $45,357, while those with college or associate's degree education earn the least with $45,357. Women with an educational attainment of bachelor's degree earn the most with the average annual earnings of $60,625, while those with graduate degree education have the smallest earnings of $33,158.
| Educational Attainment | Male Income | Female Income |
| Less than High School | - | - |
| High School Diploma | - | - |
| College or Associate's Degree | $45,357 | $0 |
| Bachelor's Degree | - | - |
| Graduate Degree | - | - |
| Total | $45,000 | $38,750 |
Family Income in Hawi
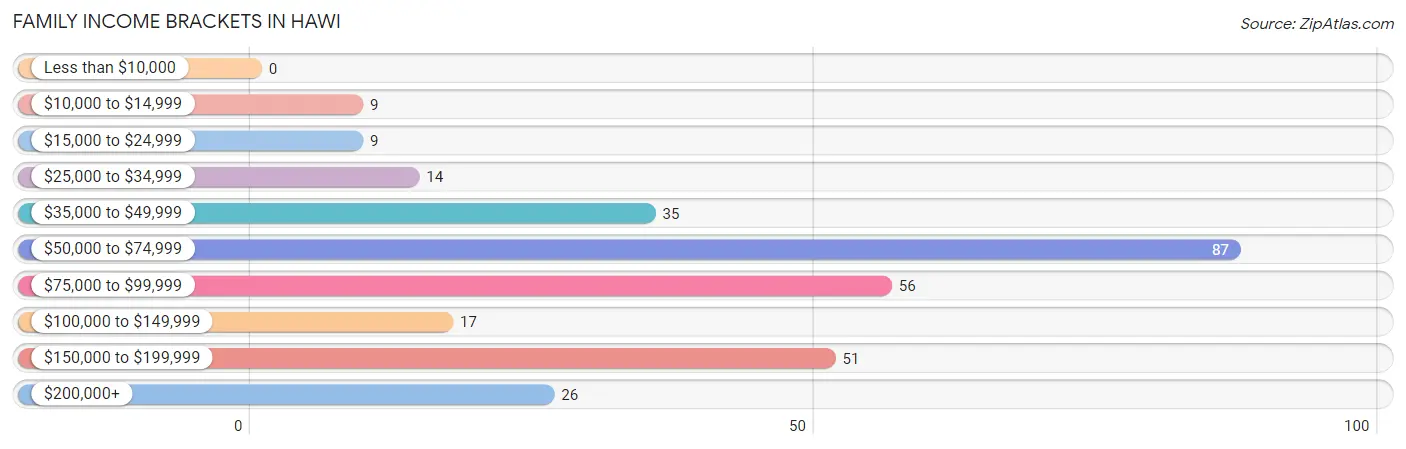
Family Income Brackets in Hawi
According to the Hawi family income data, there are 87 families falling into the $50,000 to $74,999 income range, which is the most common income bracket and makes up 28.6% of all families.
| Income Bracket | # Families | % Families |
| Less than $10,000 | 0 | 0.0% |
| $10,000 to $14,999 | 9 | 3.0% |
| $15,000 to $24,999 | 9 | 3.0% |
| $25,000 to $34,999 | 14 | 4.6% |
| $35,000 to $49,999 | 35 | 11.5% |
| $50,000 to $74,999 | 87 | 28.6% |
| $75,000 to $99,999 | 56 | 18.4% |
| $100,000 to $149,999 | 17 | 5.6% |
| $150,000 to $199,999 | 51 | 16.8% |
| $200,000+ | 26 | 8.6% |
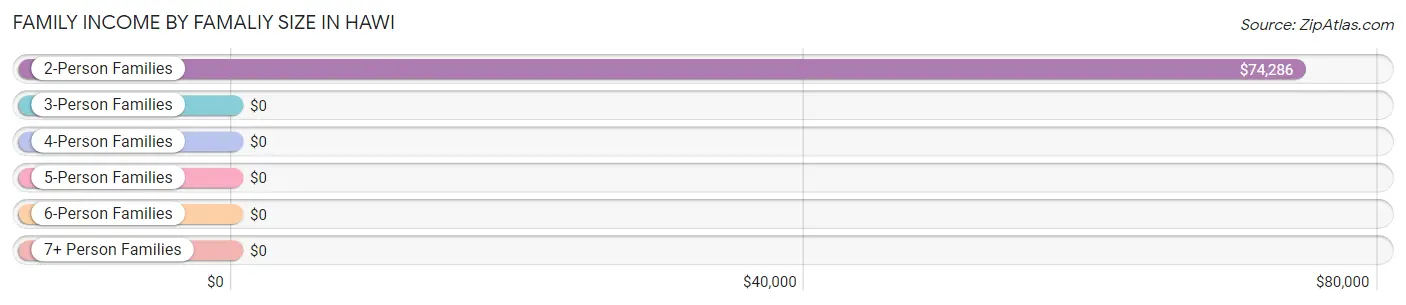
Family Income by Famaliy Size in Hawi
2-person families (166 | 54.6%) account for the highest median family income in Hawi with $74,286 per family, while 2-person families (166 | 54.6%) have the highest median income of $37,143 per family member.
| Income Bracket | # Families | Median Income |
| 2-Person Families | 166 (54.6%) | $74,286 |
| 3-Person Families | 91 (29.9%) | $0 |
| 4-Person Families | 21 (6.9%) | $0 |
| 5-Person Families | 17 (5.6%) | $0 |
| 6-Person Families | 0 (0.0%) | $0 |
| 7+ Person Families | 9 (3.0%) | $0 |
| Total | 304 (100.0%) | $74,828 |
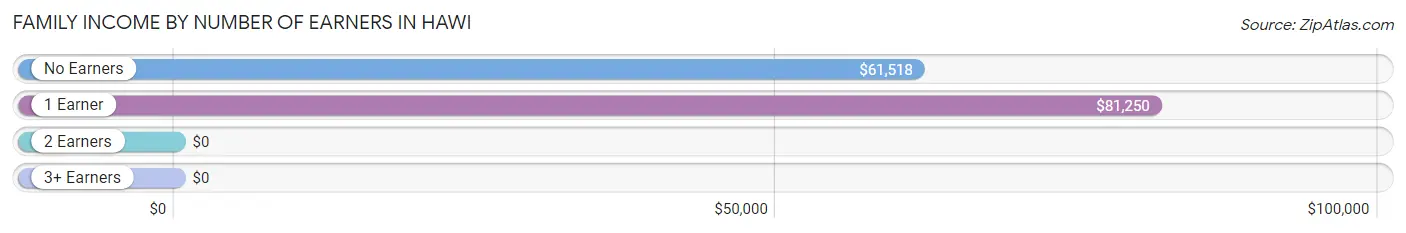
Family Income by Number of Earners in Hawi
| Number of Earners | # Families | Median Income |
| No Earners | 63 (20.7%) | $61,518 |
| 1 Earner | 114 (37.5%) | $81,250 |
| 2 Earners | 108 (35.5%) | $0 |
| 3+ Earners | 19 (6.2%) | $0 |
| Total | 304 (100.0%) | $74,828 |
Household Income in Hawi
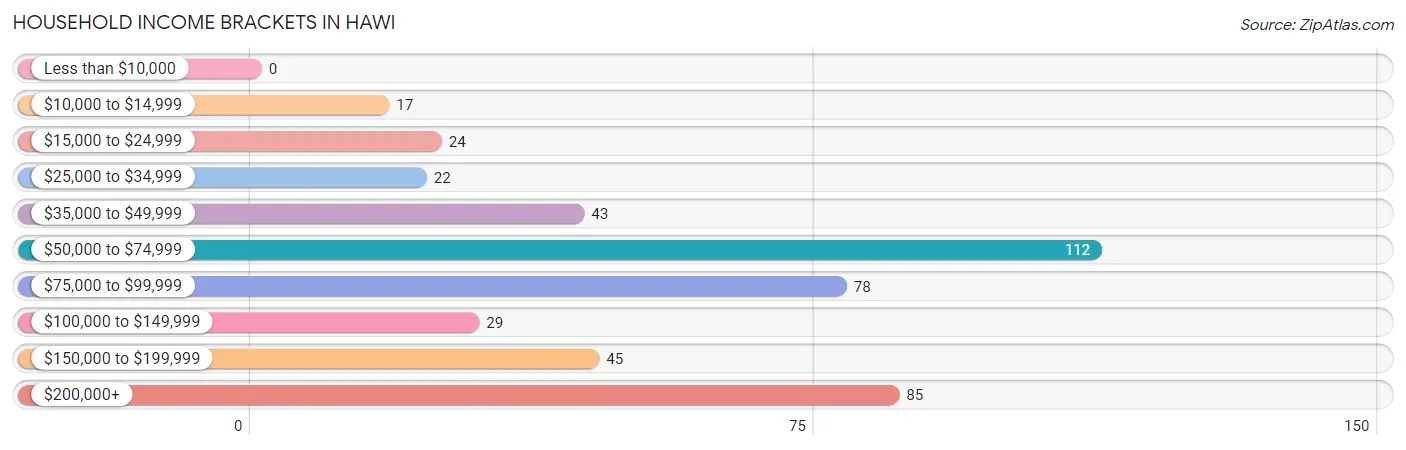
Household Income Brackets in Hawi
With 112 households falling in the category, the $50,000 to $74,999 income range is the most frequent in Hawi, accounting for 24.6% of all households.
| Income Bracket | # Households | % Households |
| Less than $10,000 | 0 | 0.0% |
| $10,000 to $14,999 | 17 | 3.7% |
| $15,000 to $24,999 | 24 | 5.3% |
| $25,000 to $34,999 | 22 | 4.8% |
| $35,000 to $49,999 | 43 | 9.5% |
| $50,000 to $74,999 | 112 | 24.6% |
| $75,000 to $99,999 | 78 | 17.1% |
| $100,000 to $149,999 | 29 | 6.4% |
| $150,000 to $199,999 | 45 | 9.9% |
| $200,000+ | 85 | 18.7% |
Household Income by Householder Age in Hawi
The median household income in Hawi is $77,589, with the highest median household income of $132,727 found in the 25 to 44 years age bracket for the primary householder. A total of 82 households (18.0%) fall into this category. Meanwhile, the 15 to 24 years age bracket for the primary householder has the lowest median household income of $0, with 9 households (2.0%) in this group.
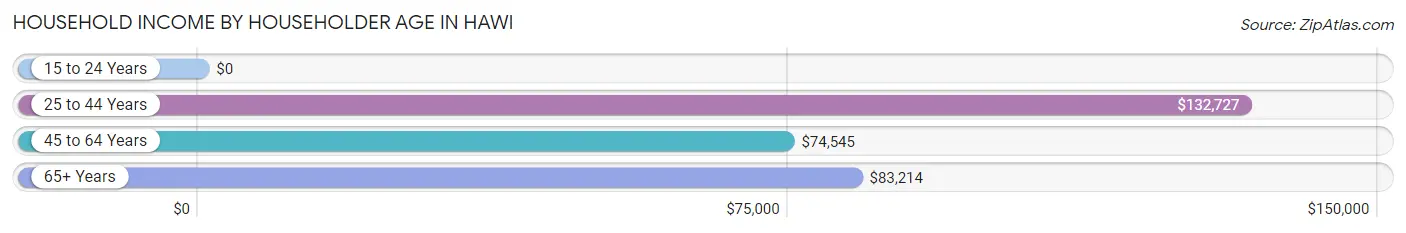
| Income Bracket | # Households | Median Income |
| 15 to 24 Years | 9 (2.0%) | $0 |
| 25 to 44 Years | 82 (18.0%) | $132,727 |
| 45 to 64 Years | 128 (28.1%) | $74,545 |
| 65+ Years | 236 (51.9%) | $83,214 |
| Total | 455 (100.0%) | $77,589 |
Poverty in Hawi
Income Below Poverty by Sex and Age in Hawi
With 15.3% poverty level for males and 17.5% for females among the residents of Hawi, under 5 year old males and 12 to 14 year old females are the most vulnerable to poverty, with 20 males (100.0%) and 79 females (100.0%) in their respective age groups living below the poverty level.
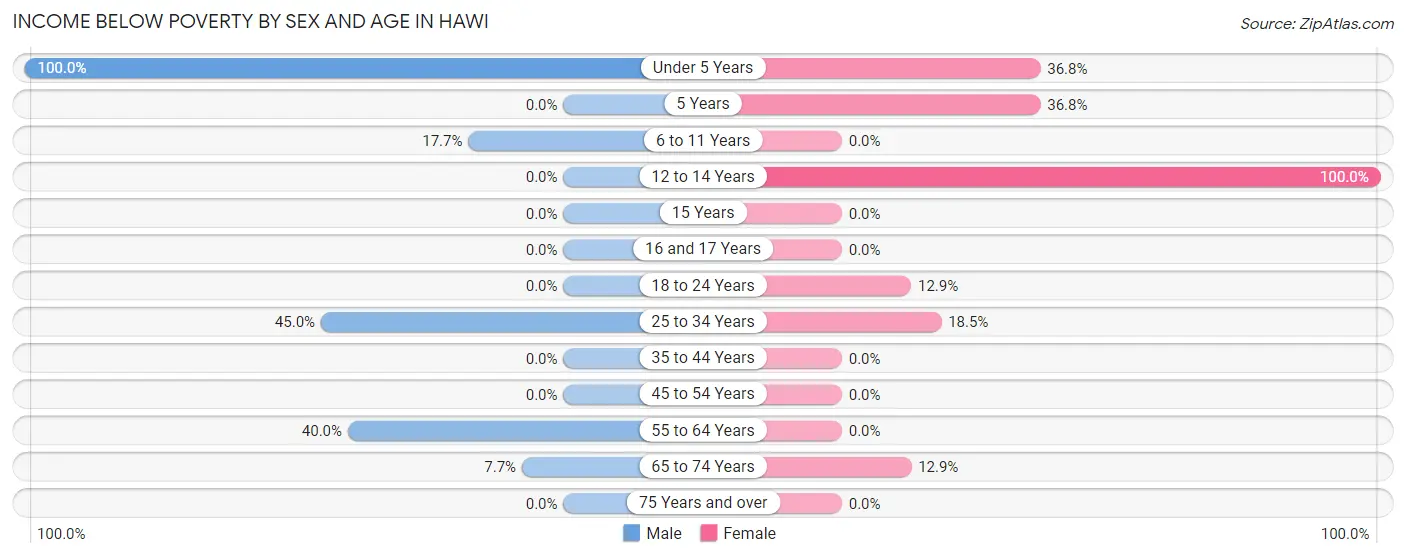
| Age Bracket | Male | Female |
| Under 5 Years | 20 (100.0%) | 7 (36.8%) |
| 5 Years | 0 (0.0%) | 7 (36.8%) |
| 6 to 11 Years | 9 (17.6%) | 0 (0.0%) |
| 12 to 14 Years | 0 (0.0%) | 79 (100.0%) |
| 15 Years | 0 (0.0%) | 0 (0.0%) |
| 16 and 17 Years | 0 (0.0%) | 0 (0.0%) |
| 18 to 24 Years | 0 (0.0%) | 9 (12.9%) |
| 25 to 34 Years | 36 (45.0%) | 19 (18.4%) |
| 35 to 44 Years | 0 (0.0%) | 0 (0.0%) |
| 45 to 54 Years | 0 (0.0%) | 0 (0.0%) |
| 55 to 64 Years | 18 (40.0%) | 0 (0.0%) |
| 65 to 74 Years | 8 (7.7%) | 17 (12.9%) |
| 75 Years and over | 0 (0.0%) | 0 (0.0%) |
| Total | 91 (15.3%) | 138 (17.5%) |
Income Above Poverty by Sex and Age in Hawi
According to the poverty statistics in Hawi, males aged 16 and 17 years and females aged 6 to 11 years are the age groups that are most secure financially, with 100.0% of males and 100.0% of females in these age groups living above the poverty line.
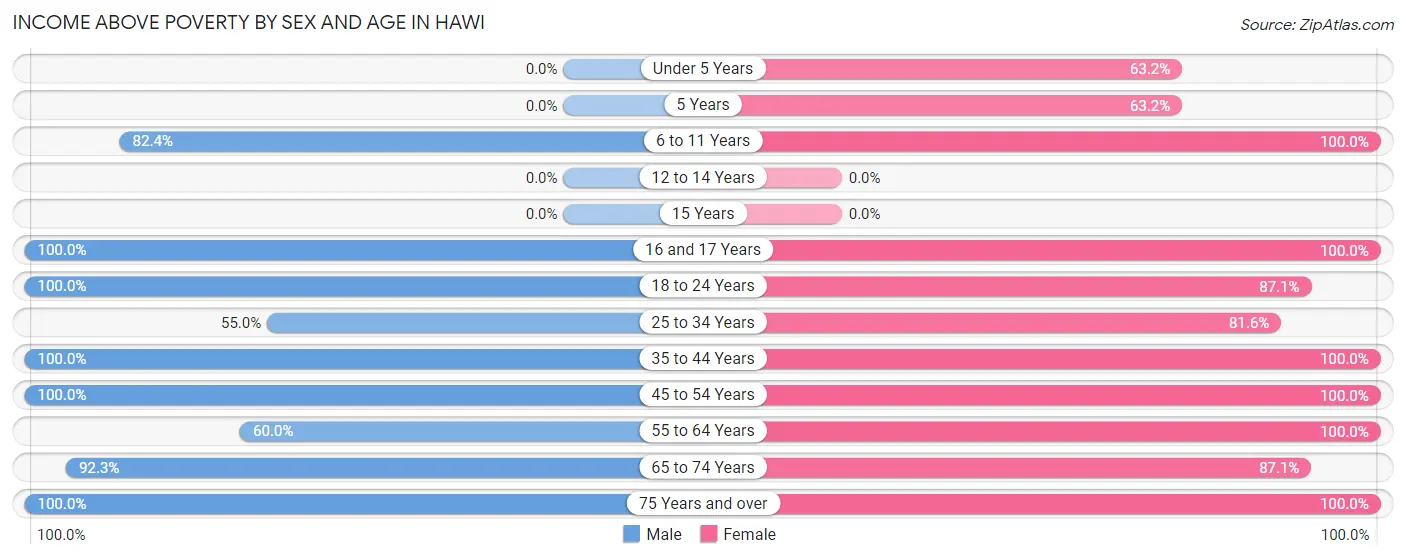
| Age Bracket | Male | Female |
| Under 5 Years | 0 (0.0%) | 12 (63.2%) |
| 5 Years | 0 (0.0%) | 12 (63.2%) |
| 6 to 11 Years | 42 (82.4%) | 70 (100.0%) |
| 12 to 14 Years | 0 (0.0%) | 0 (0.0%) |
| 15 Years | 0 (0.0%) | 0 (0.0%) |
| 16 and 17 Years | 9 (100.0%) | 13 (100.0%) |
| 18 to 24 Years | 37 (100.0%) | 61 (87.1%) |
| 25 to 34 Years | 44 (55.0%) | 84 (81.6%) |
| 35 to 44 Years | 78 (100.0%) | 81 (100.0%) |
| 45 to 54 Years | 77 (100.0%) | 80 (100.0%) |
| 55 to 64 Years | 27 (60.0%) | 40 (100.0%) |
| 65 to 74 Years | 96 (92.3%) | 115 (87.1%) |
| 75 Years and over | 92 (100.0%) | 84 (100.0%) |
| Total | 502 (84.7%) | 652 (82.5%) |
Income Below Poverty Among Married-Couple Families in Hawi
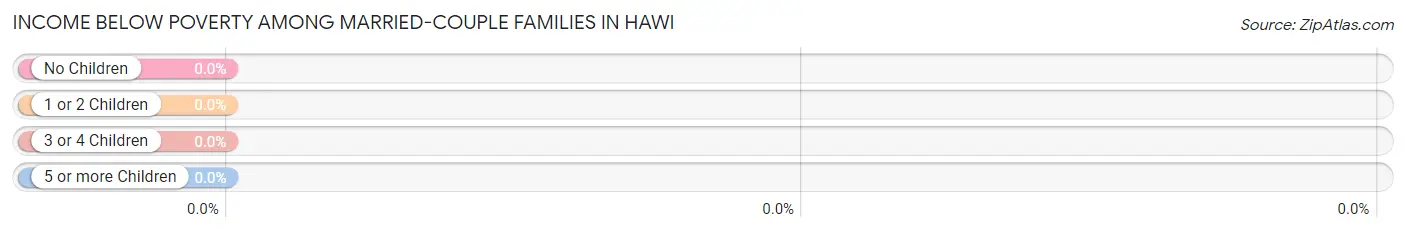
| Children | Above Poverty | Below Poverty |
| No Children | 122 (100.0%) | 0 (0.0%) |
| 1 or 2 Children | 49 (100.0%) | 0 (0.0%) |
| 3 or 4 Children | 9 (100.0%) | 0 (0.0%) |
| 5 or more Children | 0 (0.0%) | 0 (0.0%) |
| Total | 180 (100.0%) | 0 (0.0%) |
Income Below Poverty Among Single-Parent Households in Hawi
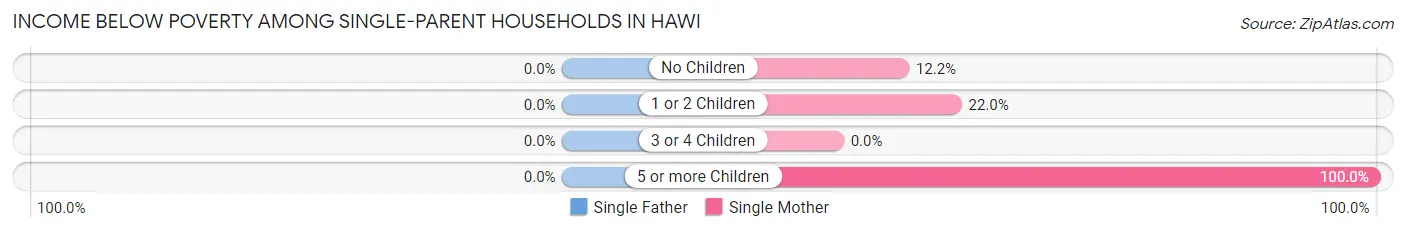
| Children | Single Father | Single Mother |
| No Children | 0 (0.0%) | 9 (12.2%) |
| 1 or 2 Children | 0 (0.0%) | 9 (22.0%) |
| 3 or 4 Children | 0 (0.0%) | 0 (0.0%) |
| 5 or more Children | 0 (0.0%) | 9 (100.0%) |
| Total | 0 (0.0%) | 27 (21.8%) |
Income Below Poverty Among Married-Couple vs Single-Parent Households in Hawi
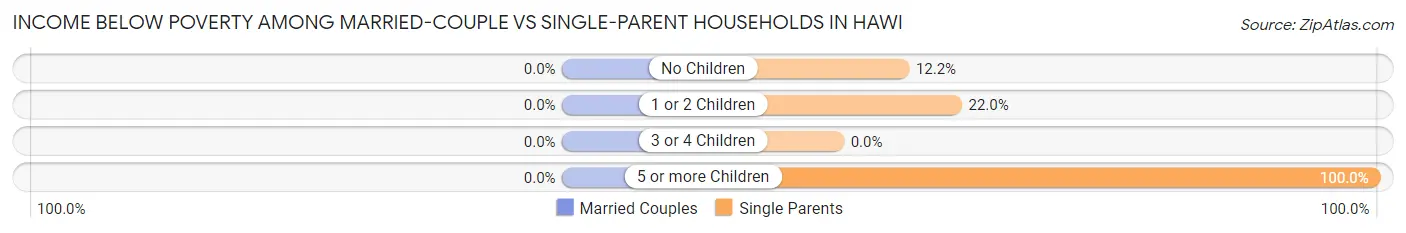
| Children | Married-Couple Families | Single-Parent Households |
| No Children | 0 (0.0%) | 9 (12.2%) |
| 1 or 2 Children | 0 (0.0%) | 9 (22.0%) |
| 3 or 4 Children | 0 (0.0%) | 0 (0.0%) |
| 5 or more Children | 0 (0.0%) | 9 (100.0%) |
| Total | 0 (0.0%) | 27 (21.8%) |
Race in Hawi
The most populous races in Hawi are White / Caucasian (492 | 35.6%), Two or more Races (463 | 33.5%), and Hawaiian / Pacific (229 | 16.6%).
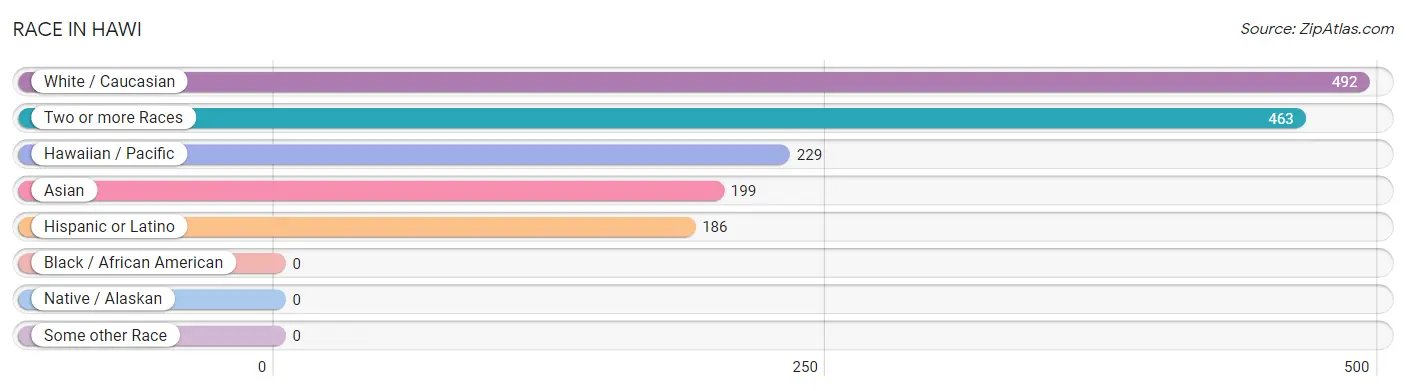
| Race | # Population | % Population |
| Asian | 199 | 14.4% |
| Black / African American | 0 | 0.0% |
| Hawaiian / Pacific | 229 | 16.6% |
| Hispanic or Latino | 186 | 13.5% |
| Native / Alaskan | 0 | 0.0% |
| White / Caucasian | 492 | 35.6% |
| Two or more Races | 463 | 33.5% |
| Some other Race | 0 | 0.0% |
| Total | 1,383 | 100.0% |
Ancestry in Hawi
The most populous ancestries reported in Hawi are Native Hawaiian (447 | 32.3%), Bhutanese (283 | 20.5%), European (177 | 12.8%), Korean (156 | 11.3%), and Portuguese (134 | 9.7%), together accounting for 86.6% of all Hawi residents.
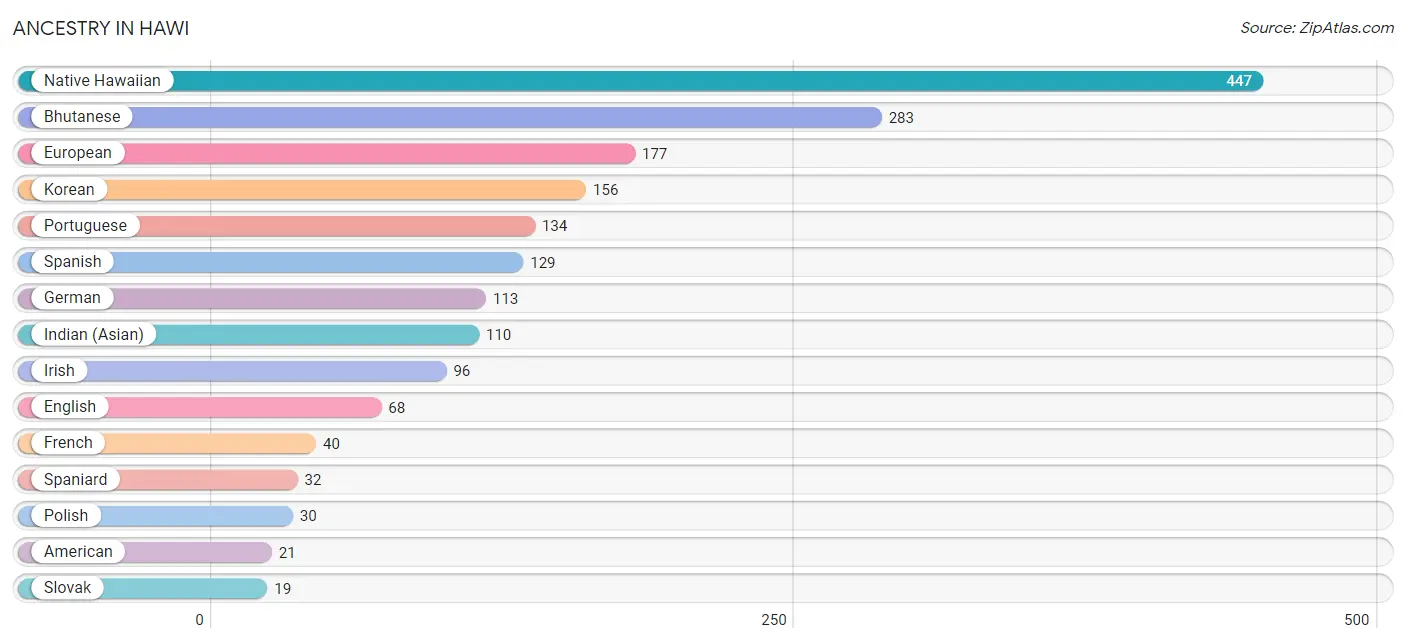
| Ancestry | # Population | % Population |
| American | 21 | 1.5% |
| Bhutanese | 283 | 20.5% |
| British | 7 | 0.5% |
| Burmese | 9 | 0.6% |
| Central American Indian | 10 | 0.7% |
| Chinese | 15 | 1.1% |
| English | 68 | 4.9% |
| European | 177 | 12.8% |
| French | 40 | 2.9% |
| French Canadian | 16 | 1.2% |
| German | 113 | 8.2% |
| Hungarian | 12 | 0.9% |
| Indian (Asian) | 110 | 8.0% |
| Irish | 96 | 6.9% |
| Korean | 156 | 11.3% |
| Mexican | 15 | 1.1% |
| Native Hawaiian | 447 | 32.3% |
| Norwegian | 9 | 0.6% |
| Polish | 30 | 2.2% |
| Portuguese | 134 | 9.7% |
| Puerto Rican | 10 | 0.7% |
| Russian | 15 | 1.1% |
| Slovak | 19 | 1.4% |
| Spaniard | 32 | 2.3% |
| Spanish | 129 | 9.3% |
| Thai | 10 | 0.7% |
| Welsh | 9 | 0.6% | View All 27 Rows |
Immigrants in Hawi
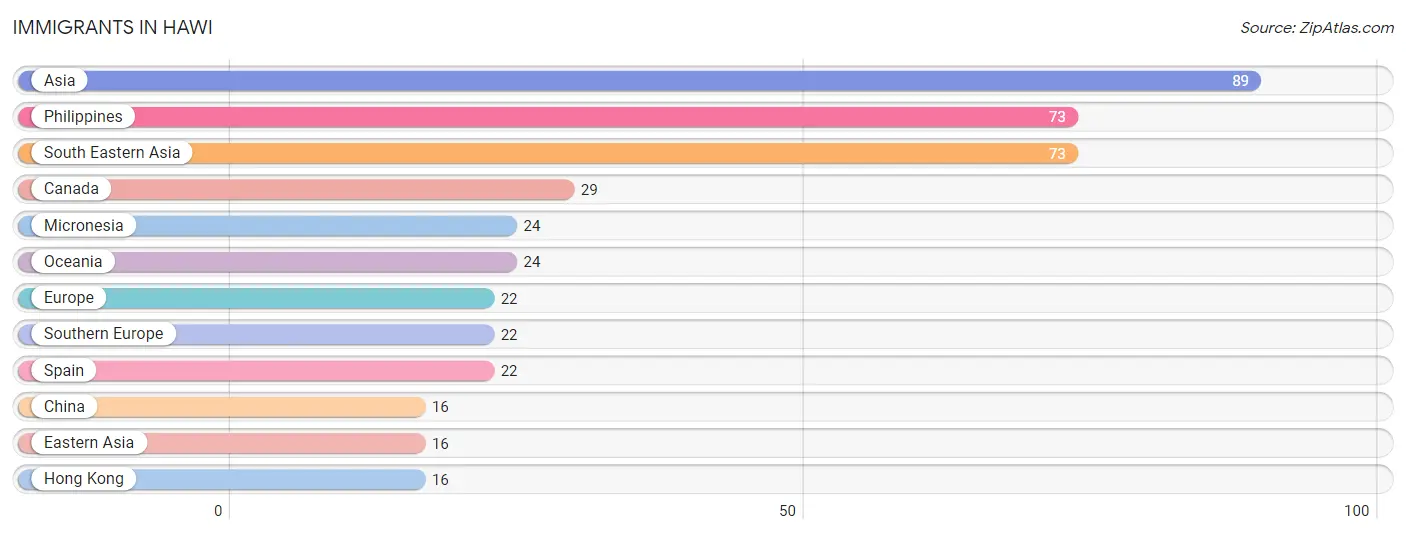
The most numerous immigrant groups reported in Hawi came from Asia (89 | 6.4%), Philippines (73 | 5.3%), South Eastern Asia (73 | 5.3%), Canada (29 | 2.1%), and Micronesia (24 | 1.7%), together accounting for 20.8% of all Hawi residents.
| Immigration Origin | # Population | % Population |
| Asia | 89 | 6.4% |
| Canada | 29 | 2.1% |
| China | 16 | 1.2% |
| Eastern Asia | 16 | 1.2% |
| Europe | 22 | 1.6% |
| Hong Kong | 16 | 1.2% |
| Micronesia | 24 | 1.7% |
| Oceania | 24 | 1.7% |
| Philippines | 73 | 5.3% |
| South Eastern Asia | 73 | 5.3% |
| Southern Europe | 22 | 1.6% |
| Spain | 22 | 1.6% | View All 12 Rows |
Sex and Age in Hawi
Sex and Age in Hawi
The most populous age groups in Hawi are 65 to 69 Years (71 | 12.0%) for men and 10 to 14 Years (89 | 11.3%) for women.
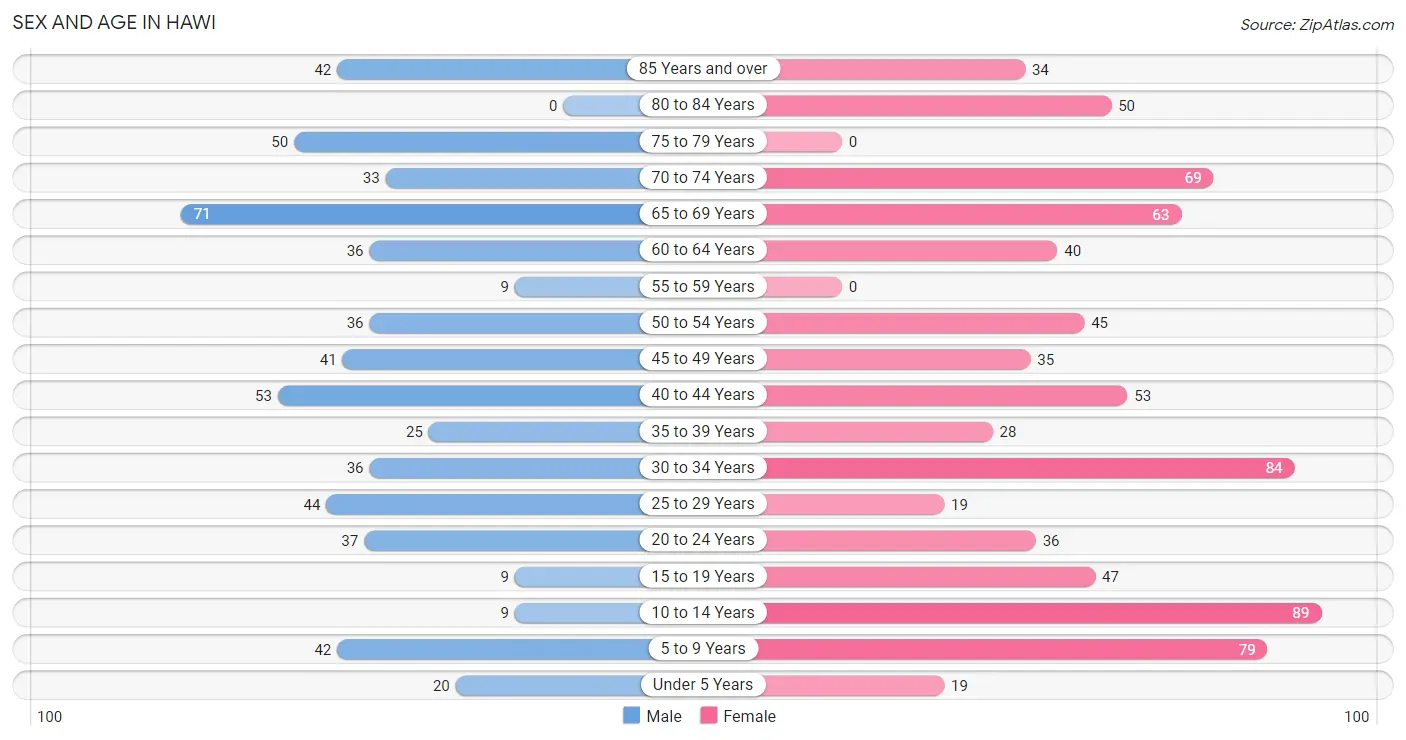
| Age Bracket | Male | Female |
| Under 5 Years | 20 (3.4%) | 19 (2.4%) |
| 5 to 9 Years | 42 (7.1%) | 79 (10.0%) |
| 10 to 14 Years | 9 (1.5%) | 89 (11.3%) |
| 15 to 19 Years | 9 (1.5%) | 47 (5.9%) |
| 20 to 24 Years | 37 (6.2%) | 36 (4.6%) |
| 25 to 29 Years | 44 (7.4%) | 19 (2.4%) |
| 30 to 34 Years | 36 (6.1%) | 84 (10.6%) |
| 35 to 39 Years | 25 (4.2%) | 28 (3.5%) |
| 40 to 44 Years | 53 (8.9%) | 53 (6.7%) |
| 45 to 49 Years | 41 (6.9%) | 35 (4.4%) |
| 50 to 54 Years | 36 (6.1%) | 45 (5.7%) |
| 55 to 59 Years | 9 (1.5%) | 0 (0.0%) |
| 60 to 64 Years | 36 (6.1%) | 40 (5.1%) |
| 65 to 69 Years | 71 (12.0%) | 63 (8.0%) |
| 70 to 74 Years | 33 (5.6%) | 69 (8.7%) |
| 75 to 79 Years | 50 (8.4%) | 0 (0.0%) |
| 80 to 84 Years | 0 (0.0%) | 50 (6.3%) |
| 85 Years and over | 42 (7.1%) | 34 (4.3%) |
| Total | 593 (100.0%) | 790 (100.0%) |
Families and Households in Hawi
Median Family Size in Hawi
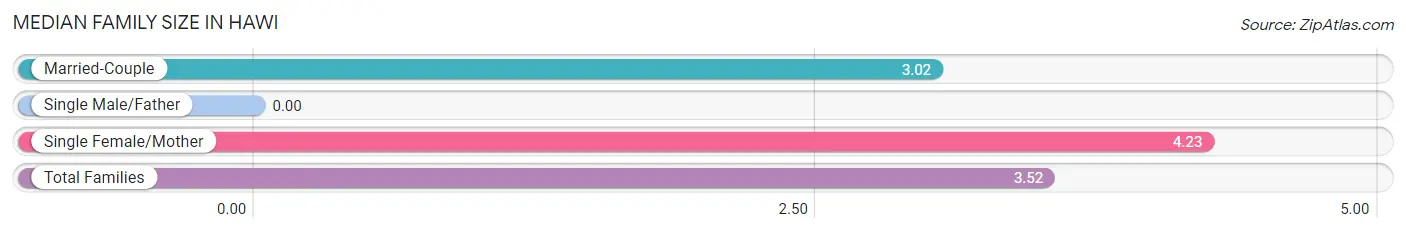
| Family Type | # Families | Family Size |
| Married-Couple | 180 (59.2%) | 3.02 |
| Single Male/Father | 0 (0.0%) | - |
| Single Female/Mother | 124 (40.8%) | 4.23 |
| Total Families | 304 (100.0%) | 3.52 |
Median Household Size in Hawi
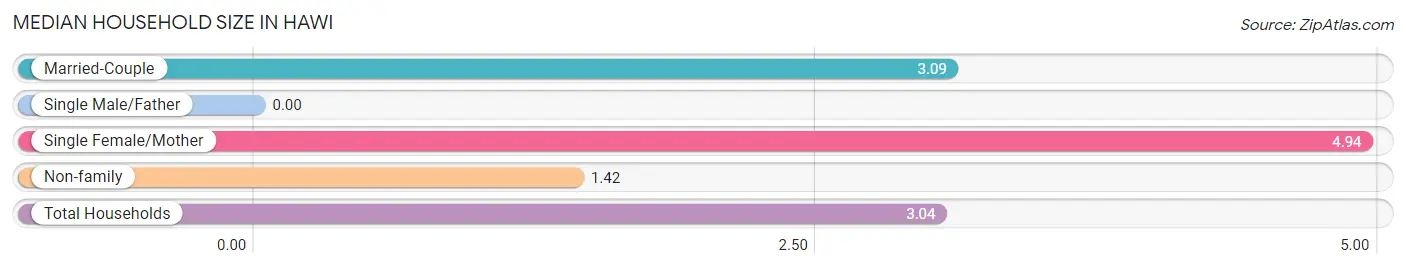
| Household Type | # Households | Household Size |
| Married-Couple | 180 (39.6%) | 3.09 |
| Single Male/Father | 0 (0.0%) | - |
| Single Female/Mother | 124 (27.3%) | 4.94 |
| Non-family | 151 (33.2%) | 1.42 |
| Total Households | 455 (100.0%) | 3.04 |
Household Size by Marriage Status in Hawi
Out of a total of 455 households in Hawi, 304 (66.8%) are family households, while 151 (33.2%) are nonfamily households. The most numerous type of family households are 2-person households, comprising 147, and the most common type of nonfamily households are 2-person households, comprising 79.
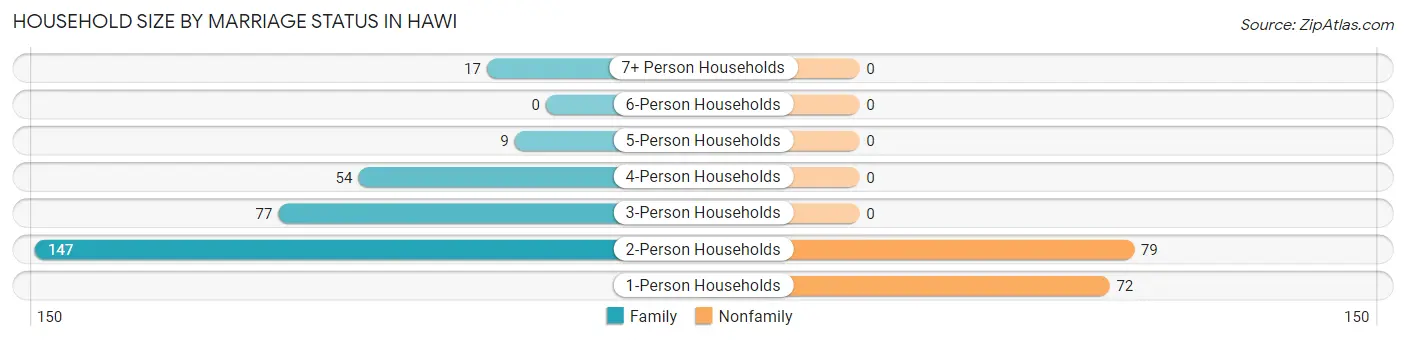
| Household Size | Family Households | Nonfamily Households |
| 1-Person Households | - | 72 (15.8%) |
| 2-Person Households | 147 (32.3%) | 79 (17.4%) |
| 3-Person Households | 77 (16.9%) | 0 (0.0%) |
| 4-Person Households | 54 (11.9%) | 0 (0.0%) |
| 5-Person Households | 9 (2.0%) | 0 (0.0%) |
| 6-Person Households | 0 (0.0%) | 0 (0.0%) |
| 7+ Person Households | 17 (3.7%) | 0 (0.0%) |
| Total | 304 (66.8%) | 151 (33.2%) |
Female Fertility in Hawi
Fertility by Age in Hawi
Average fertility rate in Hawi is 22.0 births per 1,000 women. Women in the age bracket of 35 to 50 years have the highest fertility rate with 53.0 births per 1,000 women. Women in the age bracket of 35 to 50 years acount for 100.0% of all women with births.
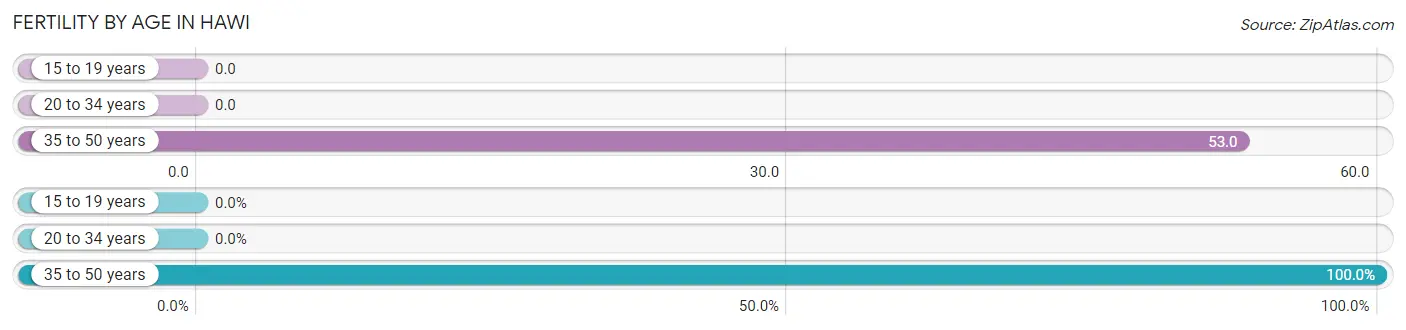
| Age Bracket | Women with Births | Births / 1,000 Women |
| 15 to 19 years | 0 (0.0%) | 0.0 |
| 20 to 34 years | 0 (0.0%) | 0.0 |
| 35 to 50 years | 7 (100.0%) | 53.0 |
| Total | 7 (100.0%) | 22.0 |
Fertility by Age by Marriage Status in Hawi
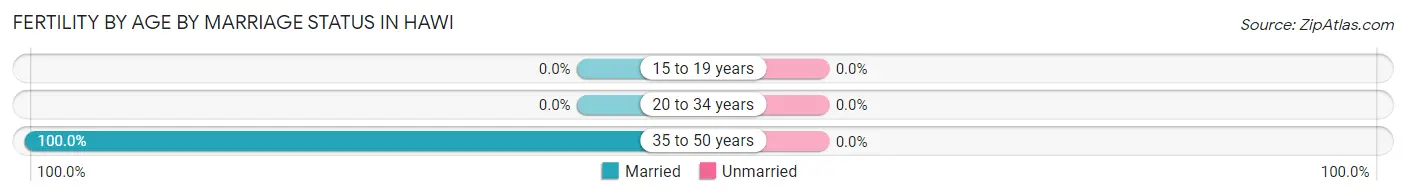
| Age Bracket | Married | Unmarried |
| 15 to 19 years | 0 (0.0%) | 0 (0.0%) |
| 20 to 34 years | 0 (0.0%) | 0 (0.0%) |
| 35 to 50 years | 7 (100.0%) | 0 (0.0%) |
| Total | 7 (100.0%) | 0 (0.0%) |
Fertility by Education in Hawi
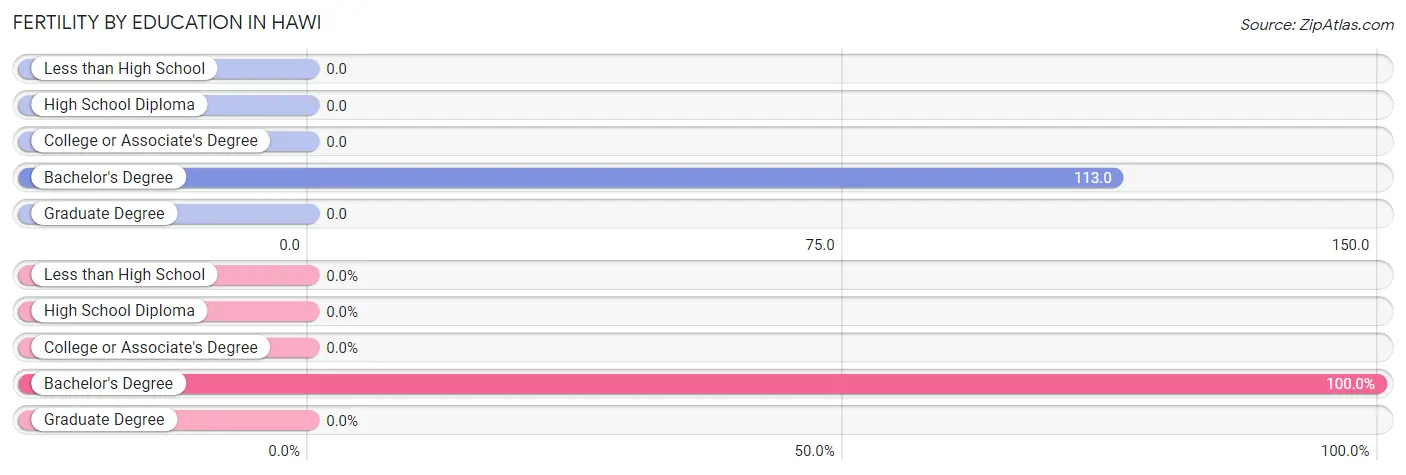
| Educational Attainment | Women with Births | Births / 1,000 Women |
| Less than High School | 0 (0.0%) | 0.0 |
| High School Diploma | 0 (0.0%) | 0.0 |
| College or Associate's Degree | 0 (0.0%) | 0.0 |
| Bachelor's Degree | 7 (100.0%) | 113.0 |
| Graduate Degree | 0 (0.0%) | 0.0 |
| Total | 7 (100.0%) | 22.0 |
Fertility by Education by Marriage Status in Hawi
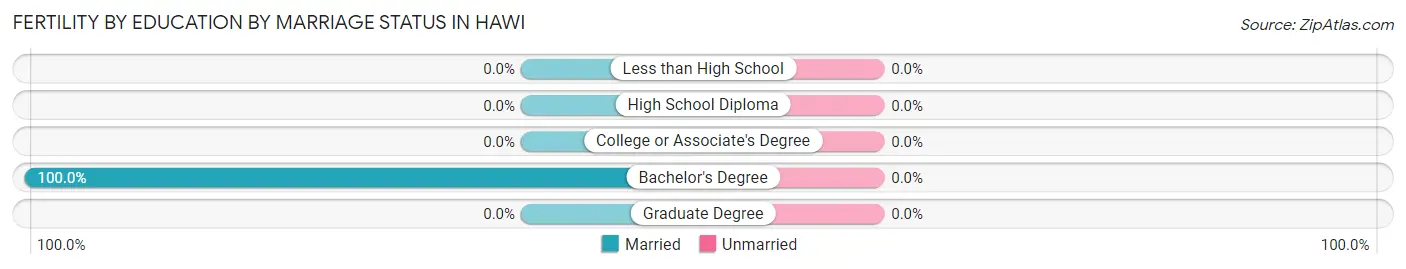
| Educational Attainment | Married | Unmarried |
| Less than High School | 0 (0.0%) | 0 (0.0%) |
| High School Diploma | 0 (0.0%) | 0 (0.0%) |
| College or Associate's Degree | 0 (0.0%) | 0 (0.0%) |
| Bachelor's Degree | 7 (100.0%) | 0 (0.0%) |
| Graduate Degree | 0 (0.0%) | 0 (0.0%) |
| Total | 7 (100.0%) | 0 (0.0%) |
Employment Characteristics in Hawi
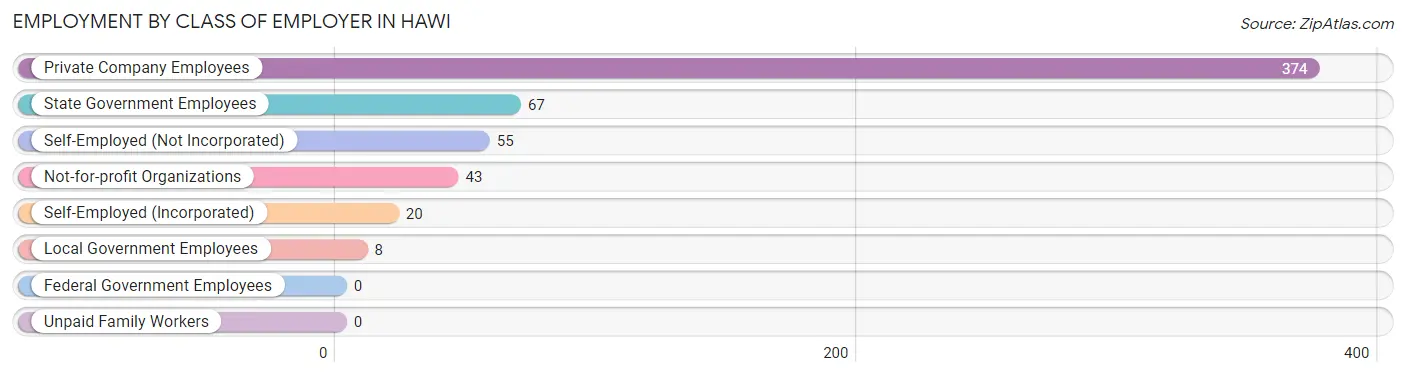
Employment by Class of Employer in Hawi
Among the 567 employed individuals in Hawi, private company employees (374 | 66.0%), state government employees (67 | 11.8%), and self-employed (not incorporated) (55 | 9.7%) make up the most common classes of employment.
| Employer Class | # Employees | % Employees |
| Private Company Employees | 374 | 66.0% |
| Self-Employed (Incorporated) | 20 | 3.5% |
| Self-Employed (Not Incorporated) | 55 | 9.7% |
| Not-for-profit Organizations | 43 | 7.6% |
| Local Government Employees | 8 | 1.4% |
| State Government Employees | 67 | 11.8% |
| Federal Government Employees | 0 | 0.0% |
| Unpaid Family Workers | 0 | 0.0% |
| Total | 567 | 100.0% |
Employment Status by Age in Hawi
According to the labor force statistics for Hawi, out of the total population over 16 years of age (1,125), 63.1% or 710 individuals are in the labor force, with 13.7% or 97 of them unemployed. The age group with the highest labor force participation rate is 20 to 24 years, with 100.0% or 73 individuals in the labor force. Within the labor force, the 25 to 29 years age range has the highest percentage of unemployed individuals, with 41.3% or 26 of them being unemployed.
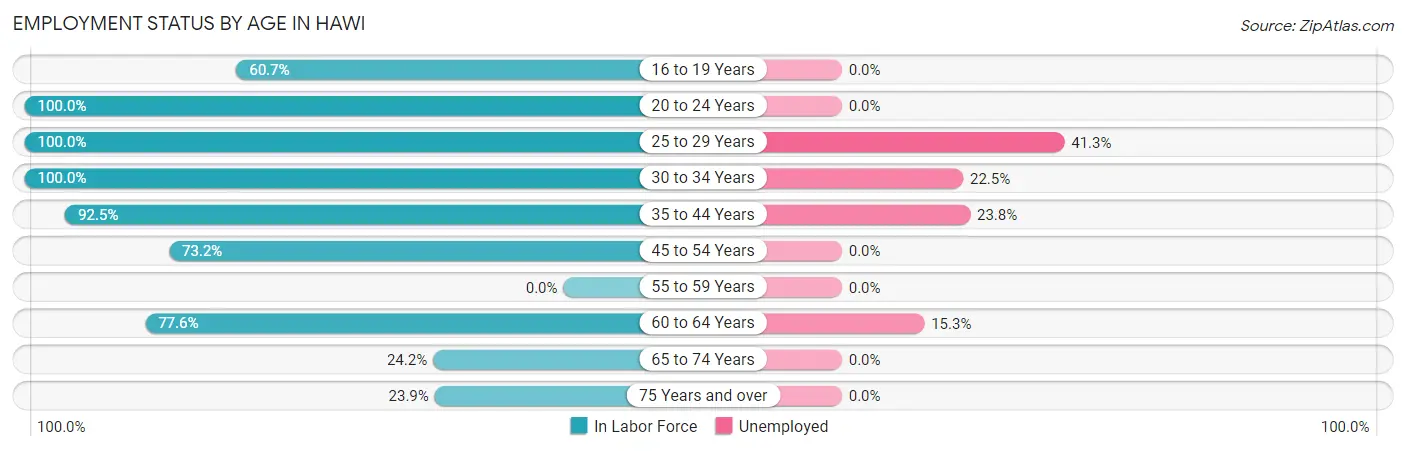
| Age Bracket | In Labor Force | Unemployed |
| 16 to 19 Years | 34 (60.7%) | 0 (0.0%) |
| 20 to 24 Years | 73 (100.0%) | 0 (0.0%) |
| 25 to 29 Years | 63 (100.0%) | 26 (41.3%) |
| 30 to 34 Years | 120 (100.0%) | 27 (22.5%) |
| 35 to 44 Years | 147 (92.5%) | 35 (23.8%) |
| 45 to 54 Years | 115 (73.2%) | 0 (0.0%) |
| 55 to 59 Years | 0 (0.0%) | 0 (0.0%) |
| 60 to 64 Years | 59 (77.6%) | 9 (15.3%) |
| 65 to 74 Years | 57 (24.2%) | 0 (0.0%) |
| 75 Years and over | 42 (23.9%) | 0 (0.0%) |
| Total | 710 (63.1%) | 97 (13.7%) |
Employment Status by Educational Attainment in Hawi
According to labor force statistics for Hawi, 86.3% of individuals (504) out of the total population between 25 and 64 years of age (584) are in the labor force, with 19.2% or 97 of them being unemployed. The group with the highest labor force participation rate are those with the educational attainment of less than high school, with 100.0% or 7 individuals in the labor force. Within the labor force, individuals with college / associate degree education have the highest percentage of unemployment, with 37.1% or 36 of them being unemployed.
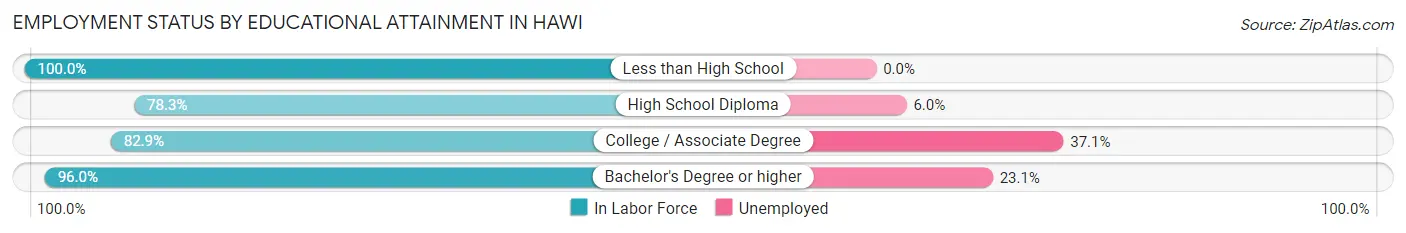
| Educational Attainment | In Labor Force | Unemployed |
| Less than High School | 7 (100.0%) | 0 (0.0%) |
| High School Diploma | 184 (78.3%) | 14 (6.0%) |
| College / Associate Degree | 97 (82.9%) | 43 (37.1%) |
| Bachelor's Degree or higher | 216 (96.0%) | 52 (23.1%) |
| Total | 504 (86.3%) | 112 (19.2%) |
Employment Occupations by Sex in Hawi
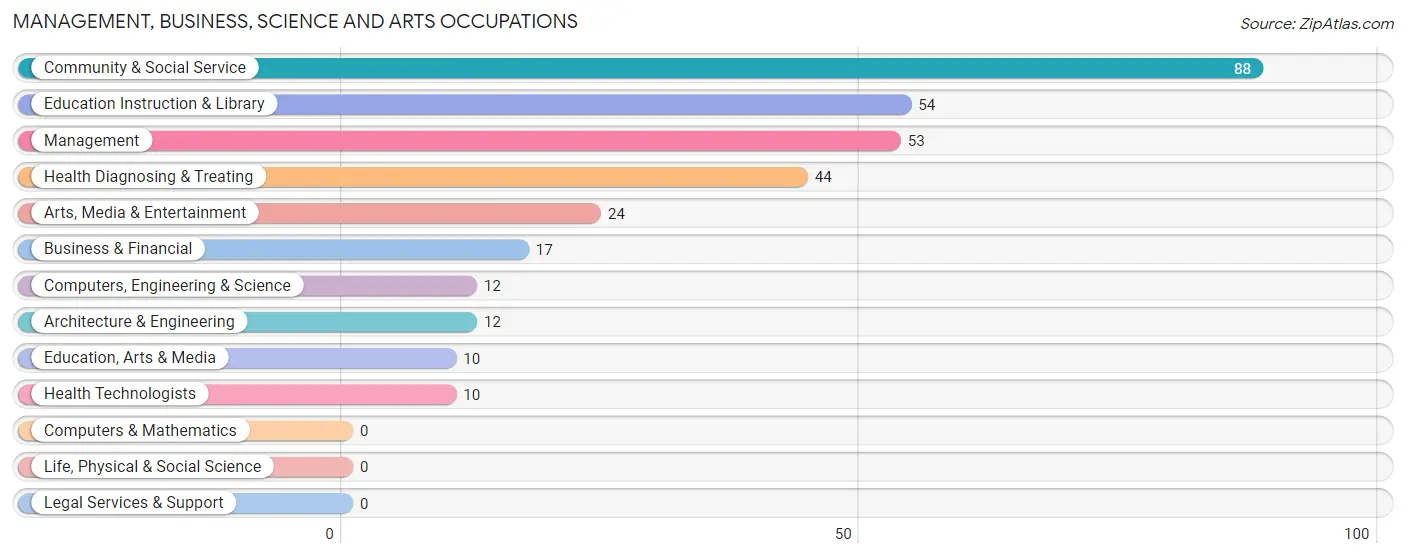
Management, Business, Science and Arts Occupations
The most common Management, Business, Science and Arts occupations in Hawi are Community & Social Service (88 | 14.4%), Education Instruction & Library (54 | 8.8%), Management (53 | 8.6%), Health Diagnosing & Treating (44 | 7.2%), and Arts, Media & Entertainment (24 | 3.9%).
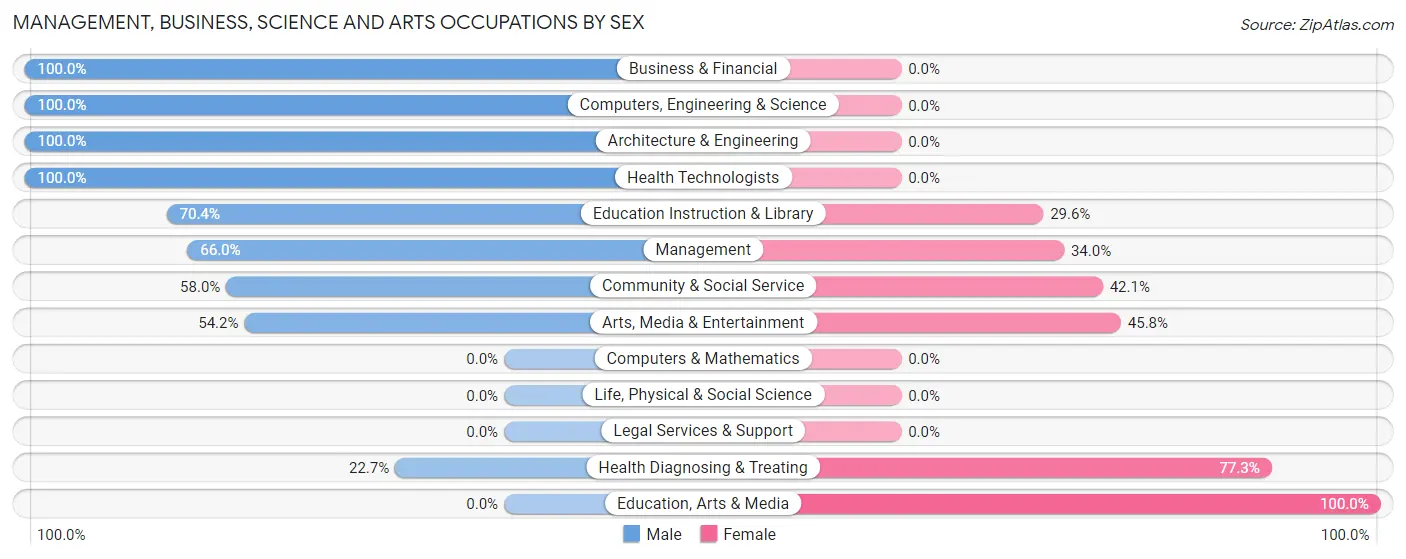
Management, Business, Science and Arts Occupations by Sex
Within the Management, Business, Science and Arts occupations in Hawi, the most male-oriented occupations are Business & Financial (100.0%), Computers, Engineering & Science (100.0%), and Architecture & Engineering (100.0%), while the most female-oriented occupations are Education, Arts & Media (100.0%), Health Diagnosing & Treating (77.3%), and Arts, Media & Entertainment (45.8%).
| Occupation | Male | Female |
| Management | 35 (66.0%) | 18 (34.0%) |
| Business & Financial | 17 (100.0%) | 0 (0.0%) |
| Computers, Engineering & Science | 12 (100.0%) | 0 (0.0%) |
| Computers & Mathematics | 0 (0.0%) | 0 (0.0%) |
| Architecture & Engineering | 12 (100.0%) | 0 (0.0%) |
| Life, Physical & Social Science | 0 (0.0%) | 0 (0.0%) |
| Community & Social Service | 51 (58.0%) | 37 (42.0%) |
| Education, Arts & Media | 0 (0.0%) | 10 (100.0%) |
| Legal Services & Support | 0 (0.0%) | 0 (0.0%) |
| Education Instruction & Library | 38 (70.4%) | 16 (29.6%) |
| Arts, Media & Entertainment | 13 (54.2%) | 11 (45.8%) |
| Health Diagnosing & Treating | 10 (22.7%) | 34 (77.3%) |
| Health Technologists | 10 (100.0%) | 0 (0.0%) |
| Total (Category) | 125 (58.4%) | 89 (41.6%) |
| Total (Overall) | 307 (50.1%) | 306 (49.9%) |
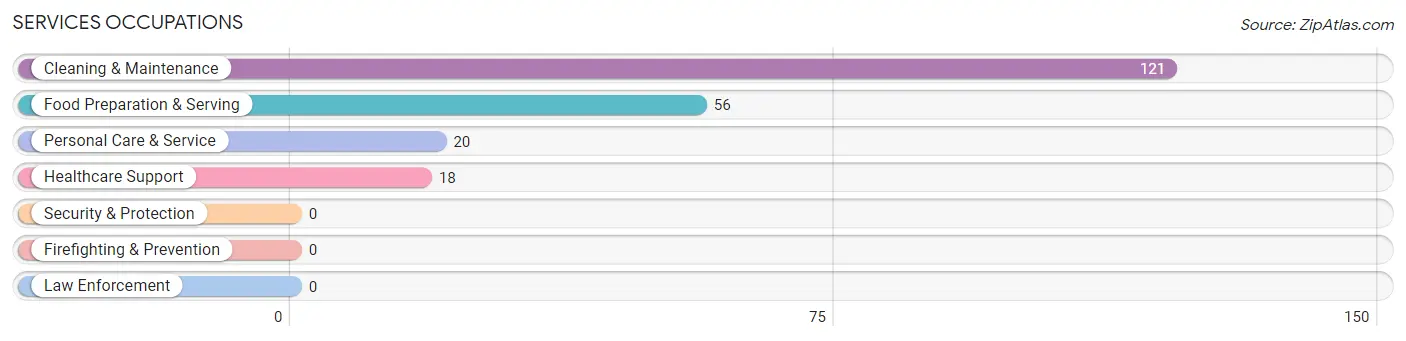
Services Occupations
The most common Services occupations in Hawi are Cleaning & Maintenance (121 | 19.7%), Food Preparation & Serving (56 | 9.1%), Personal Care & Service (20 | 3.3%), and Healthcare Support (18 | 2.9%).
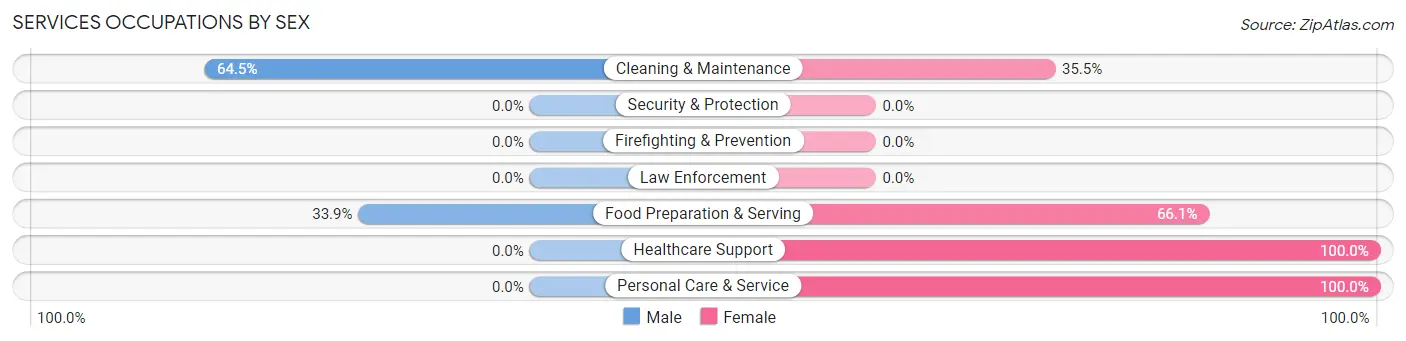
Services Occupations by Sex
Within the Services occupations in Hawi, the most male-oriented occupations are Cleaning & Maintenance (64.5%), and Food Preparation & Serving (33.9%), while the most female-oriented occupations are Healthcare Support (100.0%), Personal Care & Service (100.0%), and Food Preparation & Serving (66.1%).
| Occupation | Male | Female |
| Healthcare Support | 0 (0.0%) | 18 (100.0%) |
| Security & Protection | 0 (0.0%) | 0 (0.0%) |
| Firefighting & Prevention | 0 (0.0%) | 0 (0.0%) |
| Law Enforcement | 0 (0.0%) | 0 (0.0%) |
| Food Preparation & Serving | 19 (33.9%) | 37 (66.1%) |
| Cleaning & Maintenance | 78 (64.5%) | 43 (35.5%) |
| Personal Care & Service | 0 (0.0%) | 20 (100.0%) |
| Total (Category) | 97 (45.1%) | 118 (54.9%) |
| Total (Overall) | 307 (50.1%) | 306 (49.9%) |
Sales and Office Occupations
The most common Sales and Office occupations in Hawi are Office & Administration (59 | 9.6%), and Sales & Related (46 | 7.5%).
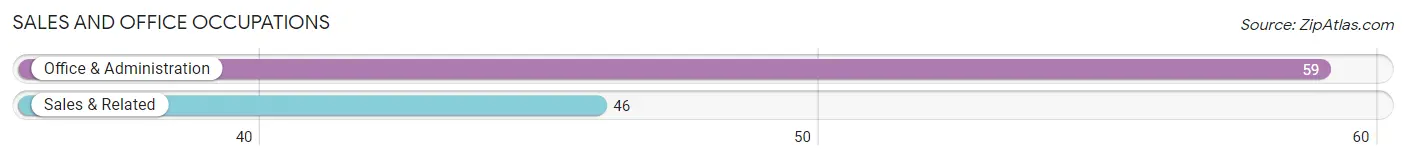
Sales and Office Occupations by Sex
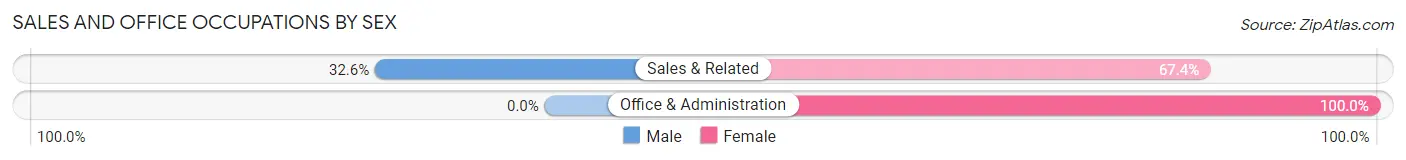
| Occupation | Male | Female |
| Sales & Related | 15 (32.6%) | 31 (67.4%) |
| Office & Administration | 0 (0.0%) | 59 (100.0%) |
| Total (Category) | 15 (14.3%) | 90 (85.7%) |
| Total (Overall) | 307 (50.1%) | 306 (49.9%) |
Natural Resources, Construction and Maintenance Occupations
The most common Natural Resources, Construction and Maintenance occupations in Hawi are Construction & Extraction (31 | 5.1%), and Installation, Maintenance & Repair (2 | 0.3%).
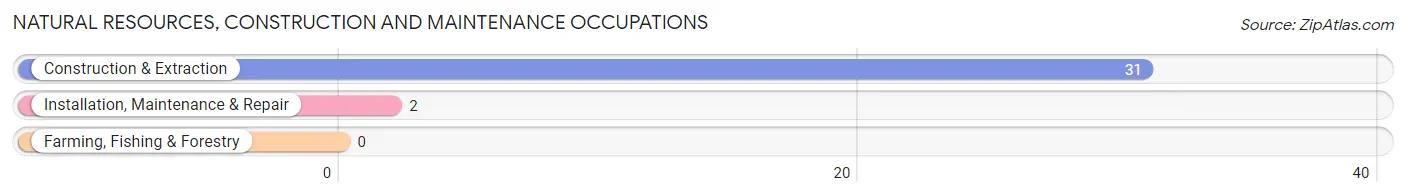
Natural Resources, Construction and Maintenance Occupations by Sex
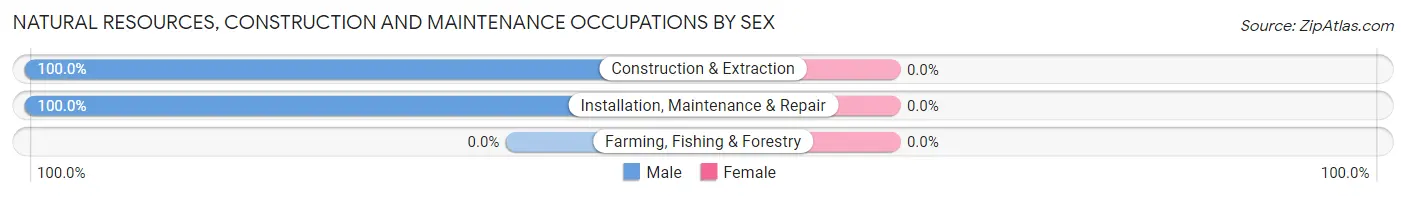
| Occupation | Male | Female |
| Farming, Fishing & Forestry | 0 (0.0%) | 0 (0.0%) |
| Construction & Extraction | 31 (100.0%) | 0 (0.0%) |
| Installation, Maintenance & Repair | 2 (100.0%) | 0 (0.0%) |
| Total (Category) | 33 (100.0%) | 0 (0.0%) |
| Total (Overall) | 307 (50.1%) | 306 (49.9%) |
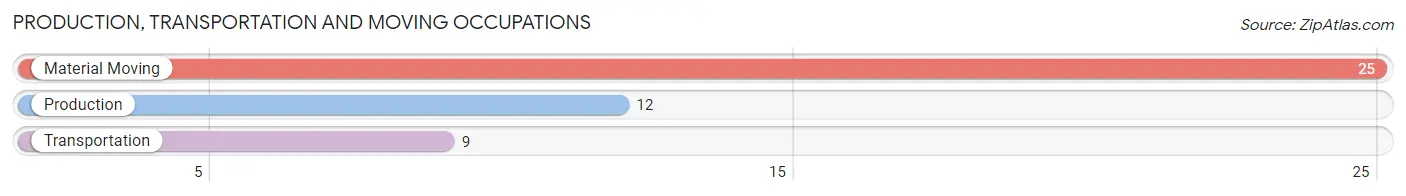
Production, Transportation and Moving Occupations
The most common Production, Transportation and Moving occupations in Hawi are Material Moving (25 | 4.1%), Production (12 | 2.0%), and Transportation (9 | 1.5%).
Production, Transportation and Moving Occupations by Sex
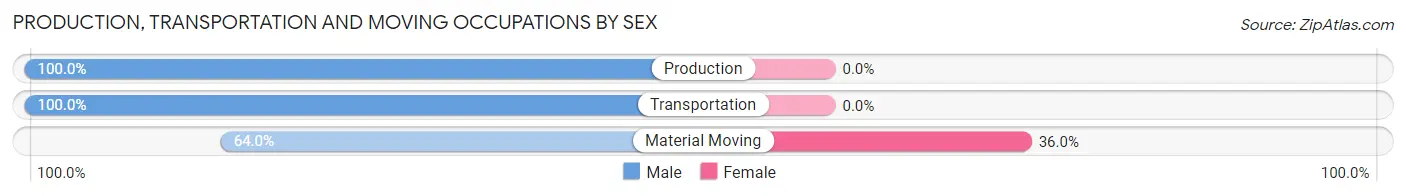
| Occupation | Male | Female |
| Production | 12 (100.0%) | 0 (0.0%) |
| Transportation | 9 (100.0%) | 0 (0.0%) |
| Material Moving | 16 (64.0%) | 9 (36.0%) |
| Total (Category) | 37 (80.4%) | 9 (19.6%) |
| Total (Overall) | 307 (50.1%) | 306 (49.9%) |
Employment Industries by Sex in Hawi
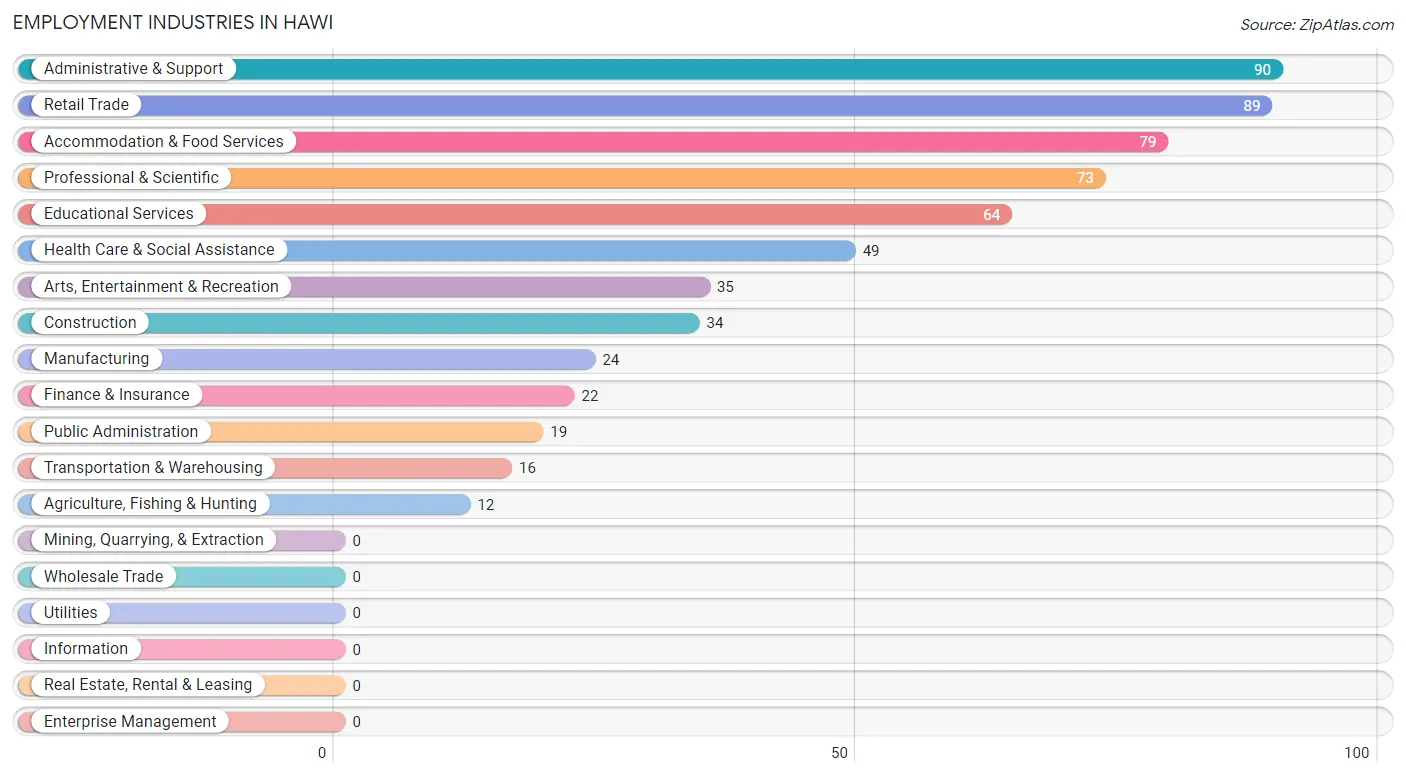
Employment Industries in Hawi
The major employment industries in Hawi include Administrative & Support (90 | 14.7%), Retail Trade (89 | 14.5%), Accommodation & Food Services (79 | 12.9%), Professional & Scientific (73 | 11.9%), and Educational Services (64 | 10.4%).
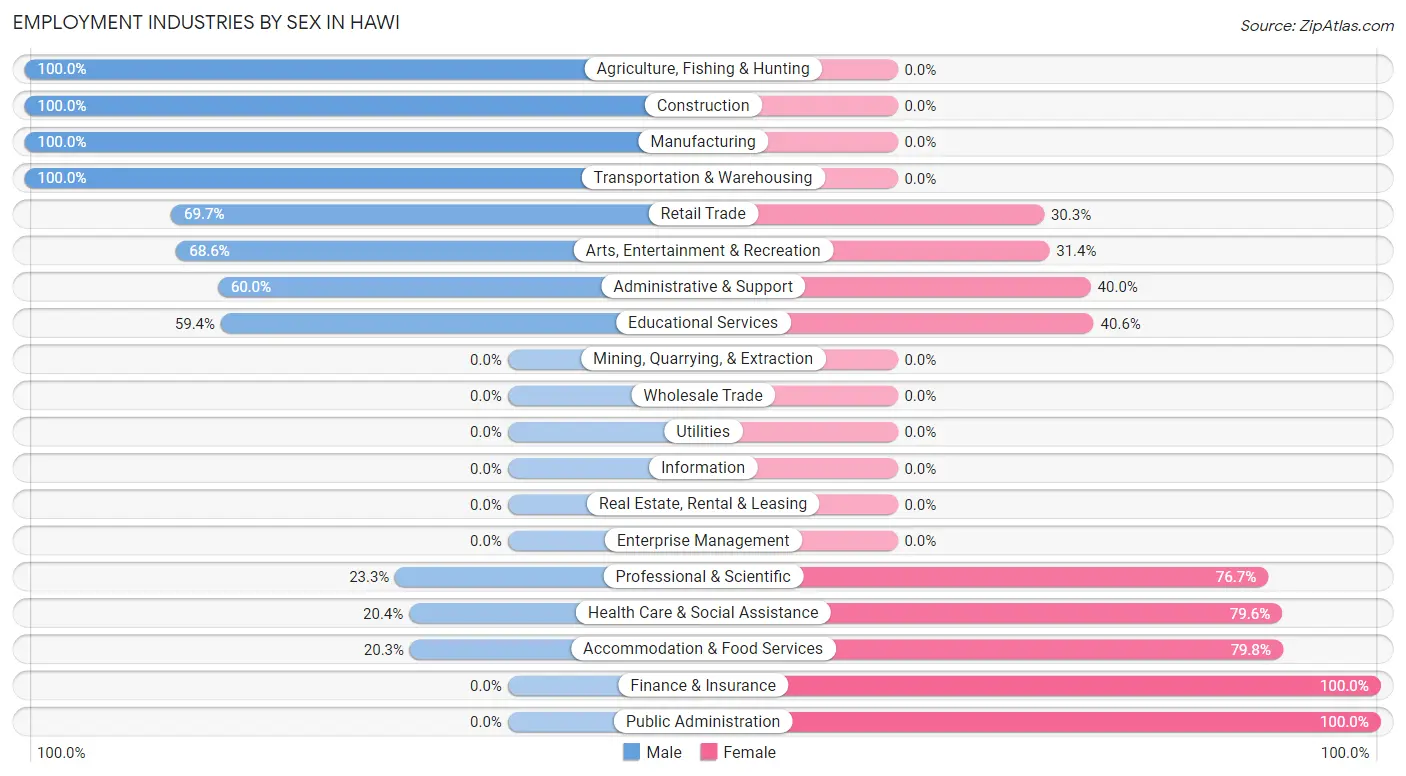
Employment Industries by Sex in Hawi
The Hawi industries that see more men than women are Agriculture, Fishing & Hunting (100.0%), Construction (100.0%), and Manufacturing (100.0%), whereas the industries that tend to have a higher number of women are Finance & Insurance (100.0%), Public Administration (100.0%), and Accommodation & Food Services (79.7%).
| Industry | Male | Female |
| Agriculture, Fishing & Hunting | 12 (100.0%) | 0 (0.0%) |
| Mining, Quarrying, & Extraction | 0 (0.0%) | 0 (0.0%) |
| Construction | 34 (100.0%) | 0 (0.0%) |
| Manufacturing | 24 (100.0%) | 0 (0.0%) |
| Wholesale Trade | 0 (0.0%) | 0 (0.0%) |
| Retail Trade | 62 (69.7%) | 27 (30.3%) |
| Transportation & Warehousing | 16 (100.0%) | 0 (0.0%) |
| Utilities | 0 (0.0%) | 0 (0.0%) |
| Information | 0 (0.0%) | 0 (0.0%) |
| Finance & Insurance | 0 (0.0%) | 22 (100.0%) |
| Real Estate, Rental & Leasing | 0 (0.0%) | 0 (0.0%) |
| Professional & Scientific | 17 (23.3%) | 56 (76.7%) |
| Enterprise Management | 0 (0.0%) | 0 (0.0%) |
| Administrative & Support | 54 (60.0%) | 36 (40.0%) |
| Educational Services | 38 (59.4%) | 26 (40.6%) |
| Health Care & Social Assistance | 10 (20.4%) | 39 (79.6%) |
| Arts, Entertainment & Recreation | 24 (68.6%) | 11 (31.4%) |
| Accommodation & Food Services | 16 (20.3%) | 63 (79.7%) |
| Public Administration | 0 (0.0%) | 19 (100.0%) |
| Total | 307 (50.1%) | 306 (49.9%) |
Education in Hawi
School Enrollment in Hawi
The most common levels of schooling among the 280 students in Hawi are middle school (111 | 39.6%), elementary school (79 | 28.2%), and graduate / professional (32 | 11.4%).
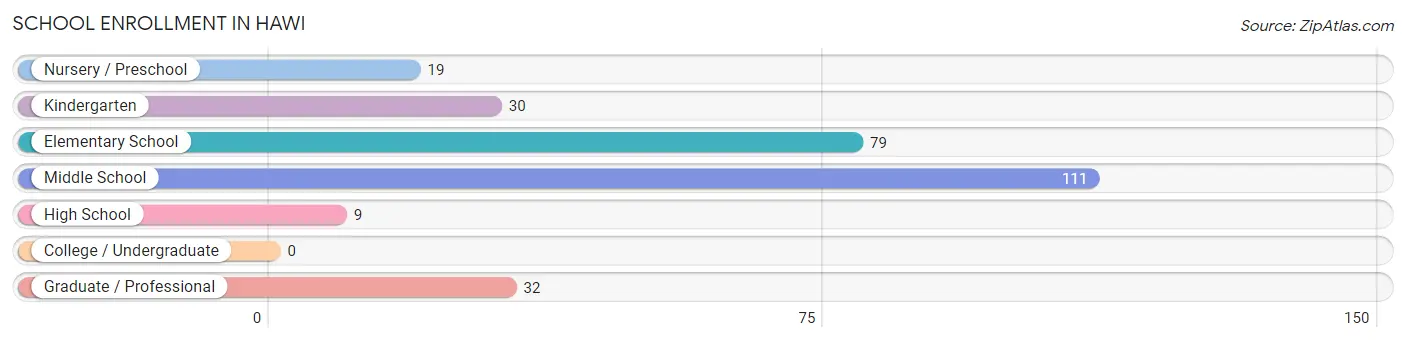
| School Level | # Students | % Students |
| Nursery / Preschool | 19 | 6.8% |
| Kindergarten | 30 | 10.7% |
| Elementary School | 79 | 28.2% |
| Middle School | 111 | 39.6% |
| High School | 9 | 3.2% |
| College / Undergraduate | 0 | 0.0% |
| Graduate / Professional | 32 | 11.4% |
| Total | 280 | 100.0% |
School Enrollment by Age by Funding Source in Hawi
Out of a total of 280 students who are enrolled in schools in Hawi, 68 (24.3%) attend a private institution, while the remaining 212 (75.7%) are enrolled in public schools. The age group of 25 to 34 year olds has the highest likelihood of being enrolled in private schools, with 22 (100.0% in the age bracket) enrolled. Conversely, the age group of 3 to 4 year olds has the lowest likelihood of being enrolled in a private school, with 7 (100.0% in the age bracket) attending a public institution.
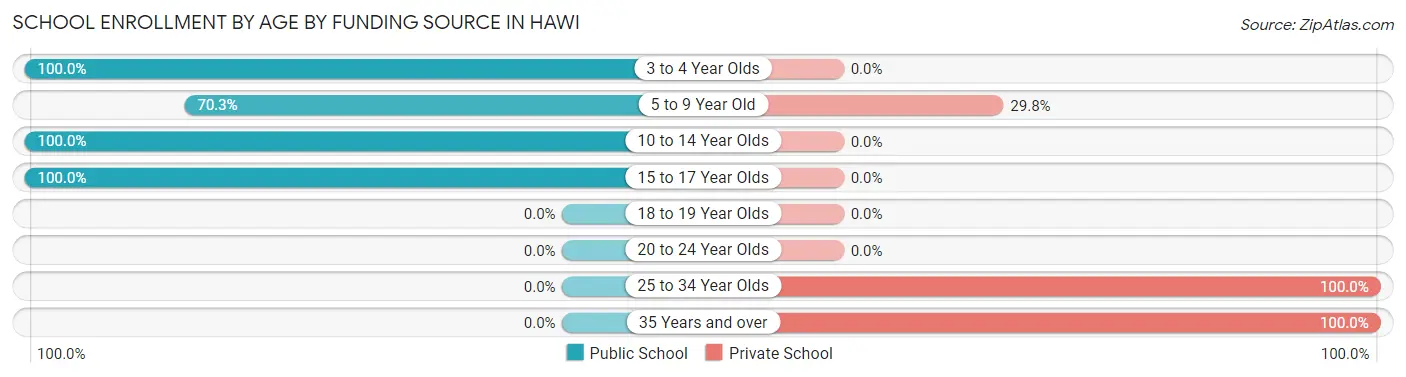
| Age Bracket | Public School | Private School |
| 3 to 4 Year Olds | 7 (100.0%) | 0 (0.0%) |
| 5 to 9 Year Old | 85 (70.3%) | 36 (29.7%) |
| 10 to 14 Year Olds | 98 (100.0%) | 0 (0.0%) |
| 15 to 17 Year Olds | 22 (100.0%) | 0 (0.0%) |
| 18 to 19 Year Olds | 0 (0.0%) | 0 (0.0%) |
| 20 to 24 Year Olds | 0 (0.0%) | 0 (0.0%) |
| 25 to 34 Year Olds | 0 (0.0%) | 22 (100.0%) |
| 35 Years and over | 0 (0.0%) | 10 (100.0%) |
| Total | 212 (75.7%) | 68 (24.3%) |
Educational Attainment by Field of Study in Hawi
Social sciences (62 | 15.9%), science & technology (51 | 13.0%), education (43 | 11.0%), physical & health sciences (41 | 10.5%), and literature & languages (40 | 10.2%) are the most common fields of study among 391 individuals in Hawi who have obtained a bachelor's degree or higher.
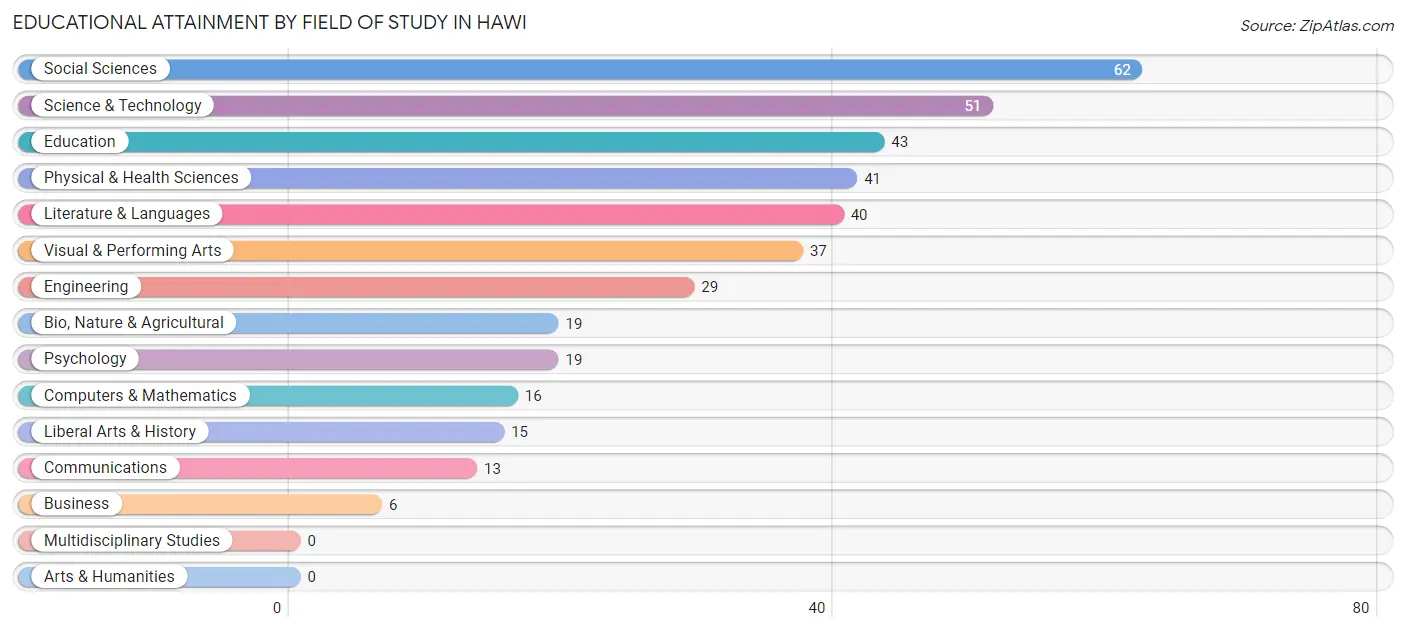
| Field of Study | # Graduates | % Graduates |
| Computers & Mathematics | 16 | 4.1% |
| Bio, Nature & Agricultural | 19 | 4.9% |
| Physical & Health Sciences | 41 | 10.5% |
| Psychology | 19 | 4.9% |
| Social Sciences | 62 | 15.9% |
| Engineering | 29 | 7.4% |
| Multidisciplinary Studies | 0 | 0.0% |
| Science & Technology | 51 | 13.0% |
| Business | 6 | 1.5% |
| Education | 43 | 11.0% |
| Literature & Languages | 40 | 10.2% |
| Liberal Arts & History | 15 | 3.8% |
| Visual & Performing Arts | 37 | 9.5% |
| Communications | 13 | 3.3% |
| Arts & Humanities | 0 | 0.0% |
| Total | 391 | 100.0% |
Transportation & Commute in Hawi
Vehicle Availability by Sex in Hawi
The most prevalent vehicle ownership categories in Hawi are males with 2 vehicles (96, accounting for 33.6%) and females with 2 vehicles (87, making up 34.2%).

| Vehicles Available | Male | Female |
| No Vehicle | 0 (0.0%) | 0 (0.0%) |
| 1 Vehicle | 45 (15.7%) | 30 (10.7%) |
| 2 Vehicles | 96 (33.6%) | 87 (31.0%) |
| 3 Vehicles | 72 (25.2%) | 75 (26.7%) |
| 4 Vehicles | 17 (5.9%) | 6 (2.1%) |
| 5 or more Vehicles | 56 (19.6%) | 83 (29.5%) |
| Total | 286 (100.0%) | 281 (100.0%) |
Commute Time in Hawi
The most frequently occuring commute durations in Hawi are 10 to 14 minutes (109 commuters, 22.0%), 5 to 9 minutes (101 commuters, 20.4%), and 30 to 34 minutes (93 commuters, 18.8%).
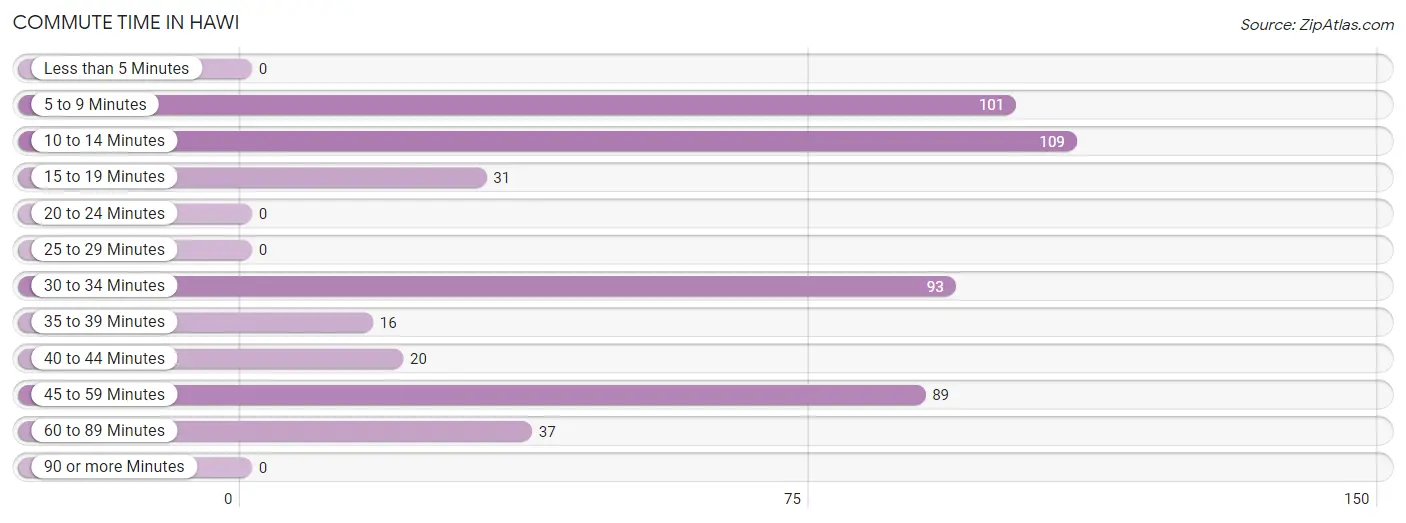
| Commute Time | # Commuters | % Commuters |
| Less than 5 Minutes | 0 | 0.0% |
| 5 to 9 Minutes | 101 | 20.4% |
| 10 to 14 Minutes | 109 | 22.0% |
| 15 to 19 Minutes | 31 | 6.2% |
| 20 to 24 Minutes | 0 | 0.0% |
| 25 to 29 Minutes | 0 | 0.0% |
| 30 to 34 Minutes | 93 | 18.8% |
| 35 to 39 Minutes | 16 | 3.2% |
| 40 to 44 Minutes | 20 | 4.0% |
| 45 to 59 Minutes | 89 | 17.9% |
| 60 to 89 Minutes | 37 | 7.5% |
| 90 or more Minutes | 0 | 0.0% |
Commute Time by Sex in Hawi
The most common commute times in Hawi are 30 to 34 minutes (53 commuters, 22.8%) for males and 10 to 14 minutes (72 commuters, 27.4%) for females.
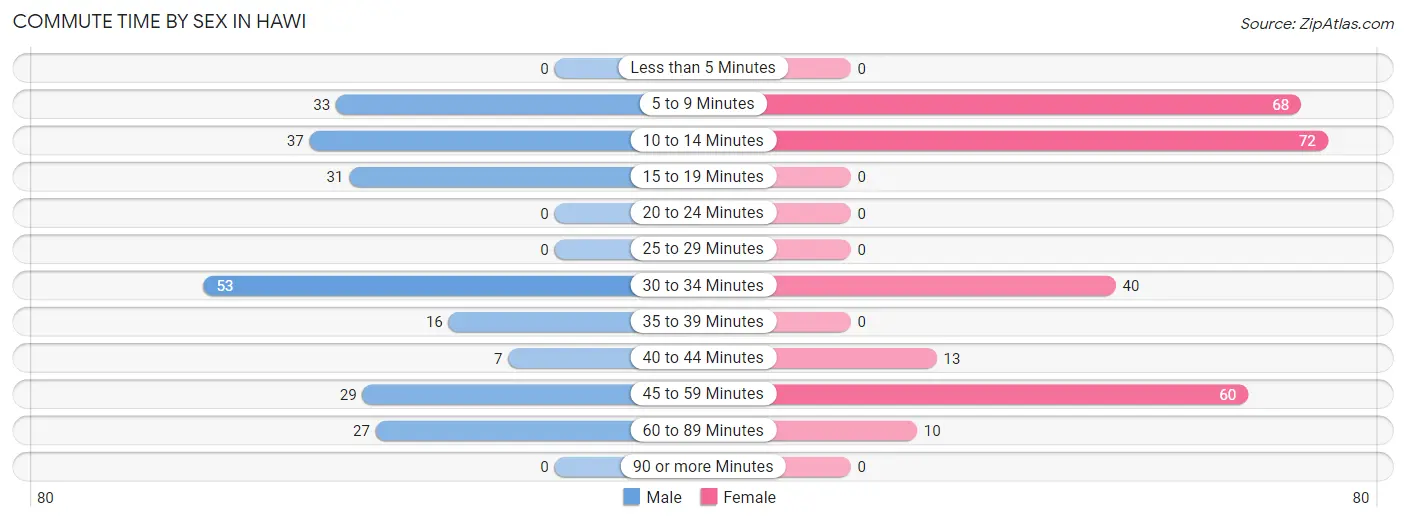
| Commute Time | Male | Female |
| Less than 5 Minutes | 0 (0.0%) | 0 (0.0%) |
| 5 to 9 Minutes | 33 (14.2%) | 68 (25.9%) |
| 10 to 14 Minutes | 37 (15.9%) | 72 (27.4%) |
| 15 to 19 Minutes | 31 (13.3%) | 0 (0.0%) |
| 20 to 24 Minutes | 0 (0.0%) | 0 (0.0%) |
| 25 to 29 Minutes | 0 (0.0%) | 0 (0.0%) |
| 30 to 34 Minutes | 53 (22.8%) | 40 (15.2%) |
| 35 to 39 Minutes | 16 (6.9%) | 0 (0.0%) |
| 40 to 44 Minutes | 7 (3.0%) | 13 (4.9%) |
| 45 to 59 Minutes | 29 (12.4%) | 60 (22.8%) |
| 60 to 89 Minutes | 27 (11.6%) | 10 (3.8%) |
| 90 or more Minutes | 0 (0.0%) | 0 (0.0%) |
Time of Departure to Work by Sex in Hawi
The most frequent times of departure to work in Hawi are 12:00 AM to 4:59 AM (42, 18.0%) for males and 6:30 AM to 6:59 AM (57, 21.7%) for females.
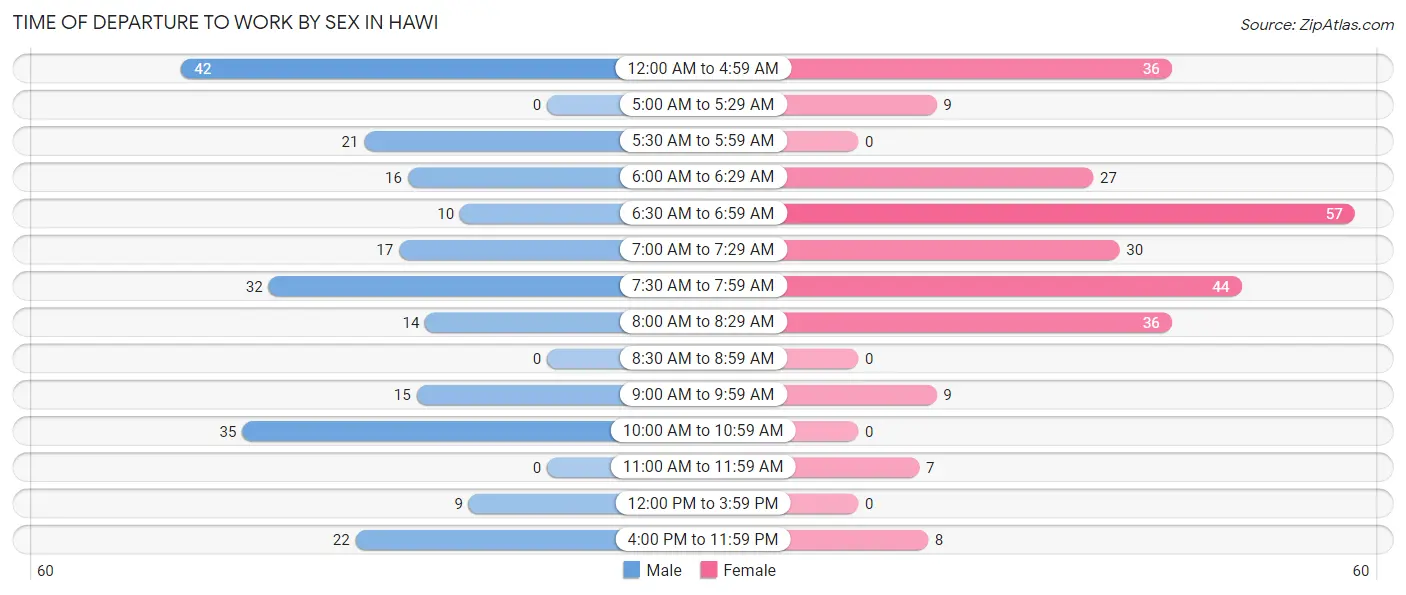
| Time of Departure | Male | Female |
| 12:00 AM to 4:59 AM | 42 (18.0%) | 36 (13.7%) |
| 5:00 AM to 5:29 AM | 0 (0.0%) | 9 (3.4%) |
| 5:30 AM to 5:59 AM | 21 (9.0%) | 0 (0.0%) |
| 6:00 AM to 6:29 AM | 16 (6.9%) | 27 (10.3%) |
| 6:30 AM to 6:59 AM | 10 (4.3%) | 57 (21.7%) |
| 7:00 AM to 7:29 AM | 17 (7.3%) | 30 (11.4%) |
| 7:30 AM to 7:59 AM | 32 (13.7%) | 44 (16.7%) |
| 8:00 AM to 8:29 AM | 14 (6.0%) | 36 (13.7%) |
| 8:30 AM to 8:59 AM | 0 (0.0%) | 0 (0.0%) |
| 9:00 AM to 9:59 AM | 15 (6.4%) | 9 (3.4%) |
| 10:00 AM to 10:59 AM | 35 (15.0%) | 0 (0.0%) |
| 11:00 AM to 11:59 AM | 0 (0.0%) | 7 (2.7%) |
| 12:00 PM to 3:59 PM | 9 (3.9%) | 0 (0.0%) |
| 4:00 PM to 11:59 PM | 22 (9.4%) | 8 (3.0%) |
| Total | 233 (100.0%) | 263 (100.0%) |
Housing Occupancy in Hawi
Occupancy by Ownership in Hawi
Of the total 455 dwellings in Hawi, owner-occupied units account for 346 (76.0%), while renter-occupied units make up 109 (24.0%).
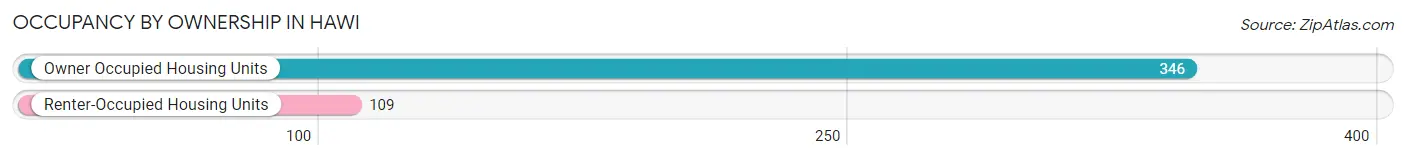
| Occupancy | # Housing Units | % Housing Units |
| Owner Occupied Housing Units | 346 | 76.0% |
| Renter-Occupied Housing Units | 109 | 24.0% |
| Total Occupied Housing Units | 455 | 100.0% |
Occupancy by Household Size in Hawi
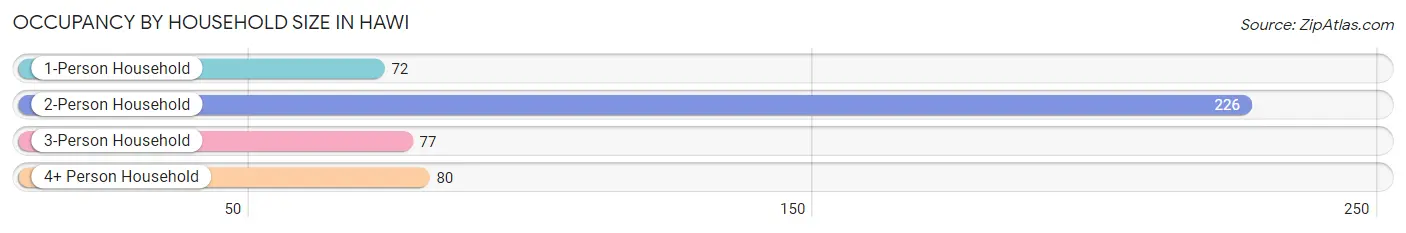
| Household Size | # Housing Units | % Housing Units |
| 1-Person Household | 72 | 15.8% |
| 2-Person Household | 226 | 49.7% |
| 3-Person Household | 77 | 16.9% |
| 4+ Person Household | 80 | 17.6% |
| Total Housing Units | 455 | 100.0% |
Occupancy by Ownership by Household Size in Hawi
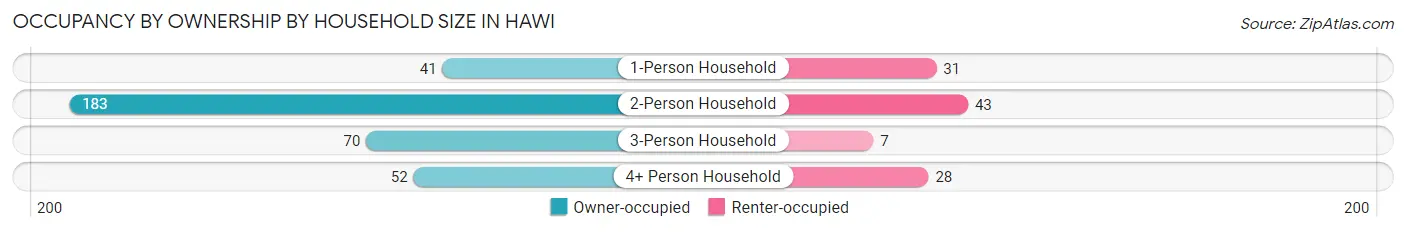
| Household Size | Owner-occupied | Renter-occupied |
| 1-Person Household | 41 (56.9%) | 31 (43.1%) |
| 2-Person Household | 183 (81.0%) | 43 (19.0%) |
| 3-Person Household | 70 (90.9%) | 7 (9.1%) |
| 4+ Person Household | 52 (65.0%) | 28 (35.0%) |
| Total Housing Units | 346 (76.0%) | 109 (24.0%) |
Occupancy by Educational Attainment in Hawi
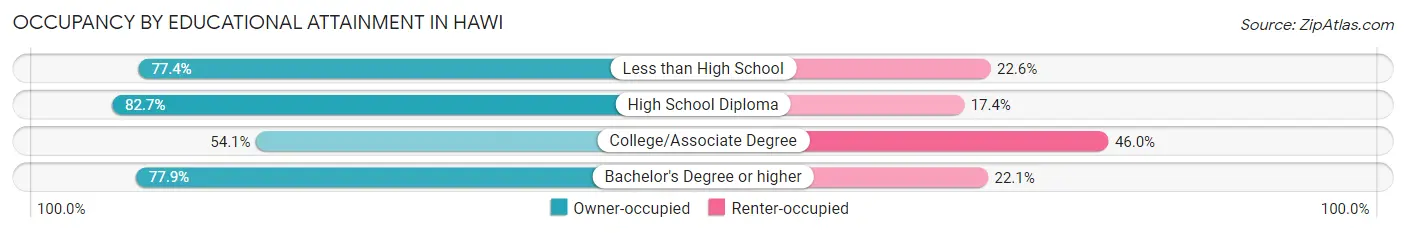
| Household Size | Owner-occupied | Renter-occupied |
| Less than High School | 24 (77.4%) | 7 (22.6%) |
| High School Diploma | 162 (82.7%) | 34 (17.3%) |
| College/Associate Degree | 40 (54.0%) | 34 (46.0%) |
| Bachelor's Degree or higher | 120 (77.9%) | 34 (22.1%) |
Occupancy by Age of Householder in Hawi
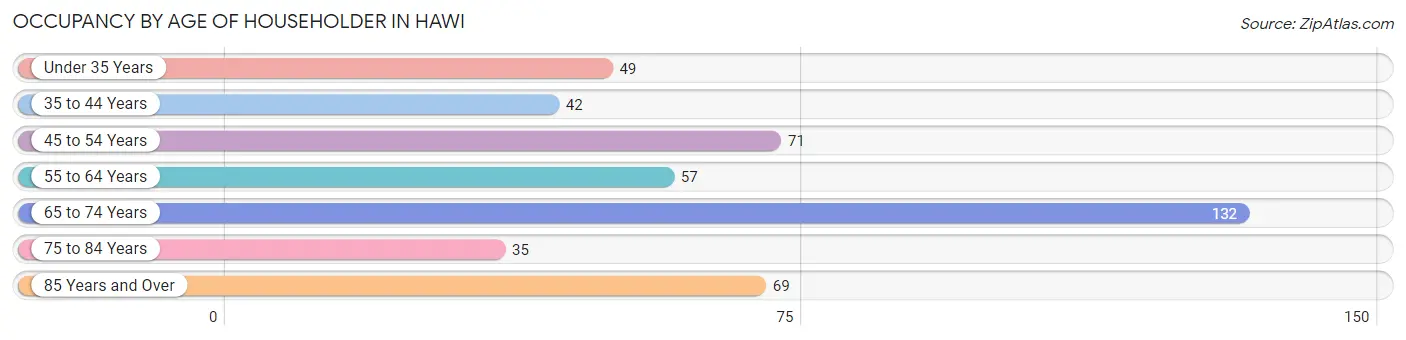
| Age Bracket | # Households | % Households |
| Under 35 Years | 49 | 10.8% |
| 35 to 44 Years | 42 | 9.2% |
| 45 to 54 Years | 71 | 15.6% |
| 55 to 64 Years | 57 | 12.5% |
| 65 to 74 Years | 132 | 29.0% |
| 75 to 84 Years | 35 | 7.7% |
| 85 Years and Over | 69 | 15.2% |
| Total | 455 | 100.0% |
Housing Finances in Hawi
Median Income by Occupancy in Hawi
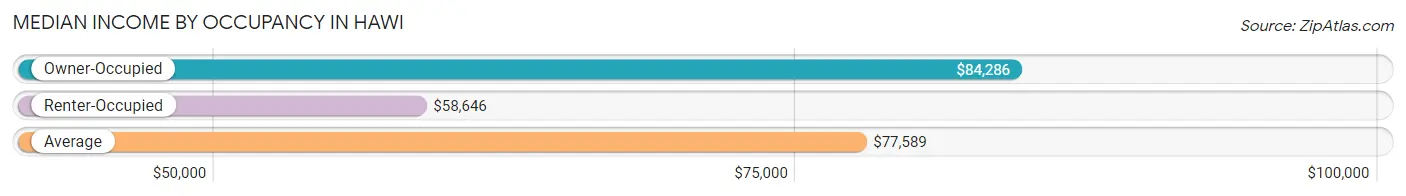
| Occupancy Type | # Households | Median Income |
| Owner-Occupied | 346 (76.0%) | $84,286 |
| Renter-Occupied | 109 (24.0%) | $58,646 |
| Average | 455 (100.0%) | $77,589 |
Occupancy by Householder Income Bracket in Hawi
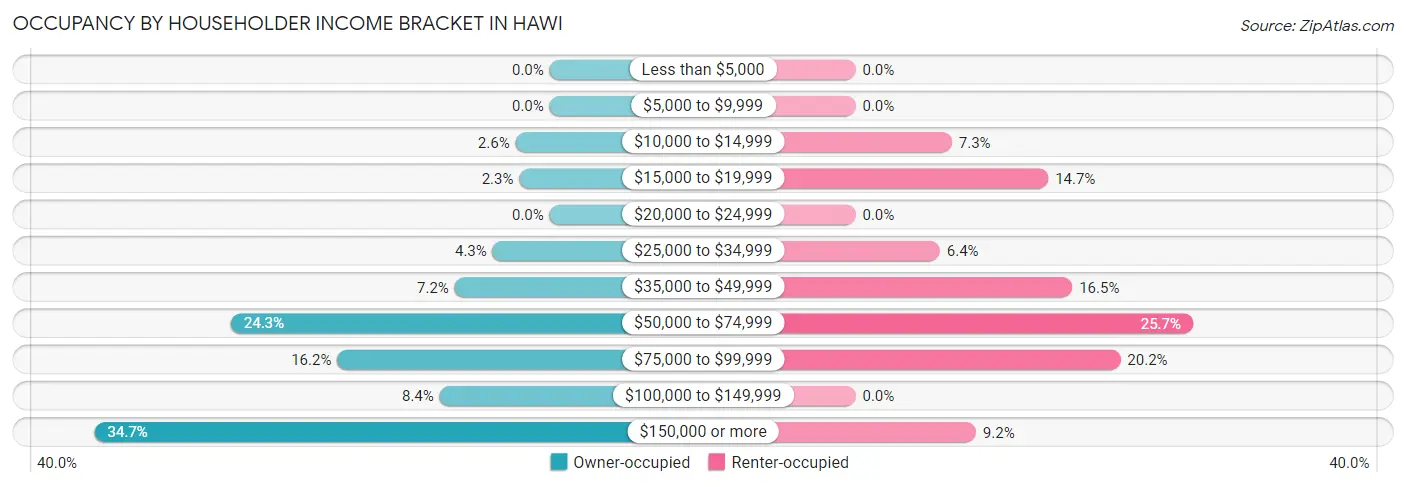
| Income Bracket | Owner-occupied | Renter-occupied |
| Less than $5,000 | 0 (0.0%) | 0 (0.0%) |
| $5,000 to $9,999 | 0 (0.0%) | 0 (0.0%) |
| $10,000 to $14,999 | 9 (2.6%) | 8 (7.3%) |
| $15,000 to $19,999 | 8 (2.3%) | 16 (14.7%) |
| $20,000 to $24,999 | 0 (0.0%) | 0 (0.0%) |
| $25,000 to $34,999 | 15 (4.3%) | 7 (6.4%) |
| $35,000 to $49,999 | 25 (7.2%) | 18 (16.5%) |
| $50,000 to $74,999 | 84 (24.3%) | 28 (25.7%) |
| $75,000 to $99,999 | 56 (16.2%) | 22 (20.2%) |
| $100,000 to $149,999 | 29 (8.4%) | 0 (0.0%) |
| $150,000 or more | 120 (34.7%) | 10 (9.2%) |
| Total | 346 (100.0%) | 109 (100.0%) |
Monthly Housing Cost Tiers in Hawi
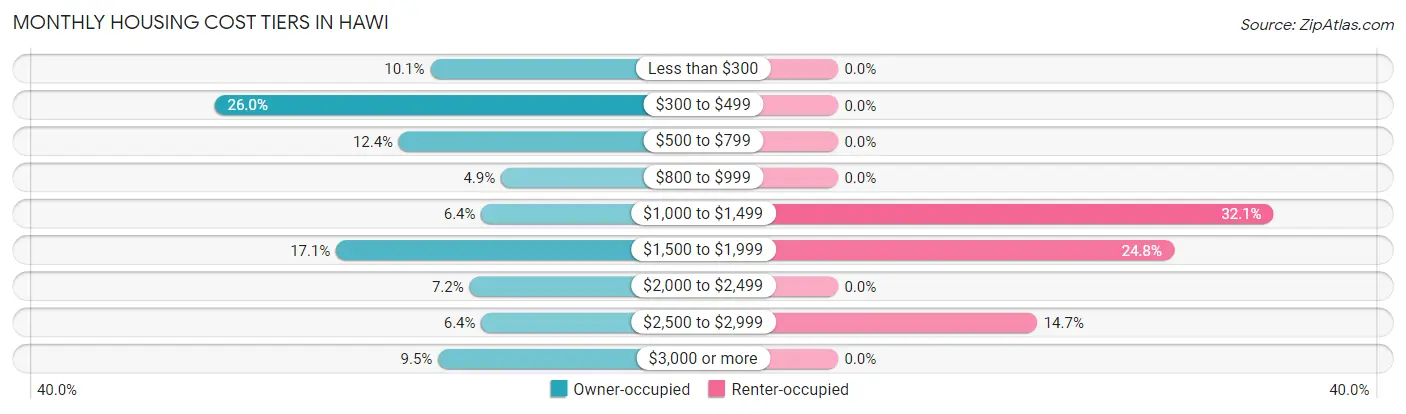
| Monthly Cost | Owner-occupied | Renter-occupied |
| Less than $300 | 35 (10.1%) | 0 (0.0%) |
| $300 to $499 | 90 (26.0%) | 0 (0.0%) |
| $500 to $799 | 43 (12.4%) | 0 (0.0%) |
| $800 to $999 | 17 (4.9%) | 0 (0.0%) |
| $1,000 to $1,499 | 22 (6.4%) | 35 (32.1%) |
| $1,500 to $1,999 | 59 (17.1%) | 27 (24.8%) |
| $2,000 to $2,499 | 25 (7.2%) | 0 (0.0%) |
| $2,500 to $2,999 | 22 (6.4%) | 16 (14.7%) |
| $3,000 or more | 33 (9.5%) | 0 (0.0%) |
| Total | 346 (100.0%) | 109 (100.0%) |
Physical Housing Characteristics in Hawi
Housing Structures in Hawi
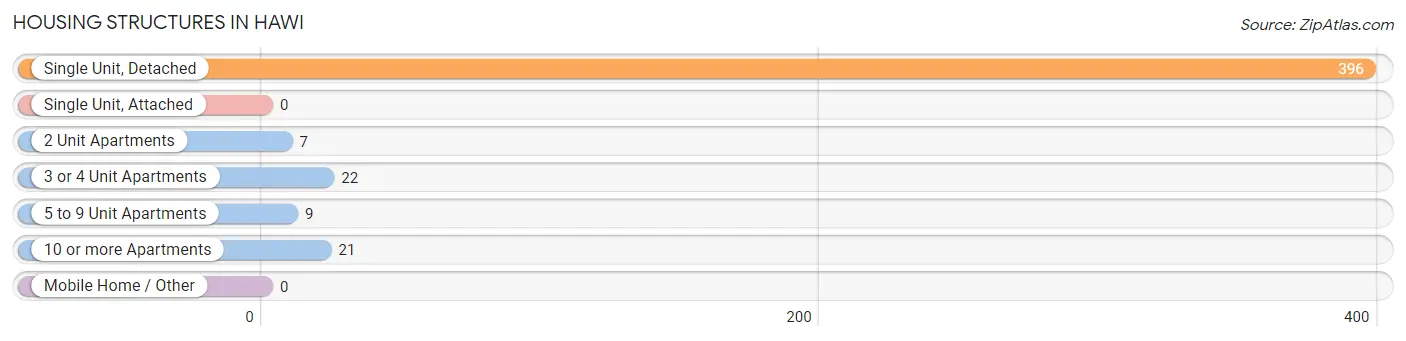
| Structure Type | # Housing Units | % Housing Units |
| Single Unit, Detached | 396 | 87.0% |
| Single Unit, Attached | 0 | 0.0% |
| 2 Unit Apartments | 7 | 1.5% |
| 3 or 4 Unit Apartments | 22 | 4.8% |
| 5 to 9 Unit Apartments | 9 | 2.0% |
| 10 or more Apartments | 21 | 4.6% |
| Mobile Home / Other | 0 | 0.0% |
| Total | 455 | 100.0% |
Housing Structures by Occupancy in Hawi
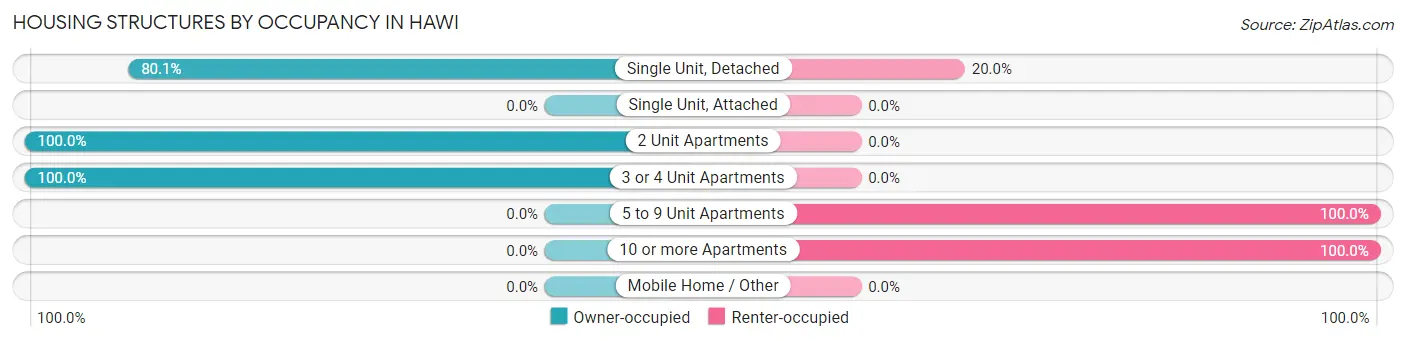
| Structure Type | Owner-occupied | Renter-occupied |
| Single Unit, Detached | 317 (80.0%) | 79 (20.0%) |
| Single Unit, Attached | 0 (0.0%) | 0 (0.0%) |
| 2 Unit Apartments | 7 (100.0%) | 0 (0.0%) |
| 3 or 4 Unit Apartments | 22 (100.0%) | 0 (0.0%) |
| 5 to 9 Unit Apartments | 0 (0.0%) | 9 (100.0%) |
| 10 or more Apartments | 0 (0.0%) | 21 (100.0%) |
| Mobile Home / Other | 0 (0.0%) | 0 (0.0%) |
| Total | 346 (76.0%) | 109 (24.0%) |
Housing Structures by Number of Rooms in Hawi
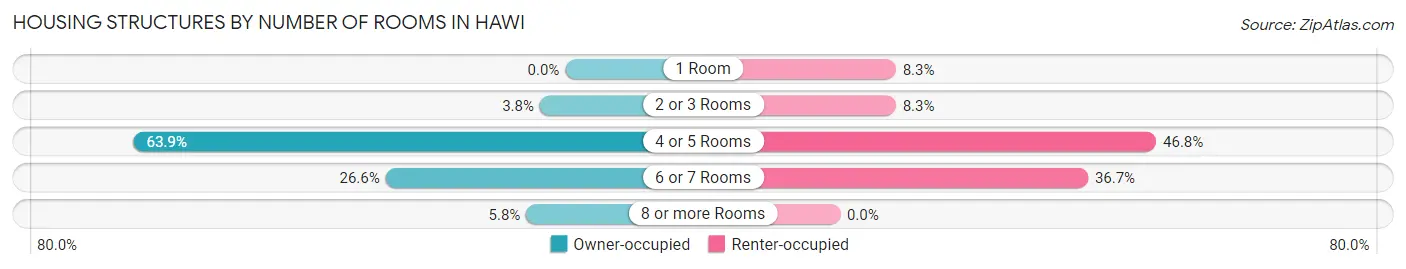
| Number of Rooms | Owner-occupied | Renter-occupied |
| 1 Room | 0 (0.0%) | 9 (8.3%) |
| 2 or 3 Rooms | 13 (3.8%) | 9 (8.3%) |
| 4 or 5 Rooms | 221 (63.9%) | 51 (46.8%) |
| 6 or 7 Rooms | 92 (26.6%) | 40 (36.7%) |
| 8 or more Rooms | 20 (5.8%) | 0 (0.0%) |
| Total | 346 (100.0%) | 109 (100.0%) |
Housing Structure by Heating Type in Hawi
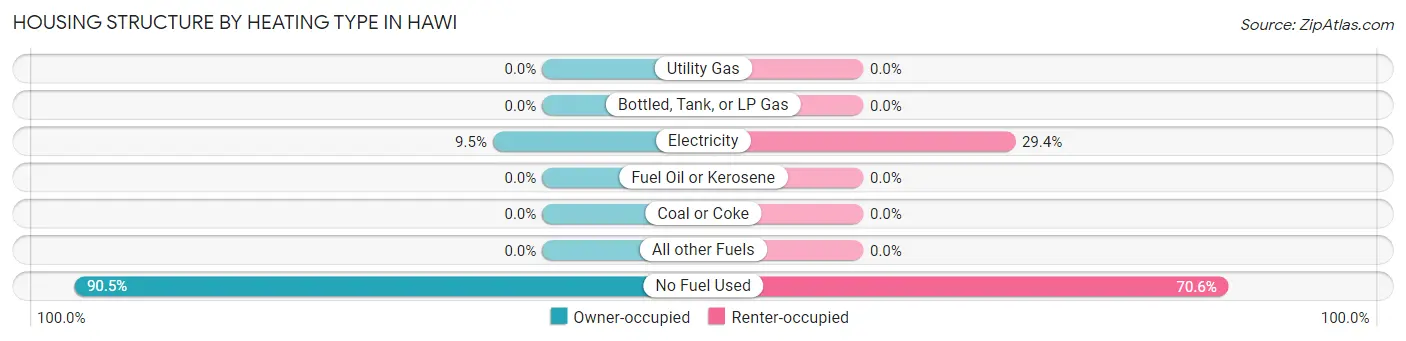
| Heating Type | Owner-occupied | Renter-occupied |
| Utility Gas | 0 (0.0%) | 0 (0.0%) |
| Bottled, Tank, or LP Gas | 0 (0.0%) | 0 (0.0%) |
| Electricity | 33 (9.5%) | 32 (29.4%) |
| Fuel Oil or Kerosene | 0 (0.0%) | 0 (0.0%) |
| Coal or Coke | 0 (0.0%) | 0 (0.0%) |
| All other Fuels | 0 (0.0%) | 0 (0.0%) |
| No Fuel Used | 313 (90.5%) | 77 (70.6%) |
| Total | 346 (100.0%) | 109 (100.0%) |
Household Vehicle Usage in Hawi
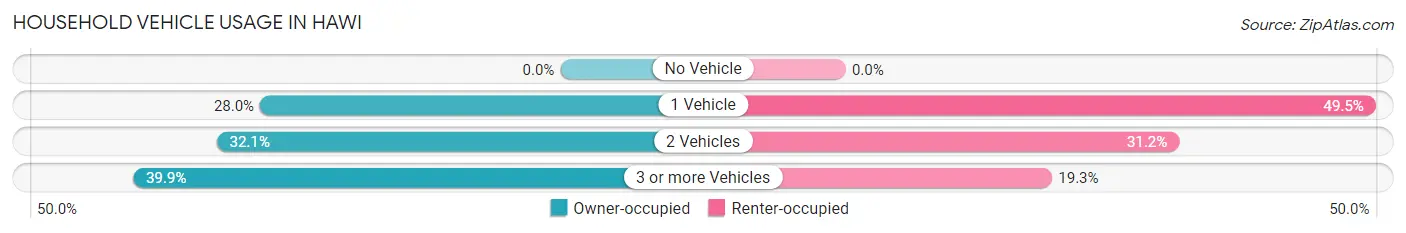
| Vehicles per Household | Owner-occupied | Renter-occupied |
| No Vehicle | 0 (0.0%) | 0 (0.0%) |
| 1 Vehicle | 97 (28.0%) | 54 (49.5%) |
| 2 Vehicles | 111 (32.1%) | 34 (31.2%) |
| 3 or more Vehicles | 138 (39.9%) | 21 (19.3%) |
| Total | 346 (100.0%) | 109 (100.0%) |
Real Estate & Mortgages in Hawi
Real Estate and Mortgage Overview in Hawi
| Characteristic | Without Mortgage | With Mortgage |
| Housing Units | 176 | 170 |
| Median Property Value | $601,200 | $614,400 |
| Median Household Income | $73,879 | $55 |
| Monthly Housing Costs | $437 | $33 |
| Real Estate Taxes | $1,274 | $7 |
Property Value by Mortgage Status in Hawi
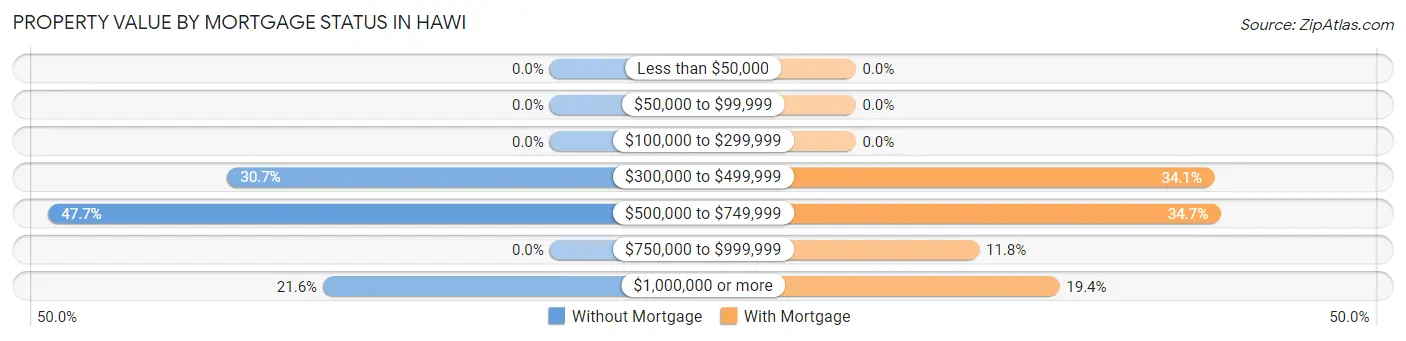
| Property Value | Without Mortgage | With Mortgage |
| Less than $50,000 | 0 (0.0%) | 0 (0.0%) |
| $50,000 to $99,999 | 0 (0.0%) | 0 (0.0%) |
| $100,000 to $299,999 | 0 (0.0%) | 0 (0.0%) |
| $300,000 to $499,999 | 54 (30.7%) | 58 (34.1%) |
| $500,000 to $749,999 | 84 (47.7%) | 59 (34.7%) |
| $750,000 to $999,999 | 0 (0.0%) | 20 (11.8%) |
| $1,000,000 or more | 38 (21.6%) | 33 (19.4%) |
| Total | 176 (100.0%) | 170 (100.0%) |
Household Income by Mortgage Status in Hawi
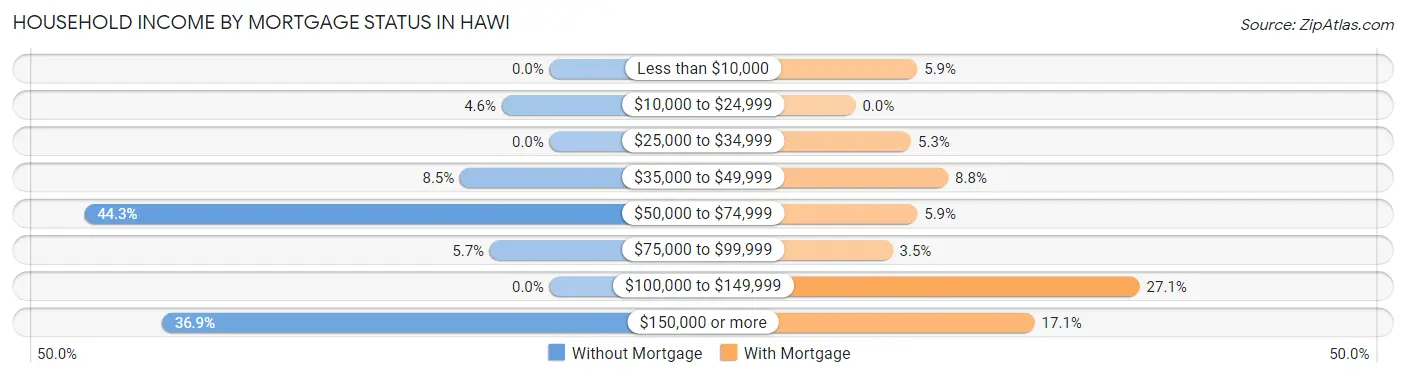
| Household Income | Without Mortgage | With Mortgage |
| Less than $10,000 | 0 (0.0%) | 10 (5.9%) |
| $10,000 to $24,999 | 8 (4.5%) | 0 (0.0%) |
| $25,000 to $34,999 | 0 (0.0%) | 9 (5.3%) |
| $35,000 to $49,999 | 15 (8.5%) | 15 (8.8%) |
| $50,000 to $74,999 | 78 (44.3%) | 10 (5.9%) |
| $75,000 to $99,999 | 10 (5.7%) | 6 (3.5%) |
| $100,000 to $149,999 | 0 (0.0%) | 46 (27.1%) |
| $150,000 or more | 65 (36.9%) | 29 (17.1%) |
| Total | 176 (100.0%) | 170 (100.0%) |
Property Value to Household Income Ratio in Hawi
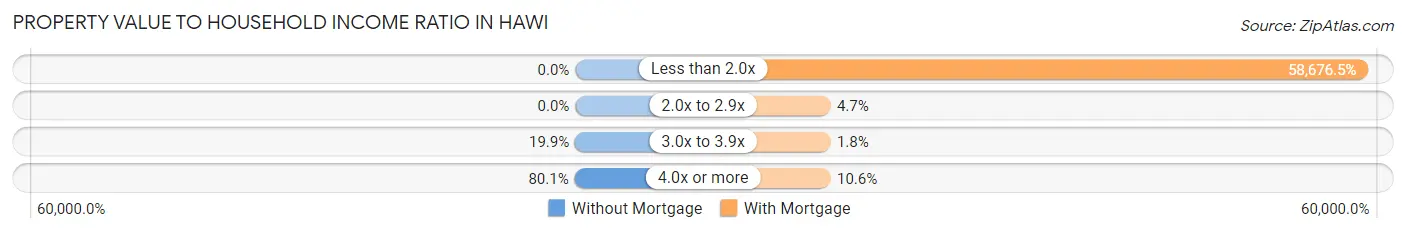
| Value-to-Income Ratio | Without Mortgage | With Mortgage |
| Less than 2.0x | 0 (0.0%) | 99,750 (58,676.5%) |
| 2.0x to 2.9x | 0 (0.0%) | 8 (4.7%) |
| 3.0x to 3.9x | 35 (19.9%) | 3 (1.8%) |
| 4.0x or more | 141 (80.1%) | 18 (10.6%) |
| Total | 176 (100.0%) | 170 (100.0%) |
Real Estate Taxes by Mortgage Status in Hawi
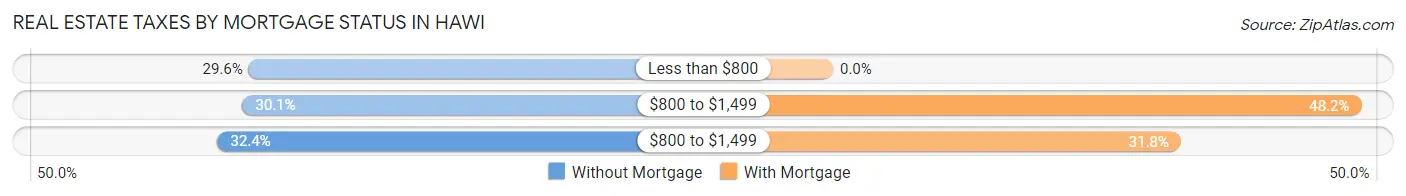
| Property Taxes | Without Mortgage | With Mortgage |
| Less than $800 | 52 (29.5%) | 0 (0.0%) |
| $800 to $1,499 | 53 (30.1%) | 82 (48.2%) |
| $800 to $1,499 | 57 (32.4%) | 54 (31.8%) |
| Total | 176 (100.0%) | 170 (100.0%) |
Health & Disability in Hawi
Health Insurance Coverage by Age in Hawi
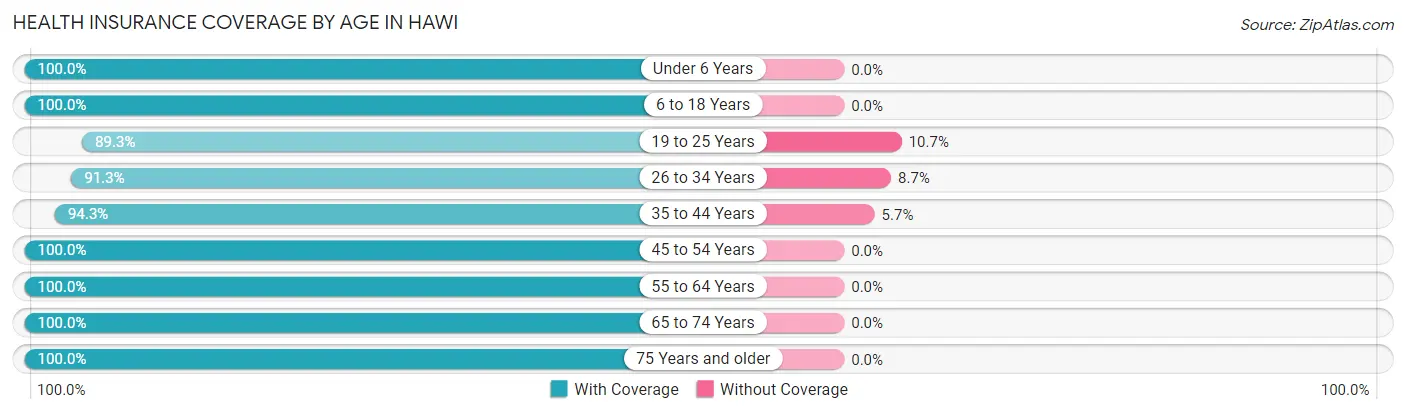
| Age Bracket | With Coverage | Without Coverage |
| Under 6 Years | 58 (100.0%) | 0 (0.0%) |
| 6 to 18 Years | 256 (100.0%) | 0 (0.0%) |
| 19 to 25 Years | 75 (89.3%) | 9 (10.7%) |
| 26 to 34 Years | 157 (91.3%) | 15 (8.7%) |
| 35 to 44 Years | 150 (94.3%) | 9 (5.7%) |
| 45 to 54 Years | 157 (100.0%) | 0 (0.0%) |
| 55 to 64 Years | 85 (100.0%) | 0 (0.0%) |
| 65 to 74 Years | 236 (100.0%) | 0 (0.0%) |
| 75 Years and older | 176 (100.0%) | 0 (0.0%) |
| Total | 1,350 (97.6%) | 33 (2.4%) |
Health Insurance Coverage by Citizenship Status in Hawi
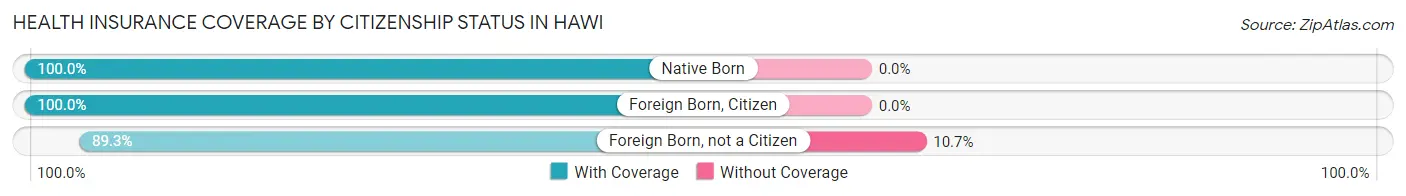
| Citizenship Status | With Coverage | Without Coverage |
| Native Born | 58 (100.0%) | 0 (0.0%) |
| Foreign Born, Citizen | 256 (100.0%) | 0 (0.0%) |
| Foreign Born, not a Citizen | 75 (89.3%) | 9 (10.7%) |
Health Insurance Coverage by Household Income in Hawi
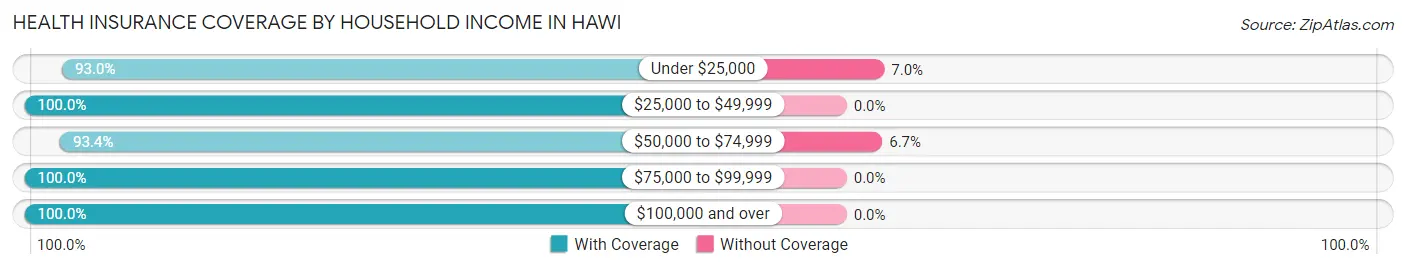
| Household Income | With Coverage | Without Coverage |
| Under $25,000 | 119 (93.0%) | 9 (7.0%) |
| $25,000 to $49,999 | 163 (100.0%) | 0 (0.0%) |
| $50,000 to $74,999 | 337 (93.3%) | 24 (6.7%) |
| $75,000 to $99,999 | 176 (100.0%) | 0 (0.0%) |
| $100,000 and over | 555 (100.0%) | 0 (0.0%) |
Public vs Private Health Insurance Coverage by Age in Hawi
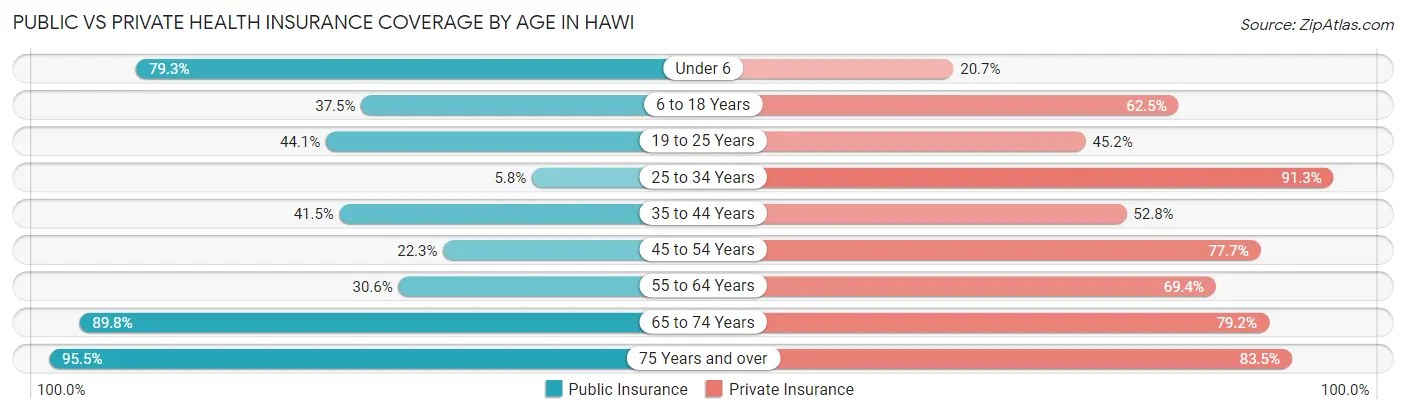
| Age Bracket | Public Insurance | Private Insurance |
| Under 6 | 46 (79.3%) | 12 (20.7%) |
| 6 to 18 Years | 96 (37.5%) | 160 (62.5%) |
| 19 to 25 Years | 37 (44.1%) | 38 (45.2%) |
| 25 to 34 Years | 10 (5.8%) | 157 (91.3%) |
| 35 to 44 Years | 66 (41.5%) | 84 (52.8%) |
| 45 to 54 Years | 35 (22.3%) | 122 (77.7%) |
| 55 to 64 Years | 26 (30.6%) | 59 (69.4%) |
| 65 to 74 Years | 212 (89.8%) | 187 (79.2%) |
| 75 Years and over | 168 (95.5%) | 147 (83.5%) |
| Total | 696 (50.3%) | 966 (69.9%) |
Disability Status by Sex by Age in Hawi
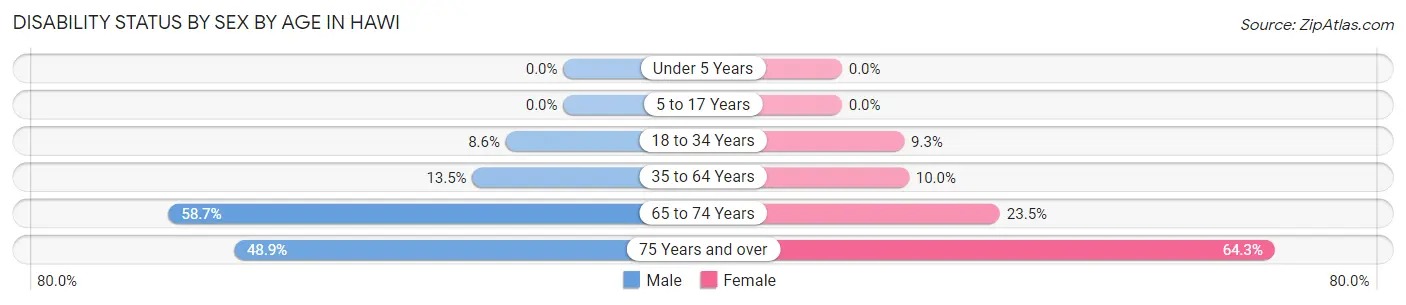
| Age Bracket | Male | Female |
| Under 5 Years | 0 (0.0%) | 0 (0.0%) |
| 5 to 17 Years | 0 (0.0%) | 0 (0.0%) |
| 18 to 34 Years | 10 (8.6%) | 16 (9.2%) |
| 35 to 64 Years | 27 (13.5%) | 20 (10.0%) |
| 65 to 74 Years | 61 (58.7%) | 31 (23.5%) |
| 75 Years and over | 45 (48.9%) | 54 (64.3%) |
Disability Class by Sex by Age in Hawi
Disability Class: Hearing Difficulty
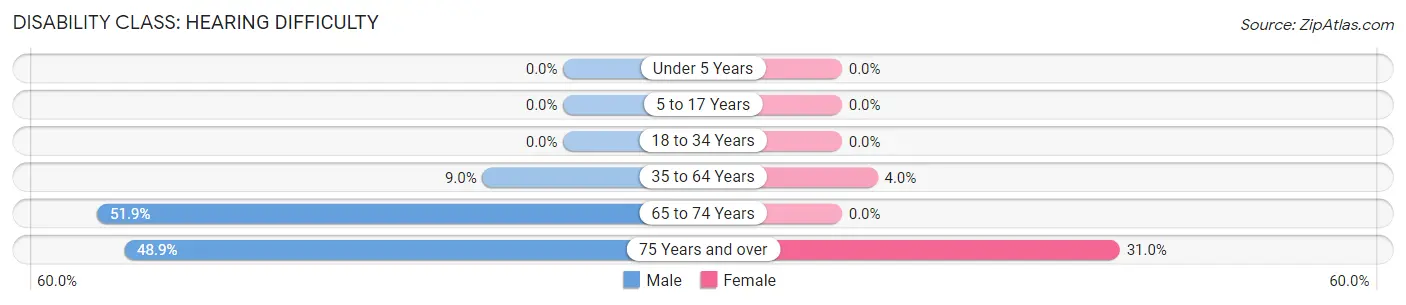
| Age Bracket | Male | Female |
| Under 5 Years | 0 (0.0%) | 0 (0.0%) |
| 5 to 17 Years | 0 (0.0%) | 0 (0.0%) |
| 18 to 34 Years | 0 (0.0%) | 0 (0.0%) |
| 35 to 64 Years | 18 (9.0%) | 8 (4.0%) |
| 65 to 74 Years | 54 (51.9%) | 0 (0.0%) |
| 75 Years and over | 45 (48.9%) | 26 (30.9%) |
Disability Class: Vision Difficulty
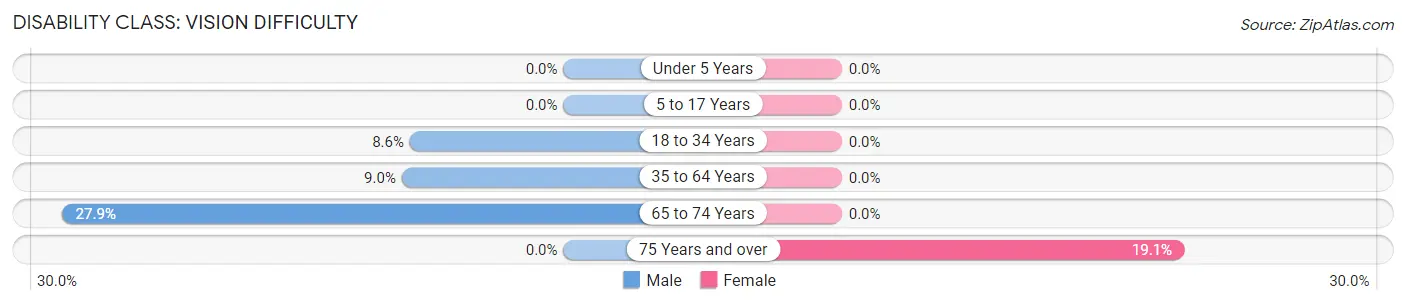
| Age Bracket | Male | Female |
| Under 5 Years | 0 (0.0%) | 0 (0.0%) |
| 5 to 17 Years | 0 (0.0%) | 0 (0.0%) |
| 18 to 34 Years | 10 (8.6%) | 0 (0.0%) |
| 35 to 64 Years | 18 (9.0%) | 0 (0.0%) |
| 65 to 74 Years | 29 (27.9%) | 0 (0.0%) |
| 75 Years and over | 0 (0.0%) | 16 (19.1%) |
Disability Class: Cognitive Difficulty
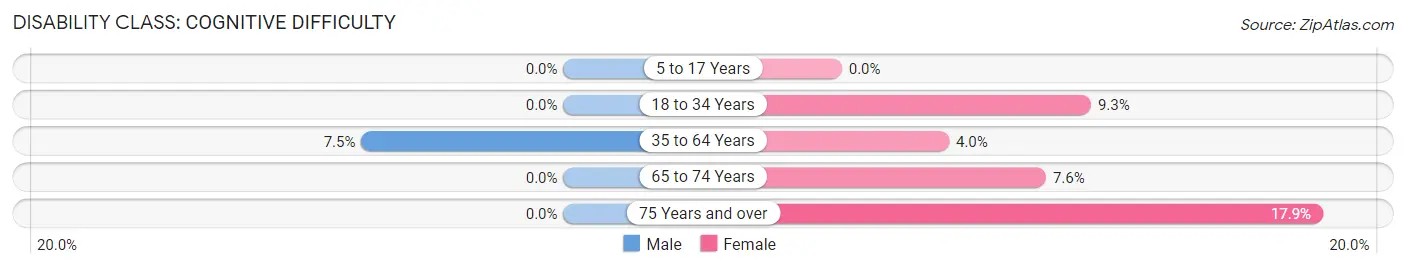
| Age Bracket | Male | Female |
| 5 to 17 Years | 0 (0.0%) | 0 (0.0%) |
| 18 to 34 Years | 0 (0.0%) | 16 (9.2%) |
| 35 to 64 Years | 15 (7.5%) | 8 (4.0%) |
| 65 to 74 Years | 0 (0.0%) | 10 (7.6%) |
| 75 Years and over | 0 (0.0%) | 15 (17.9%) |
Disability Class: Ambulatory Difficulty
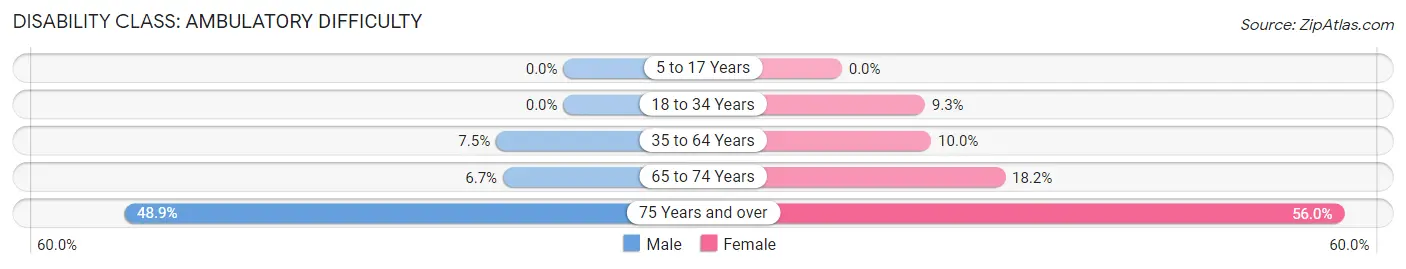
| Age Bracket | Male | Female |
| 5 to 17 Years | 0 (0.0%) | 0 (0.0%) |
| 18 to 34 Years | 0 (0.0%) | 16 (9.2%) |
| 35 to 64 Years | 15 (7.5%) | 20 (10.0%) |
| 65 to 74 Years | 7 (6.7%) | 24 (18.2%) |
| 75 Years and over | 45 (48.9%) | 47 (55.9%) |
Disability Class: Self-Care Difficulty
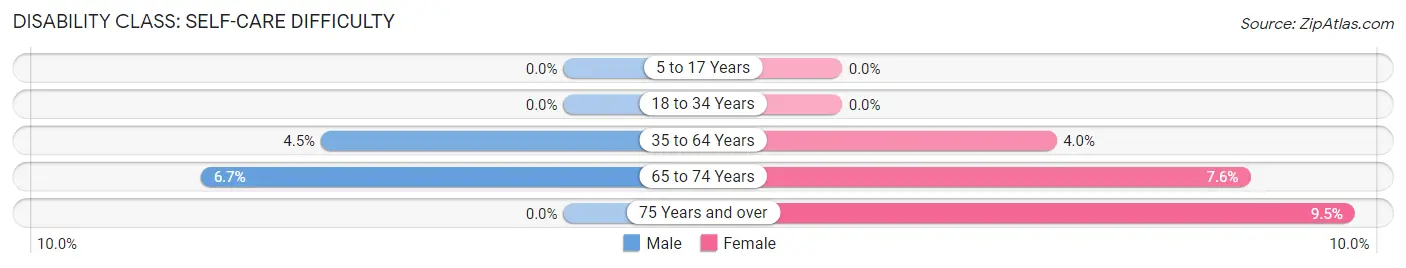
| Age Bracket | Male | Female |
| 5 to 17 Years | 0 (0.0%) | 0 (0.0%) |
| 18 to 34 Years | 0 (0.0%) | 0 (0.0%) |
| 35 to 64 Years | 9 (4.5%) | 8 (4.0%) |
| 65 to 74 Years | 7 (6.7%) | 10 (7.6%) |
| 75 Years and over | 0 (0.0%) | 8 (9.5%) |
Technology Access in Hawi
Computing Device Access in Hawi
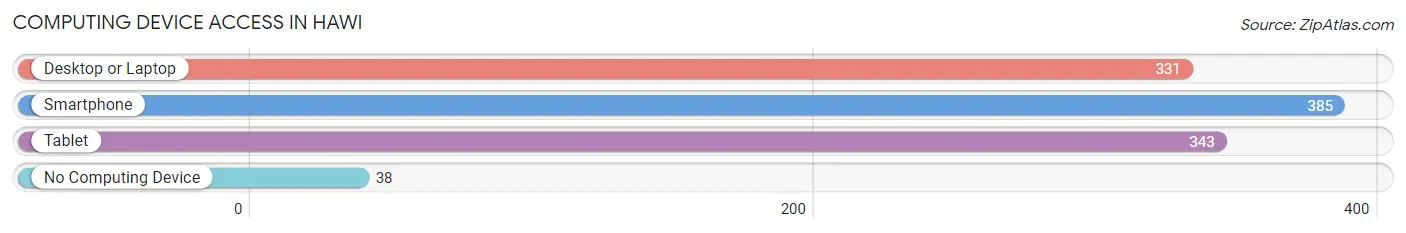
| Device Type | # Households | % Households |
| Desktop or Laptop | 331 | 72.8% |
| Smartphone | 385 | 84.6% |
| Tablet | 343 | 75.4% |
| No Computing Device | 38 | 8.4% |
| Total | 455 | 100.0% |
Internet Access in Hawi
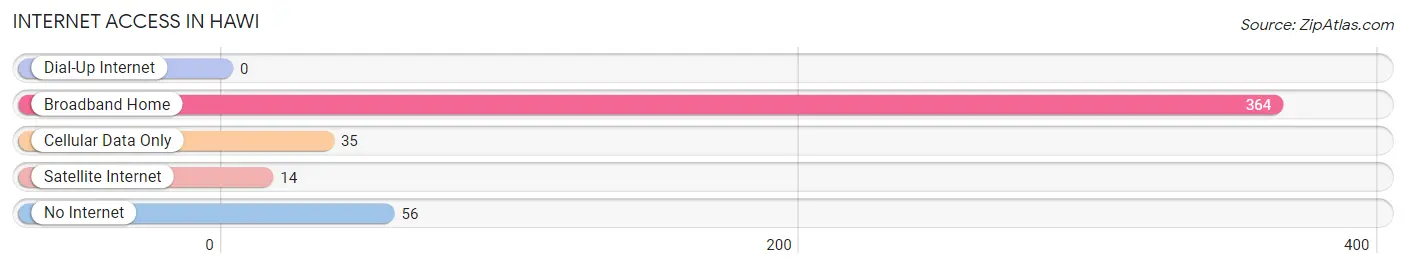
| Internet Type | # Households | % Households |
| Dial-Up Internet | 0 | 0.0% |
| Broadband Home | 364 | 80.0% |
| Cellular Data Only | 35 | 7.7% |
| Satellite Internet | 14 | 3.1% |
| No Internet | 56 | 12.3% |
| Total | 455 | 100.0% |
Hawi Summary
Hawi is a small unincorporated community located in the North Kohala District of the Big Island of Hawaii. It is situated on the northern tip of the island, approximately 20 miles north of the town of Waimea. The population of Hawi was 1,717 as of the 2010 census.
History
Hawi has a long and rich history. It was first settled by Polynesian voyagers in the late 1700s. The area was then known as Kaawaloa, and was a major port of call for whaling ships. In the early 1800s, the area was renamed Hawi, after the Hawaiian word for “wind”.
In the mid-1800s, the area was home to a large sugar plantation. The plantation was owned by the British firm, Castle & Cooke, and was one of the largest in the Hawaiian Islands. The plantation was eventually abandoned in the late 1800s, and the land was divided up among the local Hawaiian families.
In the early 1900s, the area was home to a thriving cattle ranching industry. The ranching industry was eventually replaced by the pineapple industry in the mid-1900s. The pineapple industry was eventually replaced by the macadamia nut industry in the late 1900s.
Geography
Hawi is located on the northern tip of the Big Island of Hawaii. It is situated on the slopes of Mauna Kea, the highest mountain in the Hawaiian Islands. The area is characterized by rolling hills, lush vegetation, and stunning views of the Pacific Ocean.
The climate in Hawi is tropical and humid. The average temperature is around 75 degrees Fahrenheit, with temperatures rarely dropping below 65 degrees Fahrenheit. The area receives an average of about 50 inches of rain per year.
Economy
The economy of Hawi is largely based on agriculture and tourism. The area is home to several macadamia nut farms, as well as a number of small-scale farms that produce a variety of fruits and vegetables.
Tourism is also an important part of the local economy. The area is home to several resorts and hotels, as well as a number of attractions, such as the historic Hawi Town and the nearby Pololu Valley.
Demographics
As of the 2010 census, the population of Hawi was 1,717. The racial makeup of the town was 79.3% White, 0.3% African American, 0.2% Native American, 0.2% Asian, 0.1% Pacific Islander, 0.1% from other races, and 19.8% from two or more races.
The median household income in Hawi was $50,000, and the median family income was $54,000. The per capita income was $25,000. About 10.3% of the population was below the poverty line.
Conclusion
Hawi is a small unincorporated community located on the northern tip of the Big Island of Hawaii. It has a long and rich history, and is home to a variety of agricultural and tourism-based industries. The population of Hawi was 1,717 as of the 2010 census, and the median household income was $50,000. Hawi is a beautiful and unique place to visit, and is a great place to experience the culture and history of the Hawaiian Islands.
Common Questions
What is Per Capita Income in Hawi?
Per Capita income in Hawi is $36,445.
What is the Median Family Income in Hawi?
Median Family Income in Hawi is $74,828.
What is the Median Household income in Hawi?
Median Household Income in Hawi is $77,589.
What is Income or Wage Gap in Hawi?
Income or Wage Gap in Hawi is 20.1%.
Women in Hawi earn 79.9 cents for every dollar earned by a man.
What is Family Income Deficit in Hawi?
Family Income Deficit in Hawi is $6,130.
Families that are below poverty line in Hawi earn $6,130 less on average than the poverty threshold level.
What is Inequality or Gini Index in Hawi?
Inequality or Gini Index in Hawi is 0.37.
What is the Total Population of Hawi?
Total Population of Hawi is 1,383.
What is the Total Male Population of Hawi?
Total Male Population of Hawi is 593.
What is the Total Female Population of Hawi?
Total Female Population of Hawi is 790.
What is the Ratio of Males per 100 Females in Hawi?
There are 75.06 Males per 100 Females in Hawi.
What is the Ratio of Females per 100 Males in Hawi?
There are 133.22 Females per 100 Males in Hawi.
What is the Median Population Age in Hawi?
Median Population Age in Hawi is 44.0 Years.
What is the Average Family Size in Hawi
Average Family Size in Hawi is 3.5 People.
What is the Average Household Size in Hawi
Average Household Size in Hawi is 3.0 People.
How Large is the Labor Force in Hawi?
There are 710 People in the Labor Forcein in Hawi.
What is the Percentage of People in the Labor Force in Hawi?
63.1% of People are in the Labor Force in Hawi.
What is the Unemployment Rate in Hawi?
Unemployment Rate in Hawi is 13.7%.