Kaumakani, HI Map & Demographics
Kaumakani Map
Kaumakani Overview
$27,877
PER CAPITA INCOME
$80,804
AVG FAMILY INCOME
$82,652
AVG HOUSEHOLD INCOME
26.6%
WAGE / INCOME GAP [ % ]
73.4¢/ $1
WAGE / INCOME GAP [ $ ]
0.39
INEQUALITY / GINI INDEX
1,498
TOTAL POPULATION
883
MALE POPULATION
615
FEMALE POPULATION
143.58
MALES / 100 FEMALES
69.65
FEMALES / 100 MALES
39.5
MEDIAN AGE
4.8
AVG FAMILY SIZE
5.0
AVG HOUSEHOLD SIZE
853
LABOR FORCE [ PEOPLE ]
69.1%
PERCENT IN LABOR FORCE
1.9%
UNEMPLOYMENT RATE
Kaumakani Zip Codes
Kaumakani Area Codes
Income in Kaumakani
Income Overview in Kaumakani
Per Capita Income in Kaumakani is $27,877, while median incomes of families and households are $80,804 and $82,652 respectively.
| Characteristic | Number | Measure |
| Per Capita Income | 1,498 | $27,877 |
| Median Family Income | 272 | $80,804 |
| Mean Family Income | 272 | $98,106 |
| Median Household Income | 302 | $82,652 |
| Mean Household Income | 302 | $115,371 |
| Income Deficit | 272 | $0 |
| Wage / Income Gap (%) | 1,498 | 26.62% |
| Wage / Income Gap ($) | 1,498 | 73.38¢ per $1 |
| Gini / Inequality Index | 1,498 | 0.39 |
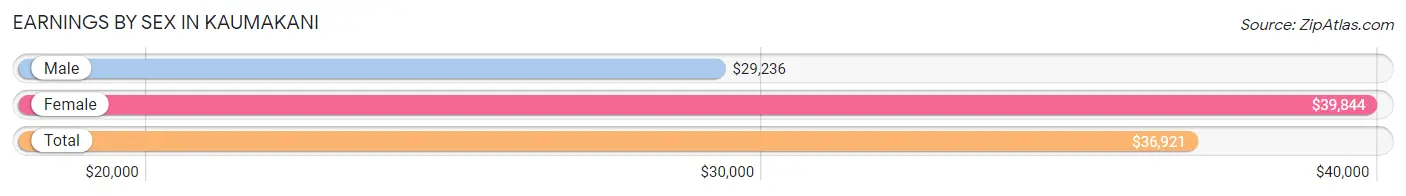
Earnings by Sex in Kaumakani
Average Earnings in Kaumakani are $36,921, $29,236 for men and $39,844 for women, a difference of 26.6%.
| Sex | Number | Average Earnings |
| Male | 453 (53.6%) | $29,236 |
| Female | 392 (46.4%) | $39,844 |
| Total | 845 (100.0%) | $36,921 |
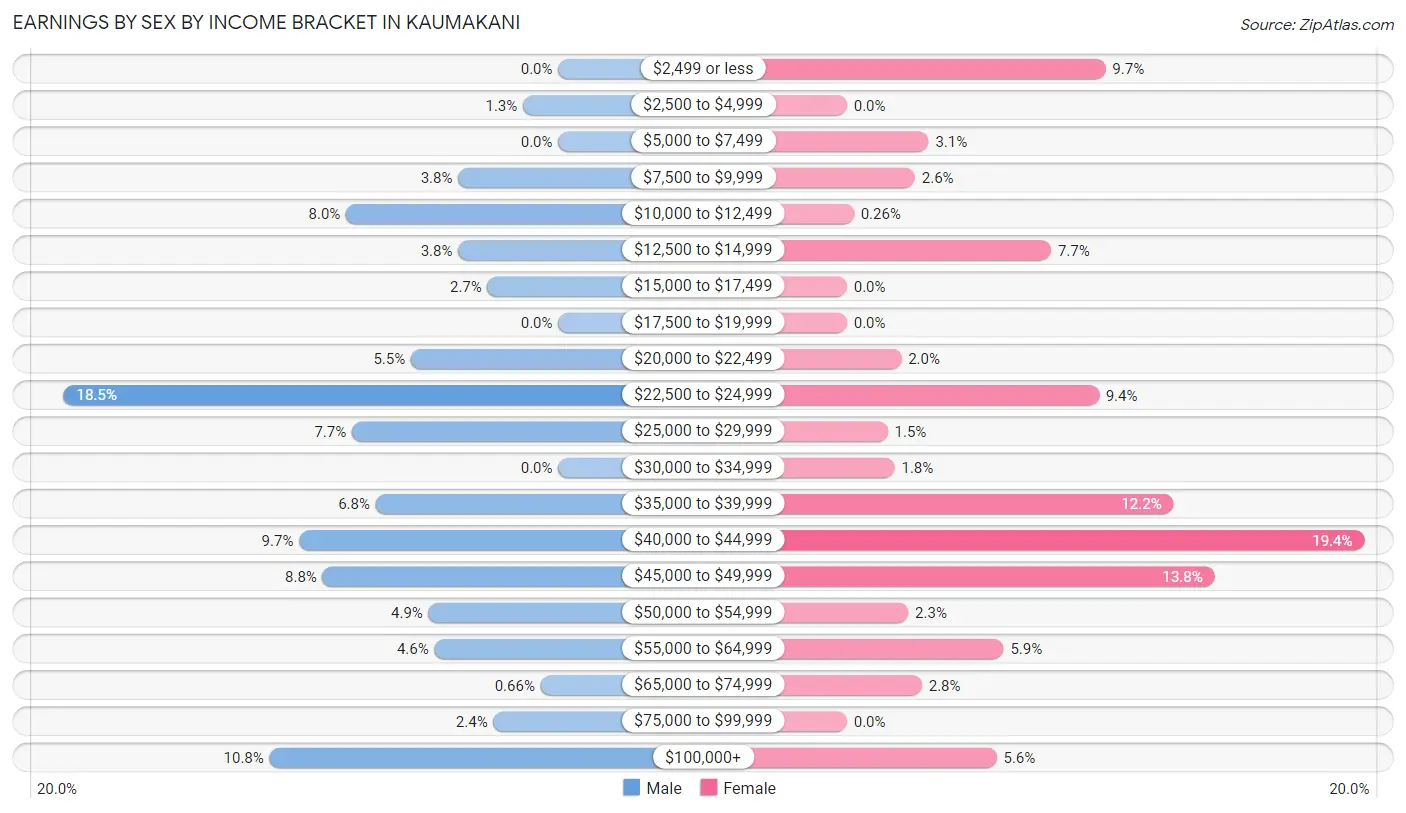
Earnings by Sex by Income Bracket in Kaumakani
The most common earnings brackets in Kaumakani are $22,500 to $24,999 for men (84 | 18.5%) and $40,000 to $44,999 for women (76 | 19.4%).
| Income | Male | Female |
| $2,499 or less | 0 (0.0%) | 38 (9.7%) |
| $2,500 to $4,999 | 6 (1.3%) | 0 (0.0%) |
| $5,000 to $7,499 | 0 (0.0%) | 12 (3.1%) |
| $7,500 to $9,999 | 17 (3.7%) | 10 (2.5%) |
| $10,000 to $12,499 | 36 (8.0%) | 1 (0.3%) |
| $12,500 to $14,999 | 17 (3.7%) | 30 (7.6%) |
| $15,000 to $17,499 | 12 (2.6%) | 0 (0.0%) |
| $17,500 to $19,999 | 0 (0.0%) | 0 (0.0%) |
| $20,000 to $22,499 | 25 (5.5%) | 8 (2.0%) |
| $22,500 to $24,999 | 84 (18.5%) | 37 (9.4%) |
| $25,000 to $29,999 | 35 (7.7%) | 6 (1.5%) |
| $30,000 to $34,999 | 0 (0.0%) | 7 (1.8%) |
| $35,000 to $39,999 | 31 (6.8%) | 48 (12.2%) |
| $40,000 to $44,999 | 44 (9.7%) | 76 (19.4%) |
| $45,000 to $49,999 | 40 (8.8%) | 54 (13.8%) |
| $50,000 to $54,999 | 22 (4.9%) | 9 (2.3%) |
| $55,000 to $64,999 | 21 (4.6%) | 23 (5.9%) |
| $65,000 to $74,999 | 3 (0.7%) | 11 (2.8%) |
| $75,000 to $99,999 | 11 (2.4%) | 0 (0.0%) |
| $100,000+ | 49 (10.8%) | 22 (5.6%) |
| Total | 453 (100.0%) | 392 (100.0%) |
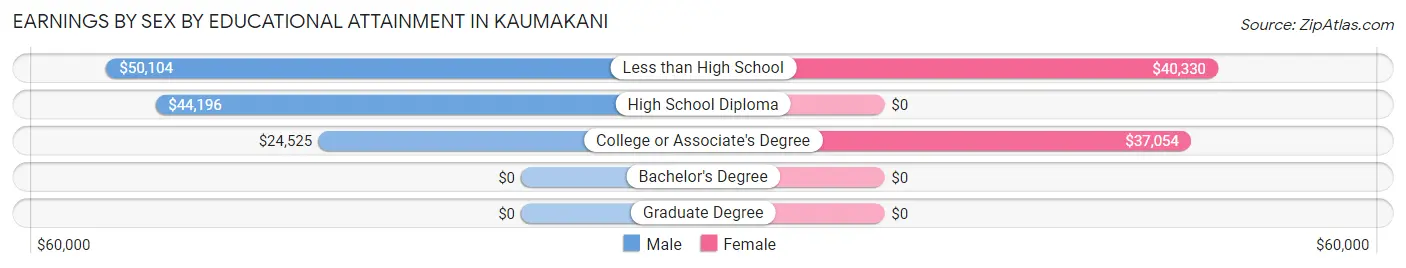
Earnings by Sex by Educational Attainment in Kaumakani
Average earnings in Kaumakani are $39,722 for men and $40,082 for women, a difference of 0.9%. Men with an educational attainment of less than high school enjoy the highest average annual earnings of $50,104, while those with college or associate's degree education earn the least with $24,525. Women with an educational attainment of less than high school earn the most with the average annual earnings of $40,330, while those with college or associate's degree education have the smallest earnings of $37,054.
| Educational Attainment | Male Income | Female Income |
| Less than High School | $50,104 | $40,330 |
| High School Diploma | $44,196 | $0 |
| College or Associate's Degree | $24,525 | $37,054 |
| Bachelor's Degree | - | - |
| Graduate Degree | - | - |
| Total | $39,722 | $40,082 |
Family Income in Kaumakani
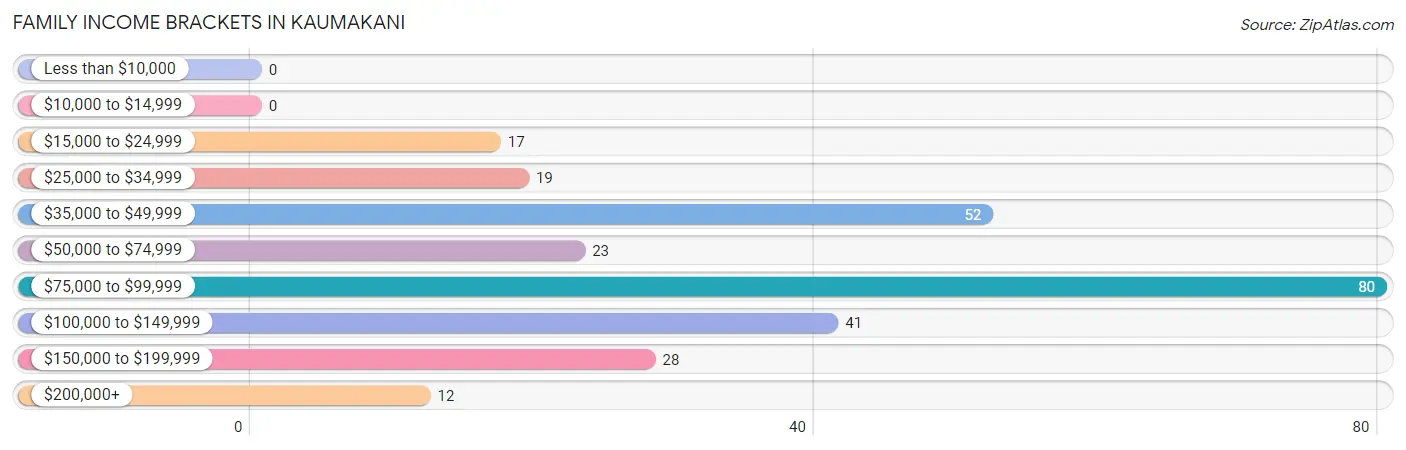
Family Income Brackets in Kaumakani
According to the Kaumakani family income data, there are 80 families falling into the $75,000 to $99,999 income range, which is the most common income bracket and makes up 29.4% of all families.
| Income Bracket | # Families | % Families |
| Less than $10,000 | 0 | 0.0% |
| $10,000 to $14,999 | 0 | 0.0% |
| $15,000 to $24,999 | 17 | 6.3% |
| $25,000 to $34,999 | 19 | 7.0% |
| $35,000 to $49,999 | 52 | 19.1% |
| $50,000 to $74,999 | 23 | 8.5% |
| $75,000 to $99,999 | 80 | 29.4% |
| $100,000 to $149,999 | 41 | 15.1% |
| $150,000 to $199,999 | 28 | 10.3% |
| $200,000+ | 12 | 4.4% |
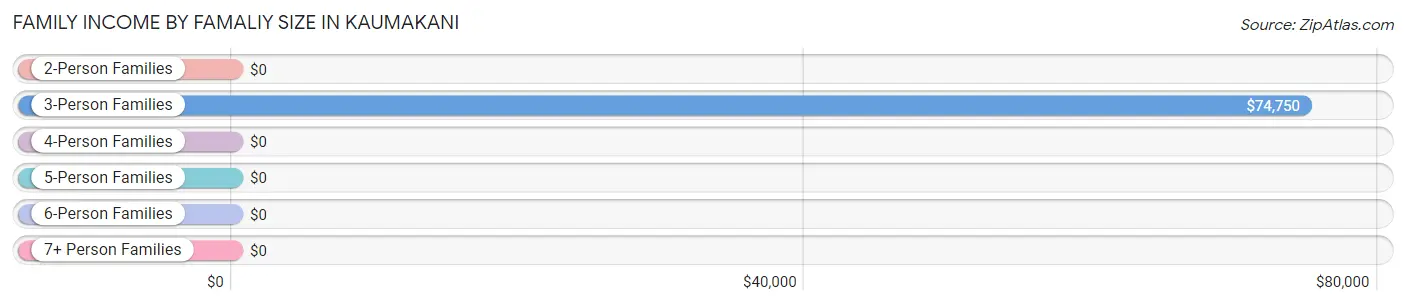
Family Income by Famaliy Size in Kaumakani
3-person families (59 | 21.7%) account for the highest median family income in Kaumakani with $74,750 per family, while 3-person families (59 | 21.7%) have the highest median income of $24,917 per family member.
| Income Bracket | # Families | Median Income |
| 2-Person Families | 58 (21.3%) | $0 |
| 3-Person Families | 59 (21.7%) | $74,750 |
| 4-Person Families | 82 (30.1%) | $0 |
| 5-Person Families | 11 (4.0%) | $0 |
| 6-Person Families | 6 (2.2%) | $0 |
| 7+ Person Families | 56 (20.6%) | $0 |
| Total | 272 (100.0%) | $80,804 |
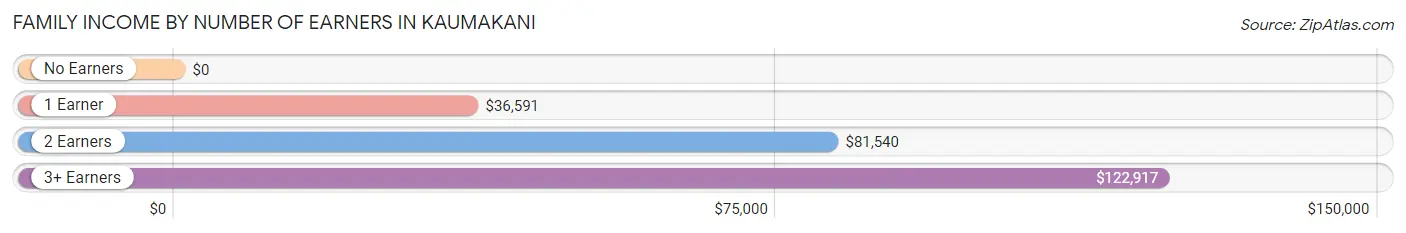
Family Income by Number of Earners in Kaumakani
| Number of Earners | # Families | Median Income |
| No Earners | 0 (0.0%) | $0 |
| 1 Earner | 80 (29.4%) | $36,591 |
| 2 Earners | 141 (51.8%) | $81,540 |
| 3+ Earners | 51 (18.8%) | $122,917 |
| Total | 272 (100.0%) | $80,804 |
Household Income in Kaumakani
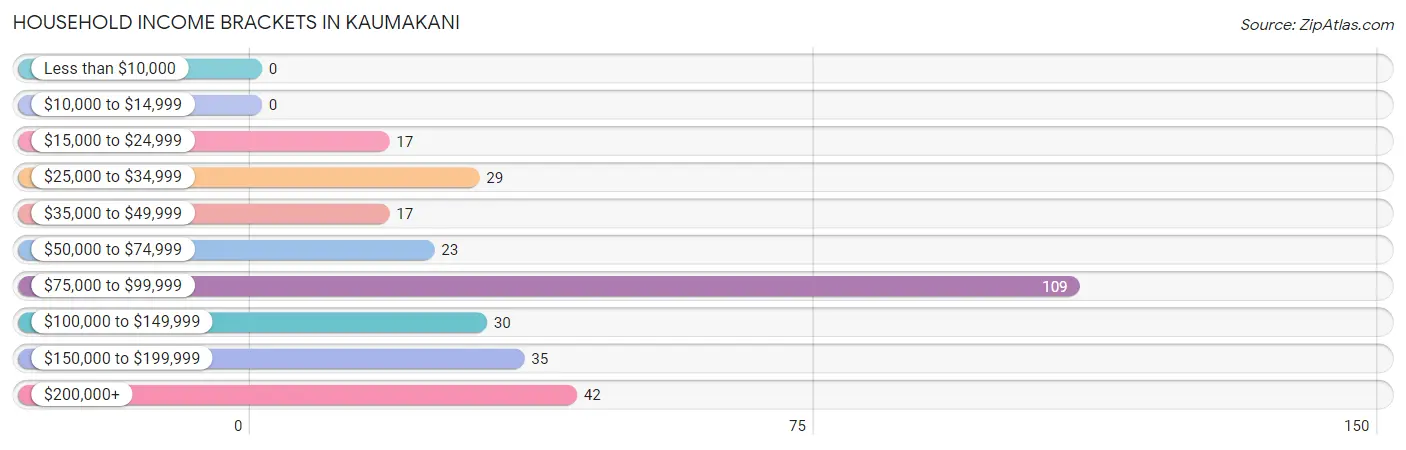
Household Income Brackets in Kaumakani
With 109 households falling in the category, the $75,000 to $99,999 income range is the most frequent in Kaumakani, accounting for 36.1% of all households.
| Income Bracket | # Households | % Households |
| Less than $10,000 | 0 | 0.0% |
| $10,000 to $14,999 | 0 | 0.0% |
| $15,000 to $24,999 | 17 | 5.6% |
| $25,000 to $34,999 | 29 | 9.6% |
| $35,000 to $49,999 | 17 | 5.6% |
| $50,000 to $74,999 | 23 | 7.6% |
| $75,000 to $99,999 | 109 | 36.1% |
| $100,000 to $149,999 | 30 | 9.9% |
| $150,000 to $199,999 | 35 | 11.6% |
| $200,000+ | 42 | 13.9% |
Household Income by Householder Age in Kaumakani
The median household income in Kaumakani is $82,652, with the highest median household income of $94,583 found in the 25 to 44 years age bracket for the primary householder. A total of 106 households (35.1%) fall into this category.
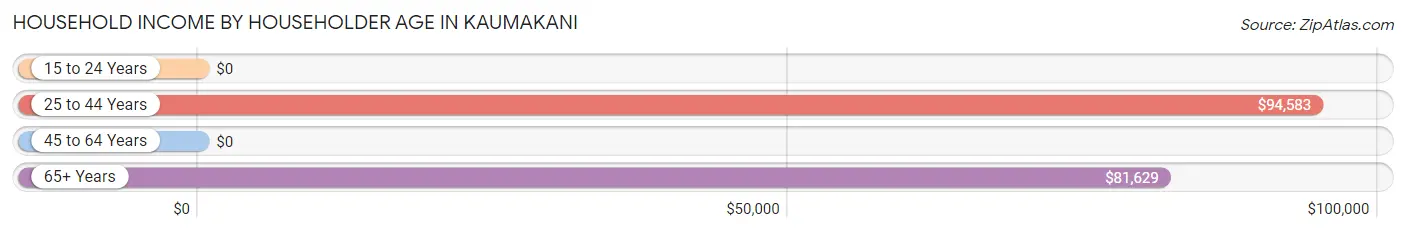
| Income Bracket | # Households | Median Income |
| 15 to 24 Years | 0 (0.0%) | $0 |
| 25 to 44 Years | 106 (35.1%) | $94,583 |
| 45 to 64 Years | 91 (30.1%) | $0 |
| 65+ Years | 105 (34.8%) | $81,629 |
| Total | 302 (100.0%) | $82,652 |
Poverty in Kaumakani
Income Below Poverty by Sex and Age in Kaumakani
With 6.5% poverty level for males and 13.8% for females among the residents of Kaumakani, 16 and 17 year old males and 12 to 14 year old females are the most vulnerable to poverty, with 40 males (42.1%) and 49 females (70.0%) in their respective age groups living below the poverty level.
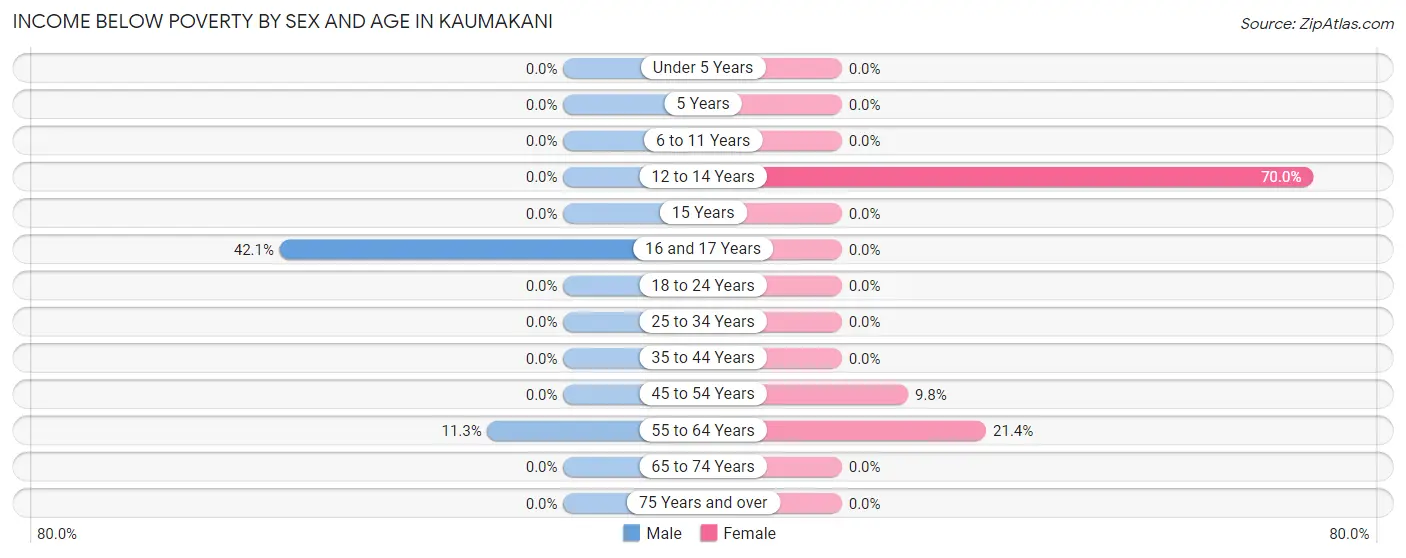
| Age Bracket | Male | Female |
| Under 5 Years | 0 (0.0%) | 0 (0.0%) |
| 5 Years | 0 (0.0%) | 0 (0.0%) |
| 6 to 11 Years | 0 (0.0%) | 0 (0.0%) |
| 12 to 14 Years | 0 (0.0%) | 49 (70.0%) |
| 15 Years | 0 (0.0%) | 0 (0.0%) |
| 16 and 17 Years | 40 (42.1%) | 0 (0.0%) |
| 18 to 24 Years | 0 (0.0%) | 0 (0.0%) |
| 25 to 34 Years | 0 (0.0%) | 0 (0.0%) |
| 35 to 44 Years | 0 (0.0%) | 0 (0.0%) |
| 45 to 54 Years | 0 (0.0%) | 6 (9.8%) |
| 55 to 64 Years | 17 (11.3%) | 30 (21.4%) |
| 65 to 74 Years | 0 (0.0%) | 0 (0.0%) |
| 75 Years and over | 0 (0.0%) | 0 (0.0%) |
| Total | 57 (6.5%) | 85 (13.8%) |
Income Above Poverty by Sex and Age in Kaumakani
According to the poverty statistics in Kaumakani, males aged under 5 years and females aged under 5 years are the age groups that are most secure financially, with 100.0% of males and 100.0% of females in these age groups living above the poverty line.
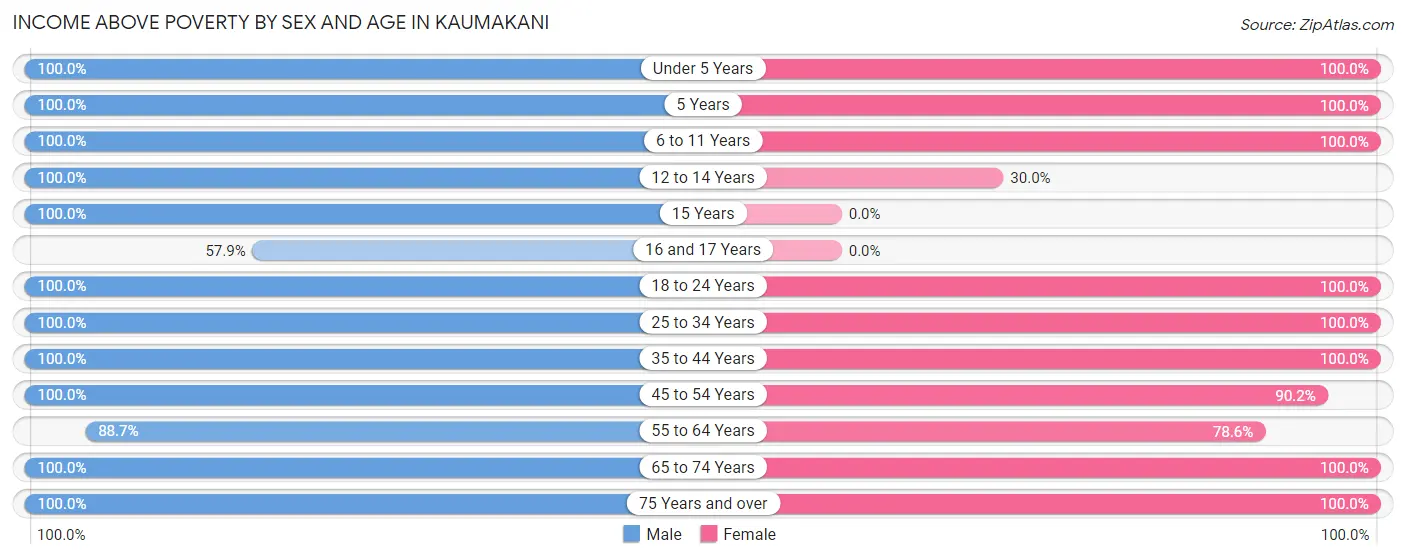
| Age Bracket | Male | Female |
| Under 5 Years | 18 (100.0%) | 18 (100.0%) |
| 5 Years | 7 (100.0%) | 7 (100.0%) |
| 6 to 11 Years | 36 (100.0%) | 34 (100.0%) |
| 12 to 14 Years | 27 (100.0%) | 21 (30.0%) |
| 15 Years | 46 (100.0%) | 0 (0.0%) |
| 16 and 17 Years | 55 (57.9%) | 0 (0.0%) |
| 18 to 24 Years | 166 (100.0%) | 25 (100.0%) |
| 25 to 34 Years | 66 (100.0%) | 57 (100.0%) |
| 35 to 44 Years | 83 (100.0%) | 72 (100.0%) |
| 45 to 54 Years | 38 (100.0%) | 55 (90.2%) |
| 55 to 64 Years | 134 (88.7%) | 110 (78.6%) |
| 65 to 74 Years | 53 (100.0%) | 53 (100.0%) |
| 75 Years and over | 97 (100.0%) | 78 (100.0%) |
| Total | 826 (93.5%) | 530 (86.2%) |
Income Below Poverty Among Married-Couple Families in Kaumakani
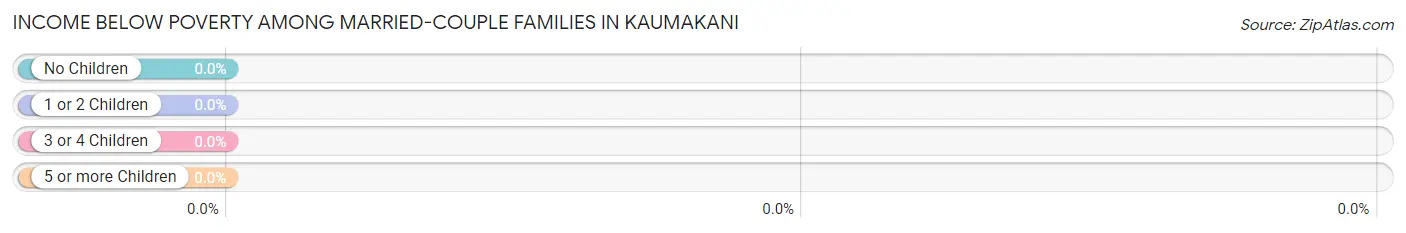
| Children | Above Poverty | Below Poverty |
| No Children | 58 (100.0%) | 0 (0.0%) |
| 1 or 2 Children | 88 (100.0%) | 0 (0.0%) |
| 3 or 4 Children | 0 (0.0%) | 0 (0.0%) |
| 5 or more Children | 0 (0.0%) | 0 (0.0%) |
| Total | 146 (100.0%) | 0 (0.0%) |
Income Below Poverty Among Single-Parent Households in Kaumakani
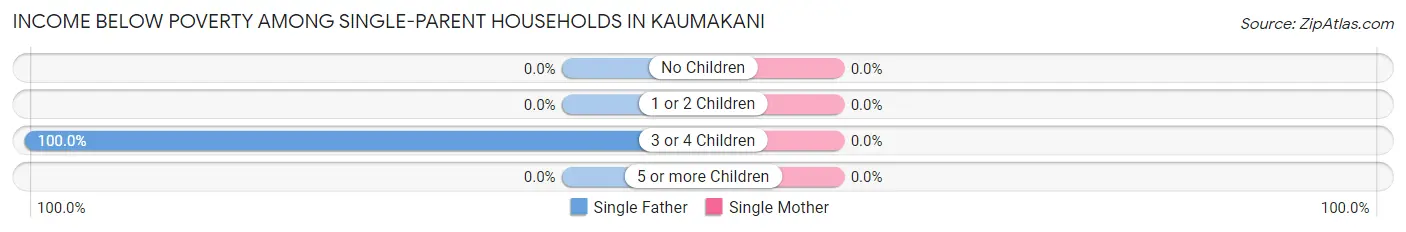
| Children | Single Father | Single Mother |
| No Children | 0 (0.0%) | 0 (0.0%) |
| 1 or 2 Children | 0 (0.0%) | 0 (0.0%) |
| 3 or 4 Children | 17 (100.0%) | 0 (0.0%) |
| 5 or more Children | 0 (0.0%) | 0 (0.0%) |
| Total | 17 (25.0%) | 0 (0.0%) |
Income Below Poverty Among Married-Couple vs Single-Parent Households in Kaumakani
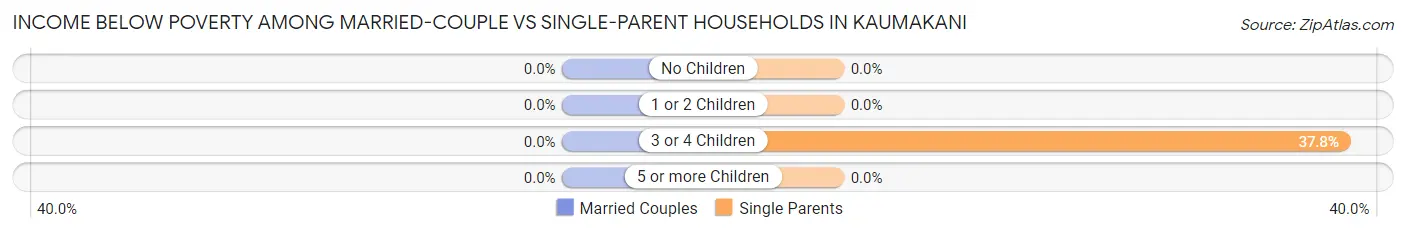
| Children | Married-Couple Families | Single-Parent Households |
| No Children | 0 (0.0%) | 0 (0.0%) |
| 1 or 2 Children | 0 (0.0%) | 0 (0.0%) |
| 3 or 4 Children | 0 (0.0%) | 17 (37.8%) |
| 5 or more Children | 0 (0.0%) | 0 (0.0%) |
| Total | 0 (0.0%) | 17 (13.5%) |
Race in Kaumakani
The most populous races in Kaumakani are Asian (1,275 | 85.1%), Two or more Races (143 | 9.6%), and Hawaiian / Pacific (59 | 3.9%).
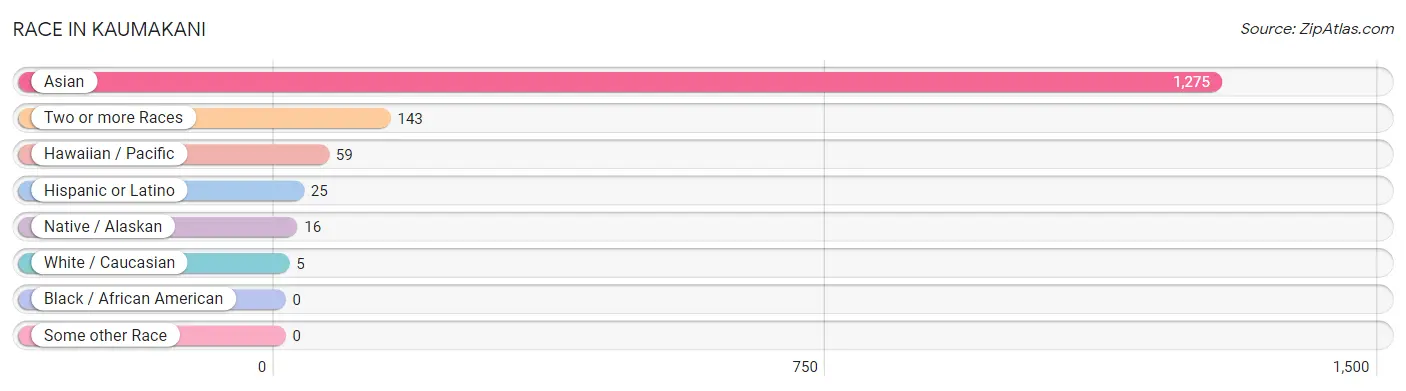
| Race | # Population | % Population |
| Asian | 1,275 | 85.1% |
| Black / African American | 0 | 0.0% |
| Hawaiian / Pacific | 59 | 3.9% |
| Hispanic or Latino | 25 | 1.7% |
| Native / Alaskan | 16 | 1.1% |
| White / Caucasian | 5 | 0.3% |
| Two or more Races | 143 | 9.6% |
| Some other Race | 0 | 0.0% |
| Total | 1,498 | 100.0% |
Ancestry in Kaumakani
The most populous ancestries reported in Kaumakani are Korean (1,368 | 91.3%), Native Hawaiian (114 | 7.6%), Bhutanese (60 | 4.0%), Portuguese (54 | 3.6%), and Italian (37 | 2.5%), together accounting for 109.0% of all Kaumakani residents.
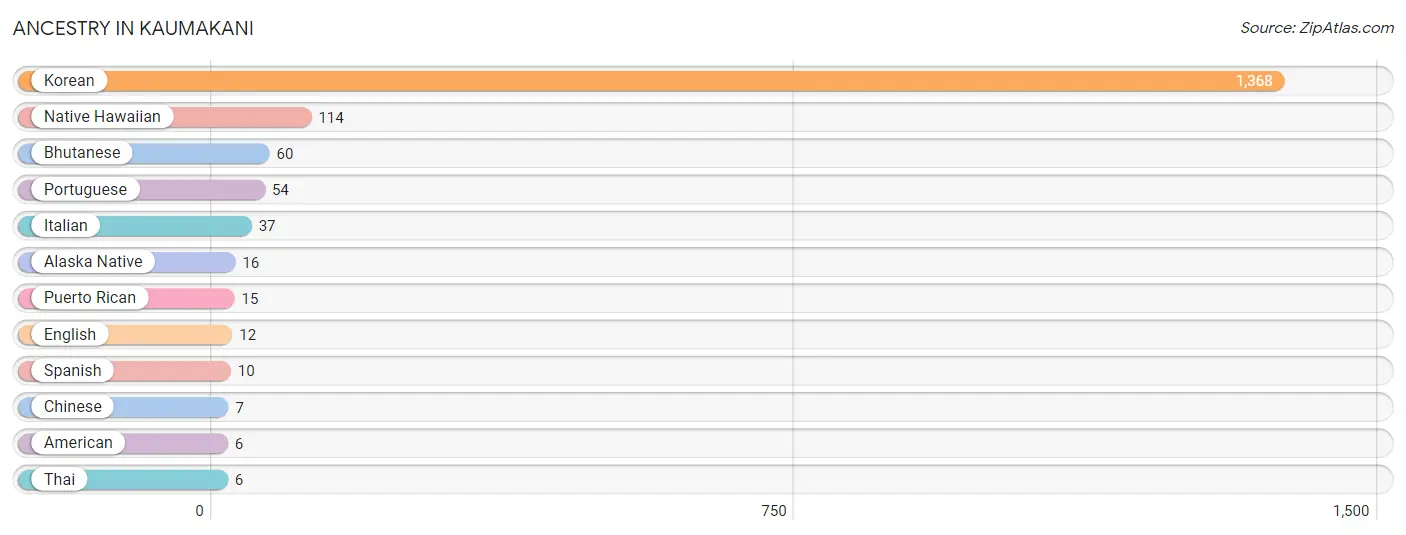
| Ancestry | # Population | % Population |
| Alaska Native | 16 | 1.1% |
| American | 6 | 0.4% |
| Bhutanese | 60 | 4.0% |
| Chinese | 7 | 0.5% |
| English | 12 | 0.8% |
| Italian | 37 | 2.5% |
| Korean | 1,368 | 91.3% |
| Native Hawaiian | 114 | 7.6% |
| Portuguese | 54 | 3.6% |
| Puerto Rican | 15 | 1.0% |
| Spanish | 10 | 0.7% |
| Thai | 6 | 0.4% | View All 12 Rows |
Immigrants in Kaumakani
The most numerous immigrant groups reported in Kaumakani came from Asia (999 | 66.7%), Philippines (999 | 66.7%), and South Eastern Asia (999 | 66.7%), together accounting for 200.1% of all Kaumakani residents.
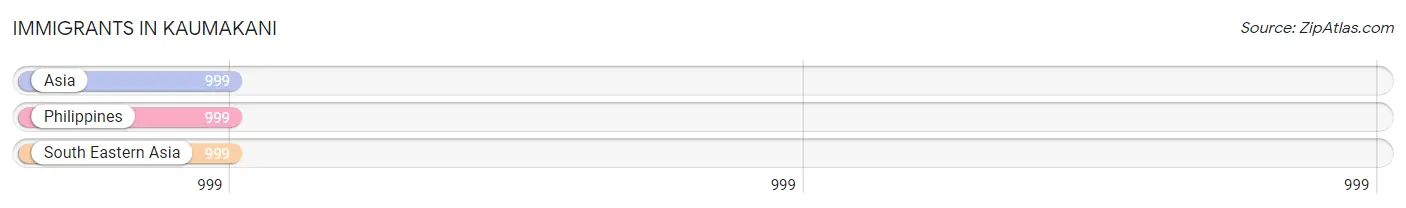
| Immigration Origin | # Population | % Population |
| Asia | 999 | 66.7% |
| Philippines | 999 | 66.7% |
| South Eastern Asia | 999 | 66.7% | View All 3 Rows |
Sex and Age in Kaumakani
Sex and Age in Kaumakani
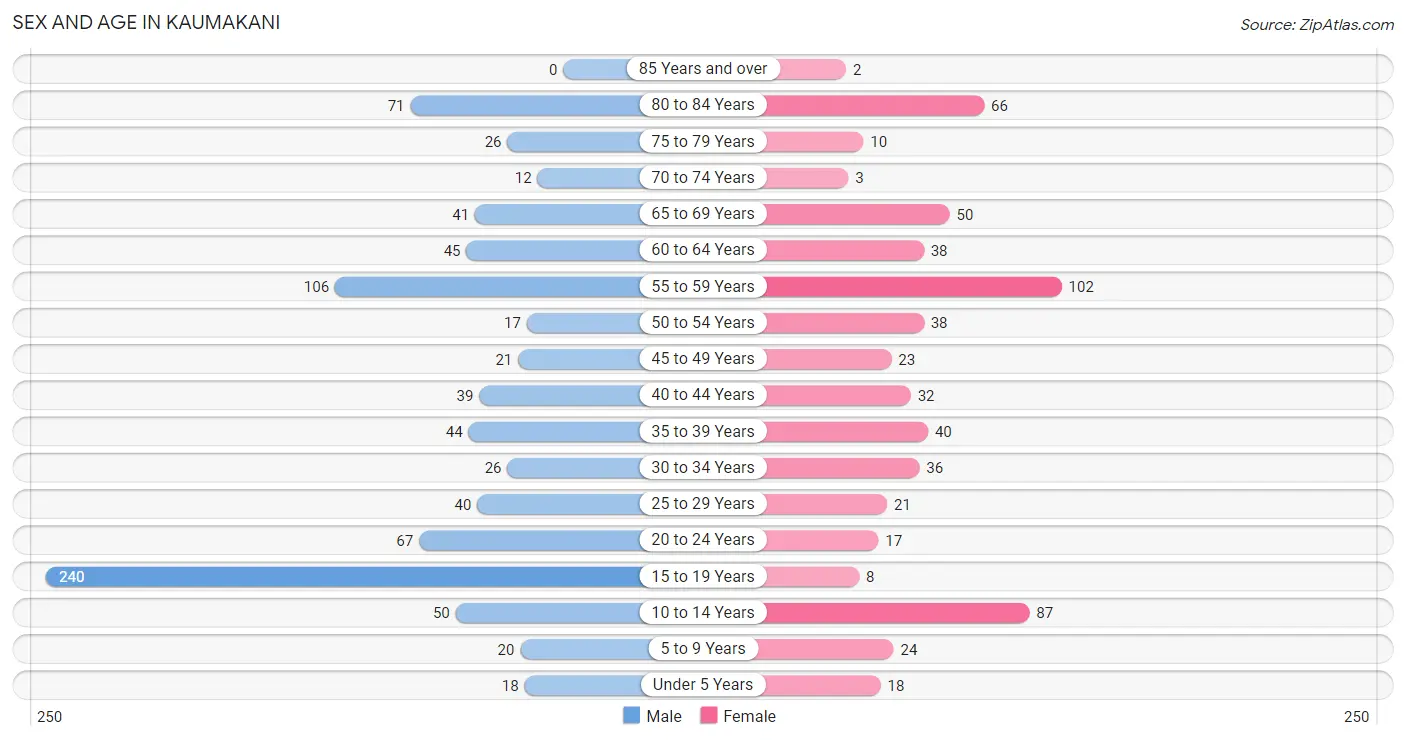
The most populous age groups in Kaumakani are 15 to 19 Years (240 | 27.2%) for men and 55 to 59 Years (102 | 16.6%) for women.
| Age Bracket | Male | Female |
| Under 5 Years | 18 (2.0%) | 18 (2.9%) |
| 5 to 9 Years | 20 (2.3%) | 24 (3.9%) |
| 10 to 14 Years | 50 (5.7%) | 87 (14.1%) |
| 15 to 19 Years | 240 (27.2%) | 8 (1.3%) |
| 20 to 24 Years | 67 (7.6%) | 17 (2.8%) |
| 25 to 29 Years | 40 (4.5%) | 21 (3.4%) |
| 30 to 34 Years | 26 (2.9%) | 36 (5.9%) |
| 35 to 39 Years | 44 (5.0%) | 40 (6.5%) |
| 40 to 44 Years | 39 (4.4%) | 32 (5.2%) |
| 45 to 49 Years | 21 (2.4%) | 23 (3.7%) |
| 50 to 54 Years | 17 (1.9%) | 38 (6.2%) |
| 55 to 59 Years | 106 (12.0%) | 102 (16.6%) |
| 60 to 64 Years | 45 (5.1%) | 38 (6.2%) |
| 65 to 69 Years | 41 (4.6%) | 50 (8.1%) |
| 70 to 74 Years | 12 (1.4%) | 3 (0.5%) |
| 75 to 79 Years | 26 (2.9%) | 10 (1.6%) |
| 80 to 84 Years | 71 (8.0%) | 66 (10.7%) |
| 85 Years and over | 0 (0.0%) | 2 (0.3%) |
| Total | 883 (100.0%) | 615 (100.0%) |
Families and Households in Kaumakani
Median Family Size in Kaumakani
The median family size in Kaumakani is 4.82 persons per family, with married-couple families (146 | 53.7%) accounting for the largest median family size of 5.41 persons per family. On the other hand, single female/mother families (58 | 21.3%) represent the smallest median family size with 3.74 persons per family.
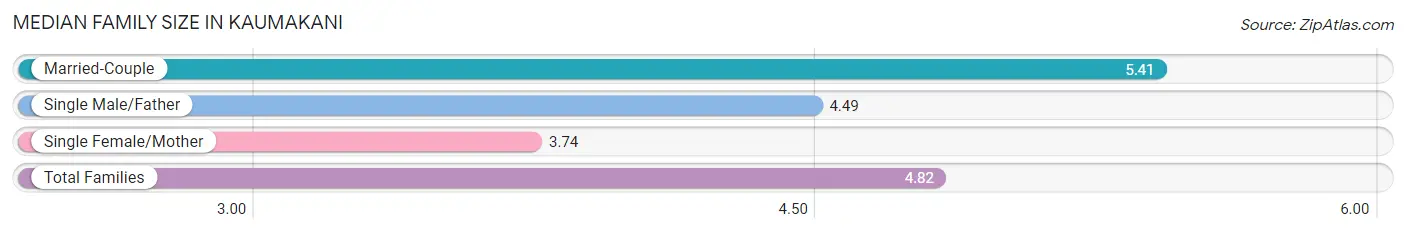
| Family Type | # Families | Family Size |
| Married-Couple | 146 (53.7%) | 5.41 |
| Single Male/Father | 68 (25.0%) | 4.49 |
| Single Female/Mother | 58 (21.3%) | 3.74 |
| Total Families | 272 (100.0%) | 4.82 |
Median Household Size in Kaumakani
The median household size in Kaumakani is 4.96 persons per household, with married-couple households (146 | 48.3%) accounting for the largest median household size of 5.75 persons per household. non-family households (30 | 9.9%) represent the smallest median household size with 1.77 persons per household.
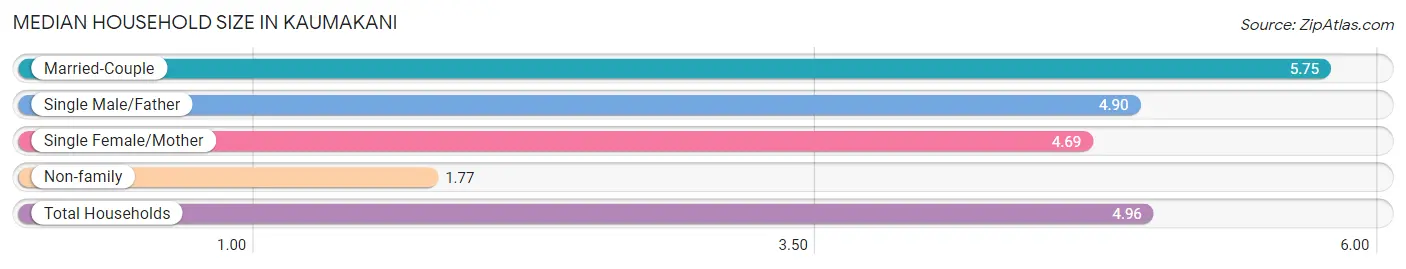
| Household Type | # Households | Household Size |
| Married-Couple | 146 (48.3%) | 5.75 |
| Single Male/Father | 68 (22.5%) | 4.90 |
| Single Female/Mother | 58 (19.2%) | 4.69 |
| Non-family | 30 (9.9%) | 1.77 |
| Total Households | 302 (100.0%) | 4.96 |
Household Size by Marriage Status in Kaumakani
Out of a total of 302 households in Kaumakani, 272 (90.1%) are family households, while 30 (9.9%) are nonfamily households. The most numerous type of family households are 4-person households, comprising 69, and the most common type of nonfamily households are 2-person households, comprising 20.
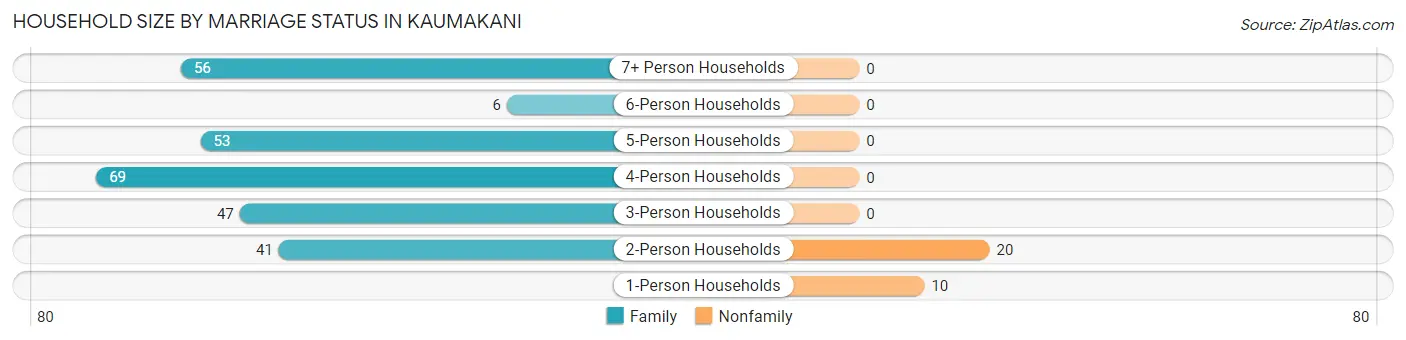
| Household Size | Family Households | Nonfamily Households |
| 1-Person Households | - | 10 (3.3%) |
| 2-Person Households | 41 (13.6%) | 20 (6.6%) |
| 3-Person Households | 47 (15.6%) | 0 (0.0%) |
| 4-Person Households | 69 (22.9%) | 0 (0.0%) |
| 5-Person Households | 53 (17.5%) | 0 (0.0%) |
| 6-Person Households | 6 (2.0%) | 0 (0.0%) |
| 7+ Person Households | 56 (18.5%) | 0 (0.0%) |
| Total | 272 (90.1%) | 30 (9.9%) |
Female Fertility in Kaumakani
Fertility by Age in Kaumakani
Average fertility rate in Kaumakani is 31.0 births per 1,000 women. Women in the age bracket of 35 to 50 years have the highest fertility rate with 54.0 births per 1,000 women. Women in the age bracket of 35 to 50 years acount for 100.0% of all women with births.
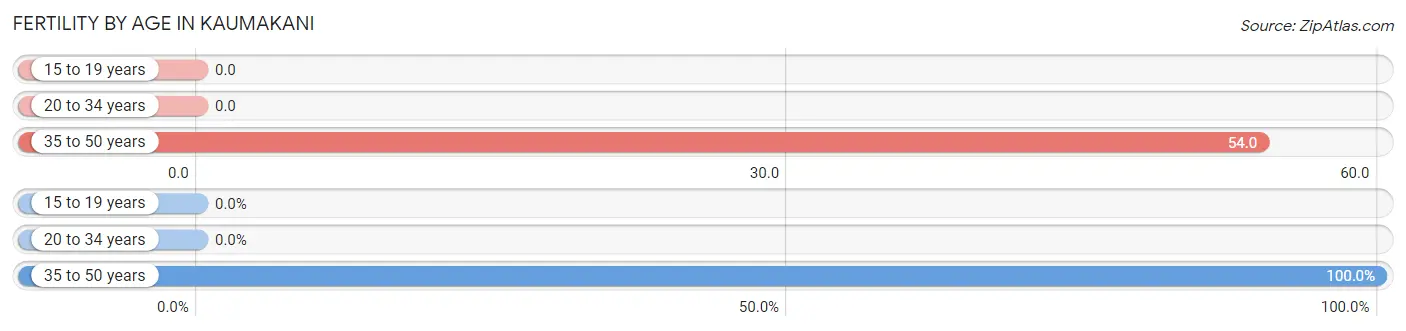
| Age Bracket | Women with Births | Births / 1,000 Women |
| 15 to 19 years | 0 (0.0%) | 0.0 |
| 20 to 34 years | 0 (0.0%) | 0.0 |
| 35 to 50 years | 6 (100.0%) | 54.0 |
| Total | 6 (100.0%) | 31.0 |
Fertility by Age by Marriage Status in Kaumakani
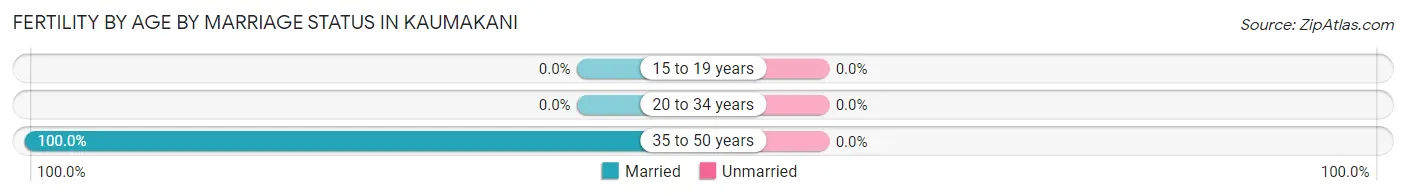
| Age Bracket | Married | Unmarried |
| 15 to 19 years | 0 (0.0%) | 0 (0.0%) |
| 20 to 34 years | 0 (0.0%) | 0 (0.0%) |
| 35 to 50 years | 6 (100.0%) | 0 (0.0%) |
| Total | 6 (100.0%) | 0 (0.0%) |
Fertility by Education in Kaumakani
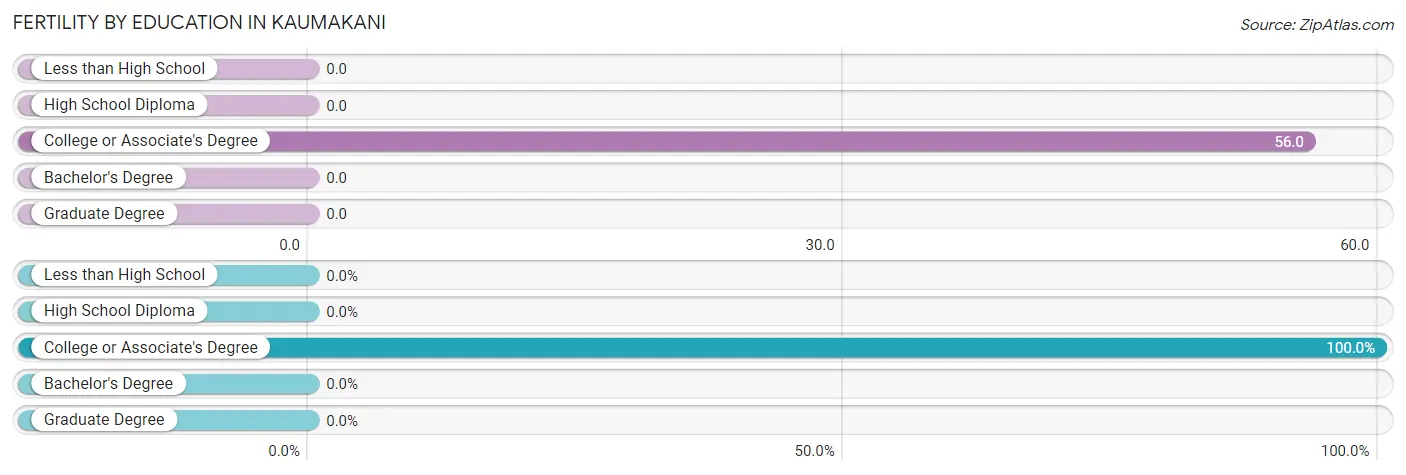
| Educational Attainment | Women with Births | Births / 1,000 Women |
| Less than High School | 0 (0.0%) | 0.0 |
| High School Diploma | 0 (0.0%) | 0.0 |
| College or Associate's Degree | 6 (100.0%) | 56.0 |
| Bachelor's Degree | 0 (0.0%) | 0.0 |
| Graduate Degree | 0 (0.0%) | 0.0 |
| Total | 6 (100.0%) | 31.0 |
Fertility by Education by Marriage Status in Kaumakani
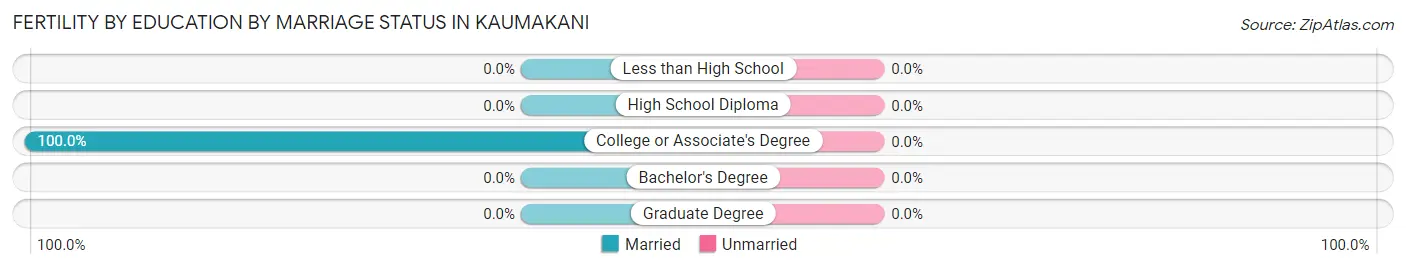
| Educational Attainment | Married | Unmarried |
| Less than High School | 0 (0.0%) | 0 (0.0%) |
| High School Diploma | 0 (0.0%) | 0 (0.0%) |
| College or Associate's Degree | 6 (100.0%) | 0 (0.0%) |
| Bachelor's Degree | 0 (0.0%) | 0 (0.0%) |
| Graduate Degree | 0 (0.0%) | 0 (0.0%) |
| Total | 6 (100.0%) | 0 (0.0%) |
Employment Characteristics in Kaumakani
Employment by Class of Employer in Kaumakani
Among the 820 employed individuals in Kaumakani, private company employees (765 | 93.3%), self-employed (not incorporated) (22 | 2.7%), and not-for-profit organizations (15 | 1.8%) make up the most common classes of employment.
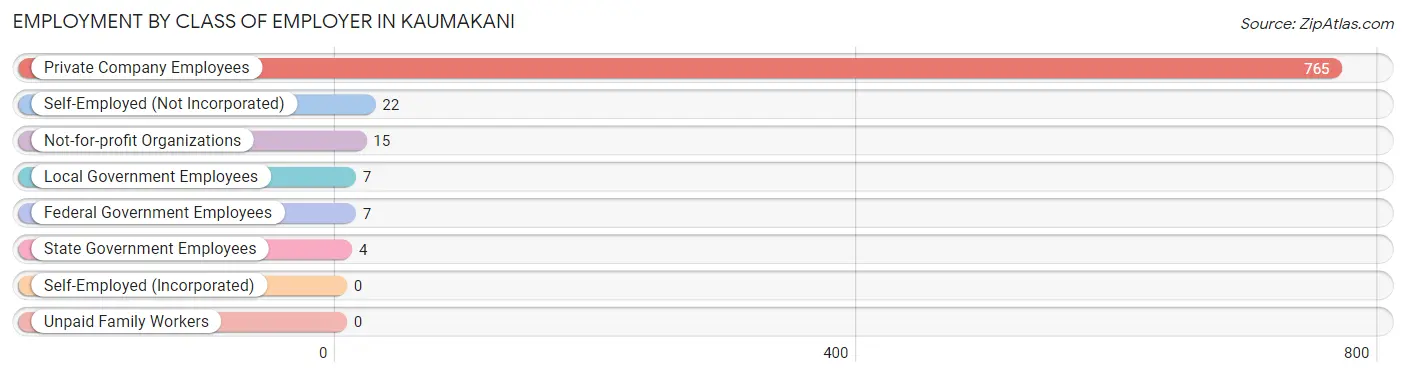
| Employer Class | # Employees | % Employees |
| Private Company Employees | 765 | 93.3% |
| Self-Employed (Incorporated) | 0 | 0.0% |
| Self-Employed (Not Incorporated) | 22 | 2.7% |
| Not-for-profit Organizations | 15 | 1.8% |
| Local Government Employees | 7 | 0.9% |
| State Government Employees | 4 | 0.5% |
| Federal Government Employees | 7 | 0.9% |
| Unpaid Family Workers | 0 | 0.0% |
| Total | 820 | 100.0% |
Employment Status by Age in Kaumakani
According to the labor force statistics for Kaumakani, out of the total population over 16 years of age (1,235), 69.1% or 853 individuals are in the labor force, with 1.9% or 16 of them unemployed. The age group with the highest labor force participation rate is 20 to 24 years, with 100.0% or 84 individuals in the labor force. Within the labor force, the 16 to 19 years age range has the highest percentage of unemployed individuals, with 42.9% or 9 of them being unemployed.
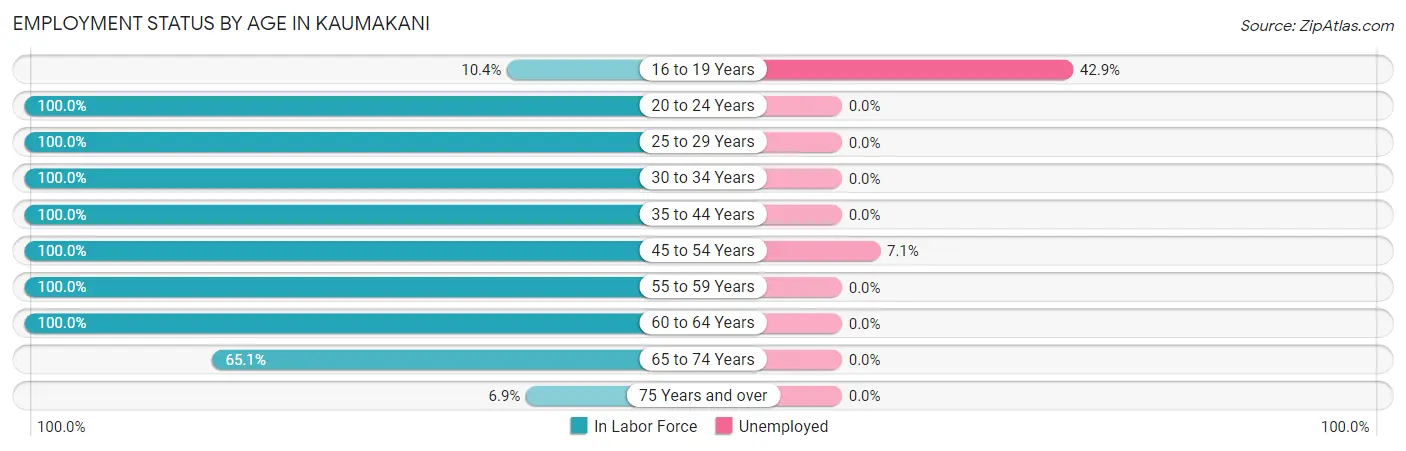
| Age Bracket | In Labor Force | Unemployed |
| 16 to 19 Years | 21 (10.4%) | 9 (42.9%) |
| 20 to 24 Years | 84 (100.0%) | 0 (0.0%) |
| 25 to 29 Years | 61 (100.0%) | 0 (0.0%) |
| 30 to 34 Years | 62 (100.0%) | 0 (0.0%) |
| 35 to 44 Years | 155 (100.0%) | 0 (0.0%) |
| 45 to 54 Years | 99 (100.0%) | 7 (7.1%) |
| 55 to 59 Years | 208 (100.0%) | 0 (0.0%) |
| 60 to 64 Years | 83 (100.0%) | 0 (0.0%) |
| 65 to 74 Years | 69 (65.1%) | 0 (0.0%) |
| 75 Years and over | 12 (6.9%) | 0 (0.0%) |
| Total | 853 (69.1%) | 16 (1.9%) |
Employment Status by Educational Attainment in Kaumakani
According to labor force statistics for Kaumakani, 100.0% of individuals (668) out of the total population between 25 and 64 years of age (668) are in the labor force, with 1.0% or 7 of them being unemployed. The group with the highest labor force participation rate are those with the educational attainment of less than high school, with 100.0% or 133 individuals in the labor force. Within the labor force, individuals with college / associate degree education have the highest percentage of unemployment, with 2.7% or 7 of them being unemployed.
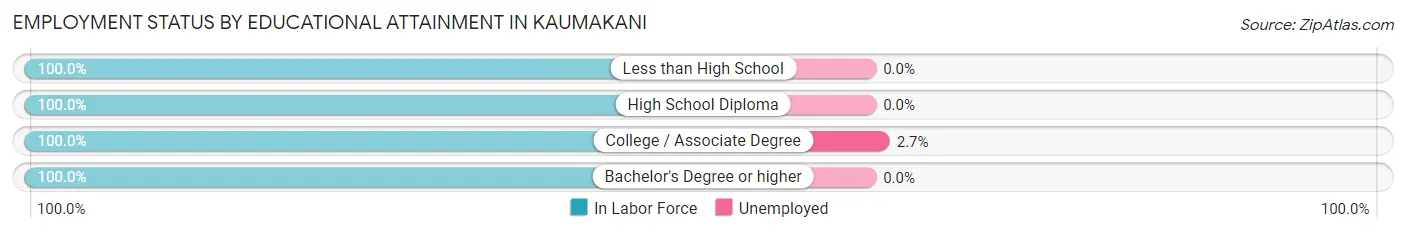
| Educational Attainment | In Labor Force | Unemployed |
| Less than High School | 133 (100.0%) | 0 (0.0%) |
| High School Diploma | 243 (100.0%) | 0 (0.0%) |
| College / Associate Degree | 255 (100.0%) | 7 (2.7%) |
| Bachelor's Degree or higher | 37 (100.0%) | 0 (0.0%) |
| Total | 668 (100.0%) | 7 (1.0%) |
Employment Occupations by Sex in Kaumakani
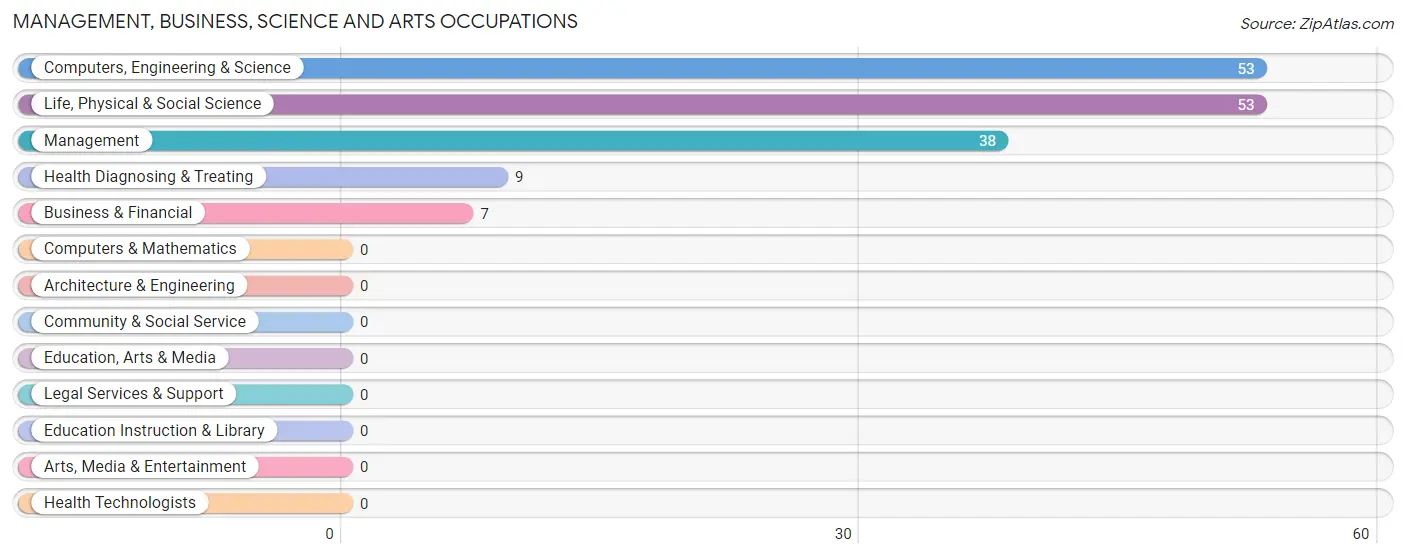
Management, Business, Science and Arts Occupations
The most common Management, Business, Science and Arts occupations in Kaumakani are Computers, Engineering & Science (53 | 6.3%), Life, Physical & Social Science (53 | 6.3%), Management (38 | 4.5%), Health Diagnosing & Treating (9 | 1.1%), and Business & Financial (7 | 0.8%).
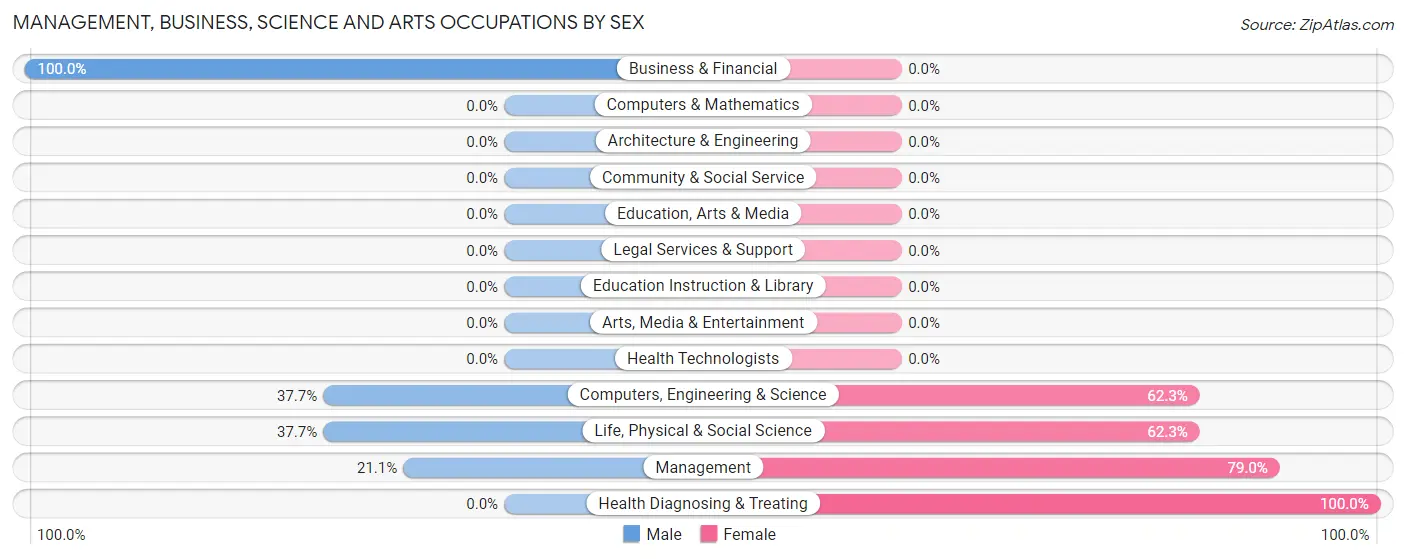
Management, Business, Science and Arts Occupations by Sex
Within the Management, Business, Science and Arts occupations in Kaumakani, the most male-oriented occupations are Business & Financial (100.0%), Computers, Engineering & Science (37.7%), and Life, Physical & Social Science (37.7%), while the most female-oriented occupations are Health Diagnosing & Treating (100.0%), Management (78.9%), and Computers, Engineering & Science (62.3%).
| Occupation | Male | Female |
| Management | 8 (21.0%) | 30 (78.9%) |
| Business & Financial | 7 (100.0%) | 0 (0.0%) |
| Computers, Engineering & Science | 20 (37.7%) | 33 (62.3%) |
| Computers & Mathematics | 0 (0.0%) | 0 (0.0%) |
| Architecture & Engineering | 0 (0.0%) | 0 (0.0%) |
| Life, Physical & Social Science | 20 (37.7%) | 33 (62.3%) |
| Community & Social Service | 0 (0.0%) | 0 (0.0%) |
| Education, Arts & Media | 0 (0.0%) | 0 (0.0%) |
| Legal Services & Support | 0 (0.0%) | 0 (0.0%) |
| Education Instruction & Library | 0 (0.0%) | 0 (0.0%) |
| Arts, Media & Entertainment | 0 (0.0%) | 0 (0.0%) |
| Health Diagnosing & Treating | 0 (0.0%) | 9 (100.0%) |
| Health Technologists | 0 (0.0%) | 0 (0.0%) |
| Total (Category) | 35 (32.7%) | 72 (67.3%) |
| Total (Overall) | 446 (53.2%) | 392 (46.8%) |
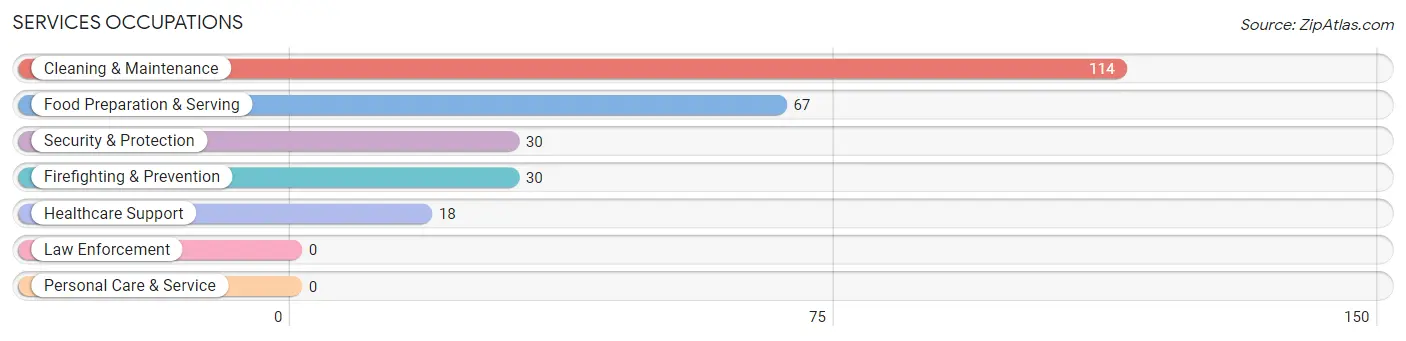
Services Occupations
The most common Services occupations in Kaumakani are Cleaning & Maintenance (114 | 13.6%), Food Preparation & Serving (67 | 8.0%), Security & Protection (30 | 3.6%), Firefighting & Prevention (30 | 3.6%), and Healthcare Support (18 | 2.1%).
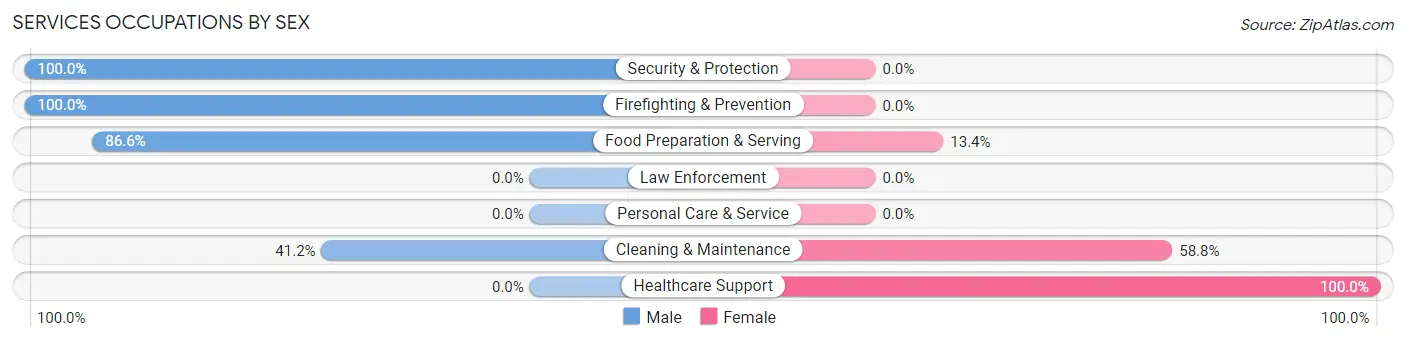
Services Occupations by Sex
Within the Services occupations in Kaumakani, the most male-oriented occupations are Security & Protection (100.0%), Firefighting & Prevention (100.0%), and Food Preparation & Serving (86.6%), while the most female-oriented occupations are Healthcare Support (100.0%), Cleaning & Maintenance (58.8%), and Food Preparation & Serving (13.4%).
| Occupation | Male | Female |
| Healthcare Support | 0 (0.0%) | 18 (100.0%) |
| Security & Protection | 30 (100.0%) | 0 (0.0%) |
| Firefighting & Prevention | 30 (100.0%) | 0 (0.0%) |
| Law Enforcement | 0 (0.0%) | 0 (0.0%) |
| Food Preparation & Serving | 58 (86.6%) | 9 (13.4%) |
| Cleaning & Maintenance | 47 (41.2%) | 67 (58.8%) |
| Personal Care & Service | 0 (0.0%) | 0 (0.0%) |
| Total (Category) | 135 (59.0%) | 94 (41.0%) |
| Total (Overall) | 446 (53.2%) | 392 (46.8%) |
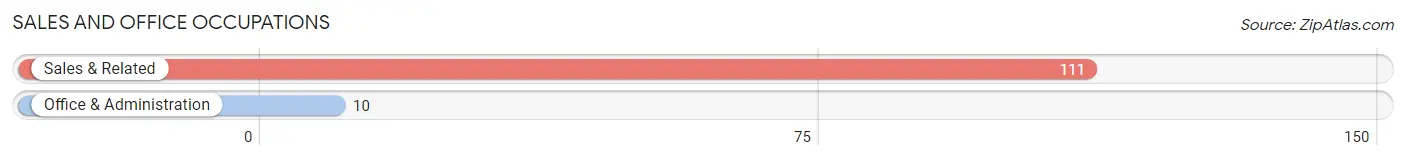
Sales and Office Occupations
The most common Sales and Office occupations in Kaumakani are Sales & Related (111 | 13.3%), and Office & Administration (10 | 1.2%).
Sales and Office Occupations by Sex
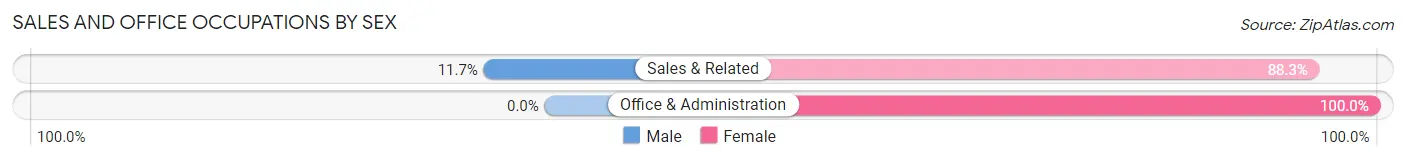
| Occupation | Male | Female |
| Sales & Related | 13 (11.7%) | 98 (88.3%) |
| Office & Administration | 0 (0.0%) | 10 (100.0%) |
| Total (Category) | 13 (10.7%) | 108 (89.3%) |
| Total (Overall) | 446 (53.2%) | 392 (46.8%) |
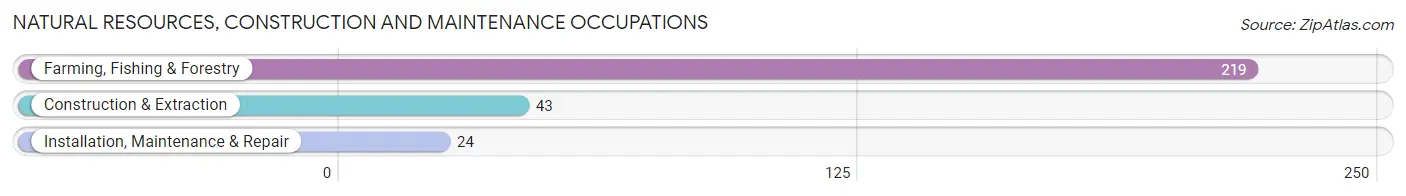
Natural Resources, Construction and Maintenance Occupations
The most common Natural Resources, Construction and Maintenance occupations in Kaumakani are Farming, Fishing & Forestry (219 | 26.1%), Construction & Extraction (43 | 5.1%), and Installation, Maintenance & Repair (24 | 2.9%).
Natural Resources, Construction and Maintenance Occupations by Sex
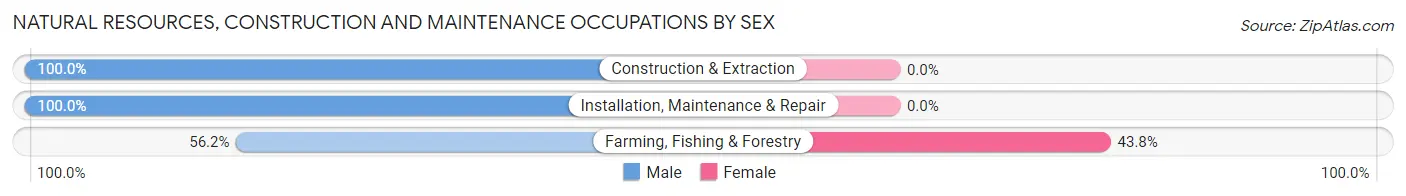
| Occupation | Male | Female |
| Farming, Fishing & Forestry | 123 (56.2%) | 96 (43.8%) |
| Construction & Extraction | 43 (100.0%) | 0 (0.0%) |
| Installation, Maintenance & Repair | 24 (100.0%) | 0 (0.0%) |
| Total (Category) | 190 (66.4%) | 96 (33.6%) |
| Total (Overall) | 446 (53.2%) | 392 (46.8%) |
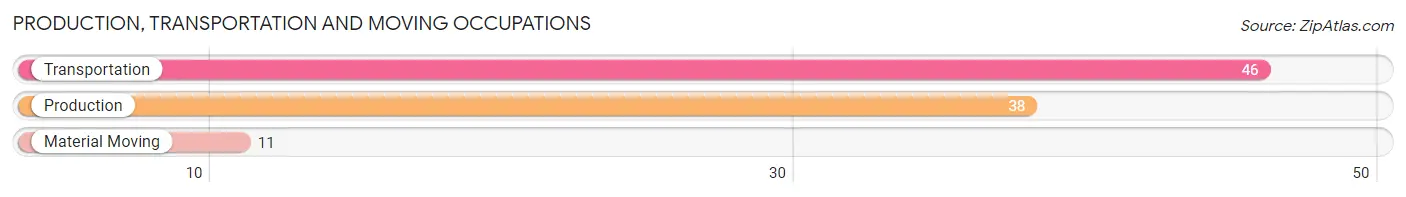
Production, Transportation and Moving Occupations
The most common Production, Transportation and Moving occupations in Kaumakani are Transportation (46 | 5.5%), Production (38 | 4.5%), and Material Moving (11 | 1.3%).
Production, Transportation and Moving Occupations by Sex
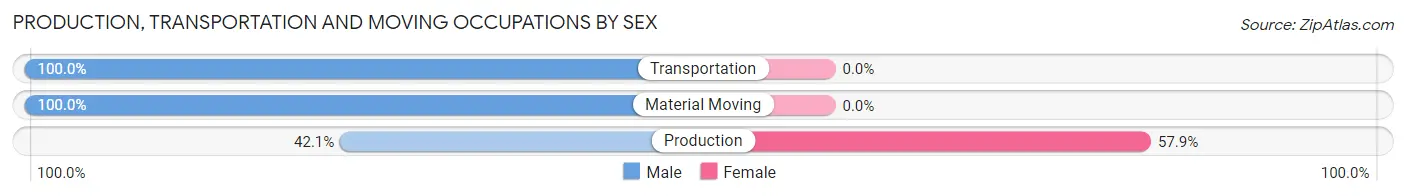
| Occupation | Male | Female |
| Production | 16 (42.1%) | 22 (57.9%) |
| Transportation | 46 (100.0%) | 0 (0.0%) |
| Material Moving | 11 (100.0%) | 0 (0.0%) |
| Total (Category) | 73 (76.8%) | 22 (23.2%) |
| Total (Overall) | 446 (53.2%) | 392 (46.8%) |
Employment Industries by Sex in Kaumakani
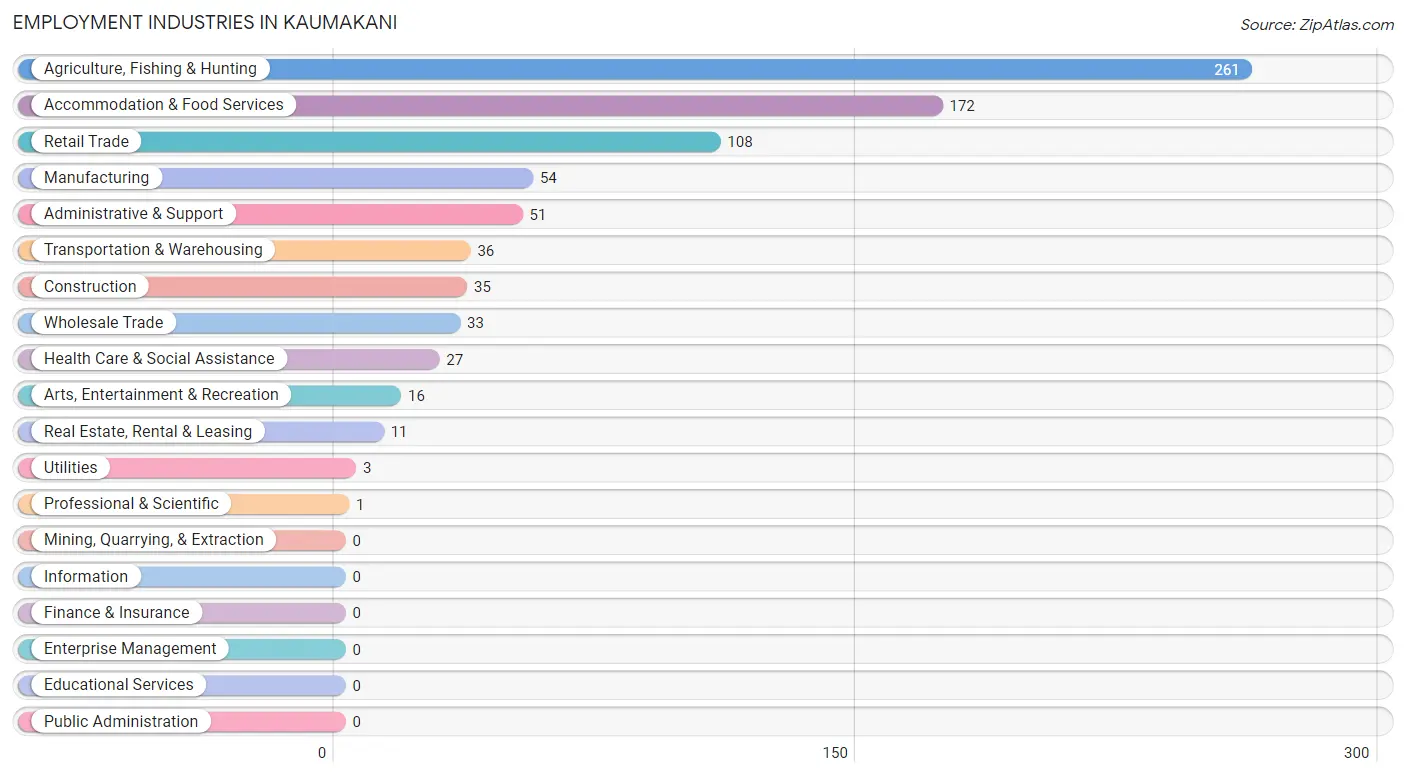
Employment Industries in Kaumakani
The major employment industries in Kaumakani include Agriculture, Fishing & Hunting (261 | 31.1%), Accommodation & Food Services (172 | 20.5%), Retail Trade (108 | 12.9%), Manufacturing (54 | 6.4%), and Administrative & Support (51 | 6.1%).
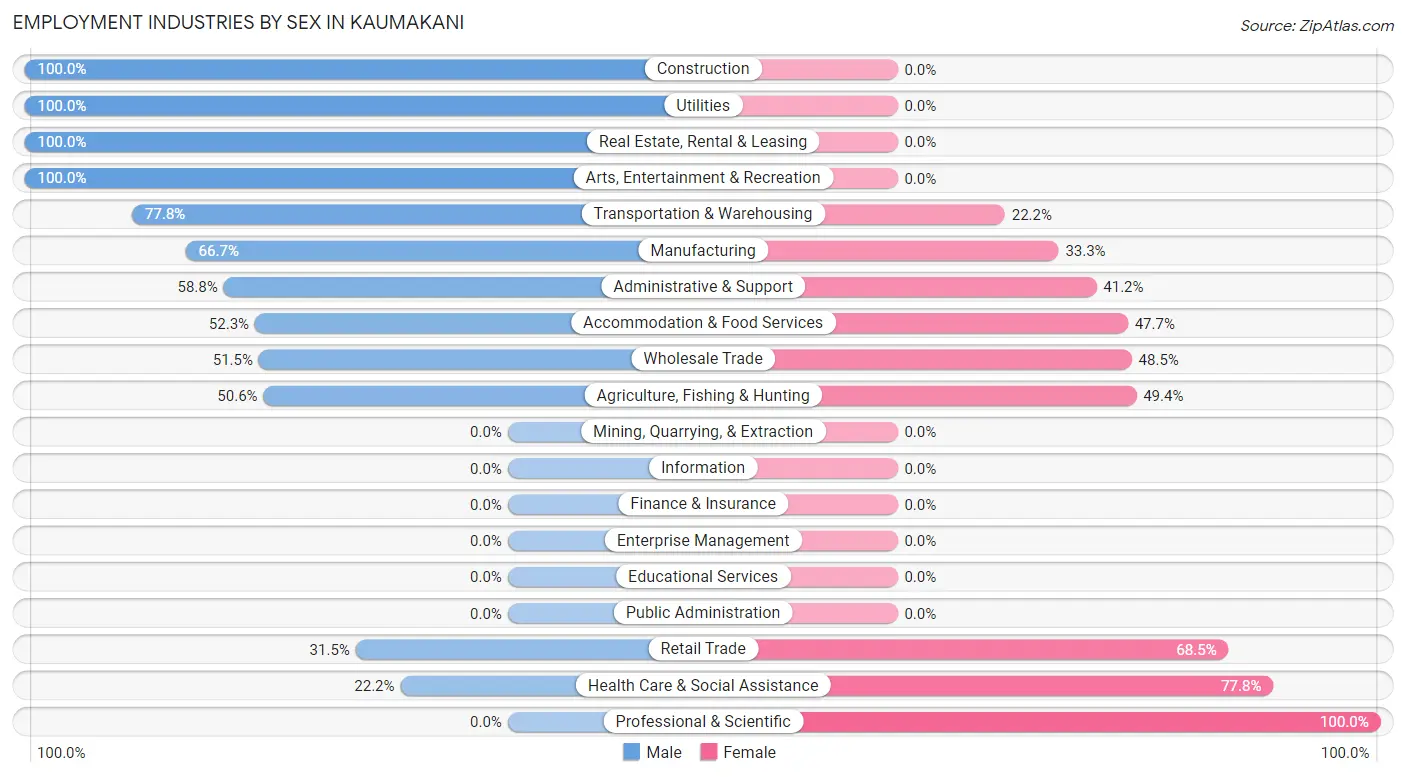
Employment Industries by Sex in Kaumakani
The Kaumakani industries that see more men than women are Construction (100.0%), Utilities (100.0%), and Real Estate, Rental & Leasing (100.0%), whereas the industries that tend to have a higher number of women are Professional & Scientific (100.0%), Health Care & Social Assistance (77.8%), and Retail Trade (68.5%).
| Industry | Male | Female |
| Agriculture, Fishing & Hunting | 132 (50.6%) | 129 (49.4%) |
| Mining, Quarrying, & Extraction | 0 (0.0%) | 0 (0.0%) |
| Construction | 35 (100.0%) | 0 (0.0%) |
| Manufacturing | 36 (66.7%) | 18 (33.3%) |
| Wholesale Trade | 17 (51.5%) | 16 (48.5%) |
| Retail Trade | 34 (31.5%) | 74 (68.5%) |
| Transportation & Warehousing | 28 (77.8%) | 8 (22.2%) |
| Utilities | 3 (100.0%) | 0 (0.0%) |
| Information | 0 (0.0%) | 0 (0.0%) |
| Finance & Insurance | 0 (0.0%) | 0 (0.0%) |
| Real Estate, Rental & Leasing | 11 (100.0%) | 0 (0.0%) |
| Professional & Scientific | 0 (0.0%) | 1 (100.0%) |
| Enterprise Management | 0 (0.0%) | 0 (0.0%) |
| Administrative & Support | 30 (58.8%) | 21 (41.2%) |
| Educational Services | 0 (0.0%) | 0 (0.0%) |
| Health Care & Social Assistance | 6 (22.2%) | 21 (77.8%) |
| Arts, Entertainment & Recreation | 16 (100.0%) | 0 (0.0%) |
| Accommodation & Food Services | 90 (52.3%) | 82 (47.7%) |
| Public Administration | 0 (0.0%) | 0 (0.0%) |
| Total | 446 (53.2%) | 392 (46.8%) |
Education in Kaumakani
School Enrollment in Kaumakani
The most common levels of schooling among the 428 students in Kaumakani are high school (232 | 54.2%), middle school (121 | 28.3%), and elementary school (34 | 7.9%).
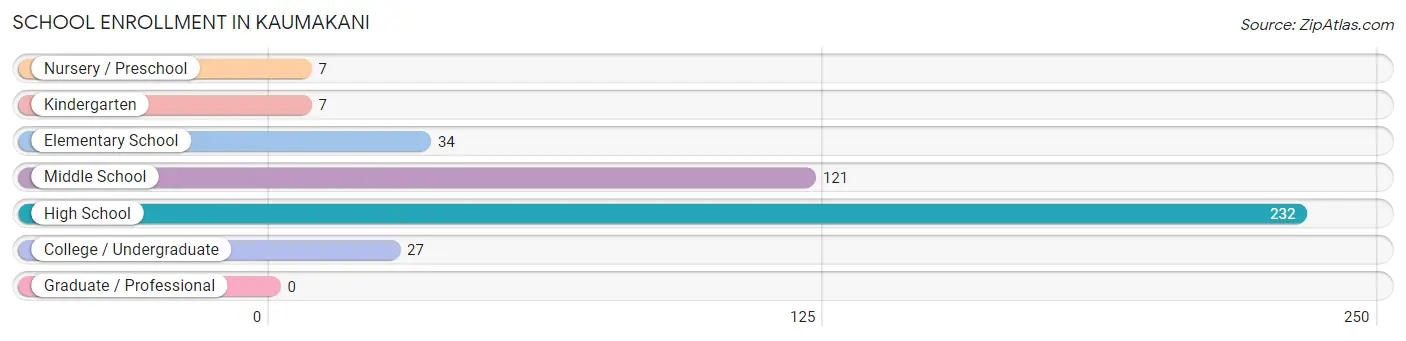
| School Level | # Students | % Students |
| Nursery / Preschool | 7 | 1.6% |
| Kindergarten | 7 | 1.6% |
| Elementary School | 34 | 7.9% |
| Middle School | 121 | 28.3% |
| High School | 232 | 54.2% |
| College / Undergraduate | 27 | 6.3% |
| Graduate / Professional | 0 | 0.0% |
| Total | 428 | 100.0% |
School Enrollment by Age by Funding Source in Kaumakani
Out of a total of 428 students who are enrolled in schools in Kaumakani, 7 (1.6%) attend a private institution, while the remaining 421 (98.4%) are enrolled in public schools. The age group of 5 to 9 year old has the highest likelihood of being enrolled in private schools, with 7 (17.9% in the age bracket) enrolled. Conversely, the age group of 10 to 14 year olds has the lowest likelihood of being enrolled in a private school, with 137 (100.0% in the age bracket) attending a public institution.
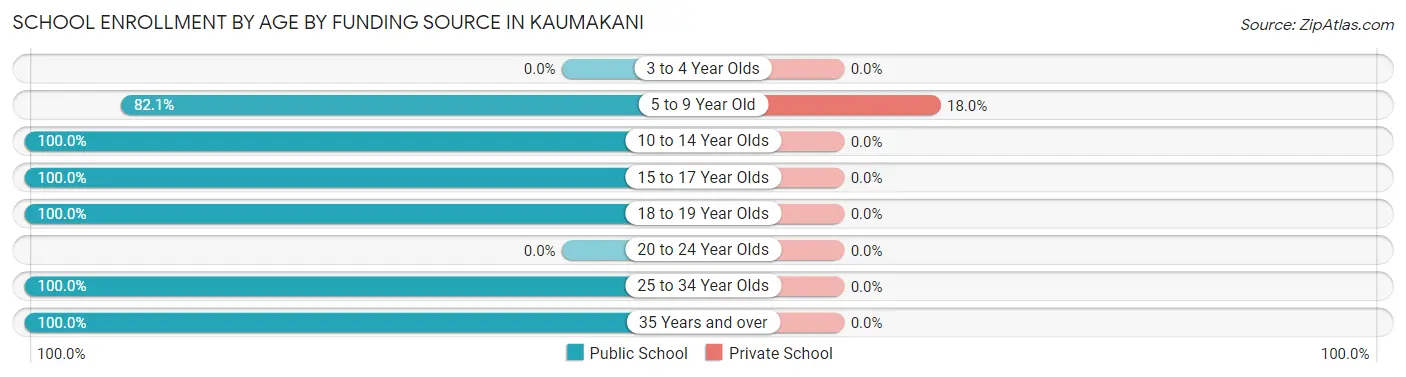
| Age Bracket | Public School | Private School |
| 3 to 4 Year Olds | 0 (0.0%) | 0 (0.0%) |
| 5 to 9 Year Old | 32 (82.1%) | 7 (17.9%) |
| 10 to 14 Year Olds | 137 (100.0%) | 0 (0.0%) |
| 15 to 17 Year Olds | 141 (100.0%) | 0 (0.0%) |
| 18 to 19 Year Olds | 98 (100.0%) | 0 (0.0%) |
| 20 to 24 Year Olds | 0 (0.0%) | 0 (0.0%) |
| 25 to 34 Year Olds | 4 (100.0%) | 0 (0.0%) |
| 35 Years and over | 9 (100.0%) | 0 (0.0%) |
| Total | 421 (98.4%) | 7 (1.6%) |
Educational Attainment by Field of Study in Kaumakani
Business (14 | 24.6%), computers & mathematics (11 | 19.3%), arts & humanities (10 | 17.5%), science & technology (6 | 10.5%), and bio, nature & agricultural (5 | 8.8%) are the most common fields of study among 57 individuals in Kaumakani who have obtained a bachelor's degree or higher.
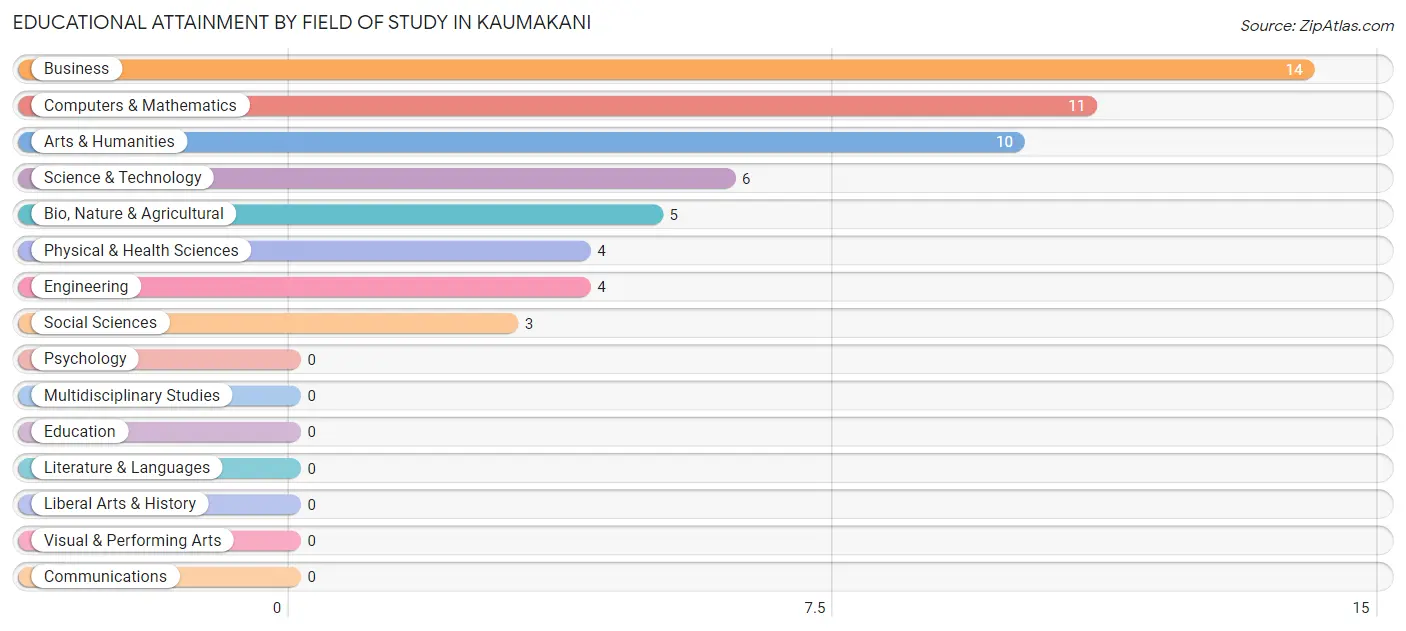
| Field of Study | # Graduates | % Graduates |
| Computers & Mathematics | 11 | 19.3% |
| Bio, Nature & Agricultural | 5 | 8.8% |
| Physical & Health Sciences | 4 | 7.0% |
| Psychology | 0 | 0.0% |
| Social Sciences | 3 | 5.3% |
| Engineering | 4 | 7.0% |
| Multidisciplinary Studies | 0 | 0.0% |
| Science & Technology | 6 | 10.5% |
| Business | 14 | 24.6% |
| Education | 0 | 0.0% |
| Literature & Languages | 0 | 0.0% |
| Liberal Arts & History | 0 | 0.0% |
| Visual & Performing Arts | 0 | 0.0% |
| Communications | 0 | 0.0% |
| Arts & Humanities | 10 | 17.5% |
| Total | 57 | 100.0% |
Transportation & Commute in Kaumakani
Vehicle Availability by Sex in Kaumakani
The most prevalent vehicle ownership categories in Kaumakani are males with 2 vehicles (133, accounting for 30.9%) and females with 2 vehicles (106, making up 34.2%).
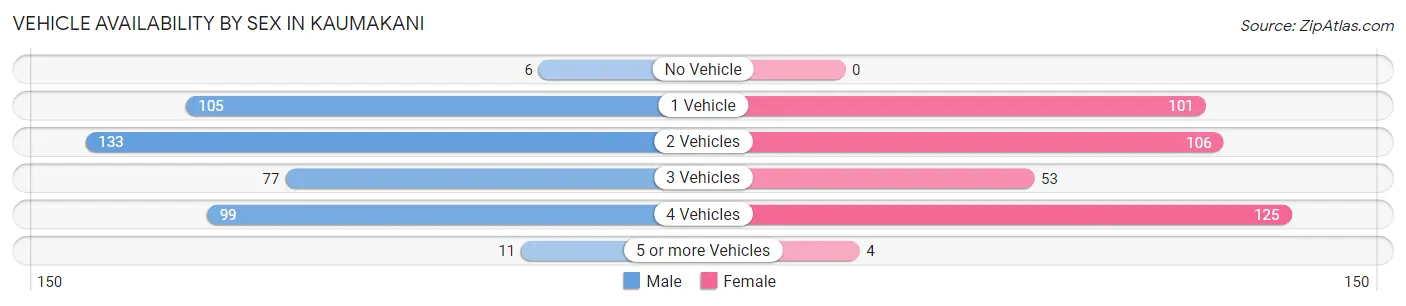
| Vehicles Available | Male | Female |
| No Vehicle | 6 (1.4%) | 0 (0.0%) |
| 1 Vehicle | 105 (24.4%) | 101 (26.0%) |
| 2 Vehicles | 133 (30.9%) | 106 (27.3%) |
| 3 Vehicles | 77 (17.9%) | 53 (13.6%) |
| 4 Vehicles | 99 (23.0%) | 125 (32.1%) |
| 5 or more Vehicles | 11 (2.5%) | 4 (1.0%) |
| Total | 431 (100.0%) | 389 (100.0%) |
Commute Time in Kaumakani
The most frequently occuring commute durations in Kaumakani are 15 to 19 minutes (174 commuters, 21.2%), 30 to 34 minutes (154 commuters, 18.8%), and 20 to 24 minutes (149 commuters, 18.2%).
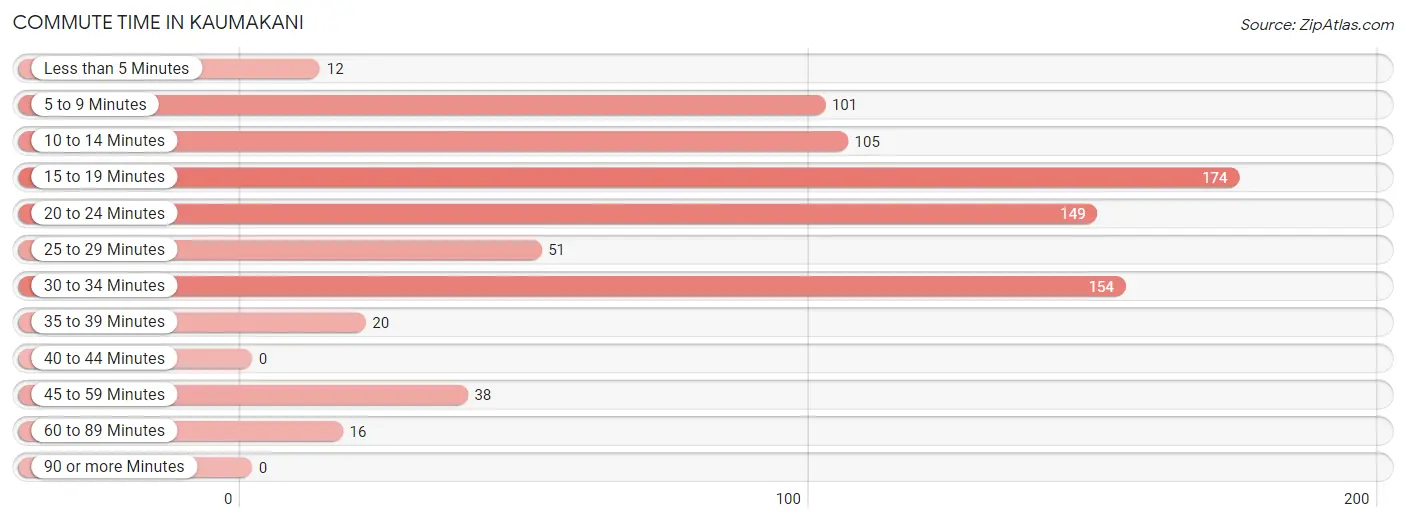
| Commute Time | # Commuters | % Commuters |
| Less than 5 Minutes | 12 | 1.5% |
| 5 to 9 Minutes | 101 | 12.3% |
| 10 to 14 Minutes | 105 | 12.8% |
| 15 to 19 Minutes | 174 | 21.2% |
| 20 to 24 Minutes | 149 | 18.2% |
| 25 to 29 Minutes | 51 | 6.2% |
| 30 to 34 Minutes | 154 | 18.8% |
| 35 to 39 Minutes | 20 | 2.4% |
| 40 to 44 Minutes | 0 | 0.0% |
| 45 to 59 Minutes | 38 | 4.6% |
| 60 to 89 Minutes | 16 | 1.9% |
| 90 or more Minutes | 0 | 0.0% |
Commute Time by Sex in Kaumakani
The most common commute times in Kaumakani are 30 to 34 minutes (93 commuters, 21.6%) for males and 15 to 19 minutes (89 commuters, 22.9%) for females.
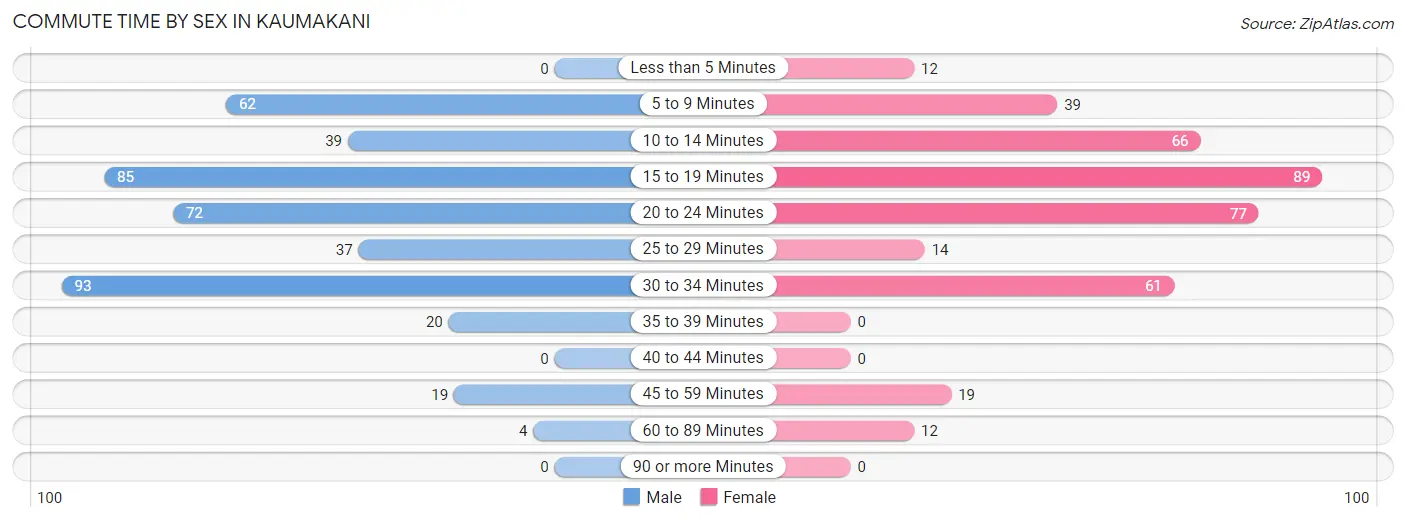
| Commute Time | Male | Female |
| Less than 5 Minutes | 0 (0.0%) | 12 (3.1%) |
| 5 to 9 Minutes | 62 (14.4%) | 39 (10.0%) |
| 10 to 14 Minutes | 39 (9.0%) | 66 (17.0%) |
| 15 to 19 Minutes | 85 (19.7%) | 89 (22.9%) |
| 20 to 24 Minutes | 72 (16.7%) | 77 (19.8%) |
| 25 to 29 Minutes | 37 (8.6%) | 14 (3.6%) |
| 30 to 34 Minutes | 93 (21.6%) | 61 (15.7%) |
| 35 to 39 Minutes | 20 (4.6%) | 0 (0.0%) |
| 40 to 44 Minutes | 0 (0.0%) | 0 (0.0%) |
| 45 to 59 Minutes | 19 (4.4%) | 19 (4.9%) |
| 60 to 89 Minutes | 4 (0.9%) | 12 (3.1%) |
| 90 or more Minutes | 0 (0.0%) | 0 (0.0%) |
Time of Departure to Work by Sex in Kaumakani
The most frequent times of departure to work in Kaumakani are 5:30 AM to 5:59 AM (82, 19.0%) for males and 5:30 AM to 5:59 AM (74, 19.0%) for females.
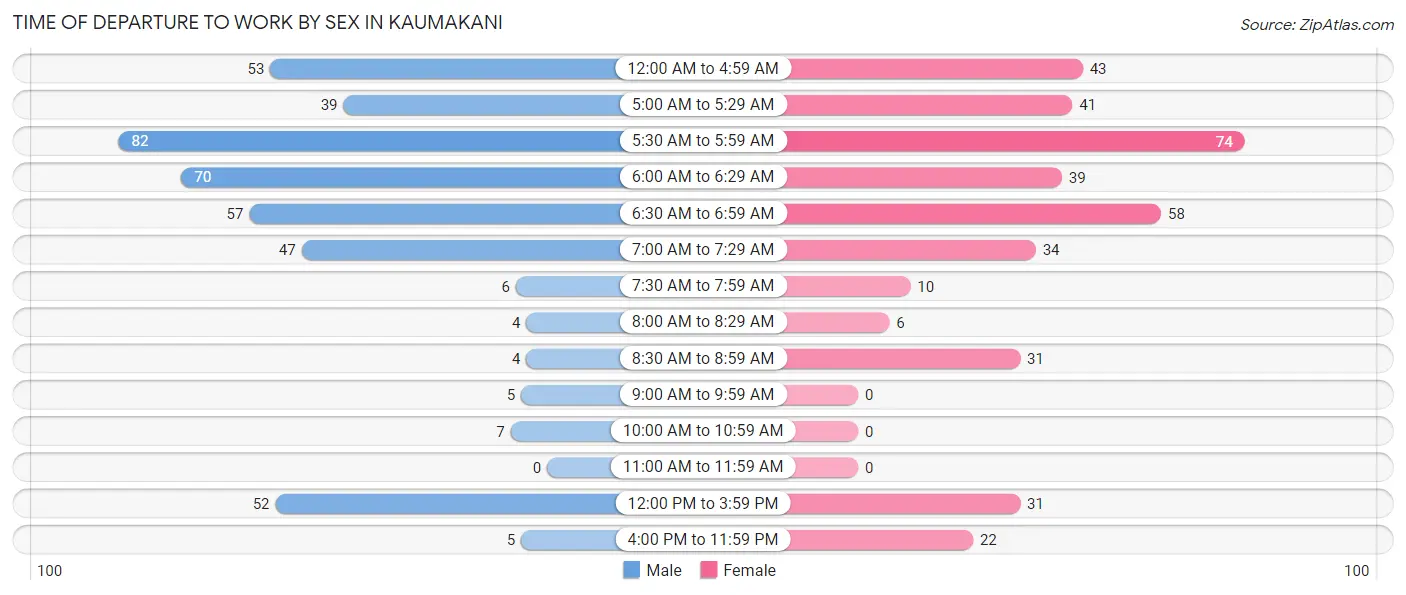
| Time of Departure | Male | Female |
| 12:00 AM to 4:59 AM | 53 (12.3%) | 43 (11.1%) |
| 5:00 AM to 5:29 AM | 39 (9.0%) | 41 (10.5%) |
| 5:30 AM to 5:59 AM | 82 (19.0%) | 74 (19.0%) |
| 6:00 AM to 6:29 AM | 70 (16.2%) | 39 (10.0%) |
| 6:30 AM to 6:59 AM | 57 (13.2%) | 58 (14.9%) |
| 7:00 AM to 7:29 AM | 47 (10.9%) | 34 (8.7%) |
| 7:30 AM to 7:59 AM | 6 (1.4%) | 10 (2.6%) |
| 8:00 AM to 8:29 AM | 4 (0.9%) | 6 (1.5%) |
| 8:30 AM to 8:59 AM | 4 (0.9%) | 31 (8.0%) |
| 9:00 AM to 9:59 AM | 5 (1.2%) | 0 (0.0%) |
| 10:00 AM to 10:59 AM | 7 (1.6%) | 0 (0.0%) |
| 11:00 AM to 11:59 AM | 0 (0.0%) | 0 (0.0%) |
| 12:00 PM to 3:59 PM | 52 (12.1%) | 31 (8.0%) |
| 4:00 PM to 11:59 PM | 5 (1.2%) | 22 (5.7%) |
| Total | 431 (100.0%) | 389 (100.0%) |
Housing Occupancy in Kaumakani
Occupancy by Ownership in Kaumakani
Of the total 302 dwellings in Kaumakani, owner-occupied units account for 0 (0.0%), while renter-occupied units make up 302 (100.0%).
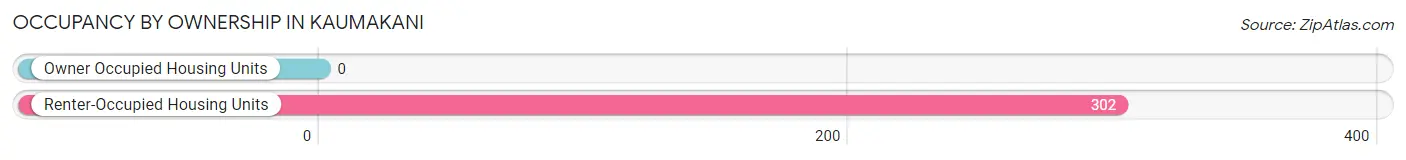
| Occupancy | # Housing Units | % Housing Units |
| Owner Occupied Housing Units | 0 | 0.0% |
| Renter-Occupied Housing Units | 302 | 100.0% |
| Total Occupied Housing Units | 302 | 100.0% |
Occupancy by Household Size in Kaumakani
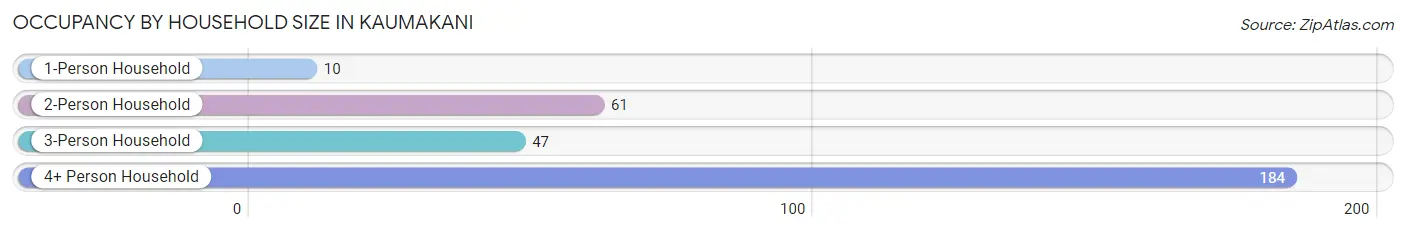
| Household Size | # Housing Units | % Housing Units |
| 1-Person Household | 10 | 3.3% |
| 2-Person Household | 61 | 20.2% |
| 3-Person Household | 47 | 15.6% |
| 4+ Person Household | 184 | 60.9% |
| Total Housing Units | 302 | 100.0% |
Occupancy by Ownership by Household Size in Kaumakani
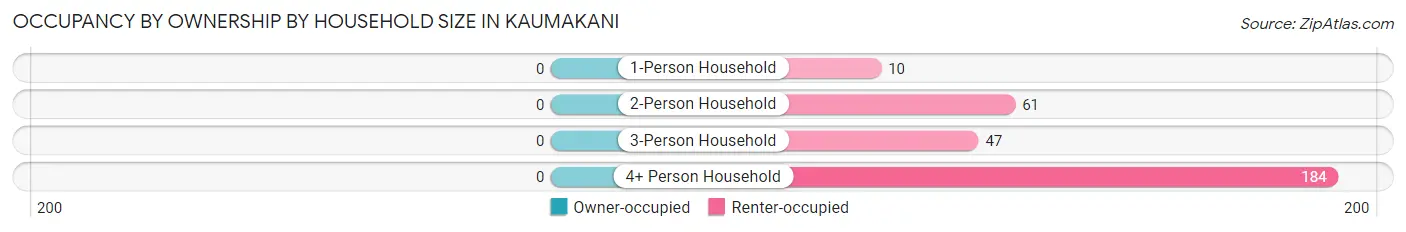
| Household Size | Owner-occupied | Renter-occupied |
| 1-Person Household | 0 (0.0%) | 10 (100.0%) |
| 2-Person Household | 0 (0.0%) | 61 (100.0%) |
| 3-Person Household | 0 (0.0%) | 47 (100.0%) |
| 4+ Person Household | 0 (0.0%) | 184 (100.0%) |
| Total Housing Units | 0 (0.0%) | 302 (100.0%) |
Occupancy by Educational Attainment in Kaumakani
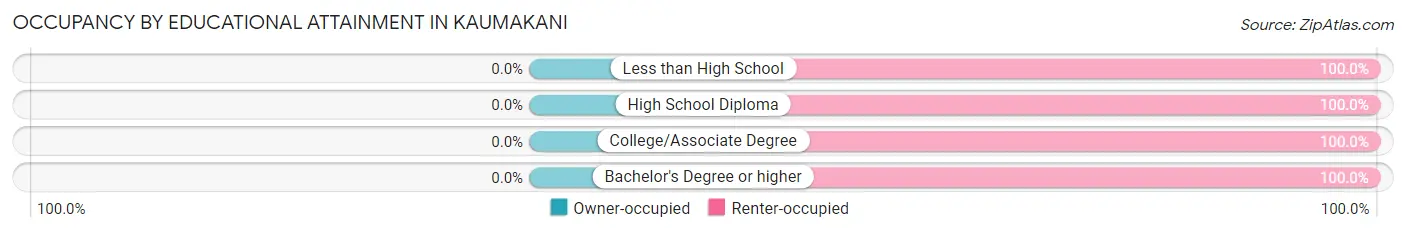
| Household Size | Owner-occupied | Renter-occupied |
| Less than High School | 0 (0.0%) | 108 (100.0%) |
| High School Diploma | 0 (0.0%) | 103 (100.0%) |
| College/Associate Degree | 0 (0.0%) | 72 (100.0%) |
| Bachelor's Degree or higher | 0 (0.0%) | 19 (100.0%) |
Occupancy by Age of Householder in Kaumakani
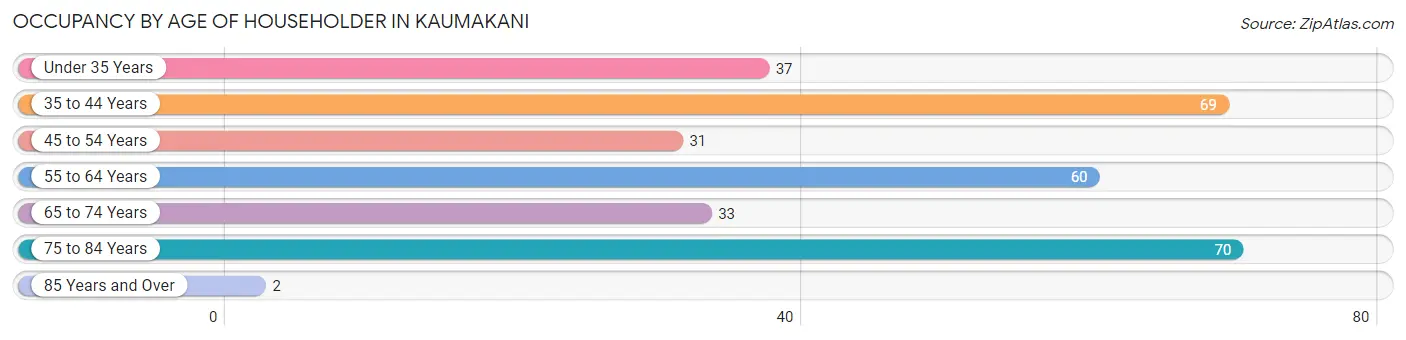
| Age Bracket | # Households | % Households |
| Under 35 Years | 37 | 12.2% |
| 35 to 44 Years | 69 | 22.9% |
| 45 to 54 Years | 31 | 10.3% |
| 55 to 64 Years | 60 | 19.9% |
| 65 to 74 Years | 33 | 10.9% |
| 75 to 84 Years | 70 | 23.2% |
| 85 Years and Over | 2 | 0.7% |
| Total | 302 | 100.0% |
Housing Finances in Kaumakani
Median Income by Occupancy in Kaumakani
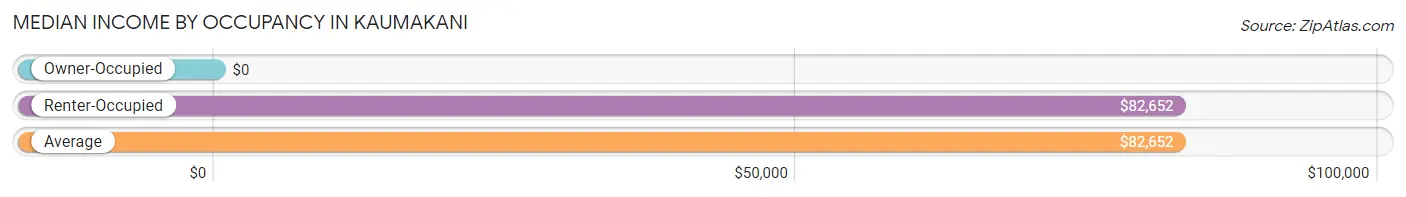
| Occupancy Type | # Households | Median Income |
| Owner-Occupied | 0 (0.0%) | $0 |
| Renter-Occupied | 302 (100.0%) | $82,652 |
| Average | 302 (100.0%) | $82,652 |
Occupancy by Householder Income Bracket in Kaumakani
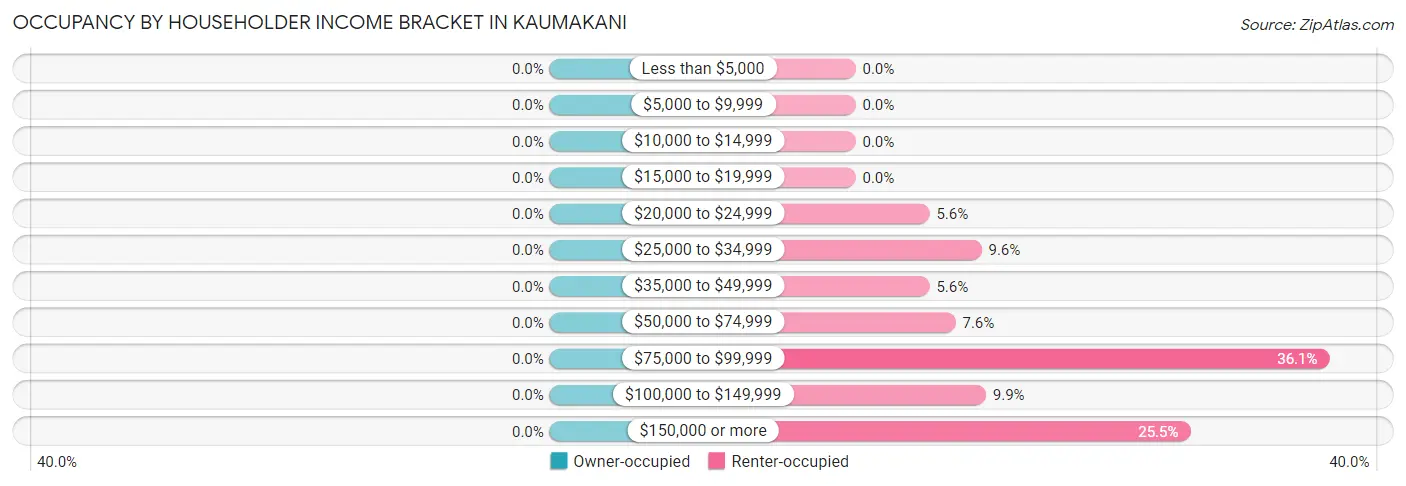
| Income Bracket | Owner-occupied | Renter-occupied |
| Less than $5,000 | 0 (0.0%) | 0 (0.0%) |
| $5,000 to $9,999 | 0 (0.0%) | 0 (0.0%) |
| $10,000 to $14,999 | 0 (0.0%) | 0 (0.0%) |
| $15,000 to $19,999 | 0 (0.0%) | 0 (0.0%) |
| $20,000 to $24,999 | 0 (0.0%) | 17 (5.6%) |
| $25,000 to $34,999 | 0 (0.0%) | 29 (9.6%) |
| $35,000 to $49,999 | 0 (0.0%) | 17 (5.6%) |
| $50,000 to $74,999 | 0 (0.0%) | 23 (7.6%) |
| $75,000 to $99,999 | 0 (0.0%) | 109 (36.1%) |
| $100,000 to $149,999 | 0 (0.0%) | 30 (9.9%) |
| $150,000 or more | 0 (0.0%) | 77 (25.5%) |
| Total | 0 (0.0%) | 302 (100.0%) |
Monthly Housing Cost Tiers in Kaumakani
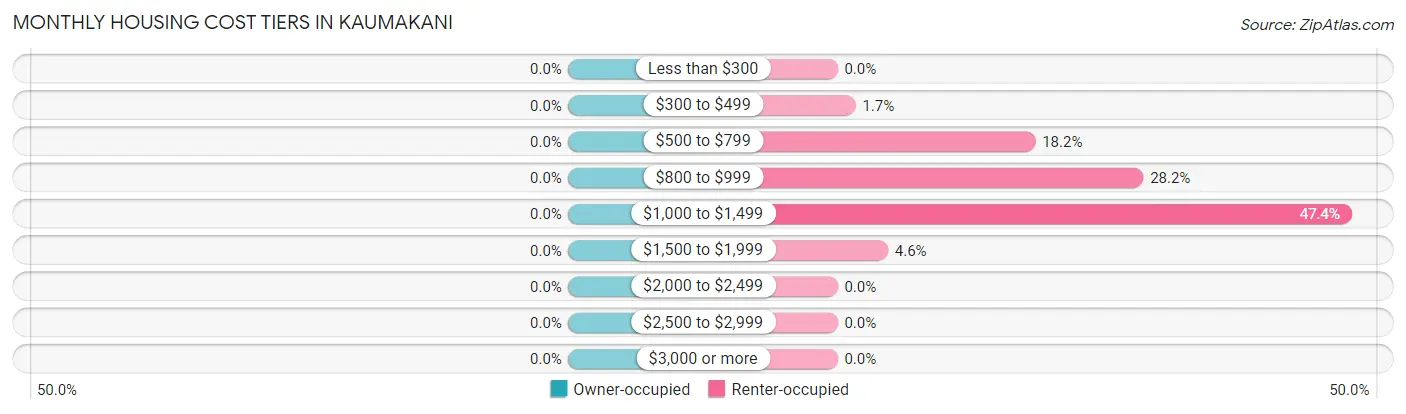
| Monthly Cost | Owner-occupied | Renter-occupied |
| Less than $300 | 0 (0.0%) | 0 (0.0%) |
| $300 to $499 | 0 (0.0%) | 5 (1.7%) |
| $500 to $799 | 0 (0.0%) | 55 (18.2%) |
| $800 to $999 | 0 (0.0%) | 85 (28.1%) |
| $1,000 to $1,499 | 0 (0.0%) | 143 (47.3%) |
| $1,500 to $1,999 | 0 (0.0%) | 14 (4.6%) |
| $2,000 to $2,499 | 0 (0.0%) | 0 (0.0%) |
| $2,500 to $2,999 | 0 (0.0%) | 0 (0.0%) |
| $3,000 or more | 0 (0.0%) | 0 (0.0%) |
| Total | 0 (0.0%) | 302 (100.0%) |
Physical Housing Characteristics in Kaumakani
Housing Structures in Kaumakani
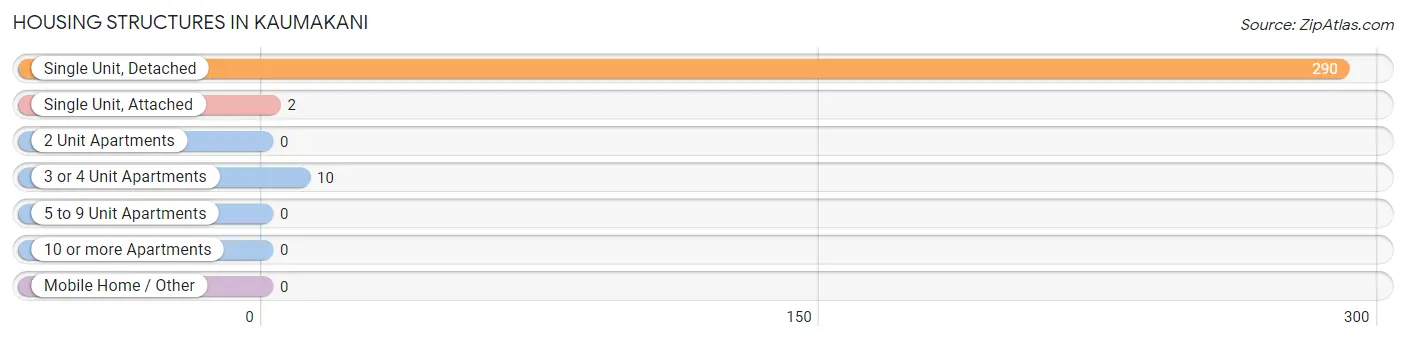
| Structure Type | # Housing Units | % Housing Units |
| Single Unit, Detached | 290 | 96.0% |
| Single Unit, Attached | 2 | 0.7% |
| 2 Unit Apartments | 0 | 0.0% |
| 3 or 4 Unit Apartments | 10 | 3.3% |
| 5 to 9 Unit Apartments | 0 | 0.0% |
| 10 or more Apartments | 0 | 0.0% |
| Mobile Home / Other | 0 | 0.0% |
| Total | 302 | 100.0% |
Housing Structures by Occupancy in Kaumakani
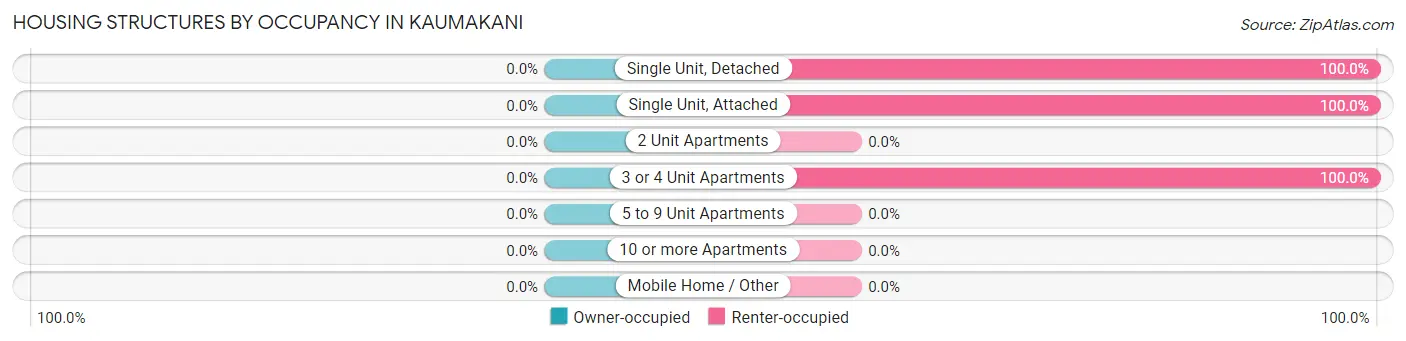
| Structure Type | Owner-occupied | Renter-occupied |
| Single Unit, Detached | 0 (0.0%) | 290 (100.0%) |
| Single Unit, Attached | 0 (0.0%) | 2 (100.0%) |
| 2 Unit Apartments | 0 (0.0%) | 0 (0.0%) |
| 3 or 4 Unit Apartments | 0 (0.0%) | 10 (100.0%) |
| 5 to 9 Unit Apartments | 0 (0.0%) | 0 (0.0%) |
| 10 or more Apartments | 0 (0.0%) | 0 (0.0%) |
| Mobile Home / Other | 0 (0.0%) | 0 (0.0%) |
| Total | 0 (0.0%) | 302 (100.0%) |
Housing Structures by Number of Rooms in Kaumakani
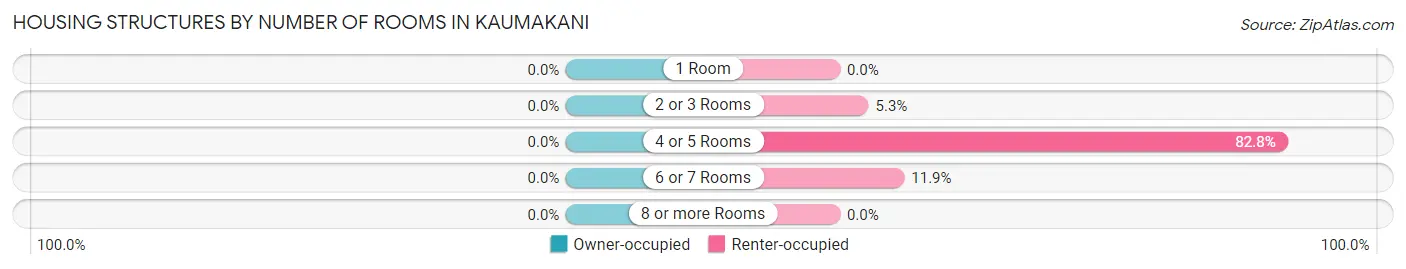
| Number of Rooms | Owner-occupied | Renter-occupied |
| 1 Room | 0 (0.0%) | 0 (0.0%) |
| 2 or 3 Rooms | 0 (0.0%) | 16 (5.3%) |
| 4 or 5 Rooms | 0 (0.0%) | 250 (82.8%) |
| 6 or 7 Rooms | 0 (0.0%) | 36 (11.9%) |
| 8 or more Rooms | 0 (0.0%) | 0 (0.0%) |
| Total | 0 (0.0%) | 302 (100.0%) |
Housing Structure by Heating Type in Kaumakani
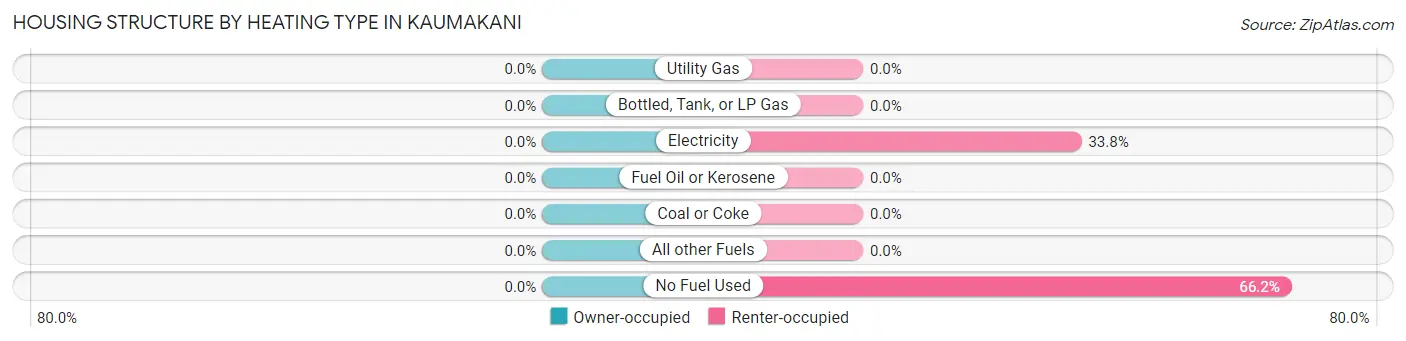
| Heating Type | Owner-occupied | Renter-occupied |
| Utility Gas | 0 (0.0%) | 0 (0.0%) |
| Bottled, Tank, or LP Gas | 0 (0.0%) | 0 (0.0%) |
| Electricity | 0 (0.0%) | 102 (33.8%) |
| Fuel Oil or Kerosene | 0 (0.0%) | 0 (0.0%) |
| Coal or Coke | 0 (0.0%) | 0 (0.0%) |
| All other Fuels | 0 (0.0%) | 0 (0.0%) |
| No Fuel Used | 0 (0.0%) | 200 (66.2%) |
| Total | 0 (0.0%) | 302 (100.0%) |
Household Vehicle Usage in Kaumakani
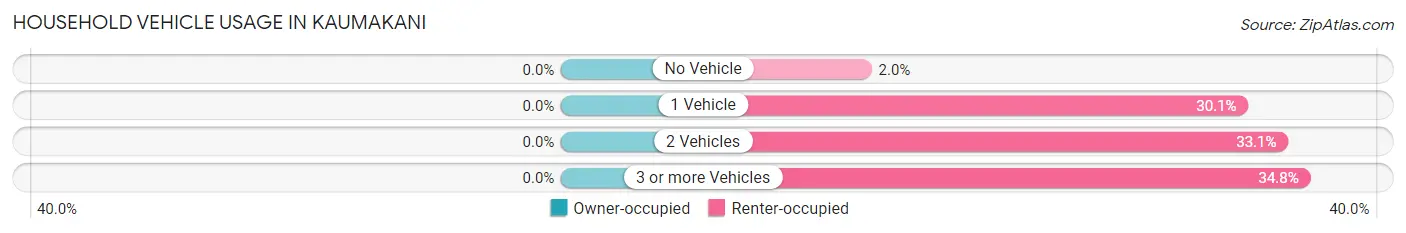
| Vehicles per Household | Owner-occupied | Renter-occupied |
| No Vehicle | 0 (0.0%) | 6 (2.0%) |
| 1 Vehicle | 0 (0.0%) | 91 (30.1%) |
| 2 Vehicles | 0 (0.0%) | 100 (33.1%) |
| 3 or more Vehicles | 0 (0.0%) | 105 (34.8%) |
| Total | 0 (0.0%) | 302 (100.0%) |
Real Estate & Mortgages in Kaumakani
Real Estate and Mortgage Overview in Kaumakani
| Characteristic | Without Mortgage | With Mortgage |
| Housing Units | 0 | 0 |
| Median Property Value | - | - |
| Median Household Income | - | - |
| Monthly Housing Costs | - | - |
| Real Estate Taxes | - | - |
Property Value by Mortgage Status in Kaumakani
| Property Value | Without Mortgage | With Mortgage |
| Less than $50,000 | 0 (0.0%) | 0 (0.0%) |
| $50,000 to $99,999 | 0 (0.0%) | 0 (0.0%) |
| $100,000 to $299,999 | 0 (0.0%) | 0 (0.0%) |
| $300,000 to $499,999 | 0 (0.0%) | 0 (0.0%) |
| $500,000 to $749,999 | 0 (0.0%) | 0 (0.0%) |
| $750,000 to $999,999 | 0 (0.0%) | 0 (0.0%) |
| $1,000,000 or more | 0 (0.0%) | 0 (0.0%) |
| Total | 0 (0.0%) | 0 (0.0%) |
Household Income by Mortgage Status in Kaumakani
| Household Income | Without Mortgage | With Mortgage |
| Less than $10,000 | 0 (0.0%) | 0 (0.0%) |
| $10,000 to $24,999 | 0 (0.0%) | 0 (0.0%) |
| $25,000 to $34,999 | 0 (0.0%) | 0 (0.0%) |
| $35,000 to $49,999 | 0 (0.0%) | 0 (0.0%) |
| $50,000 to $74,999 | 0 (0.0%) | 0 (0.0%) |
| $75,000 to $99,999 | 0 (0.0%) | 0 (0.0%) |
| $100,000 to $149,999 | 0 (0.0%) | 0 (0.0%) |
| $150,000 or more | 0 (0.0%) | 0 (0.0%) |
| Total | 0 (0.0%) | 0 (0.0%) |
Property Value to Household Income Ratio in Kaumakani
| Value-to-Income Ratio | Without Mortgage | With Mortgage |
| Less than 2.0x | 0 (0.0%) | 0 (0.0%) |
| 2.0x to 2.9x | 0 (0.0%) | 0 (0.0%) |
| 3.0x to 3.9x | 0 (0.0%) | 0 (0.0%) |
| 4.0x or more | 0 (0.0%) | 0 (0.0%) |
| Total | 0 (0.0%) | 0 (0.0%) |
Real Estate Taxes by Mortgage Status in Kaumakani
| Property Taxes | Without Mortgage | With Mortgage |
| Less than $800 | 0 (0.0%) | 0 (0.0%) |
| $800 to $1,499 | 0 (0.0%) | 0 (0.0%) |
| $800 to $1,499 | 0 (0.0%) | 0 (0.0%) |
| Total | 0 (0.0%) | 0 (0.0%) |
Health & Disability in Kaumakani
Health Insurance Coverage by Age in Kaumakani
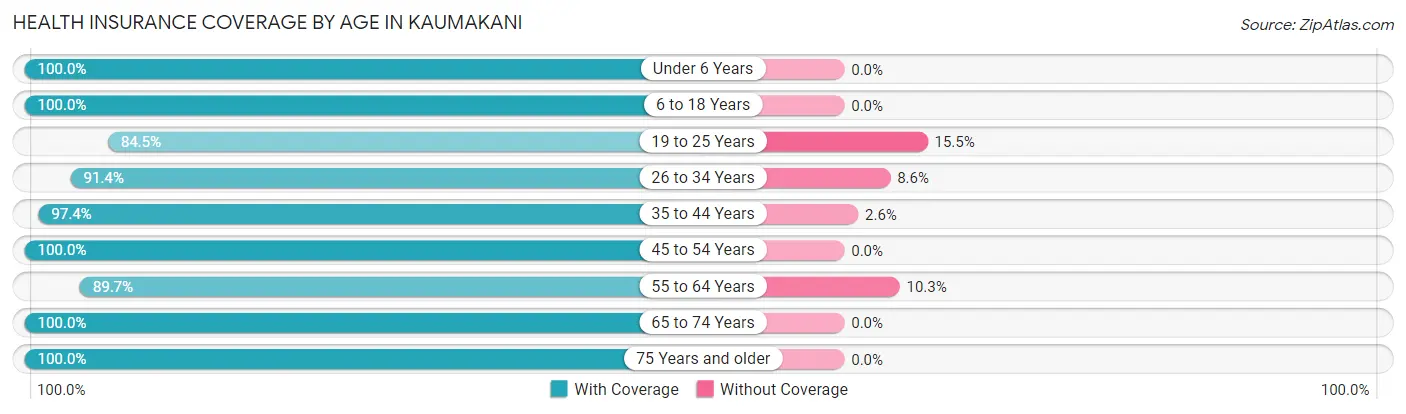
| Age Bracket | With Coverage | Without Coverage |
| Under 6 Years | 50 (100.0%) | 0 (0.0%) |
| 6 to 18 Years | 401 (100.0%) | 0 (0.0%) |
| 19 to 25 Years | 98 (84.5%) | 18 (15.5%) |
| 26 to 34 Years | 96 (91.4%) | 9 (8.6%) |
| 35 to 44 Years | 151 (97.4%) | 4 (2.6%) |
| 45 to 54 Years | 99 (100.0%) | 0 (0.0%) |
| 55 to 64 Years | 261 (89.7%) | 30 (10.3%) |
| 65 to 74 Years | 106 (100.0%) | 0 (0.0%) |
| 75 Years and older | 175 (100.0%) | 0 (0.0%) |
| Total | 1,437 (95.9%) | 61 (4.1%) |
Health Insurance Coverage by Citizenship Status in Kaumakani
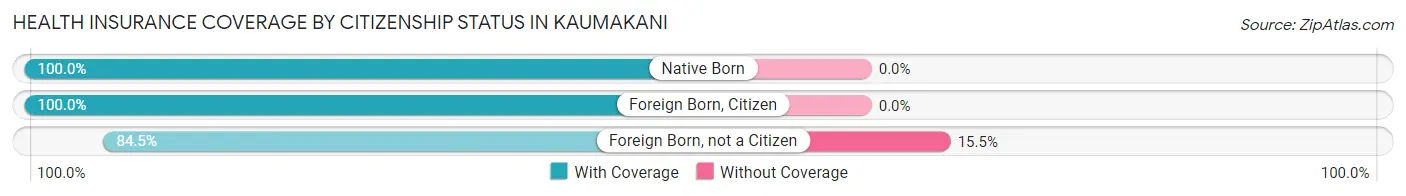
| Citizenship Status | With Coverage | Without Coverage |
| Native Born | 50 (100.0%) | 0 (0.0%) |
| Foreign Born, Citizen | 401 (100.0%) | 0 (0.0%) |
| Foreign Born, not a Citizen | 98 (84.5%) | 18 (15.5%) |
Health Insurance Coverage by Household Income in Kaumakani
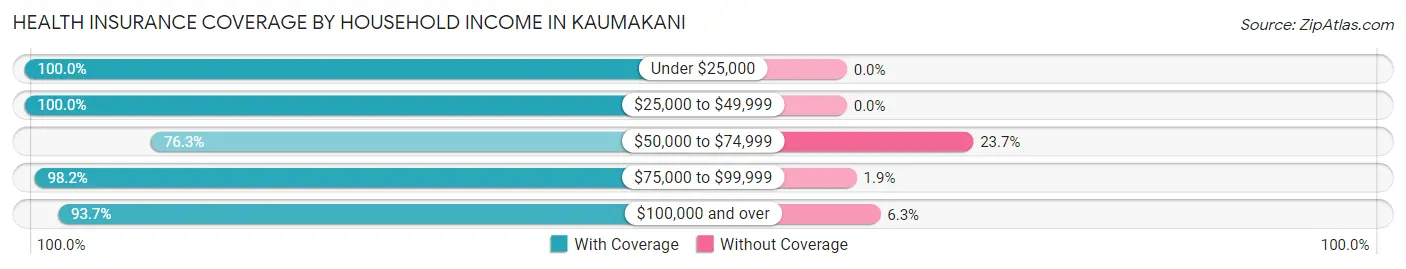
| Household Income | With Coverage | Without Coverage |
| Under $25,000 | 106 (100.0%) | 0 (0.0%) |
| $25,000 to $49,999 | 138 (100.0%) | 0 (0.0%) |
| $50,000 to $74,999 | 58 (76.3%) | 18 (23.7%) |
| $75,000 to $99,999 | 688 (98.2%) | 13 (1.8%) |
| $100,000 and over | 447 (93.7%) | 30 (6.3%) |
Public vs Private Health Insurance Coverage by Age in Kaumakani
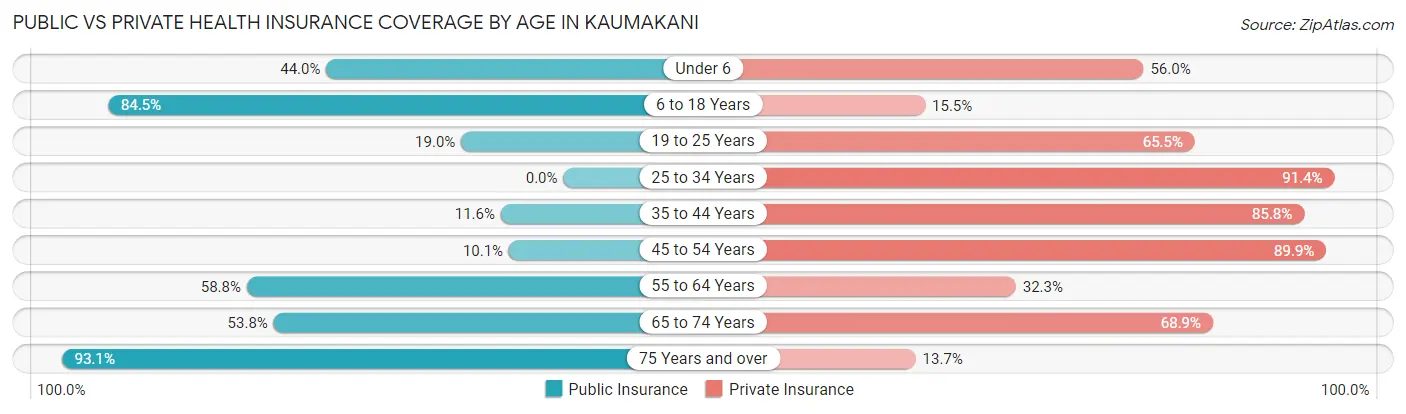
| Age Bracket | Public Insurance | Private Insurance |
| Under 6 | 22 (44.0%) | 28 (56.0%) |
| 6 to 18 Years | 339 (84.5%) | 62 (15.5%) |
| 19 to 25 Years | 22 (19.0%) | 76 (65.5%) |
| 25 to 34 Years | 0 (0.0%) | 96 (91.4%) |
| 35 to 44 Years | 18 (11.6%) | 133 (85.8%) |
| 45 to 54 Years | 10 (10.1%) | 89 (89.9%) |
| 55 to 64 Years | 171 (58.8%) | 94 (32.3%) |
| 65 to 74 Years | 57 (53.8%) | 73 (68.9%) |
| 75 Years and over | 163 (93.1%) | 24 (13.7%) |
| Total | 802 (53.5%) | 675 (45.1%) |
Disability Status by Sex by Age in Kaumakani
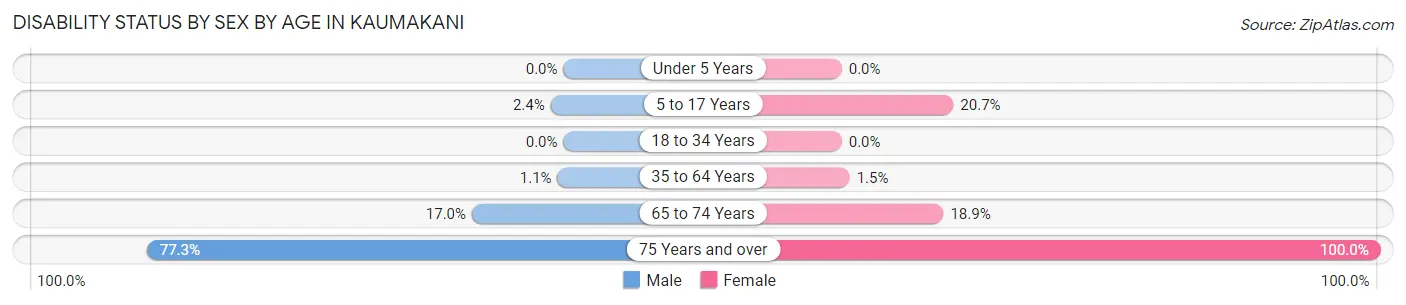
| Age Bracket | Male | Female |
| Under 5 Years | 0 (0.0%) | 0 (0.0%) |
| 5 to 17 Years | 5 (2.4%) | 23 (20.7%) |
| 18 to 34 Years | 0 (0.0%) | 0 (0.0%) |
| 35 to 64 Years | 3 (1.1%) | 4 (1.5%) |
| 65 to 74 Years | 9 (17.0%) | 10 (18.9%) |
| 75 Years and over | 75 (77.3%) | 78 (100.0%) |
Disability Class by Sex by Age in Kaumakani
Disability Class: Hearing Difficulty
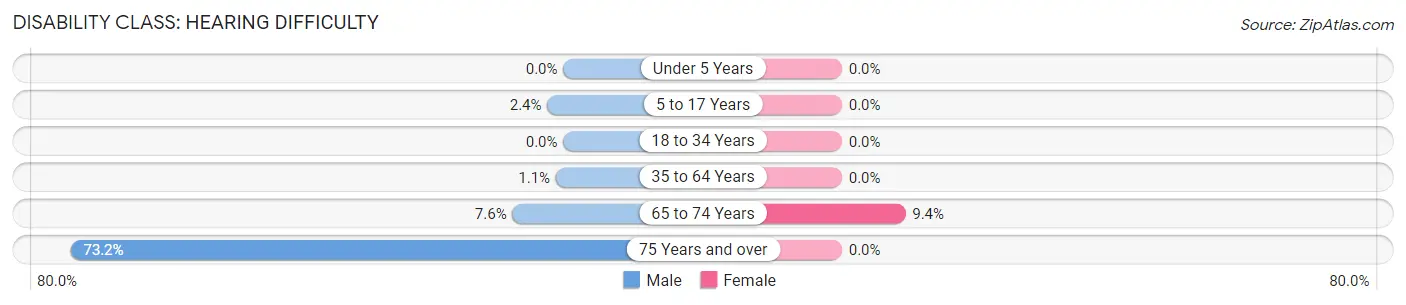
| Age Bracket | Male | Female |
| Under 5 Years | 0 (0.0%) | 0 (0.0%) |
| 5 to 17 Years | 5 (2.4%) | 0 (0.0%) |
| 18 to 34 Years | 0 (0.0%) | 0 (0.0%) |
| 35 to 64 Years | 3 (1.1%) | 0 (0.0%) |
| 65 to 74 Years | 4 (7.5%) | 5 (9.4%) |
| 75 Years and over | 71 (73.2%) | 0 (0.0%) |
Disability Class: Vision Difficulty
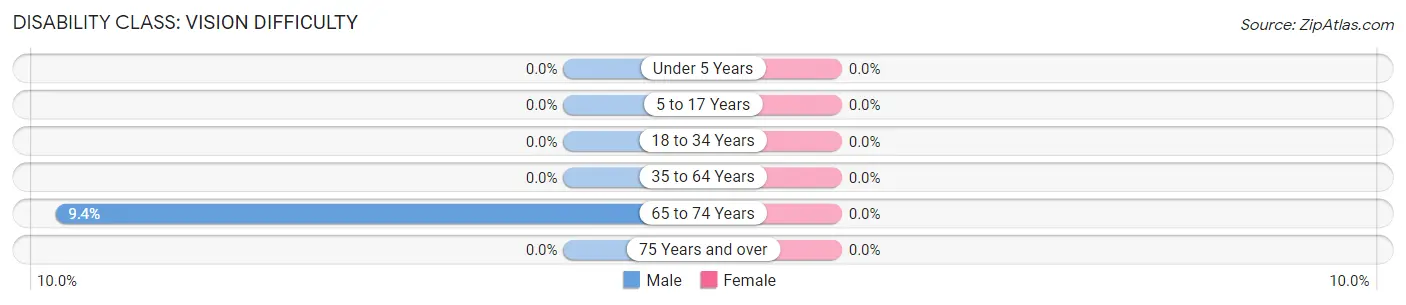
| Age Bracket | Male | Female |
| Under 5 Years | 0 (0.0%) | 0 (0.0%) |
| 5 to 17 Years | 0 (0.0%) | 0 (0.0%) |
| 18 to 34 Years | 0 (0.0%) | 0 (0.0%) |
| 35 to 64 Years | 0 (0.0%) | 0 (0.0%) |
| 65 to 74 Years | 5 (9.4%) | 0 (0.0%) |
| 75 Years and over | 0 (0.0%) | 0 (0.0%) |
Disability Class: Cognitive Difficulty
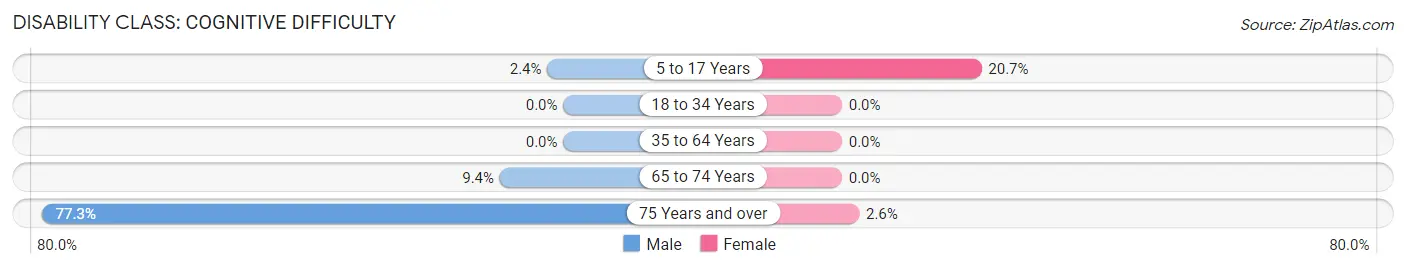
| Age Bracket | Male | Female |
| 5 to 17 Years | 5 (2.4%) | 23 (20.7%) |
| 18 to 34 Years | 0 (0.0%) | 0 (0.0%) |
| 35 to 64 Years | 0 (0.0%) | 0 (0.0%) |
| 65 to 74 Years | 5 (9.4%) | 0 (0.0%) |
| 75 Years and over | 75 (77.3%) | 2 (2.6%) |
Disability Class: Ambulatory Difficulty
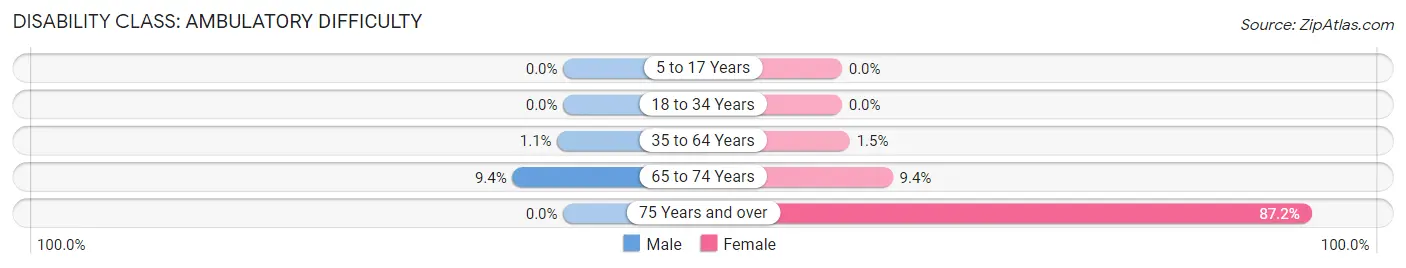
| Age Bracket | Male | Female |
| 5 to 17 Years | 0 (0.0%) | 0 (0.0%) |
| 18 to 34 Years | 0 (0.0%) | 0 (0.0%) |
| 35 to 64 Years | 3 (1.1%) | 4 (1.5%) |
| 65 to 74 Years | 5 (9.4%) | 5 (9.4%) |
| 75 Years and over | 0 (0.0%) | 68 (87.2%) |
Disability Class: Self-Care Difficulty
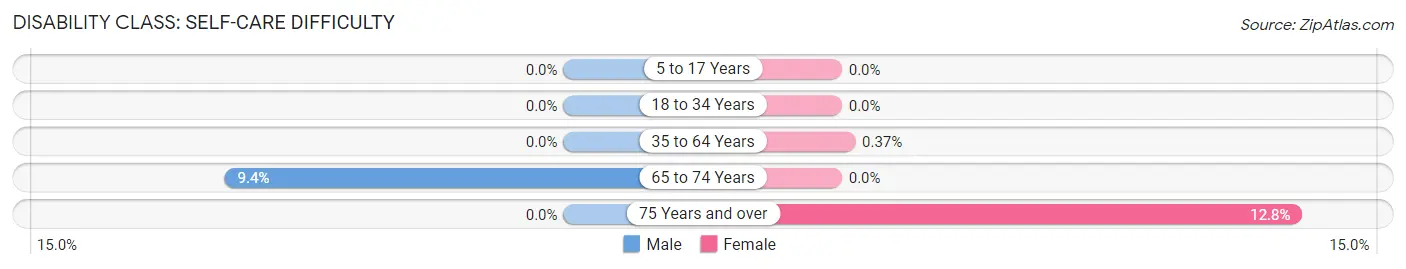
| Age Bracket | Male | Female |
| 5 to 17 Years | 0 (0.0%) | 0 (0.0%) |
| 18 to 34 Years | 0 (0.0%) | 0 (0.0%) |
| 35 to 64 Years | 0 (0.0%) | 1 (0.4%) |
| 65 to 74 Years | 5 (9.4%) | 0 (0.0%) |
| 75 Years and over | 0 (0.0%) | 10 (12.8%) |
Technology Access in Kaumakani
Computing Device Access in Kaumakani
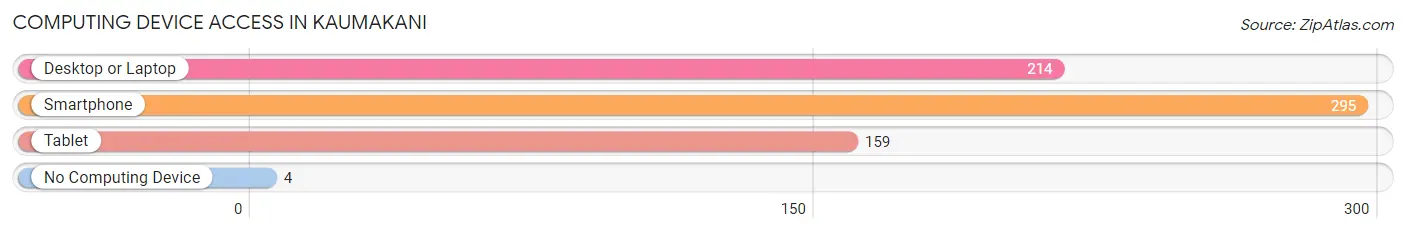
| Device Type | # Households | % Households |
| Desktop or Laptop | 214 | 70.9% |
| Smartphone | 295 | 97.7% |
| Tablet | 159 | 52.6% |
| No Computing Device | 4 | 1.3% |
| Total | 302 | 100.0% |
Internet Access in Kaumakani
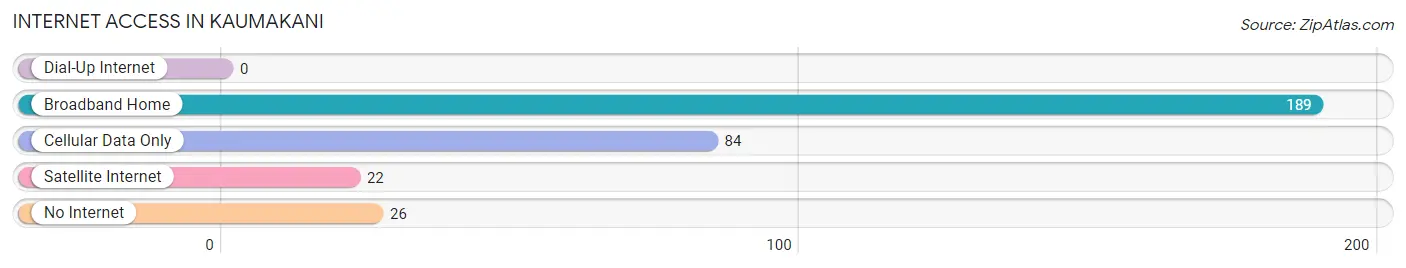
| Internet Type | # Households | % Households |
| Dial-Up Internet | 0 | 0.0% |
| Broadband Home | 189 | 62.6% |
| Cellular Data Only | 84 | 27.8% |
| Satellite Internet | 22 | 7.3% |
| No Internet | 26 | 8.6% |
| Total | 302 | 100.0% |
Kaumakani Summary
Kaumakani is a census-designated place (CDP) located in the Hawaiian island of Kauai. It is located in the eastern part of the island, near the town of Kilauea. The population of Kaumakani was 1,845 at the 2010 census.
Geography
Kaumakani is located at 21°58'17" North, 159°25'45" West (21.9714, -159.4292). It is situated at an elevation of 545 feet (166 m) above sea level.
Kaumakani is located on the eastern side of Kauai, near the town of Kilauea. It is bordered to the north by the town of Kilauea, to the east by the Pacific Ocean, to the south by the town of Hanalei, and to the west by the town of Kapaa.
The climate in Kaumakani is tropical, with temperatures ranging from an average low of 68°F (20°C) in the winter to an average high of 85°F (29°C) in the summer.
History
Kaumakani was originally settled by Native Hawaiians in the late 1700s. The area was used for farming and fishing, and the local population grew steadily over the years.
In the late 1800s, the area was developed by sugar plantation owners, who built a railroad line to transport sugar cane from the fields to the port of Nawiliwili. The railroad line was eventually abandoned in the early 1900s, but the town of Kaumakani remained.
In the 1950s, the area was developed further with the construction of a new highway, which connected Kaumakani to the rest of the island. This allowed for easier access to the town and helped to spur further growth.
Economy
The economy of Kaumakani is largely based on tourism and agriculture. The town is home to several small businesses, including restaurants, shops, and a few hotels.
Agriculture is also an important part of the local economy. The area is known for its production of sugar cane, coffee, and macadamia nuts.
Demographics
As of the 2010 census, the population of Kaumakani was 1,845. The racial makeup of the town was 79.3% White, 0.7% African American, 0.3% Native American, 0.7% Asian, 0.1% Pacific Islander, and 18.8% from other races.
The median household income in Kaumakani was $50,938, and the median family income was $54,844. The per capita income was $22,945. About 11.2% of families and 14.2% of the population were below the poverty line.
Conclusion
Kaumakani is a small town located on the eastern side of Kauai. It has a population of 1,845 and is known for its tourism and agriculture. The economy is largely based on tourism and agriculture, with the production of sugar cane, coffee, and macadamia nuts being important to the local economy. The racial makeup of the town is mostly White, with a small percentage of African American, Native American, Asian, and Pacific Islander residents. The median household income is $50,938, and the median family income is $54,844.
Common Questions
What is Per Capita Income in Kaumakani?
Per Capita income in Kaumakani is $27,877.
What is the Median Family Income in Kaumakani?
Median Family Income in Kaumakani is $80,804.
What is the Median Household income in Kaumakani?
Median Household Income in Kaumakani is $82,652.
What is Income or Wage Gap in Kaumakani?
Income or Wage Gap in Kaumakani is 26.6%.
Women in Kaumakani earn 73.4 cents for every dollar earned by a man.
What is Inequality or Gini Index in Kaumakani?
Inequality or Gini Index in Kaumakani is 0.39.
What is the Total Population of Kaumakani?
Total Population of Kaumakani is 1,498.
What is the Total Male Population of Kaumakani?
Total Male Population of Kaumakani is 883.
What is the Total Female Population of Kaumakani?
Total Female Population of Kaumakani is 615.
What is the Ratio of Males per 100 Females in Kaumakani?
There are 143.58 Males per 100 Females in Kaumakani.
What is the Ratio of Females per 100 Males in Kaumakani?
There are 69.65 Females per 100 Males in Kaumakani.
What is the Median Population Age in Kaumakani?
Median Population Age in Kaumakani is 39.5 Years.
What is the Average Family Size in Kaumakani
Average Family Size in Kaumakani is 4.8 People.
What is the Average Household Size in Kaumakani
Average Household Size in Kaumakani is 5.0 People.
How Large is the Labor Force in Kaumakani?
There are 853 People in the Labor Forcein in Kaumakani.
What is the Percentage of People in the Labor Force in Kaumakani?
69.1% of People are in the Labor Force in Kaumakani.
What is the Unemployment Rate in Kaumakani?
Unemployment Rate in Kaumakani is 1.9%.