Farmville, NC Map & Demographics
Farmville Map
Farmville Overview
$31,520
PER CAPITA INCOME
$83,269
AVG FAMILY INCOME
$47,604
AVG HOUSEHOLD INCOME
42.2%
WAGE / INCOME GAP [ % ]
57.8¢/ $1
WAGE / INCOME GAP [ $ ]
0.46
INEQUALITY / GINI INDEX
4,474
TOTAL POPULATION
2,006
MALE POPULATION
2,468
FEMALE POPULATION
81.28
MALES / 100 FEMALES
123.03
FEMALES / 100 MALES
46.8
MEDIAN AGE
2.8
AVG FAMILY SIZE
2.1
AVG HOUSEHOLD SIZE
1,950
LABOR FORCE [ PEOPLE ]
55.5%
PERCENT IN LABOR FORCE
2.4%
UNEMPLOYMENT RATE
Farmville Zip Codes
Farmville Area Codes
Income in Farmville
Income Overview in Farmville
Per Capita Income in Farmville is $31,520, while median incomes of families and households are $83,269 and $47,604 respectively.
| Characteristic | Number | Measure |
| Per Capita Income | 4,474 | $31,520 |
| Median Family Income | 1,278 | $83,269 |
| Mean Family Income | 1,278 | $81,849 |
| Median Household Income | 2,094 | $47,604 |
| Mean Household Income | 2,094 | $69,326 |
| Income Deficit | 1,278 | $0 |
| Wage / Income Gap (%) | 4,474 | 42.19% |
| Wage / Income Gap ($) | 4,474 | 57.81¢ per $1 |
| Gini / Inequality Index | 4,474 | 0.46 |
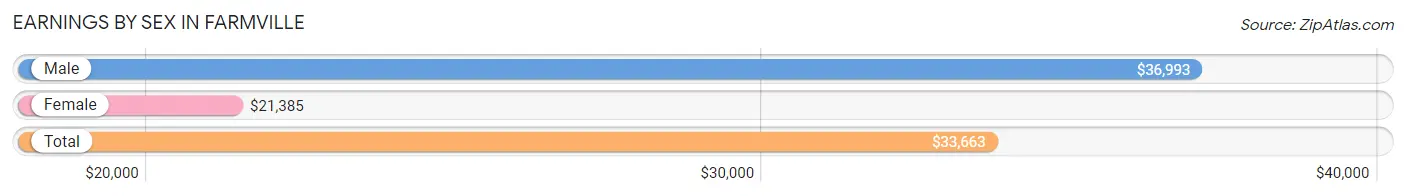
Earnings by Sex in Farmville
Average Earnings in Farmville are $33,663, $36,993 for men and $21,385 for women, a difference of 42.2%.
| Sex | Number | Average Earnings |
| Male | 866 (42.7%) | $36,993 |
| Female | 1,164 (57.3%) | $21,385 |
| Total | 2,030 (100.0%) | $33,663 |
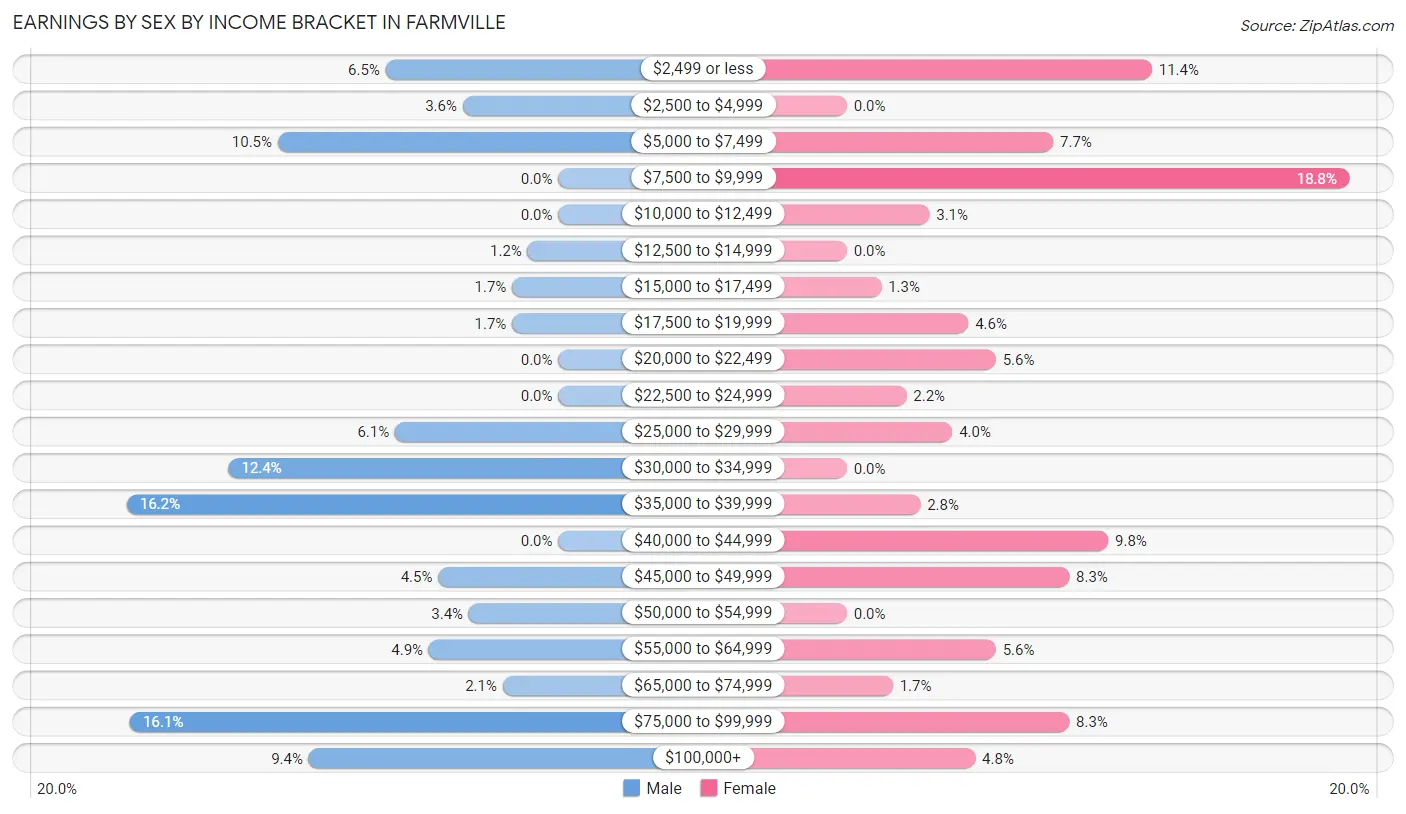
Earnings by Sex by Income Bracket in Farmville
The most common earnings brackets in Farmville are $35,000 to $39,999 for men (140 | 16.2%) and $7,500 to $9,999 for women (219 | 18.8%).
| Income | Male | Female |
| $2,499 or less | 56 (6.5%) | 133 (11.4%) |
| $2,500 to $4,999 | 31 (3.6%) | 0 (0.0%) |
| $5,000 to $7,499 | 91 (10.5%) | 90 (7.7%) |
| $7,500 to $9,999 | 0 (0.0%) | 219 (18.8%) |
| $10,000 to $12,499 | 0 (0.0%) | 36 (3.1%) |
| $12,500 to $14,999 | 10 (1.1%) | 0 (0.0%) |
| $15,000 to $17,499 | 15 (1.7%) | 15 (1.3%) |
| $17,500 to $19,999 | 15 (1.7%) | 53 (4.5%) |
| $20,000 to $22,499 | 0 (0.0%) | 65 (5.6%) |
| $22,500 to $24,999 | 0 (0.0%) | 26 (2.2%) |
| $25,000 to $29,999 | 53 (6.1%) | 46 (4.0%) |
| $30,000 to $34,999 | 107 (12.4%) | 0 (0.0%) |
| $35,000 to $39,999 | 140 (16.2%) | 32 (2.8%) |
| $40,000 to $44,999 | 0 (0.0%) | 114 (9.8%) |
| $45,000 to $49,999 | 39 (4.5%) | 97 (8.3%) |
| $50,000 to $54,999 | 29 (3.4%) | 0 (0.0%) |
| $55,000 to $64,999 | 42 (4.9%) | 65 (5.6%) |
| $65,000 to $74,999 | 18 (2.1%) | 20 (1.7%) |
| $75,000 to $99,999 | 139 (16.1%) | 97 (8.3%) |
| $100,000+ | 81 (9.3%) | 56 (4.8%) |
| Total | 866 (100.0%) | 1,164 (100.0%) |
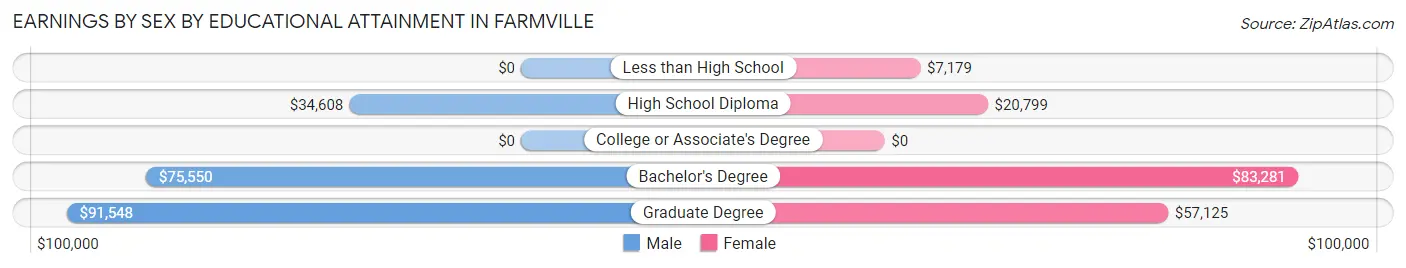
Earnings by Sex by Educational Attainment in Farmville
Average earnings in Farmville are $37,210 for men and $25,700 for women, a difference of 30.9%. Men with an educational attainment of graduate degree enjoy the highest average annual earnings of $91,548, while those with high school diploma education earn the least with $34,608. Women with an educational attainment of bachelor's degree earn the most with the average annual earnings of $83,281, while those with less than high school education have the smallest earnings of $7,179.
| Educational Attainment | Male Income | Female Income |
| Less than High School | - | - |
| High School Diploma | $34,608 | $20,799 |
| College or Associate's Degree | - | - |
| Bachelor's Degree | $75,550 | $83,281 |
| Graduate Degree | $91,548 | $57,125 |
| Total | $37,210 | $25,700 |
Family Income in Farmville
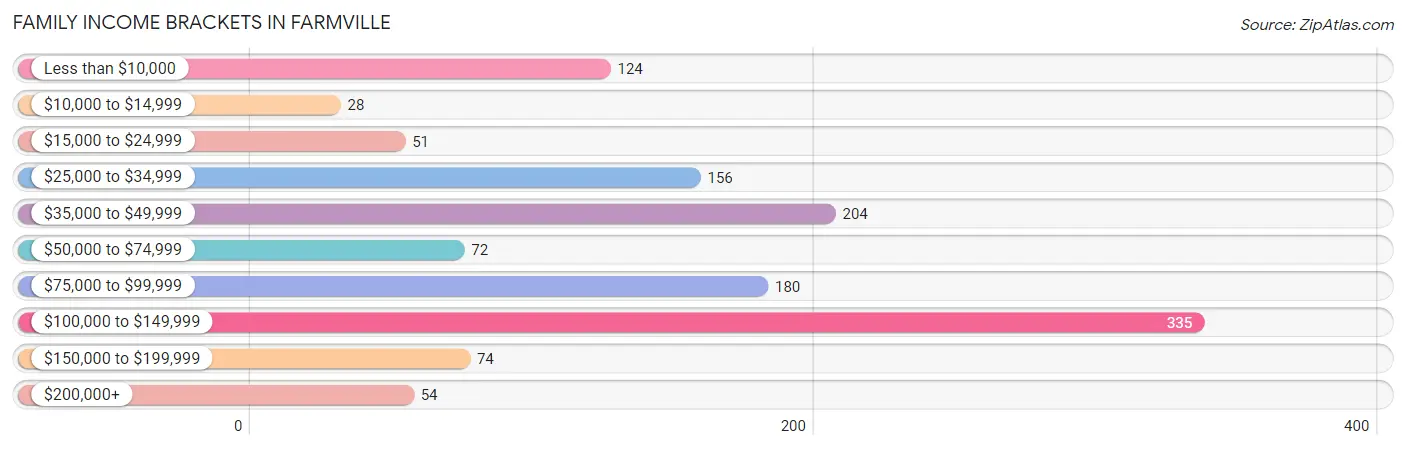
Family Income Brackets in Farmville
According to the Farmville family income data, there are 335 families falling into the $100,000 to $149,999 income range, which is the most common income bracket and makes up 26.2% of all families. Conversely, the $10,000 to $14,999 income bracket is the least frequent group with only 28 families (2.2%) belonging to this category.
| Income Bracket | # Families | % Families |
| Less than $10,000 | 124 | 9.7% |
| $10,000 to $14,999 | 28 | 2.2% |
| $15,000 to $24,999 | 51 | 4.0% |
| $25,000 to $34,999 | 156 | 12.2% |
| $35,000 to $49,999 | 204 | 16.0% |
| $50,000 to $74,999 | 72 | 5.6% |
| $75,000 to $99,999 | 180 | 14.1% |
| $100,000 to $149,999 | 335 | 26.2% |
| $150,000 to $199,999 | 74 | 5.8% |
| $200,000+ | 54 | 4.2% |
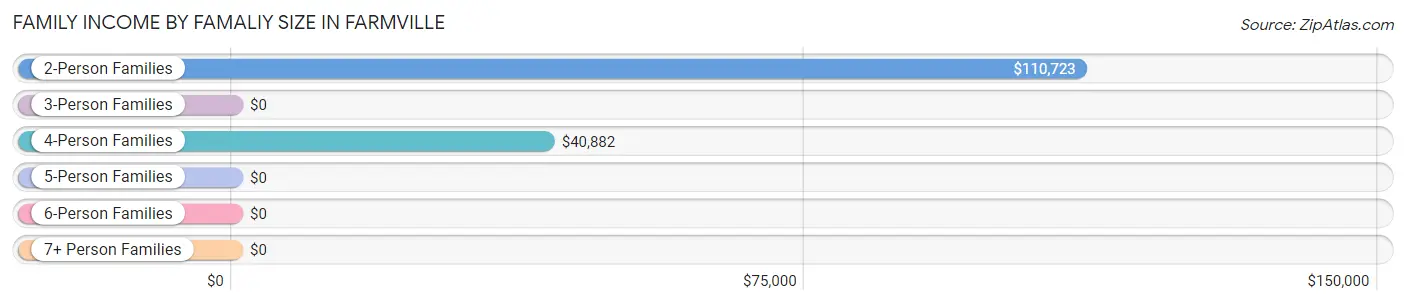
Family Income by Famaliy Size in Farmville
2-person families (549 | 43.0%) account for the highest median family income in Farmville with $110,723 per family, while 2-person families (549 | 43.0%) have the highest median income of $55,362 per family member.
| Income Bracket | # Families | Median Income |
| 2-Person Families | 549 (43.0%) | $110,723 |
| 3-Person Families | 444 (34.7%) | $0 |
| 4-Person Families | 240 (18.8%) | $40,882 |
| 5-Person Families | 0 (0.0%) | $0 |
| 6-Person Families | 45 (3.5%) | $0 |
| 7+ Person Families | 0 (0.0%) | $0 |
| Total | 1,278 (100.0%) | $83,269 |
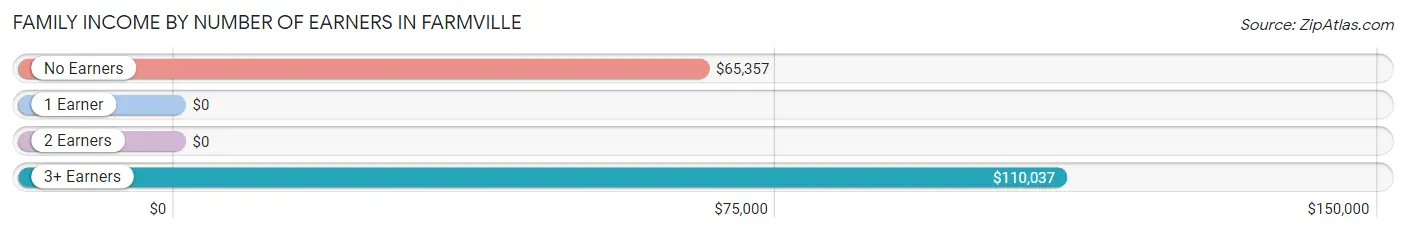
Family Income by Number of Earners in Farmville
| Number of Earners | # Families | Median Income |
| No Earners | 102 (8.0%) | $65,357 |
| 1 Earner | 718 (56.2%) | $0 |
| 2 Earners | 391 (30.6%) | $0 |
| 3+ Earners | 67 (5.2%) | $110,037 |
| Total | 1,278 (100.0%) | $83,269 |
Household Income in Farmville
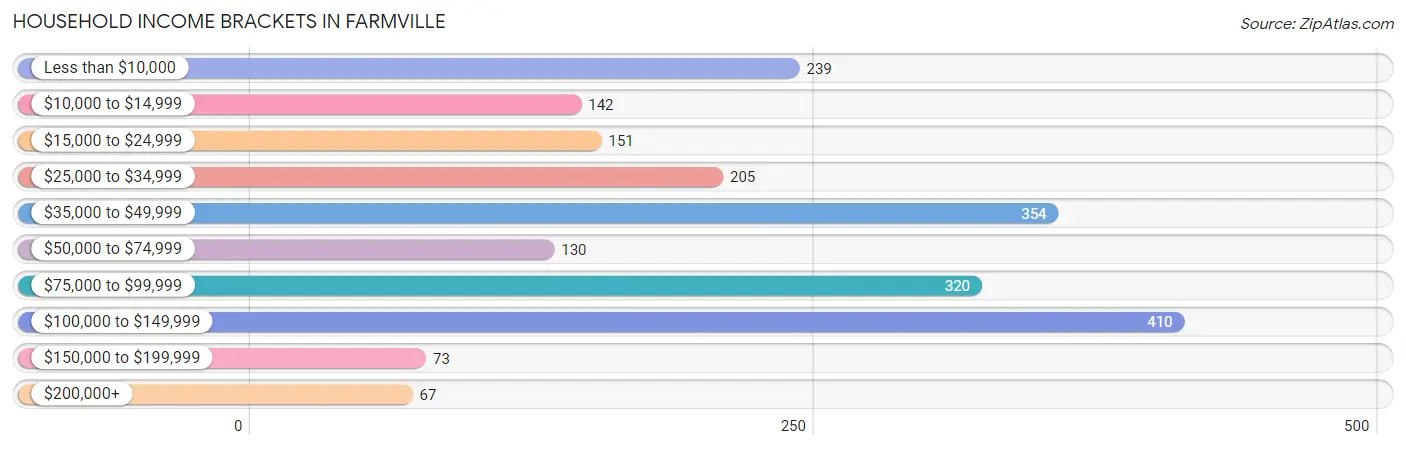
Household Income Brackets in Farmville
With 410 households falling in the category, the $100,000 to $149,999 income range is the most frequent in Farmville, accounting for 19.6% of all households. In contrast, only 67 households (3.2%) fall into the $200,000+ income bracket, making it the least populous group.
| Income Bracket | # Households | % Households |
| Less than $10,000 | 239 | 11.4% |
| $10,000 to $14,999 | 142 | 6.8% |
| $15,000 to $24,999 | 151 | 7.2% |
| $25,000 to $34,999 | 205 | 9.8% |
| $35,000 to $49,999 | 354 | 16.9% |
| $50,000 to $74,999 | 130 | 6.2% |
| $75,000 to $99,999 | 320 | 15.3% |
| $100,000 to $149,999 | 410 | 19.6% |
| $150,000 to $199,999 | 73 | 3.5% |
| $200,000+ | 67 | 3.2% |
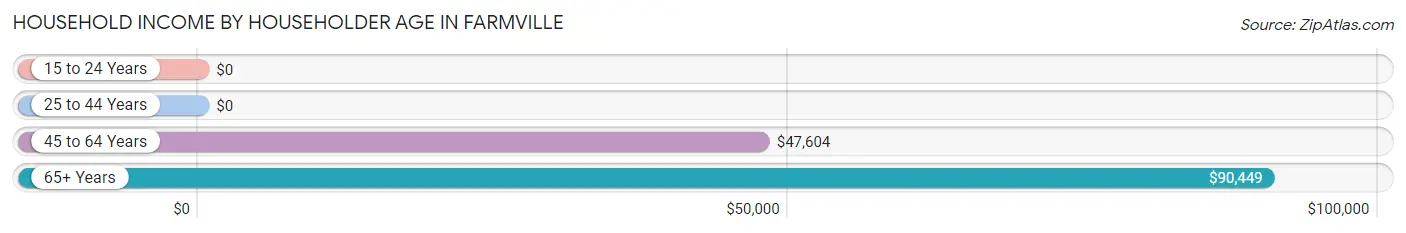
Household Income by Householder Age in Farmville
The median household income in Farmville is $47,604, with the highest median household income of $90,449 found in the 65+ years age bracket for the primary householder. A total of 826 households (39.5%) fall into this category. Meanwhile, the 15 to 24 years age bracket for the primary householder has the lowest median household income of $0, with 18 households (0.9%) in this group.
| Income Bracket | # Households | Median Income |
| 15 to 24 Years | 18 (0.9%) | $0 |
| 25 to 44 Years | 508 (24.3%) | $0 |
| 45 to 64 Years | 742 (35.4%) | $47,604 |
| 65+ Years | 826 (39.5%) | $90,449 |
| Total | 2,094 (100.0%) | $47,604 |
Poverty in Farmville
Income Below Poverty by Sex and Age in Farmville
With 23.8% poverty level for males and 29.7% for females among the residents of Farmville, 12 to 14 year old males and 5 year old females are the most vulnerable to poverty, with 111 males (90.2%) and 72 females (100.0%) in their respective age groups living below the poverty level.
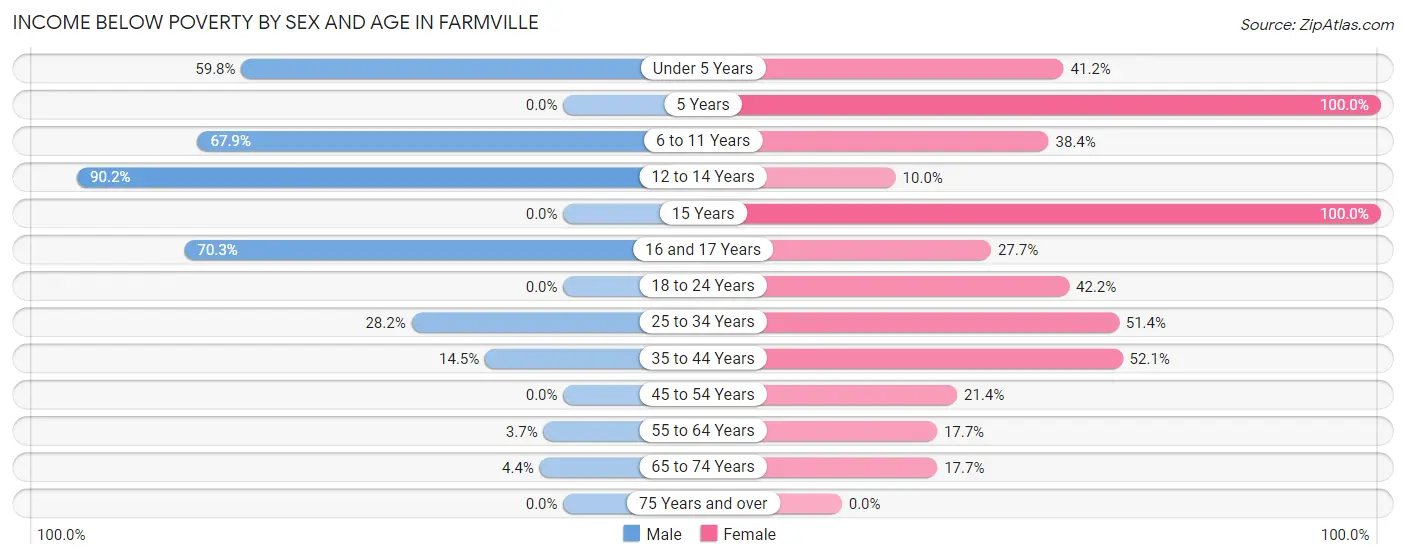
| Age Bracket | Male | Female |
| Under 5 Years | 52 (59.8%) | 28 (41.2%) |
| 5 Years | 0 (0.0%) | 72 (100.0%) |
| 6 to 11 Years | 131 (67.9%) | 86 (38.4%) |
| 12 to 14 Years | 111 (90.2%) | 13 (10.0%) |
| 15 Years | 0 (0.0%) | 15 (100.0%) |
| 16 and 17 Years | 64 (70.3%) | 18 (27.7%) |
| 18 to 24 Years | 0 (0.0%) | 54 (42.2%) |
| 25 to 34 Years | 64 (28.2%) | 146 (51.4%) |
| 35 to 44 Years | 27 (14.5%) | 98 (52.1%) |
| 45 to 54 Years | 0 (0.0%) | 46 (21.4%) |
| 55 to 64 Years | 10 (3.7%) | 62 (17.7%) |
| 65 to 74 Years | 19 (4.4%) | 79 (17.7%) |
| 75 Years and over | 0 (0.0%) | 0 (0.0%) |
| Total | 478 (23.8%) | 717 (29.7%) |
Income Above Poverty by Sex and Age in Farmville
According to the poverty statistics in Farmville, males aged 15 years and females aged 75 years and over are the age groups that are most secure financially, with 100.0% of males and 100.0% of females in these age groups living above the poverty line.
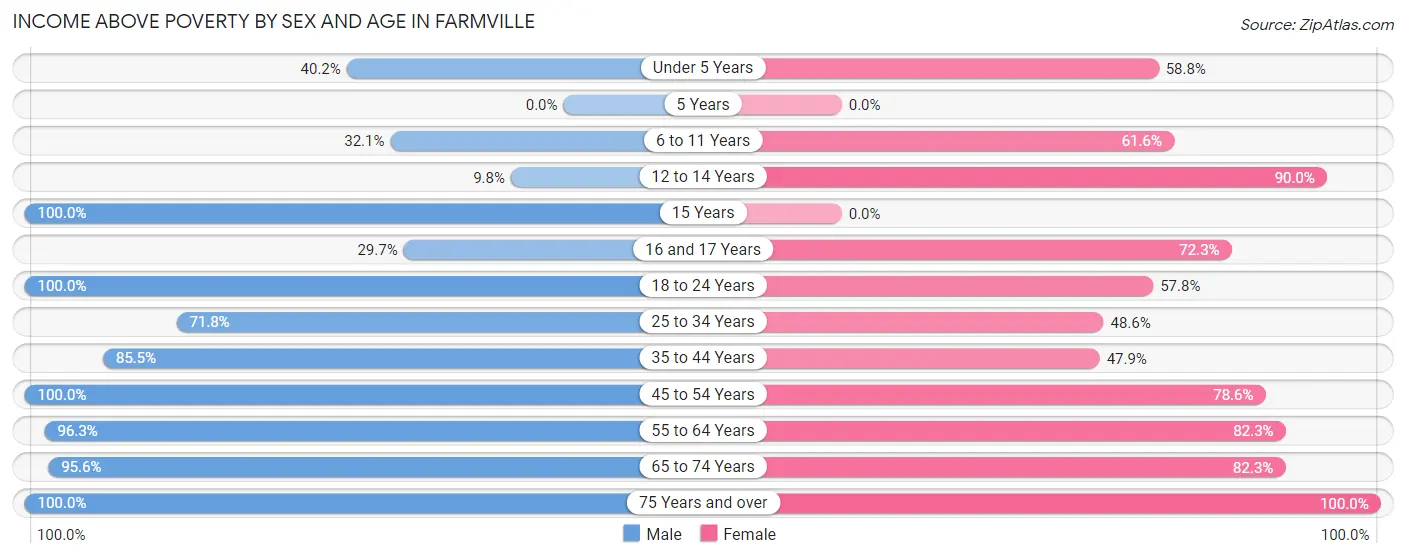
| Age Bracket | Male | Female |
| Under 5 Years | 35 (40.2%) | 40 (58.8%) |
| 5 Years | 0 (0.0%) | 0 (0.0%) |
| 6 to 11 Years | 62 (32.1%) | 138 (61.6%) |
| 12 to 14 Years | 12 (9.8%) | 117 (90.0%) |
| 15 Years | 48 (100.0%) | 0 (0.0%) |
| 16 and 17 Years | 27 (29.7%) | 47 (72.3%) |
| 18 to 24 Years | 59 (100.0%) | 74 (57.8%) |
| 25 to 34 Years | 163 (71.8%) | 138 (48.6%) |
| 35 to 44 Years | 159 (85.5%) | 90 (47.9%) |
| 45 to 54 Years | 143 (100.0%) | 169 (78.6%) |
| 55 to 64 Years | 261 (96.3%) | 289 (82.3%) |
| 65 to 74 Years | 414 (95.6%) | 367 (82.3%) |
| 75 Years and over | 145 (100.0%) | 228 (100.0%) |
| Total | 1,528 (76.2%) | 1,697 (70.3%) |
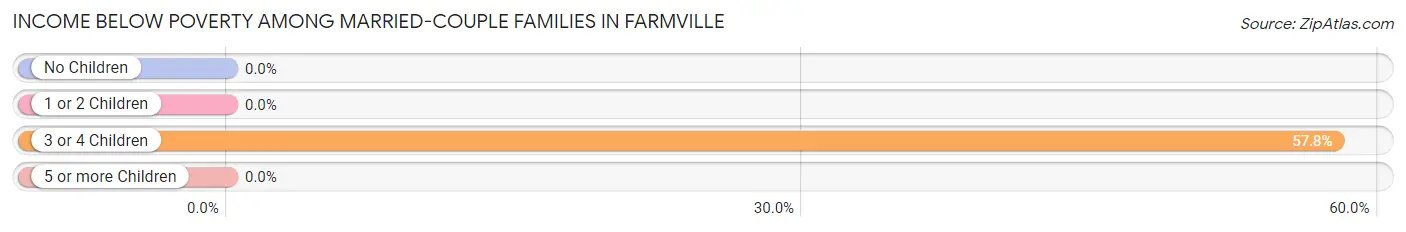
Income Below Poverty Among Married-Couple Families in Farmville
The poverty statistics for married-couple families in Farmville show that 3.7% or 26 of the total 710 families live below the poverty line. Families with 3 or 4 children have the highest poverty rate of 57.8%, comprising of 26 families. On the other hand, families with no children have the lowest poverty rate of 0.0%, which includes 0 families.
| Children | Above Poverty | Below Poverty |
| No Children | 483 (100.0%) | 0 (0.0%) |
| 1 or 2 Children | 182 (100.0%) | 0 (0.0%) |
| 3 or 4 Children | 19 (42.2%) | 26 (57.8%) |
| 5 or more Children | 0 (0.0%) | 0 (0.0%) |
| Total | 684 (96.3%) | 26 (3.7%) |
Income Below Poverty Among Single-Parent Households in Farmville
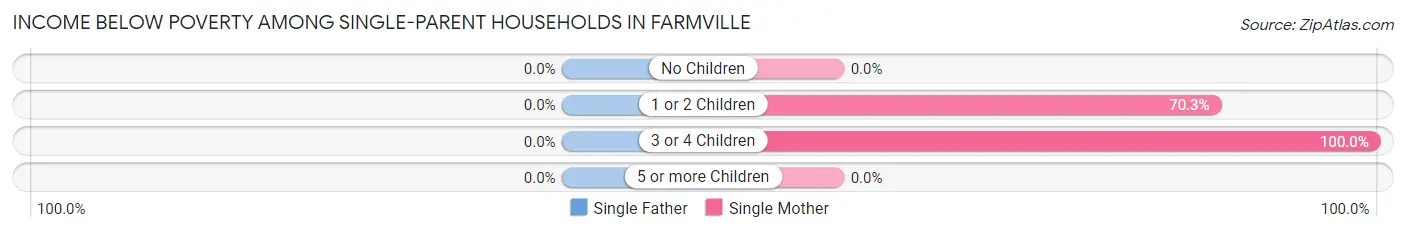
| Children | Single Father | Single Mother |
| No Children | 0 (0.0%) | 0 (0.0%) |
| 1 or 2 Children | 0 (0.0%) | 128 (70.3%) |
| 3 or 4 Children | 0 (0.0%) | 90 (100.0%) |
| 5 or more Children | 0 (0.0%) | 0 (0.0%) |
| Total | 0 (0.0%) | 218 (55.9%) |
Income Below Poverty Among Married-Couple vs Single-Parent Households in Farmville
The poverty data for Farmville shows that 26 of the married-couple family households (3.7%) and 218 of the single-parent households (38.4%) are living below the poverty level. Within the married-couple family households, those with 3 or 4 children have the highest poverty rate, with 26 households (57.8%) falling below the poverty line. Among the single-parent households, those with 3 or 4 children have the highest poverty rate, with 90 household (100.0%) living below poverty.
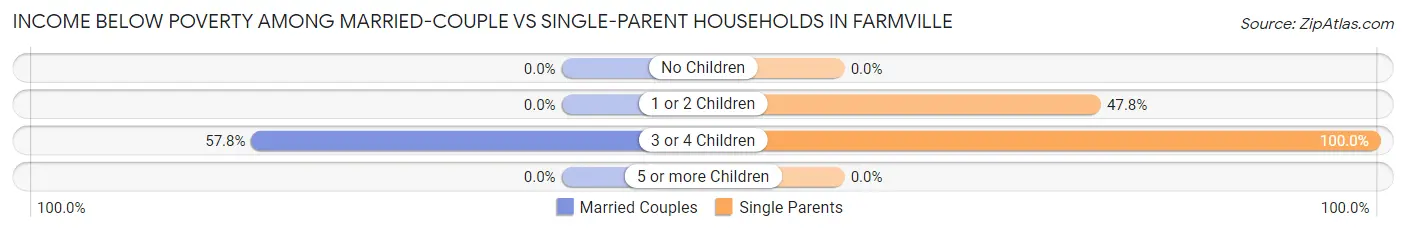
| Children | Married-Couple Families | Single-Parent Households |
| No Children | 0 (0.0%) | 0 (0.0%) |
| 1 or 2 Children | 0 (0.0%) | 128 (47.8%) |
| 3 or 4 Children | 26 (57.8%) | 90 (100.0%) |
| 5 or more Children | 0 (0.0%) | 0 (0.0%) |
| Total | 26 (3.7%) | 218 (38.4%) |
Race in Farmville
The most populous races in Farmville are White / Caucasian (2,109 | 47.1%), Black / African American (2,045 | 45.7%), and Two or more Races (320 | 7.1%).
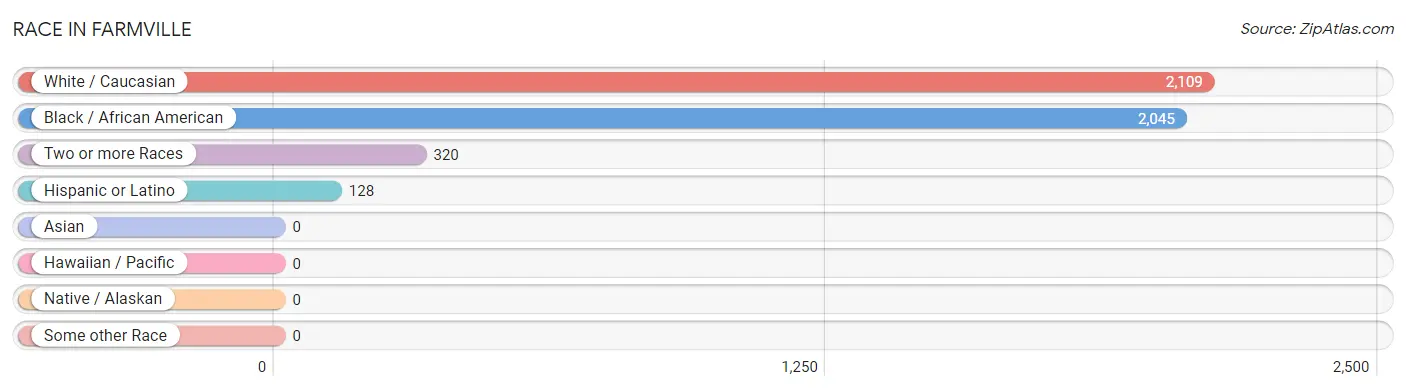
| Race | # Population | % Population |
| Asian | 0 | 0.0% |
| Black / African American | 2,045 | 45.7% |
| Hawaiian / Pacific | 0 | 0.0% |
| Hispanic or Latino | 128 | 2.9% |
| Native / Alaskan | 0 | 0.0% |
| White / Caucasian | 2,109 | 47.1% |
| Two or more Races | 320 | 7.1% |
| Some other Race | 0 | 0.0% |
| Total | 4,474 | 100.0% |
Ancestry in Farmville
The most populous ancestries reported in Farmville are English (446 | 10.0%), American (411 | 9.2%), German (184 | 4.1%), Irish (141 | 3.2%), and Jamaican (129 | 2.9%), together accounting for 29.3% of all Farmville residents.
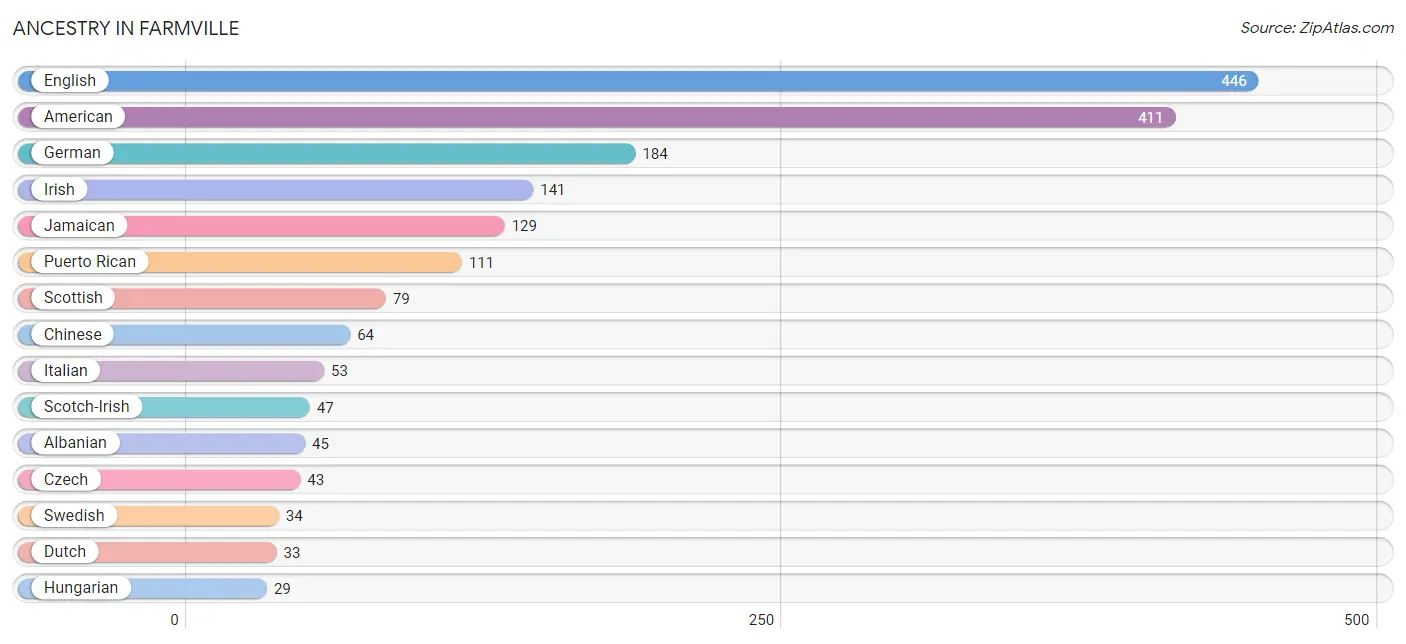
| Ancestry | # Population | % Population |
| African | 26 | 0.6% |
| Albanian | 45 | 1.0% |
| American | 411 | 9.2% |
| Central American | 17 | 0.4% |
| Chinese | 64 | 1.4% |
| Czech | 43 | 1.0% |
| Dutch | 33 | 0.7% |
| English | 446 | 10.0% |
| German | 184 | 4.1% |
| Honduran | 17 | 0.4% |
| Hungarian | 29 | 0.6% |
| Irish | 141 | 3.2% |
| Italian | 53 | 1.2% |
| Jamaican | 129 | 2.9% |
| Norwegian | 13 | 0.3% |
| Pakistani | 13 | 0.3% |
| Polish | 17 | 0.4% |
| Puerto Rican | 111 | 2.5% |
| Romanian | 13 | 0.3% |
| Russian | 19 | 0.4% |
| Scotch-Irish | 47 | 1.1% |
| Scottish | 79 | 1.8% |
| Subsaharan African | 26 | 0.6% |
| Swedish | 34 | 0.8% |
| Welsh | 23 | 0.5% | View All 25 Rows |
Immigrants in Farmville
The most numerous immigrant groups reported in Farmville came from Europe (46 | 1.0%), Canada (37 | 0.8%), Eastern Europe (32 | 0.7%), Russia (19 | 0.4%), and Northern Europe (14 | 0.3%), together accounting for 3.3% of all Farmville residents.
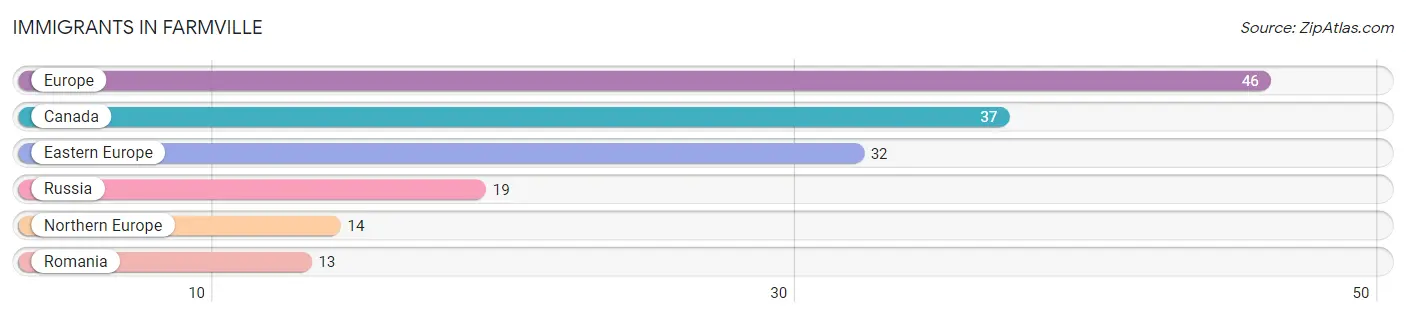
| Immigration Origin | # Population | % Population |
| Canada | 37 | 0.8% |
| Eastern Europe | 32 | 0.7% |
| Europe | 46 | 1.0% |
| Northern Europe | 14 | 0.3% |
| Romania | 13 | 0.3% |
| Russia | 19 | 0.4% | View All 6 Rows |
Sex and Age in Farmville
Sex and Age in Farmville
The most populous age groups in Farmville are 65 to 69 Years (322 | 16.1%) for men and 65 to 69 Years (358 | 14.5%) for women.
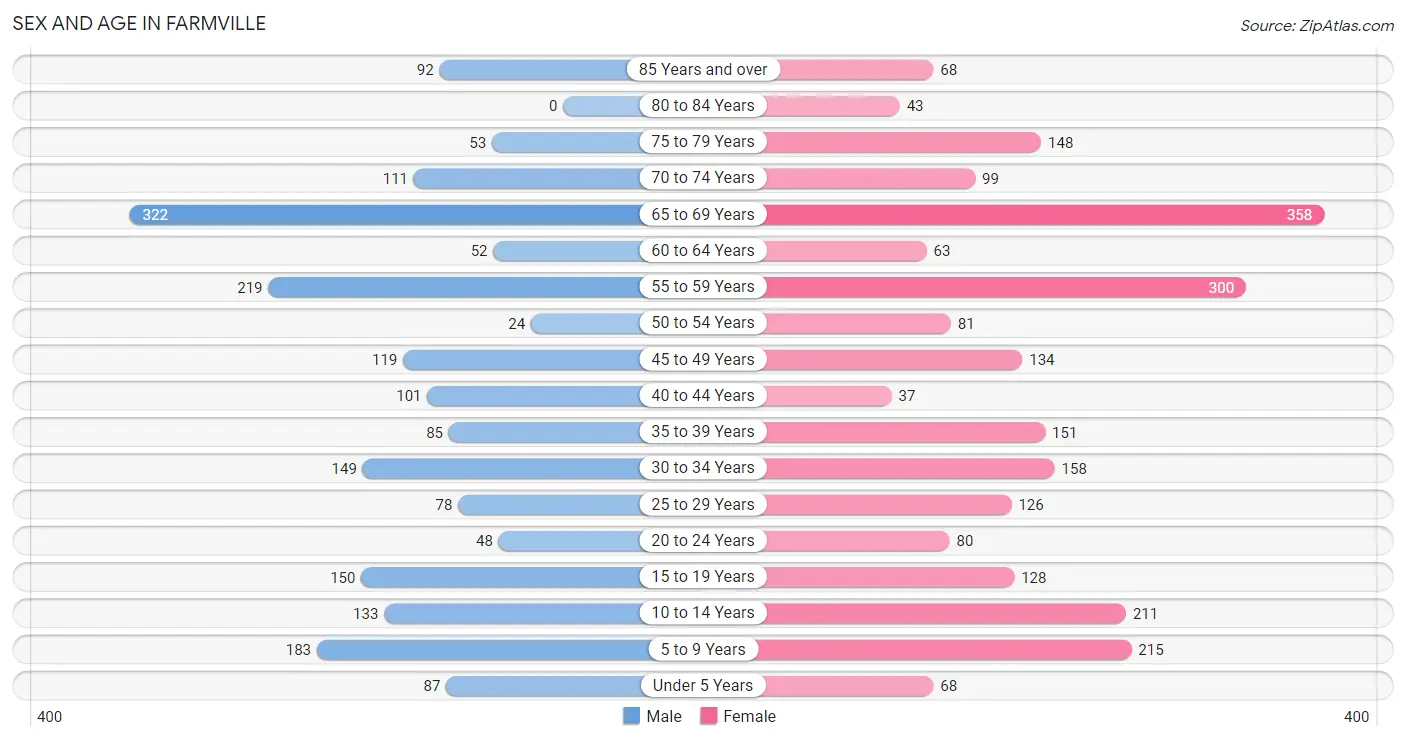
| Age Bracket | Male | Female |
| Under 5 Years | 87 (4.3%) | 68 (2.8%) |
| 5 to 9 Years | 183 (9.1%) | 215 (8.7%) |
| 10 to 14 Years | 133 (6.6%) | 211 (8.6%) |
| 15 to 19 Years | 150 (7.5%) | 128 (5.2%) |
| 20 to 24 Years | 48 (2.4%) | 80 (3.2%) |
| 25 to 29 Years | 78 (3.9%) | 126 (5.1%) |
| 30 to 34 Years | 149 (7.4%) | 158 (6.4%) |
| 35 to 39 Years | 85 (4.2%) | 151 (6.1%) |
| 40 to 44 Years | 101 (5.0%) | 37 (1.5%) |
| 45 to 49 Years | 119 (5.9%) | 134 (5.4%) |
| 50 to 54 Years | 24 (1.2%) | 81 (3.3%) |
| 55 to 59 Years | 219 (10.9%) | 300 (12.2%) |
| 60 to 64 Years | 52 (2.6%) | 63 (2.5%) |
| 65 to 69 Years | 322 (16.1%) | 358 (14.5%) |
| 70 to 74 Years | 111 (5.5%) | 99 (4.0%) |
| 75 to 79 Years | 53 (2.6%) | 148 (6.0%) |
| 80 to 84 Years | 0 (0.0%) | 43 (1.7%) |
| 85 Years and over | 92 (4.6%) | 68 (2.8%) |
| Total | 2,006 (100.0%) | 2,468 (100.0%) |
Families and Households in Farmville
Median Family Size in Farmville
The median family size in Farmville is 2.75 persons per family, with single female/mother families (390 | 30.5%) accounting for the largest median family size of 3.11 persons per family. On the other hand, single male/father families (178 | 13.9%) represent the smallest median family size with 2.47 persons per family.
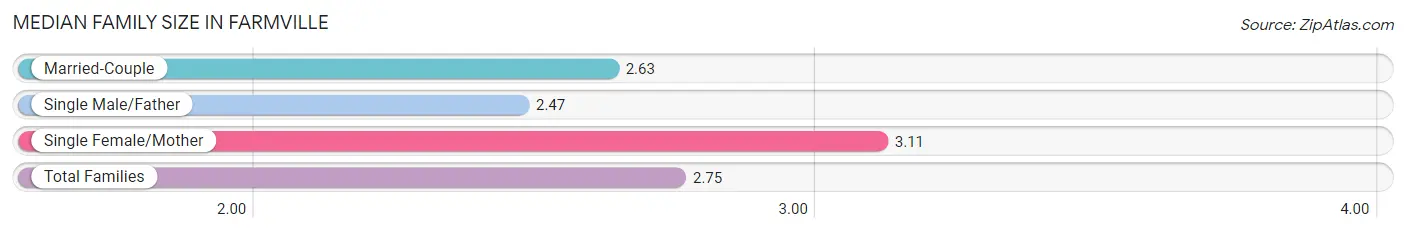
| Family Type | # Families | Family Size |
| Married-Couple | 710 (55.6%) | 2.63 |
| Single Male/Father | 178 (13.9%) | 2.47 |
| Single Female/Mother | 390 (30.5%) | 3.11 |
| Total Families | 1,278 (100.0%) | 2.75 |
Median Household Size in Farmville
The median household size in Farmville is 2.11 persons per household, with single female/mother households (390 | 18.6%) accounting for the largest median household size of 3.16 persons per household. non-family households (816 | 39.0%) represent the smallest median household size with 1.04 persons per household.
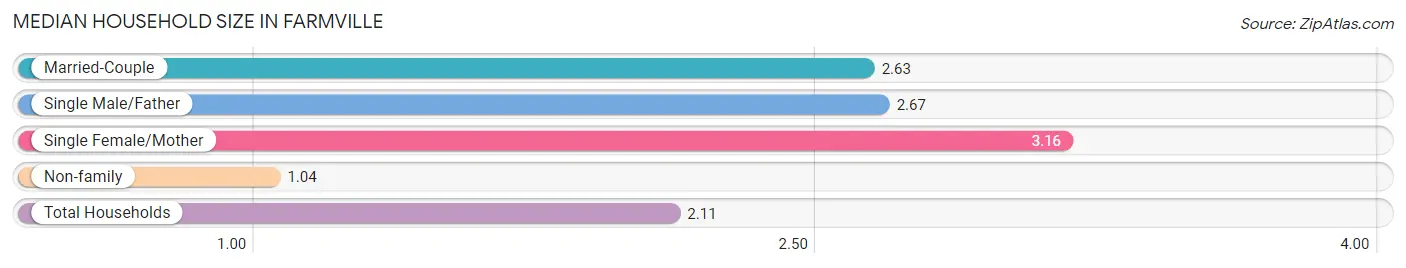
| Household Type | # Households | Household Size |
| Married-Couple | 710 (33.9%) | 2.63 |
| Single Male/Father | 178 (8.5%) | 2.67 |
| Single Female/Mother | 390 (18.6%) | 3.16 |
| Non-family | 816 (39.0%) | 1.04 |
| Total Households | 2,094 (100.0%) | 2.11 |
Household Size by Marriage Status in Farmville
Out of a total of 2,094 households in Farmville, 1,278 (61.0%) are family households, while 816 (39.0%) are nonfamily households. The most numerous type of family households are 2-person households, comprising 549, and the most common type of nonfamily households are 1-person households, comprising 785.
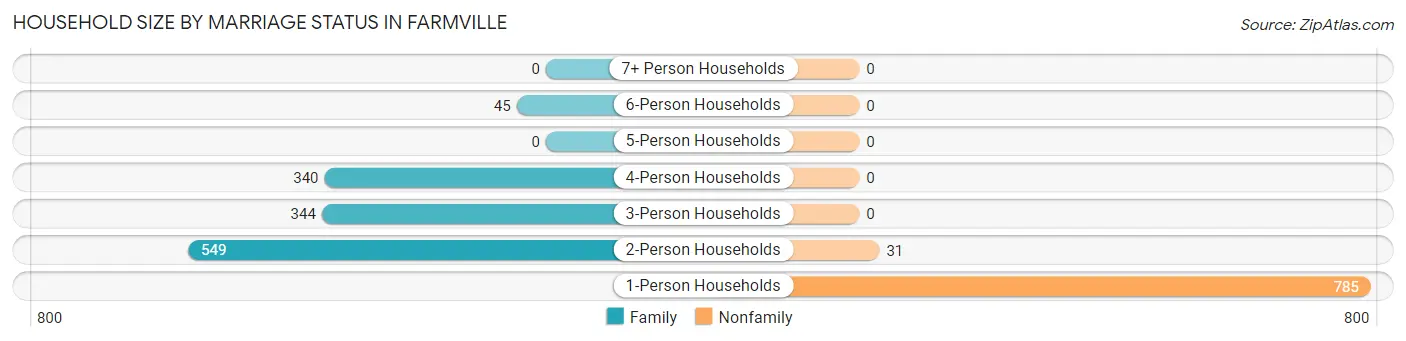
| Household Size | Family Households | Nonfamily Households |
| 1-Person Households | - | 785 (37.5%) |
| 2-Person Households | 549 (26.2%) | 31 (1.5%) |
| 3-Person Households | 344 (16.4%) | 0 (0.0%) |
| 4-Person Households | 340 (16.2%) | 0 (0.0%) |
| 5-Person Households | 0 (0.0%) | 0 (0.0%) |
| 6-Person Households | 45 (2.1%) | 0 (0.0%) |
| 7+ Person Households | 0 (0.0%) | 0 (0.0%) |
| Total | 1,278 (61.0%) | 816 (39.0%) |
Female Fertility in Farmville
Fertility by Age in Farmville
Average fertility rate in Farmville is 28.0 births per 1,000 women. Women in the age bracket of 20 to 34 years have the highest fertility rate with 63.0 births per 1,000 women. Women in the age bracket of 20 to 34 years acount for 100.0% of all women with births.
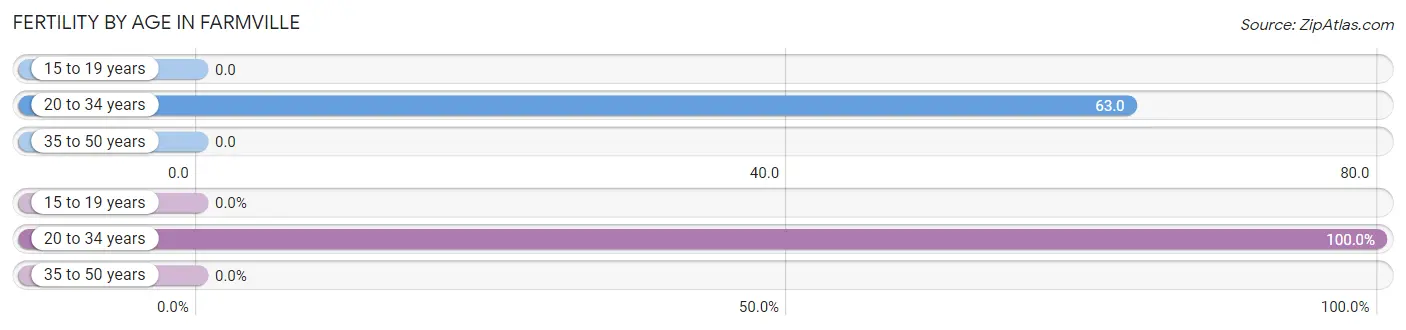
| Age Bracket | Women with Births | Births / 1,000 Women |
| 15 to 19 years | 0 (0.0%) | 0.0 |
| 20 to 34 years | 23 (100.0%) | 63.0 |
| 35 to 50 years | 0 (0.0%) | 0.0 |
| Total | 23 (100.0%) | 28.0 |
Fertility by Age by Marriage Status in Farmville
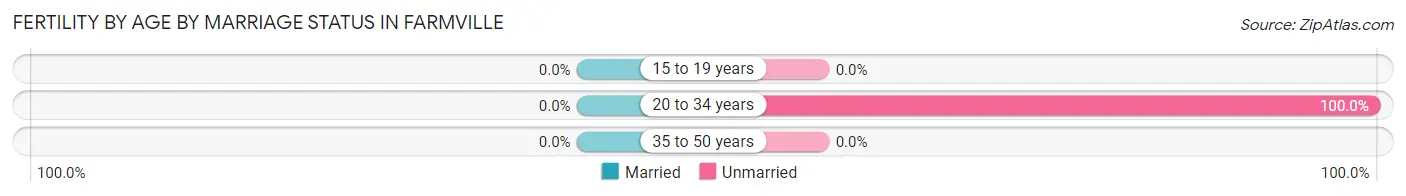
| Age Bracket | Married | Unmarried |
| 15 to 19 years | 0 (0.0%) | 0 (0.0%) |
| 20 to 34 years | 0 (0.0%) | 23 (100.0%) |
| 35 to 50 years | 0 (0.0%) | 0 (0.0%) |
| Total | 0 (0.0%) | 23 (100.0%) |
Fertility by Education in Farmville
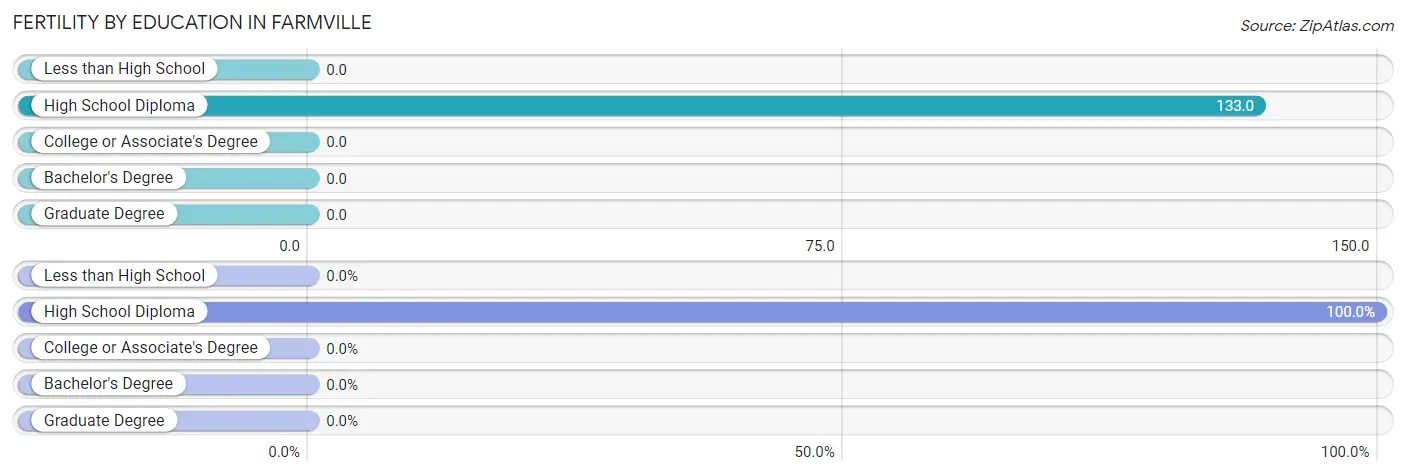
| Educational Attainment | Women with Births | Births / 1,000 Women |
| Less than High School | 0 (0.0%) | 0.0 |
| High School Diploma | 23 (100.0%) | 133.0 |
| College or Associate's Degree | 0 (0.0%) | 0.0 |
| Bachelor's Degree | 0 (0.0%) | 0.0 |
| Graduate Degree | 0 (0.0%) | 0.0 |
| Total | 23 (100.0%) | 28.0 |
Fertility by Education by Marriage Status in Farmville
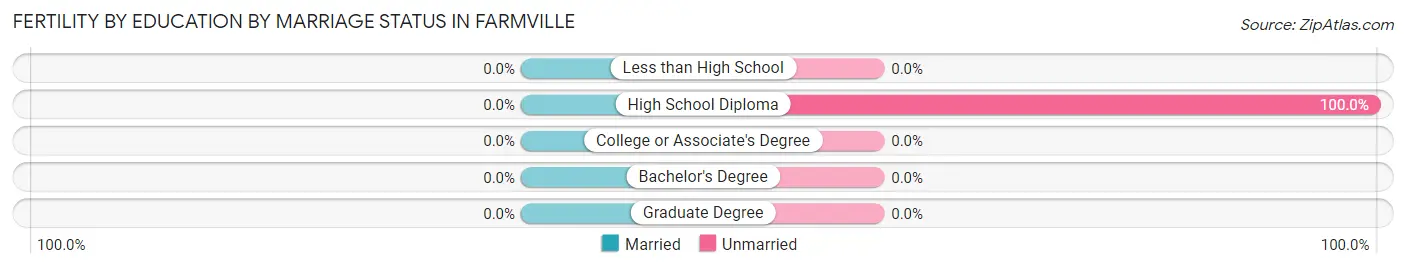
| Educational Attainment | Married | Unmarried |
| Less than High School | 0 (0.0%) | 0 (0.0%) |
| High School Diploma | 0 (0.0%) | 23 (100.0%) |
| College or Associate's Degree | 0 (0.0%) | 0 (0.0%) |
| Bachelor's Degree | 0 (0.0%) | 0 (0.0%) |
| Graduate Degree | 0 (0.0%) | 0 (0.0%) |
| Total | 0 (0.0%) | 23 (100.0%) |
Employment Characteristics in Farmville
Employment by Class of Employer in Farmville
Among the 1,860 employed individuals in Farmville, private company employees (1,378 | 74.1%), not-for-profit organizations (157 | 8.4%), and local government employees (134 | 7.2%) make up the most common classes of employment.
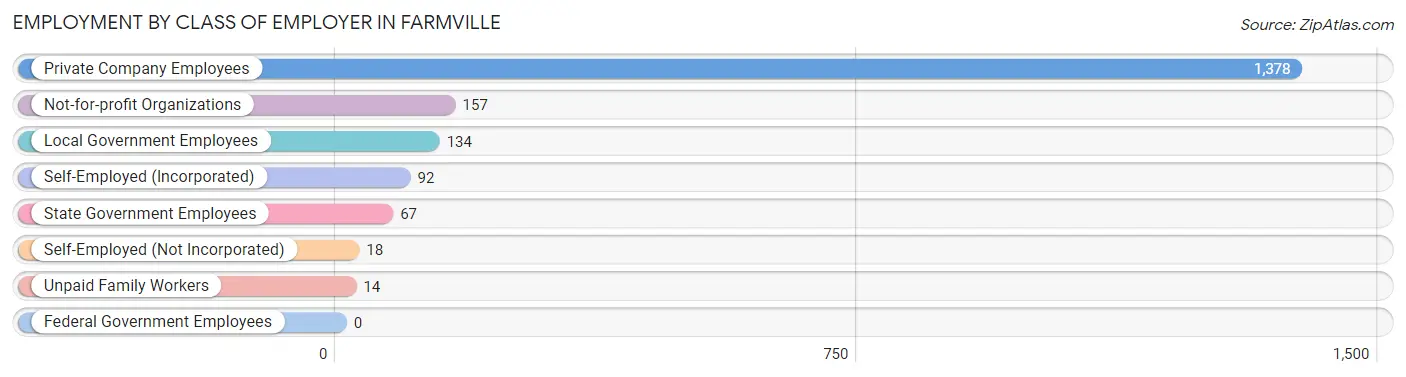
| Employer Class | # Employees | % Employees |
| Private Company Employees | 1,378 | 74.1% |
| Self-Employed (Incorporated) | 92 | 5.0% |
| Self-Employed (Not Incorporated) | 18 | 1.0% |
| Not-for-profit Organizations | 157 | 8.4% |
| Local Government Employees | 134 | 7.2% |
| State Government Employees | 67 | 3.6% |
| Federal Government Employees | 0 | 0.0% |
| Unpaid Family Workers | 14 | 0.7% |
| Total | 1,860 | 100.0% |
Employment Status by Age in Farmville
According to the labor force statistics for Farmville, out of the total population over 16 years of age (3,514), 55.5% or 1,950 individuals are in the labor force, with 2.4% or 47 of them unemployed. The age group with the highest labor force participation rate is 30 to 34 years, with 91.5% or 281 individuals in the labor force. Within the labor force, the 20 to 24 years age range has the highest percentage of unemployed individuals, with 13.0% or 15 of them being unemployed.
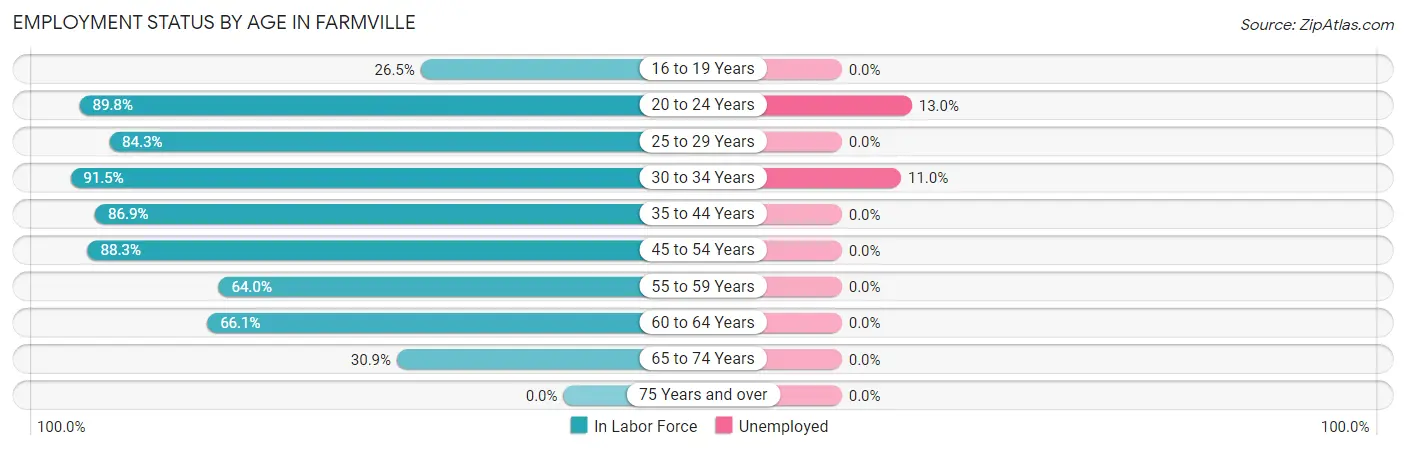
| Age Bracket | In Labor Force | Unemployed |
| 16 to 19 Years | 57 (26.5%) | 0 (0.0%) |
| 20 to 24 Years | 115 (89.8%) | 15 (13.0%) |
| 25 to 29 Years | 172 (84.3%) | 0 (0.0%) |
| 30 to 34 Years | 281 (91.5%) | 31 (11.0%) |
| 35 to 44 Years | 325 (86.9%) | 0 (0.0%) |
| 45 to 54 Years | 316 (88.3%) | 0 (0.0%) |
| 55 to 59 Years | 332 (64.0%) | 0 (0.0%) |
| 60 to 64 Years | 76 (66.1%) | 0 (0.0%) |
| 65 to 74 Years | 275 (30.9%) | 0 (0.0%) |
| 75 Years and over | 0 (0.0%) | 0 (0.0%) |
| Total | 1,950 (55.5%) | 47 (2.4%) |
Employment Status by Educational Attainment in Farmville
According to labor force statistics for Farmville, 80.0% of individuals (1,502) out of the total population between 25 and 64 years of age (1,877) are in the labor force, with 2.1% or 32 of them being unemployed. The group with the highest labor force participation rate are those with the educational attainment of bachelor's degree or higher, with 94.6% or 387 individuals in the labor force. Within the labor force, individuals with college / associate degree education have the highest percentage of unemployment, with 6.0% or 31 of them being unemployed.
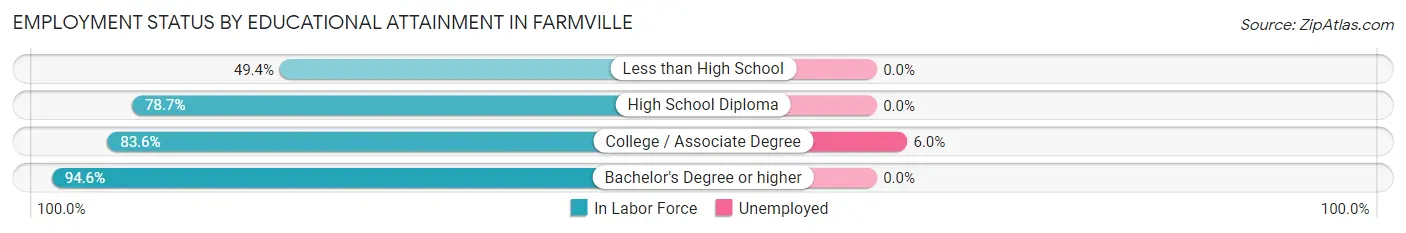
| Educational Attainment | In Labor Force | Unemployed |
| Less than High School | 119 (49.4%) | 0 (0.0%) |
| High School Diploma | 481 (78.7%) | 0 (0.0%) |
| College / Associate Degree | 515 (83.6%) | 37 (6.0%) |
| Bachelor's Degree or higher | 387 (94.6%) | 0 (0.0%) |
| Total | 1,502 (80.0%) | 39 (2.1%) |
Employment Occupations by Sex in Farmville
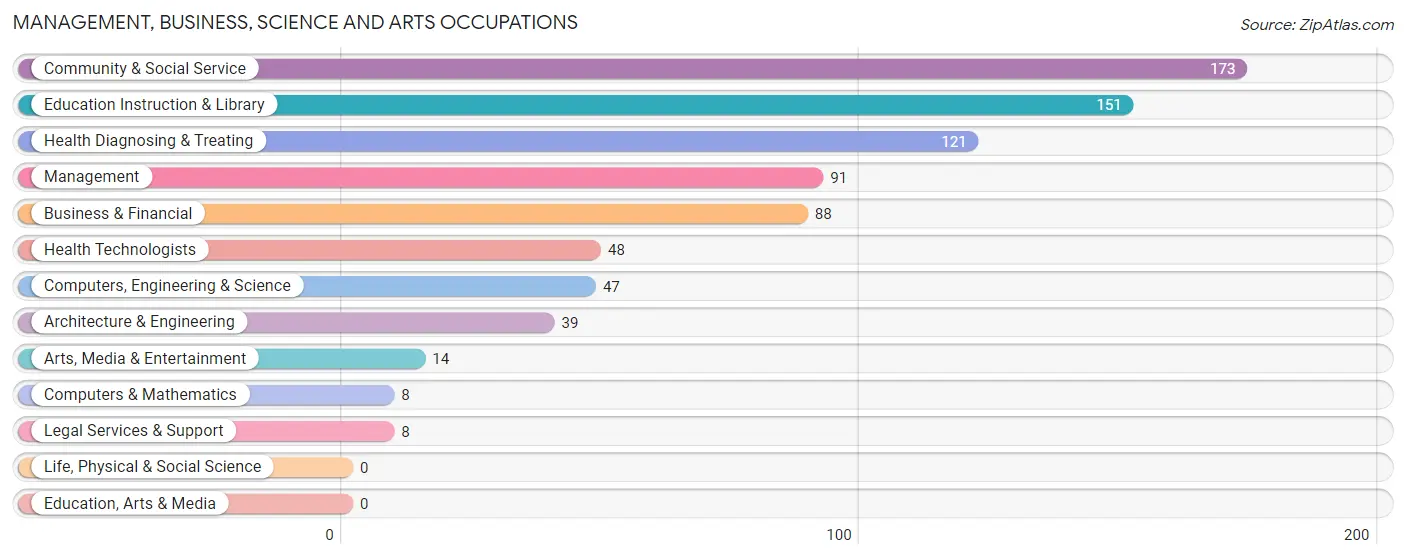
Management, Business, Science and Arts Occupations
The most common Management, Business, Science and Arts occupations in Farmville are Community & Social Service (173 | 9.1%), Education Instruction & Library (151 | 7.9%), Health Diagnosing & Treating (121 | 6.4%), Management (91 | 4.8%), and Business & Financial (88 | 4.6%).
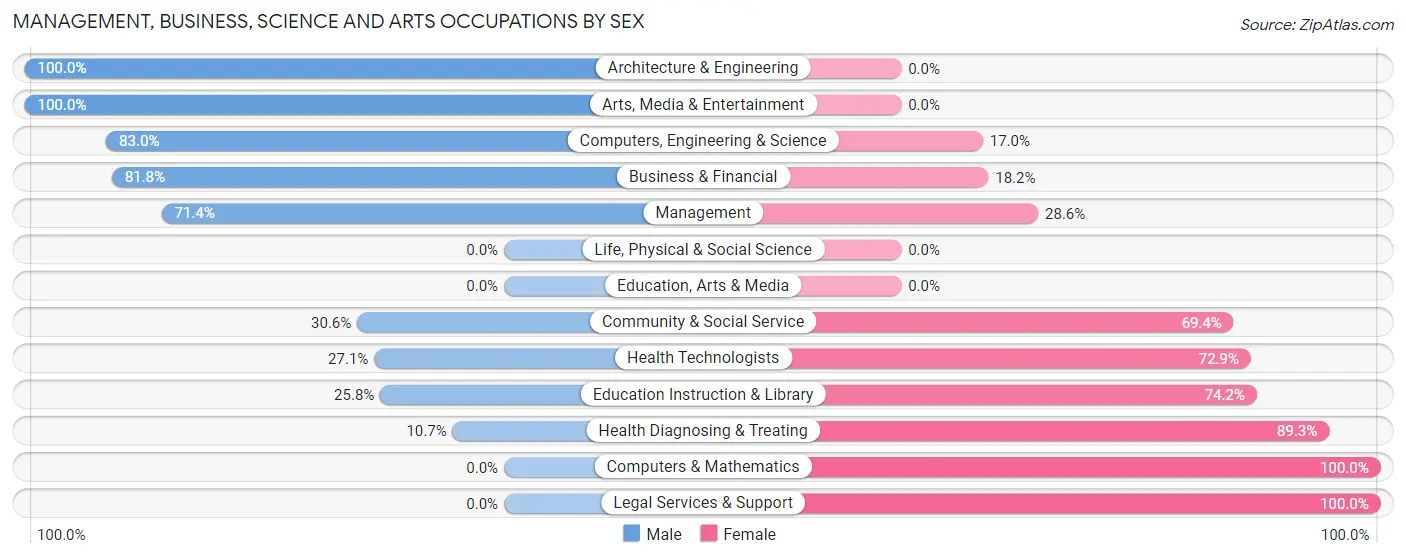
Management, Business, Science and Arts Occupations by Sex
Within the Management, Business, Science and Arts occupations in Farmville, the most male-oriented occupations are Architecture & Engineering (100.0%), Arts, Media & Entertainment (100.0%), and Computers, Engineering & Science (83.0%), while the most female-oriented occupations are Computers & Mathematics (100.0%), Legal Services & Support (100.0%), and Health Diagnosing & Treating (89.3%).
| Occupation | Male | Female |
| Management | 65 (71.4%) | 26 (28.6%) |
| Business & Financial | 72 (81.8%) | 16 (18.2%) |
| Computers, Engineering & Science | 39 (83.0%) | 8 (17.0%) |
| Computers & Mathematics | 0 (0.0%) | 8 (100.0%) |
| Architecture & Engineering | 39 (100.0%) | 0 (0.0%) |
| Life, Physical & Social Science | 0 (0.0%) | 0 (0.0%) |
| Community & Social Service | 53 (30.6%) | 120 (69.4%) |
| Education, Arts & Media | 0 (0.0%) | 0 (0.0%) |
| Legal Services & Support | 0 (0.0%) | 8 (100.0%) |
| Education Instruction & Library | 39 (25.8%) | 112 (74.2%) |
| Arts, Media & Entertainment | 14 (100.0%) | 0 (0.0%) |
| Health Diagnosing & Treating | 13 (10.7%) | 108 (89.3%) |
| Health Technologists | 13 (27.1%) | 35 (72.9%) |
| Total (Category) | 242 (46.5%) | 278 (53.5%) |
| Total (Overall) | 781 (41.0%) | 1,122 (59.0%) |
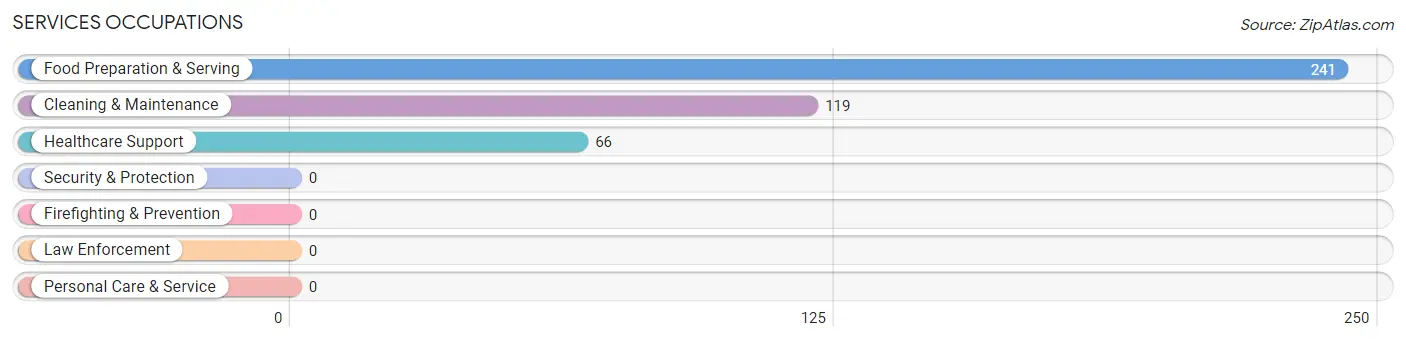
Services Occupations
The most common Services occupations in Farmville are Food Preparation & Serving (241 | 12.7%), Cleaning & Maintenance (119 | 6.2%), and Healthcare Support (66 | 3.5%).
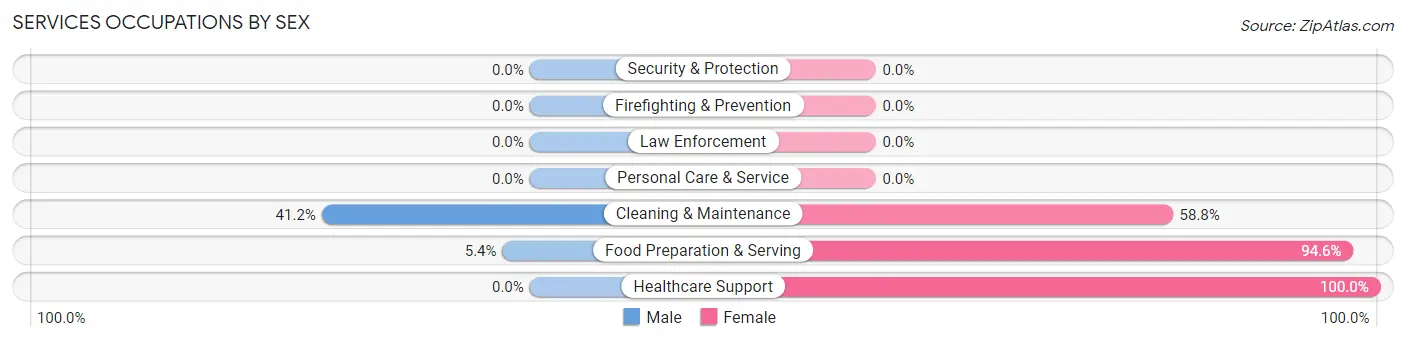
Services Occupations by Sex
Within the Services occupations in Farmville, the most male-oriented occupations are Cleaning & Maintenance (41.2%), and Food Preparation & Serving (5.4%), while the most female-oriented occupations are Healthcare Support (100.0%), Food Preparation & Serving (94.6%), and Cleaning & Maintenance (58.8%).
| Occupation | Male | Female |
| Healthcare Support | 0 (0.0%) | 66 (100.0%) |
| Security & Protection | 0 (0.0%) | 0 (0.0%) |
| Firefighting & Prevention | 0 (0.0%) | 0 (0.0%) |
| Law Enforcement | 0 (0.0%) | 0 (0.0%) |
| Food Preparation & Serving | 13 (5.4%) | 228 (94.6%) |
| Cleaning & Maintenance | 49 (41.2%) | 70 (58.8%) |
| Personal Care & Service | 0 (0.0%) | 0 (0.0%) |
| Total (Category) | 62 (14.5%) | 364 (85.5%) |
| Total (Overall) | 781 (41.0%) | 1,122 (59.0%) |
Sales and Office Occupations
The most common Sales and Office occupations in Farmville are Office & Administration (281 | 14.8%), and Sales & Related (215 | 11.3%).

Sales and Office Occupations by Sex

| Occupation | Male | Female |
| Sales & Related | 17 (7.9%) | 198 (92.1%) |
| Office & Administration | 24 (8.5%) | 257 (91.5%) |
| Total (Category) | 41 (8.3%) | 455 (91.7%) |
| Total (Overall) | 781 (41.0%) | 1,122 (59.0%) |
Natural Resources, Construction and Maintenance Occupations
The most common Natural Resources, Construction and Maintenance occupations in Farmville are Installation, Maintenance & Repair (109 | 5.7%), and Construction & Extraction (101 | 5.3%).

Natural Resources, Construction and Maintenance Occupations by Sex

| Occupation | Male | Female |
| Farming, Fishing & Forestry | 0 (0.0%) | 0 (0.0%) |
| Construction & Extraction | 101 (100.0%) | 0 (0.0%) |
| Installation, Maintenance & Repair | 109 (100.0%) | 0 (0.0%) |
| Total (Category) | 210 (100.0%) | 0 (0.0%) |
| Total (Overall) | 781 (41.0%) | 1,122 (59.0%) |
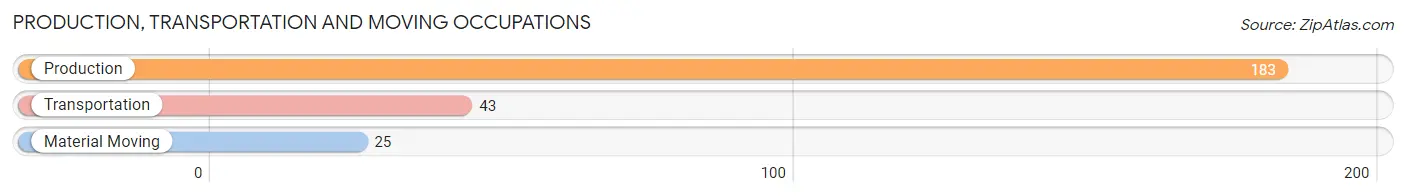
Production, Transportation and Moving Occupations
The most common Production, Transportation and Moving occupations in Farmville are Production (183 | 9.6%), Transportation (43 | 2.3%), and Material Moving (25 | 1.3%).
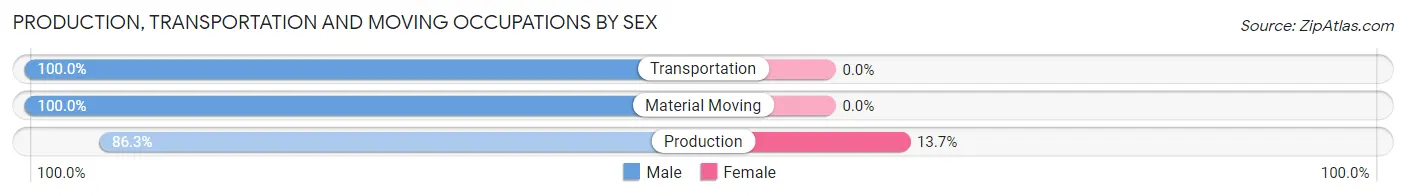
Production, Transportation and Moving Occupations by Sex
| Occupation | Male | Female |
| Production | 158 (86.3%) | 25 (13.7%) |
| Transportation | 43 (100.0%) | 0 (0.0%) |
| Material Moving | 25 (100.0%) | 0 (0.0%) |
| Total (Category) | 226 (90.0%) | 25 (10.0%) |
| Total (Overall) | 781 (41.0%) | 1,122 (59.0%) |
Employment Industries by Sex in Farmville
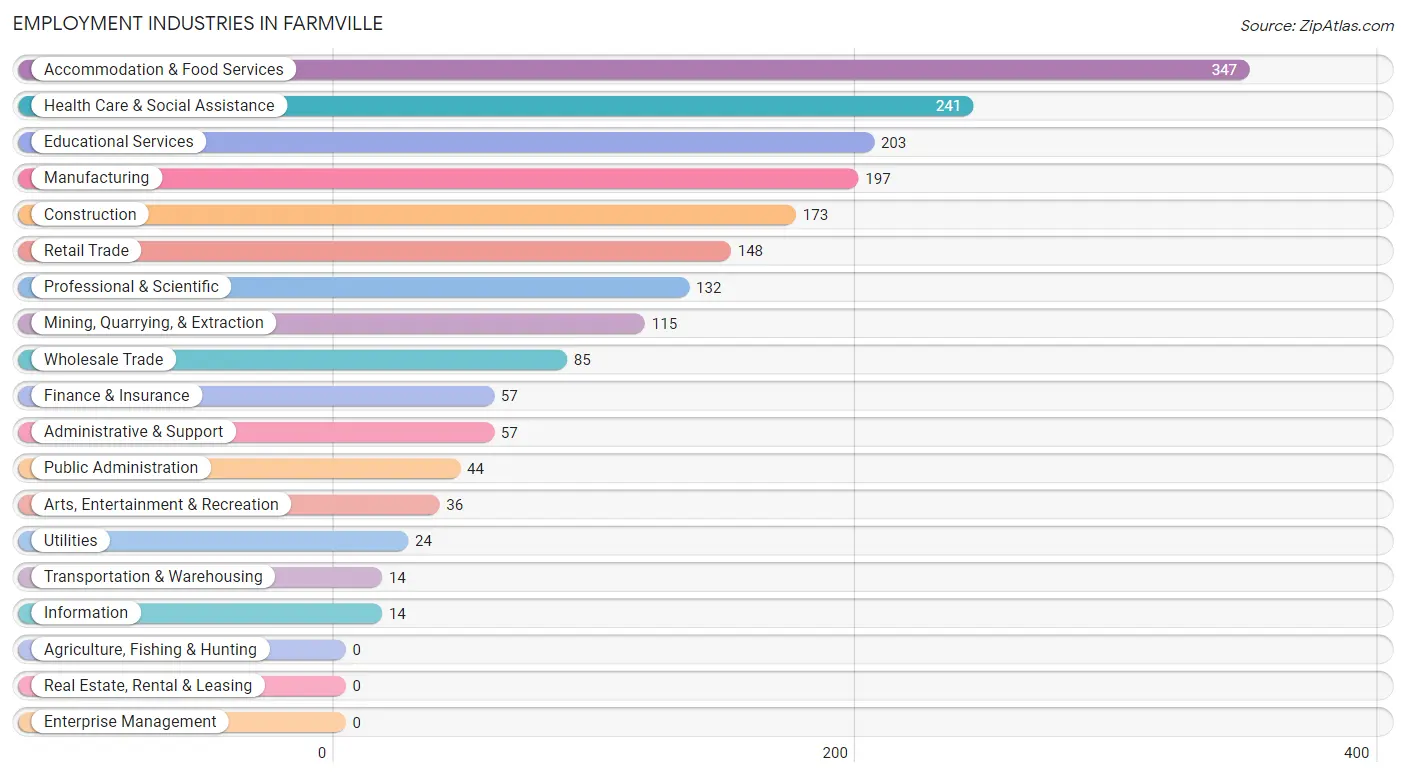
Employment Industries in Farmville
The major employment industries in Farmville include Accommodation & Food Services (347 | 18.2%), Health Care & Social Assistance (241 | 12.7%), Educational Services (203 | 10.7%), Manufacturing (197 | 10.3%), and Construction (173 | 9.1%).
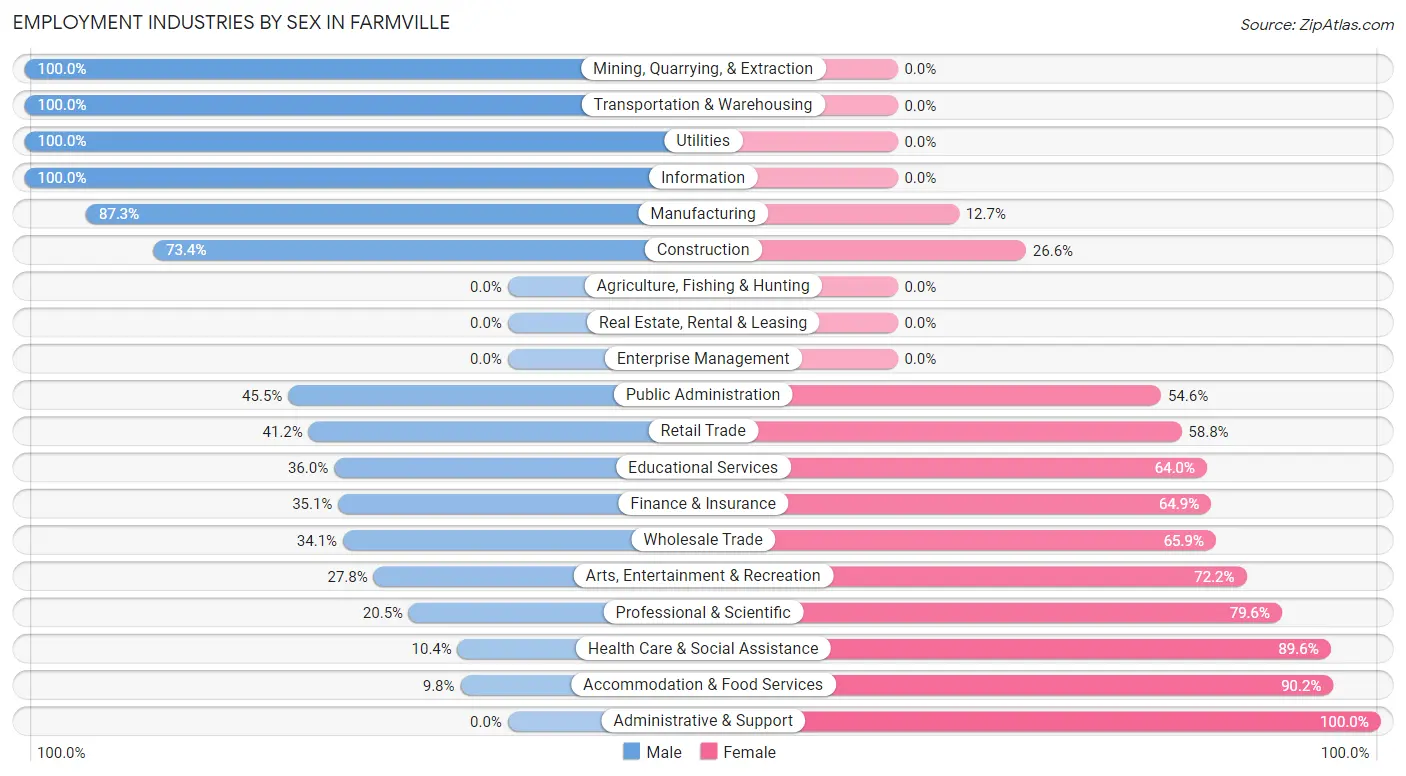
Employment Industries by Sex in Farmville
The Farmville industries that see more men than women are Mining, Quarrying, & Extraction (100.0%), Transportation & Warehousing (100.0%), and Utilities (100.0%), whereas the industries that tend to have a higher number of women are Administrative & Support (100.0%), Accommodation & Food Services (90.2%), and Health Care & Social Assistance (89.6%).
| Industry | Male | Female |
| Agriculture, Fishing & Hunting | 0 (0.0%) | 0 (0.0%) |
| Mining, Quarrying, & Extraction | 115 (100.0%) | 0 (0.0%) |
| Construction | 127 (73.4%) | 46 (26.6%) |
| Manufacturing | 172 (87.3%) | 25 (12.7%) |
| Wholesale Trade | 29 (34.1%) | 56 (65.9%) |
| Retail Trade | 61 (41.2%) | 87 (58.8%) |
| Transportation & Warehousing | 14 (100.0%) | 0 (0.0%) |
| Utilities | 24 (100.0%) | 0 (0.0%) |
| Information | 14 (100.0%) | 0 (0.0%) |
| Finance & Insurance | 20 (35.1%) | 37 (64.9%) |
| Real Estate, Rental & Leasing | 0 (0.0%) | 0 (0.0%) |
| Professional & Scientific | 27 (20.4%) | 105 (79.5%) |
| Enterprise Management | 0 (0.0%) | 0 (0.0%) |
| Administrative & Support | 0 (0.0%) | 57 (100.0%) |
| Educational Services | 73 (36.0%) | 130 (64.0%) |
| Health Care & Social Assistance | 25 (10.4%) | 216 (89.6%) |
| Arts, Entertainment & Recreation | 10 (27.8%) | 26 (72.2%) |
| Accommodation & Food Services | 34 (9.8%) | 313 (90.2%) |
| Public Administration | 20 (45.5%) | 24 (54.5%) |
| Total | 781 (41.0%) | 1,122 (59.0%) |
Education in Farmville
School Enrollment in Farmville
The most common levels of schooling among the 1,114 students in Farmville are middle school (327 | 29.3%), elementary school (303 | 27.2%), and high school (272 | 24.4%).
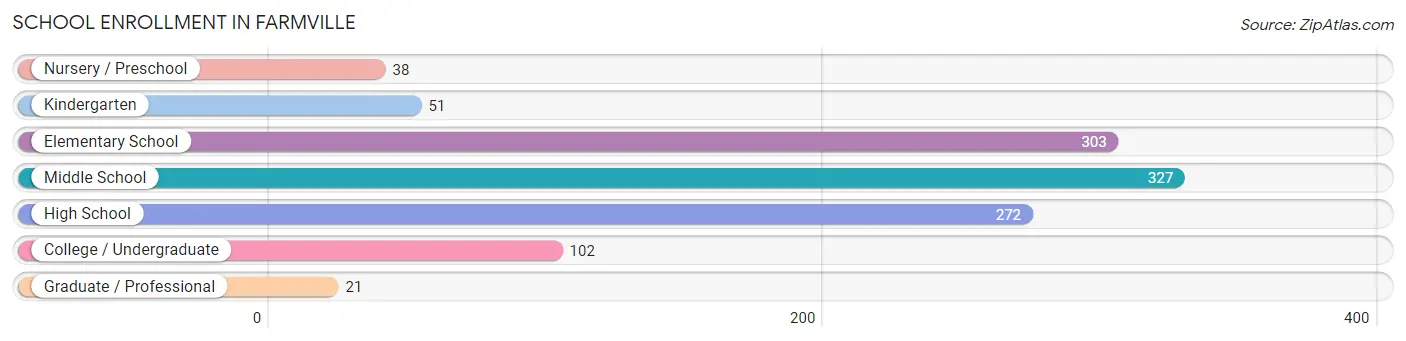
| School Level | # Students | % Students |
| Nursery / Preschool | 38 | 3.4% |
| Kindergarten | 51 | 4.6% |
| Elementary School | 303 | 27.2% |
| Middle School | 327 | 29.3% |
| High School | 272 | 24.4% |
| College / Undergraduate | 102 | 9.2% |
| Graduate / Professional | 21 | 1.9% |
| Total | 1,114 | 100.0% |
School Enrollment by Age by Funding Source in Farmville
Out of a total of 1,114 students who are enrolled in schools in Farmville, 126 (11.3%) attend a private institution, while the remaining 988 (88.7%) are enrolled in public schools. The age group of 25 to 34 year olds has the highest likelihood of being enrolled in private schools, with 32 (100.0% in the age bracket) enrolled. Conversely, the age group of 10 to 14 year olds has the lowest likelihood of being enrolled in a private school, with 344 (100.0% in the age bracket) attending a public institution.
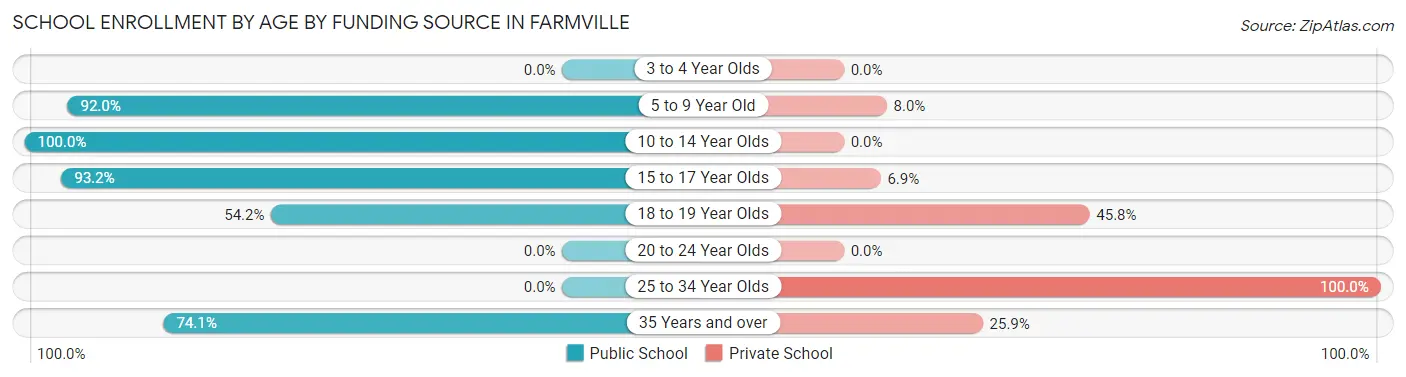
| Age Bracket | Public School | Private School |
| 3 to 4 Year Olds | 0 (0.0%) | 0 (0.0%) |
| 5 to 9 Year Old | 345 (92.0%) | 30 (8.0%) |
| 10 to 14 Year Olds | 344 (100.0%) | 0 (0.0%) |
| 15 to 17 Year Olds | 204 (93.1%) | 15 (6.9%) |
| 18 to 19 Year Olds | 32 (54.2%) | 27 (45.8%) |
| 20 to 24 Year Olds | 0 (0.0%) | 0 (0.0%) |
| 25 to 34 Year Olds | 0 (0.0%) | 32 (100.0%) |
| 35 Years and over | 63 (74.1%) | 22 (25.9%) |
| Total | 988 (88.7%) | 126 (11.3%) |
Educational Attainment by Field of Study in Farmville
Business (148 | 17.8%), engineering (146 | 17.6%), science & technology (123 | 14.8%), education (109 | 13.1%), and arts & humanities (76 | 9.2%) are the most common fields of study among 830 individuals in Farmville who have obtained a bachelor's degree or higher.
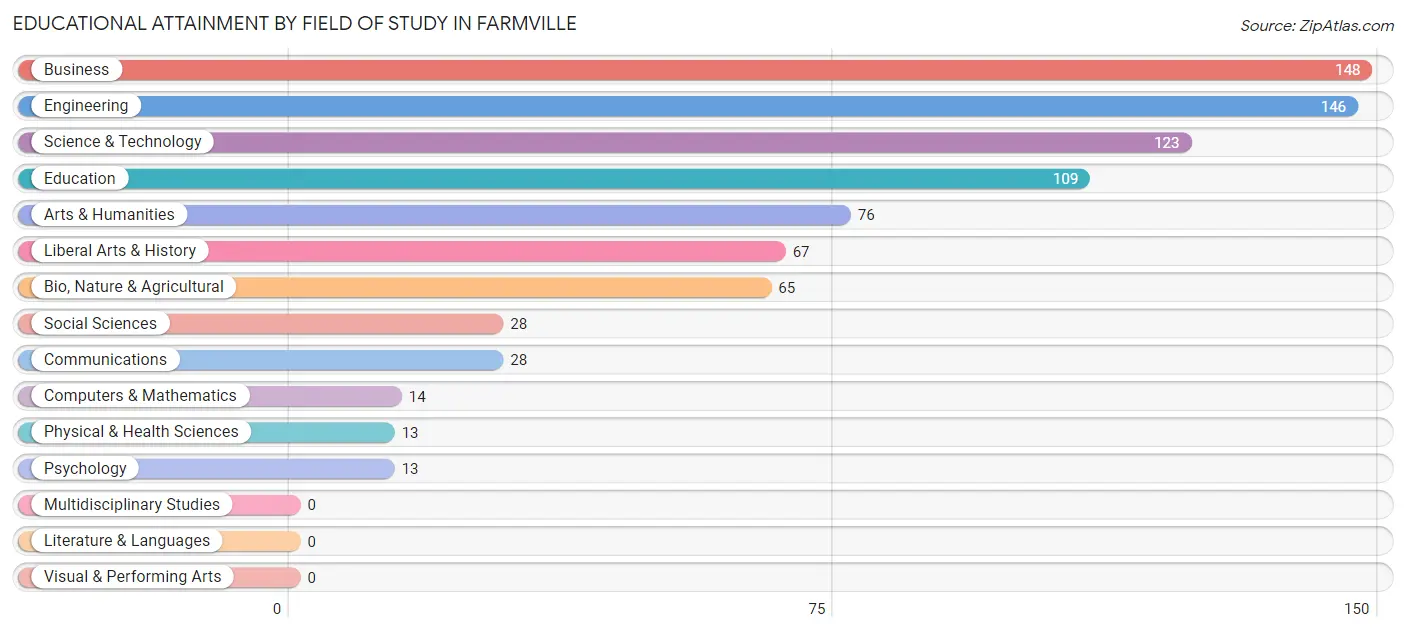
| Field of Study | # Graduates | % Graduates |
| Computers & Mathematics | 14 | 1.7% |
| Bio, Nature & Agricultural | 65 | 7.8% |
| Physical & Health Sciences | 13 | 1.6% |
| Psychology | 13 | 1.6% |
| Social Sciences | 28 | 3.4% |
| Engineering | 146 | 17.6% |
| Multidisciplinary Studies | 0 | 0.0% |
| Science & Technology | 123 | 14.8% |
| Business | 148 | 17.8% |
| Education | 109 | 13.1% |
| Literature & Languages | 0 | 0.0% |
| Liberal Arts & History | 67 | 8.1% |
| Visual & Performing Arts | 0 | 0.0% |
| Communications | 28 | 3.4% |
| Arts & Humanities | 76 | 9.2% |
| Total | 830 | 100.0% |
Transportation & Commute in Farmville
Vehicle Availability by Sex in Farmville
The most prevalent vehicle ownership categories in Farmville are males with 3 vehicles (292, accounting for 38.6%) and females with 3 vehicles (193, making up 26.5%).
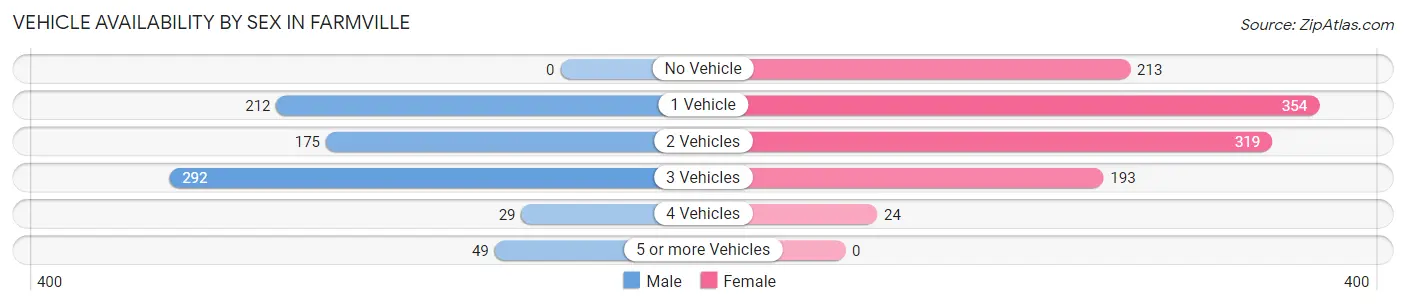
| Vehicles Available | Male | Female |
| No Vehicle | 0 (0.0%) | 213 (19.3%) |
| 1 Vehicle | 212 (28.0%) | 354 (32.1%) |
| 2 Vehicles | 175 (23.1%) | 319 (28.9%) |
| 3 Vehicles | 292 (38.6%) | 193 (17.5%) |
| 4 Vehicles | 29 (3.8%) | 24 (2.2%) |
| 5 or more Vehicles | 49 (6.5%) | 0 (0.0%) |
| Total | 757 (100.0%) | 1,103 (100.0%) |
Commute Time in Farmville
The most frequently occuring commute durations in Farmville are 30 to 34 minutes (475 commuters, 28.3%), 20 to 24 minutes (261 commuters, 15.6%), and 5 to 9 minutes (212 commuters, 12.6%).
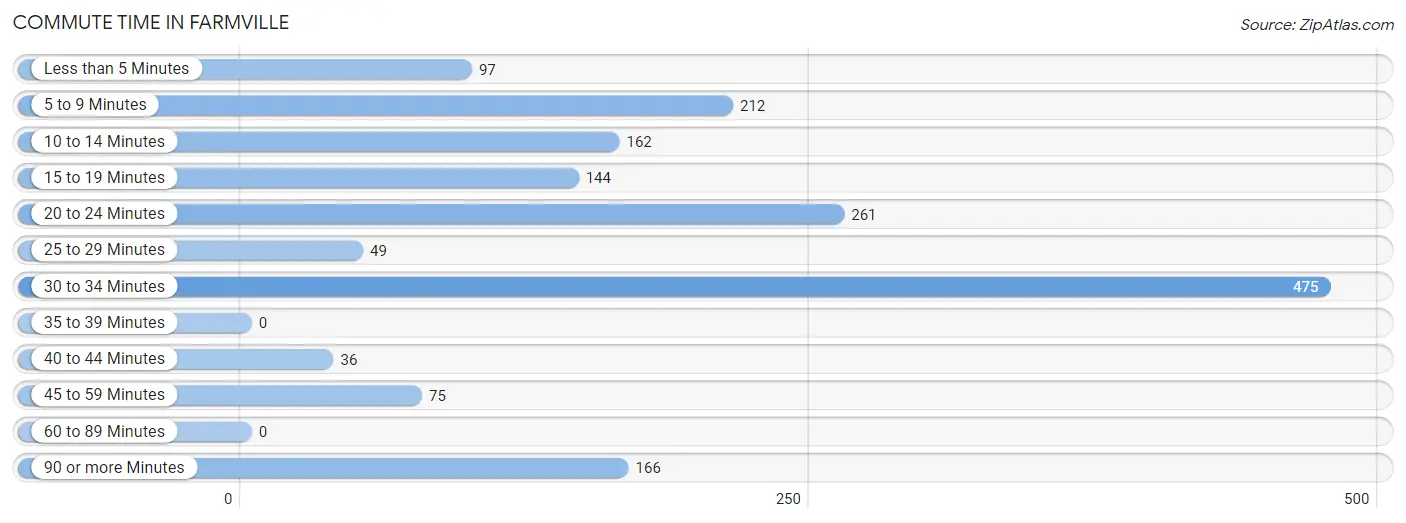
| Commute Time | # Commuters | % Commuters |
| Less than 5 Minutes | 97 | 5.8% |
| 5 to 9 Minutes | 212 | 12.6% |
| 10 to 14 Minutes | 162 | 9.7% |
| 15 to 19 Minutes | 144 | 8.6% |
| 20 to 24 Minutes | 261 | 15.6% |
| 25 to 29 Minutes | 49 | 2.9% |
| 30 to 34 Minutes | 475 | 28.3% |
| 35 to 39 Minutes | 0 | 0.0% |
| 40 to 44 Minutes | 36 | 2.1% |
| 45 to 59 Minutes | 75 | 4.5% |
| 60 to 89 Minutes | 0 | 0.0% |
| 90 or more Minutes | 166 | 9.9% |
Commute Time by Sex in Farmville
The most common commute times in Farmville are 20 to 24 minutes (163 commuters, 21.9%) for males and 30 to 34 minutes (397 commuters, 42.5%) for females.
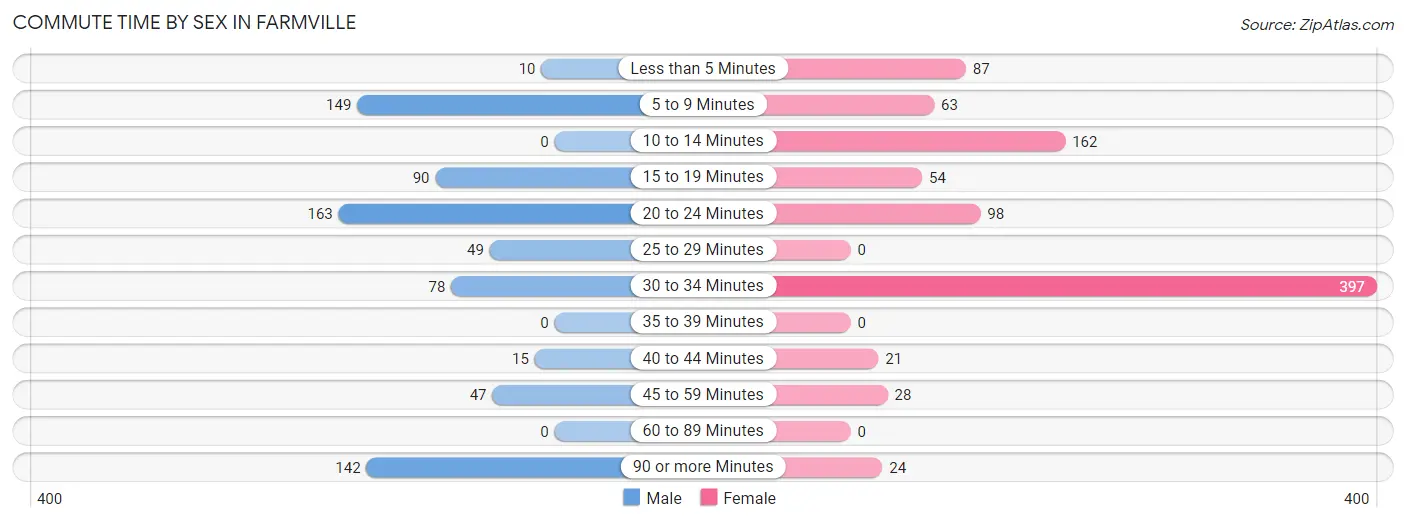
| Commute Time | Male | Female |
| Less than 5 Minutes | 10 (1.3%) | 87 (9.3%) |
| 5 to 9 Minutes | 149 (20.1%) | 63 (6.8%) |
| 10 to 14 Minutes | 0 (0.0%) | 162 (17.3%) |
| 15 to 19 Minutes | 90 (12.1%) | 54 (5.8%) |
| 20 to 24 Minutes | 163 (21.9%) | 98 (10.5%) |
| 25 to 29 Minutes | 49 (6.6%) | 0 (0.0%) |
| 30 to 34 Minutes | 78 (10.5%) | 397 (42.5%) |
| 35 to 39 Minutes | 0 (0.0%) | 0 (0.0%) |
| 40 to 44 Minutes | 15 (2.0%) | 21 (2.2%) |
| 45 to 59 Minutes | 47 (6.3%) | 28 (3.0%) |
| 60 to 89 Minutes | 0 (0.0%) | 0 (0.0%) |
| 90 or more Minutes | 142 (19.1%) | 24 (2.6%) |
Time of Departure to Work by Sex in Farmville
The most frequent times of departure to work in Farmville are 6:30 AM to 6:59 AM (193, 26.0%) for males and 7:00 AM to 7:29 AM (390, 41.8%) for females.
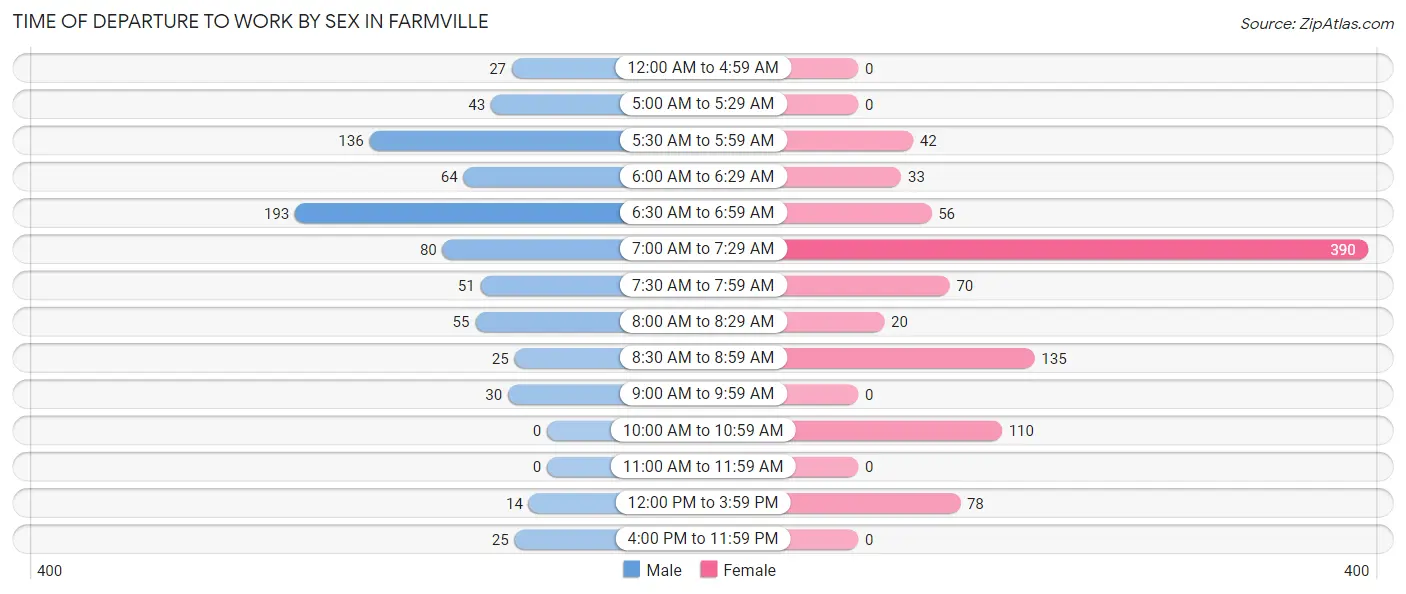
| Time of Departure | Male | Female |
| 12:00 AM to 4:59 AM | 27 (3.6%) | 0 (0.0%) |
| 5:00 AM to 5:29 AM | 43 (5.8%) | 0 (0.0%) |
| 5:30 AM to 5:59 AM | 136 (18.3%) | 42 (4.5%) |
| 6:00 AM to 6:29 AM | 64 (8.6%) | 33 (3.5%) |
| 6:30 AM to 6:59 AM | 193 (26.0%) | 56 (6.0%) |
| 7:00 AM to 7:29 AM | 80 (10.8%) | 390 (41.8%) |
| 7:30 AM to 7:59 AM | 51 (6.9%) | 70 (7.5%) |
| 8:00 AM to 8:29 AM | 55 (7.4%) | 20 (2.1%) |
| 8:30 AM to 8:59 AM | 25 (3.4%) | 135 (14.4%) |
| 9:00 AM to 9:59 AM | 30 (4.0%) | 0 (0.0%) |
| 10:00 AM to 10:59 AM | 0 (0.0%) | 110 (11.8%) |
| 11:00 AM to 11:59 AM | 0 (0.0%) | 0 (0.0%) |
| 12:00 PM to 3:59 PM | 14 (1.9%) | 78 (8.4%) |
| 4:00 PM to 11:59 PM | 25 (3.4%) | 0 (0.0%) |
| Total | 743 (100.0%) | 934 (100.0%) |
Housing Occupancy in Farmville
Occupancy by Ownership in Farmville
Of the total 2,094 dwellings in Farmville, owner-occupied units account for 1,181 (56.4%), while renter-occupied units make up 913 (43.6%).
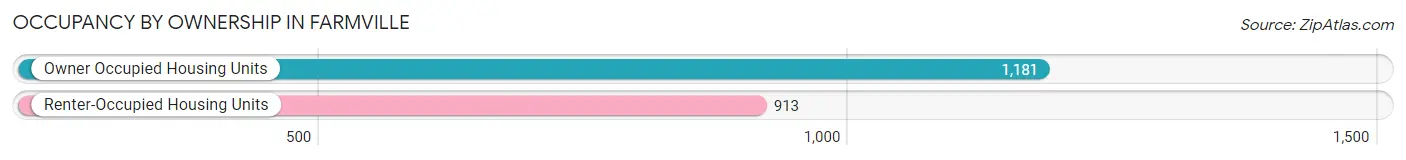
| Occupancy | # Housing Units | % Housing Units |
| Owner Occupied Housing Units | 1,181 | 56.4% |
| Renter-Occupied Housing Units | 913 | 43.6% |
| Total Occupied Housing Units | 2,094 | 100.0% |
Occupancy by Household Size in Farmville
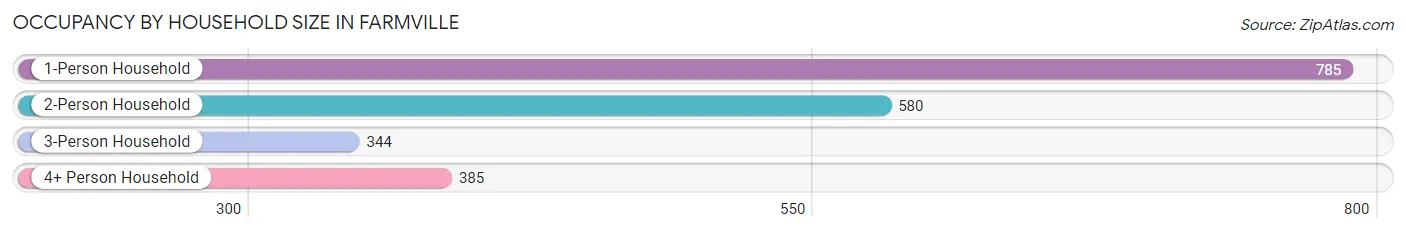
| Household Size | # Housing Units | % Housing Units |
| 1-Person Household | 785 | 37.5% |
| 2-Person Household | 580 | 27.7% |
| 3-Person Household | 344 | 16.4% |
| 4+ Person Household | 385 | 18.4% |
| Total Housing Units | 2,094 | 100.0% |
Occupancy by Ownership by Household Size in Farmville
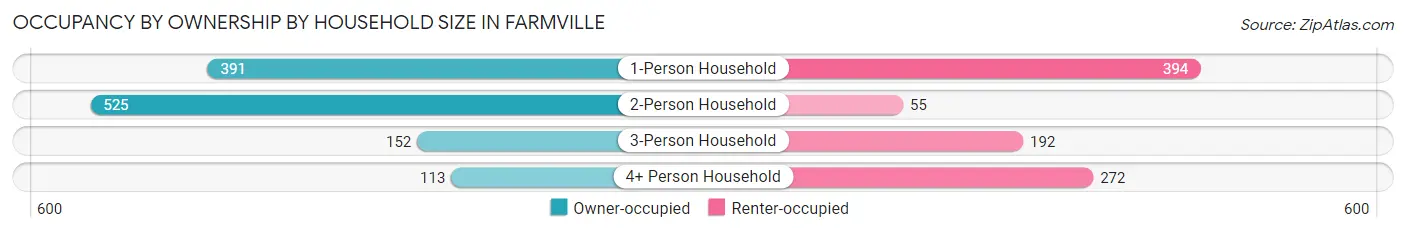
| Household Size | Owner-occupied | Renter-occupied |
| 1-Person Household | 391 (49.8%) | 394 (50.2%) |
| 2-Person Household | 525 (90.5%) | 55 (9.5%) |
| 3-Person Household | 152 (44.2%) | 192 (55.8%) |
| 4+ Person Household | 113 (29.3%) | 272 (70.7%) |
| Total Housing Units | 1,181 (56.4%) | 913 (43.6%) |
Occupancy by Educational Attainment in Farmville
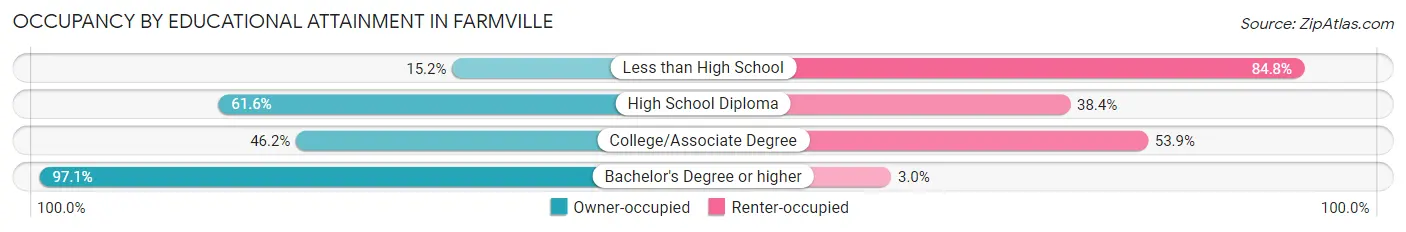
| Household Size | Owner-occupied | Renter-occupied |
| Less than High School | 54 (15.2%) | 301 (84.8%) |
| High School Diploma | 330 (61.6%) | 206 (38.4%) |
| College/Associate Degree | 336 (46.2%) | 392 (53.8%) |
| Bachelor's Degree or higher | 461 (97.1%) | 14 (2.9%) |
Occupancy by Age of Householder in Farmville
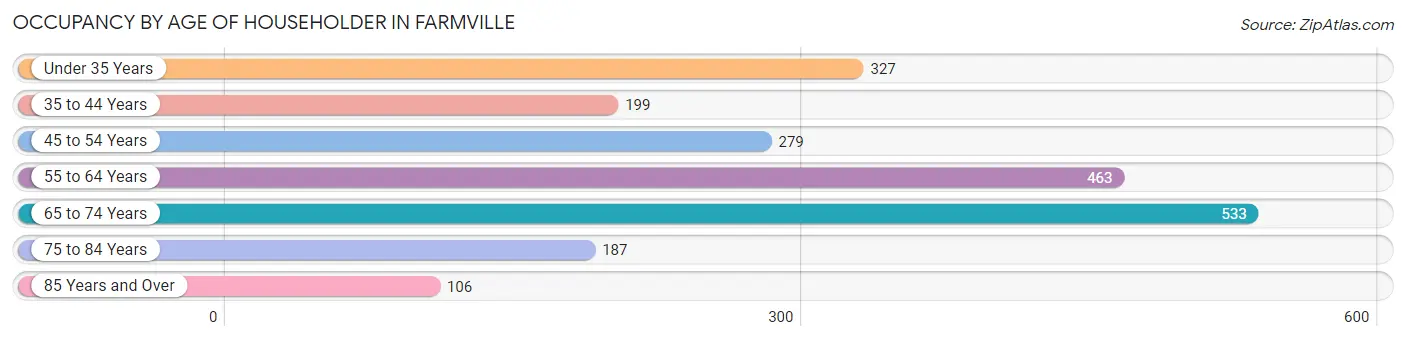
| Age Bracket | # Households | % Households |
| Under 35 Years | 327 | 15.6% |
| 35 to 44 Years | 199 | 9.5% |
| 45 to 54 Years | 279 | 13.3% |
| 55 to 64 Years | 463 | 22.1% |
| 65 to 74 Years | 533 | 25.5% |
| 75 to 84 Years | 187 | 8.9% |
| 85 Years and Over | 106 | 5.1% |
| Total | 2,094 | 100.0% |
Housing Finances in Farmville
Median Income by Occupancy in Farmville
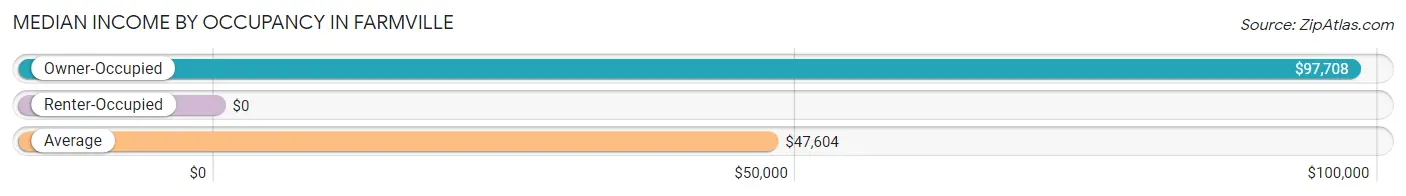
| Occupancy Type | # Households | Median Income |
| Owner-Occupied | 1,181 (56.4%) | $97,708 |
| Renter-Occupied | 913 (43.6%) | $0 |
| Average | 2,094 (100.0%) | $47,604 |
Occupancy by Householder Income Bracket in Farmville
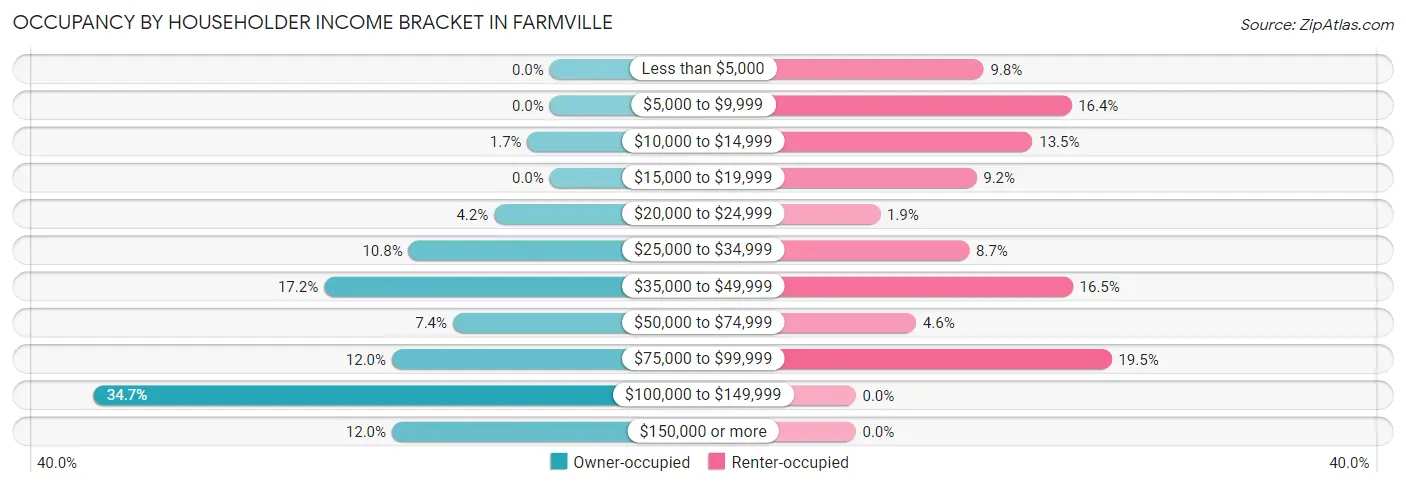
| Income Bracket | Owner-occupied | Renter-occupied |
| Less than $5,000 | 0 (0.0%) | 89 (9.8%) |
| $5,000 to $9,999 | 0 (0.0%) | 150 (16.4%) |
| $10,000 to $14,999 | 20 (1.7%) | 123 (13.5%) |
| $15,000 to $19,999 | 0 (0.0%) | 84 (9.2%) |
| $20,000 to $24,999 | 50 (4.2%) | 17 (1.9%) |
| $25,000 to $34,999 | 127 (10.7%) | 79 (8.6%) |
| $35,000 to $49,999 | 203 (17.2%) | 151 (16.5%) |
| $50,000 to $74,999 | 87 (7.4%) | 42 (4.6%) |
| $75,000 to $99,999 | 142 (12.0%) | 178 (19.5%) |
| $100,000 to $149,999 | 410 (34.7%) | 0 (0.0%) |
| $150,000 or more | 142 (12.0%) | 0 (0.0%) |
| Total | 1,181 (100.0%) | 913 (100.0%) |
Monthly Housing Cost Tiers in Farmville
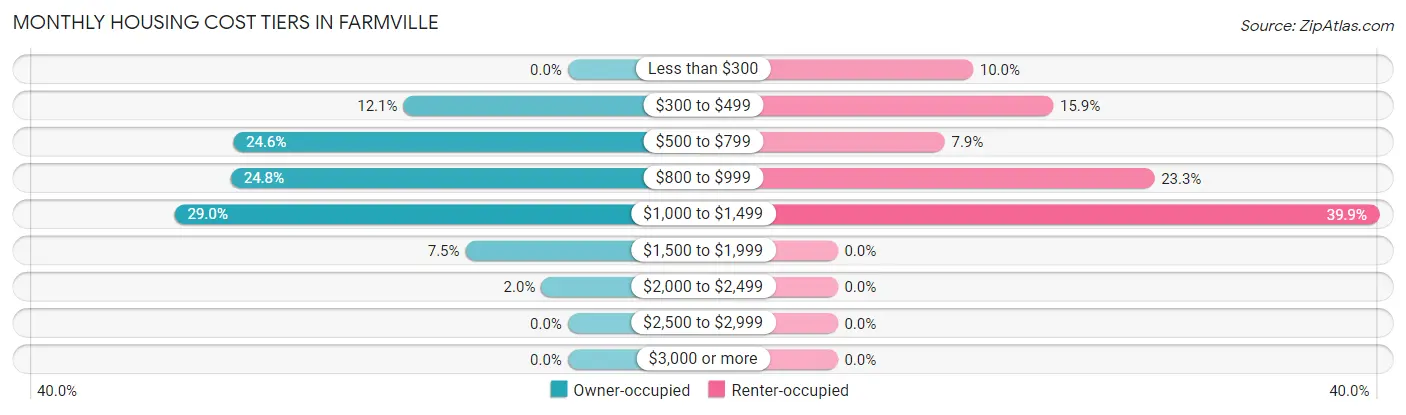
| Monthly Cost | Owner-occupied | Renter-occupied |
| Less than $300 | 0 (0.0%) | 91 (10.0%) |
| $300 to $499 | 143 (12.1%) | 145 (15.9%) |
| $500 to $799 | 291 (24.6%) | 72 (7.9%) |
| $800 to $999 | 293 (24.8%) | 213 (23.3%) |
| $1,000 to $1,499 | 342 (29.0%) | 364 (39.9%) |
| $1,500 to $1,999 | 89 (7.5%) | 0 (0.0%) |
| $2,000 to $2,499 | 23 (1.9%) | 0 (0.0%) |
| $2,500 to $2,999 | 0 (0.0%) | 0 (0.0%) |
| $3,000 or more | 0 (0.0%) | 0 (0.0%) |
| Total | 1,181 (100.0%) | 913 (100.0%) |
Physical Housing Characteristics in Farmville
Housing Structures in Farmville
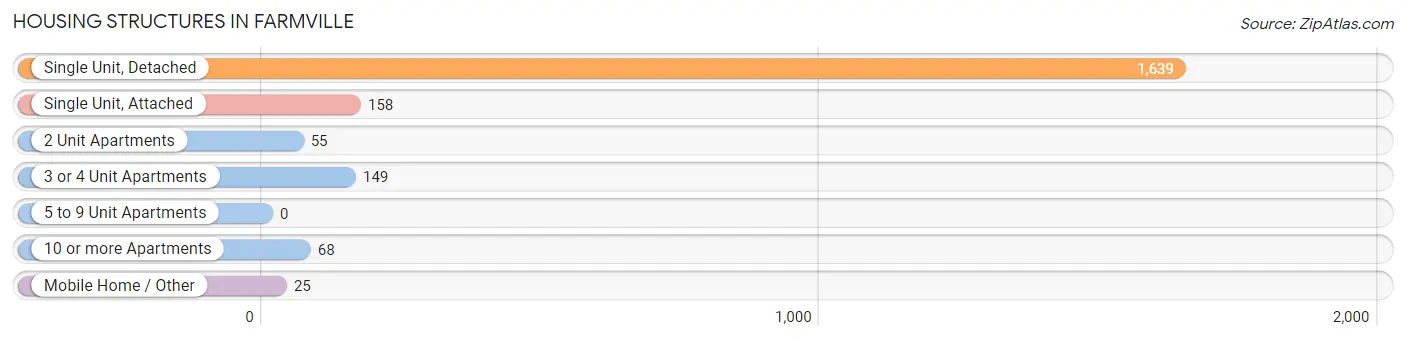
| Structure Type | # Housing Units | % Housing Units |
| Single Unit, Detached | 1,639 | 78.3% |
| Single Unit, Attached | 158 | 7.5% |
| 2 Unit Apartments | 55 | 2.6% |
| 3 or 4 Unit Apartments | 149 | 7.1% |
| 5 to 9 Unit Apartments | 0 | 0.0% |
| 10 or more Apartments | 68 | 3.3% |
| Mobile Home / Other | 25 | 1.2% |
| Total | 2,094 | 100.0% |
Housing Structures by Occupancy in Farmville
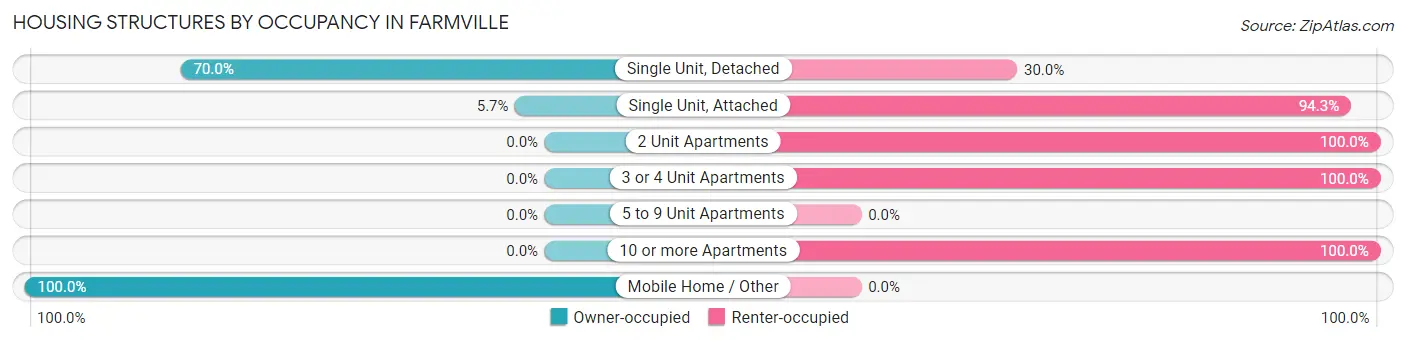
| Structure Type | Owner-occupied | Renter-occupied |
| Single Unit, Detached | 1,147 (70.0%) | 492 (30.0%) |
| Single Unit, Attached | 9 (5.7%) | 149 (94.3%) |
| 2 Unit Apartments | 0 (0.0%) | 55 (100.0%) |
| 3 or 4 Unit Apartments | 0 (0.0%) | 149 (100.0%) |
| 5 to 9 Unit Apartments | 0 (0.0%) | 0 (0.0%) |
| 10 or more Apartments | 0 (0.0%) | 68 (100.0%) |
| Mobile Home / Other | 25 (100.0%) | 0 (0.0%) |
| Total | 1,181 (56.4%) | 913 (43.6%) |
Housing Structures by Number of Rooms in Farmville
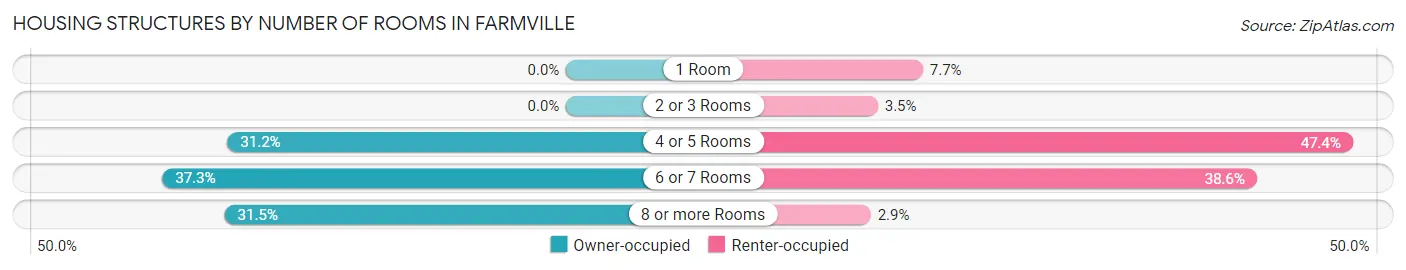
| Number of Rooms | Owner-occupied | Renter-occupied |
| 1 Room | 0 (0.0%) | 70 (7.7%) |
| 2 or 3 Rooms | 0 (0.0%) | 32 (3.5%) |
| 4 or 5 Rooms | 369 (31.2%) | 433 (47.4%) |
| 6 or 7 Rooms | 440 (37.3%) | 352 (38.6%) |
| 8 or more Rooms | 372 (31.5%) | 26 (2.9%) |
| Total | 1,181 (100.0%) | 913 (100.0%) |
Housing Structure by Heating Type in Farmville
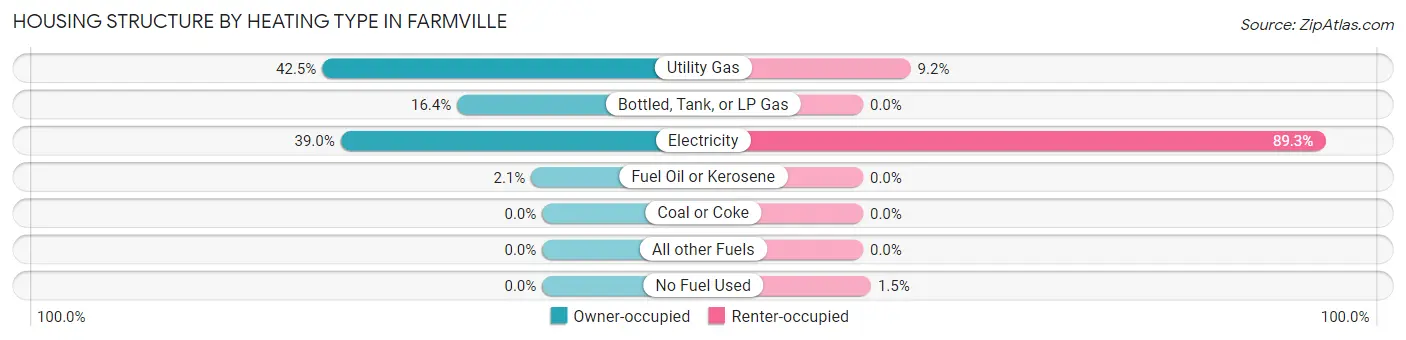
| Heating Type | Owner-occupied | Renter-occupied |
| Utility Gas | 502 (42.5%) | 84 (9.2%) |
| Bottled, Tank, or LP Gas | 194 (16.4%) | 0 (0.0%) |
| Electricity | 460 (39.0%) | 815 (89.3%) |
| Fuel Oil or Kerosene | 25 (2.1%) | 0 (0.0%) |
| Coal or Coke | 0 (0.0%) | 0 (0.0%) |
| All other Fuels | 0 (0.0%) | 0 (0.0%) |
| No Fuel Used | 0 (0.0%) | 14 (1.5%) |
| Total | 1,181 (100.0%) | 913 (100.0%) |
Household Vehicle Usage in Farmville
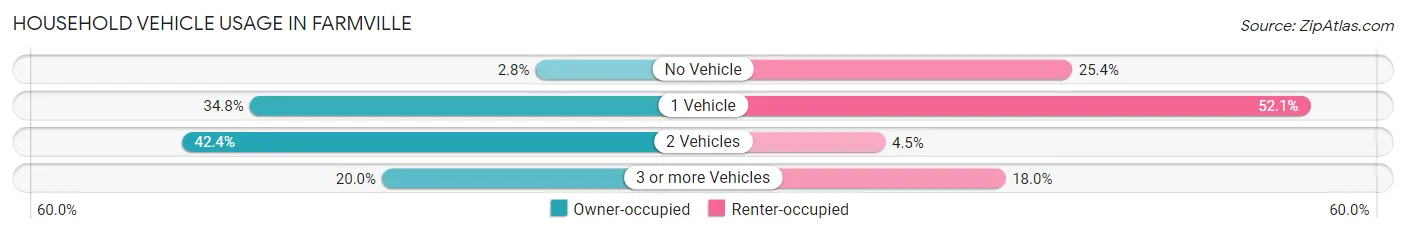
| Vehicles per Household | Owner-occupied | Renter-occupied |
| No Vehicle | 33 (2.8%) | 232 (25.4%) |
| 1 Vehicle | 411 (34.8%) | 476 (52.1%) |
| 2 Vehicles | 501 (42.4%) | 41 (4.5%) |
| 3 or more Vehicles | 236 (20.0%) | 164 (18.0%) |
| Total | 1,181 (100.0%) | 913 (100.0%) |
Real Estate & Mortgages in Farmville
Real Estate and Mortgage Overview in Farmville
| Characteristic | Without Mortgage | With Mortgage |
| Housing Units | 663 | 518 |
| Median Property Value | - | - |
| Median Household Income | $110,338 | $39 |
| Monthly Housing Costs | $658 | $0 |
| Real Estate Taxes | $2,433 | $0 |
Property Value by Mortgage Status in Farmville
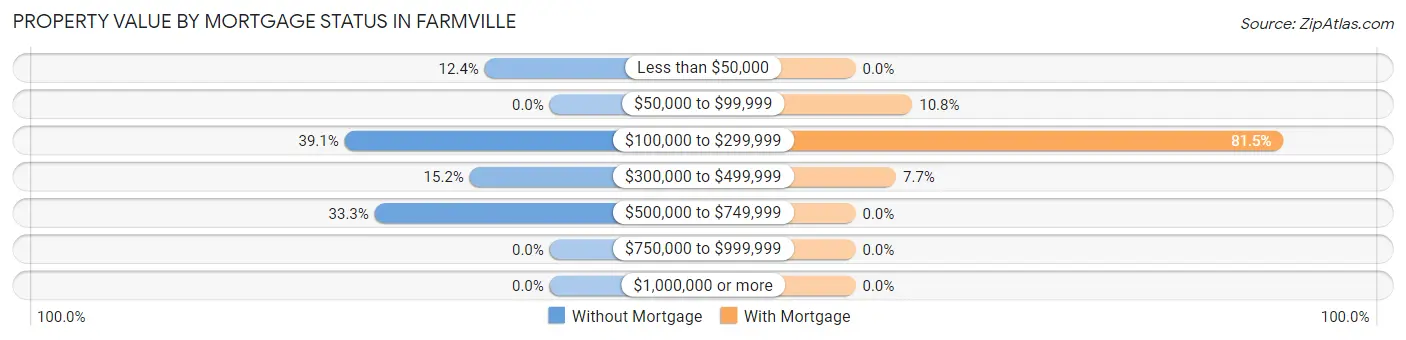
| Property Value | Without Mortgage | With Mortgage |
| Less than $50,000 | 82 (12.4%) | 0 (0.0%) |
| $50,000 to $99,999 | 0 (0.0%) | 56 (10.8%) |
| $100,000 to $299,999 | 259 (39.1%) | 422 (81.5%) |
| $300,000 to $499,999 | 101 (15.2%) | 40 (7.7%) |
| $500,000 to $749,999 | 221 (33.3%) | 0 (0.0%) |
| $750,000 to $999,999 | 0 (0.0%) | 0 (0.0%) |
| $1,000,000 or more | 0 (0.0%) | 0 (0.0%) |
| Total | 663 (100.0%) | 518 (100.0%) |
Household Income by Mortgage Status in Farmville
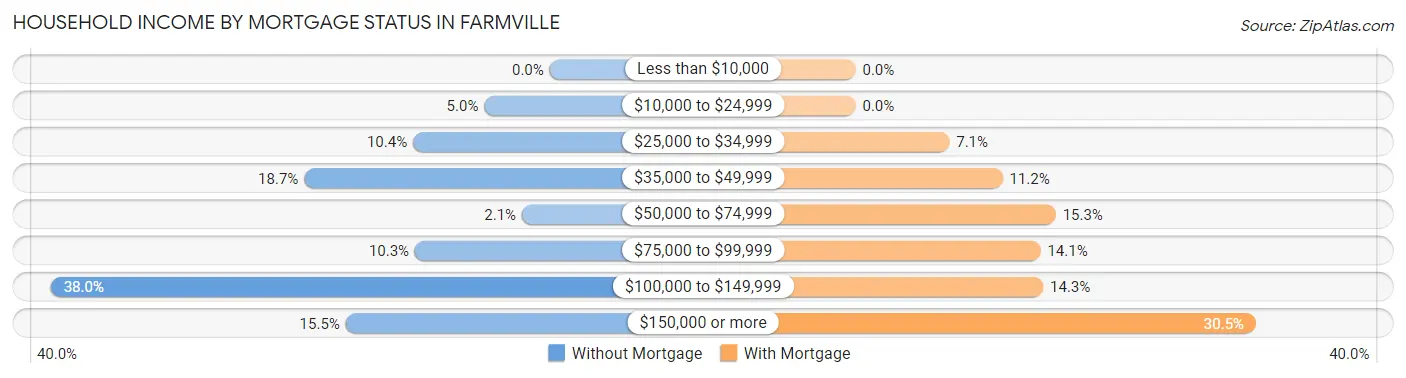
| Household Income | Without Mortgage | With Mortgage |
| Less than $10,000 | 0 (0.0%) | 0 (0.0%) |
| $10,000 to $24,999 | 33 (5.0%) | 0 (0.0%) |
| $25,000 to $34,999 | 69 (10.4%) | 37 (7.1%) |
| $35,000 to $49,999 | 124 (18.7%) | 58 (11.2%) |
| $50,000 to $74,999 | 14 (2.1%) | 79 (15.2%) |
| $75,000 to $99,999 | 68 (10.3%) | 73 (14.1%) |
| $100,000 to $149,999 | 252 (38.0%) | 74 (14.3%) |
| $150,000 or more | 103 (15.5%) | 158 (30.5%) |
| Total | 663 (100.0%) | 518 (100.0%) |
Property Value to Household Income Ratio in Farmville
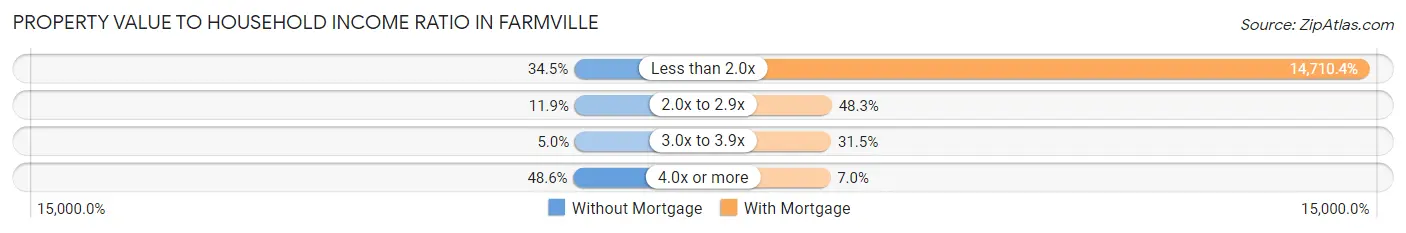
| Value-to-Income Ratio | Without Mortgage | With Mortgage |
| Less than 2.0x | 229 (34.5%) | 76,200 (14,710.4%) |
| 2.0x to 2.9x | 79 (11.9%) | 250 (48.3%) |
| 3.0x to 3.9x | 33 (5.0%) | 163 (31.5%) |
| 4.0x or more | 322 (48.6%) | 36 (7.0%) |
| Total | 663 (100.0%) | 518 (100.0%) |
Real Estate Taxes by Mortgage Status in Farmville
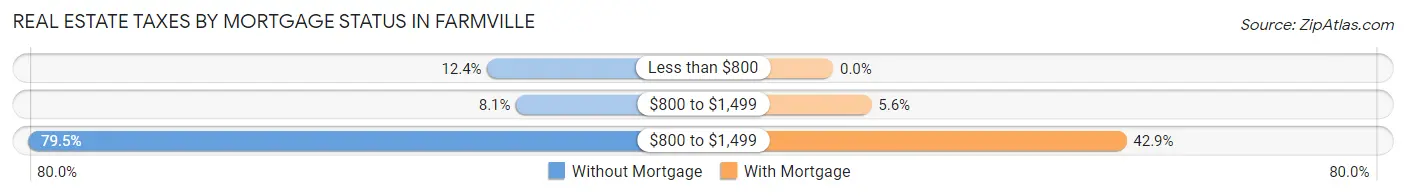
| Property Taxes | Without Mortgage | With Mortgage |
| Less than $800 | 82 (12.4%) | 0 (0.0%) |
| $800 to $1,499 | 54 (8.1%) | 29 (5.6%) |
| $800 to $1,499 | 527 (79.5%) | 222 (42.9%) |
| Total | 663 (100.0%) | 518 (100.0%) |
Health & Disability in Farmville
Health Insurance Coverage by Age in Farmville
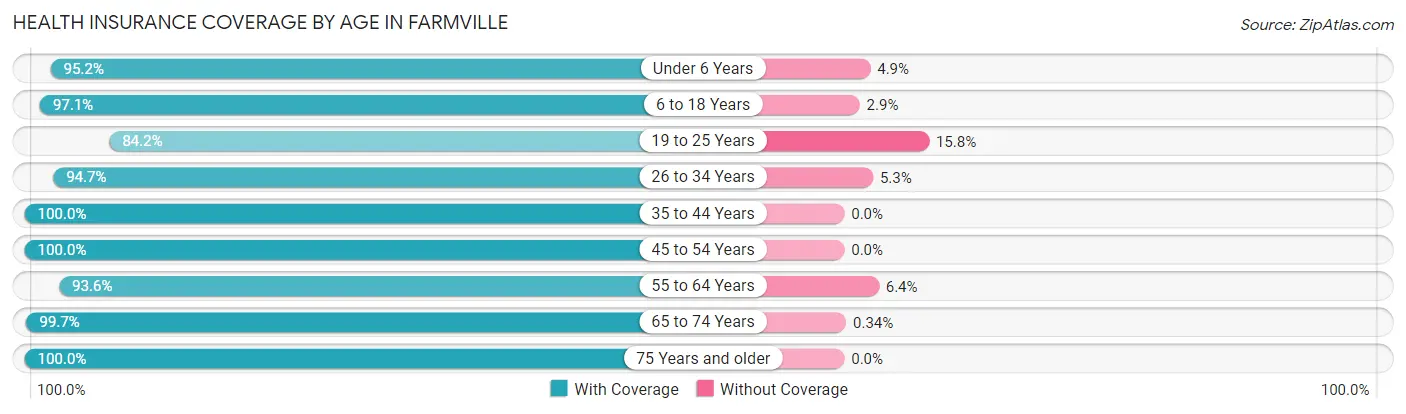
| Age Bracket | With Coverage | Without Coverage |
| Under 6 Years | 216 (95.2%) | 11 (4.9%) |
| 6 to 18 Years | 884 (97.1%) | 26 (2.9%) |
| 19 to 25 Years | 160 (84.2%) | 30 (15.8%) |
| 26 to 34 Years | 461 (94.7%) | 26 (5.3%) |
| 35 to 44 Years | 374 (100.0%) | 0 (0.0%) |
| 45 to 54 Years | 358 (100.0%) | 0 (0.0%) |
| 55 to 64 Years | 582 (93.6%) | 40 (6.4%) |
| 65 to 74 Years | 876 (99.7%) | 3 (0.3%) |
| 75 Years and older | 373 (100.0%) | 0 (0.0%) |
| Total | 4,284 (96.9%) | 136 (3.1%) |
Health Insurance Coverage by Citizenship Status in Farmville
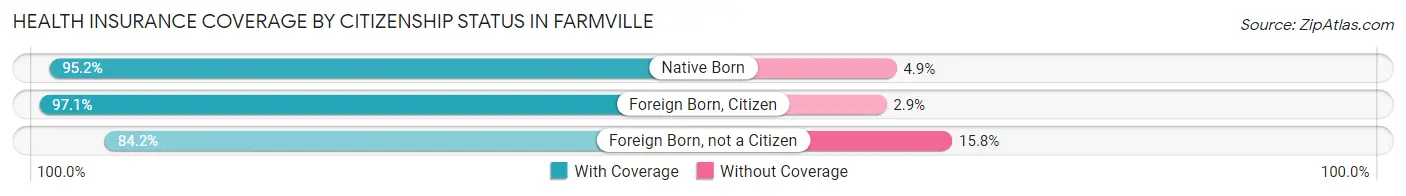
| Citizenship Status | With Coverage | Without Coverage |
| Native Born | 216 (95.2%) | 11 (4.9%) |
| Foreign Born, Citizen | 884 (97.1%) | 26 (2.9%) |
| Foreign Born, not a Citizen | 160 (84.2%) | 30 (15.8%) |
Health Insurance Coverage by Household Income in Farmville
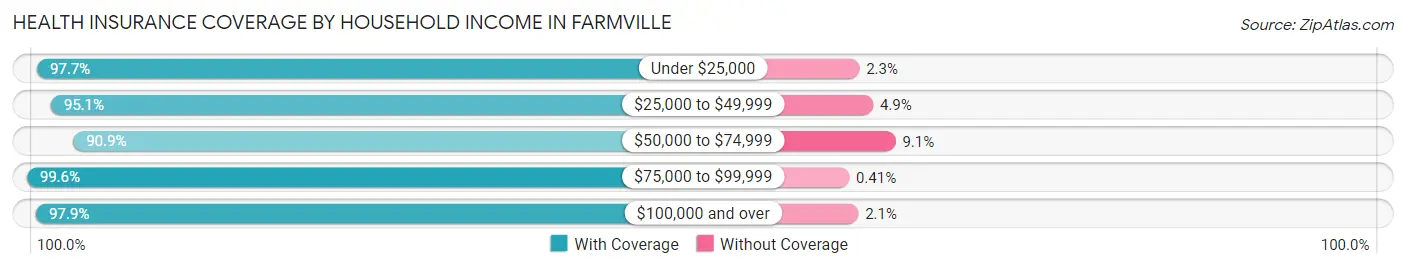
| Household Income | With Coverage | Without Coverage |
| Under $25,000 | 1,009 (97.7%) | 24 (2.3%) |
| $25,000 to $49,999 | 1,105 (95.1%) | 57 (4.9%) |
| $50,000 to $74,999 | 259 (90.9%) | 26 (9.1%) |
| $75,000 to $99,999 | 722 (99.6%) | 3 (0.4%) |
| $100,000 and over | 1,189 (97.9%) | 26 (2.1%) |
Public vs Private Health Insurance Coverage by Age in Farmville
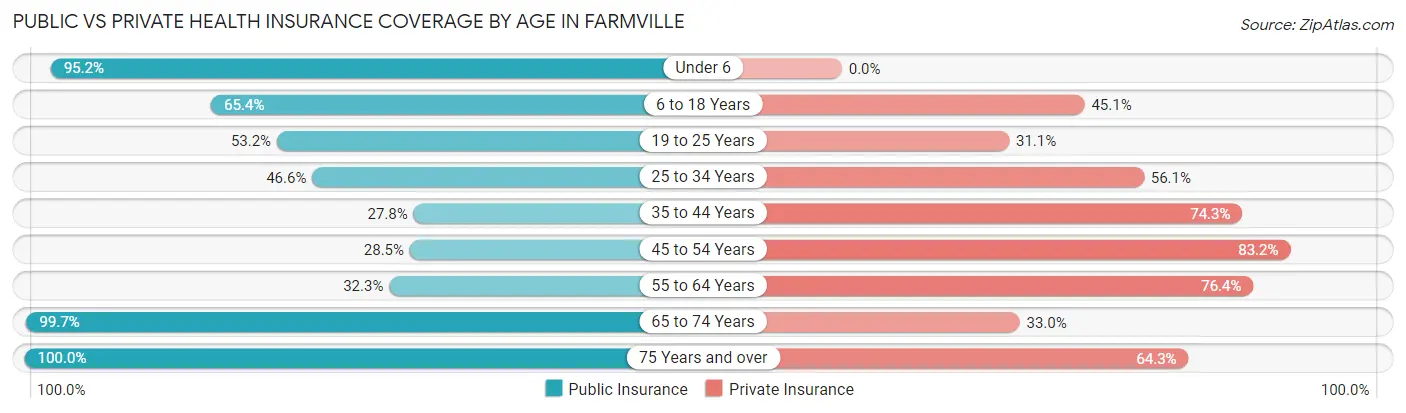
| Age Bracket | Public Insurance | Private Insurance |
| Under 6 | 216 (95.2%) | 0 (0.0%) |
| 6 to 18 Years | 595 (65.4%) | 410 (45.1%) |
| 19 to 25 Years | 101 (53.2%) | 59 (31.0%) |
| 25 to 34 Years | 227 (46.6%) | 273 (56.1%) |
| 35 to 44 Years | 104 (27.8%) | 278 (74.3%) |
| 45 to 54 Years | 102 (28.5%) | 298 (83.2%) |
| 55 to 64 Years | 201 (32.3%) | 475 (76.4%) |
| 65 to 74 Years | 876 (99.7%) | 290 (33.0%) |
| 75 Years and over | 373 (100.0%) | 240 (64.3%) |
| Total | 2,795 (63.2%) | 2,323 (52.6%) |
Disability Status by Sex by Age in Farmville
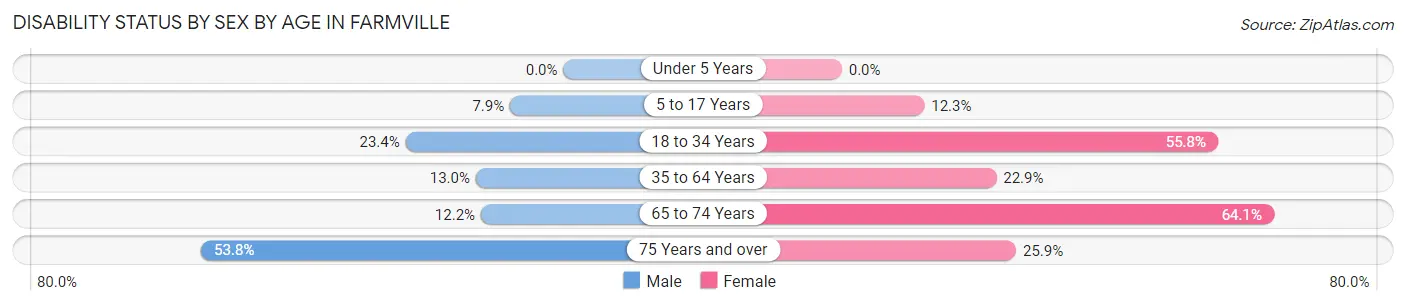
| Age Bracket | Male | Female |
| Under 5 Years | 0 (0.0%) | 0 (0.0%) |
| 5 to 17 Years | 36 (7.9%) | 62 (12.2%) |
| 18 to 34 Years | 67 (23.4%) | 230 (55.8%) |
| 35 to 64 Years | 78 (13.0%) | 173 (22.9%) |
| 65 to 74 Years | 53 (12.2%) | 286 (64.1%) |
| 75 Years and over | 78 (53.8%) | 59 (25.9%) |
Disability Class by Sex by Age in Farmville
Disability Class: Hearing Difficulty
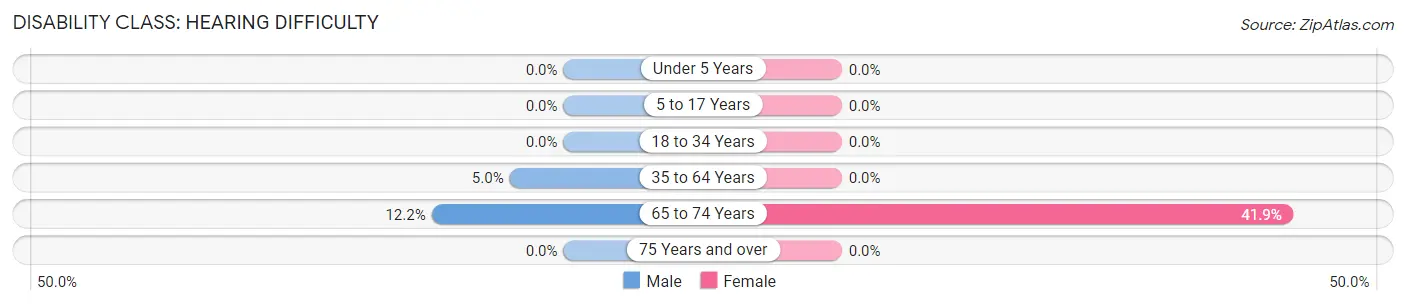
| Age Bracket | Male | Female |
| Under 5 Years | 0 (0.0%) | 0 (0.0%) |
| 5 to 17 Years | 0 (0.0%) | 0 (0.0%) |
| 18 to 34 Years | 0 (0.0%) | 0 (0.0%) |
| 35 to 64 Years | 30 (5.0%) | 0 (0.0%) |
| 65 to 74 Years | 53 (12.2%) | 187 (41.9%) |
| 75 Years and over | 0 (0.0%) | 0 (0.0%) |
Disability Class: Vision Difficulty
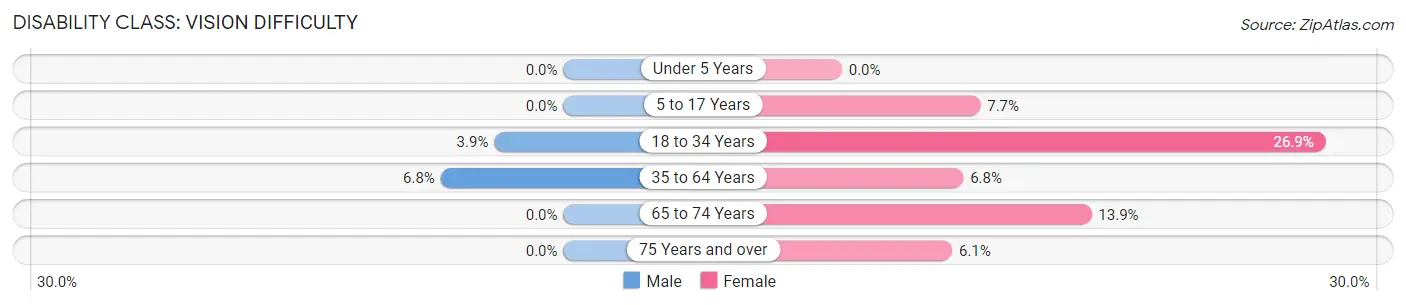
| Age Bracket | Male | Female |
| Under 5 Years | 0 (0.0%) | 0 (0.0%) |
| 5 to 17 Years | 0 (0.0%) | 39 (7.7%) |
| 18 to 34 Years | 11 (3.8%) | 111 (26.9%) |
| 35 to 64 Years | 41 (6.8%) | 51 (6.8%) |
| 65 to 74 Years | 0 (0.0%) | 62 (13.9%) |
| 75 Years and over | 0 (0.0%) | 14 (6.1%) |
Disability Class: Cognitive Difficulty
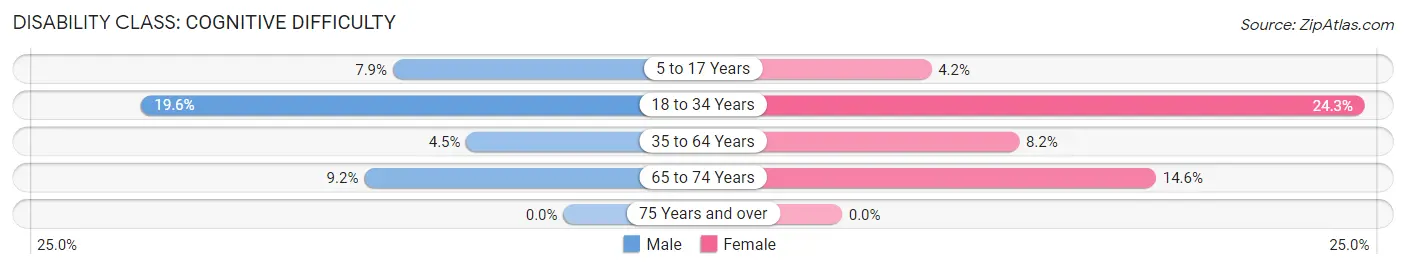
| Age Bracket | Male | Female |
| 5 to 17 Years | 36 (7.9%) | 21 (4.2%) |
| 18 to 34 Years | 56 (19.6%) | 100 (24.3%) |
| 35 to 64 Years | 27 (4.5%) | 62 (8.2%) |
| 65 to 74 Years | 40 (9.2%) | 65 (14.6%) |
| 75 Years and over | 0 (0.0%) | 0 (0.0%) |
Disability Class: Ambulatory Difficulty
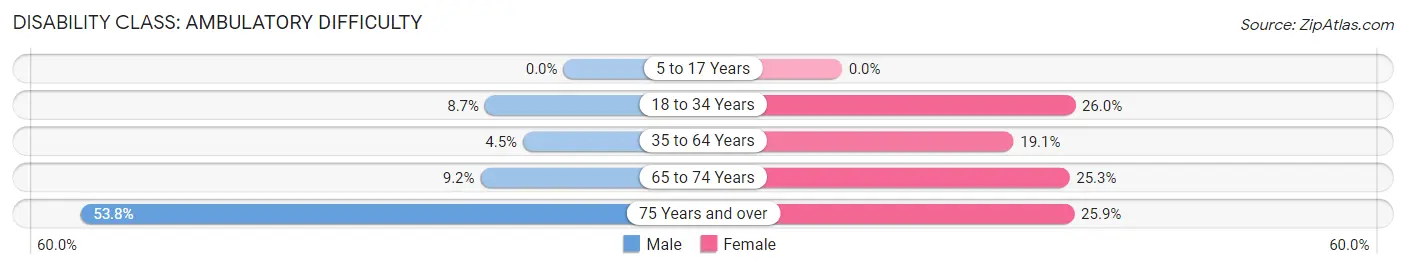
| Age Bracket | Male | Female |
| 5 to 17 Years | 0 (0.0%) | 0 (0.0%) |
| 18 to 34 Years | 25 (8.7%) | 107 (26.0%) |
| 35 to 64 Years | 27 (4.5%) | 144 (19.1%) |
| 65 to 74 Years | 40 (9.2%) | 113 (25.3%) |
| 75 Years and over | 78 (53.8%) | 59 (25.9%) |
Disability Class: Self-Care Difficulty
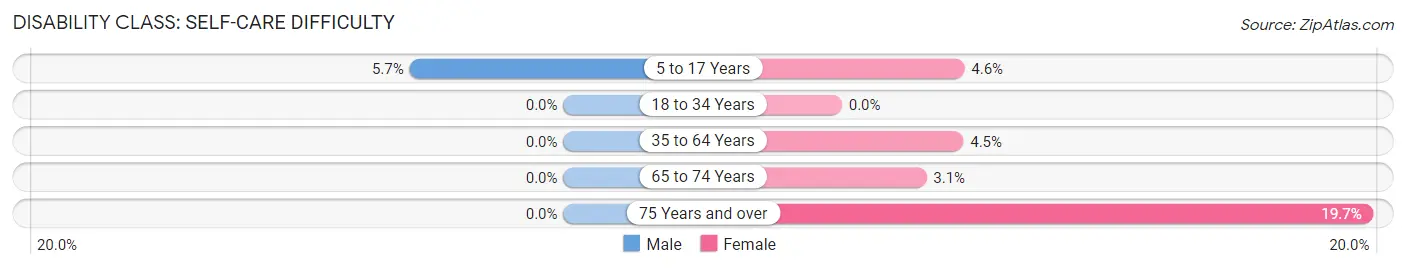
| Age Bracket | Male | Female |
| 5 to 17 Years | 26 (5.7%) | 23 (4.5%) |
| 18 to 34 Years | 0 (0.0%) | 0 (0.0%) |
| 35 to 64 Years | 0 (0.0%) | 34 (4.5%) |
| 65 to 74 Years | 0 (0.0%) | 14 (3.1%) |
| 75 Years and over | 0 (0.0%) | 45 (19.7%) |
Technology Access in Farmville
Computing Device Access in Farmville
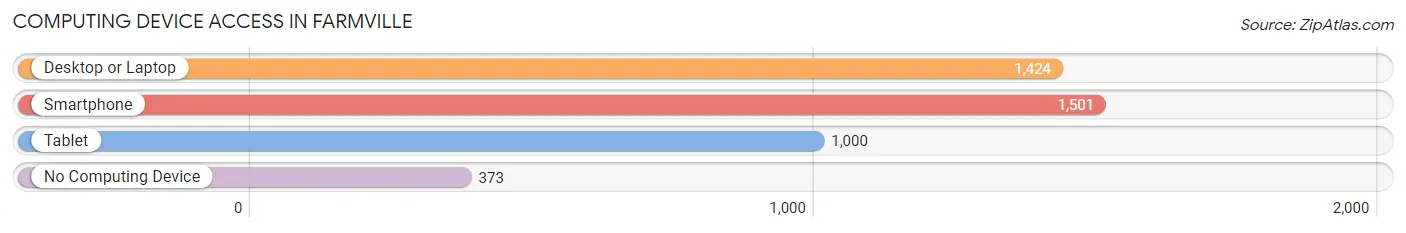
| Device Type | # Households | % Households |
| Desktop or Laptop | 1,424 | 68.0% |
| Smartphone | 1,501 | 71.7% |
| Tablet | 1,000 | 47.8% |
| No Computing Device | 373 | 17.8% |
| Total | 2,094 | 100.0% |
Internet Access in Farmville
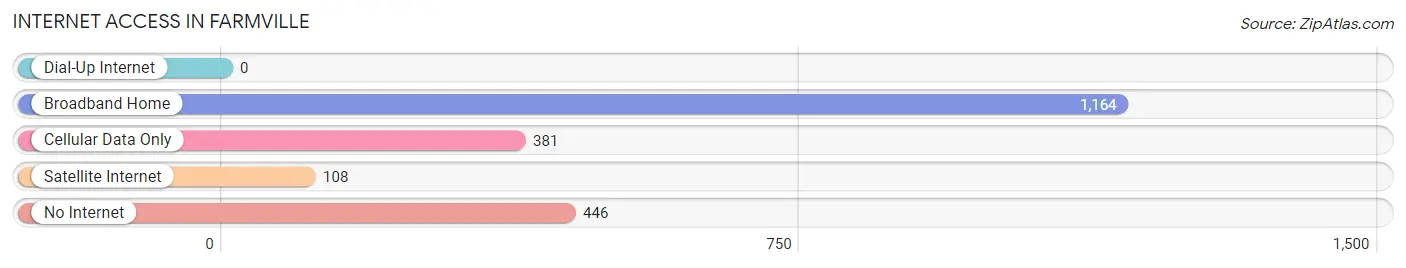
| Internet Type | # Households | % Households |
| Dial-Up Internet | 0 | 0.0% |
| Broadband Home | 1,164 | 55.6% |
| Cellular Data Only | 381 | 18.2% |
| Satellite Internet | 108 | 5.2% |
| No Internet | 446 | 21.3% |
| Total | 2,094 | 100.0% |
Farmville Summary
History
The town of Farmville, North Carolina is located in Pitt County, in the eastern part of the state. It was founded in 1760 by a group of settlers from Virginia, and was originally known as Farmville Crossroads. The town was named after the nearby plantation of the same name, which was owned by the family of William Farmville. The town was incorporated in 1855, and has since grown to become the largest town in Pitt County.
The town of Farmville has a rich history, and has been home to many notable figures throughout its history. During the Civil War, the town was the site of a major battle between Union and Confederate forces. The Battle of Farmville was fought on April 7, 1865, and resulted in a Confederate victory.
In the late 19th century, the town was home to several prominent African-American leaders, including the Reverend Henry Plummer, who founded the first African-American church in the town. The town was also home to the first African-American college in the state, the Farmville Normal and Industrial Institute, which was founded in 1892.
Geography
Farmville is located in the eastern part of North Carolina, in Pitt County. The town is situated on the banks of the Tar River, and is surrounded by rolling hills and forests. The town is located approximately 30 miles east of Greenville, and is about an hour and a half drive from Raleigh.
The town has a humid subtropical climate, with hot, humid summers and mild winters. The average annual temperature is around 70 degrees Fahrenheit, and the average annual precipitation is around 45 inches.
Economy
The economy of Farmville is largely based on agriculture and manufacturing. The town is home to several large farms, which produce a variety of crops, including corn, soybeans, cotton, and tobacco. The town is also home to several manufacturing companies, which produce a variety of products, including furniture, textiles, and electronics.
The town is also home to several retail stores, restaurants, and other businesses. The town is served by the Pitt-Greenville Airport, which provides air service to the surrounding area.
Demographics
As of the 2010 census, the population of Farmville was 8,919. The racial makeup of the town was 73.3% White, 22.2% African American, 0.4% Native American, 0.7% Asian, 0.1% Pacific Islander, and 2.3% from other races. The median household income was $35,945, and the median family income was $41,945.
The town is served by the Pitt County School District, which includes five elementary schools, two middle schools, and one high school. The town is also home to several private schools, including Farmville Christian Academy and Farmville Montessori School.
Conclusion
Farmville, North Carolina is a small town with a rich history and a vibrant economy. The town is home to several farms and manufacturing companies, as well as a variety of retail stores and restaurants. The town is served by the Pitt County School District, and is home to several private schools. The town has a diverse population, with a median household income of $35,945. Farmville is a great place to live, work, and raise a family.
Common Questions
What is Per Capita Income in Farmville?
Per Capita income in Farmville is $31,520.
What is the Median Family Income in Farmville?
Median Family Income in Farmville is $83,269.
What is the Median Household income in Farmville?
Median Household Income in Farmville is $47,604.
What is Income or Wage Gap in Farmville?
Income or Wage Gap in Farmville is 42.2%.
Women in Farmville earn 57.8 cents for every dollar earned by a man.
What is Inequality or Gini Index in Farmville?
Inequality or Gini Index in Farmville is 0.46.
What is the Total Population of Farmville?
Total Population of Farmville is 4,474.
What is the Total Male Population of Farmville?
Total Male Population of Farmville is 2,006.
What is the Total Female Population of Farmville?
Total Female Population of Farmville is 2,468.
What is the Ratio of Males per 100 Females in Farmville?
There are 81.28 Males per 100 Females in Farmville.
What is the Ratio of Females per 100 Males in Farmville?
There are 123.03 Females per 100 Males in Farmville.
What is the Median Population Age in Farmville?
Median Population Age in Farmville is 46.8 Years.
What is the Average Family Size in Farmville
Average Family Size in Farmville is 2.8 People.
What is the Average Household Size in Farmville
Average Household Size in Farmville is 2.1 People.
How Large is the Labor Force in Farmville?
There are 1,950 People in the Labor Forcein in Farmville.
What is the Percentage of People in the Labor Force in Farmville?
55.5% of People are in the Labor Force in Farmville.
What is the Unemployment Rate in Farmville?
Unemployment Rate in Farmville is 2.4%.