Kaaawa, HI Map & Demographics
Kaaawa Map
Kaaawa Overview
$53,483
PER CAPITA INCOME
$132,059
AVG FAMILY INCOME
$130,257
AVG HOUSEHOLD INCOME
66.3%
WAGE / INCOME GAP [ % ]
33.7¢/ $1
WAGE / INCOME GAP [ $ ]
0.38
INEQUALITY / GINI INDEX
1,259
TOTAL POPULATION
642
MALE POPULATION
617
FEMALE POPULATION
104.05
MALES / 100 FEMALES
96.11
FEMALES / 100 MALES
35.5
MEDIAN AGE
3.1
AVG FAMILY SIZE
2.6
AVG HOUSEHOLD SIZE
774
LABOR FORCE [ PEOPLE ]
78.3%
PERCENT IN LABOR FORCE
3.9%
UNEMPLOYMENT RATE
Kaaawa Zip Codes
Kaaawa Area Codes
Income in Kaaawa
Income Overview in Kaaawa
Per Capita Income in Kaaawa is $53,483, while median incomes of families and households are $132,059 and $130,257 respectively.
| Characteristic | Number | Measure |
| Per Capita Income | 1,259 | $53,483 |
| Median Family Income | 354 | $132,059 |
| Mean Family Income | 354 | $154,525 |
| Median Household Income | 476 | $130,257 |
| Mean Household Income | 476 | $132,732 |
| Income Deficit | 354 | $0 |
| Wage / Income Gap (%) | 1,259 | 66.32% |
| Wage / Income Gap ($) | 1,259 | 33.68¢ per $1 |
| Gini / Inequality Index | 1,259 | 0.38 |
Earnings by Sex in Kaaawa
Average Earnings in Kaaawa are $64,875, $107,630 for men and $36,250 for women, a difference of 66.3%.
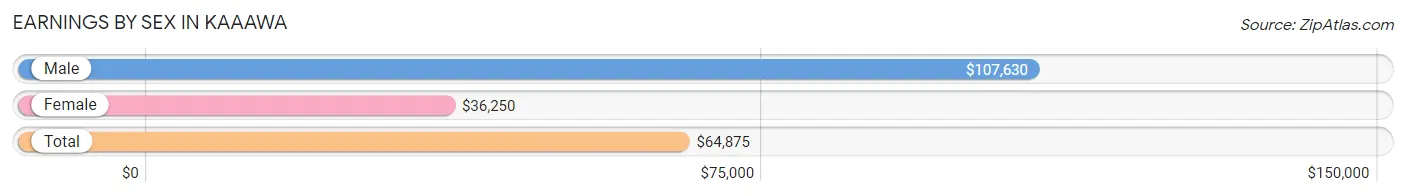
| Sex | Number | Average Earnings |
| Male | 397 (51.5%) | $107,630 |
| Female | 374 (48.5%) | $36,250 |
| Total | 771 (100.0%) | $64,875 |
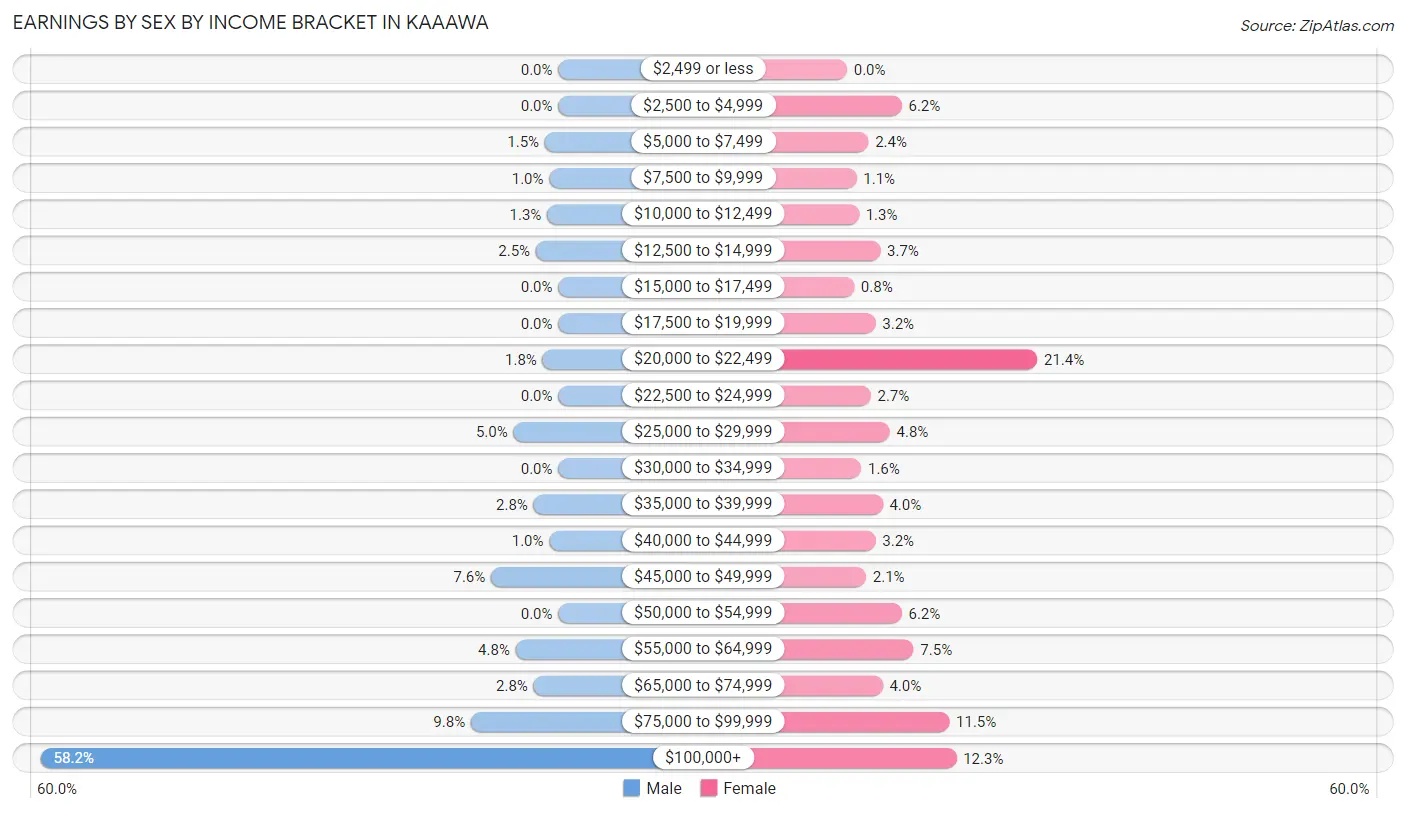
Earnings by Sex by Income Bracket in Kaaawa
The most common earnings brackets in Kaaawa are $100,000+ for men (231 | 58.2%) and $20,000 to $22,499 for women (80 | 21.4%).
| Income | Male | Female |
| $2,499 or less | 0 (0.0%) | 0 (0.0%) |
| $2,500 to $4,999 | 0 (0.0%) | 23 (6.1%) |
| $5,000 to $7,499 | 6 (1.5%) | 9 (2.4%) |
| $7,500 to $9,999 | 4 (1.0%) | 4 (1.1%) |
| $10,000 to $12,499 | 5 (1.3%) | 5 (1.3%) |
| $12,500 to $14,999 | 10 (2.5%) | 14 (3.7%) |
| $15,000 to $17,499 | 0 (0.0%) | 3 (0.8%) |
| $17,500 to $19,999 | 0 (0.0%) | 12 (3.2%) |
| $20,000 to $22,499 | 7 (1.8%) | 80 (21.4%) |
| $22,500 to $24,999 | 0 (0.0%) | 10 (2.7%) |
| $25,000 to $29,999 | 20 (5.0%) | 18 (4.8%) |
| $30,000 to $34,999 | 0 (0.0%) | 6 (1.6%) |
| $35,000 to $39,999 | 11 (2.8%) | 15 (4.0%) |
| $40,000 to $44,999 | 4 (1.0%) | 12 (3.2%) |
| $45,000 to $49,999 | 30 (7.6%) | 8 (2.1%) |
| $50,000 to $54,999 | 0 (0.0%) | 23 (6.1%) |
| $55,000 to $64,999 | 19 (4.8%) | 28 (7.5%) |
| $65,000 to $74,999 | 11 (2.8%) | 15 (4.0%) |
| $75,000 to $99,999 | 39 (9.8%) | 43 (11.5%) |
| $100,000+ | 231 (58.2%) | 46 (12.3%) |
| Total | 397 (100.0%) | 374 (100.0%) |
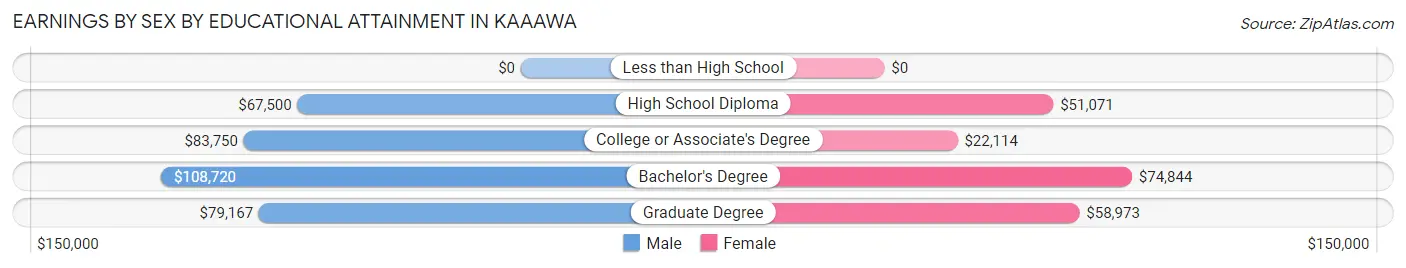
Earnings by Sex by Educational Attainment in Kaaawa
Average earnings in Kaaawa are $107,700 for men and $39,167 for women, a difference of 63.6%. Men with an educational attainment of bachelor's degree enjoy the highest average annual earnings of $108,720, while those with high school diploma education earn the least with $67,500. Women with an educational attainment of bachelor's degree earn the most with the average annual earnings of $74,844, while those with college or associate's degree education have the smallest earnings of $22,114.
| Educational Attainment | Male Income | Female Income |
| Less than High School | - | - |
| High School Diploma | $67,500 | $51,071 |
| College or Associate's Degree | $83,750 | $22,114 |
| Bachelor's Degree | $108,720 | $74,844 |
| Graduate Degree | $79,167 | $58,973 |
| Total | $107,700 | $39,167 |
Family Income in Kaaawa
Family Income Brackets in Kaaawa
According to the Kaaawa family income data, there are 130 families falling into the $100,000 to $149,999 income range, which is the most common income bracket and makes up 36.7% of all families.
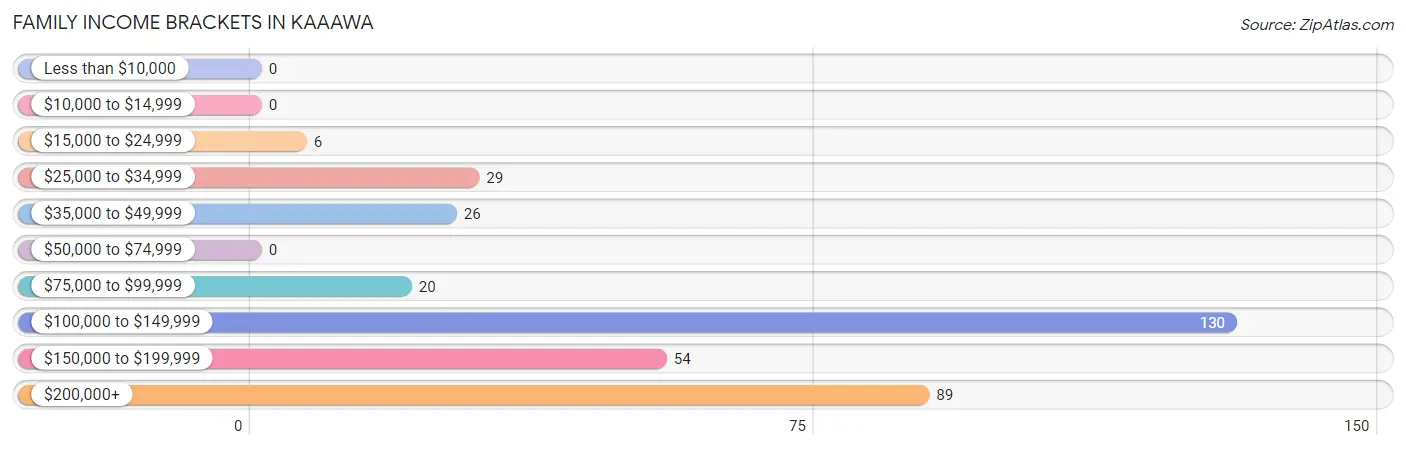
| Income Bracket | # Families | % Families |
| Less than $10,000 | 0 | 0.0% |
| $10,000 to $14,999 | 0 | 0.0% |
| $15,000 to $24,999 | 6 | 1.7% |
| $25,000 to $34,999 | 29 | 8.2% |
| $35,000 to $49,999 | 26 | 7.3% |
| $50,000 to $74,999 | 0 | 0.0% |
| $75,000 to $99,999 | 20 | 5.6% |
| $100,000 to $149,999 | 130 | 36.7% |
| $150,000 to $199,999 | 54 | 15.3% |
| $200,000+ | 89 | 25.1% |
Family Income by Famaliy Size in Kaaawa
4-person families (40 | 11.3%) account for the highest median family income in Kaaawa with $218,281 per family, while 2-person families (227 | 64.1%) have the highest median income of $65,340 per family member.
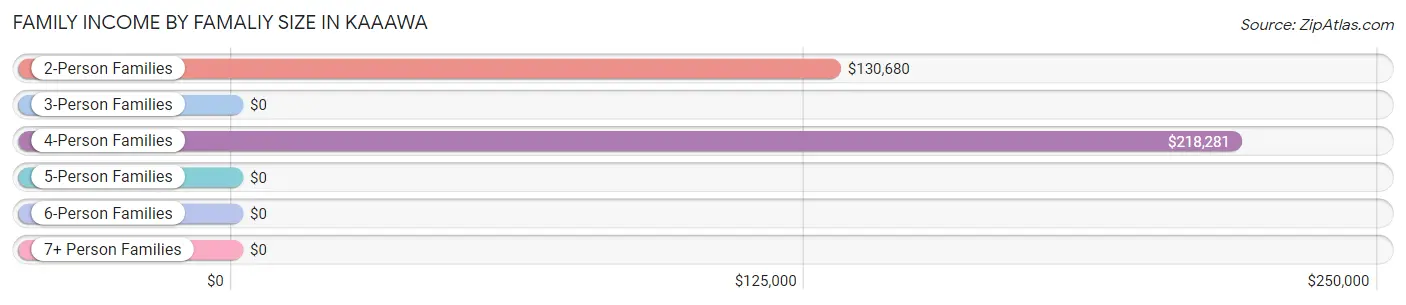
| Income Bracket | # Families | Median Income |
| 2-Person Families | 227 (64.1%) | $130,680 |
| 3-Person Families | 22 (6.2%) | $0 |
| 4-Person Families | 40 (11.3%) | $218,281 |
| 5-Person Families | 44 (12.4%) | $0 |
| 6-Person Families | 0 (0.0%) | $0 |
| 7+ Person Families | 21 (5.9%) | $0 |
| Total | 354 (100.0%) | $132,059 |
Family Income by Number of Earners in Kaaawa
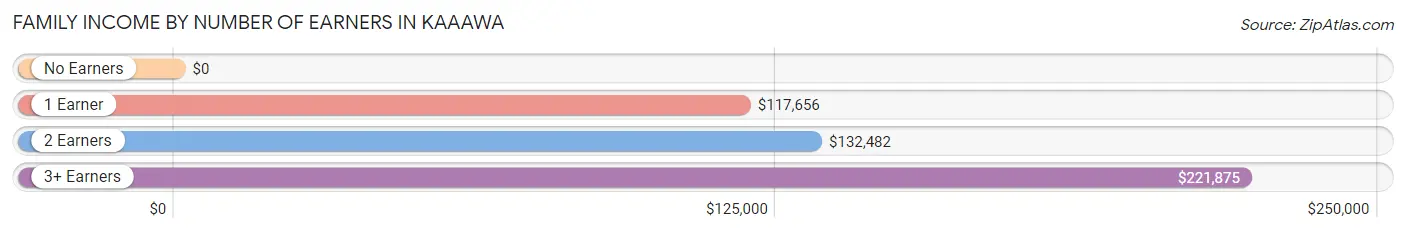
| Number of Earners | # Families | Median Income |
| No Earners | 32 (9.0%) | $0 |
| 1 Earner | 81 (22.9%) | $117,656 |
| 2 Earners | 215 (60.7%) | $132,482 |
| 3+ Earners | 26 (7.3%) | $221,875 |
| Total | 354 (100.0%) | $132,059 |
Household Income in Kaaawa
Household Income Brackets in Kaaawa
With 149 households falling in the category, the $100,000 to $149,999 income range is the most frequent in Kaaawa, accounting for 31.3% of all households.
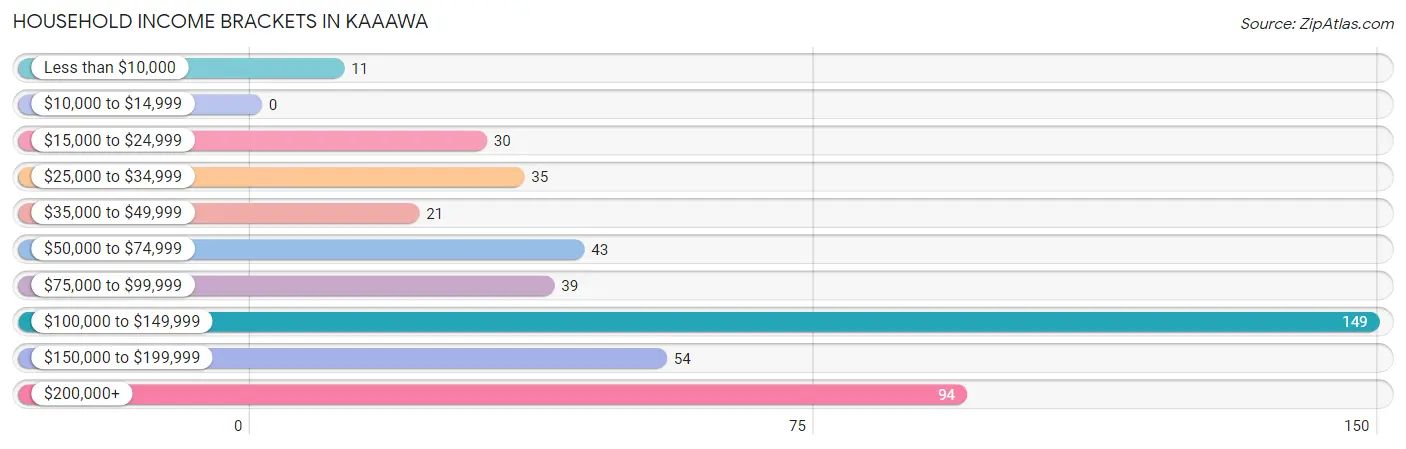
| Income Bracket | # Households | % Households |
| Less than $10,000 | 11 | 2.3% |
| $10,000 to $14,999 | 0 | 0.0% |
| $15,000 to $24,999 | 30 | 6.3% |
| $25,000 to $34,999 | 35 | 7.4% |
| $35,000 to $49,999 | 21 | 4.4% |
| $50,000 to $74,999 | 43 | 9.0% |
| $75,000 to $99,999 | 39 | 8.2% |
| $100,000 to $149,999 | 149 | 31.3% |
| $150,000 to $199,999 | 54 | 11.3% |
| $200,000+ | 94 | 19.7% |
Household Income by Householder Age in Kaaawa
The median household income in Kaaawa is $130,257, with the highest median household income of $138,214 found in the 45 to 64 years age bracket for the primary householder. A total of 162 households (34.0%) fall into this category. Meanwhile, the 15 to 24 years age bracket for the primary householder has the lowest median household income of $0, with 10 households (2.1%) in this group.
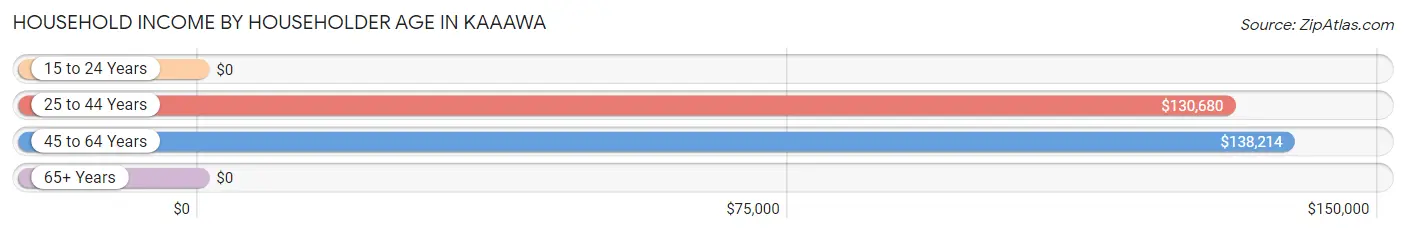
| Income Bracket | # Households | Median Income |
| 15 to 24 Years | 10 (2.1%) | $0 |
| 25 to 44 Years | 229 (48.1%) | $130,680 |
| 45 to 64 Years | 162 (34.0%) | $138,214 |
| 65+ Years | 75 (15.8%) | $0 |
| Total | 476 (100.0%) | $130,257 |
Poverty in Kaaawa
Income Below Poverty by Sex and Age in Kaaawa
With 6.7% poverty level for males and 5.8% for females among the residents of Kaaawa, under 5 year old males and 12 to 14 year old females are the most vulnerable to poverty, with 17 males (41.5%) and 7 females (20.6%) in their respective age groups living below the poverty level.
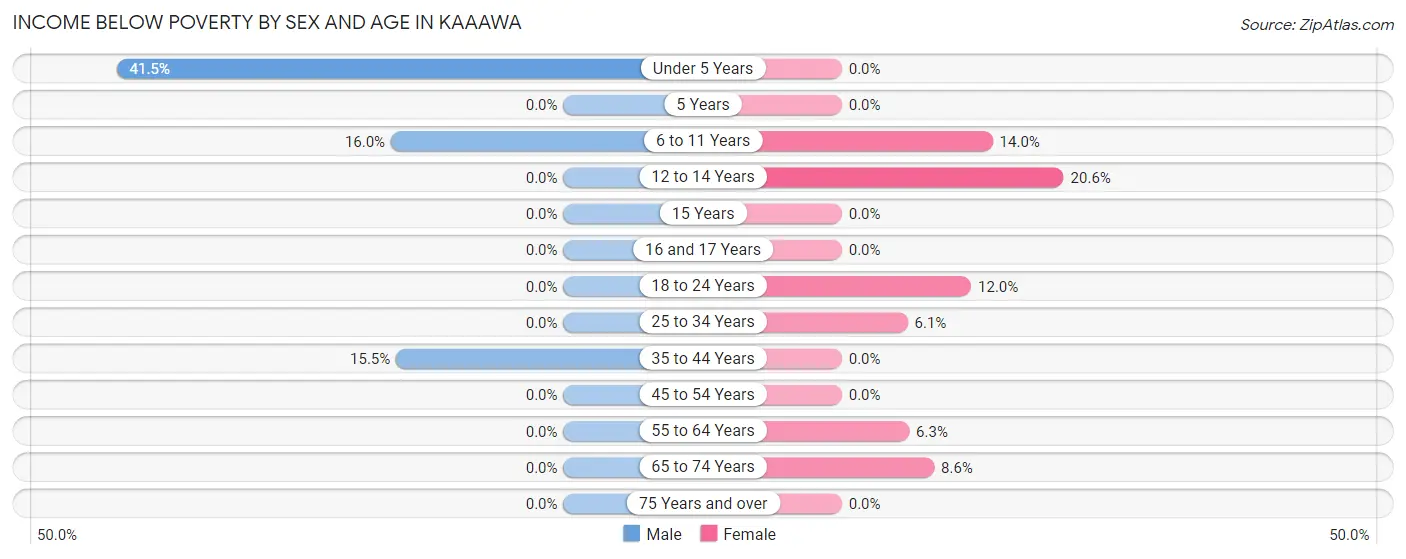
| Age Bracket | Male | Female |
| Under 5 Years | 17 (41.5%) | 0 (0.0%) |
| 5 Years | 0 (0.0%) | 0 (0.0%) |
| 6 to 11 Years | 8 (16.0%) | 7 (14.0%) |
| 12 to 14 Years | 0 (0.0%) | 7 (20.6%) |
| 15 Years | 0 (0.0%) | 0 (0.0%) |
| 16 and 17 Years | 0 (0.0%) | 0 (0.0%) |
| 18 to 24 Years | 0 (0.0%) | 3 (12.0%) |
| 25 to 34 Years | 0 (0.0%) | 8 (6.1%) |
| 35 to 44 Years | 18 (15.5%) | 0 (0.0%) |
| 45 to 54 Years | 0 (0.0%) | 0 (0.0%) |
| 55 to 64 Years | 0 (0.0%) | 5 (6.2%) |
| 65 to 74 Years | 0 (0.0%) | 6 (8.6%) |
| 75 Years and over | 0 (0.0%) | 0 (0.0%) |
| Total | 43 (6.7%) | 36 (5.8%) |
Income Above Poverty by Sex and Age in Kaaawa
According to the poverty statistics in Kaaawa, males aged 5 years and females aged under 5 years are the age groups that are most secure financially, with 100.0% of males and 100.0% of females in these age groups living above the poverty line.
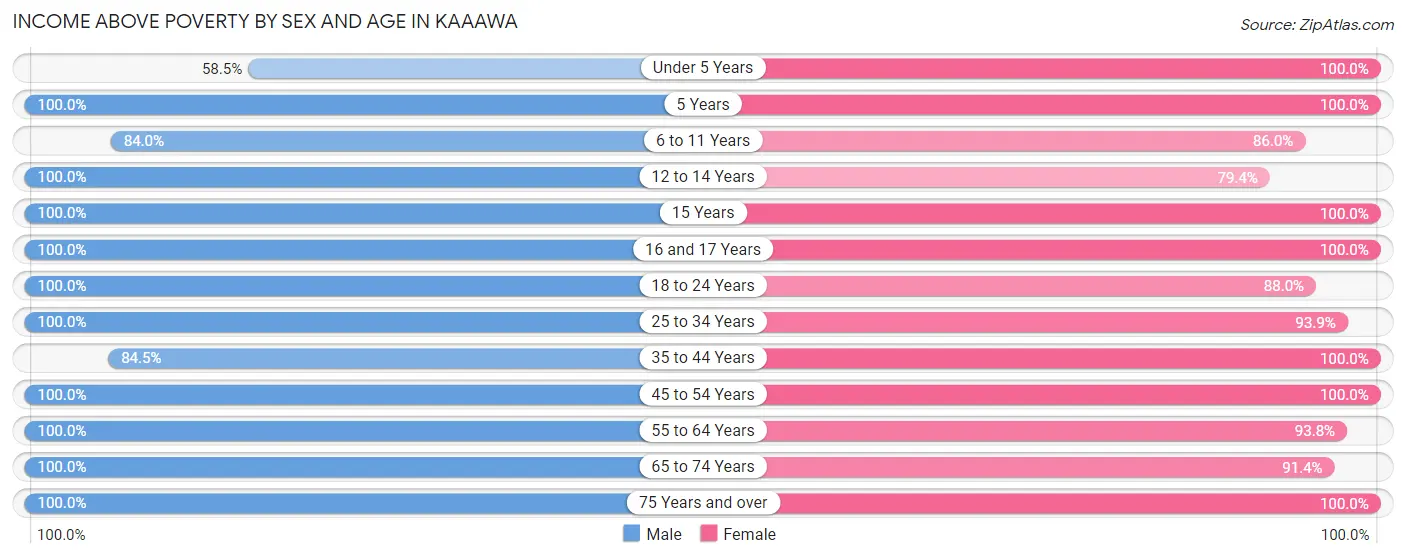
| Age Bracket | Male | Female |
| Under 5 Years | 24 (58.5%) | 7 (100.0%) |
| 5 Years | 9 (100.0%) | 7 (100.0%) |
| 6 to 11 Years | 42 (84.0%) | 43 (86.0%) |
| 12 to 14 Years | 49 (100.0%) | 27 (79.4%) |
| 15 Years | 11 (100.0%) | 12 (100.0%) |
| 16 and 17 Years | 5 (100.0%) | 14 (100.0%) |
| 18 to 24 Years | 19 (100.0%) | 22 (88.0%) |
| 25 to 34 Years | 146 (100.0%) | 123 (93.9%) |
| 35 to 44 Years | 98 (84.5%) | 109 (100.0%) |
| 45 to 54 Years | 83 (100.0%) | 55 (100.0%) |
| 55 to 64 Years | 62 (100.0%) | 75 (93.8%) |
| 65 to 74 Years | 47 (100.0%) | 64 (91.4%) |
| 75 Years and over | 4 (100.0%) | 23 (100.0%) |
| Total | 599 (93.3%) | 581 (94.2%) |
Income Below Poverty Among Married-Couple Families in Kaaawa
The poverty statistics for married-couple families in Kaaawa show that 3.7% or 11 of the total 298 families live below the poverty line. Families with 5 or more children have the highest poverty rate of 64.7%, comprising of 11 families. On the other hand, families with no children have the lowest poverty rate of 0.0%, which includes 0 families.
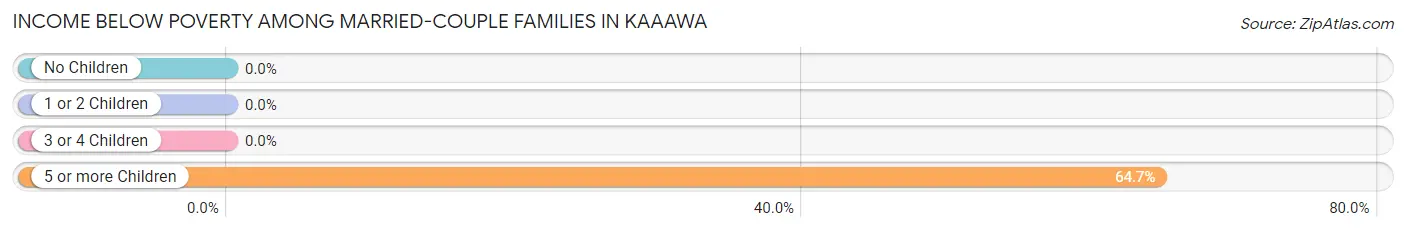
| Children | Above Poverty | Below Poverty |
| No Children | 187 (100.0%) | 0 (0.0%) |
| 1 or 2 Children | 70 (100.0%) | 0 (0.0%) |
| 3 or 4 Children | 24 (100.0%) | 0 (0.0%) |
| 5 or more Children | 6 (35.3%) | 11 (64.7%) |
| Total | 287 (96.3%) | 11 (3.7%) |
Income Below Poverty Among Single-Parent Households in Kaaawa
| Children | Single Father | Single Mother |
| No Children | 0 (0.0%) | 0 (0.0%) |
| 1 or 2 Children | 0 (0.0%) | 0 (0.0%) |
| 3 or 4 Children | 0 (0.0%) | 0 (0.0%) |
| 5 or more Children | 0 (0.0%) | 0 (0.0%) |
| Total | 0 (0.0%) | 0 (0.0%) |
Income Below Poverty Among Married-Couple vs Single-Parent Households in Kaaawa
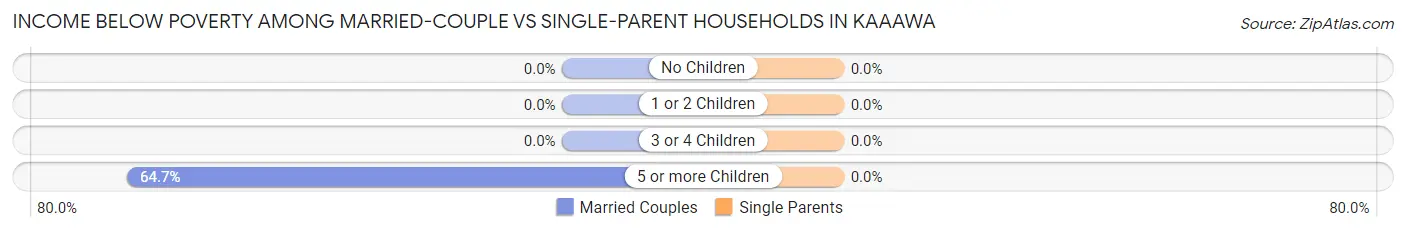
| Children | Married-Couple Families | Single-Parent Households |
| No Children | 0 (0.0%) | 0 (0.0%) |
| 1 or 2 Children | 0 (0.0%) | 0 (0.0%) |
| 3 or 4 Children | 0 (0.0%) | 0 (0.0%) |
| 5 or more Children | 11 (64.7%) | 0 (0.0%) |
| Total | 11 (3.7%) | 0 (0.0%) |
Race in Kaaawa
The most populous races in Kaaawa are Two or more Races (555 | 44.1%), White / Caucasian (498 | 39.6%), and Hispanic or Latino (202 | 16.0%).
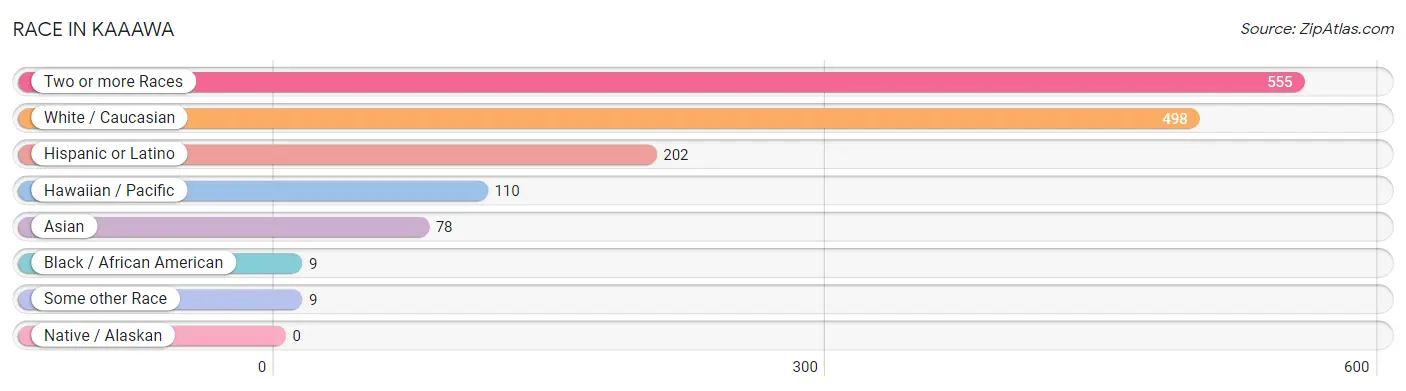
| Race | # Population | % Population |
| Asian | 78 | 6.2% |
| Black / African American | 9 | 0.7% |
| Hawaiian / Pacific | 110 | 8.7% |
| Hispanic or Latino | 202 | 16.0% |
| Native / Alaskan | 0 | 0.0% |
| White / Caucasian | 498 | 39.6% |
| Two or more Races | 555 | 44.1% |
| Some other Race | 9 | 0.7% |
| Total | 1,259 | 100.0% |
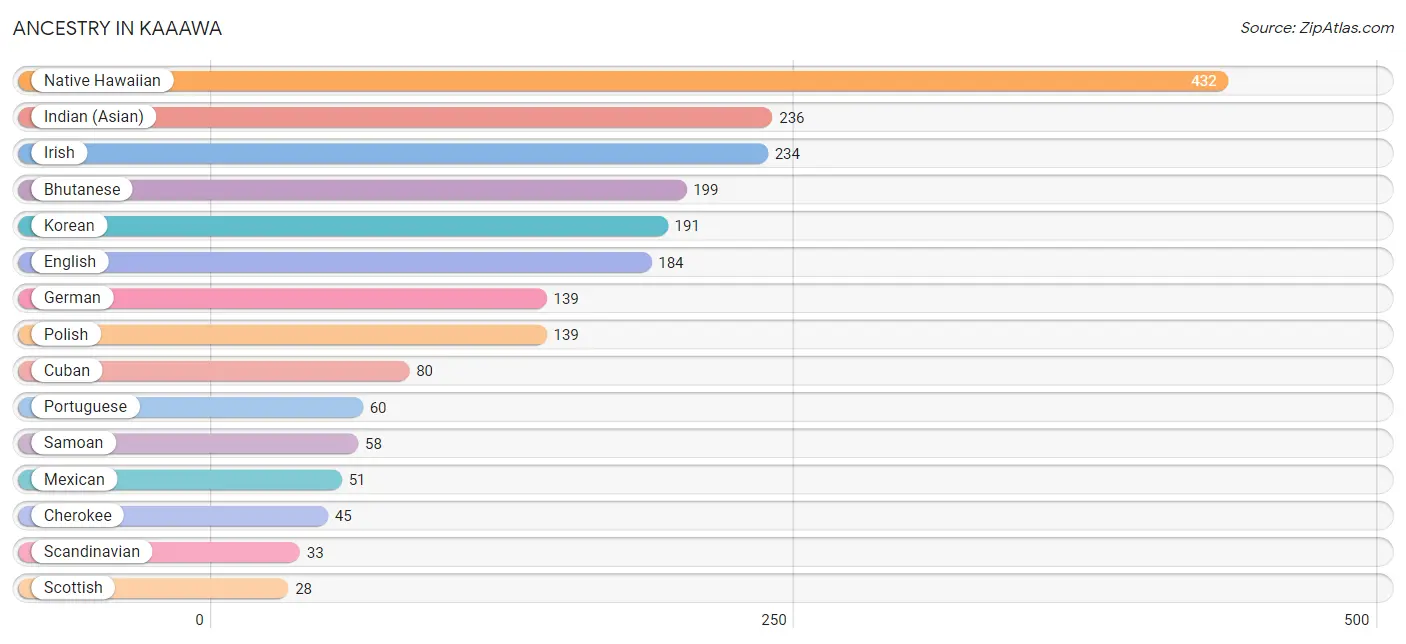
Ancestry in Kaaawa
The most populous ancestries reported in Kaaawa are Native Hawaiian (432 | 34.3%), Indian (Asian) (236 | 18.8%), Irish (234 | 18.6%), Bhutanese (199 | 15.8%), and Korean (191 | 15.2%), together accounting for 102.6% of all Kaaawa residents.
| Ancestry | # Population | % Population |
| American | 23 | 1.8% |
| Armenian | 6 | 0.5% |
| Bhutanese | 199 | 15.8% |
| Burmese | 13 | 1.0% |
| Cherokee | 45 | 3.6% |
| Chinese | 7 | 0.6% |
| Cuban | 80 | 6.4% |
| Danish | 7 | 0.6% |
| Dutch | 10 | 0.8% |
| English | 184 | 14.6% |
| European | 7 | 0.6% |
| Filipino | 4 | 0.3% |
| French | 26 | 2.1% |
| German | 139 | 11.0% |
| Hungarian | 3 | 0.2% |
| Icelander | 6 | 0.5% |
| Indian (Asian) | 236 | 18.8% |
| Irish | 234 | 18.6% |
| Italian | 10 | 0.8% |
| Jamaican | 3 | 0.2% |
| Korean | 191 | 15.2% |
| Mexican | 51 | 4.1% |
| Native Hawaiian | 432 | 34.3% |
| Norwegian | 17 | 1.3% |
| Polish | 139 | 11.0% |
| Portuguese | 60 | 4.8% |
| Puerto Rican | 26 | 2.1% |
| Russian | 3 | 0.2% |
| Samoan | 58 | 4.6% |
| Scandinavian | 33 | 2.6% |
| Scotch-Irish | 6 | 0.5% |
| Scottish | 28 | 2.2% |
| Spaniard | 5 | 0.4% |
| Spanish | 11 | 0.9% |
| Spanish American | 6 | 0.5% |
| Swedish | 8 | 0.6% |
| West Indian | 5 | 0.4% | View All 37 Rows |
Immigrants in Kaaawa
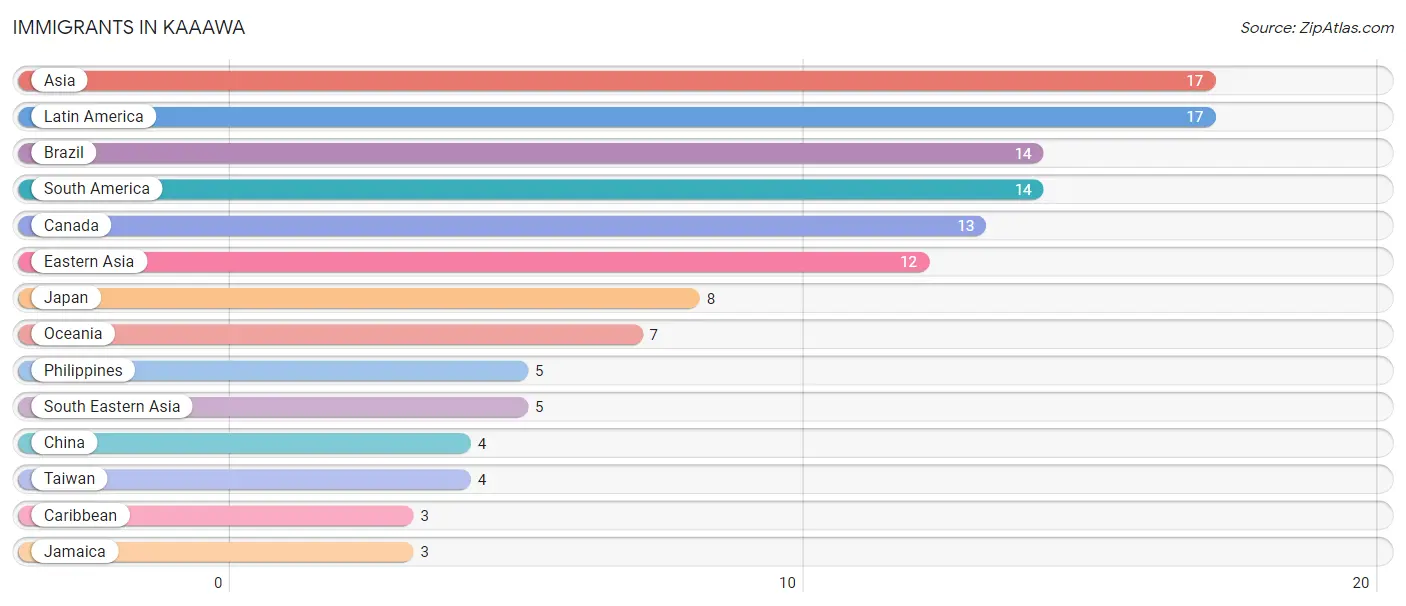
The most numerous immigrant groups reported in Kaaawa came from Asia (17 | 1.3%), Latin America (17 | 1.3%), Brazil (14 | 1.1%), South America (14 | 1.1%), and Canada (13 | 1.0%), together accounting for 5.9% of all Kaaawa residents.
| Immigration Origin | # Population | % Population |
| Asia | 17 | 1.3% |
| Brazil | 14 | 1.1% |
| Canada | 13 | 1.0% |
| Caribbean | 3 | 0.2% |
| China | 4 | 0.3% |
| Eastern Asia | 12 | 0.9% |
| Jamaica | 3 | 0.2% |
| Japan | 8 | 0.6% |
| Latin America | 17 | 1.3% |
| Oceania | 7 | 0.6% |
| Philippines | 5 | 0.4% |
| South America | 14 | 1.1% |
| South Eastern Asia | 5 | 0.4% |
| Taiwan | 4 | 0.3% | View All 14 Rows |
Sex and Age in Kaaawa
Sex and Age in Kaaawa
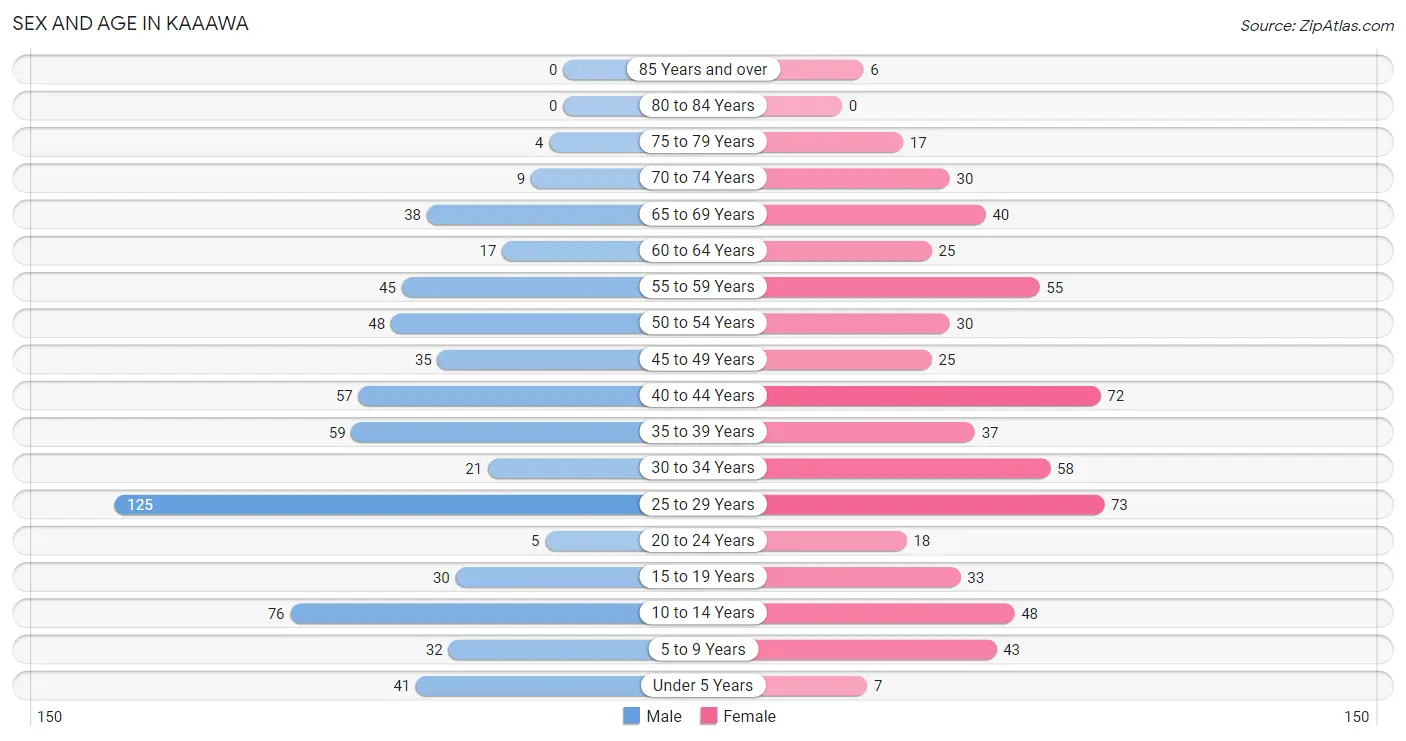
The most populous age groups in Kaaawa are 25 to 29 Years (125 | 19.5%) for men and 25 to 29 Years (73 | 11.8%) for women.
| Age Bracket | Male | Female |
| Under 5 Years | 41 (6.4%) | 7 (1.1%) |
| 5 to 9 Years | 32 (5.0%) | 43 (7.0%) |
| 10 to 14 Years | 76 (11.8%) | 48 (7.8%) |
| 15 to 19 Years | 30 (4.7%) | 33 (5.3%) |
| 20 to 24 Years | 5 (0.8%) | 18 (2.9%) |
| 25 to 29 Years | 125 (19.5%) | 73 (11.8%) |
| 30 to 34 Years | 21 (3.3%) | 58 (9.4%) |
| 35 to 39 Years | 59 (9.2%) | 37 (6.0%) |
| 40 to 44 Years | 57 (8.9%) | 72 (11.7%) |
| 45 to 49 Years | 35 (5.4%) | 25 (4.1%) |
| 50 to 54 Years | 48 (7.5%) | 30 (4.9%) |
| 55 to 59 Years | 45 (7.0%) | 55 (8.9%) |
| 60 to 64 Years | 17 (2.6%) | 25 (4.1%) |
| 65 to 69 Years | 38 (5.9%) | 40 (6.5%) |
| 70 to 74 Years | 9 (1.4%) | 30 (4.9%) |
| 75 to 79 Years | 4 (0.6%) | 17 (2.8%) |
| 80 to 84 Years | 0 (0.0%) | 0 (0.0%) |
| 85 Years and over | 0 (0.0%) | 6 (1.0%) |
| Total | 642 (100.0%) | 617 (100.0%) |
Families and Households in Kaaawa
Median Family Size in Kaaawa
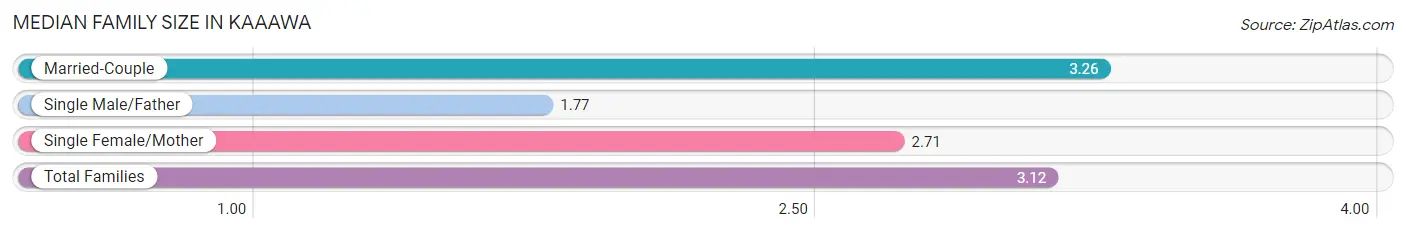
The median family size in Kaaawa is 3.12 persons per family, with married-couple families (298 | 84.2%) accounting for the largest median family size of 3.26 persons per family. On the other hand, single male/father families (22 | 6.2%) represent the smallest median family size with 1.77 persons per family.
| Family Type | # Families | Family Size |
| Married-Couple | 298 (84.2%) | 3.26 |
| Single Male/Father | 22 (6.2%) | 1.77 |
| Single Female/Mother | 34 (9.6%) | 2.71 |
| Total Families | 354 (100.0%) | 3.12 |
Median Household Size in Kaaawa
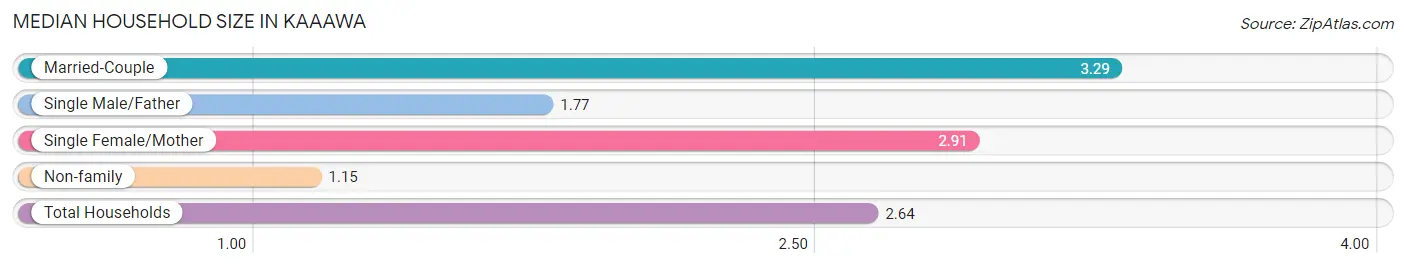
The median household size in Kaaawa is 2.64 persons per household, with married-couple households (298 | 62.6%) accounting for the largest median household size of 3.29 persons per household. non-family households (122 | 25.6%) represent the smallest median household size with 1.15 persons per household.
| Household Type | # Households | Household Size |
| Married-Couple | 298 (62.6%) | 3.29 |
| Single Male/Father | 22 (4.6%) | 1.77 |
| Single Female/Mother | 34 (7.1%) | 2.91 |
| Non-family | 122 (25.6%) | 1.15 |
| Total Households | 476 (100.0%) | 2.64 |
Household Size by Marriage Status in Kaaawa
Out of a total of 476 households in Kaaawa, 354 (74.4%) are family households, while 122 (25.6%) are nonfamily households. The most numerous type of family households are 2-person households, comprising 210, and the most common type of nonfamily households are 1-person households, comprising 114.
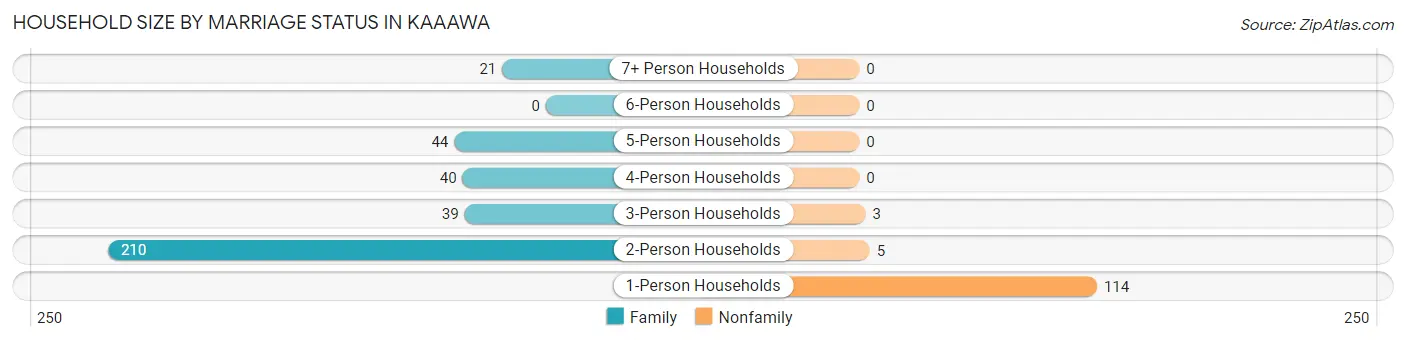
| Household Size | Family Households | Nonfamily Households |
| 1-Person Households | - | 114 (23.9%) |
| 2-Person Households | 210 (44.1%) | 5 (1.1%) |
| 3-Person Households | 39 (8.2%) | 3 (0.6%) |
| 4-Person Households | 40 (8.4%) | 0 (0.0%) |
| 5-Person Households | 44 (9.2%) | 0 (0.0%) |
| 6-Person Households | 0 (0.0%) | 0 (0.0%) |
| 7+ Person Households | 21 (4.4%) | 0 (0.0%) |
| Total | 354 (74.4%) | 122 (25.6%) |
Female Fertility in Kaaawa
Fertility by Age in Kaaawa
| Age Bracket | Women with Births | Births / 1,000 Women |
| 15 to 19 years | 0 (0.0%) | 0.0 |
| 20 to 34 years | 0 (0.0%) | 0.0 |
| 35 to 50 years | 0 (0.0%) | 0.0 |
| Total | 0 (0.0%) | 0.0 |
Fertility by Age by Marriage Status in Kaaawa
| Age Bracket | Married | Unmarried |
| 15 to 19 years | 0 (0.0%) | 0 (0.0%) |
| 20 to 34 years | 0 (0.0%) | 0 (0.0%) |
| 35 to 50 years | 0 (0.0%) | 0 (0.0%) |
| Total | 0 (0.0%) | 0 (0.0%) |
Fertility by Education in Kaaawa

| Educational Attainment | Women with Births | Births / 1,000 Women |
| Less than High School | 0 (0.0%) | 0.0 |
| High School Diploma | 0 (0.0%) | 0.0 |
| College or Associate's Degree | 0 (0.0%) | 0.0 |
| Bachelor's Degree | 0 (0.0%) | 0.0 |
| Graduate Degree | 0 (0.0%) | 0.0 |
| Total | 0 (0.0%) | 0.0 |
Fertility by Education by Marriage Status in Kaaawa
| Educational Attainment | Married | Unmarried |
| Less than High School | 0 (0.0%) | 0 (0.0%) |
| High School Diploma | 0 (0.0%) | 0 (0.0%) |
| College or Associate's Degree | 0 (0.0%) | 0 (0.0%) |
| Bachelor's Degree | 0 (0.0%) | 0 (0.0%) |
| Graduate Degree | 0 (0.0%) | 0 (0.0%) |
| Total | 0 (0.0%) | 0 (0.0%) |
Employment Characteristics in Kaaawa
Employment by Class of Employer in Kaaawa
Among the 719 employed individuals in Kaaawa, private company employees (301 | 41.9%), federal government employees (198 | 27.5%), and state government employees (61 | 8.5%) make up the most common classes of employment.
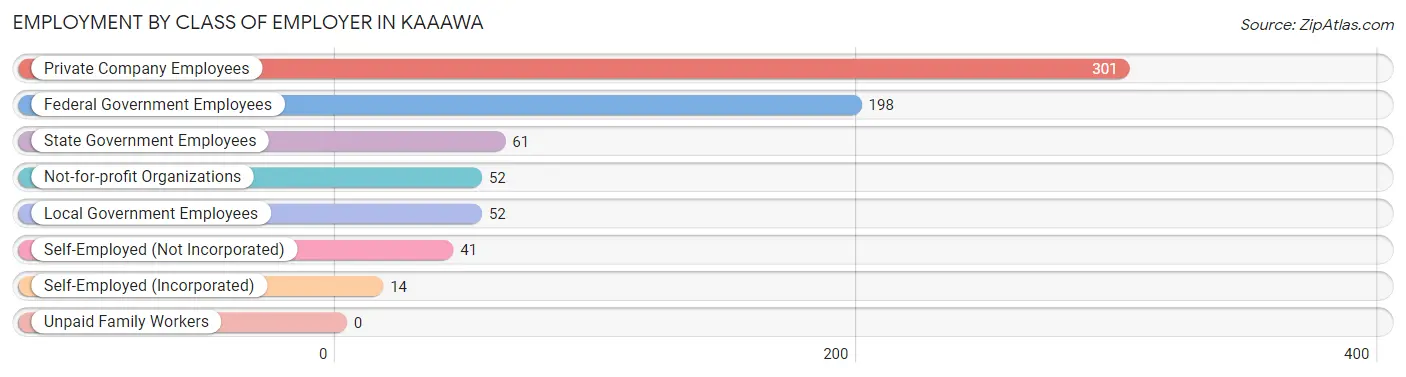
| Employer Class | # Employees | % Employees |
| Private Company Employees | 301 | 41.9% |
| Self-Employed (Incorporated) | 14 | 1.9% |
| Self-Employed (Not Incorporated) | 41 | 5.7% |
| Not-for-profit Organizations | 52 | 7.2% |
| Local Government Employees | 52 | 7.2% |
| State Government Employees | 61 | 8.5% |
| Federal Government Employees | 198 | 27.5% |
| Unpaid Family Workers | 0 | 0.0% |
| Total | 719 | 100.0% |
Employment Status by Age in Kaaawa
According to the labor force statistics for Kaaawa, out of the total population over 16 years of age (989), 78.3% or 774 individuals are in the labor force, with 3.9% or 30 of them unemployed. The age group with the highest labor force participation rate is 25 to 29 years, with 100.0% or 198 individuals in the labor force. Within the labor force, the 20 to 24 years age range has the highest percentage of unemployed individuals, with 27.8% or 5 of them being unemployed.
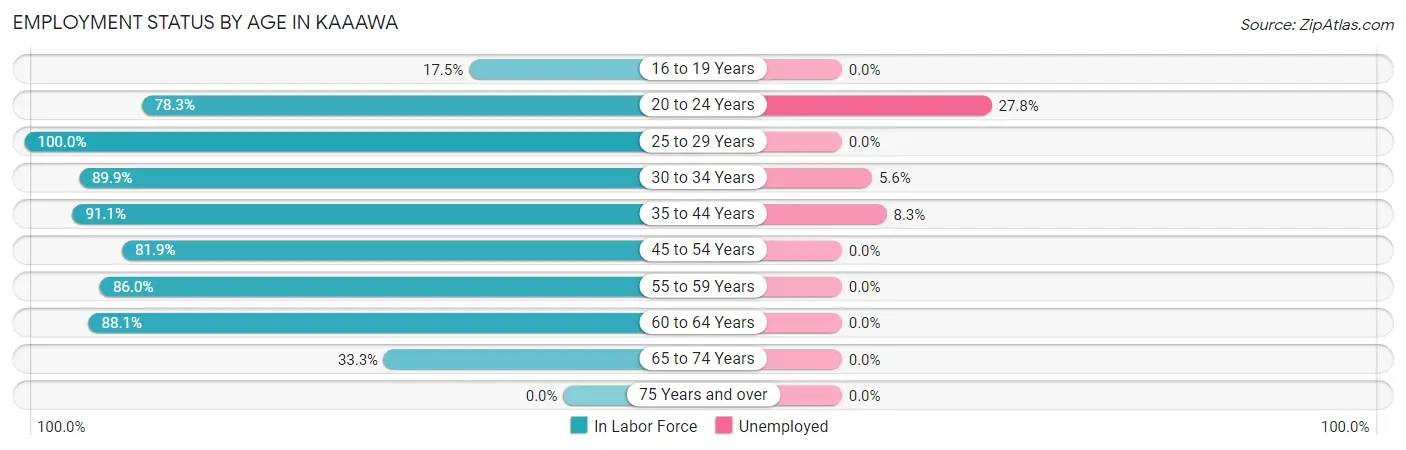
| Age Bracket | In Labor Force | Unemployed |
| 16 to 19 Years | 7 (17.5%) | 0 (0.0%) |
| 20 to 24 Years | 18 (78.3%) | 5 (27.8%) |
| 25 to 29 Years | 198 (100.0%) | 0 (0.0%) |
| 30 to 34 Years | 71 (89.9%) | 4 (5.6%) |
| 35 to 44 Years | 205 (91.1%) | 17 (8.3%) |
| 45 to 54 Years | 113 (81.9%) | 0 (0.0%) |
| 55 to 59 Years | 86 (86.0%) | 0 (0.0%) |
| 60 to 64 Years | 37 (88.1%) | 0 (0.0%) |
| 65 to 74 Years | 39 (33.3%) | 0 (0.0%) |
| 75 Years and over | 0 (0.0%) | 0 (0.0%) |
| Total | 774 (78.3%) | 30 (3.9%) |
Employment Status by Educational Attainment in Kaaawa
According to labor force statistics for Kaaawa, 90.8% of individuals (710) out of the total population between 25 and 64 years of age (782) are in the labor force, with 3.5% or 25 of them being unemployed. The group with the highest labor force participation rate are those with the educational attainment of less than high school, with 100.0% or 9 individuals in the labor force. Within the labor force, individuals with high school diploma education have the highest percentage of unemployment, with 11.8% or 9 of them being unemployed.
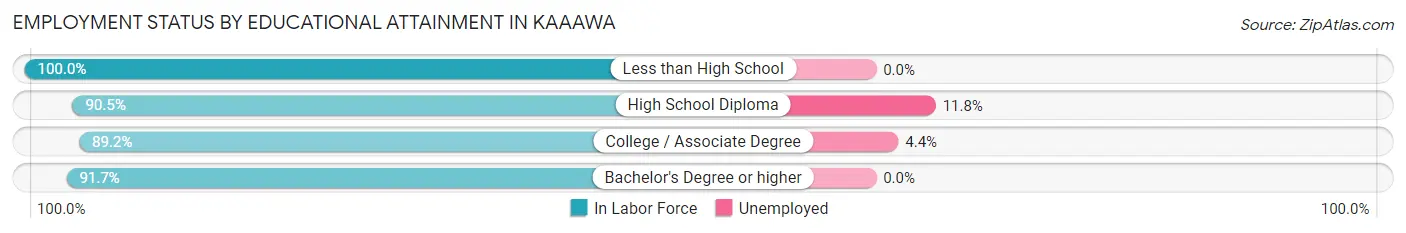
| Educational Attainment | In Labor Force | Unemployed |
| Less than High School | 9 (100.0%) | 0 (0.0%) |
| High School Diploma | 76 (90.5%) | 10 (11.8%) |
| College / Associate Degree | 249 (89.2%) | 12 (4.4%) |
| Bachelor's Degree or higher | 376 (91.7%) | 0 (0.0%) |
| Total | 710 (90.8%) | 27 (3.5%) |
Employment Occupations by Sex in Kaaawa
Management, Business, Science and Arts Occupations
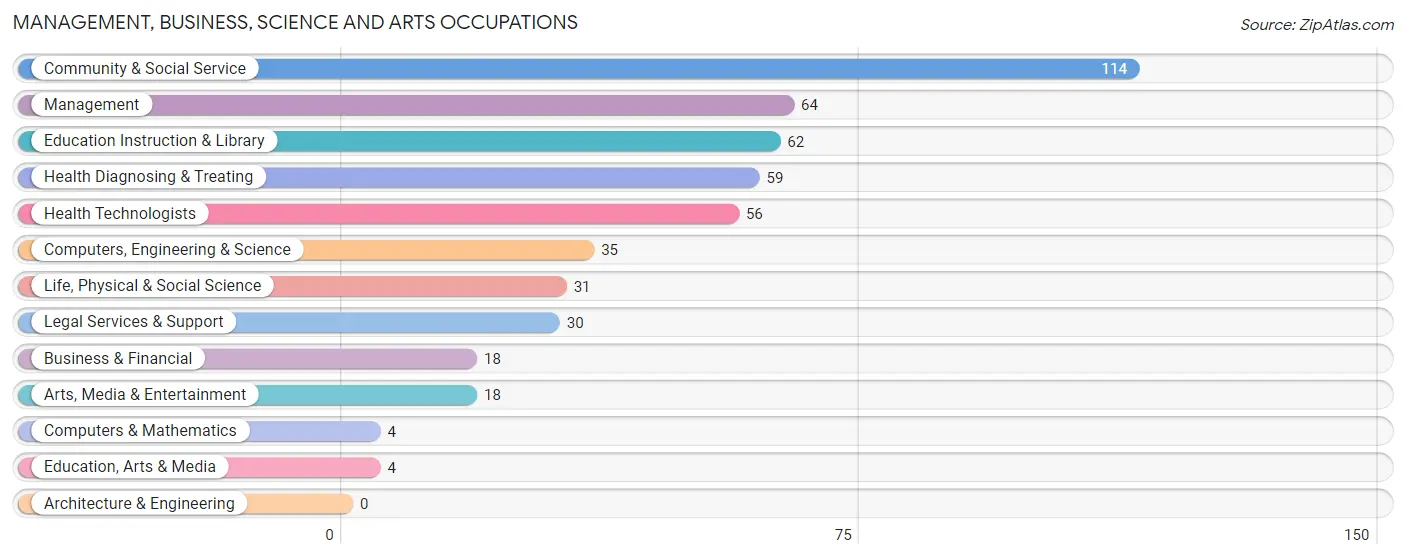
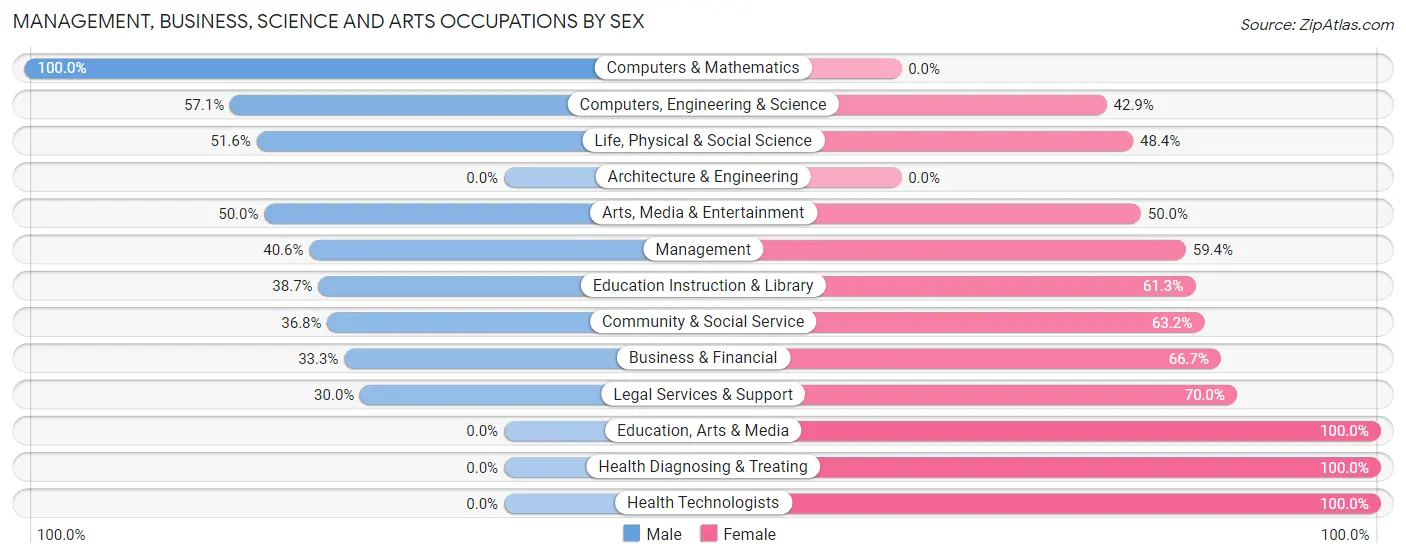
The most common Management, Business, Science and Arts occupations in Kaaawa are Community & Social Service (114 | 18.7%), Management (64 | 10.5%), Education Instruction & Library (62 | 10.2%), Health Diagnosing & Treating (59 | 9.7%), and Health Technologists (56 | 9.2%).
Management, Business, Science and Arts Occupations by Sex
Within the Management, Business, Science and Arts occupations in Kaaawa, the most male-oriented occupations are Computers & Mathematics (100.0%), Computers, Engineering & Science (57.1%), and Life, Physical & Social Science (51.6%), while the most female-oriented occupations are Education, Arts & Media (100.0%), Health Diagnosing & Treating (100.0%), and Health Technologists (100.0%).
| Occupation | Male | Female |
| Management | 26 (40.6%) | 38 (59.4%) |
| Business & Financial | 6 (33.3%) | 12 (66.7%) |
| Computers, Engineering & Science | 20 (57.1%) | 15 (42.9%) |
| Computers & Mathematics | 4 (100.0%) | 0 (0.0%) |
| Architecture & Engineering | 0 (0.0%) | 0 (0.0%) |
| Life, Physical & Social Science | 16 (51.6%) | 15 (48.4%) |
| Community & Social Service | 42 (36.8%) | 72 (63.2%) |
| Education, Arts & Media | 0 (0.0%) | 4 (100.0%) |
| Legal Services & Support | 9 (30.0%) | 21 (70.0%) |
| Education Instruction & Library | 24 (38.7%) | 38 (61.3%) |
| Arts, Media & Entertainment | 9 (50.0%) | 9 (50.0%) |
| Health Diagnosing & Treating | 0 (0.0%) | 59 (100.0%) |
| Health Technologists | 0 (0.0%) | 56 (100.0%) |
| Total (Category) | 94 (32.4%) | 196 (67.6%) |
| Total (Overall) | 246 (40.3%) | 365 (59.7%) |
Services Occupations
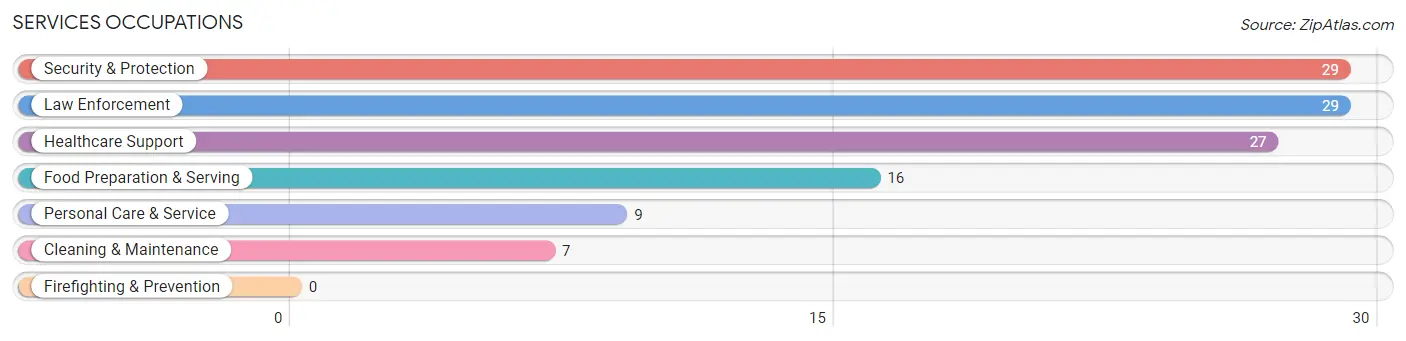
The most common Services occupations in Kaaawa are Security & Protection (29 | 4.8%), Law Enforcement (29 | 4.8%), Healthcare Support (27 | 4.4%), Food Preparation & Serving (16 | 2.6%), and Personal Care & Service (9 | 1.5%).
Services Occupations by Sex
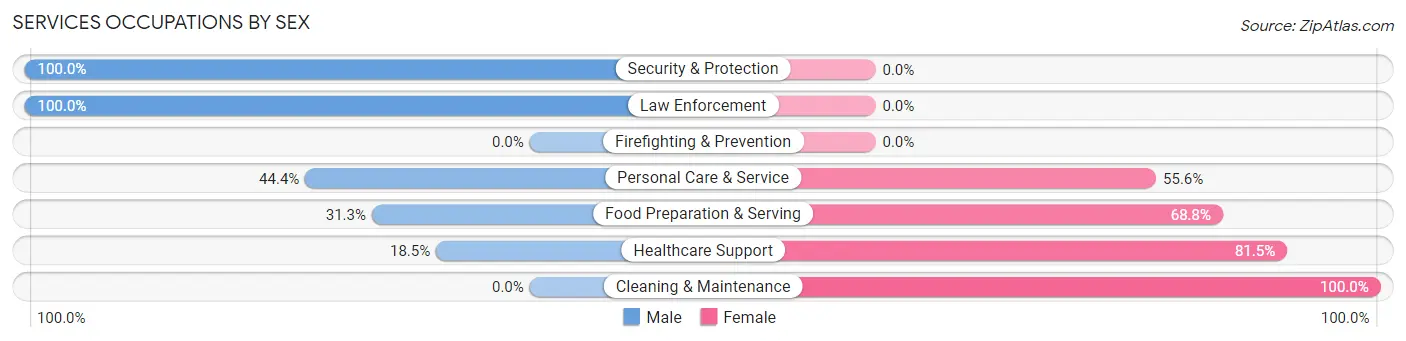
Within the Services occupations in Kaaawa, the most male-oriented occupations are Security & Protection (100.0%), Law Enforcement (100.0%), and Personal Care & Service (44.4%), while the most female-oriented occupations are Cleaning & Maintenance (100.0%), Healthcare Support (81.5%), and Food Preparation & Serving (68.8%).
| Occupation | Male | Female |
| Healthcare Support | 5 (18.5%) | 22 (81.5%) |
| Security & Protection | 29 (100.0%) | 0 (0.0%) |
| Firefighting & Prevention | 0 (0.0%) | 0 (0.0%) |
| Law Enforcement | 29 (100.0%) | 0 (0.0%) |
| Food Preparation & Serving | 5 (31.2%) | 11 (68.8%) |
| Cleaning & Maintenance | 0 (0.0%) | 7 (100.0%) |
| Personal Care & Service | 4 (44.4%) | 5 (55.6%) |
| Total (Category) | 43 (48.9%) | 45 (51.1%) |
| Total (Overall) | 246 (40.3%) | 365 (59.7%) |
Sales and Office Occupations
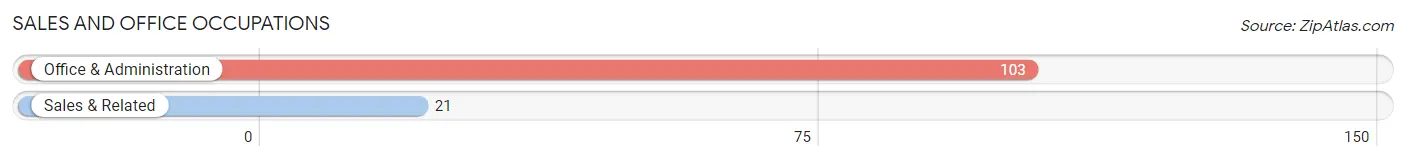
The most common Sales and Office occupations in Kaaawa are Office & Administration (103 | 16.9%), and Sales & Related (21 | 3.4%).
Sales and Office Occupations by Sex
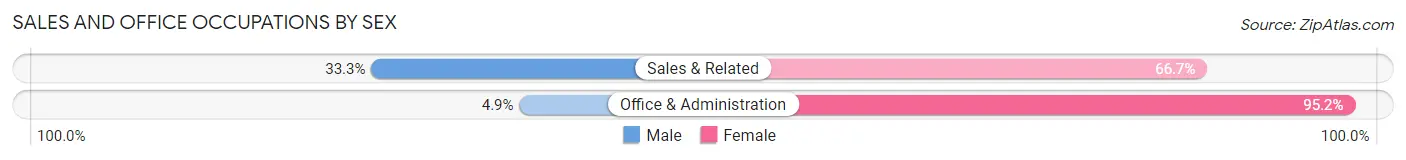
| Occupation | Male | Female |
| Sales & Related | 7 (33.3%) | 14 (66.7%) |
| Office & Administration | 5 (4.9%) | 98 (95.2%) |
| Total (Category) | 12 (9.7%) | 112 (90.3%) |
| Total (Overall) | 246 (40.3%) | 365 (59.7%) |
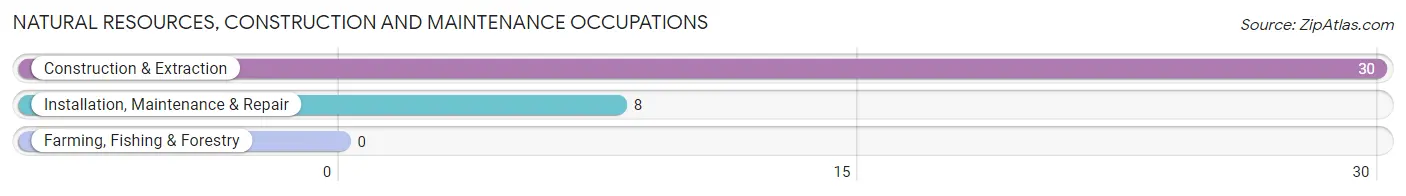
Natural Resources, Construction and Maintenance Occupations
The most common Natural Resources, Construction and Maintenance occupations in Kaaawa are Construction & Extraction (30 | 4.9%), and Installation, Maintenance & Repair (8 | 1.3%).
Natural Resources, Construction and Maintenance Occupations by Sex
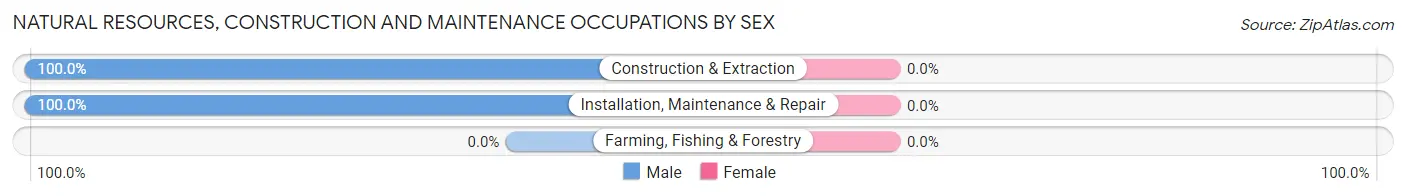
| Occupation | Male | Female |
| Farming, Fishing & Forestry | 0 (0.0%) | 0 (0.0%) |
| Construction & Extraction | 30 (100.0%) | 0 (0.0%) |
| Installation, Maintenance & Repair | 8 (100.0%) | 0 (0.0%) |
| Total (Category) | 38 (100.0%) | 0 (0.0%) |
| Total (Overall) | 246 (40.3%) | 365 (59.7%) |
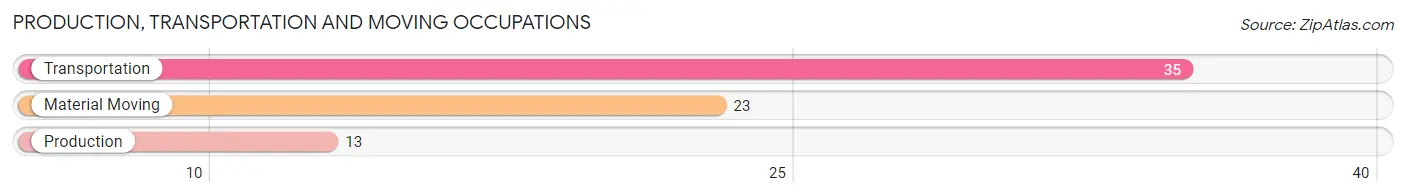
Production, Transportation and Moving Occupations
The most common Production, Transportation and Moving occupations in Kaaawa are Transportation (35 | 5.7%), Material Moving (23 | 3.8%), and Production (13 | 2.1%).
Production, Transportation and Moving Occupations by Sex
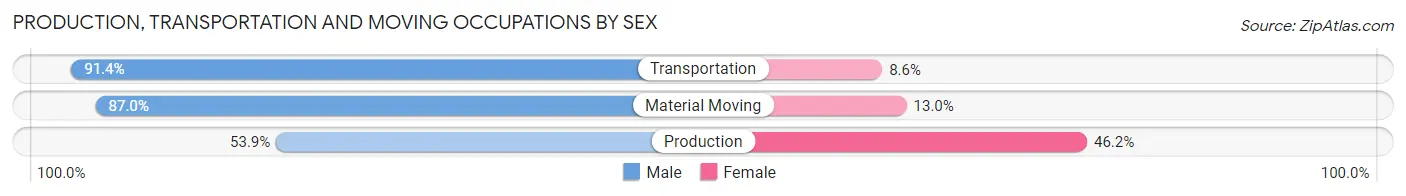
| Occupation | Male | Female |
| Production | 7 (53.8%) | 6 (46.2%) |
| Transportation | 32 (91.4%) | 3 (8.6%) |
| Material Moving | 20 (87.0%) | 3 (13.0%) |
| Total (Category) | 59 (83.1%) | 12 (16.9%) |
| Total (Overall) | 246 (40.3%) | 365 (59.7%) |
Employment Industries by Sex in Kaaawa
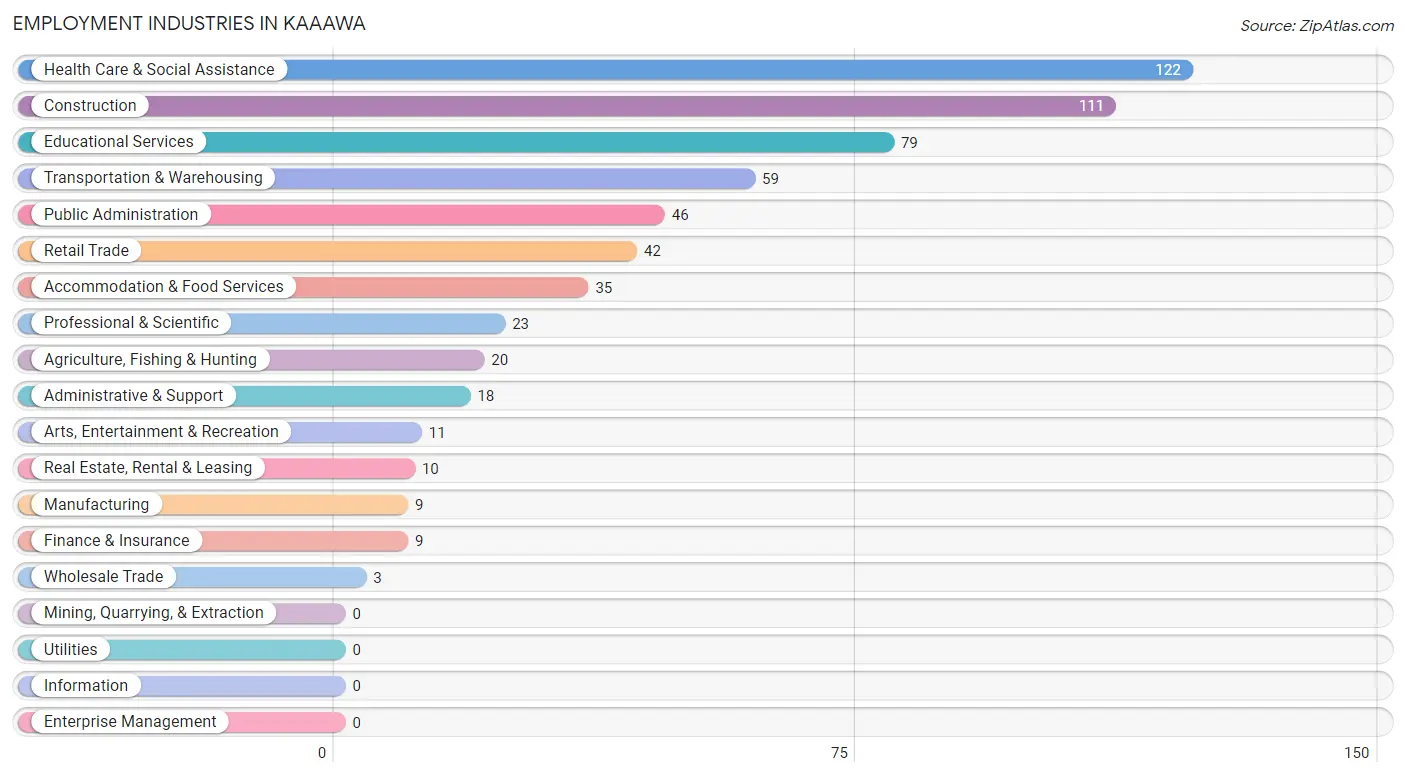
Employment Industries in Kaaawa
The major employment industries in Kaaawa include Health Care & Social Assistance (122 | 20.0%), Construction (111 | 18.2%), Educational Services (79 | 12.9%), Transportation & Warehousing (59 | 9.7%), and Public Administration (46 | 7.5%).
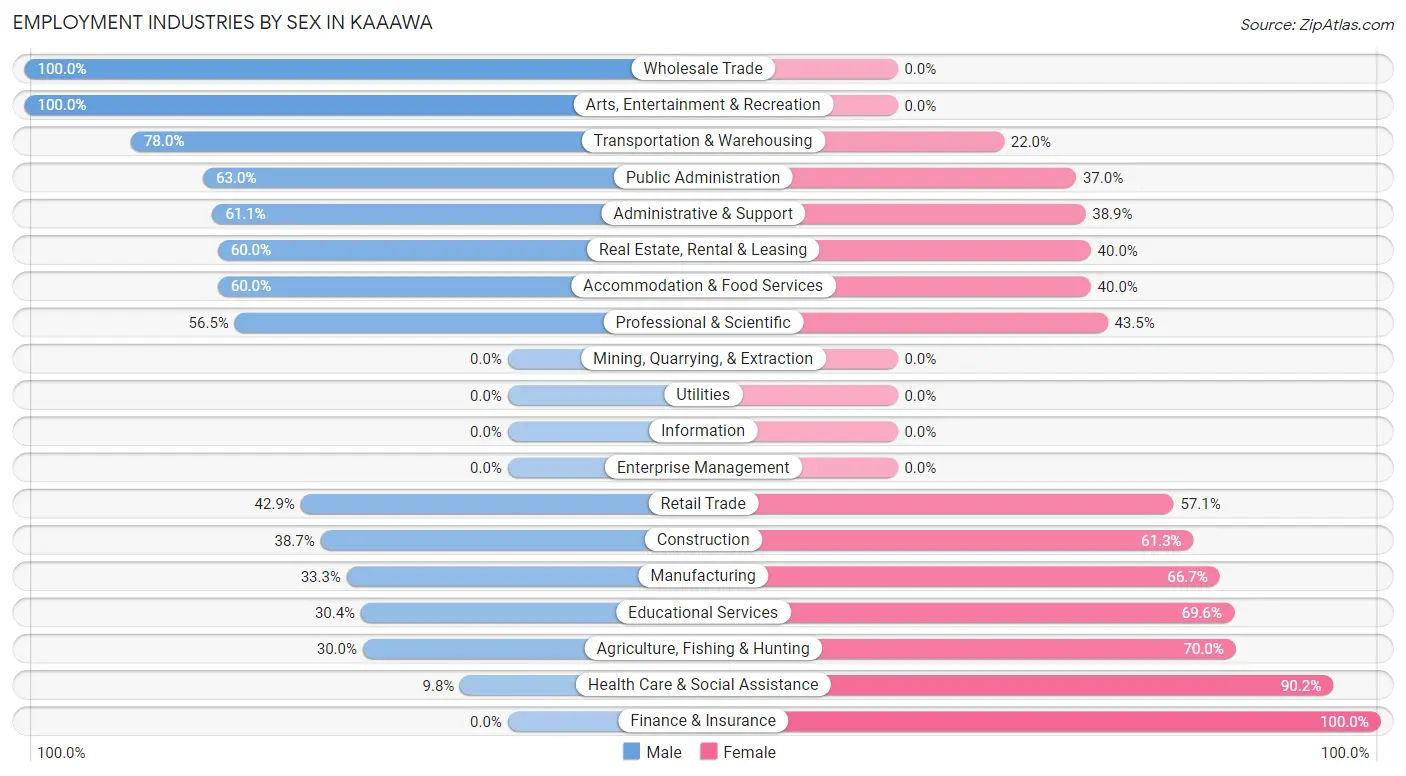
Employment Industries by Sex in Kaaawa
The Kaaawa industries that see more men than women are Wholesale Trade (100.0%), Arts, Entertainment & Recreation (100.0%), and Transportation & Warehousing (78.0%), whereas the industries that tend to have a higher number of women are Finance & Insurance (100.0%), Health Care & Social Assistance (90.2%), and Agriculture, Fishing & Hunting (70.0%).
| Industry | Male | Female |
| Agriculture, Fishing & Hunting | 6 (30.0%) | 14 (70.0%) |
| Mining, Quarrying, & Extraction | 0 (0.0%) | 0 (0.0%) |
| Construction | 43 (38.7%) | 68 (61.3%) |
| Manufacturing | 3 (33.3%) | 6 (66.7%) |
| Wholesale Trade | 3 (100.0%) | 0 (0.0%) |
| Retail Trade | 18 (42.9%) | 24 (57.1%) |
| Transportation & Warehousing | 46 (78.0%) | 13 (22.0%) |
| Utilities | 0 (0.0%) | 0 (0.0%) |
| Information | 0 (0.0%) | 0 (0.0%) |
| Finance & Insurance | 0 (0.0%) | 9 (100.0%) |
| Real Estate, Rental & Leasing | 6 (60.0%) | 4 (40.0%) |
| Professional & Scientific | 13 (56.5%) | 10 (43.5%) |
| Enterprise Management | 0 (0.0%) | 0 (0.0%) |
| Administrative & Support | 11 (61.1%) | 7 (38.9%) |
| Educational Services | 24 (30.4%) | 55 (69.6%) |
| Health Care & Social Assistance | 12 (9.8%) | 110 (90.2%) |
| Arts, Entertainment & Recreation | 11 (100.0%) | 0 (0.0%) |
| Accommodation & Food Services | 21 (60.0%) | 14 (40.0%) |
| Public Administration | 29 (63.0%) | 17 (37.0%) |
| Total | 246 (40.3%) | 365 (59.7%) |
Education in Kaaawa
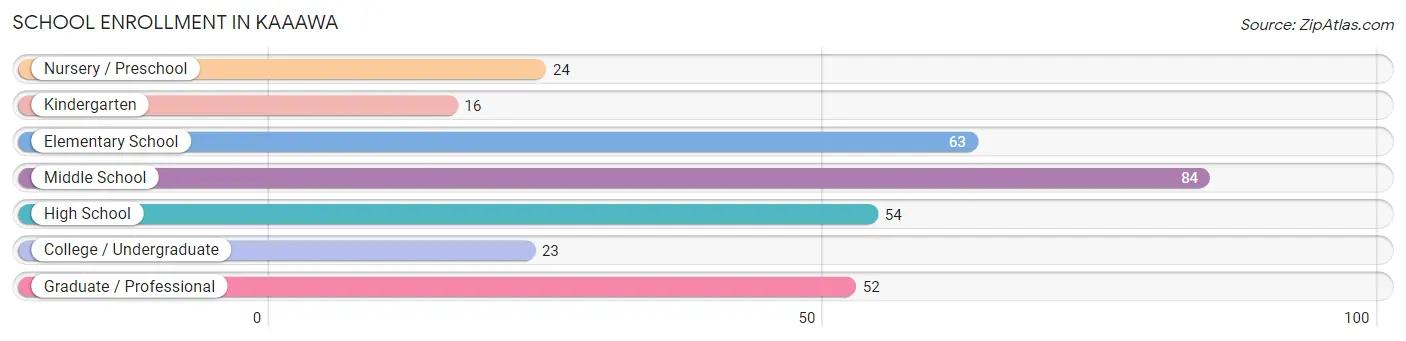
School Enrollment in Kaaawa
The most common levels of schooling among the 316 students in Kaaawa are middle school (84 | 26.6%), elementary school (63 | 19.9%), and high school (54 | 17.1%).
| School Level | # Students | % Students |
| Nursery / Preschool | 24 | 7.6% |
| Kindergarten | 16 | 5.1% |
| Elementary School | 63 | 19.9% |
| Middle School | 84 | 26.6% |
| High School | 54 | 17.1% |
| College / Undergraduate | 23 | 7.3% |
| Graduate / Professional | 52 | 16.5% |
| Total | 316 | 100.0% |
School Enrollment by Age by Funding Source in Kaaawa
Out of a total of 316 students who are enrolled in schools in Kaaawa, 83 (26.3%) attend a private institution, while the remaining 233 (73.7%) are enrolled in public schools. The age group of 3 to 4 year olds has the highest likelihood of being enrolled in private schools, with 24 (100.0% in the age bracket) enrolled. Conversely, the age group of 15 to 17 year olds has the lowest likelihood of being enrolled in a private school, with 42 (100.0% in the age bracket) attending a public institution.
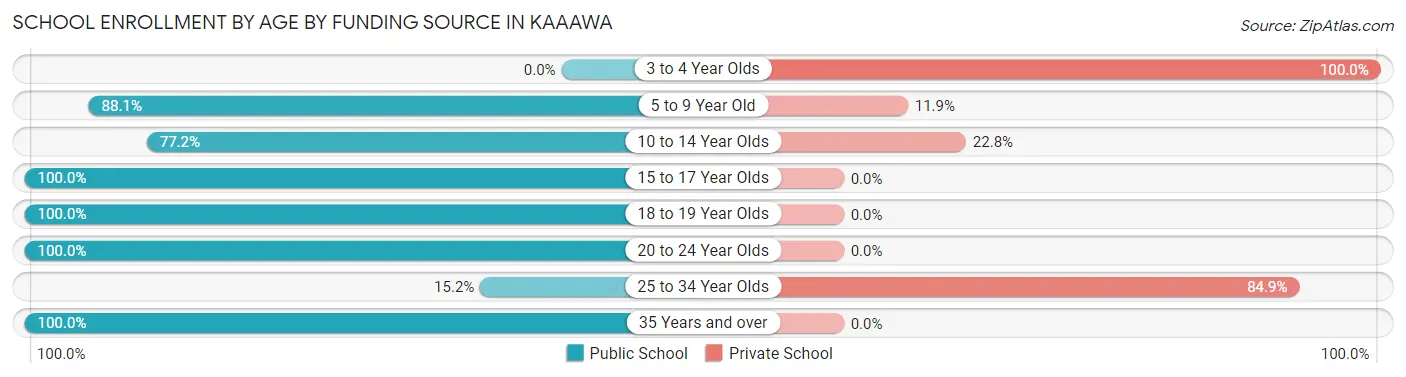
| Age Bracket | Public School | Private School |
| 3 to 4 Year Olds | 0 (0.0%) | 24 (100.0%) |
| 5 to 9 Year Old | 59 (88.1%) | 8 (11.9%) |
| 10 to 14 Year Olds | 78 (77.2%) | 23 (22.8%) |
| 15 to 17 Year Olds | 42 (100.0%) | 0 (0.0%) |
| 18 to 19 Year Olds | 14 (100.0%) | 0 (0.0%) |
| 20 to 24 Year Olds | 8 (100.0%) | 0 (0.0%) |
| 25 to 34 Year Olds | 5 (15.1%) | 28 (84.9%) |
| 35 Years and over | 27 (100.0%) | 0 (0.0%) |
| Total | 233 (73.7%) | 83 (26.3%) |
Educational Attainment by Field of Study in Kaaawa
Physical & health sciences (130 | 26.5%), psychology (57 | 11.6%), education (54 | 11.0%), arts & humanities (40 | 8.2%), and literature & languages (32 | 6.5%) are the most common fields of study among 491 individuals in Kaaawa who have obtained a bachelor's degree or higher.
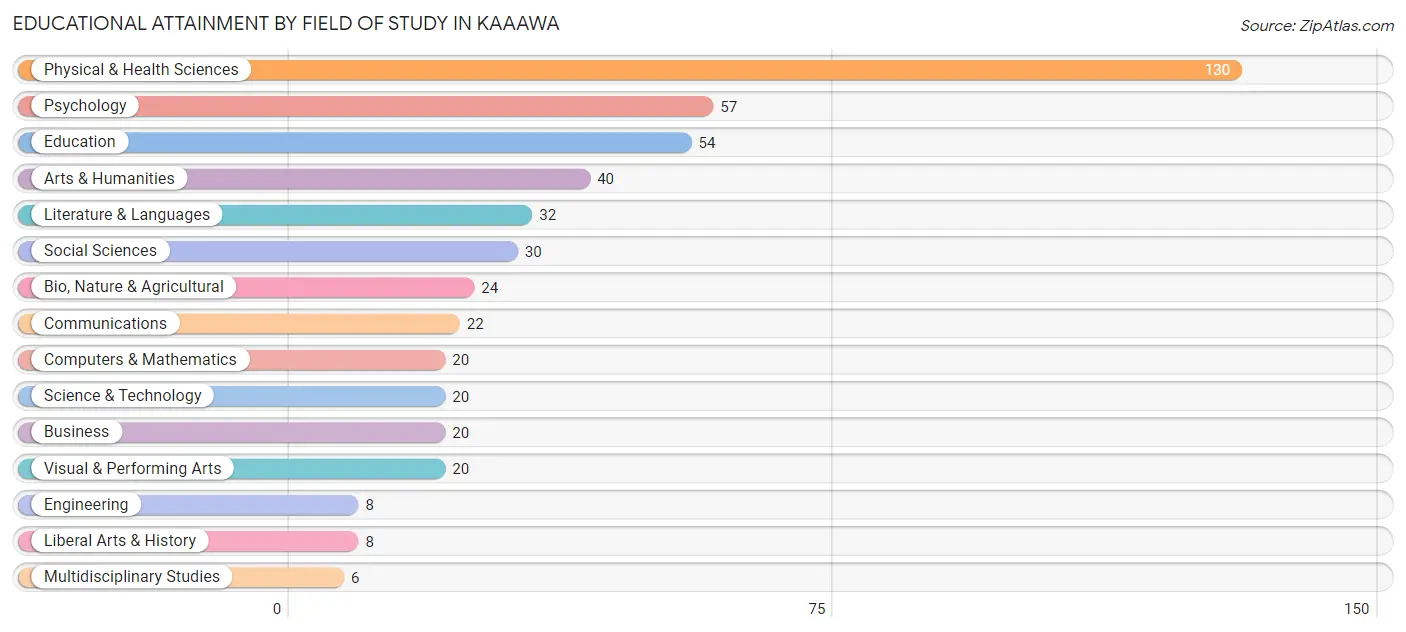
| Field of Study | # Graduates | % Graduates |
| Computers & Mathematics | 20 | 4.1% |
| Bio, Nature & Agricultural | 24 | 4.9% |
| Physical & Health Sciences | 130 | 26.5% |
| Psychology | 57 | 11.6% |
| Social Sciences | 30 | 6.1% |
| Engineering | 8 | 1.6% |
| Multidisciplinary Studies | 6 | 1.2% |
| Science & Technology | 20 | 4.1% |
| Business | 20 | 4.1% |
| Education | 54 | 11.0% |
| Literature & Languages | 32 | 6.5% |
| Liberal Arts & History | 8 | 1.6% |
| Visual & Performing Arts | 20 | 4.1% |
| Communications | 22 | 4.5% |
| Arts & Humanities | 40 | 8.2% |
| Total | 491 | 100.0% |
Transportation & Commute in Kaaawa
Vehicle Availability by Sex in Kaaawa
The most prevalent vehicle ownership categories in Kaaawa are males with 2 vehicles (275, accounting for 74.7%) and females with 2 vehicles (221, making up 78.3%).
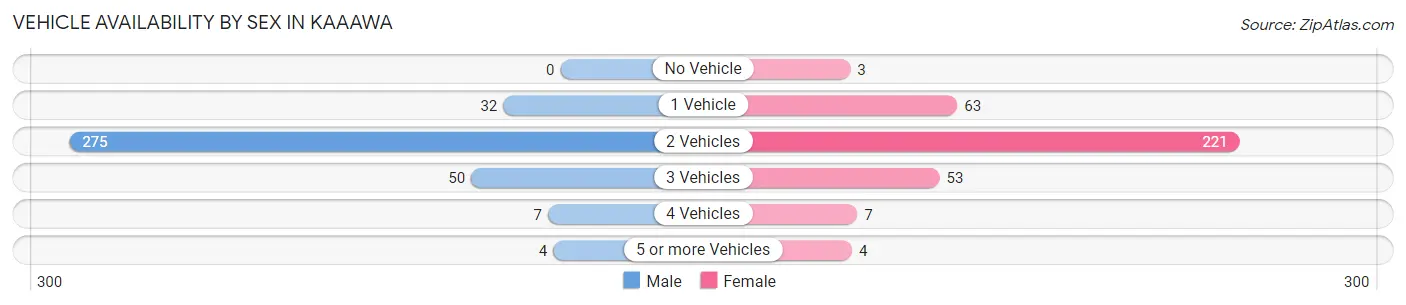
| Vehicles Available | Male | Female |
| No Vehicle | 0 (0.0%) | 3 (0.9%) |
| 1 Vehicle | 32 (8.7%) | 63 (17.9%) |
| 2 Vehicles | 275 (74.7%) | 221 (63.0%) |
| 3 Vehicles | 50 (13.6%) | 53 (15.1%) |
| 4 Vehicles | 7 (1.9%) | 7 (2.0%) |
| 5 or more Vehicles | 4 (1.1%) | 4 (1.1%) |
| Total | 368 (100.0%) | 351 (100.0%) |
Commute Time in Kaaawa
The most frequently occuring commute durations in Kaaawa are 45 to 59 minutes (221 commuters, 31.7%), 35 to 39 minutes (168 commuters, 24.1%), and 30 to 34 minutes (102 commuters, 14.6%).
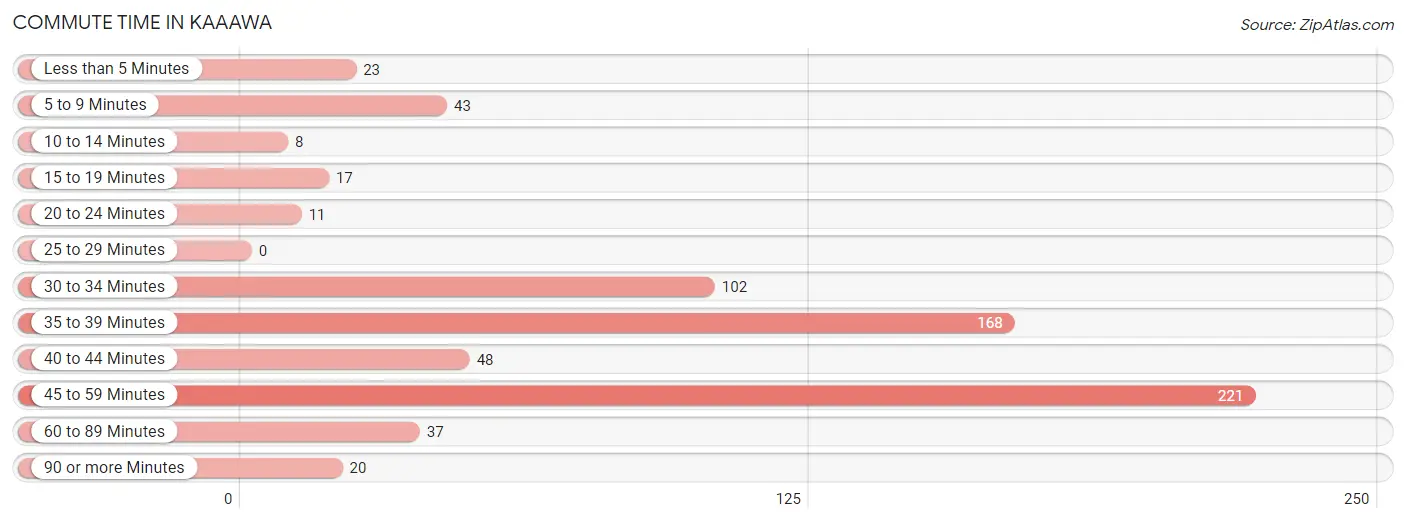
| Commute Time | # Commuters | % Commuters |
| Less than 5 Minutes | 23 | 3.3% |
| 5 to 9 Minutes | 43 | 6.2% |
| 10 to 14 Minutes | 8 | 1.1% |
| 15 to 19 Minutes | 17 | 2.4% |
| 20 to 24 Minutes | 11 | 1.6% |
| 25 to 29 Minutes | 0 | 0.0% |
| 30 to 34 Minutes | 102 | 14.6% |
| 35 to 39 Minutes | 168 | 24.1% |
| 40 to 44 Minutes | 48 | 6.9% |
| 45 to 59 Minutes | 221 | 31.7% |
| 60 to 89 Minutes | 37 | 5.3% |
| 90 or more Minutes | 20 | 2.9% |
Commute Time by Sex in Kaaawa
The most common commute times in Kaaawa are 35 to 39 minutes (161 commuters, 43.8%) for males and 45 to 59 minutes (164 commuters, 49.7%) for females.
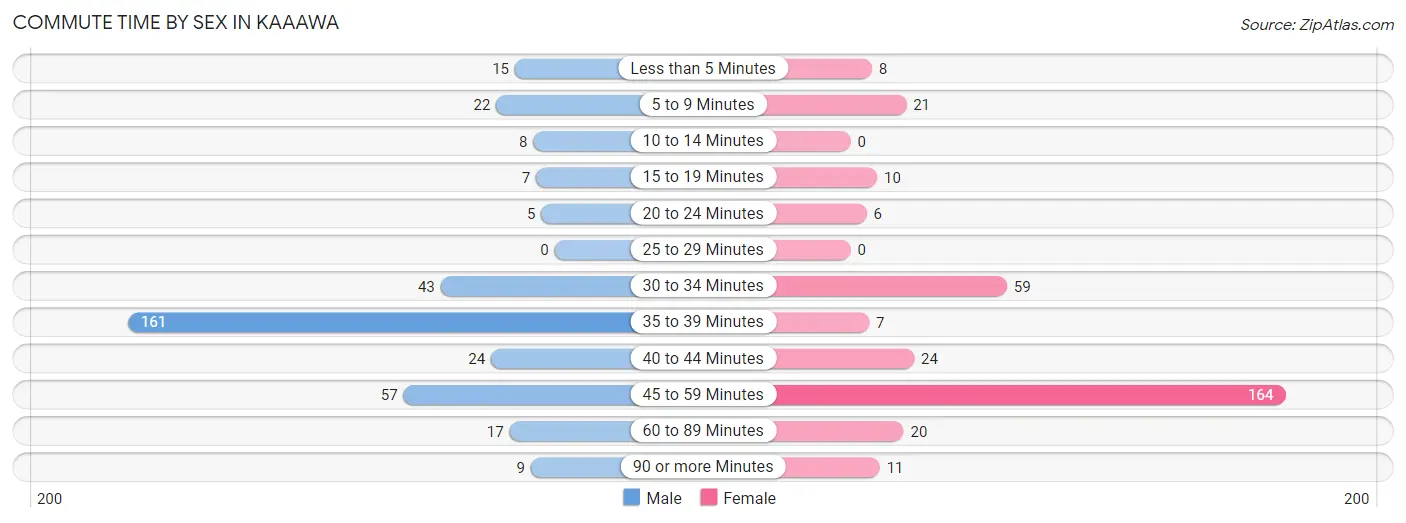
| Commute Time | Male | Female |
| Less than 5 Minutes | 15 (4.1%) | 8 (2.4%) |
| 5 to 9 Minutes | 22 (6.0%) | 21 (6.4%) |
| 10 to 14 Minutes | 8 (2.2%) | 0 (0.0%) |
| 15 to 19 Minutes | 7 (1.9%) | 10 (3.0%) |
| 20 to 24 Minutes | 5 (1.4%) | 6 (1.8%) |
| 25 to 29 Minutes | 0 (0.0%) | 0 (0.0%) |
| 30 to 34 Minutes | 43 (11.7%) | 59 (17.9%) |
| 35 to 39 Minutes | 161 (43.8%) | 7 (2.1%) |
| 40 to 44 Minutes | 24 (6.5%) | 24 (7.3%) |
| 45 to 59 Minutes | 57 (15.5%) | 164 (49.7%) |
| 60 to 89 Minutes | 17 (4.6%) | 20 (6.1%) |
| 90 or more Minutes | 9 (2.5%) | 11 (3.3%) |
Time of Departure to Work by Sex in Kaaawa
The most frequent times of departure to work in Kaaawa are 5:30 AM to 5:59 AM (166, 45.1%) for males and 8:30 AM to 8:59 AM (68, 20.6%) for females.
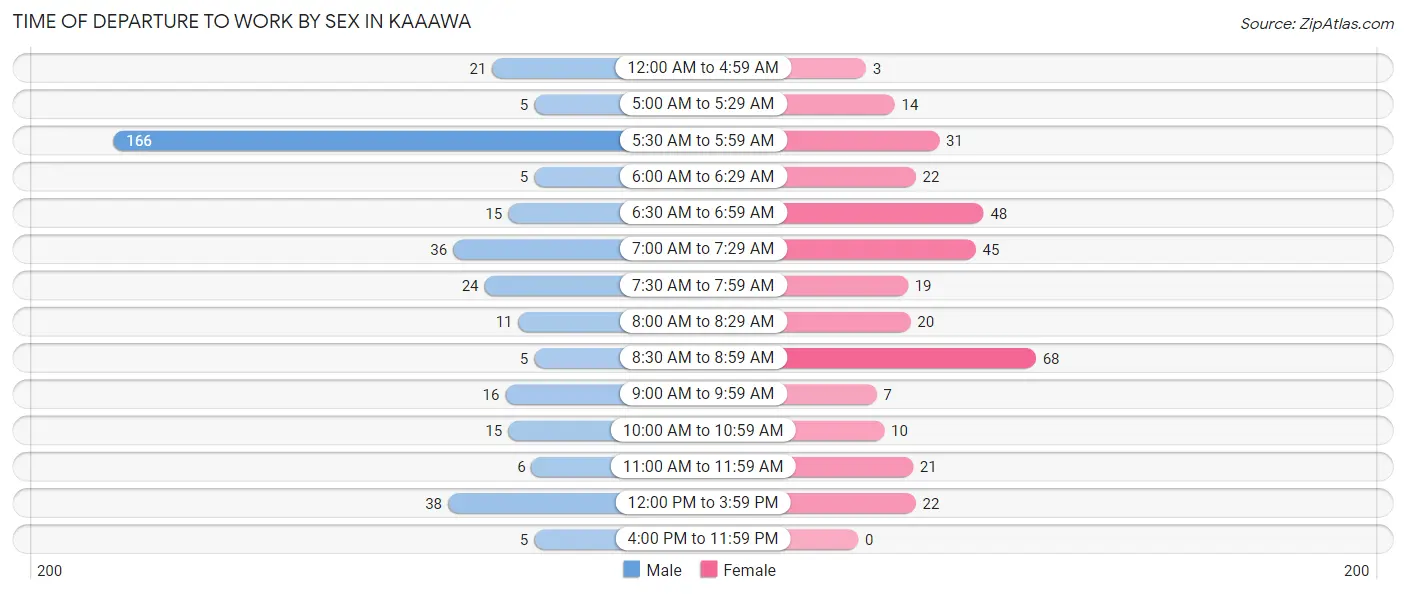
| Time of Departure | Male | Female |
| 12:00 AM to 4:59 AM | 21 (5.7%) | 3 (0.9%) |
| 5:00 AM to 5:29 AM | 5 (1.4%) | 14 (4.2%) |
| 5:30 AM to 5:59 AM | 166 (45.1%) | 31 (9.4%) |
| 6:00 AM to 6:29 AM | 5 (1.4%) | 22 (6.7%) |
| 6:30 AM to 6:59 AM | 15 (4.1%) | 48 (14.5%) |
| 7:00 AM to 7:29 AM | 36 (9.8%) | 45 (13.6%) |
| 7:30 AM to 7:59 AM | 24 (6.5%) | 19 (5.8%) |
| 8:00 AM to 8:29 AM | 11 (3.0%) | 20 (6.1%) |
| 8:30 AM to 8:59 AM | 5 (1.4%) | 68 (20.6%) |
| 9:00 AM to 9:59 AM | 16 (4.3%) | 7 (2.1%) |
| 10:00 AM to 10:59 AM | 15 (4.1%) | 10 (3.0%) |
| 11:00 AM to 11:59 AM | 6 (1.6%) | 21 (6.4%) |
| 12:00 PM to 3:59 PM | 38 (10.3%) | 22 (6.7%) |
| 4:00 PM to 11:59 PM | 5 (1.4%) | 0 (0.0%) |
| Total | 368 (100.0%) | 330 (100.0%) |
Housing Occupancy in Kaaawa
Occupancy by Ownership in Kaaawa
Of the total 476 dwellings in Kaaawa, owner-occupied units account for 324 (68.1%), while renter-occupied units make up 152 (31.9%).
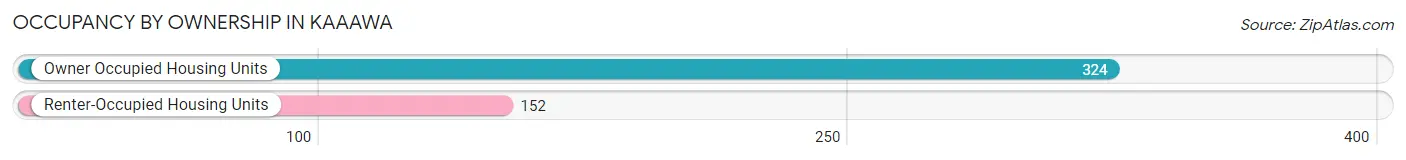
| Occupancy | # Housing Units | % Housing Units |
| Owner Occupied Housing Units | 324 | 68.1% |
| Renter-Occupied Housing Units | 152 | 31.9% |
| Total Occupied Housing Units | 476 | 100.0% |
Occupancy by Household Size in Kaaawa
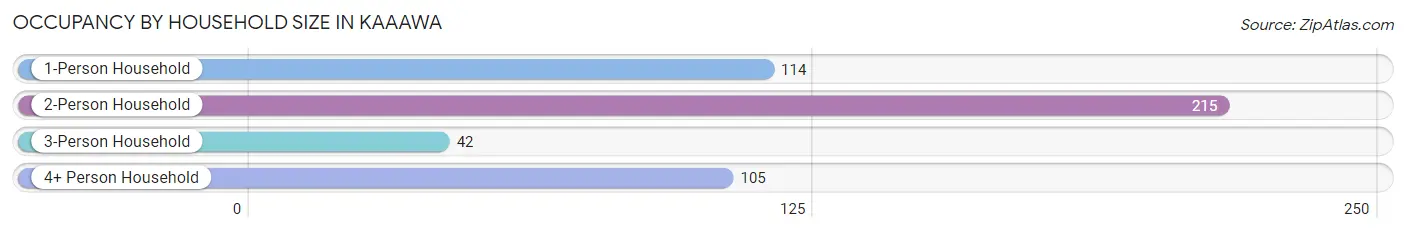
| Household Size | # Housing Units | % Housing Units |
| 1-Person Household | 114 | 23.9% |
| 2-Person Household | 215 | 45.2% |
| 3-Person Household | 42 | 8.8% |
| 4+ Person Household | 105 | 22.1% |
| Total Housing Units | 476 | 100.0% |
Occupancy by Ownership by Household Size in Kaaawa
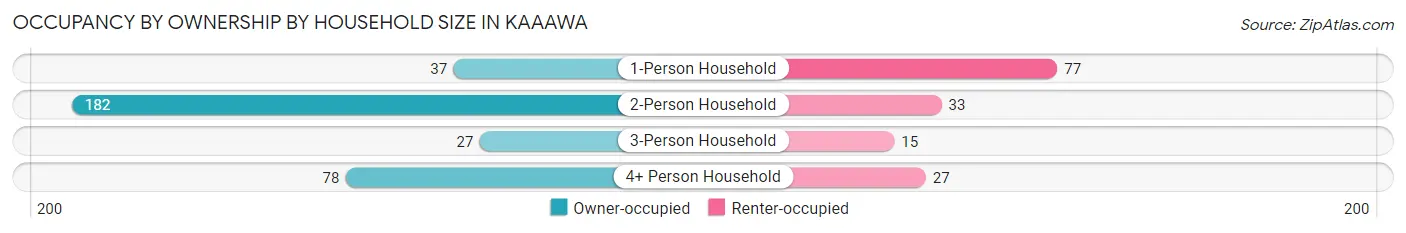
| Household Size | Owner-occupied | Renter-occupied |
| 1-Person Household | 37 (32.5%) | 77 (67.5%) |
| 2-Person Household | 182 (84.7%) | 33 (15.3%) |
| 3-Person Household | 27 (64.3%) | 15 (35.7%) |
| 4+ Person Household | 78 (74.3%) | 27 (25.7%) |
| Total Housing Units | 324 (68.1%) | 152 (31.9%) |
Occupancy by Educational Attainment in Kaaawa
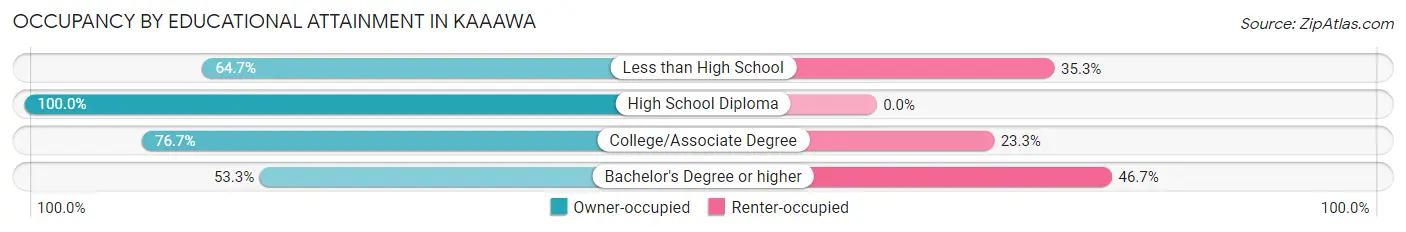
| Household Size | Owner-occupied | Renter-occupied |
| Less than High School | 11 (64.7%) | 6 (35.3%) |
| High School Diploma | 43 (100.0%) | 0 (0.0%) |
| College/Associate Degree | 158 (76.7%) | 48 (23.3%) |
| Bachelor's Degree or higher | 112 (53.3%) | 98 (46.7%) |
Occupancy by Age of Householder in Kaaawa
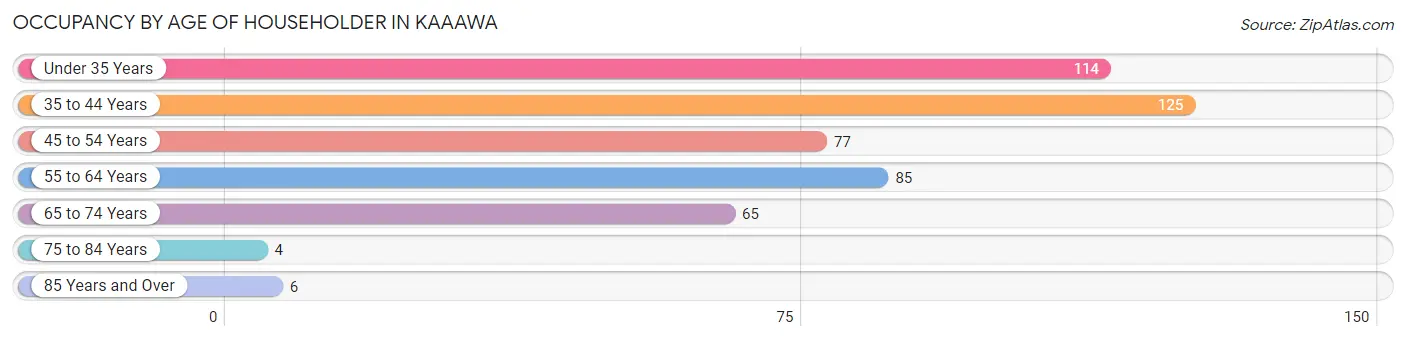
| Age Bracket | # Households | % Households |
| Under 35 Years | 114 | 23.9% |
| 35 to 44 Years | 125 | 26.3% |
| 45 to 54 Years | 77 | 16.2% |
| 55 to 64 Years | 85 | 17.9% |
| 65 to 74 Years | 65 | 13.7% |
| 75 to 84 Years | 4 | 0.8% |
| 85 Years and Over | 6 | 1.3% |
| Total | 476 | 100.0% |
Housing Finances in Kaaawa
Median Income by Occupancy in Kaaawa
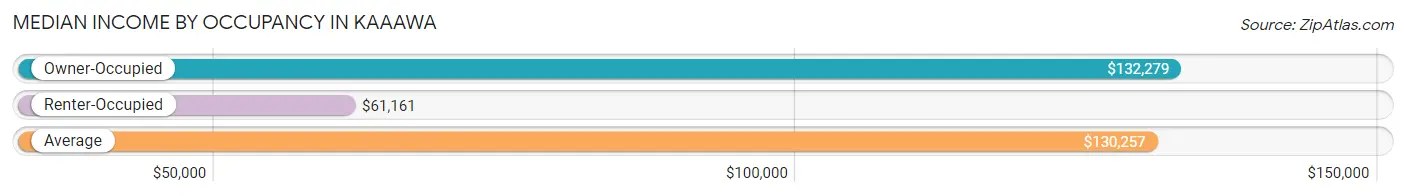
| Occupancy Type | # Households | Median Income |
| Owner-Occupied | 324 (68.1%) | $132,279 |
| Renter-Occupied | 152 (31.9%) | $61,161 |
| Average | 476 (100.0%) | $130,257 |
Occupancy by Householder Income Bracket in Kaaawa
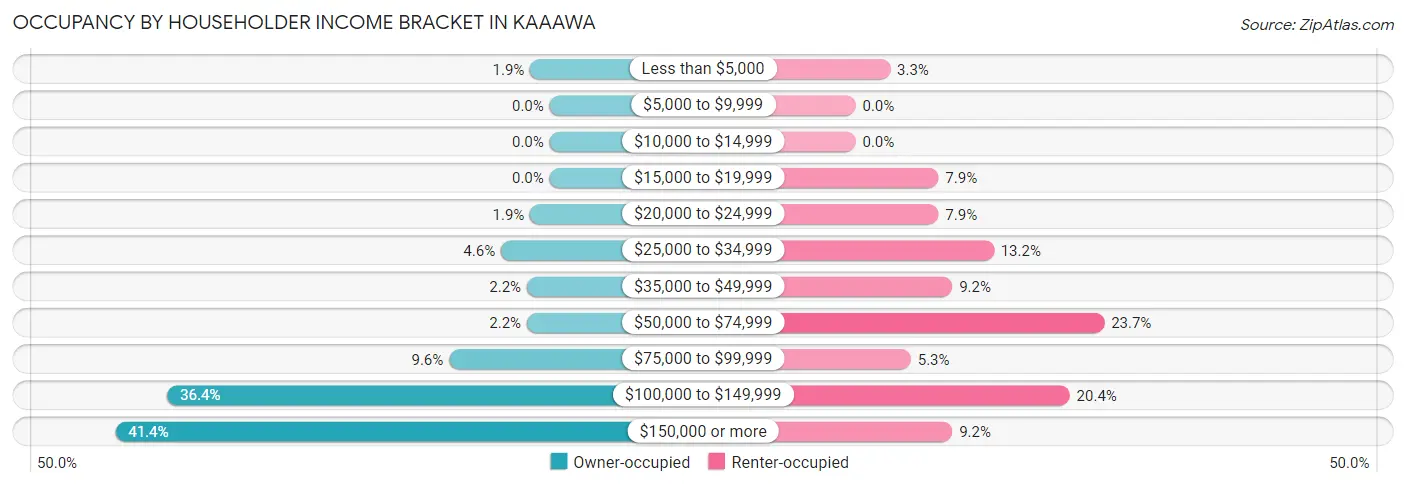
| Income Bracket | Owner-occupied | Renter-occupied |
| Less than $5,000 | 6 (1.8%) | 5 (3.3%) |
| $5,000 to $9,999 | 0 (0.0%) | 0 (0.0%) |
| $10,000 to $14,999 | 0 (0.0%) | 0 (0.0%) |
| $15,000 to $19,999 | 0 (0.0%) | 12 (7.9%) |
| $20,000 to $24,999 | 6 (1.8%) | 12 (7.9%) |
| $25,000 to $34,999 | 15 (4.6%) | 20 (13.2%) |
| $35,000 to $49,999 | 7 (2.2%) | 14 (9.2%) |
| $50,000 to $74,999 | 7 (2.2%) | 36 (23.7%) |
| $75,000 to $99,999 | 31 (9.6%) | 8 (5.3%) |
| $100,000 to $149,999 | 118 (36.4%) | 31 (20.4%) |
| $150,000 or more | 134 (41.4%) | 14 (9.2%) |
| Total | 324 (100.0%) | 152 (100.0%) |
Monthly Housing Cost Tiers in Kaaawa
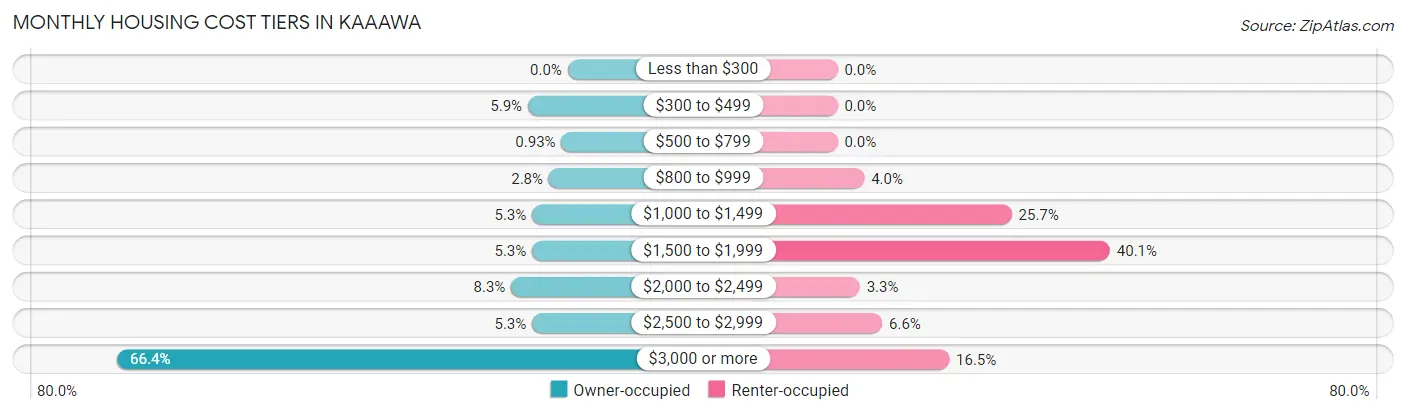
| Monthly Cost | Owner-occupied | Renter-occupied |
| Less than $300 | 0 (0.0%) | 0 (0.0%) |
| $300 to $499 | 19 (5.9%) | 0 (0.0%) |
| $500 to $799 | 3 (0.9%) | 0 (0.0%) |
| $800 to $999 | 9 (2.8%) | 6 (4.0%) |
| $1,000 to $1,499 | 17 (5.2%) | 39 (25.7%) |
| $1,500 to $1,999 | 17 (5.2%) | 61 (40.1%) |
| $2,000 to $2,499 | 27 (8.3%) | 5 (3.3%) |
| $2,500 to $2,999 | 17 (5.2%) | 10 (6.6%) |
| $3,000 or more | 215 (66.4%) | 25 (16.5%) |
| Total | 324 (100.0%) | 152 (100.0%) |
Physical Housing Characteristics in Kaaawa
Housing Structures in Kaaawa
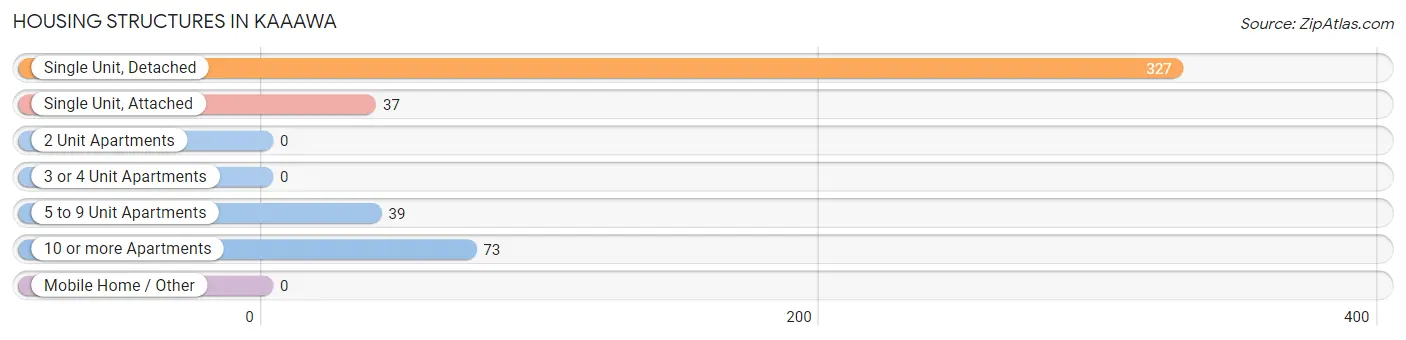
| Structure Type | # Housing Units | % Housing Units |
| Single Unit, Detached | 327 | 68.7% |
| Single Unit, Attached | 37 | 7.8% |
| 2 Unit Apartments | 0 | 0.0% |
| 3 or 4 Unit Apartments | 0 | 0.0% |
| 5 to 9 Unit Apartments | 39 | 8.2% |
| 10 or more Apartments | 73 | 15.3% |
| Mobile Home / Other | 0 | 0.0% |
| Total | 476 | 100.0% |
Housing Structures by Occupancy in Kaaawa
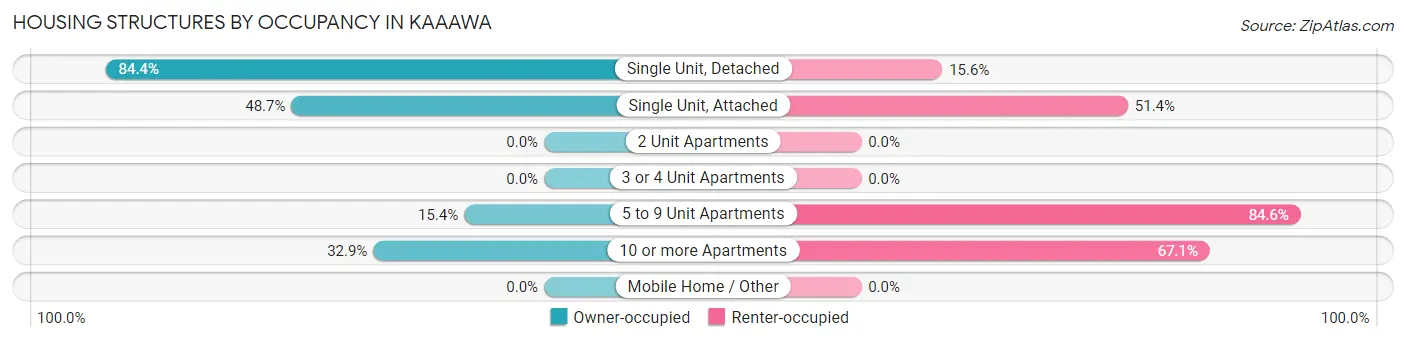
| Structure Type | Owner-occupied | Renter-occupied |
| Single Unit, Detached | 276 (84.4%) | 51 (15.6%) |
| Single Unit, Attached | 18 (48.6%) | 19 (51.3%) |
| 2 Unit Apartments | 0 (0.0%) | 0 (0.0%) |
| 3 or 4 Unit Apartments | 0 (0.0%) | 0 (0.0%) |
| 5 to 9 Unit Apartments | 6 (15.4%) | 33 (84.6%) |
| 10 or more Apartments | 24 (32.9%) | 49 (67.1%) |
| Mobile Home / Other | 0 (0.0%) | 0 (0.0%) |
| Total | 324 (68.1%) | 152 (31.9%) |
Housing Structures by Number of Rooms in Kaaawa
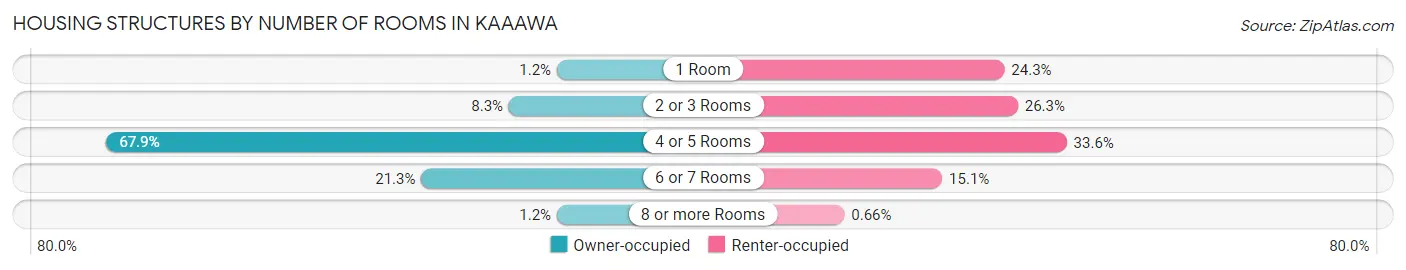
| Number of Rooms | Owner-occupied | Renter-occupied |
| 1 Room | 4 (1.2%) | 37 (24.3%) |
| 2 or 3 Rooms | 27 (8.3%) | 40 (26.3%) |
| 4 or 5 Rooms | 220 (67.9%) | 51 (33.6%) |
| 6 or 7 Rooms | 69 (21.3%) | 23 (15.1%) |
| 8 or more Rooms | 4 (1.2%) | 1 (0.7%) |
| Total | 324 (100.0%) | 152 (100.0%) |
Housing Structure by Heating Type in Kaaawa
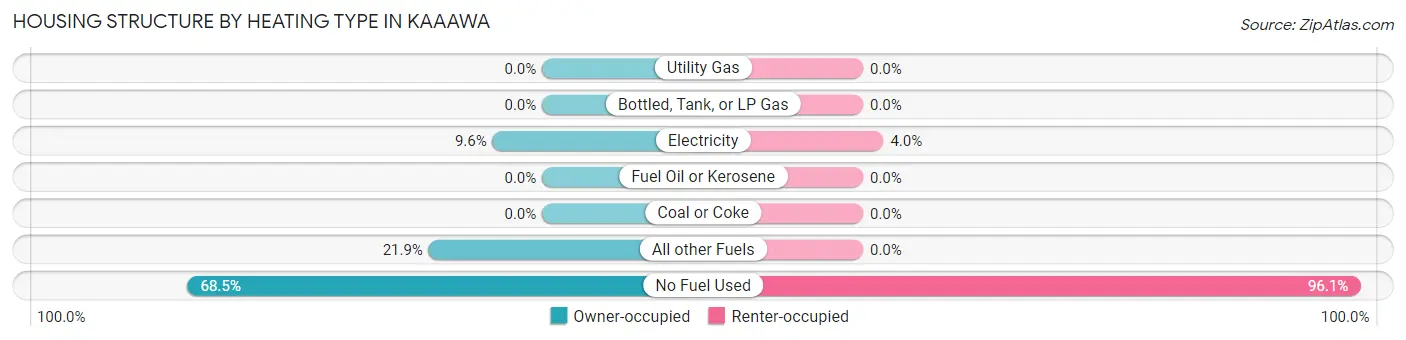
| Heating Type | Owner-occupied | Renter-occupied |
| Utility Gas | 0 (0.0%) | 0 (0.0%) |
| Bottled, Tank, or LP Gas | 0 (0.0%) | 0 (0.0%) |
| Electricity | 31 (9.6%) | 6 (4.0%) |
| Fuel Oil or Kerosene | 0 (0.0%) | 0 (0.0%) |
| Coal or Coke | 0 (0.0%) | 0 (0.0%) |
| All other Fuels | 71 (21.9%) | 0 (0.0%) |
| No Fuel Used | 222 (68.5%) | 146 (96.1%) |
| Total | 324 (100.0%) | 152 (100.0%) |
Household Vehicle Usage in Kaaawa
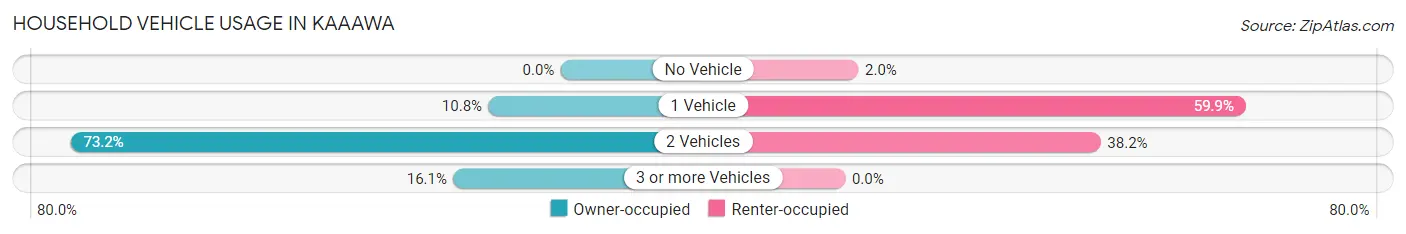
| Vehicles per Household | Owner-occupied | Renter-occupied |
| No Vehicle | 0 (0.0%) | 3 (2.0%) |
| 1 Vehicle | 35 (10.8%) | 91 (59.9%) |
| 2 Vehicles | 237 (73.2%) | 58 (38.2%) |
| 3 or more Vehicles | 52 (16.1%) | 0 (0.0%) |
| Total | 324 (100.0%) | 152 (100.0%) |
Real Estate & Mortgages in Kaaawa
Real Estate and Mortgage Overview in Kaaawa
| Characteristic | Without Mortgage | With Mortgage |
| Housing Units | 38 | 286 |
| Median Property Value | $750,000 | $880,200 |
| Median Household Income | $106,667 | $118 |
| Monthly Housing Costs | $550 | $215 |
| Real Estate Taxes | $2,591 | $3 |
Property Value by Mortgage Status in Kaaawa
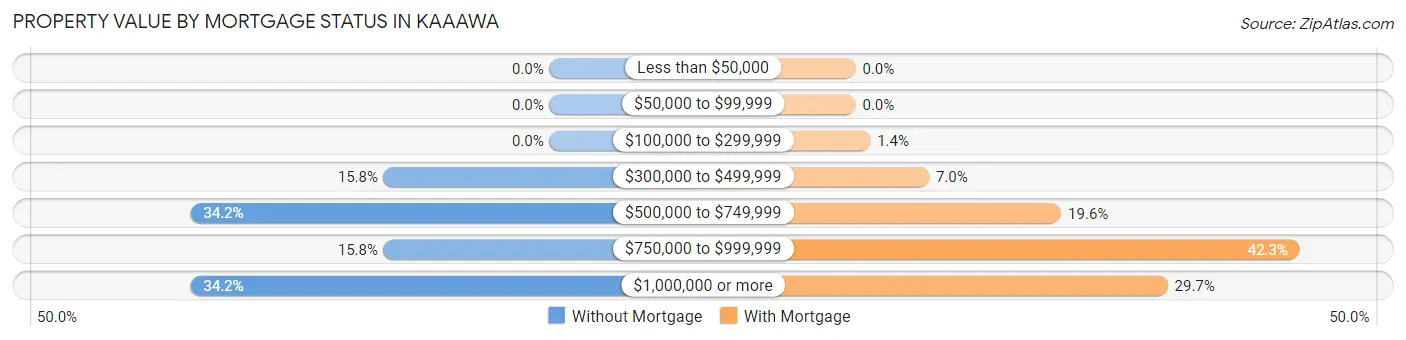
| Property Value | Without Mortgage | With Mortgage |
| Less than $50,000 | 0 (0.0%) | 0 (0.0%) |
| $50,000 to $99,999 | 0 (0.0%) | 0 (0.0%) |
| $100,000 to $299,999 | 0 (0.0%) | 4 (1.4%) |
| $300,000 to $499,999 | 6 (15.8%) | 20 (7.0%) |
| $500,000 to $749,999 | 13 (34.2%) | 56 (19.6%) |
| $750,000 to $999,999 | 6 (15.8%) | 121 (42.3%) |
| $1,000,000 or more | 13 (34.2%) | 85 (29.7%) |
| Total | 38 (100.0%) | 286 (100.0%) |
Household Income by Mortgage Status in Kaaawa
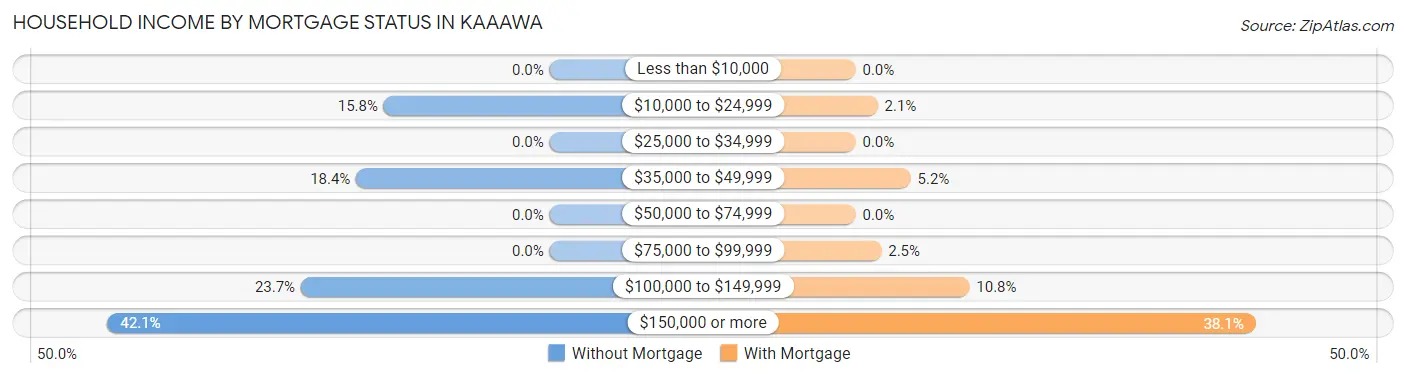
| Household Income | Without Mortgage | With Mortgage |
| Less than $10,000 | 0 (0.0%) | 0 (0.0%) |
| $10,000 to $24,999 | 6 (15.8%) | 6 (2.1%) |
| $25,000 to $34,999 | 0 (0.0%) | 0 (0.0%) |
| $35,000 to $49,999 | 7 (18.4%) | 15 (5.2%) |
| $50,000 to $74,999 | 0 (0.0%) | 0 (0.0%) |
| $75,000 to $99,999 | 0 (0.0%) | 7 (2.5%) |
| $100,000 to $149,999 | 9 (23.7%) | 31 (10.8%) |
| $150,000 or more | 16 (42.1%) | 109 (38.1%) |
| Total | 38 (100.0%) | 286 (100.0%) |
Property Value to Household Income Ratio in Kaaawa
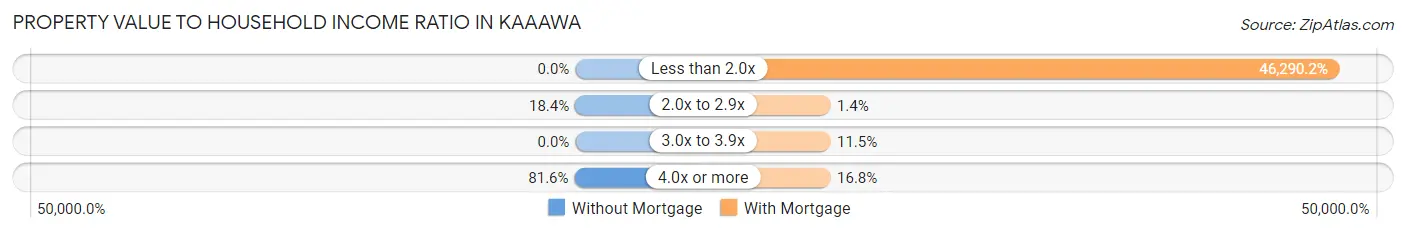
| Value-to-Income Ratio | Without Mortgage | With Mortgage |
| Less than 2.0x | 0 (0.0%) | 132,390 (46,290.2%) |
| 2.0x to 2.9x | 7 (18.4%) | 4 (1.4%) |
| 3.0x to 3.9x | 0 (0.0%) | 33 (11.5%) |
| 4.0x or more | 31 (81.6%) | 48 (16.8%) |
| Total | 38 (100.0%) | 286 (100.0%) |
Real Estate Taxes by Mortgage Status in Kaaawa
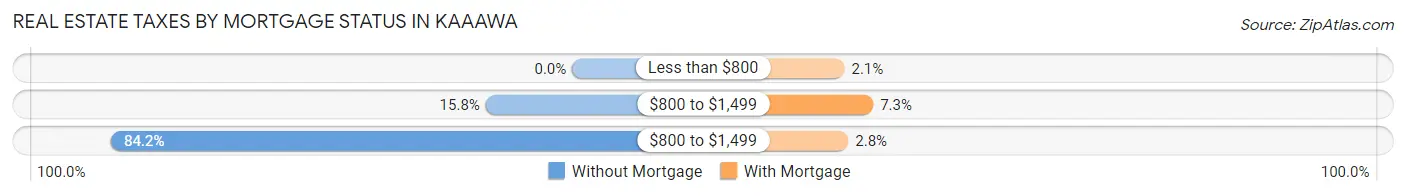
| Property Taxes | Without Mortgage | With Mortgage |
| Less than $800 | 0 (0.0%) | 6 (2.1%) |
| $800 to $1,499 | 6 (15.8%) | 21 (7.3%) |
| $800 to $1,499 | 32 (84.2%) | 8 (2.8%) |
| Total | 38 (100.0%) | 286 (100.0%) |
Health & Disability in Kaaawa
Health Insurance Coverage by Age in Kaaawa
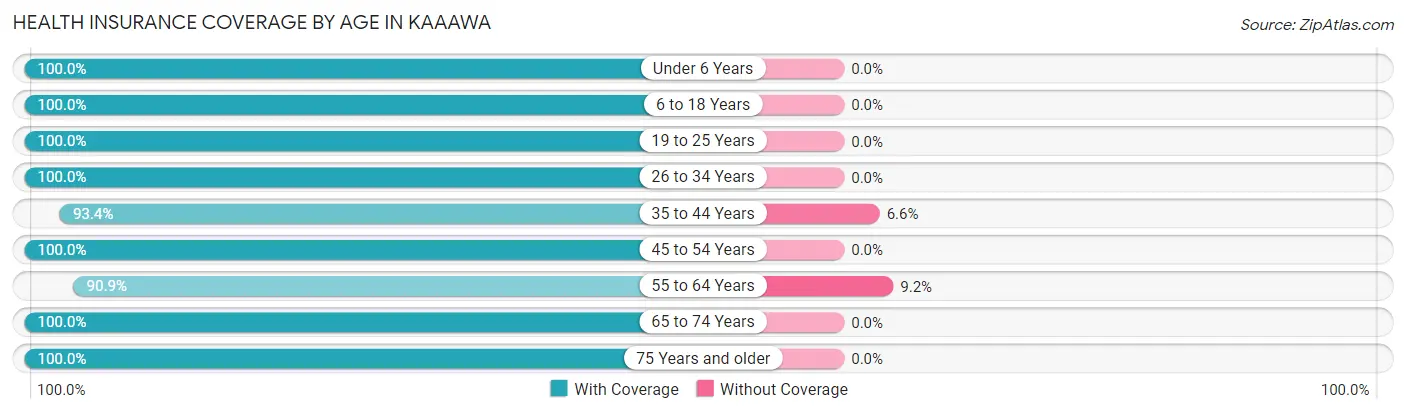
| Age Bracket | With Coverage | Without Coverage |
| Under 6 Years | 64 (100.0%) | 0 (0.0%) |
| 6 to 18 Years | 239 (100.0%) | 0 (0.0%) |
| 19 to 25 Years | 30 (100.0%) | 0 (0.0%) |
| 26 to 34 Years | 152 (100.0%) | 0 (0.0%) |
| 35 to 44 Years | 198 (93.4%) | 14 (6.6%) |
| 45 to 54 Years | 138 (100.0%) | 0 (0.0%) |
| 55 to 64 Years | 129 (90.8%) | 13 (9.1%) |
| 65 to 74 Years | 117 (100.0%) | 0 (0.0%) |
| 75 Years and older | 27 (100.0%) | 0 (0.0%) |
| Total | 1,094 (97.6%) | 27 (2.4%) |
Health Insurance Coverage by Citizenship Status in Kaaawa
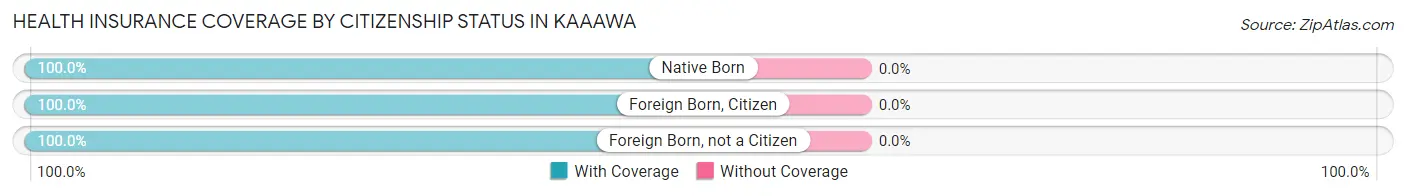
| Citizenship Status | With Coverage | Without Coverage |
| Native Born | 64 (100.0%) | 0 (0.0%) |
| Foreign Born, Citizen | 239 (100.0%) | 0 (0.0%) |
| Foreign Born, not a Citizen | 30 (100.0%) | 0 (0.0%) |
Health Insurance Coverage by Household Income in Kaaawa
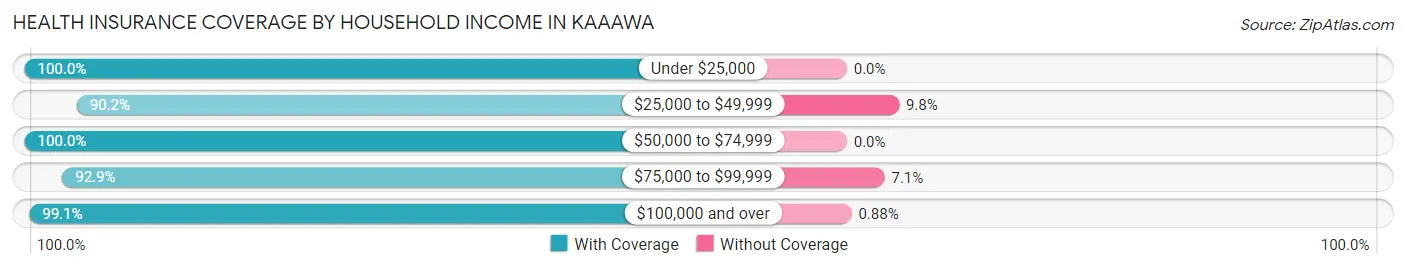
| Household Income | With Coverage | Without Coverage |
| Under $25,000 | 48 (100.0%) | 0 (0.0%) |
| $25,000 to $49,999 | 120 (90.2%) | 13 (9.8%) |
| $50,000 to $74,999 | 43 (100.0%) | 0 (0.0%) |
| $75,000 to $99,999 | 92 (92.9%) | 7 (7.1%) |
| $100,000 and over | 791 (99.1%) | 7 (0.9%) |
Public vs Private Health Insurance Coverage by Age in Kaaawa
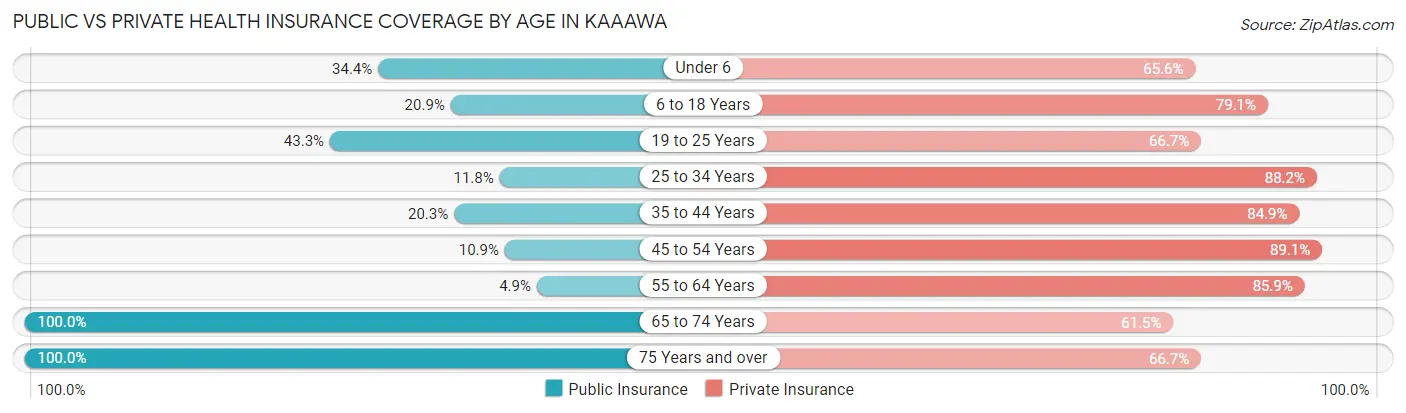
| Age Bracket | Public Insurance | Private Insurance |
| Under 6 | 22 (34.4%) | 42 (65.6%) |
| 6 to 18 Years | 50 (20.9%) | 189 (79.1%) |
| 19 to 25 Years | 13 (43.3%) | 20 (66.7%) |
| 25 to 34 Years | 18 (11.8%) | 134 (88.2%) |
| 35 to 44 Years | 43 (20.3%) | 180 (84.9%) |
| 45 to 54 Years | 15 (10.9%) | 123 (89.1%) |
| 55 to 64 Years | 7 (4.9%) | 122 (85.9%) |
| 65 to 74 Years | 117 (100.0%) | 72 (61.5%) |
| 75 Years and over | 27 (100.0%) | 18 (66.7%) |
| Total | 312 (27.8%) | 900 (80.3%) |
Disability Status by Sex by Age in Kaaawa
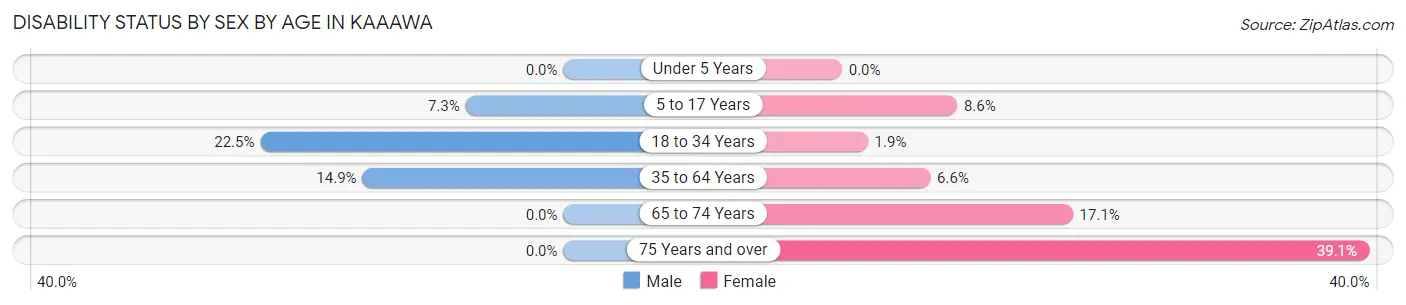
| Age Bracket | Male | Female |
| Under 5 Years | 0 (0.0%) | 0 (0.0%) |
| 5 to 17 Years | 9 (7.3%) | 10 (8.6%) |
| 18 to 34 Years | 9 (22.5%) | 3 (1.9%) |
| 35 to 64 Years | 37 (14.9%) | 16 (6.6%) |
| 65 to 74 Years | 0 (0.0%) | 12 (17.1%) |
| 75 Years and over | 0 (0.0%) | 9 (39.1%) |
Disability Class by Sex by Age in Kaaawa
Disability Class: Hearing Difficulty
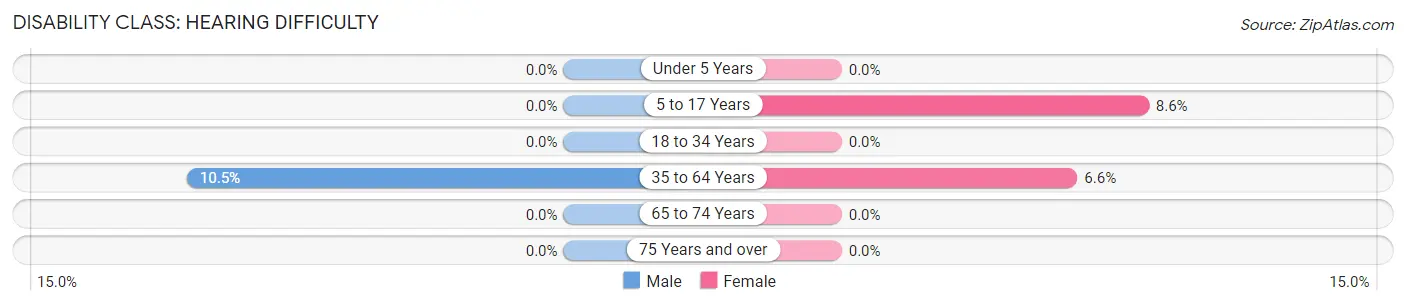
| Age Bracket | Male | Female |
| Under 5 Years | 0 (0.0%) | 0 (0.0%) |
| 5 to 17 Years | 0 (0.0%) | 10 (8.6%) |
| 18 to 34 Years | 0 (0.0%) | 0 (0.0%) |
| 35 to 64 Years | 26 (10.5%) | 16 (6.6%) |
| 65 to 74 Years | 0 (0.0%) | 0 (0.0%) |
| 75 Years and over | 0 (0.0%) | 0 (0.0%) |
Disability Class: Vision Difficulty
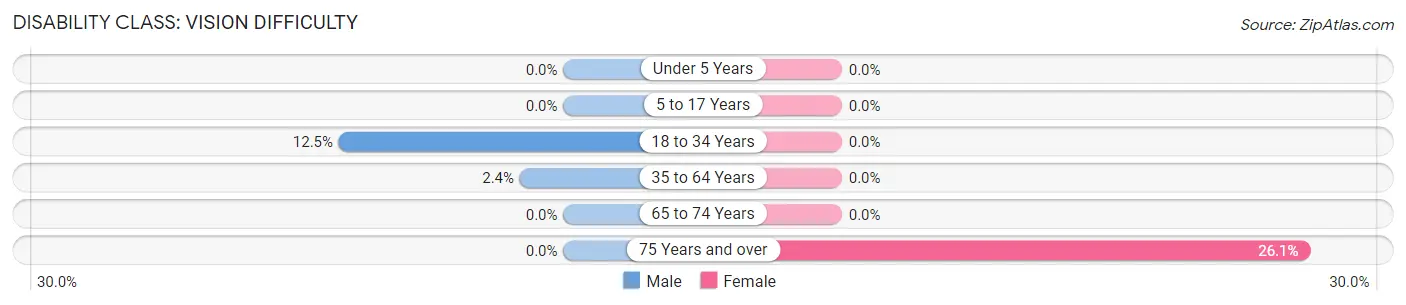
| Age Bracket | Male | Female |
| Under 5 Years | 0 (0.0%) | 0 (0.0%) |
| 5 to 17 Years | 0 (0.0%) | 0 (0.0%) |
| 18 to 34 Years | 5 (12.5%) | 0 (0.0%) |
| 35 to 64 Years | 6 (2.4%) | 0 (0.0%) |
| 65 to 74 Years | 0 (0.0%) | 0 (0.0%) |
| 75 Years and over | 0 (0.0%) | 6 (26.1%) |
Disability Class: Cognitive Difficulty
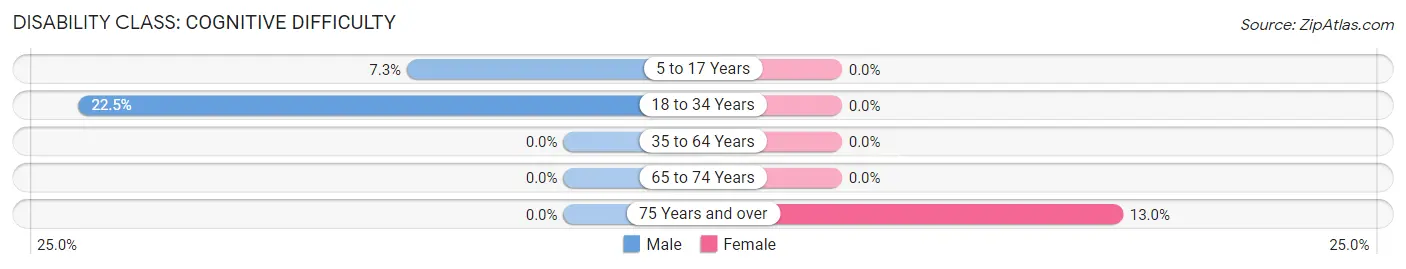
| Age Bracket | Male | Female |
| 5 to 17 Years | 9 (7.3%) | 0 (0.0%) |
| 18 to 34 Years | 9 (22.5%) | 0 (0.0%) |
| 35 to 64 Years | 0 (0.0%) | 0 (0.0%) |
| 65 to 74 Years | 0 (0.0%) | 0 (0.0%) |
| 75 Years and over | 0 (0.0%) | 3 (13.0%) |
Disability Class: Ambulatory Difficulty
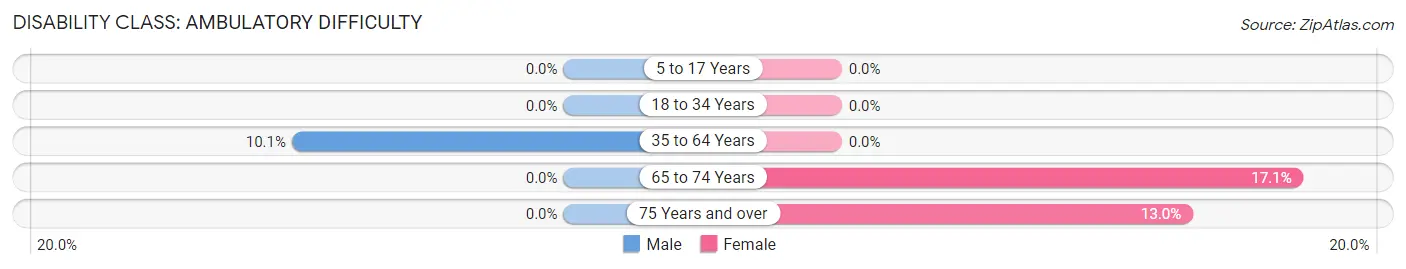
| Age Bracket | Male | Female |
| 5 to 17 Years | 0 (0.0%) | 0 (0.0%) |
| 18 to 34 Years | 0 (0.0%) | 0 (0.0%) |
| 35 to 64 Years | 25 (10.1%) | 0 (0.0%) |
| 65 to 74 Years | 0 (0.0%) | 12 (17.1%) |
| 75 Years and over | 0 (0.0%) | 3 (13.0%) |
Disability Class: Self-Care Difficulty
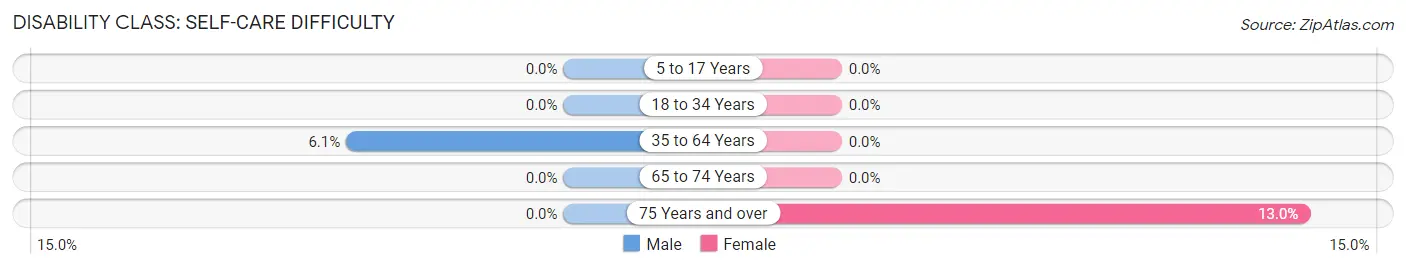
| Age Bracket | Male | Female |
| 5 to 17 Years | 0 (0.0%) | 0 (0.0%) |
| 18 to 34 Years | 0 (0.0%) | 0 (0.0%) |
| 35 to 64 Years | 15 (6.0%) | 0 (0.0%) |
| 65 to 74 Years | 0 (0.0%) | 0 (0.0%) |
| 75 Years and over | 0 (0.0%) | 3 (13.0%) |
Technology Access in Kaaawa
Computing Device Access in Kaaawa
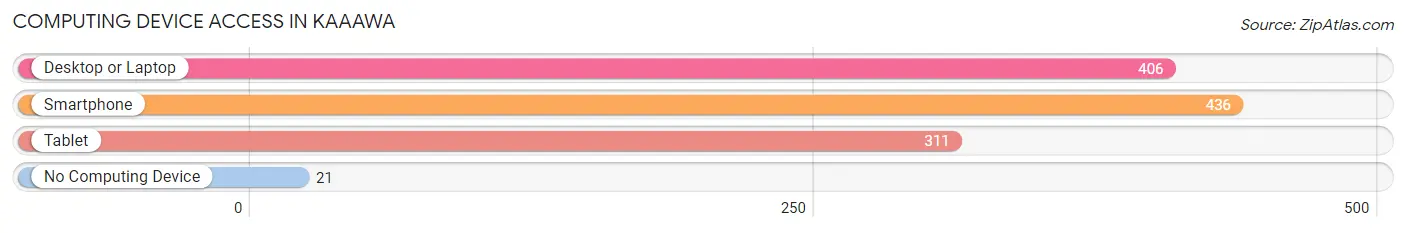
| Device Type | # Households | % Households |
| Desktop or Laptop | 406 | 85.3% |
| Smartphone | 436 | 91.6% |
| Tablet | 311 | 65.3% |
| No Computing Device | 21 | 4.4% |
| Total | 476 | 100.0% |
Internet Access in Kaaawa
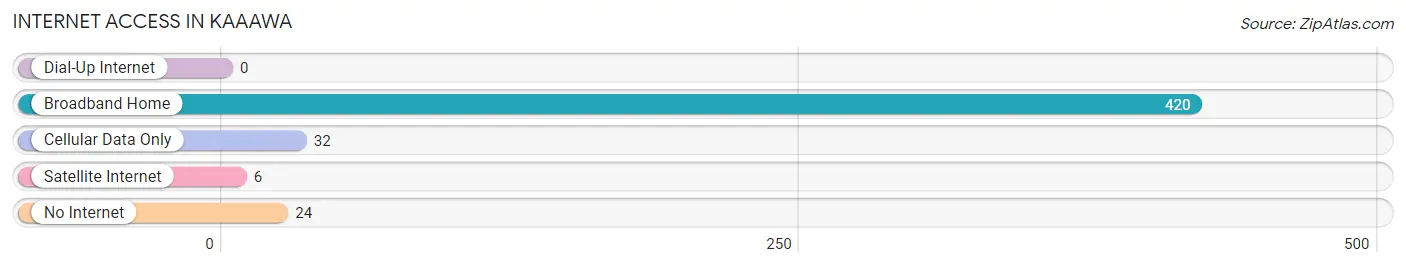
| Internet Type | # Households | % Households |
| Dial-Up Internet | 0 | 0.0% |
| Broadband Home | 420 | 88.2% |
| Cellular Data Only | 32 | 6.7% |
| Satellite Internet | 6 | 1.3% |
| No Internet | 24 | 5.0% |
| Total | 476 | 100.0% |
Kaaawa Summary
Kaaawa is a small unincorporated community located on the windward side of the island of Oahu in the state of Hawaii. It is located in the Ko’olauloa District of the City and County of Honolulu. The population of Kaaawa was 1,845 at the 2010 census.
History
Kaaawa was originally inhabited by the Native Hawaiian people. The area was first settled by Europeans in the late 1800s. The first post office in Kaaawa was established in 1891. The area was used for agricultural purposes, primarily for growing sugar cane and pineapple. In the early 1900s, the area was used for cattle ranching.
Geography
Kaaawa is located on the windward side of the island of Oahu, approximately 25 miles from Honolulu. It is situated between the towns of Kahuku and Laie. The area is bordered by the Pacific Ocean to the east and the Koolau Mountains to the west. The terrain is mostly flat with some rolling hills.
Economy
Kaaawa’s economy is primarily based on tourism and agriculture. The area is home to several resorts and hotels, as well as a variety of restaurants and shops. Agriculture is also an important part of the local economy, with sugar cane and pineapple being the primary crops.
Demographics
As of the 2010 census, the population of Kaaawa was 1,845. The racial makeup of the town was 57.3% White, 0.7% African American, 0.3% Native American, 24.2% Asian, 0.2% Pacific Islander, and 17.5% from other races. The median household income was $50,938.
Kaaawa is a small, rural community with a diverse population. The area is known for its beautiful beaches and scenic views. It is a popular destination for tourists and locals alike. The town is also home to a variety of businesses and services, making it a great place to live and work.
Common Questions
What is Per Capita Income in Kaaawa?
Per Capita income in Kaaawa is $53,483.
What is the Median Family Income in Kaaawa?
Median Family Income in Kaaawa is $132,059.
What is the Median Household income in Kaaawa?
Median Household Income in Kaaawa is $130,257.
What is Income or Wage Gap in Kaaawa?
Income or Wage Gap in Kaaawa is 66.3%.
Women in Kaaawa earn 33.7 cents for every dollar earned by a man.
What is Inequality or Gini Index in Kaaawa?
Inequality or Gini Index in Kaaawa is 0.38.
What is the Total Population of Kaaawa?
Total Population of Kaaawa is 1,259.
What is the Total Male Population of Kaaawa?
Total Male Population of Kaaawa is 642.
What is the Total Female Population of Kaaawa?
Total Female Population of Kaaawa is 617.
What is the Ratio of Males per 100 Females in Kaaawa?
There are 104.05 Males per 100 Females in Kaaawa.
What is the Ratio of Females per 100 Males in Kaaawa?
There are 96.11 Females per 100 Males in Kaaawa.
What is the Median Population Age in Kaaawa?
Median Population Age in Kaaawa is 35.5 Years.
What is the Average Family Size in Kaaawa
Average Family Size in Kaaawa is 3.1 People.
What is the Average Household Size in Kaaawa
Average Household Size in Kaaawa is 2.6 People.
How Large is the Labor Force in Kaaawa?
There are 774 People in the Labor Forcein in Kaaawa.
What is the Percentage of People in the Labor Force in Kaaawa?
78.3% of People are in the Labor Force in Kaaawa.
What is the Unemployment Rate in Kaaawa?
Unemployment Rate in Kaaawa is 3.9%.