Golden City, MO Map & Demographics
Golden City Map
Golden City Overview
$23,795
PER CAPITA INCOME
$60,156
AVG FAMILY INCOME
$37,679
AVG HOUSEHOLD INCOME
39.7%
WAGE / INCOME GAP [ % ]
60.3¢/ $1
WAGE / INCOME GAP [ $ ]
$9,439
FAMILY INCOME DEFICIT
0.45
INEQUALITY / GINI INDEX
612
TOTAL POPULATION
278
MALE POPULATION
334
FEMALE POPULATION
83.23
MALES / 100 FEMALES
120.14
FEMALES / 100 MALES
55.0
MEDIAN AGE
2.8
AVG FAMILY SIZE
2.1
AVG HOUSEHOLD SIZE
228
LABOR FORCE [ PEOPLE ]
44.4%
PERCENT IN LABOR FORCE
6.1%
UNEMPLOYMENT RATE
Golden City Zip Codes
Golden City Area Codes
Income in Golden City
Income Overview in Golden City
Per Capita Income in Golden City is $23,795, while median incomes of families and households are $60,156 and $37,679 respectively.
| Characteristic | Number | Measure |
| Per Capita Income | 612 | $23,795 |
| Median Family Income | 163 | $60,156 |
| Mean Family Income | 163 | $69,277 |
| Median Household Income | 287 | $37,679 |
| Mean Household Income | 287 | $50,962 |
| Income Deficit | 163 | $9,439 |
| Wage / Income Gap (%) | 612 | 39.74% |
| Wage / Income Gap ($) | 612 | 60.26¢ per $1 |
| Gini / Inequality Index | 612 | 0.45 |
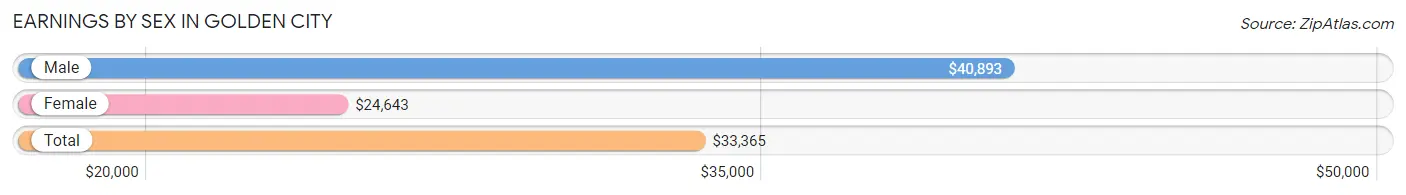
Earnings by Sex in Golden City
Average Earnings in Golden City are $33,365, $40,893 for men and $24,643 for women, a difference of 39.7%.
| Sex | Number | Average Earnings |
| Male | 135 (53.8%) | $40,893 |
| Female | 116 (46.2%) | $24,643 |
| Total | 251 (100.0%) | $33,365 |
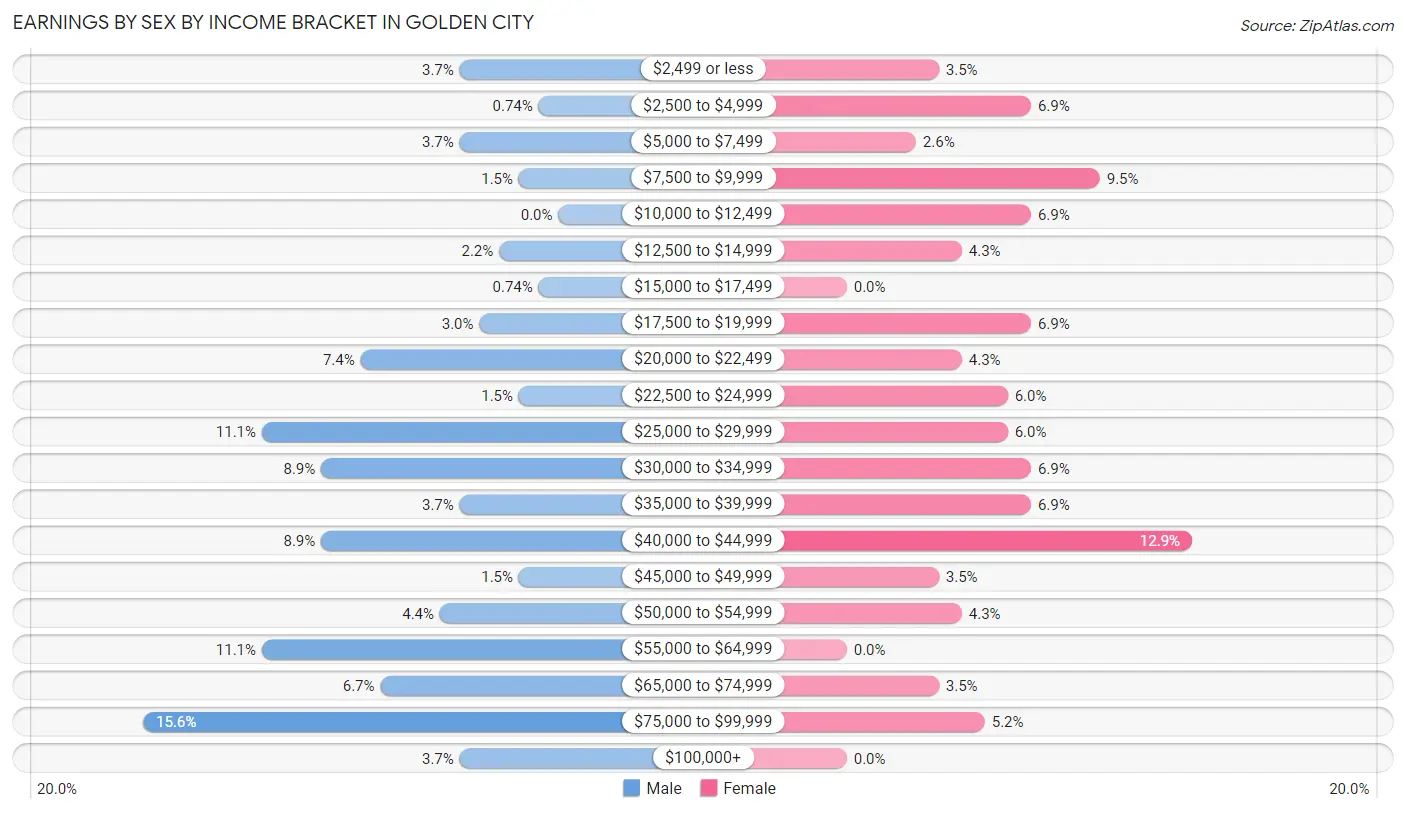
Earnings by Sex by Income Bracket in Golden City
The most common earnings brackets in Golden City are $75,000 to $99,999 for men (21 | 15.6%) and $40,000 to $44,999 for women (15 | 12.9%).
| Income | Male | Female |
| $2,499 or less | 5 (3.7%) | 4 (3.5%) |
| $2,500 to $4,999 | 1 (0.7%) | 8 (6.9%) |
| $5,000 to $7,499 | 5 (3.7%) | 3 (2.6%) |
| $7,500 to $9,999 | 2 (1.5%) | 11 (9.5%) |
| $10,000 to $12,499 | 0 (0.0%) | 8 (6.9%) |
| $12,500 to $14,999 | 3 (2.2%) | 5 (4.3%) |
| $15,000 to $17,499 | 1 (0.7%) | 0 (0.0%) |
| $17,500 to $19,999 | 4 (3.0%) | 8 (6.9%) |
| $20,000 to $22,499 | 10 (7.4%) | 5 (4.3%) |
| $22,500 to $24,999 | 2 (1.5%) | 7 (6.0%) |
| $25,000 to $29,999 | 15 (11.1%) | 7 (6.0%) |
| $30,000 to $34,999 | 12 (8.9%) | 8 (6.9%) |
| $35,000 to $39,999 | 5 (3.7%) | 8 (6.9%) |
| $40,000 to $44,999 | 12 (8.9%) | 15 (12.9%) |
| $45,000 to $49,999 | 2 (1.5%) | 4 (3.5%) |
| $50,000 to $54,999 | 6 (4.4%) | 5 (4.3%) |
| $55,000 to $64,999 | 15 (11.1%) | 0 (0.0%) |
| $65,000 to $74,999 | 9 (6.7%) | 4 (3.5%) |
| $75,000 to $99,999 | 21 (15.6%) | 6 (5.2%) |
| $100,000+ | 5 (3.7%) | 0 (0.0%) |
| Total | 135 (100.0%) | 116 (100.0%) |
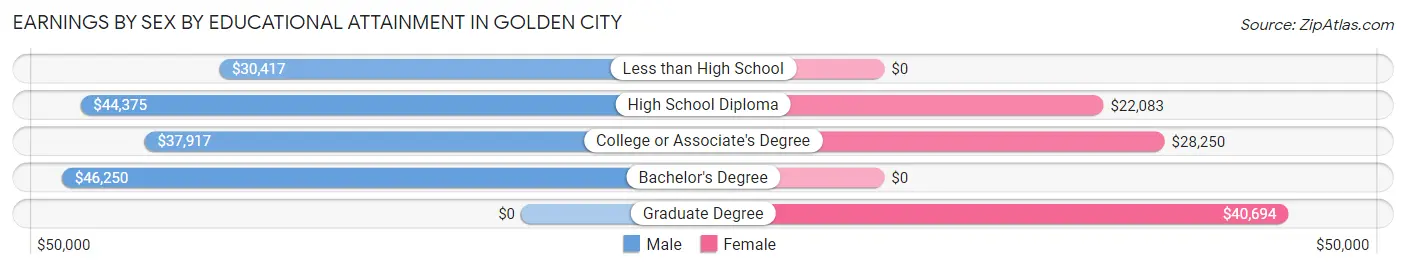
Earnings by Sex by Educational Attainment in Golden City
Average earnings in Golden City are $41,071 for men and $25,000 for women, a difference of 39.1%. Men with an educational attainment of bachelor's degree enjoy the highest average annual earnings of $46,250, while those with less than high school education earn the least with $30,417. Women with an educational attainment of graduate degree earn the most with the average annual earnings of $40,694, while those with high school diploma education have the smallest earnings of $22,083.
| Educational Attainment | Male Income | Female Income |
| Less than High School | $30,417 | $0 |
| High School Diploma | $44,375 | $22,083 |
| College or Associate's Degree | $37,917 | $28,250 |
| Bachelor's Degree | $46,250 | $0 |
| Graduate Degree | - | - |
| Total | $41,071 | $25,000 |
Family Income in Golden City
Family Income Brackets in Golden City
According to the Golden City family income data, there are 33 families falling into the $100,000 to $149,999 income range, which is the most common income bracket and makes up 20.3% of all families.
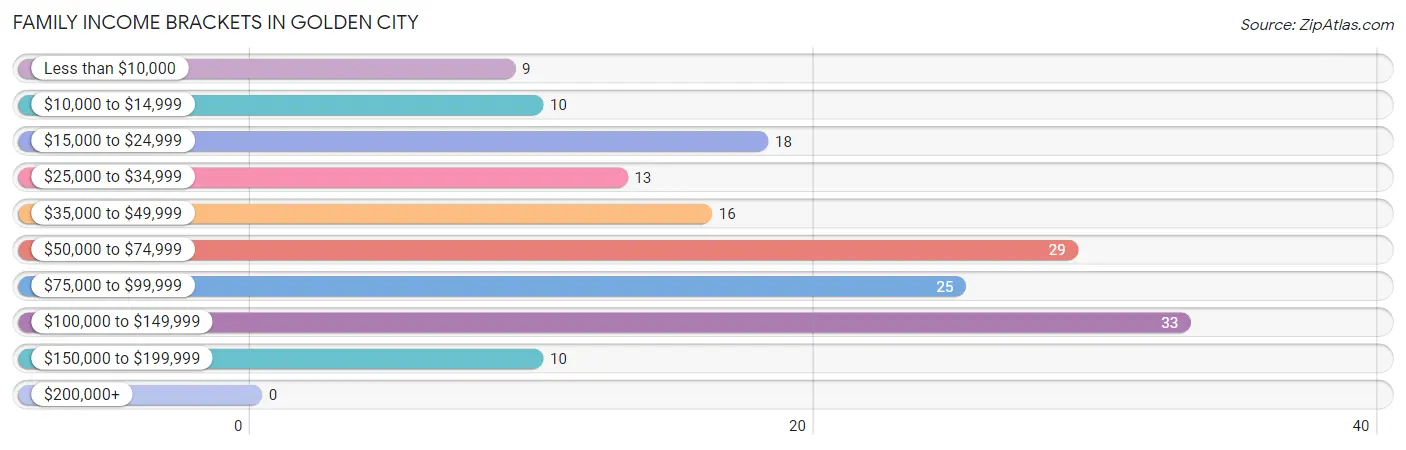
| Income Bracket | # Families | % Families |
| Less than $10,000 | 9 | 5.5% |
| $10,000 to $14,999 | 10 | 6.1% |
| $15,000 to $24,999 | 18 | 11.0% |
| $25,000 to $34,999 | 13 | 8.0% |
| $35,000 to $49,999 | 16 | 9.8% |
| $50,000 to $74,999 | 29 | 17.8% |
| $75,000 to $99,999 | 25 | 15.3% |
| $100,000 to $149,999 | 33 | 20.2% |
| $150,000 to $199,999 | 10 | 6.1% |
| $200,000+ | 0 | 0.0% |
Family Income by Famaliy Size in Golden City
2-person families (94 | 57.7%) account for the highest median family income in Golden City with $57,500 per family, while 2-person families (94 | 57.7%) have the highest median income of $28,750 per family member.
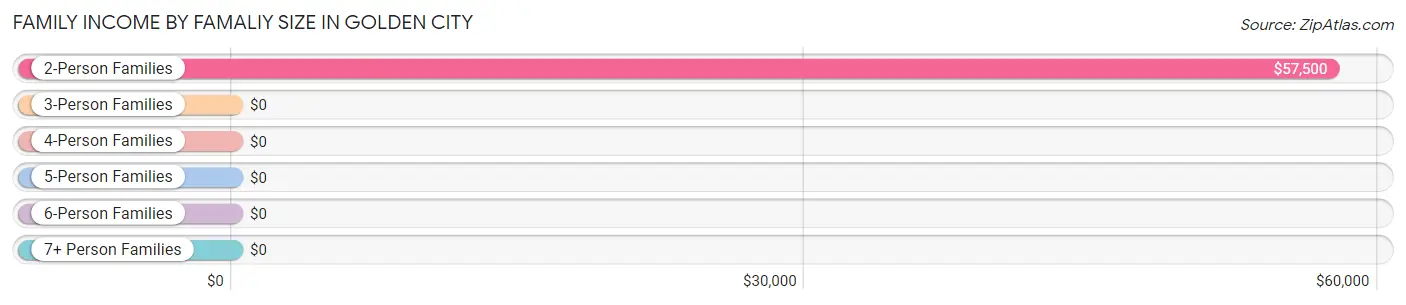
| Income Bracket | # Families | Median Income |
| 2-Person Families | 94 (57.7%) | $57,500 |
| 3-Person Families | 27 (16.6%) | $0 |
| 4-Person Families | 31 (19.0%) | $0 |
| 5-Person Families | 8 (4.9%) | $0 |
| 6-Person Families | 3 (1.8%) | $0 |
| 7+ Person Families | 0 (0.0%) | $0 |
| Total | 163 (100.0%) | $60,156 |
Family Income by Number of Earners in Golden City
The median family income in Golden City is $60,156, with families comprising 3+ earners (9) having the highest median family income of $106,875, while families with no earners (45) have the lowest median family income of $27,708, accounting for 5.5% and 27.6% of families, respectively.
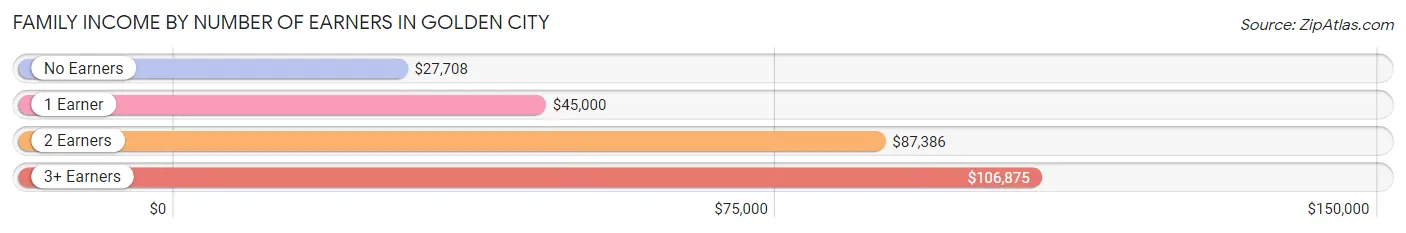
| Number of Earners | # Families | Median Income |
| No Earners | 45 (27.6%) | $27,708 |
| 1 Earner | 48 (29.4%) | $45,000 |
| 2 Earners | 61 (37.4%) | $87,386 |
| 3+ Earners | 9 (5.5%) | $106,875 |
| Total | 163 (100.0%) | $60,156 |
Household Income in Golden City
Household Income Brackets in Golden City
With 64 households falling in the category, the $15,000 to $24,999 income range is the most frequent in Golden City, accounting for 22.3% of all households.
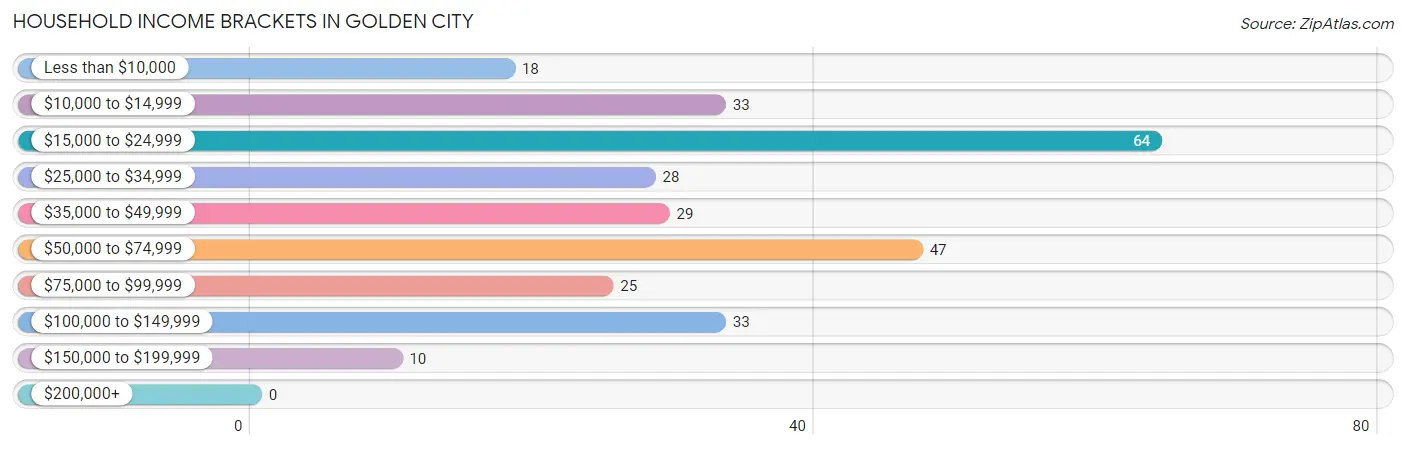
| Income Bracket | # Households | % Households |
| Less than $10,000 | 18 | 6.3% |
| $10,000 to $14,999 | 33 | 11.5% |
| $15,000 to $24,999 | 64 | 22.3% |
| $25,000 to $34,999 | 28 | 9.8% |
| $35,000 to $49,999 | 29 | 10.1% |
| $50,000 to $74,999 | 47 | 16.4% |
| $75,000 to $99,999 | 25 | 8.7% |
| $100,000 to $149,999 | 33 | 11.5% |
| $150,000 to $199,999 | 10 | 3.5% |
| $200,000+ | 0 | 0.0% |
Household Income by Householder Age in Golden City
The median household income in Golden City is $37,679, with the highest median household income of $55,625 found in the 25 to 44 years age bracket for the primary householder. A total of 39 households (13.6%) fall into this category. Meanwhile, the 15 to 24 years age bracket for the primary householder has the lowest median household income of $0, with 2 households (0.7%) in this group.
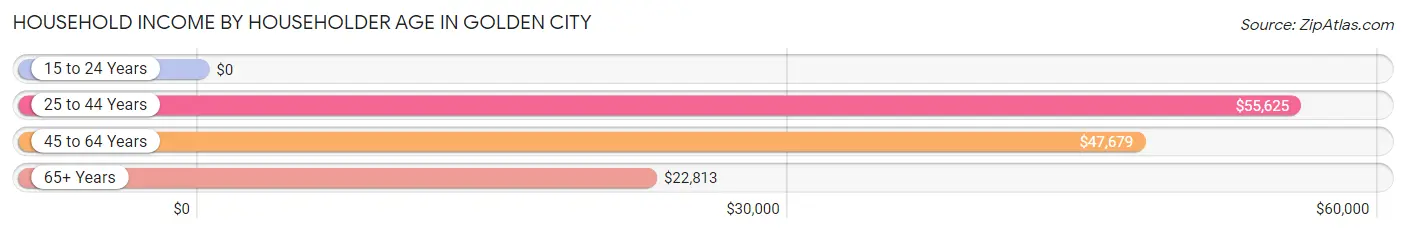
| Income Bracket | # Households | Median Income |
| 15 to 24 Years | 2 (0.7%) | $0 |
| 25 to 44 Years | 39 (13.6%) | $55,625 |
| 45 to 64 Years | 121 (42.2%) | $47,679 |
| 65+ Years | 125 (43.5%) | $22,813 |
| Total | 287 (100.0%) | $37,679 |
Poverty in Golden City
Income Below Poverty by Sex and Age in Golden City
With 20.9% poverty level for males and 29.6% for females among the residents of Golden City, under 5 year old males and 16 and 17 year old females are the most vulnerable to poverty, with 11 males (61.1%) and 2 females (100.0%) in their respective age groups living below the poverty level.
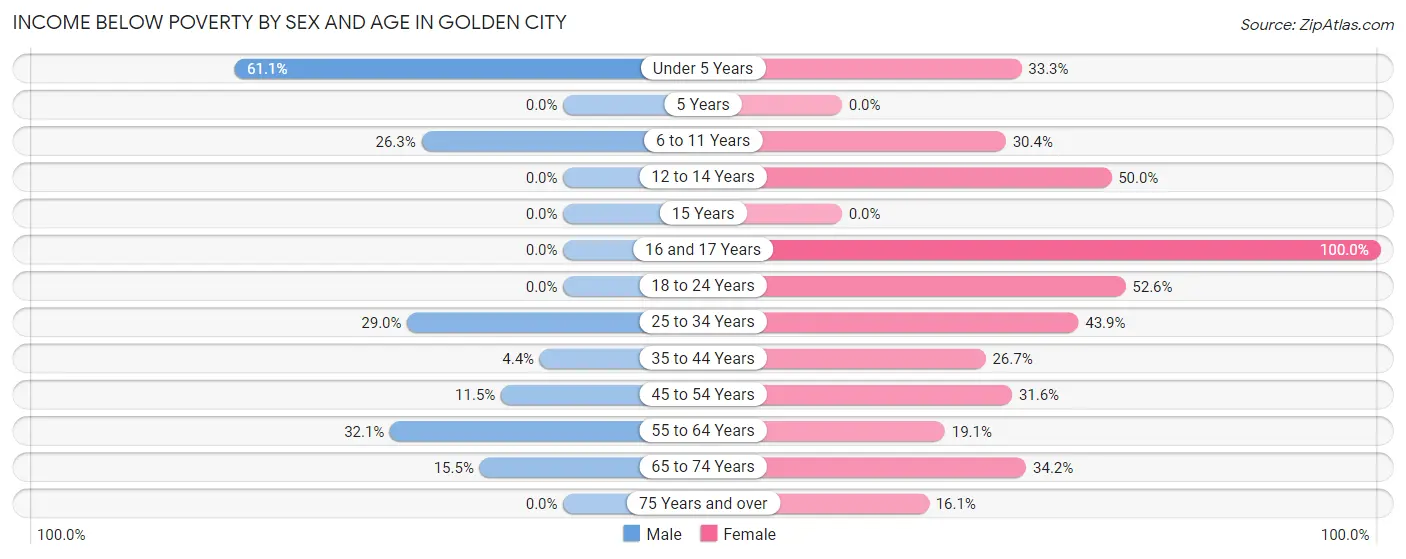
| Age Bracket | Male | Female |
| Under 5 Years | 11 (61.1%) | 4 (33.3%) |
| 5 Years | 0 (0.0%) | 0 (0.0%) |
| 6 to 11 Years | 5 (26.3%) | 7 (30.4%) |
| 12 to 14 Years | 0 (0.0%) | 4 (50.0%) |
| 15 Years | 0 (0.0%) | 0 (0.0%) |
| 16 and 17 Years | 0 (0.0%) | 2 (100.0%) |
| 18 to 24 Years | 0 (0.0%) | 10 (52.6%) |
| 25 to 34 Years | 11 (28.9%) | 18 (43.9%) |
| 35 to 44 Years | 1 (4.3%) | 4 (26.7%) |
| 45 to 54 Years | 3 (11.5%) | 12 (31.6%) |
| 55 to 64 Years | 18 (32.1%) | 13 (19.1%) |
| 65 to 74 Years | 9 (15.5%) | 13 (34.2%) |
| 75 Years and over | 0 (0.0%) | 10 (16.1%) |
| Total | 58 (20.9%) | 97 (29.6%) |
Income Above Poverty by Sex and Age in Golden City
According to the poverty statistics in Golden City, males aged 12 to 14 years and females aged 15 years are the age groups that are most secure financially, with 100.0% of males and 100.0% of females in these age groups living above the poverty line.
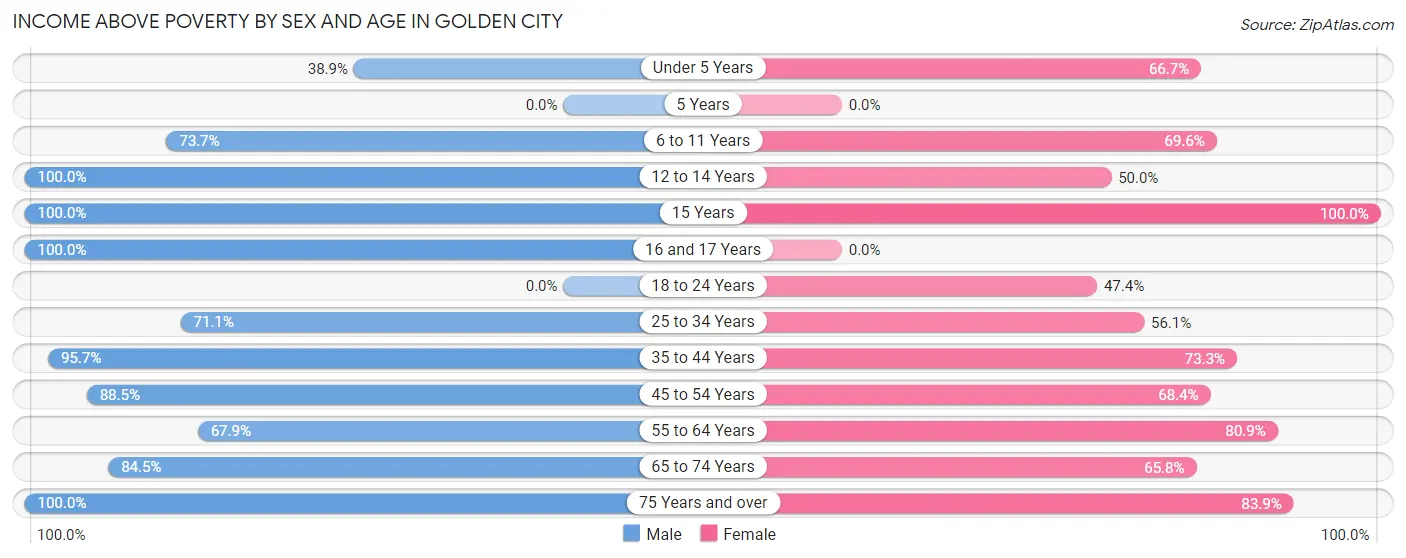
| Age Bracket | Male | Female |
| Under 5 Years | 7 (38.9%) | 8 (66.7%) |
| 5 Years | 0 (0.0%) | 0 (0.0%) |
| 6 to 11 Years | 14 (73.7%) | 16 (69.6%) |
| 12 to 14 Years | 8 (100.0%) | 4 (50.0%) |
| 15 Years | 2 (100.0%) | 2 (100.0%) |
| 16 and 17 Years | 6 (100.0%) | 0 (0.0%) |
| 18 to 24 Years | 0 (0.0%) | 9 (47.4%) |
| 25 to 34 Years | 27 (71.1%) | 23 (56.1%) |
| 35 to 44 Years | 22 (95.7%) | 11 (73.3%) |
| 45 to 54 Years | 23 (88.5%) | 26 (68.4%) |
| 55 to 64 Years | 38 (67.9%) | 55 (80.9%) |
| 65 to 74 Years | 49 (84.5%) | 25 (65.8%) |
| 75 Years and over | 24 (100.0%) | 52 (83.9%) |
| Total | 220 (79.1%) | 231 (70.4%) |
Income Below Poverty Among Married-Couple Families in Golden City
The poverty statistics for married-couple families in Golden City show that 10.2% or 12 of the total 118 families live below the poverty line. Families with 1 or 2 children have the highest poverty rate of 19.2%, comprising of 5 families. On the other hand, families with 3 or 4 children have the lowest poverty rate of 0.0%, which includes 0 families.
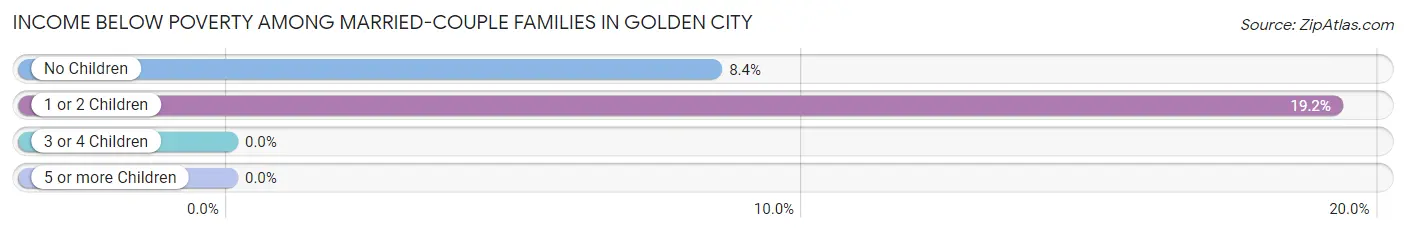
| Children | Above Poverty | Below Poverty |
| No Children | 76 (91.6%) | 7 (8.4%) |
| 1 or 2 Children | 21 (80.8%) | 5 (19.2%) |
| 3 or 4 Children | 9 (100.0%) | 0 (0.0%) |
| 5 or more Children | 0 (0.0%) | 0 (0.0%) |
| Total | 106 (89.8%) | 12 (10.2%) |
Income Below Poverty Among Single-Parent Households in Golden City
According to the poverty data in Golden City, 80.0% or 12 single-father households and 30.0% or 9 single-mother households are living below the poverty line. Among single-father households, those with 1 or 2 children have the highest poverty rate, with 12 households (80.0%) experiencing poverty. Likewise, among single-mother households, those with 3 or 4 children have the highest poverty rate, with 3 households (100.0%) falling below the poverty line.
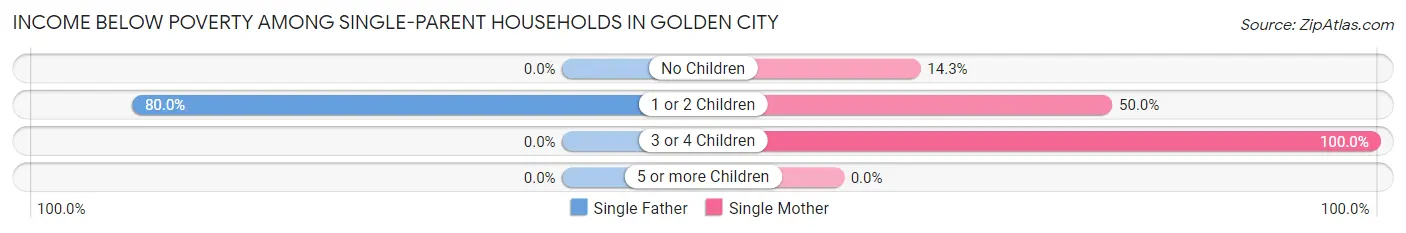
| Children | Single Father | Single Mother |
| No Children | 0 (0.0%) | 3 (14.3%) |
| 1 or 2 Children | 12 (80.0%) | 3 (50.0%) |
| 3 or 4 Children | 0 (0.0%) | 3 (100.0%) |
| 5 or more Children | 0 (0.0%) | 0 (0.0%) |
| Total | 12 (80.0%) | 9 (30.0%) |
Income Below Poverty Among Married-Couple vs Single-Parent Households in Golden City
The poverty data for Golden City shows that 12 of the married-couple family households (10.2%) and 21 of the single-parent households (46.7%) are living below the poverty level. Within the married-couple family households, those with 1 or 2 children have the highest poverty rate, with 5 households (19.2%) falling below the poverty line. Among the single-parent households, those with 3 or 4 children have the highest poverty rate, with 3 household (100.0%) living below poverty.
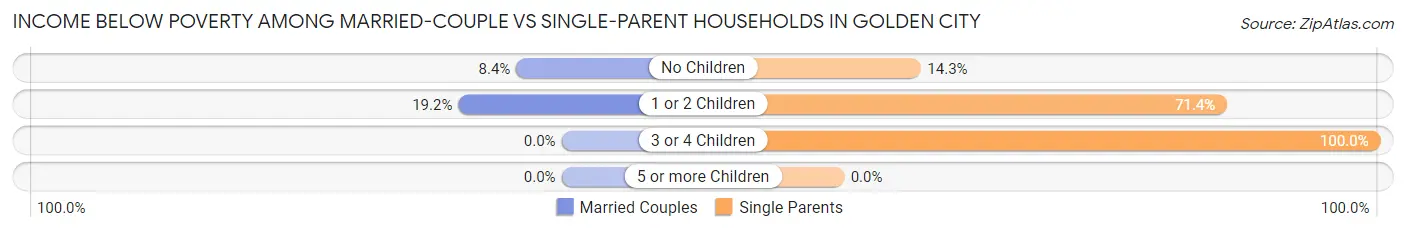
| Children | Married-Couple Families | Single-Parent Households |
| No Children | 7 (8.4%) | 3 (14.3%) |
| 1 or 2 Children | 5 (19.2%) | 15 (71.4%) |
| 3 or 4 Children | 0 (0.0%) | 3 (100.0%) |
| 5 or more Children | 0 (0.0%) | 0 (0.0%) |
| Total | 12 (10.2%) | 21 (46.7%) |
Race in Golden City
The most populous races in Golden City are White / Caucasian (557 | 91.0%), Two or more Races (40 | 6.5%), and Hispanic or Latino (20 | 3.3%).
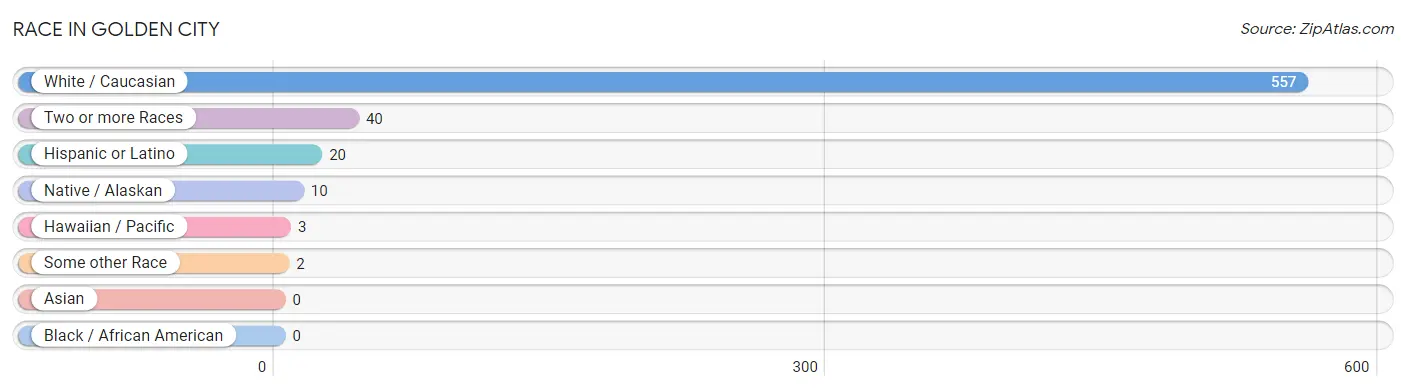
| Race | # Population | % Population |
| Asian | 0 | 0.0% |
| Black / African American | 0 | 0.0% |
| Hawaiian / Pacific | 3 | 0.5% |
| Hispanic or Latino | 20 | 3.3% |
| Native / Alaskan | 10 | 1.6% |
| White / Caucasian | 557 | 91.0% |
| Two or more Races | 40 | 6.5% |
| Some other Race | 2 | 0.3% |
| Total | 612 | 100.0% |
Ancestry in Golden City
The most populous ancestries reported in Golden City are German (98 | 16.0%), English (55 | 9.0%), American (47 | 7.7%), Irish (32 | 5.2%), and French (23 | 3.8%), together accounting for 41.7% of all Golden City residents.
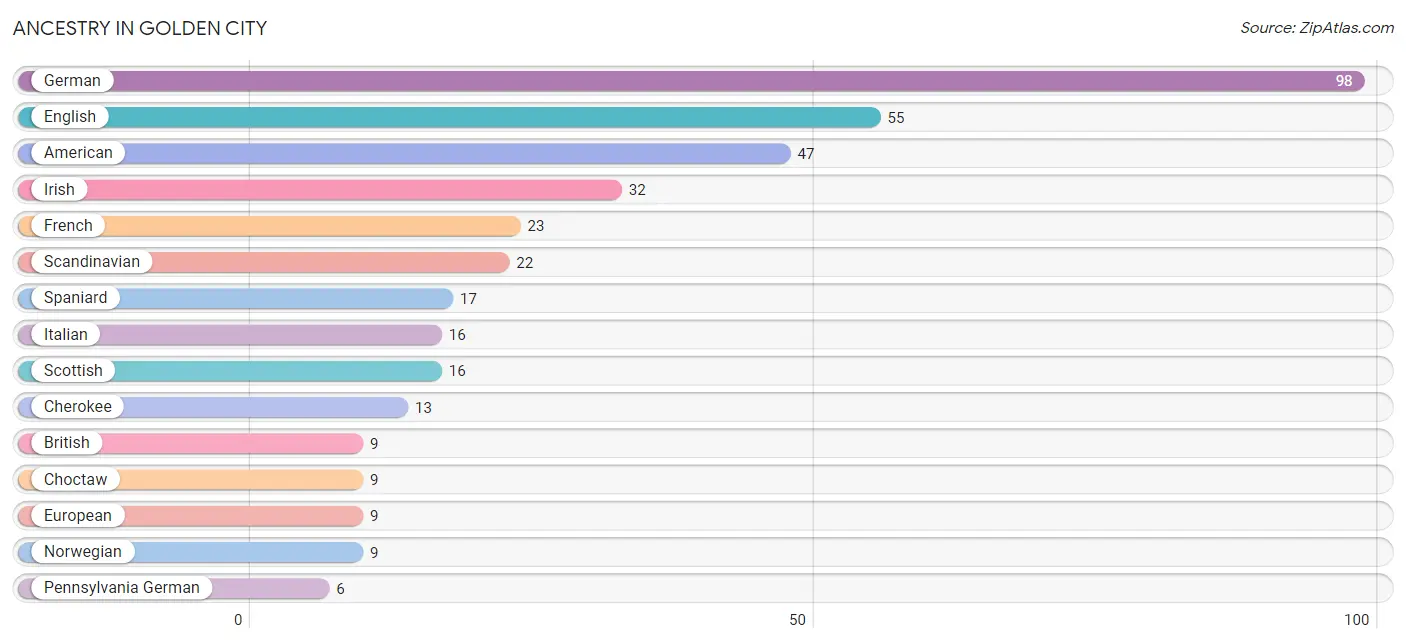
| Ancestry | # Population | % Population |
| American | 47 | 7.7% |
| British | 9 | 1.5% |
| Cherokee | 13 | 2.1% |
| Chinese | 3 | 0.5% |
| Choctaw | 9 | 1.5% |
| English | 55 | 9.0% |
| European | 9 | 1.5% |
| French | 23 | 3.8% |
| German | 98 | 16.0% |
| Irish | 32 | 5.2% |
| Italian | 16 | 2.6% |
| Norwegian | 9 | 1.5% |
| Pennsylvania German | 6 | 1.0% |
| Polish | 3 | 0.5% |
| Scandinavian | 22 | 3.6% |
| Scotch-Irish | 6 | 1.0% |
| Scottish | 16 | 2.6% |
| Sioux | 1 | 0.2% |
| Spaniard | 17 | 2.8% |
| Spanish | 3 | 0.5% |
| Welsh | 2 | 0.3% | View All 21 Rows |
Immigrants in Golden City
The most numerous immigrant groups reported in Golden City came from Europe (2 | 0.3%), and Northern Europe (2 | 0.3%), together accounting for 0.7% of all Golden City residents.
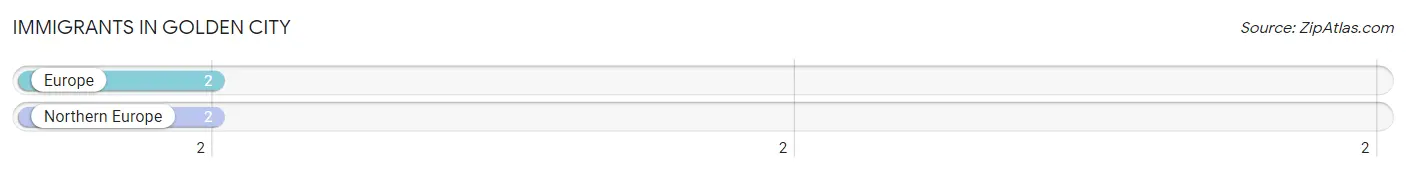
| Immigration Origin | # Population | % Population |
| Europe | 2 | 0.3% |
| Northern Europe | 2 | 0.3% | View All 2 Rows |
Sex and Age in Golden City
Sex and Age in Golden City
The most populous age groups in Golden City are 65 to 69 Years (44 | 15.8%) for men and 60 to 64 Years (49 | 14.7%) for women.
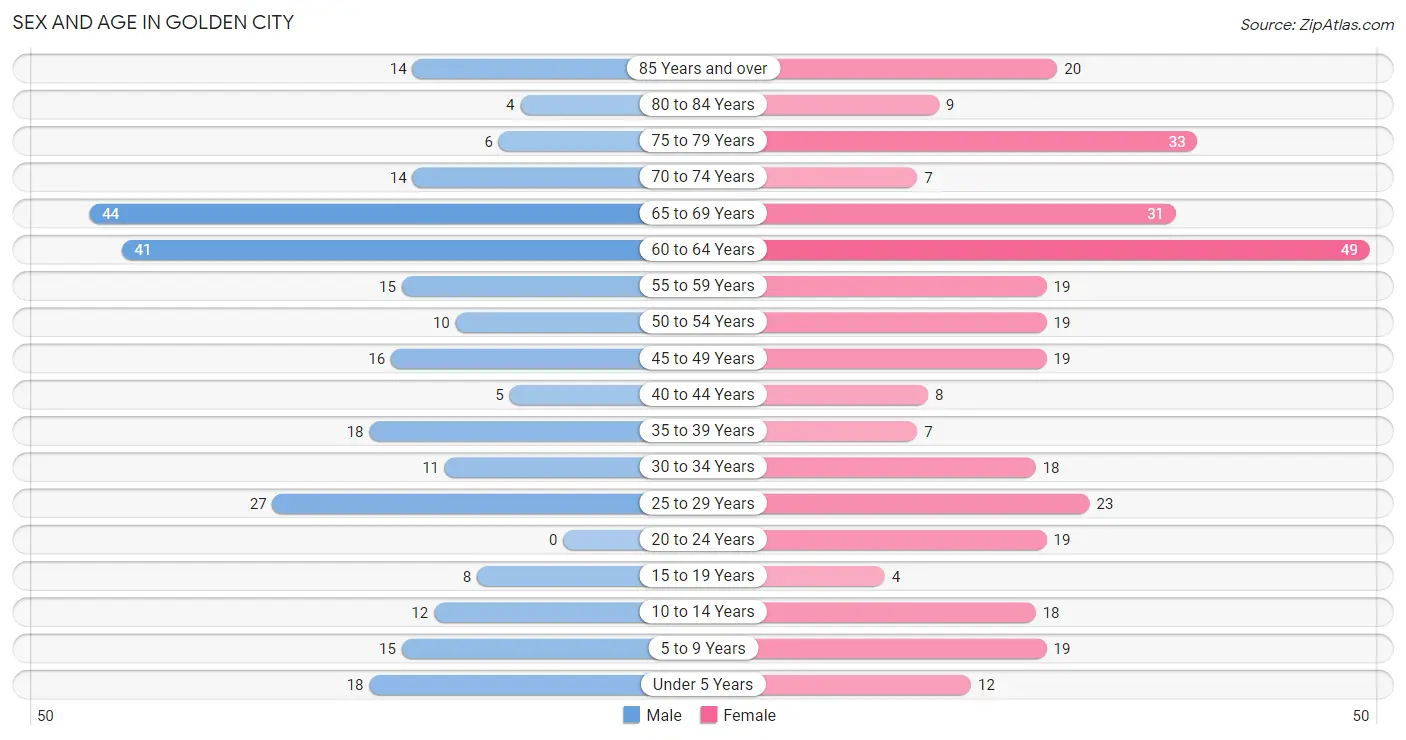
| Age Bracket | Male | Female |
| Under 5 Years | 18 (6.5%) | 12 (3.6%) |
| 5 to 9 Years | 15 (5.4%) | 19 (5.7%) |
| 10 to 14 Years | 12 (4.3%) | 18 (5.4%) |
| 15 to 19 Years | 8 (2.9%) | 4 (1.2%) |
| 20 to 24 Years | 0 (0.0%) | 19 (5.7%) |
| 25 to 29 Years | 27 (9.7%) | 23 (6.9%) |
| 30 to 34 Years | 11 (4.0%) | 18 (5.4%) |
| 35 to 39 Years | 18 (6.5%) | 7 (2.1%) |
| 40 to 44 Years | 5 (1.8%) | 8 (2.4%) |
| 45 to 49 Years | 16 (5.8%) | 19 (5.7%) |
| 50 to 54 Years | 10 (3.6%) | 19 (5.7%) |
| 55 to 59 Years | 15 (5.4%) | 19 (5.7%) |
| 60 to 64 Years | 41 (14.7%) | 49 (14.7%) |
| 65 to 69 Years | 44 (15.8%) | 31 (9.3%) |
| 70 to 74 Years | 14 (5.0%) | 7 (2.1%) |
| 75 to 79 Years | 6 (2.2%) | 33 (9.9%) |
| 80 to 84 Years | 4 (1.4%) | 9 (2.7%) |
| 85 Years and over | 14 (5.0%) | 20 (6.0%) |
| Total | 278 (100.0%) | 334 (100.0%) |
Families and Households in Golden City
Median Family Size in Golden City
The median family size in Golden City is 2.79 persons per family, with single male/father families (15 | 9.2%) accounting for the largest median family size of 3.73 persons per family. On the other hand, married-couple families (118 | 72.4%) represent the smallest median family size with 2.63 persons per family.
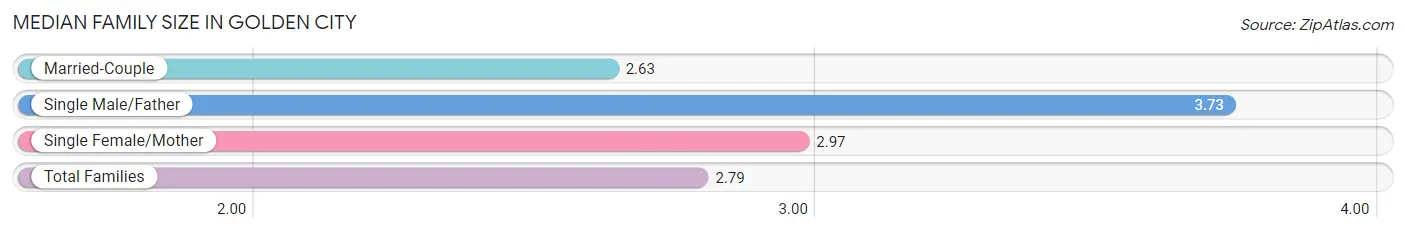
| Family Type | # Families | Family Size |
| Married-Couple | 118 (72.4%) | 2.63 |
| Single Male/Father | 15 (9.2%) | 3.73 |
| Single Female/Mother | 30 (18.4%) | 2.97 |
| Total Families | 163 (100.0%) | 2.79 |
Median Household Size in Golden City
The median household size in Golden City is 2.11 persons per household, with single male/father households (15 | 5.2%) accounting for the largest median household size of 3.93 persons per household. non-family households (124 | 43.2%) represent the smallest median household size with 1.12 persons per household.
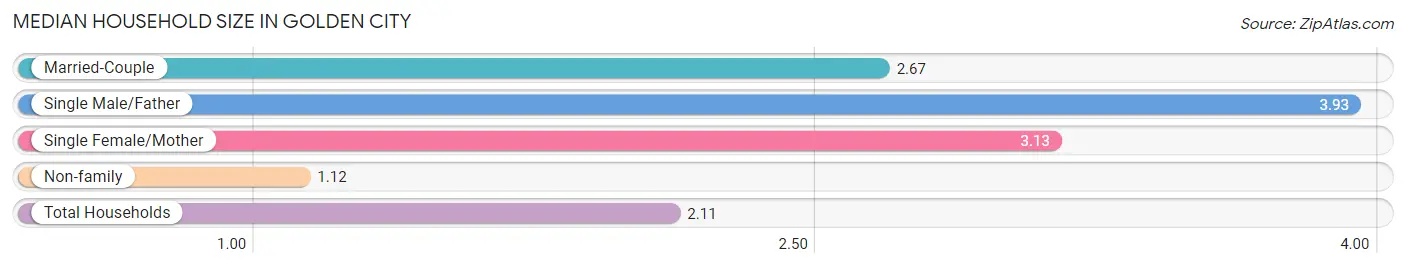
| Household Type | # Households | Household Size |
| Married-Couple | 118 (41.1%) | 2.67 |
| Single Male/Father | 15 (5.2%) | 3.93 |
| Single Female/Mother | 30 (10.4%) | 3.13 |
| Non-family | 124 (43.2%) | 1.12 |
| Total Households | 287 (100.0%) | 2.11 |
Household Size by Marriage Status in Golden City
Out of a total of 287 households in Golden City, 163 (56.8%) are family households, while 124 (43.2%) are nonfamily households. The most numerous type of family households are 2-person households, comprising 85, and the most common type of nonfamily households are 1-person households, comprising 113.
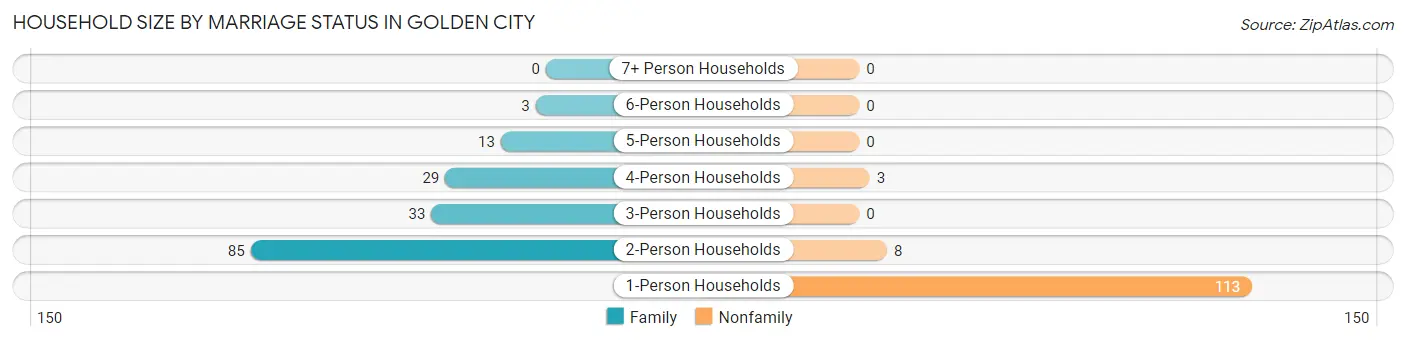
| Household Size | Family Households | Nonfamily Households |
| 1-Person Households | - | 113 (39.4%) |
| 2-Person Households | 85 (29.6%) | 8 (2.8%) |
| 3-Person Households | 33 (11.5%) | 0 (0.0%) |
| 4-Person Households | 29 (10.1%) | 3 (1.1%) |
| 5-Person Households | 13 (4.5%) | 0 (0.0%) |
| 6-Person Households | 3 (1.1%) | 0 (0.0%) |
| 7+ Person Households | 0 (0.0%) | 0 (0.0%) |
| Total | 163 (56.8%) | 124 (43.2%) |
Female Fertility in Golden City
Fertility by Age in Golden City
Average fertility rate in Golden City is 19.0 births per 1,000 women. Women in the age bracket of 20 to 34 years have the highest fertility rate with 33.0 births per 1,000 women. Women in the age bracket of 20 to 34 years acount for 100.0% of all women with births.
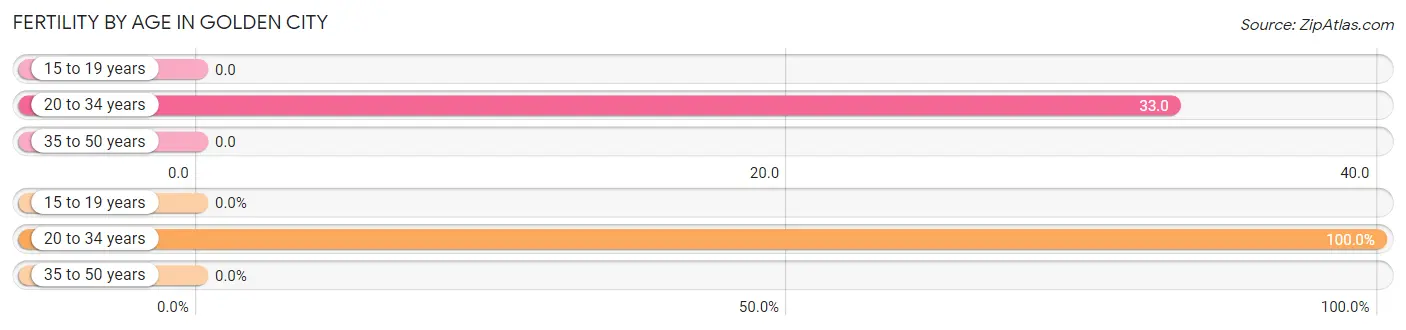
| Age Bracket | Women with Births | Births / 1,000 Women |
| 15 to 19 years | 0 (0.0%) | 0.0 |
| 20 to 34 years | 2 (100.0%) | 33.0 |
| 35 to 50 years | 0 (0.0%) | 0.0 |
| Total | 2 (100.0%) | 19.0 |
Fertility by Age by Marriage Status in Golden City
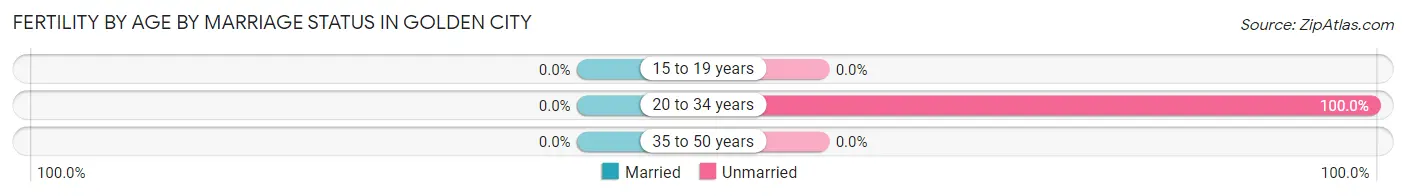
| Age Bracket | Married | Unmarried |
| 15 to 19 years | 0 (0.0%) | 0 (0.0%) |
| 20 to 34 years | 0 (0.0%) | 2 (100.0%) |
| 35 to 50 years | 0 (0.0%) | 0 (0.0%) |
| Total | 0 (0.0%) | 2 (100.0%) |
Fertility by Education in Golden City
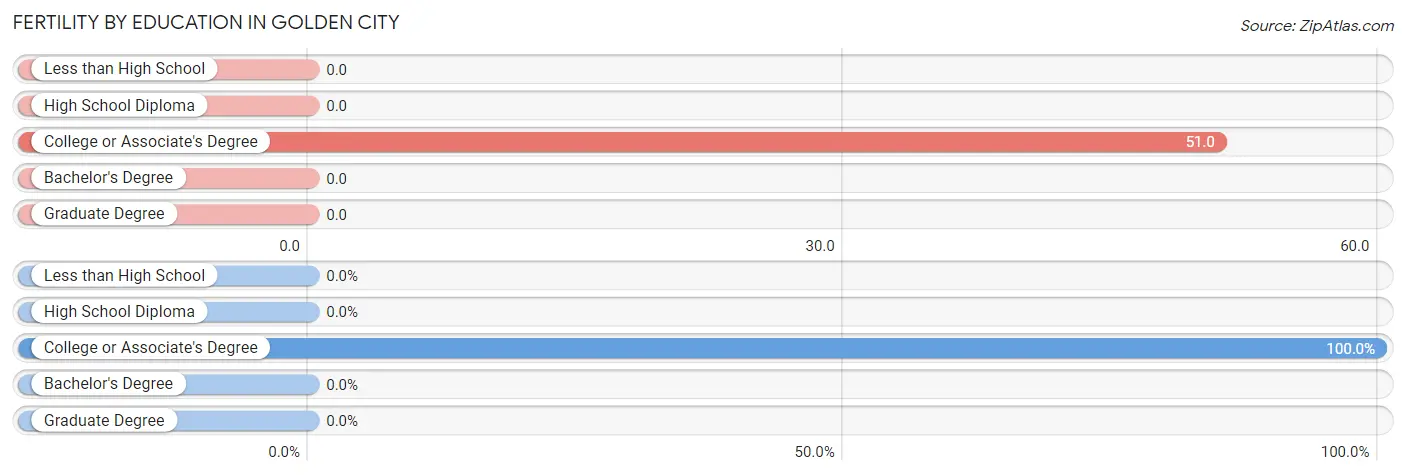
| Educational Attainment | Women with Births | Births / 1,000 Women |
| Less than High School | 0 (0.0%) | 0.0 |
| High School Diploma | 0 (0.0%) | 0.0 |
| College or Associate's Degree | 2 (100.0%) | 51.0 |
| Bachelor's Degree | 0 (0.0%) | 0.0 |
| Graduate Degree | 0 (0.0%) | 0.0 |
| Total | 2 (100.0%) | 19.0 |
Fertility by Education by Marriage Status in Golden City
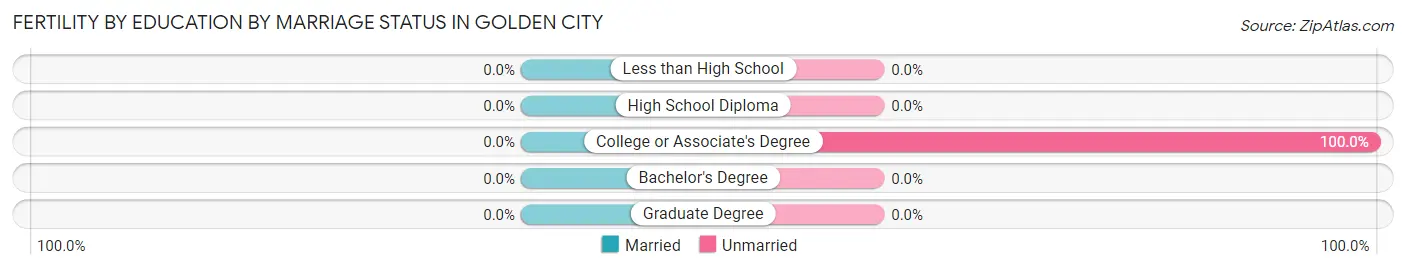
| Educational Attainment | Married | Unmarried |
| Less than High School | 0 (0.0%) | 0 (0.0%) |
| High School Diploma | 0 (0.0%) | 0 (0.0%) |
| College or Associate's Degree | 0 (0.0%) | 2 (100.0%) |
| Bachelor's Degree | 0 (0.0%) | 0 (0.0%) |
| Graduate Degree | 0 (0.0%) | 0 (0.0%) |
| Total | 0 (0.0%) | 2 (100.0%) |
Employment Characteristics in Golden City
Employment by Class of Employer in Golden City
Among the 209 employed individuals in Golden City, private company employees (149 | 71.3%), not-for-profit organizations (20 | 9.6%), and self-employed (not incorporated) (12 | 5.7%) make up the most common classes of employment.
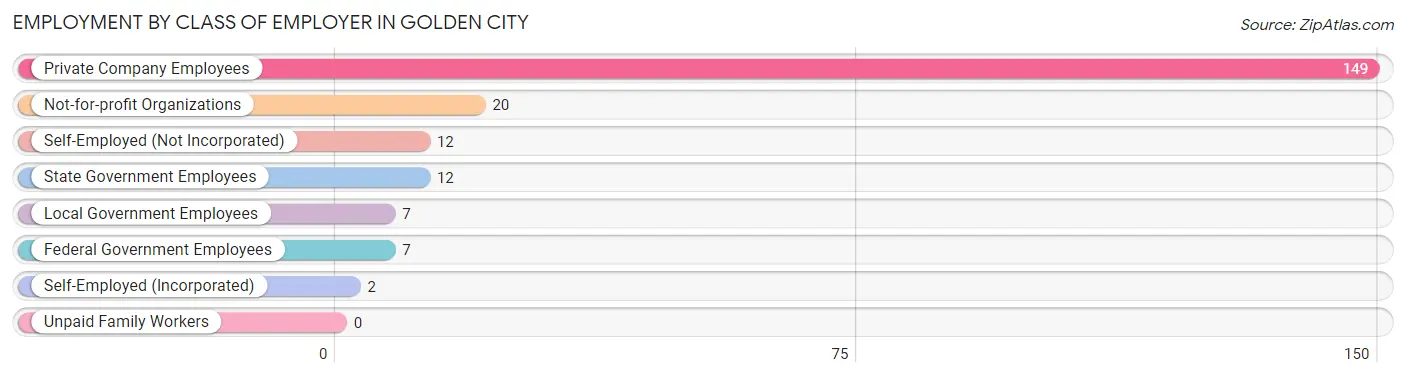
| Employer Class | # Employees | % Employees |
| Private Company Employees | 149 | 71.3% |
| Self-Employed (Incorporated) | 2 | 1.0% |
| Self-Employed (Not Incorporated) | 12 | 5.7% |
| Not-for-profit Organizations | 20 | 9.6% |
| Local Government Employees | 7 | 3.4% |
| State Government Employees | 12 | 5.7% |
| Federal Government Employees | 7 | 3.4% |
| Unpaid Family Workers | 0 | 0.0% |
| Total | 209 | 100.0% |
Employment Status by Age in Golden City
According to the labor force statistics for Golden City, out of the total population over 16 years of age (514), 44.4% or 228 individuals are in the labor force, with 6.1% or 14 of them unemployed. The age group with the highest labor force participation rate is 35 to 44 years, with 89.5% or 34 individuals in the labor force. Within the labor force, the 30 to 34 years age range has the highest percentage of unemployed individuals, with 13.6% or 3 of them being unemployed.
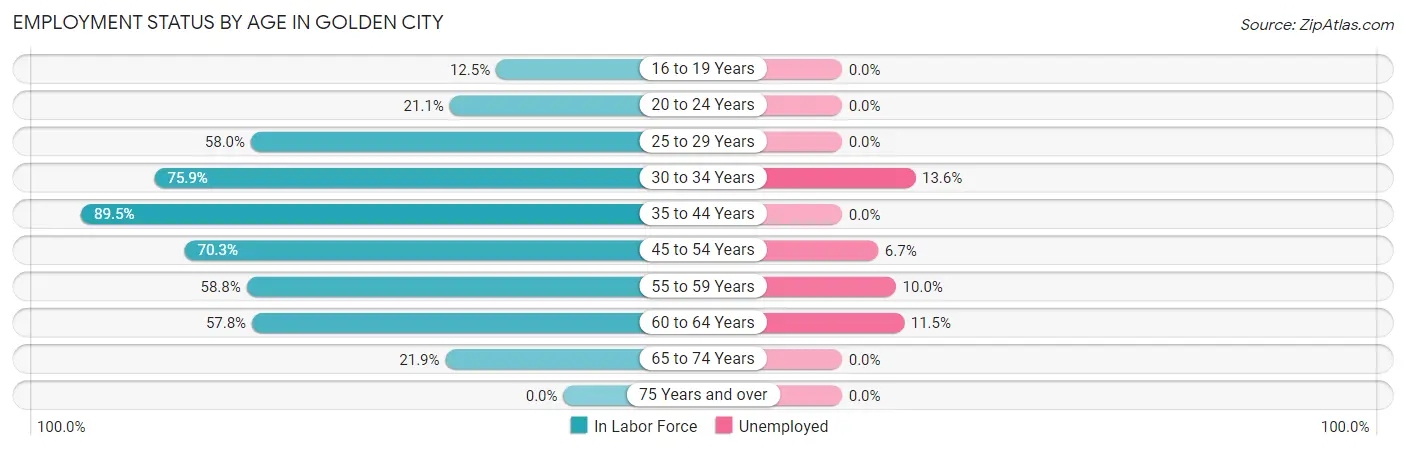
| Age Bracket | In Labor Force | Unemployed |
| 16 to 19 Years | 1 (12.5%) | 0 (0.0%) |
| 20 to 24 Years | 4 (21.1%) | 0 (0.0%) |
| 25 to 29 Years | 29 (58.0%) | 0 (0.0%) |
| 30 to 34 Years | 22 (75.9%) | 3 (13.6%) |
| 35 to 44 Years | 34 (89.5%) | 0 (0.0%) |
| 45 to 54 Years | 45 (70.3%) | 3 (6.7%) |
| 55 to 59 Years | 20 (58.8%) | 2 (10.0%) |
| 60 to 64 Years | 52 (57.8%) | 6 (11.5%) |
| 65 to 74 Years | 21 (21.9%) | 0 (0.0%) |
| 75 Years and over | 0 (0.0%) | 0 (0.0%) |
| Total | 228 (44.4%) | 14 (6.1%) |
Employment Status by Educational Attainment in Golden City
According to labor force statistics for Golden City, 66.2% of individuals (202) out of the total population between 25 and 64 years of age (305) are in the labor force, with 6.9% or 14 of them being unemployed. The group with the highest labor force participation rate are those with the educational attainment of college / associate degree, with 83.0% or 78 individuals in the labor force. Within the labor force, individuals with less than high school education have the highest percentage of unemployment, with 15.4% or 2 of them being unemployed.
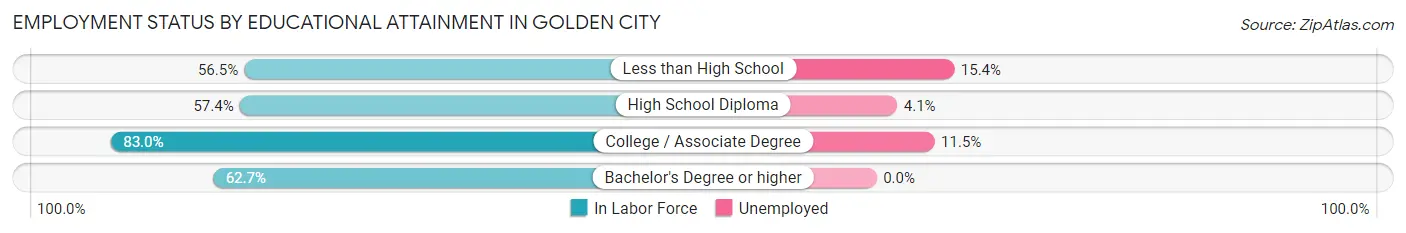
| Educational Attainment | In Labor Force | Unemployed |
| Less than High School | 13 (56.5%) | 4 (15.4%) |
| High School Diploma | 74 (57.4%) | 5 (4.1%) |
| College / Associate Degree | 78 (83.0%) | 11 (11.5%) |
| Bachelor's Degree or higher | 37 (62.7%) | 0 (0.0%) |
| Total | 202 (66.2%) | 21 (6.9%) |
Employment Occupations by Sex in Golden City
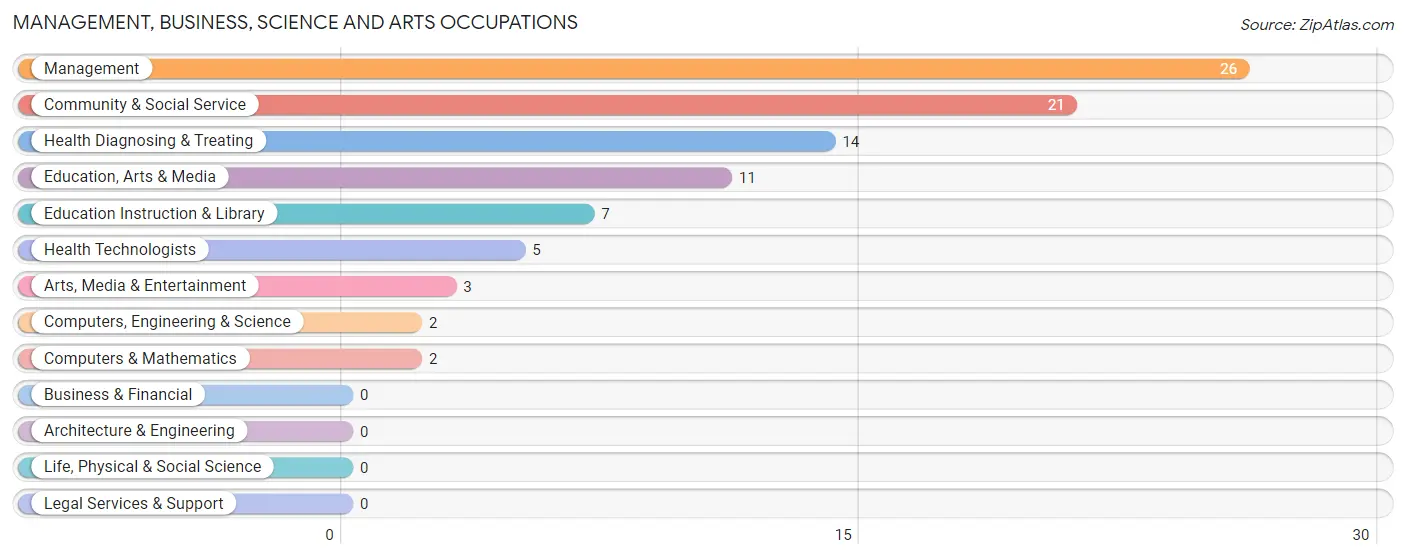
Management, Business, Science and Arts Occupations
The most common Management, Business, Science and Arts occupations in Golden City are Management (26 | 12.1%), Community & Social Service (21 | 9.8%), Health Diagnosing & Treating (14 | 6.5%), Education, Arts & Media (11 | 5.1%), and Education Instruction & Library (7 | 3.3%).
Management, Business, Science and Arts Occupations by Sex
Within the Management, Business, Science and Arts occupations in Golden City, the most male-oriented occupations are Arts, Media & Entertainment (100.0%), Management (84.6%), and Education Instruction & Library (28.6%), while the most female-oriented occupations are Computers, Engineering & Science (100.0%), Computers & Mathematics (100.0%), and Education, Arts & Media (100.0%).
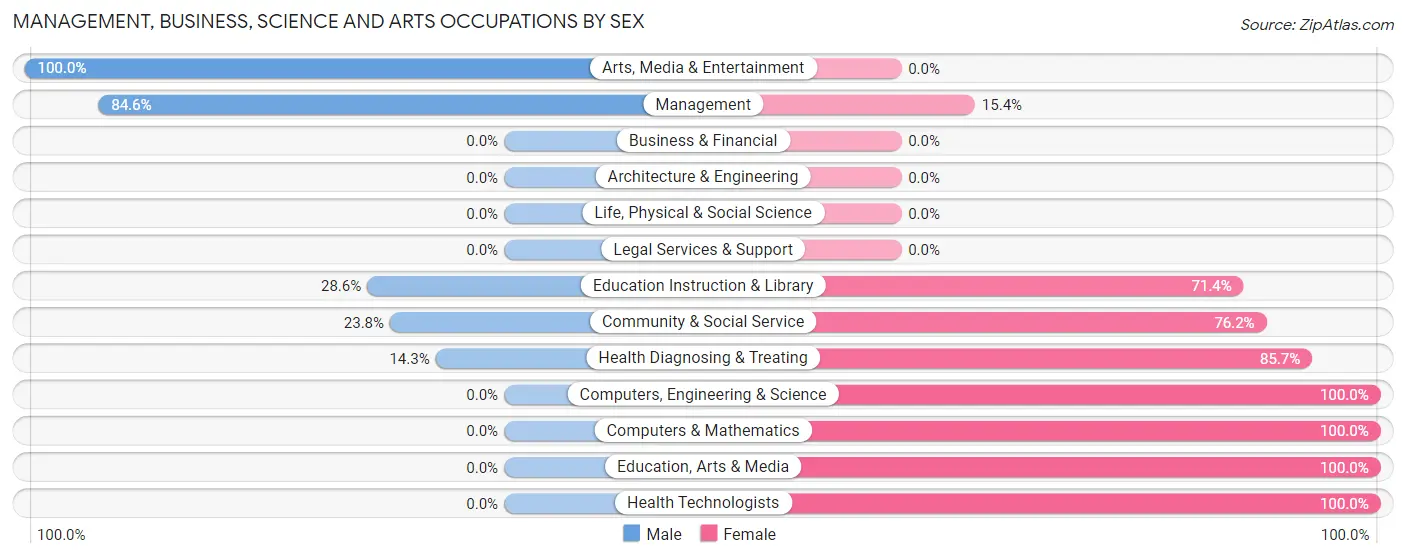
| Occupation | Male | Female |
| Management | 22 (84.6%) | 4 (15.4%) |
| Business & Financial | 0 (0.0%) | 0 (0.0%) |
| Computers, Engineering & Science | 0 (0.0%) | 2 (100.0%) |
| Computers & Mathematics | 0 (0.0%) | 2 (100.0%) |
| Architecture & Engineering | 0 (0.0%) | 0 (0.0%) |
| Life, Physical & Social Science | 0 (0.0%) | 0 (0.0%) |
| Community & Social Service | 5 (23.8%) | 16 (76.2%) |
| Education, Arts & Media | 0 (0.0%) | 11 (100.0%) |
| Legal Services & Support | 0 (0.0%) | 0 (0.0%) |
| Education Instruction & Library | 2 (28.6%) | 5 (71.4%) |
| Arts, Media & Entertainment | 3 (100.0%) | 0 (0.0%) |
| Health Diagnosing & Treating | 2 (14.3%) | 12 (85.7%) |
| Health Technologists | 0 (0.0%) | 5 (100.0%) |
| Total (Category) | 29 (46.0%) | 34 (54.0%) |
| Total (Overall) | 116 (54.2%) | 98 (45.8%) |
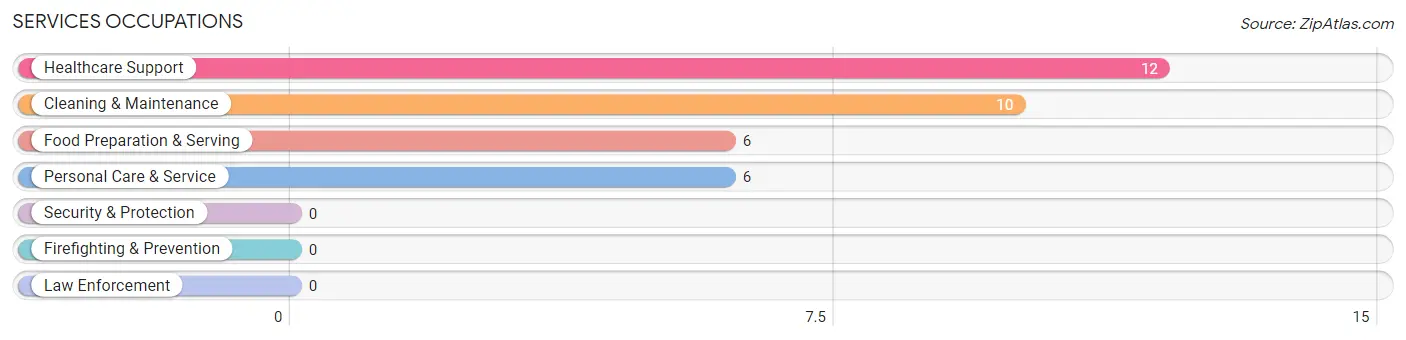
Services Occupations
The most common Services occupations in Golden City are Healthcare Support (12 | 5.6%), Cleaning & Maintenance (10 | 4.7%), Food Preparation & Serving (6 | 2.8%), and Personal Care & Service (6 | 2.8%).
Services Occupations by Sex
Within the Services occupations in Golden City, the most male-oriented occupations are Cleaning & Maintenance (80.0%), Personal Care & Service (50.0%), and Healthcare Support (25.0%), while the most female-oriented occupations are Food Preparation & Serving (100.0%), Healthcare Support (75.0%), and Personal Care & Service (50.0%).
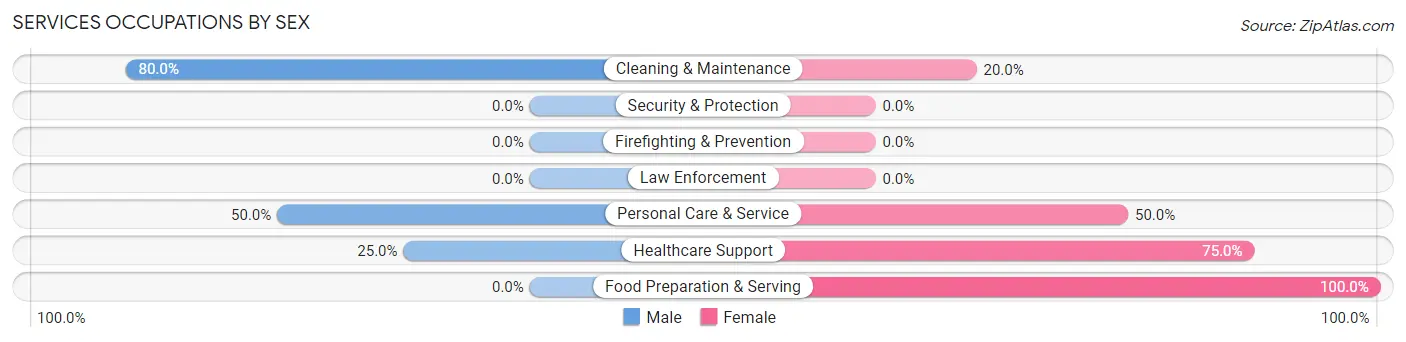
| Occupation | Male | Female |
| Healthcare Support | 3 (25.0%) | 9 (75.0%) |
| Security & Protection | 0 (0.0%) | 0 (0.0%) |
| Firefighting & Prevention | 0 (0.0%) | 0 (0.0%) |
| Law Enforcement | 0 (0.0%) | 0 (0.0%) |
| Food Preparation & Serving | 0 (0.0%) | 6 (100.0%) |
| Cleaning & Maintenance | 8 (80.0%) | 2 (20.0%) |
| Personal Care & Service | 3 (50.0%) | 3 (50.0%) |
| Total (Category) | 14 (41.2%) | 20 (58.8%) |
| Total (Overall) | 116 (54.2%) | 98 (45.8%) |
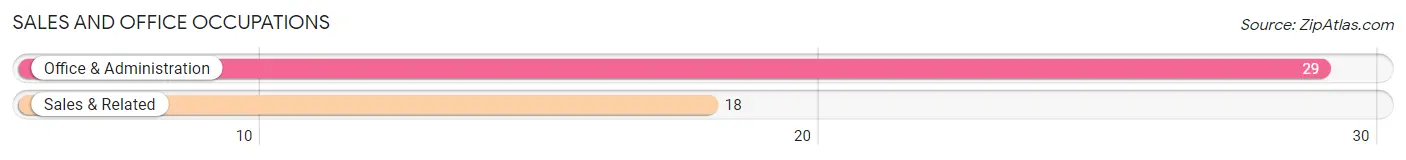
Sales and Office Occupations
The most common Sales and Office occupations in Golden City are Office & Administration (29 | 13.6%), and Sales & Related (18 | 8.4%).
Sales and Office Occupations by Sex
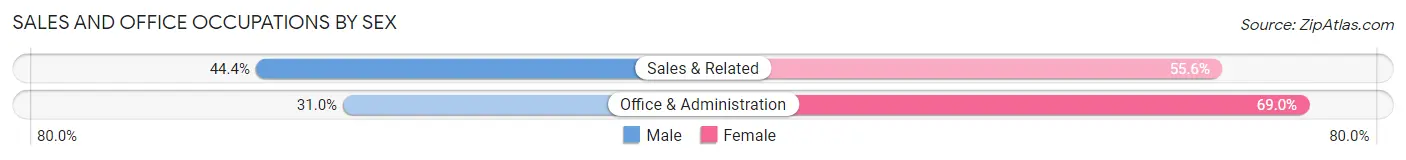
| Occupation | Male | Female |
| Sales & Related | 8 (44.4%) | 10 (55.6%) |
| Office & Administration | 9 (31.0%) | 20 (69.0%) |
| Total (Category) | 17 (36.2%) | 30 (63.8%) |
| Total (Overall) | 116 (54.2%) | 98 (45.8%) |
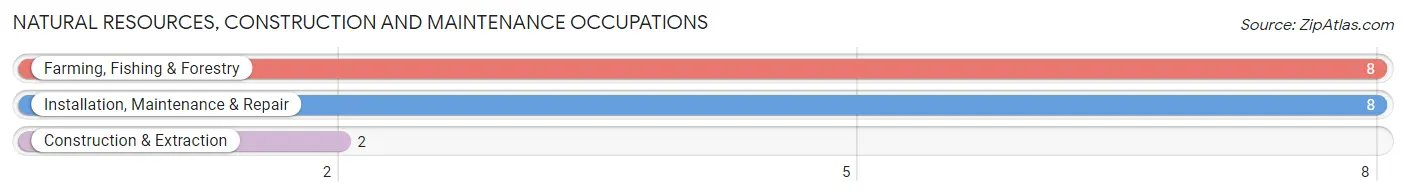
Natural Resources, Construction and Maintenance Occupations
The most common Natural Resources, Construction and Maintenance occupations in Golden City are Farming, Fishing & Forestry (8 | 3.7%), Installation, Maintenance & Repair (8 | 3.7%), and Construction & Extraction (2 | 0.9%).
Natural Resources, Construction and Maintenance Occupations by Sex
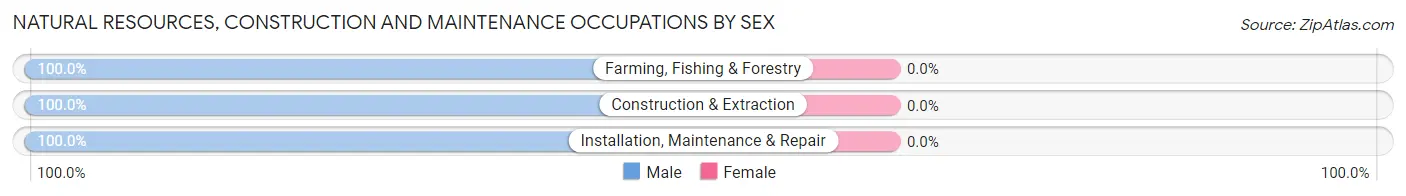
| Occupation | Male | Female |
| Farming, Fishing & Forestry | 8 (100.0%) | 0 (0.0%) |
| Construction & Extraction | 2 (100.0%) | 0 (0.0%) |
| Installation, Maintenance & Repair | 8 (100.0%) | 0 (0.0%) |
| Total (Category) | 18 (100.0%) | 0 (0.0%) |
| Total (Overall) | 116 (54.2%) | 98 (45.8%) |
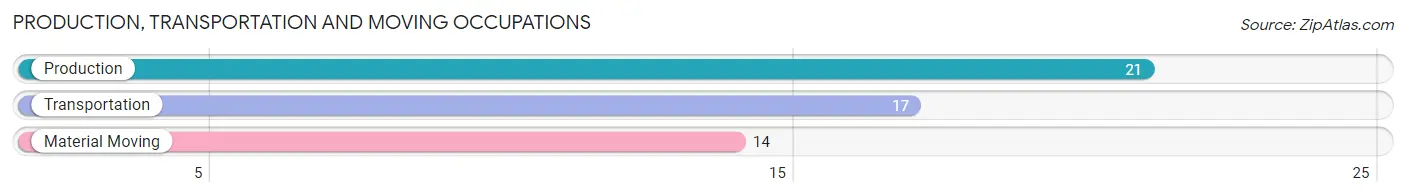
Production, Transportation and Moving Occupations
The most common Production, Transportation and Moving occupations in Golden City are Production (21 | 9.8%), Transportation (17 | 7.9%), and Material Moving (14 | 6.5%).
Production, Transportation and Moving Occupations by Sex
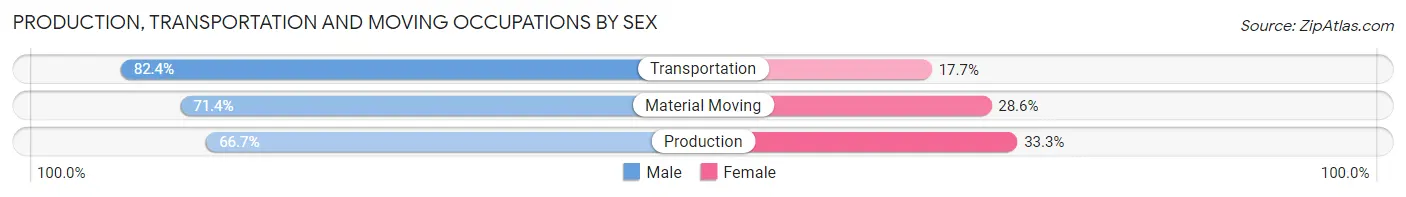
| Occupation | Male | Female |
| Production | 14 (66.7%) | 7 (33.3%) |
| Transportation | 14 (82.4%) | 3 (17.6%) |
| Material Moving | 10 (71.4%) | 4 (28.6%) |
| Total (Category) | 38 (73.1%) | 14 (26.9%) |
| Total (Overall) | 116 (54.2%) | 98 (45.8%) |
Employment Industries by Sex in Golden City
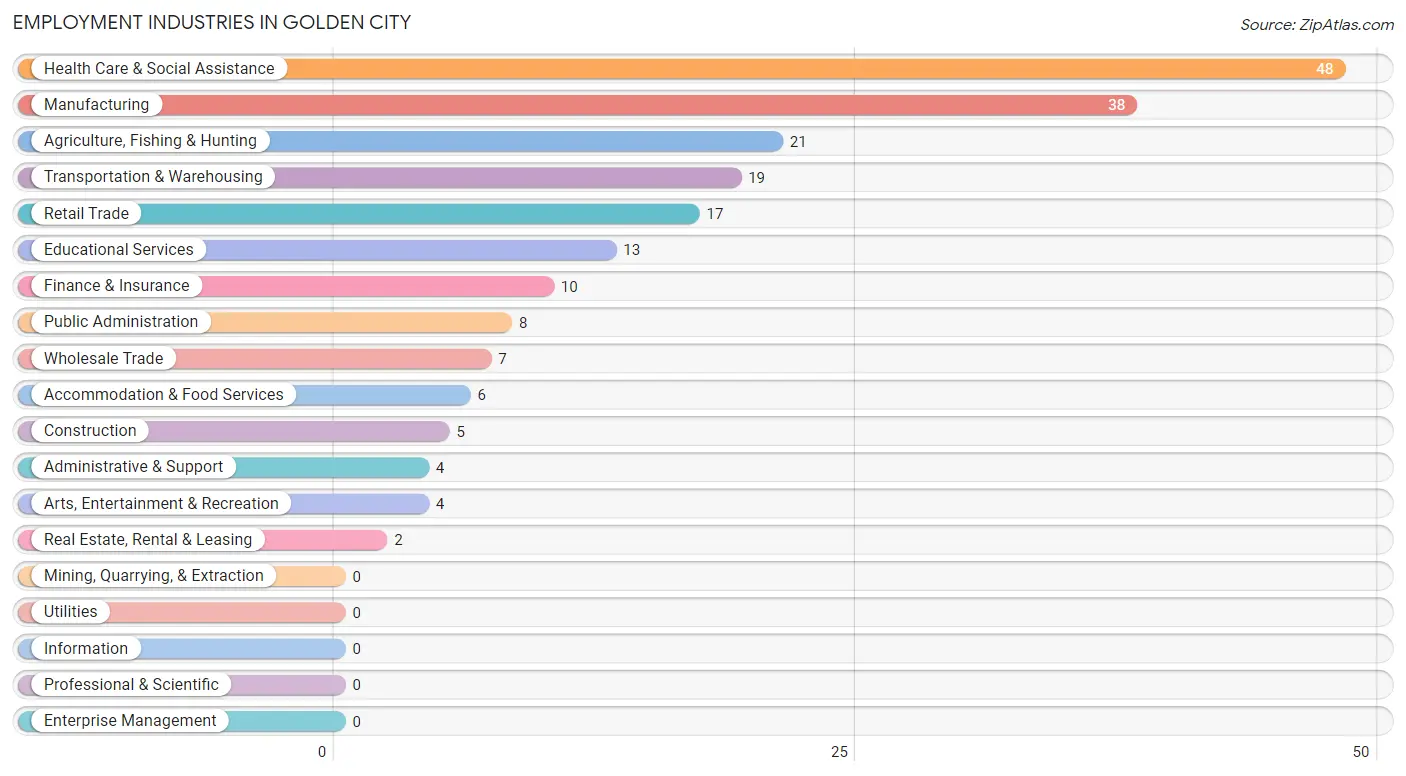
Employment Industries in Golden City
The major employment industries in Golden City include Health Care & Social Assistance (48 | 22.4%), Manufacturing (38 | 17.8%), Agriculture, Fishing & Hunting (21 | 9.8%), Transportation & Warehousing (19 | 8.9%), and Retail Trade (17 | 7.9%).
Employment Industries by Sex in Golden City
The Golden City industries that see more men than women are Agriculture, Fishing & Hunting (100.0%), Construction (100.0%), and Wholesale Trade (100.0%), whereas the industries that tend to have a higher number of women are Real Estate, Rental & Leasing (100.0%), Accommodation & Food Services (100.0%), and Health Care & Social Assistance (85.4%).
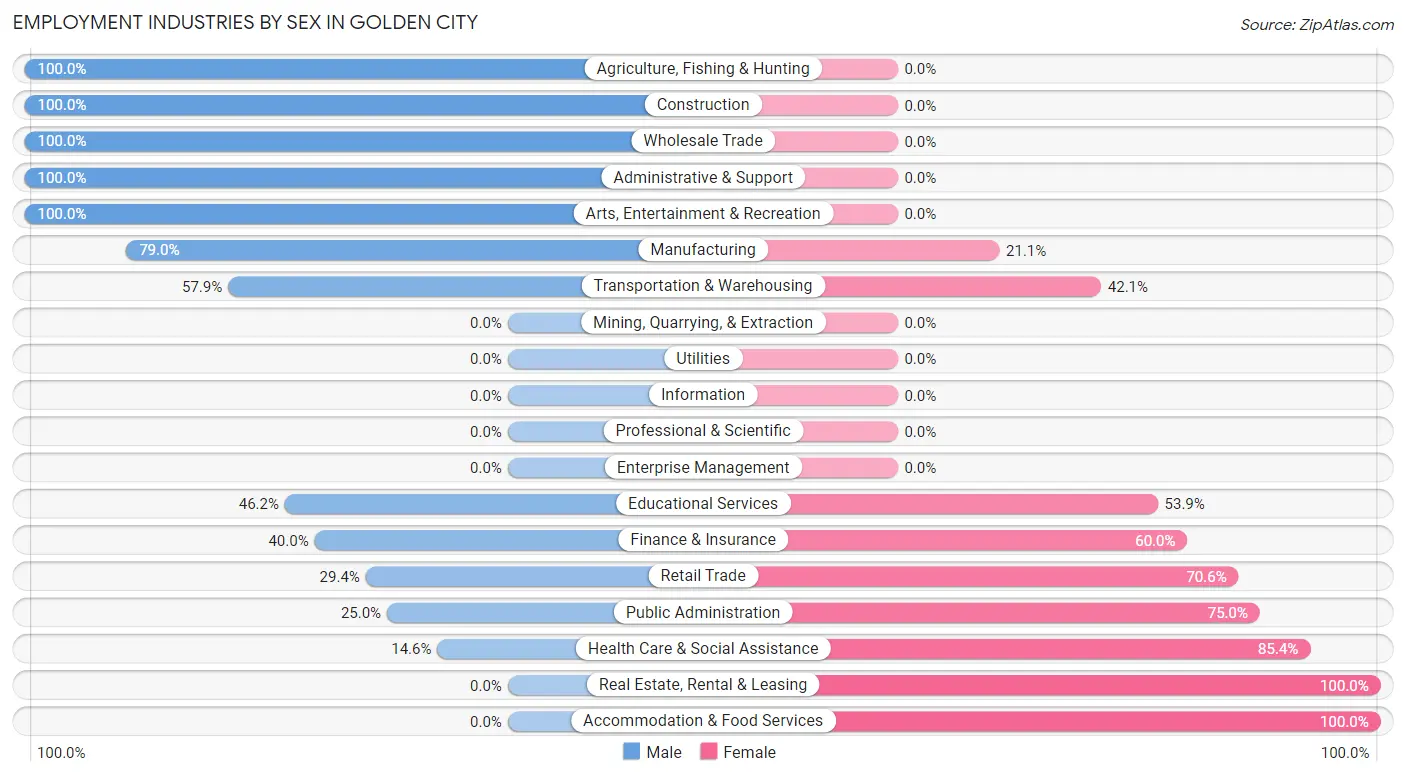
| Industry | Male | Female |
| Agriculture, Fishing & Hunting | 21 (100.0%) | 0 (0.0%) |
| Mining, Quarrying, & Extraction | 0 (0.0%) | 0 (0.0%) |
| Construction | 5 (100.0%) | 0 (0.0%) |
| Manufacturing | 30 (78.9%) | 8 (21.0%) |
| Wholesale Trade | 7 (100.0%) | 0 (0.0%) |
| Retail Trade | 5 (29.4%) | 12 (70.6%) |
| Transportation & Warehousing | 11 (57.9%) | 8 (42.1%) |
| Utilities | 0 (0.0%) | 0 (0.0%) |
| Information | 0 (0.0%) | 0 (0.0%) |
| Finance & Insurance | 4 (40.0%) | 6 (60.0%) |
| Real Estate, Rental & Leasing | 0 (0.0%) | 2 (100.0%) |
| Professional & Scientific | 0 (0.0%) | 0 (0.0%) |
| Enterprise Management | 0 (0.0%) | 0 (0.0%) |
| Administrative & Support | 4 (100.0%) | 0 (0.0%) |
| Educational Services | 6 (46.2%) | 7 (53.8%) |
| Health Care & Social Assistance | 7 (14.6%) | 41 (85.4%) |
| Arts, Entertainment & Recreation | 4 (100.0%) | 0 (0.0%) |
| Accommodation & Food Services | 0 (0.0%) | 6 (100.0%) |
| Public Administration | 2 (25.0%) | 6 (75.0%) |
| Total | 116 (54.2%) | 98 (45.8%) |
Education in Golden City
School Enrollment in Golden City
The most common levels of schooling among the 82 students in Golden City are elementary school (26 | 31.7%), middle school (25 | 30.5%), and high school (14 | 17.1%).
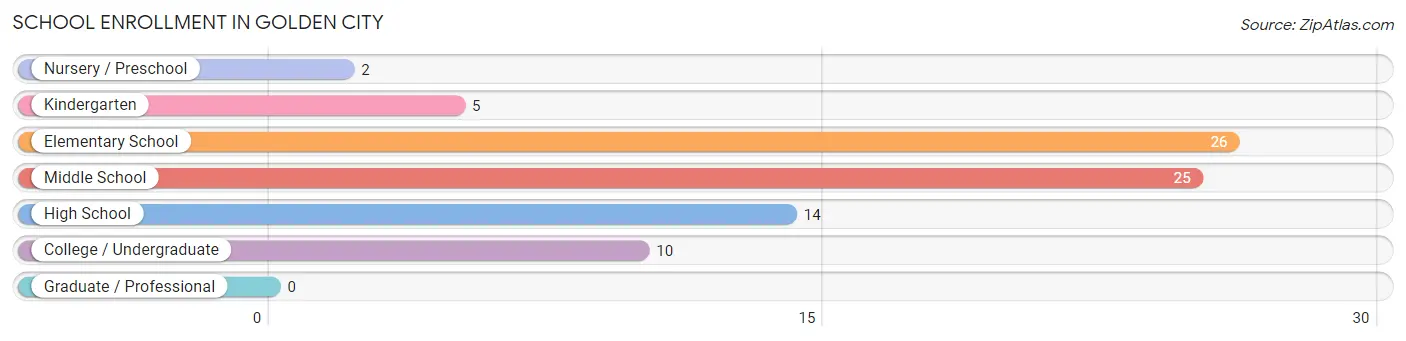
| School Level | # Students | % Students |
| Nursery / Preschool | 2 | 2.4% |
| Kindergarten | 5 | 6.1% |
| Elementary School | 26 | 31.7% |
| Middle School | 25 | 30.5% |
| High School | 14 | 17.1% |
| College / Undergraduate | 10 | 12.2% |
| Graduate / Professional | 0 | 0.0% |
| Total | 82 | 100.0% |
School Enrollment by Age by Funding Source in Golden City
Out of a total of 82 students who are enrolled in schools in Golden City, 19 (23.2%) attend a private institution, while the remaining 63 (76.8%) are enrolled in public schools. The age group of 25 to 34 year olds has the highest likelihood of being enrolled in private schools, with 2 (100.0% in the age bracket) enrolled. Conversely, the age group of 3 to 4 year olds has the lowest likelihood of being enrolled in a private school, with 2 (100.0% in the age bracket) attending a public institution.
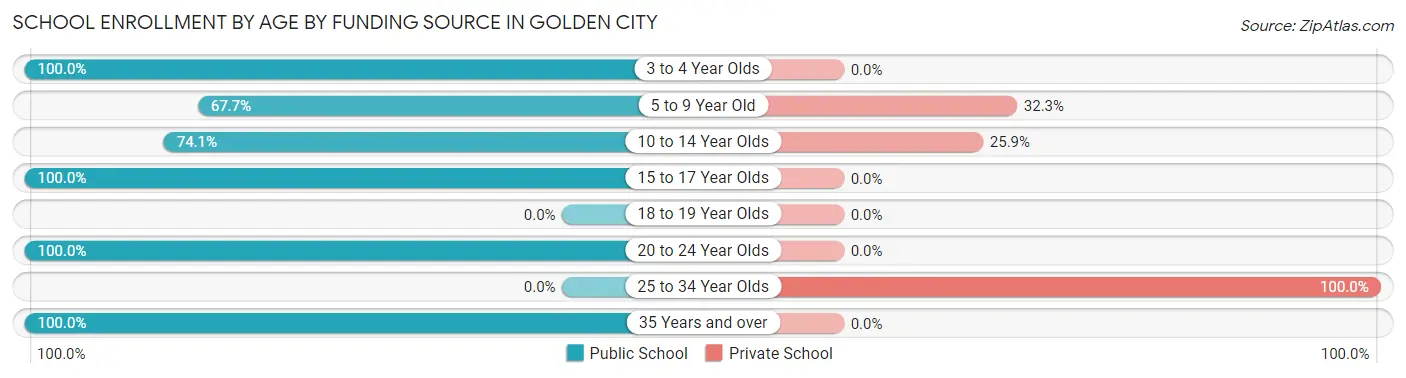
| Age Bracket | Public School | Private School |
| 3 to 4 Year Olds | 2 (100.0%) | 0 (0.0%) |
| 5 to 9 Year Old | 21 (67.7%) | 10 (32.3%) |
| 10 to 14 Year Olds | 20 (74.1%) | 7 (25.9%) |
| 15 to 17 Year Olds | 12 (100.0%) | 0 (0.0%) |
| 18 to 19 Year Olds | 0 (0.0%) | 0 (0.0%) |
| 20 to 24 Year Olds | 7 (100.0%) | 0 (0.0%) |
| 25 to 34 Year Olds | 0 (0.0%) | 2 (100.0%) |
| 35 Years and over | 1 (100.0%) | 0 (0.0%) |
| Total | 63 (76.8%) | 19 (23.2%) |
Educational Attainment by Field of Study in Golden City
Education (25 | 23.6%), arts & humanities (22 | 20.7%), physical & health sciences (17 | 16.0%), business (15 | 14.1%), and bio, nature & agricultural (10 | 9.4%) are the most common fields of study among 106 individuals in Golden City who have obtained a bachelor's degree or higher.
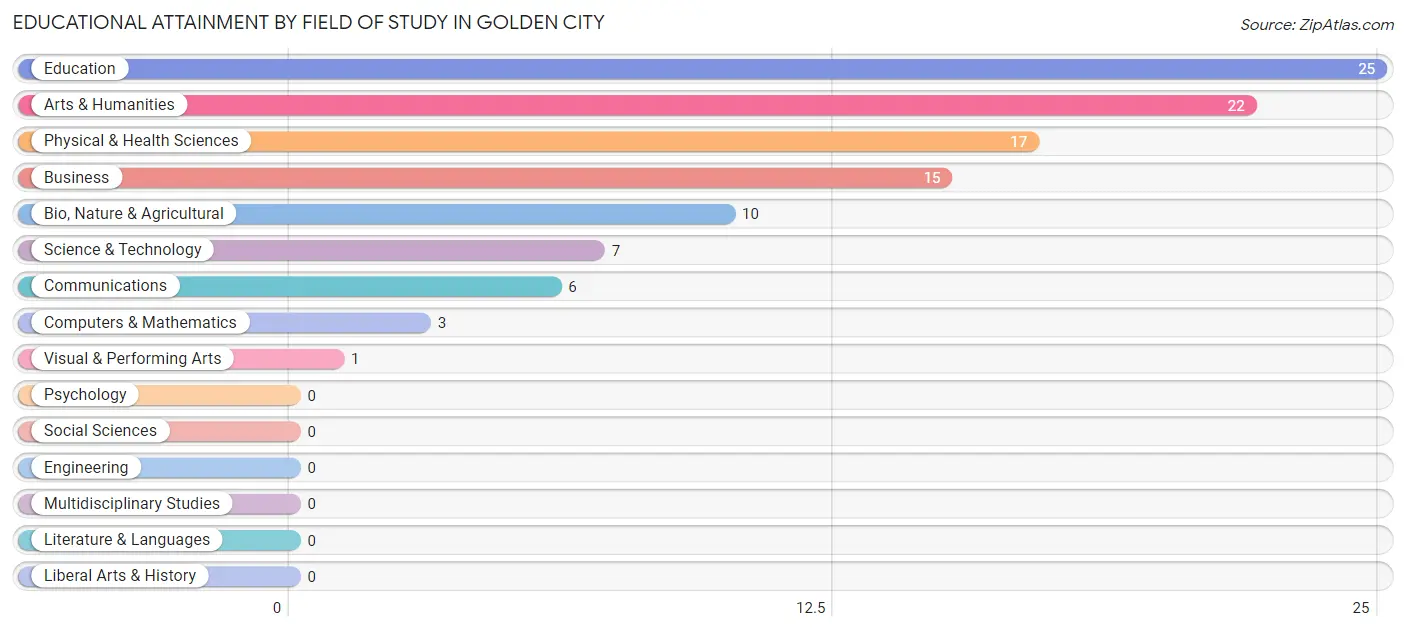
| Field of Study | # Graduates | % Graduates |
| Computers & Mathematics | 3 | 2.8% |
| Bio, Nature & Agricultural | 10 | 9.4% |
| Physical & Health Sciences | 17 | 16.0% |
| Psychology | 0 | 0.0% |
| Social Sciences | 0 | 0.0% |
| Engineering | 0 | 0.0% |
| Multidisciplinary Studies | 0 | 0.0% |
| Science & Technology | 7 | 6.6% |
| Business | 15 | 14.1% |
| Education | 25 | 23.6% |
| Literature & Languages | 0 | 0.0% |
| Liberal Arts & History | 0 | 0.0% |
| Visual & Performing Arts | 1 | 0.9% |
| Communications | 6 | 5.7% |
| Arts & Humanities | 22 | 20.7% |
| Total | 106 | 100.0% |
Transportation & Commute in Golden City
Vehicle Availability by Sex in Golden City
The most prevalent vehicle ownership categories in Golden City are males with 3 vehicles (39, accounting for 34.5%) and females with 3 vehicles (34, making up 41.0%).
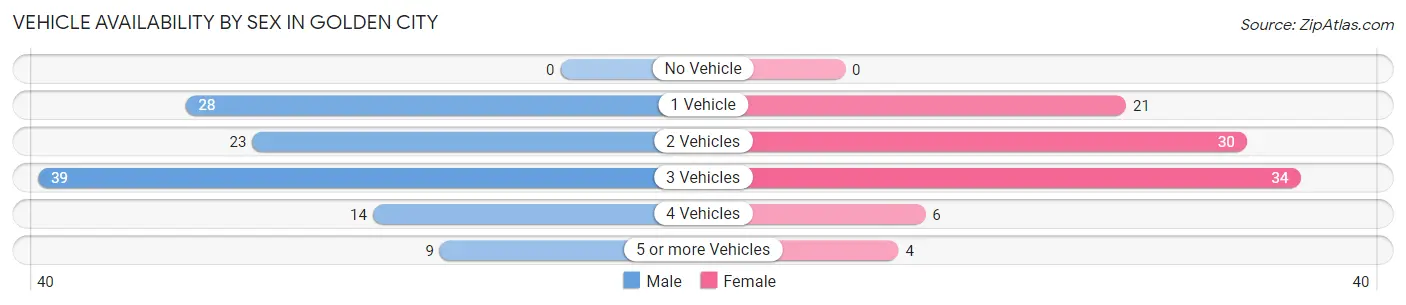
| Vehicles Available | Male | Female |
| No Vehicle | 0 (0.0%) | 0 (0.0%) |
| 1 Vehicle | 28 (24.8%) | 21 (22.1%) |
| 2 Vehicles | 23 (20.3%) | 30 (31.6%) |
| 3 Vehicles | 39 (34.5%) | 34 (35.8%) |
| 4 Vehicles | 14 (12.4%) | 6 (6.3%) |
| 5 or more Vehicles | 9 (8.0%) | 4 (4.2%) |
| Total | 113 (100.0%) | 95 (100.0%) |
Commute Time in Golden City
The most frequently occuring commute durations in Golden City are 5 to 9 minutes (39 commuters, 19.3%), 20 to 24 minutes (34 commuters, 16.8%), and less than 5 minutes (23 commuters, 11.4%).
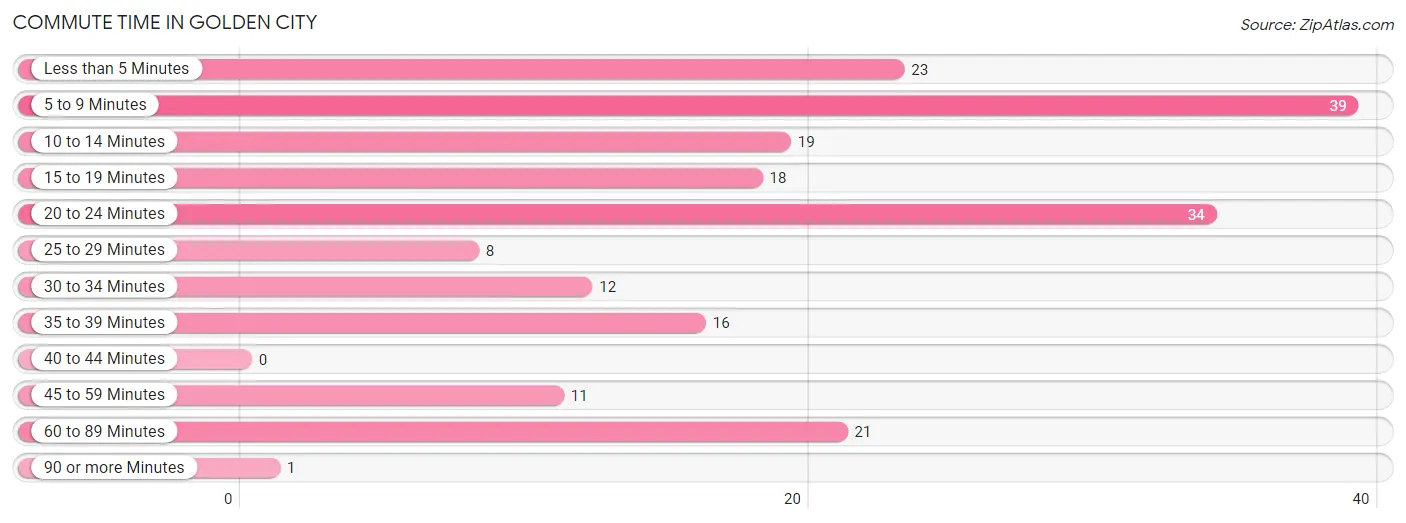
| Commute Time | # Commuters | % Commuters |
| Less than 5 Minutes | 23 | 11.4% |
| 5 to 9 Minutes | 39 | 19.3% |
| 10 to 14 Minutes | 19 | 9.4% |
| 15 to 19 Minutes | 18 | 8.9% |
| 20 to 24 Minutes | 34 | 16.8% |
| 25 to 29 Minutes | 8 | 4.0% |
| 30 to 34 Minutes | 12 | 5.9% |
| 35 to 39 Minutes | 16 | 7.9% |
| 40 to 44 Minutes | 0 | 0.0% |
| 45 to 59 Minutes | 11 | 5.4% |
| 60 to 89 Minutes | 21 | 10.4% |
| 90 or more Minutes | 1 | 0.5% |
Commute Time by Sex in Golden City
The most common commute times in Golden City are 5 to 9 minutes (27 commuters, 24.8%) for males and 20 to 24 minutes (28 commuters, 30.1%) for females.
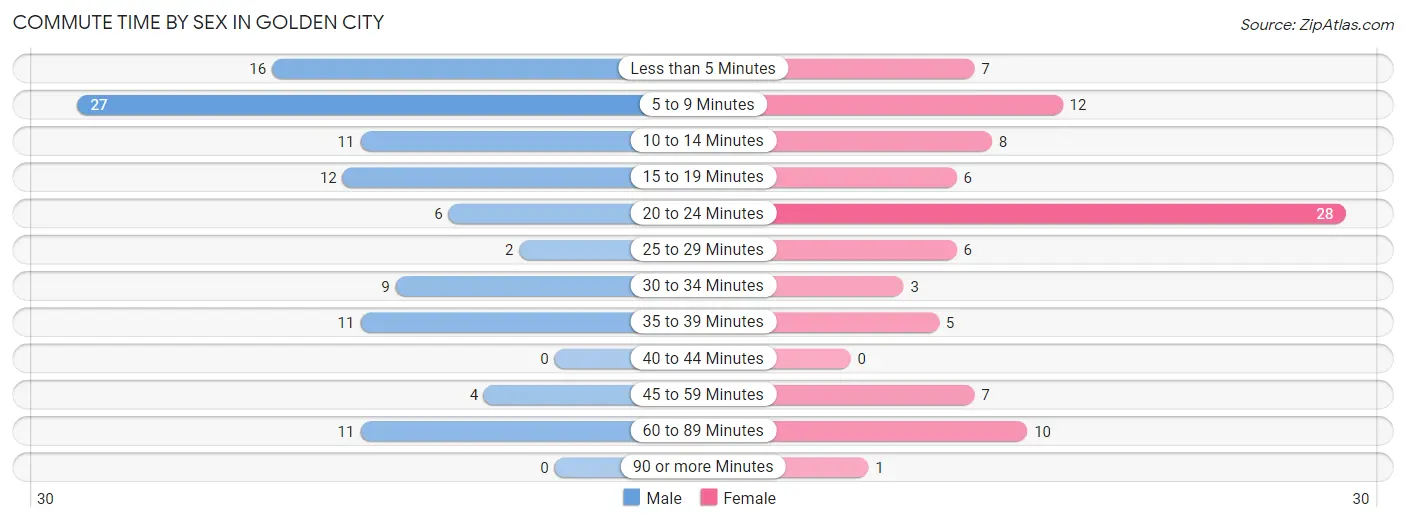
| Commute Time | Male | Female |
| Less than 5 Minutes | 16 (14.7%) | 7 (7.5%) |
| 5 to 9 Minutes | 27 (24.8%) | 12 (12.9%) |
| 10 to 14 Minutes | 11 (10.1%) | 8 (8.6%) |
| 15 to 19 Minutes | 12 (11.0%) | 6 (6.5%) |
| 20 to 24 Minutes | 6 (5.5%) | 28 (30.1%) |
| 25 to 29 Minutes | 2 (1.8%) | 6 (6.5%) |
| 30 to 34 Minutes | 9 (8.3%) | 3 (3.2%) |
| 35 to 39 Minutes | 11 (10.1%) | 5 (5.4%) |
| 40 to 44 Minutes | 0 (0.0%) | 0 (0.0%) |
| 45 to 59 Minutes | 4 (3.7%) | 7 (7.5%) |
| 60 to 89 Minutes | 11 (10.1%) | 10 (10.7%) |
| 90 or more Minutes | 0 (0.0%) | 1 (1.1%) |
Time of Departure to Work by Sex in Golden City
The most frequent times of departure to work in Golden City are 7:30 AM to 7:59 AM (26, 23.8%) for males and 7:00 AM to 7:29 AM (21, 22.6%) for females.
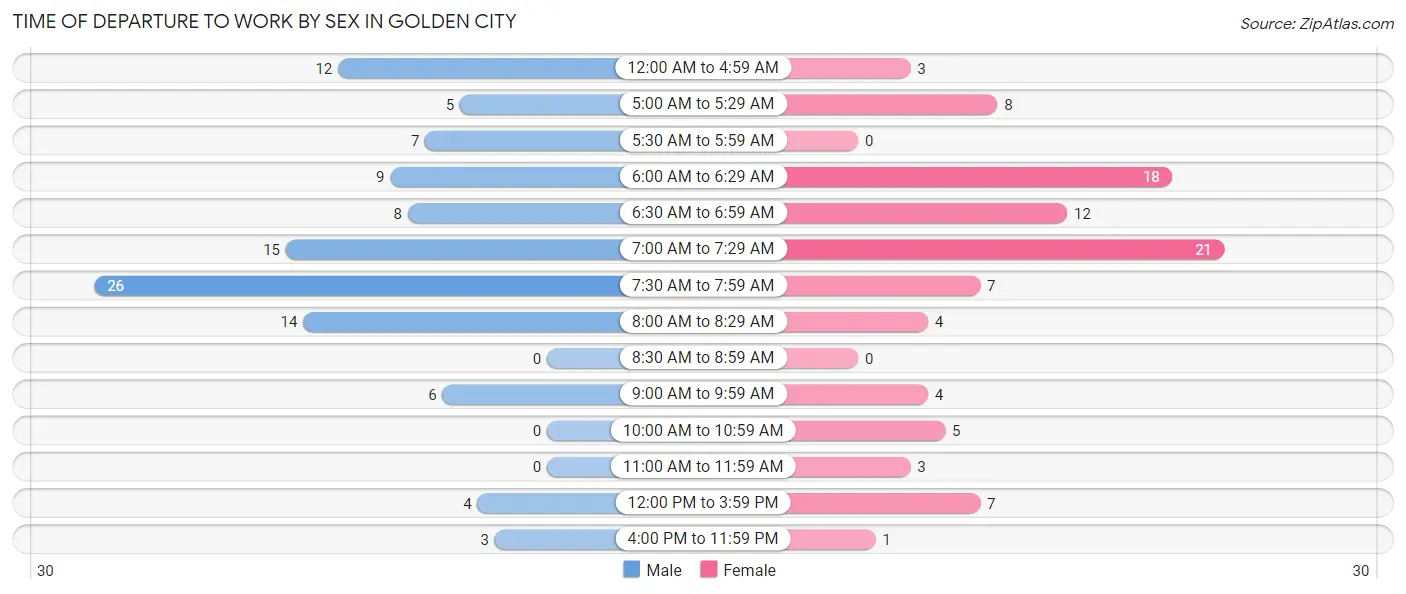
| Time of Departure | Male | Female |
| 12:00 AM to 4:59 AM | 12 (11.0%) | 3 (3.2%) |
| 5:00 AM to 5:29 AM | 5 (4.6%) | 8 (8.6%) |
| 5:30 AM to 5:59 AM | 7 (6.4%) | 0 (0.0%) |
| 6:00 AM to 6:29 AM | 9 (8.3%) | 18 (19.4%) |
| 6:30 AM to 6:59 AM | 8 (7.3%) | 12 (12.9%) |
| 7:00 AM to 7:29 AM | 15 (13.8%) | 21 (22.6%) |
| 7:30 AM to 7:59 AM | 26 (23.8%) | 7 (7.5%) |
| 8:00 AM to 8:29 AM | 14 (12.8%) | 4 (4.3%) |
| 8:30 AM to 8:59 AM | 0 (0.0%) | 0 (0.0%) |
| 9:00 AM to 9:59 AM | 6 (5.5%) | 4 (4.3%) |
| 10:00 AM to 10:59 AM | 0 (0.0%) | 5 (5.4%) |
| 11:00 AM to 11:59 AM | 0 (0.0%) | 3 (3.2%) |
| 12:00 PM to 3:59 PM | 4 (3.7%) | 7 (7.5%) |
| 4:00 PM to 11:59 PM | 3 (2.8%) | 1 (1.1%) |
| Total | 109 (100.0%) | 93 (100.0%) |
Housing Occupancy in Golden City
Occupancy by Ownership in Golden City
Of the total 287 dwellings in Golden City, owner-occupied units account for 211 (73.5%), while renter-occupied units make up 76 (26.5%).
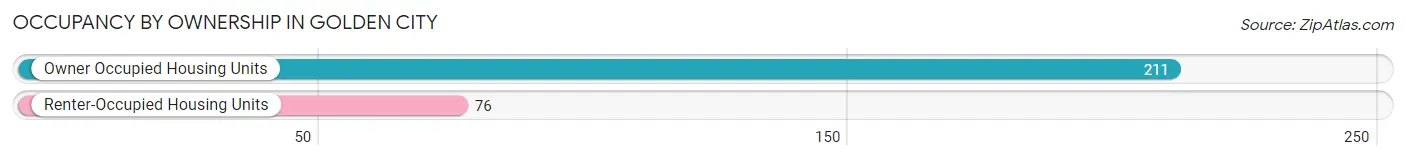
| Occupancy | # Housing Units | % Housing Units |
| Owner Occupied Housing Units | 211 | 73.5% |
| Renter-Occupied Housing Units | 76 | 26.5% |
| Total Occupied Housing Units | 287 | 100.0% |
Occupancy by Household Size in Golden City
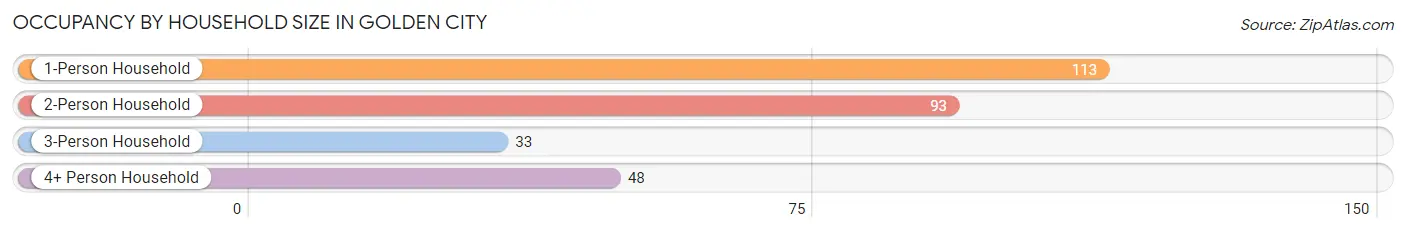
| Household Size | # Housing Units | % Housing Units |
| 1-Person Household | 113 | 39.4% |
| 2-Person Household | 93 | 32.4% |
| 3-Person Household | 33 | 11.5% |
| 4+ Person Household | 48 | 16.7% |
| Total Housing Units | 287 | 100.0% |
Occupancy by Ownership by Household Size in Golden City
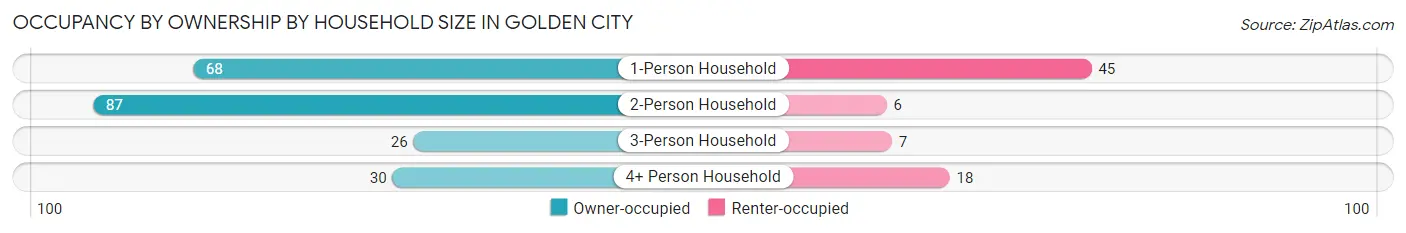
| Household Size | Owner-occupied | Renter-occupied |
| 1-Person Household | 68 (60.2%) | 45 (39.8%) |
| 2-Person Household | 87 (93.5%) | 6 (6.5%) |
| 3-Person Household | 26 (78.8%) | 7 (21.2%) |
| 4+ Person Household | 30 (62.5%) | 18 (37.5%) |
| Total Housing Units | 211 (73.5%) | 76 (26.5%) |
Occupancy by Educational Attainment in Golden City
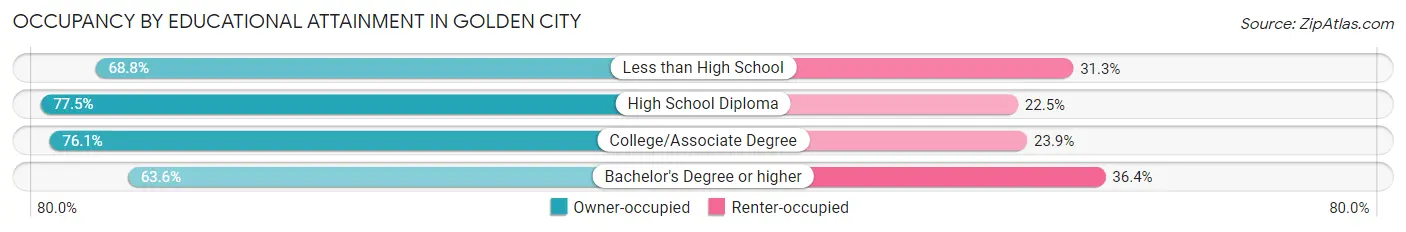
| Household Size | Owner-occupied | Renter-occupied |
| Less than High School | 22 (68.8%) | 10 (31.2%) |
| High School Diploma | 100 (77.5%) | 29 (22.5%) |
| College/Associate Degree | 54 (76.1%) | 17 (23.9%) |
| Bachelor's Degree or higher | 35 (63.6%) | 20 (36.4%) |
Occupancy by Age of Householder in Golden City
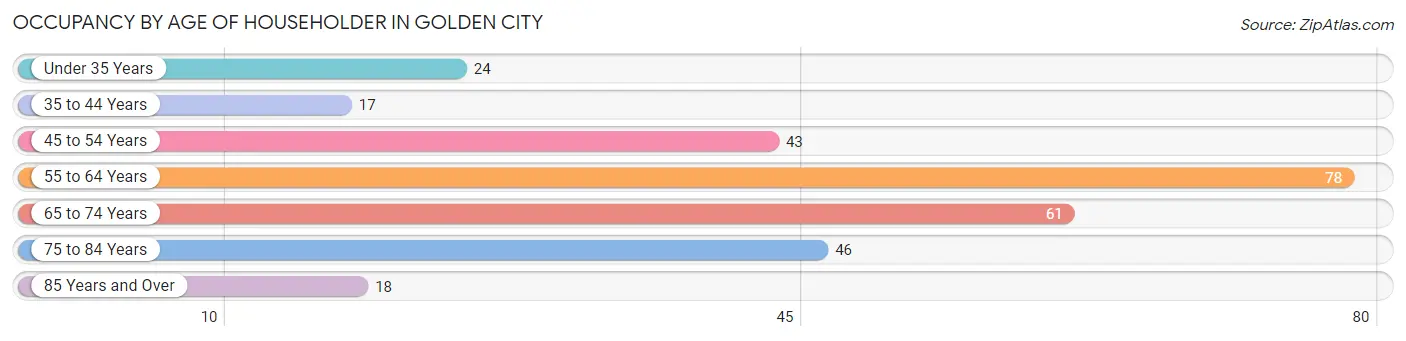
| Age Bracket | # Households | % Households |
| Under 35 Years | 24 | 8.4% |
| 35 to 44 Years | 17 | 5.9% |
| 45 to 54 Years | 43 | 15.0% |
| 55 to 64 Years | 78 | 27.2% |
| 65 to 74 Years | 61 | 21.2% |
| 75 to 84 Years | 46 | 16.0% |
| 85 Years and Over | 18 | 6.3% |
| Total | 287 | 100.0% |
Housing Finances in Golden City
Median Income by Occupancy in Golden City
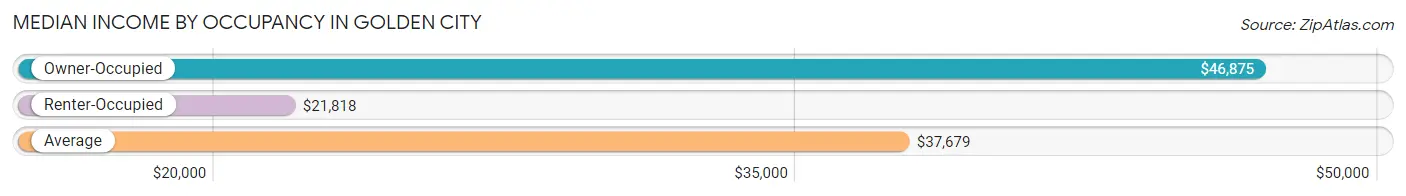
| Occupancy Type | # Households | Median Income |
| Owner-Occupied | 211 (73.5%) | $46,875 |
| Renter-Occupied | 76 (26.5%) | $21,818 |
| Average | 287 (100.0%) | $37,679 |
Occupancy by Householder Income Bracket in Golden City
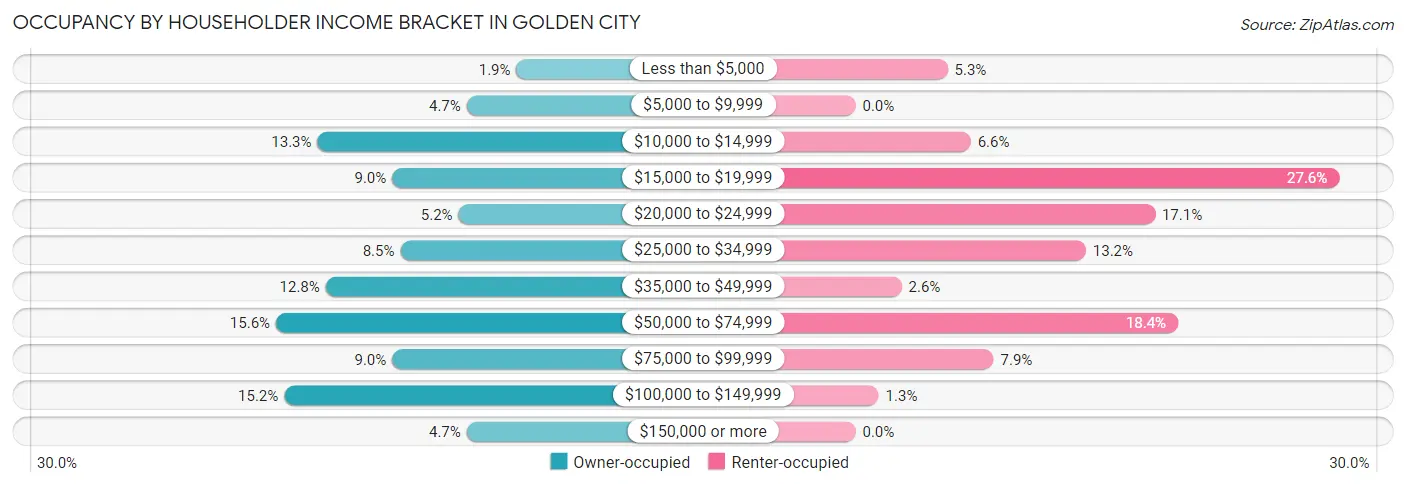
| Income Bracket | Owner-occupied | Renter-occupied |
| Less than $5,000 | 4 (1.9%) | 4 (5.3%) |
| $5,000 to $9,999 | 10 (4.7%) | 0 (0.0%) |
| $10,000 to $14,999 | 28 (13.3%) | 5 (6.6%) |
| $15,000 to $19,999 | 19 (9.0%) | 21 (27.6%) |
| $20,000 to $24,999 | 11 (5.2%) | 13 (17.1%) |
| $25,000 to $34,999 | 18 (8.5%) | 10 (13.2%) |
| $35,000 to $49,999 | 27 (12.8%) | 2 (2.6%) |
| $50,000 to $74,999 | 33 (15.6%) | 14 (18.4%) |
| $75,000 to $99,999 | 19 (9.0%) | 6 (7.9%) |
| $100,000 to $149,999 | 32 (15.2%) | 1 (1.3%) |
| $150,000 or more | 10 (4.7%) | 0 (0.0%) |
| Total | 211 (100.0%) | 76 (100.0%) |
Monthly Housing Cost Tiers in Golden City
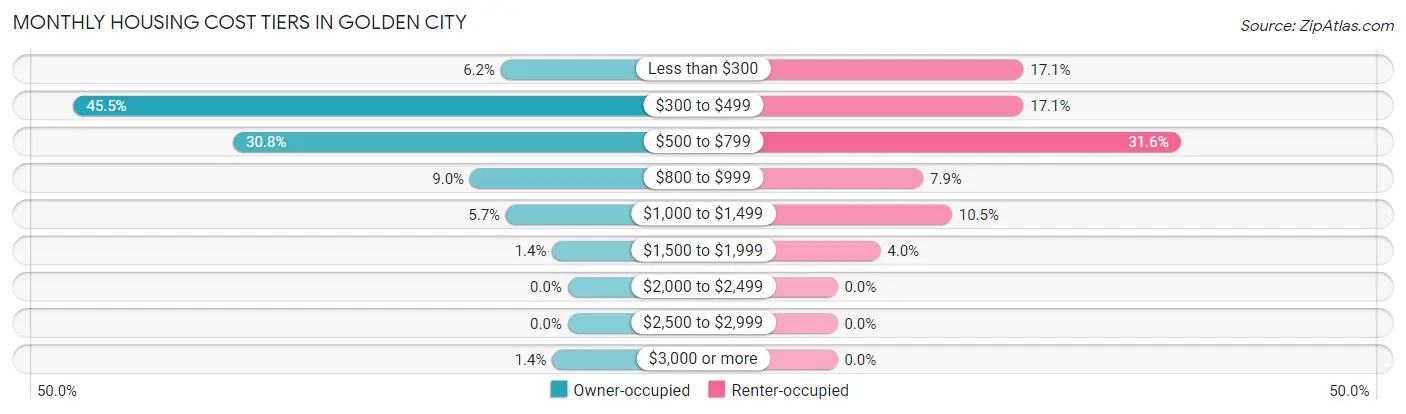
| Monthly Cost | Owner-occupied | Renter-occupied |
| Less than $300 | 13 (6.2%) | 13 (17.1%) |
| $300 to $499 | 96 (45.5%) | 13 (17.1%) |
| $500 to $799 | 65 (30.8%) | 24 (31.6%) |
| $800 to $999 | 19 (9.0%) | 6 (7.9%) |
| $1,000 to $1,499 | 12 (5.7%) | 8 (10.5%) |
| $1,500 to $1,999 | 3 (1.4%) | 3 (4.0%) |
| $2,000 to $2,499 | 0 (0.0%) | 0 (0.0%) |
| $2,500 to $2,999 | 0 (0.0%) | 0 (0.0%) |
| $3,000 or more | 3 (1.4%) | 0 (0.0%) |
| Total | 211 (100.0%) | 76 (100.0%) |
Physical Housing Characteristics in Golden City
Housing Structures in Golden City
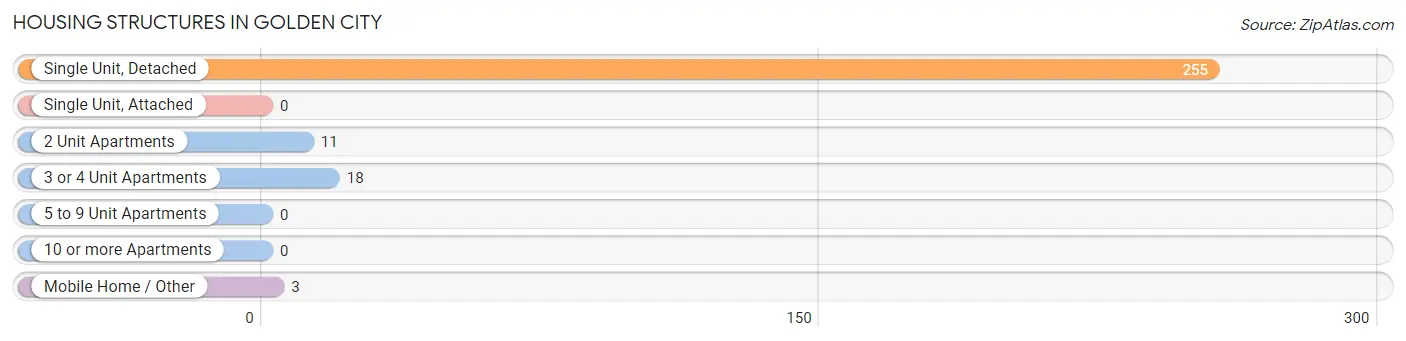
| Structure Type | # Housing Units | % Housing Units |
| Single Unit, Detached | 255 | 88.8% |
| Single Unit, Attached | 0 | 0.0% |
| 2 Unit Apartments | 11 | 3.8% |
| 3 or 4 Unit Apartments | 18 | 6.3% |
| 5 to 9 Unit Apartments | 0 | 0.0% |
| 10 or more Apartments | 0 | 0.0% |
| Mobile Home / Other | 3 | 1.1% |
| Total | 287 | 100.0% |
Housing Structures by Occupancy in Golden City
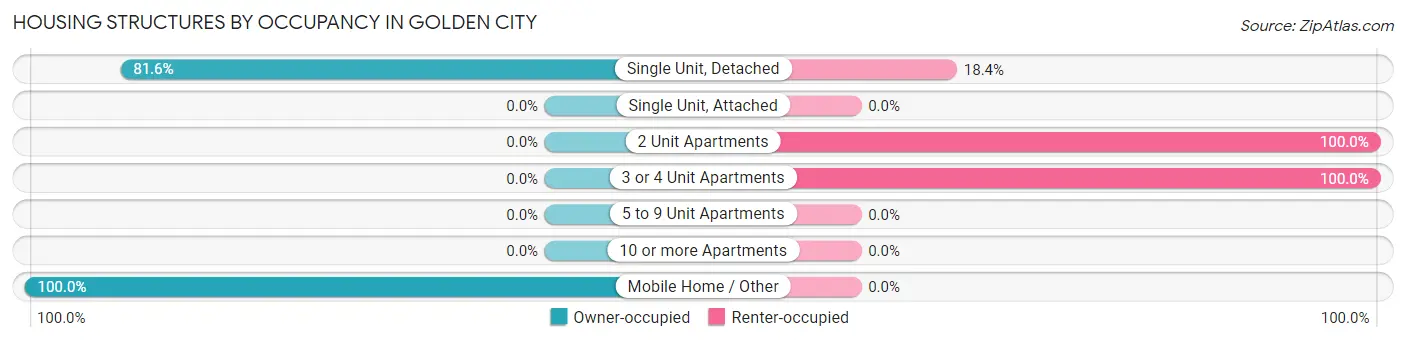
| Structure Type | Owner-occupied | Renter-occupied |
| Single Unit, Detached | 208 (81.6%) | 47 (18.4%) |
| Single Unit, Attached | 0 (0.0%) | 0 (0.0%) |
| 2 Unit Apartments | 0 (0.0%) | 11 (100.0%) |
| 3 or 4 Unit Apartments | 0 (0.0%) | 18 (100.0%) |
| 5 to 9 Unit Apartments | 0 (0.0%) | 0 (0.0%) |
| 10 or more Apartments | 0 (0.0%) | 0 (0.0%) |
| Mobile Home / Other | 3 (100.0%) | 0 (0.0%) |
| Total | 211 (73.5%) | 76 (26.5%) |
Housing Structures by Number of Rooms in Golden City
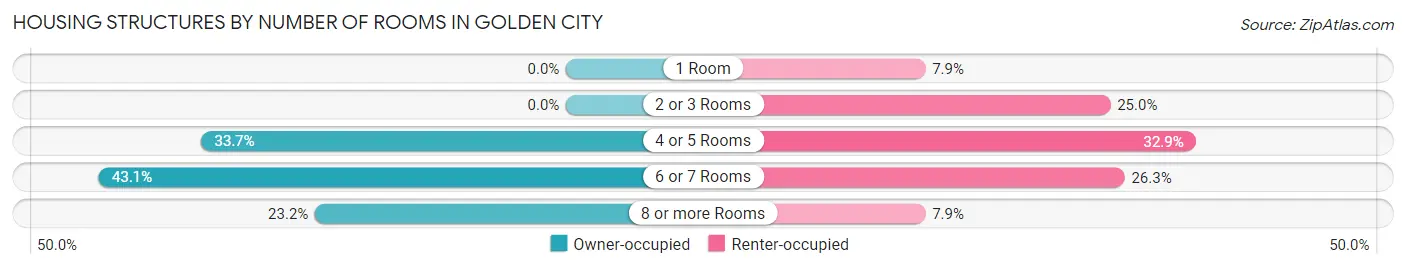
| Number of Rooms | Owner-occupied | Renter-occupied |
| 1 Room | 0 (0.0%) | 6 (7.9%) |
| 2 or 3 Rooms | 0 (0.0%) | 19 (25.0%) |
| 4 or 5 Rooms | 71 (33.7%) | 25 (32.9%) |
| 6 or 7 Rooms | 91 (43.1%) | 20 (26.3%) |
| 8 or more Rooms | 49 (23.2%) | 6 (7.9%) |
| Total | 211 (100.0%) | 76 (100.0%) |
Housing Structure by Heating Type in Golden City
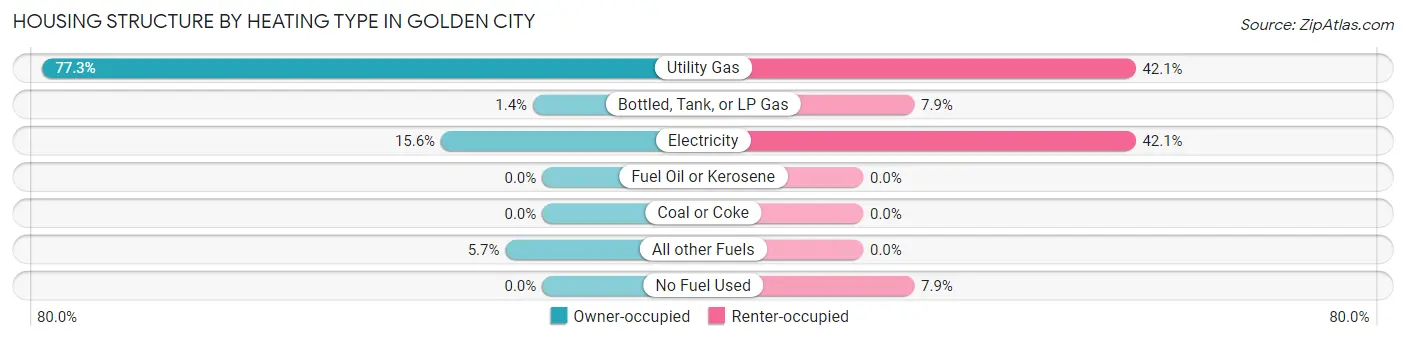
| Heating Type | Owner-occupied | Renter-occupied |
| Utility Gas | 163 (77.2%) | 32 (42.1%) |
| Bottled, Tank, or LP Gas | 3 (1.4%) | 6 (7.9%) |
| Electricity | 33 (15.6%) | 32 (42.1%) |
| Fuel Oil or Kerosene | 0 (0.0%) | 0 (0.0%) |
| Coal or Coke | 0 (0.0%) | 0 (0.0%) |
| All other Fuels | 12 (5.7%) | 0 (0.0%) |
| No Fuel Used | 0 (0.0%) | 6 (7.9%) |
| Total | 211 (100.0%) | 76 (100.0%) |
Household Vehicle Usage in Golden City
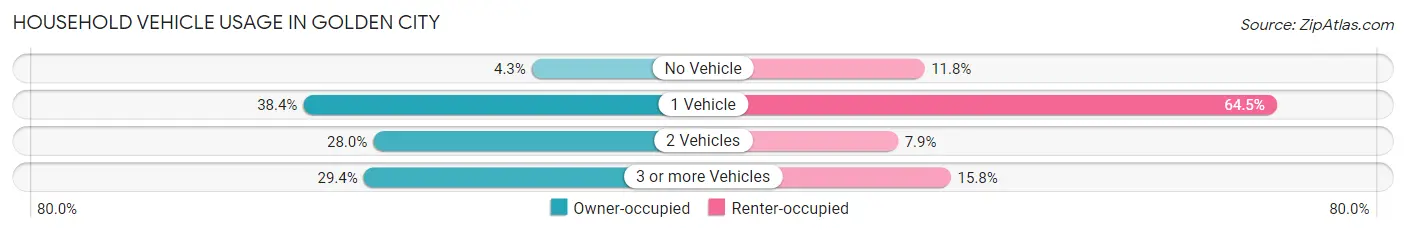
| Vehicles per Household | Owner-occupied | Renter-occupied |
| No Vehicle | 9 (4.3%) | 9 (11.8%) |
| 1 Vehicle | 81 (38.4%) | 49 (64.5%) |
| 2 Vehicles | 59 (28.0%) | 6 (7.9%) |
| 3 or more Vehicles | 62 (29.4%) | 12 (15.8%) |
| Total | 211 (100.0%) | 76 (100.0%) |
Real Estate & Mortgages in Golden City
Real Estate and Mortgage Overview in Golden City
| Characteristic | Without Mortgage | With Mortgage |
| Housing Units | 136 | 75 |
| Median Property Value | $63,500 | $98,100 |
| Median Household Income | $47,500 | $0 |
| Monthly Housing Costs | $433 | $3 |
| Real Estate Taxes | $625 | $0 |
Property Value by Mortgage Status in Golden City
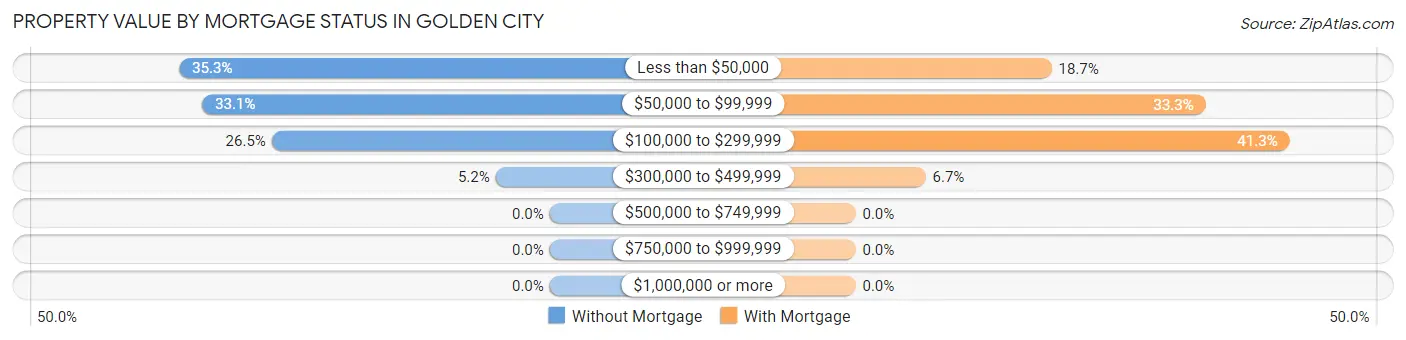
| Property Value | Without Mortgage | With Mortgage |
| Less than $50,000 | 48 (35.3%) | 14 (18.7%) |
| $50,000 to $99,999 | 45 (33.1%) | 25 (33.3%) |
| $100,000 to $299,999 | 36 (26.5%) | 31 (41.3%) |
| $300,000 to $499,999 | 7 (5.1%) | 5 (6.7%) |
| $500,000 to $749,999 | 0 (0.0%) | 0 (0.0%) |
| $750,000 to $999,999 | 0 (0.0%) | 0 (0.0%) |
| $1,000,000 or more | 0 (0.0%) | 0 (0.0%) |
| Total | 136 (100.0%) | 75 (100.0%) |
Household Income by Mortgage Status in Golden City
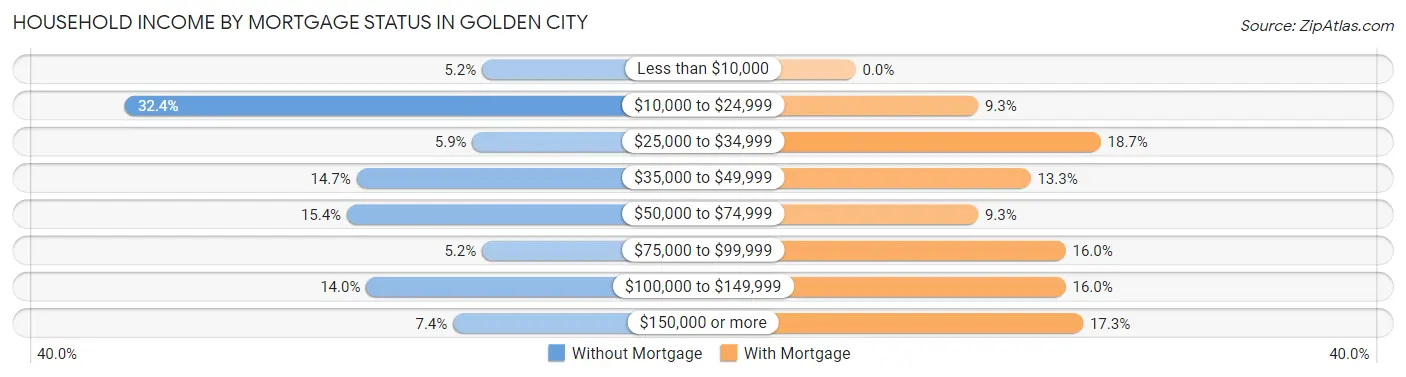
| Household Income | Without Mortgage | With Mortgage |
| Less than $10,000 | 7 (5.1%) | 0 (0.0%) |
| $10,000 to $24,999 | 44 (32.4%) | 7 (9.3%) |
| $25,000 to $34,999 | 8 (5.9%) | 14 (18.7%) |
| $35,000 to $49,999 | 20 (14.7%) | 10 (13.3%) |
| $50,000 to $74,999 | 21 (15.4%) | 7 (9.3%) |
| $75,000 to $99,999 | 7 (5.1%) | 12 (16.0%) |
| $100,000 to $149,999 | 19 (14.0%) | 12 (16.0%) |
| $150,000 or more | 10 (7.3%) | 13 (17.3%) |
| Total | 136 (100.0%) | 75 (100.0%) |
Property Value to Household Income Ratio in Golden City
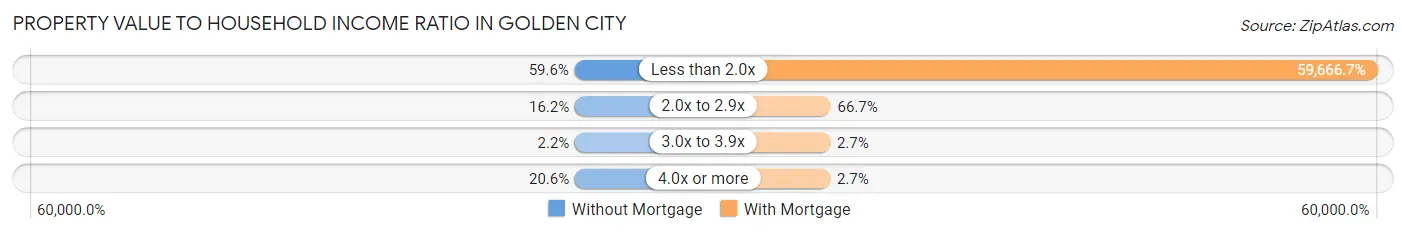
| Value-to-Income Ratio | Without Mortgage | With Mortgage |
| Less than 2.0x | 81 (59.6%) | 44,750 (59,666.7%) |
| 2.0x to 2.9x | 22 (16.2%) | 50 (66.7%) |
| 3.0x to 3.9x | 3 (2.2%) | 2 (2.7%) |
| 4.0x or more | 28 (20.6%) | 2 (2.7%) |
| Total | 136 (100.0%) | 75 (100.0%) |
Real Estate Taxes by Mortgage Status in Golden City
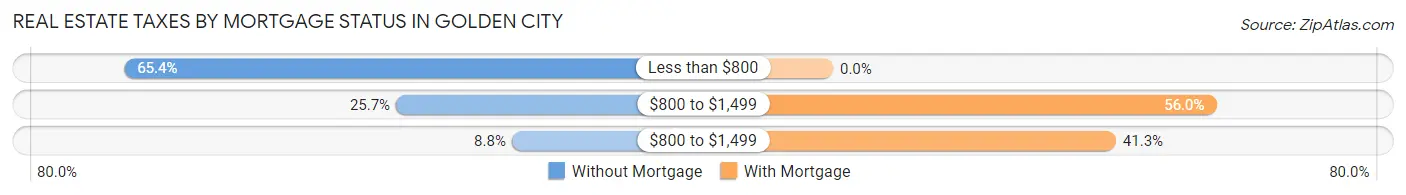
| Property Taxes | Without Mortgage | With Mortgage |
| Less than $800 | 89 (65.4%) | 0 (0.0%) |
| $800 to $1,499 | 35 (25.7%) | 42 (56.0%) |
| $800 to $1,499 | 12 (8.8%) | 31 (41.3%) |
| Total | 136 (100.0%) | 75 (100.0%) |
Health & Disability in Golden City
Health Insurance Coverage by Age in Golden City
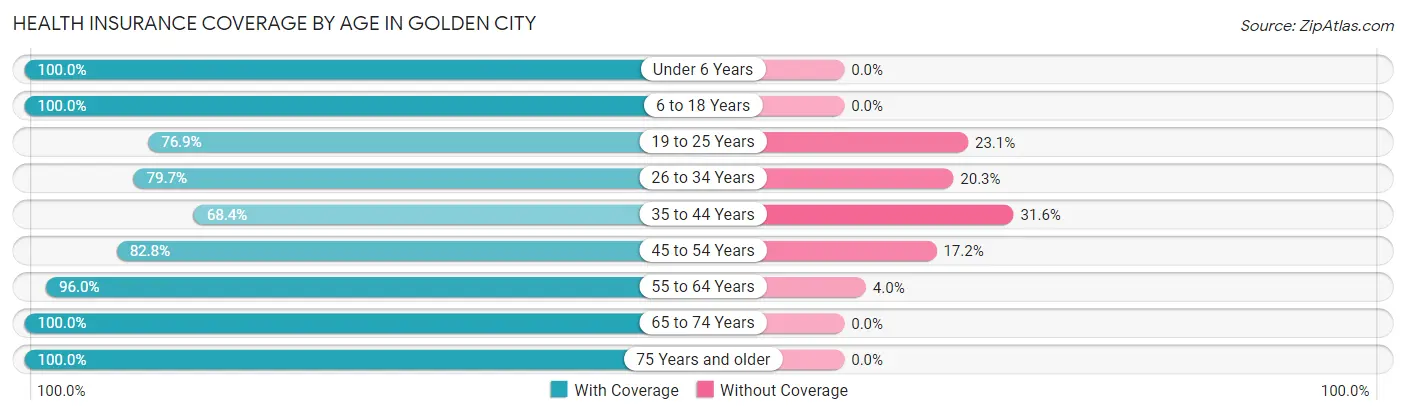
| Age Bracket | With Coverage | Without Coverage |
| Under 6 Years | 30 (100.0%) | 0 (0.0%) |
| 6 to 18 Years | 76 (100.0%) | 0 (0.0%) |
| 19 to 25 Years | 30 (76.9%) | 9 (23.1%) |
| 26 to 34 Years | 47 (79.7%) | 12 (20.3%) |
| 35 to 44 Years | 26 (68.4%) | 12 (31.6%) |
| 45 to 54 Years | 53 (82.8%) | 11 (17.2%) |
| 55 to 64 Years | 119 (96.0%) | 5 (4.0%) |
| 65 to 74 Years | 96 (100.0%) | 0 (0.0%) |
| 75 Years and older | 86 (100.0%) | 0 (0.0%) |
| Total | 563 (92.0%) | 49 (8.0%) |
Health Insurance Coverage by Citizenship Status in Golden City
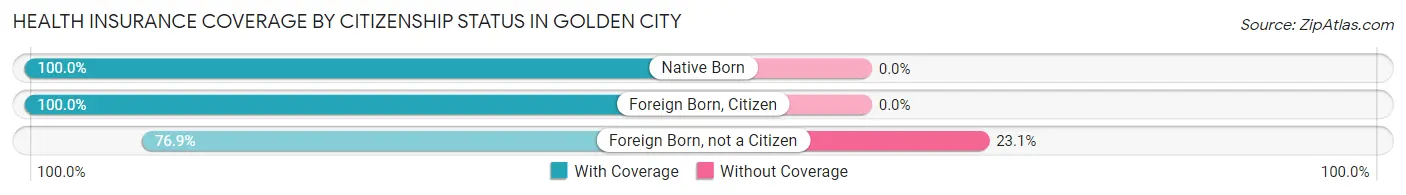
| Citizenship Status | With Coverage | Without Coverage |
| Native Born | 30 (100.0%) | 0 (0.0%) |
| Foreign Born, Citizen | 76 (100.0%) | 0 (0.0%) |
| Foreign Born, not a Citizen | 30 (76.9%) | 9 (23.1%) |
Health Insurance Coverage by Household Income in Golden City
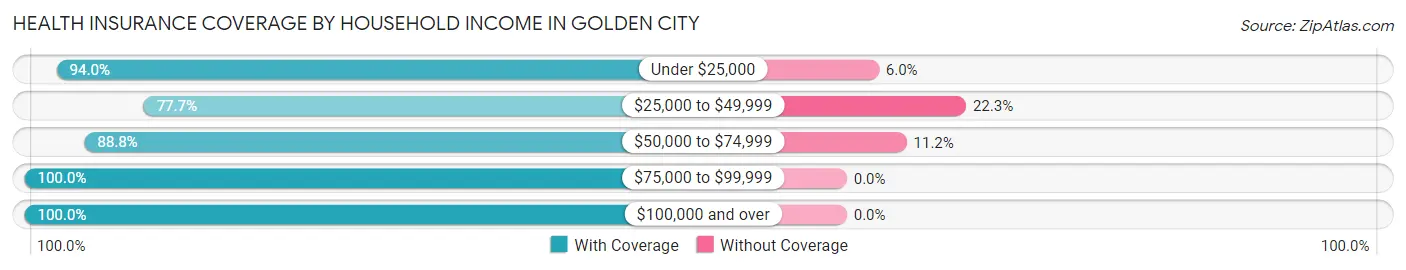
| Household Income | With Coverage | Without Coverage |
| Under $25,000 | 172 (94.0%) | 11 (6.0%) |
| $25,000 to $49,999 | 80 (77.7%) | 23 (22.3%) |
| $50,000 to $74,999 | 103 (88.8%) | 13 (11.2%) |
| $75,000 to $99,999 | 83 (100.0%) | 0 (0.0%) |
| $100,000 and over | 122 (100.0%) | 0 (0.0%) |
Public vs Private Health Insurance Coverage by Age in Golden City
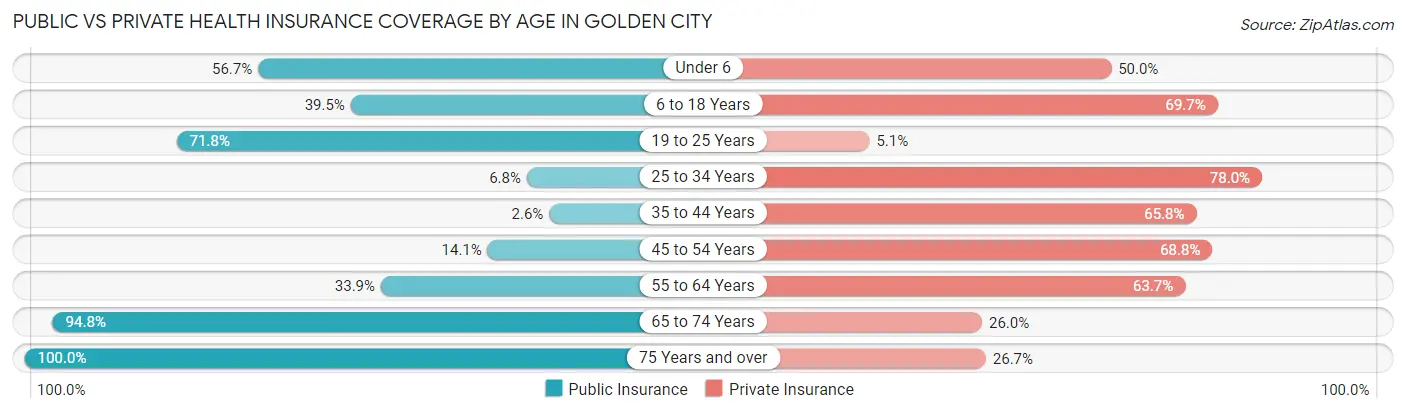
| Age Bracket | Public Insurance | Private Insurance |
| Under 6 | 17 (56.7%) | 15 (50.0%) |
| 6 to 18 Years | 30 (39.5%) | 53 (69.7%) |
| 19 to 25 Years | 28 (71.8%) | 2 (5.1%) |
| 25 to 34 Years | 4 (6.8%) | 46 (78.0%) |
| 35 to 44 Years | 1 (2.6%) | 25 (65.8%) |
| 45 to 54 Years | 9 (14.1%) | 44 (68.8%) |
| 55 to 64 Years | 42 (33.9%) | 79 (63.7%) |
| 65 to 74 Years | 91 (94.8%) | 25 (26.0%) |
| 75 Years and over | 86 (100.0%) | 23 (26.7%) |
| Total | 308 (50.3%) | 312 (51.0%) |
Disability Status by Sex by Age in Golden City
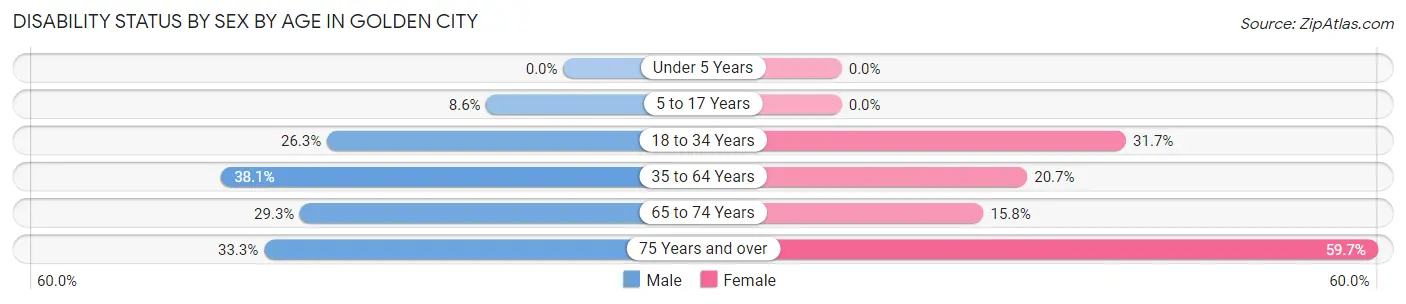
| Age Bracket | Male | Female |
| Under 5 Years | 0 (0.0%) | 0 (0.0%) |
| 5 to 17 Years | 3 (8.6%) | 0 (0.0%) |
| 18 to 34 Years | 10 (26.3%) | 19 (31.7%) |
| 35 to 64 Years | 40 (38.1%) | 25 (20.7%) |
| 65 to 74 Years | 17 (29.3%) | 6 (15.8%) |
| 75 Years and over | 8 (33.3%) | 37 (59.7%) |
Disability Class by Sex by Age in Golden City
Disability Class: Hearing Difficulty
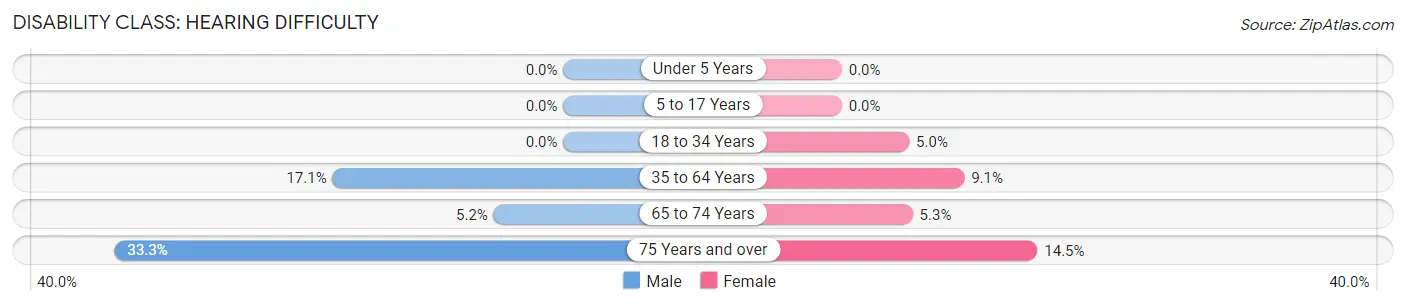
| Age Bracket | Male | Female |
| Under 5 Years | 0 (0.0%) | 0 (0.0%) |
| 5 to 17 Years | 0 (0.0%) | 0 (0.0%) |
| 18 to 34 Years | 0 (0.0%) | 3 (5.0%) |
| 35 to 64 Years | 18 (17.1%) | 11 (9.1%) |
| 65 to 74 Years | 3 (5.2%) | 2 (5.3%) |
| 75 Years and over | 8 (33.3%) | 9 (14.5%) |
Disability Class: Vision Difficulty
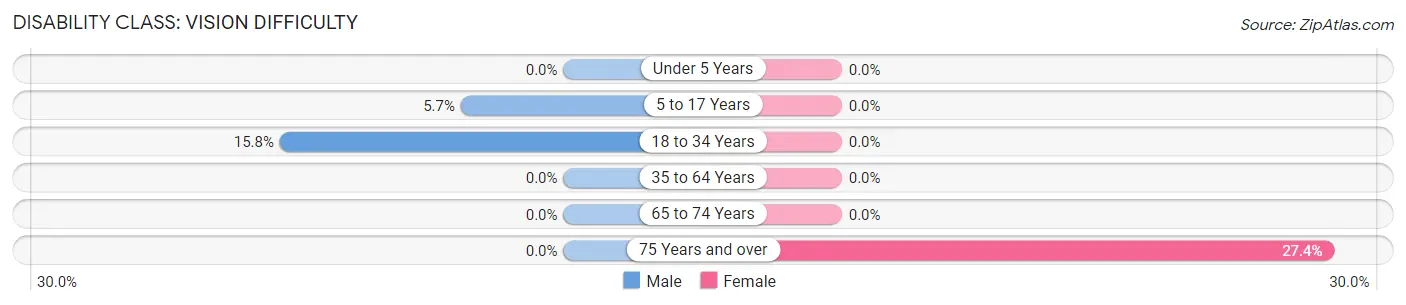
| Age Bracket | Male | Female |
| Under 5 Years | 0 (0.0%) | 0 (0.0%) |
| 5 to 17 Years | 2 (5.7%) | 0 (0.0%) |
| 18 to 34 Years | 6 (15.8%) | 0 (0.0%) |
| 35 to 64 Years | 0 (0.0%) | 0 (0.0%) |
| 65 to 74 Years | 0 (0.0%) | 0 (0.0%) |
| 75 Years and over | 0 (0.0%) | 17 (27.4%) |
Disability Class: Cognitive Difficulty
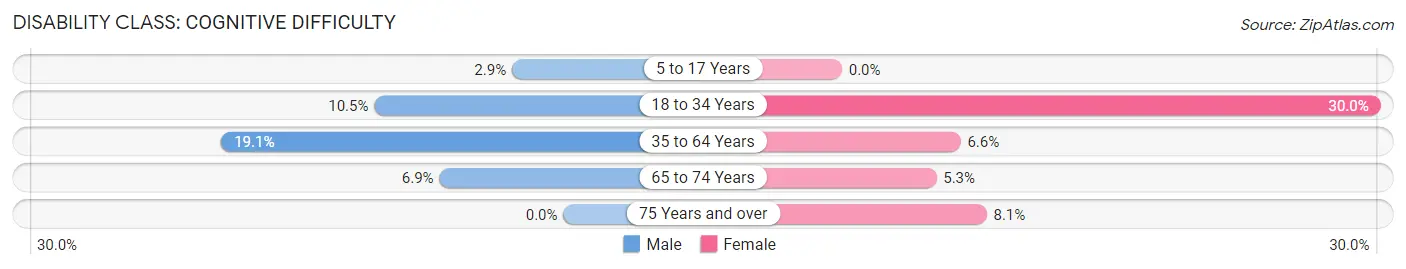
| Age Bracket | Male | Female |
| 5 to 17 Years | 1 (2.9%) | 0 (0.0%) |
| 18 to 34 Years | 4 (10.5%) | 18 (30.0%) |
| 35 to 64 Years | 20 (19.1%) | 8 (6.6%) |
| 65 to 74 Years | 4 (6.9%) | 2 (5.3%) |
| 75 Years and over | 0 (0.0%) | 5 (8.1%) |
Disability Class: Ambulatory Difficulty
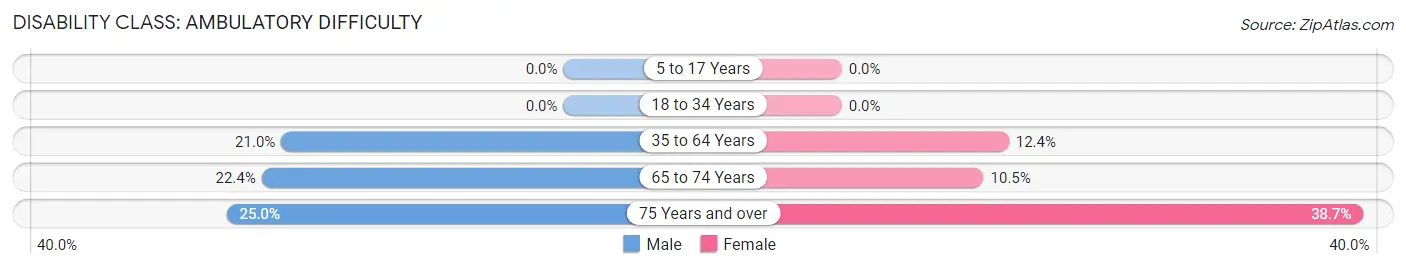
| Age Bracket | Male | Female |
| 5 to 17 Years | 0 (0.0%) | 0 (0.0%) |
| 18 to 34 Years | 0 (0.0%) | 0 (0.0%) |
| 35 to 64 Years | 22 (20.9%) | 15 (12.4%) |
| 65 to 74 Years | 13 (22.4%) | 4 (10.5%) |
| 75 Years and over | 6 (25.0%) | 24 (38.7%) |
Disability Class: Self-Care Difficulty
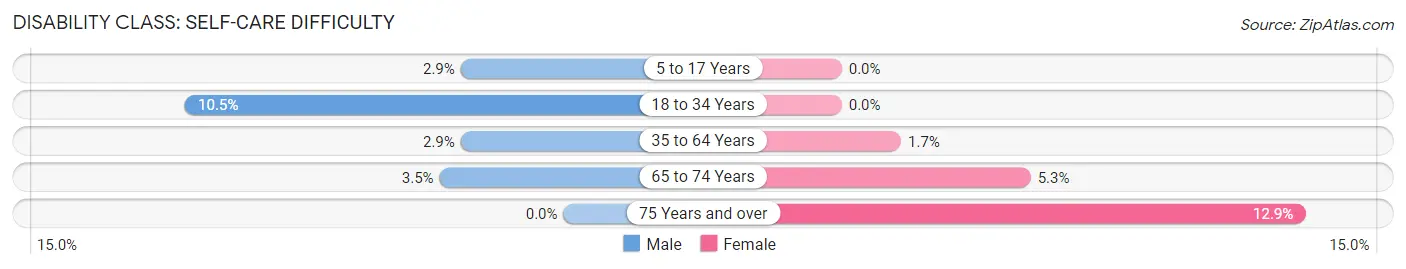
| Age Bracket | Male | Female |
| 5 to 17 Years | 1 (2.9%) | 0 (0.0%) |
| 18 to 34 Years | 4 (10.5%) | 0 (0.0%) |
| 35 to 64 Years | 3 (2.9%) | 2 (1.7%) |
| 65 to 74 Years | 2 (3.5%) | 2 (5.3%) |
| 75 Years and over | 0 (0.0%) | 8 (12.9%) |
Technology Access in Golden City
Computing Device Access in Golden City
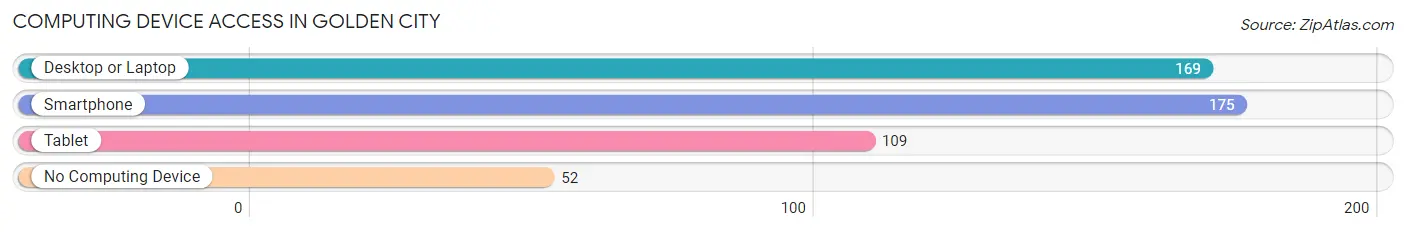
| Device Type | # Households | % Households |
| Desktop or Laptop | 169 | 58.9% |
| Smartphone | 175 | 61.0% |
| Tablet | 109 | 38.0% |
| No Computing Device | 52 | 18.1% |
| Total | 287 | 100.0% |
Internet Access in Golden City
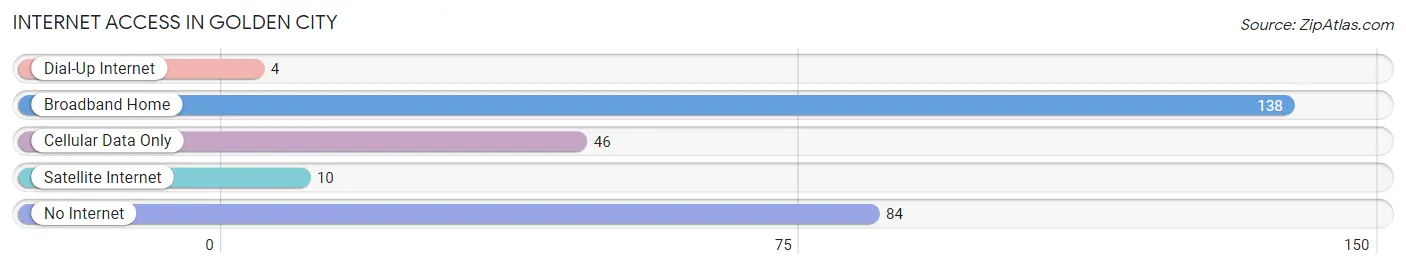
| Internet Type | # Households | % Households |
| Dial-Up Internet | 4 | 1.4% |
| Broadband Home | 138 | 48.1% |
| Cellular Data Only | 46 | 16.0% |
| Satellite Internet | 10 | 3.5% |
| No Internet | 84 | 29.3% |
| Total | 287 | 100.0% |
Golden City Summary
Golden City, Missouri is a small town located in Barton County in the southwestern corner of the state. It is situated on the banks of the Spring River, which is a tributary of the James River. The town was founded in 1881 and was named after the gold rush that occurred in the area in the late 19th century. The population of Golden City was 1,093 as of the 2010 census.
History
The area around Golden City was first settled in the late 18th century by settlers from the United States and Europe. The first permanent settlement was established in 1881 when the town was founded. The town was named after the gold rush that occurred in the area in the late 19th century. The gold rush brought many people to the area, and the town quickly grew.
In the early 20th century, the town was a major center for the production of lead and zinc. The mines in the area provided employment for many of the town's residents. The town also had a thriving agricultural industry, with many of the town's residents working in the fields.
The town was also home to a number of businesses, including a hotel, a bank, a general store, and a movie theater. The town also had a number of churches, including the First Baptist Church, the Methodist Church, and the Catholic Church.
Geography
Golden City is located in Barton County in the southwestern corner of the state. It is situated on the banks of the Spring River, which is a tributary of the James River. The town is located at an elevation of 890 feet above sea level.
The town is located in a rural area, and the surrounding landscape is mostly flat. The town is surrounded by farmland and is located near the Ozark Mountains. The town is located about 30 miles from the nearest major city, Springfield.
Economy
The economy of Golden City is largely based on agriculture. The town is home to a number of farms, and many of the town's residents are employed in the agricultural industry. The town also has a number of businesses, including a hotel, a bank, a general store, and a movie theater.
The town is also home to a number of manufacturing companies, including a lead and zinc smelter, a furniture factory, and a canning factory. The town is also home to a number of small businesses, including restaurants, shops, and other services.
Demographics
As of the 2010 census, the population of Golden City was 1,093. The racial makeup of the town was 97.3% White, 0.7% African American, 0.2% Native American, 0.2% Asian, 0.1% Pacific Islander, 0.4% from other races, and 1.1% from two or more races. Hispanic or Latino of any race were 1.3% of the population.
The median income for a household in the town was $31,250, and the median income for a family was $37,500. The per capita income for the town was $15,945. About 16.2% of the population was below the poverty line.
Common Questions
What is Per Capita Income in Golden City?
Per Capita income in Golden City is $23,795.
What is the Median Family Income in Golden City?
Median Family Income in Golden City is $60,156.
What is the Median Household income in Golden City?
Median Household Income in Golden City is $37,679.
What is Income or Wage Gap in Golden City?
Income or Wage Gap in Golden City is 39.7%.
Women in Golden City earn 60.3 cents for every dollar earned by a man.
What is Family Income Deficit in Golden City?
Family Income Deficit in Golden City is $9,439.
Families that are below poverty line in Golden City earn $9,439 less on average than the poverty threshold level.
What is Inequality or Gini Index in Golden City?
Inequality or Gini Index in Golden City is 0.45.
What is the Total Population of Golden City?
Total Population of Golden City is 612.
What is the Total Male Population of Golden City?
Total Male Population of Golden City is 278.
What is the Total Female Population of Golden City?
Total Female Population of Golden City is 334.
What is the Ratio of Males per 100 Females in Golden City?
There are 83.23 Males per 100 Females in Golden City.
What is the Ratio of Females per 100 Males in Golden City?
There are 120.14 Females per 100 Males in Golden City.
What is the Median Population Age in Golden City?
Median Population Age in Golden City is 55.0 Years.
What is the Average Family Size in Golden City
Average Family Size in Golden City is 2.8 People.
What is the Average Household Size in Golden City
Average Household Size in Golden City is 2.1 People.
How Large is the Labor Force in Golden City?
There are 228 People in the Labor Forcein in Golden City.
What is the Percentage of People in the Labor Force in Golden City?
44.4% of People are in the Labor Force in Golden City.
What is the Unemployment Rate in Golden City?
Unemployment Rate in Golden City is 6.1%.