Greenfield, WI Map & Demographics
Greenfield Map
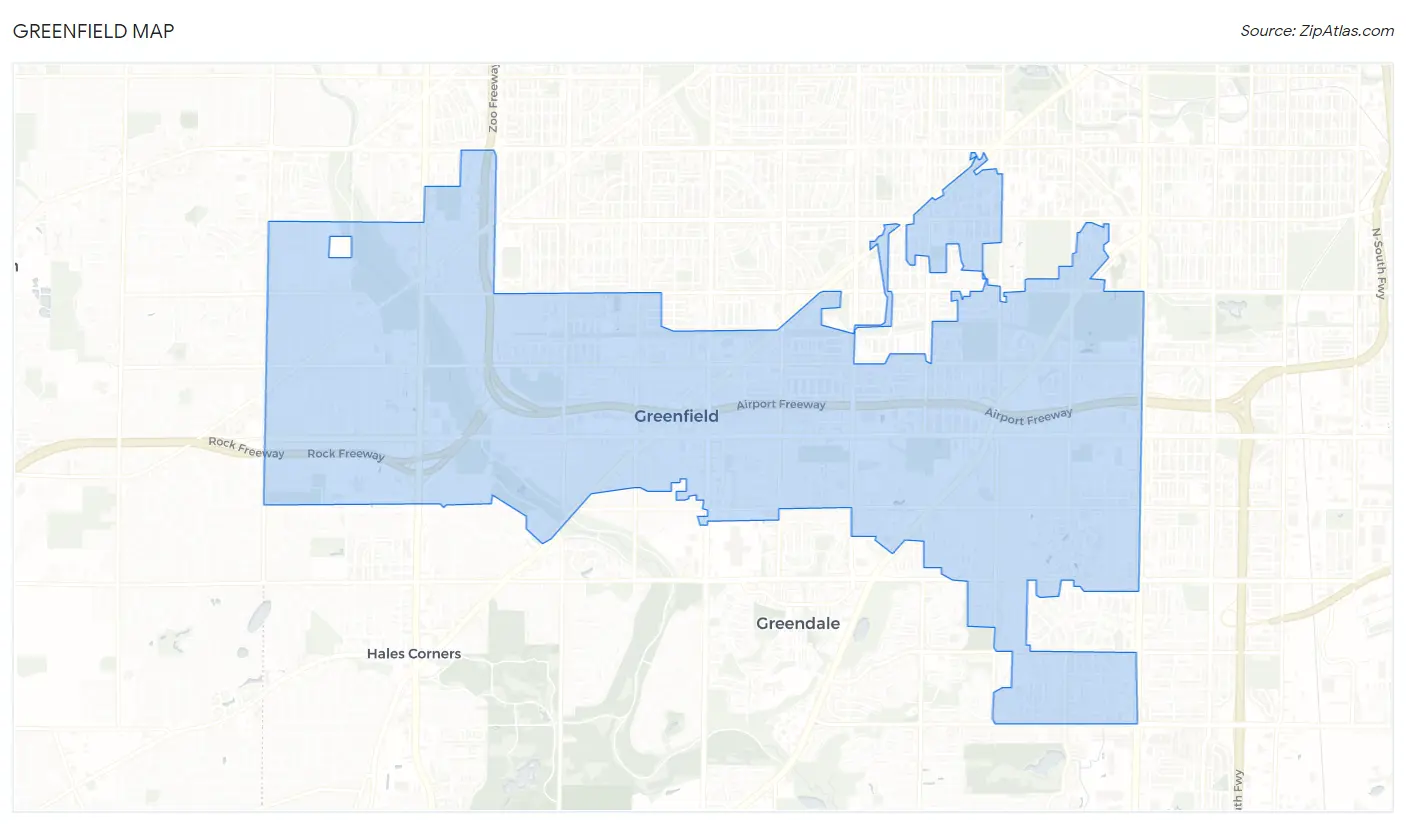
Greenfield Overview
$40,221
PER CAPITA INCOME
$87,011
AVG FAMILY INCOME
$67,536
AVG HOUSEHOLD INCOME
20.8%
WAGE / INCOME GAP [ % ]
79.2¢/ $1
WAGE / INCOME GAP [ $ ]
$9,698
FAMILY INCOME DEFICIT
0.39
INEQUALITY / GINI INDEX
37,521
TOTAL POPULATION
17,753
MALE POPULATION
19,768
FEMALE POPULATION
89.81
MALES / 100 FEMALES
111.35
FEMALES / 100 MALES
43.3
MEDIAN AGE
2.9
AVG FAMILY SIZE
2.1
AVG HOUSEHOLD SIZE
20,645
LABOR FORCE [ PEOPLE ]
65.4%
PERCENT IN LABOR FORCE
3.5%
UNEMPLOYMENT RATE
Income in Greenfield
Income Overview in Greenfield
Per Capita Income in Greenfield is $40,221, while median incomes of families and households are $87,011 and $67,536 respectively.
| Characteristic | Number | Measure |
| Per Capita Income | 37,521 | $40,221 |
| Median Family Income | 9,039 | $87,011 |
| Mean Family Income | 9,039 | $104,959 |
| Median Household Income | 17,883 | $67,536 |
| Mean Household Income | 17,883 | $82,392 |
| Income Deficit | 9,039 | $9,698 |
| Wage / Income Gap (%) | 37,521 | 20.81% |
| Wage / Income Gap ($) | 37,521 | 79.19¢ per $1 |
| Gini / Inequality Index | 37,521 | 0.39 |
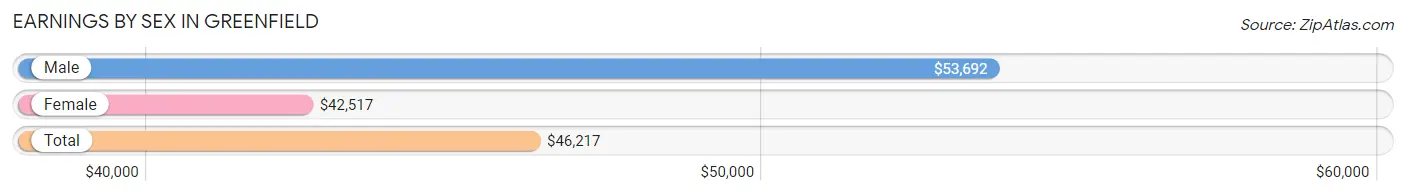
Earnings by Sex in Greenfield
Average Earnings in Greenfield are $46,217, $53,692 for men and $42,517 for women, a difference of 20.8%.
| Sex | Number | Average Earnings |
| Male | 10,744 (49.9%) | $53,692 |
| Female | 10,778 (50.1%) | $42,517 |
| Total | 21,522 (100.0%) | $46,217 |
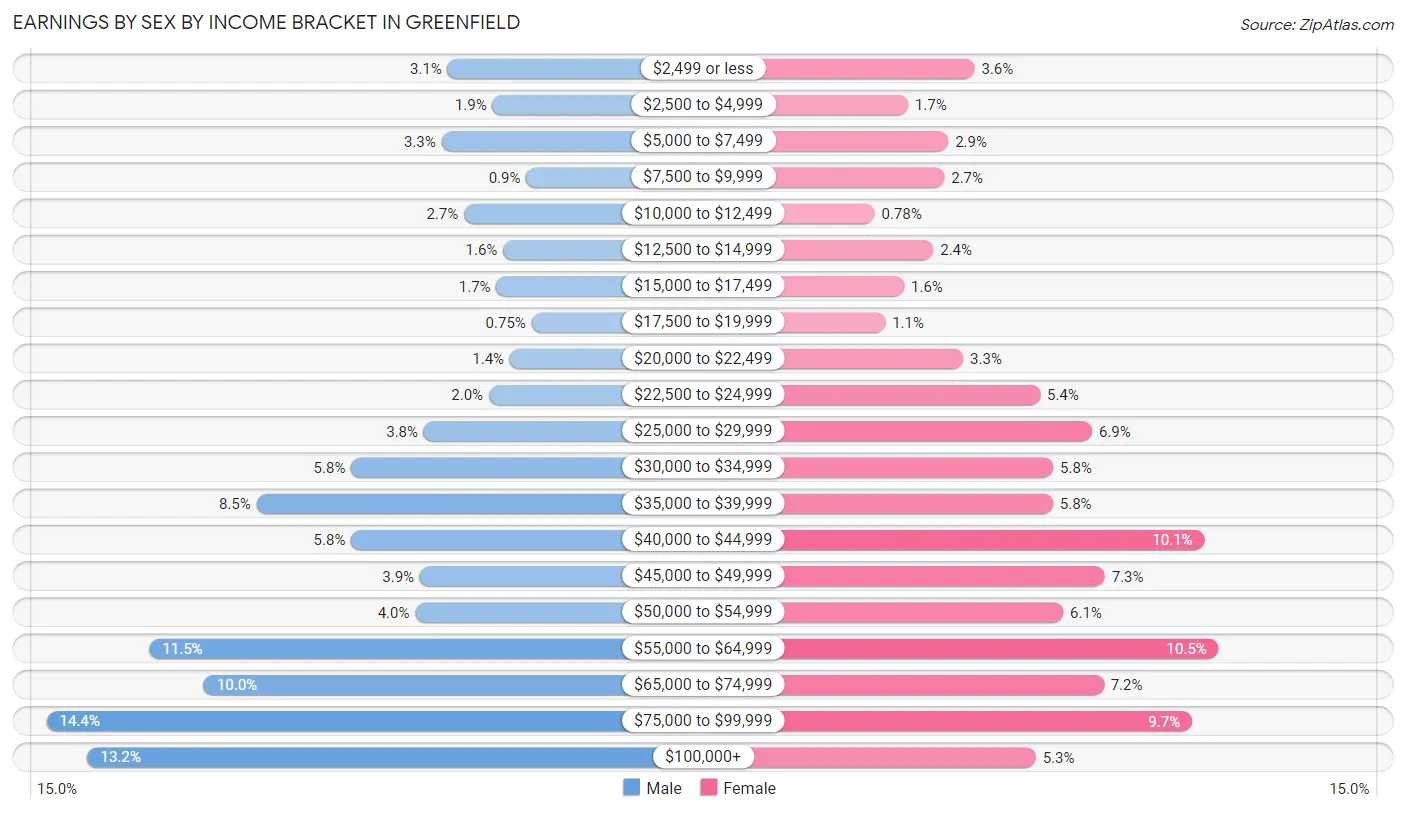
Earnings by Sex by Income Bracket in Greenfield
The most common earnings brackets in Greenfield are $75,000 to $99,999 for men (1,545 | 14.4%) and $55,000 to $64,999 for women (1,126 | 10.4%).
| Income | Male | Female |
| $2,499 or less | 334 (3.1%) | 387 (3.6%) |
| $2,500 to $4,999 | 199 (1.8%) | 185 (1.7%) |
| $5,000 to $7,499 | 352 (3.3%) | 307 (2.9%) |
| $7,500 to $9,999 | 97 (0.9%) | 295 (2.7%) |
| $10,000 to $12,499 | 285 (2.6%) | 84 (0.8%) |
| $12,500 to $14,999 | 166 (1.5%) | 262 (2.4%) |
| $15,000 to $17,499 | 187 (1.7%) | 173 (1.6%) |
| $17,500 to $19,999 | 81 (0.7%) | 116 (1.1%) |
| $20,000 to $22,499 | 146 (1.4%) | 352 (3.3%) |
| $22,500 to $24,999 | 210 (1.9%) | 585 (5.4%) |
| $25,000 to $29,999 | 406 (3.8%) | 743 (6.9%) |
| $30,000 to $34,999 | 625 (5.8%) | 625 (5.8%) |
| $35,000 to $39,999 | 911 (8.5%) | 624 (5.8%) |
| $40,000 to $44,999 | 625 (5.8%) | 1,083 (10.1%) |
| $45,000 to $49,999 | 418 (3.9%) | 781 (7.2%) |
| $50,000 to $54,999 | 432 (4.0%) | 655 (6.1%) |
| $55,000 to $64,999 | 1,234 (11.5%) | 1,126 (10.4%) |
| $65,000 to $74,999 | 1,070 (10.0%) | 778 (7.2%) |
| $75,000 to $99,999 | 1,545 (14.4%) | 1,045 (9.7%) |
| $100,000+ | 1,421 (13.2%) | 572 (5.3%) |
| Total | 10,744 (100.0%) | 10,778 (100.0%) |
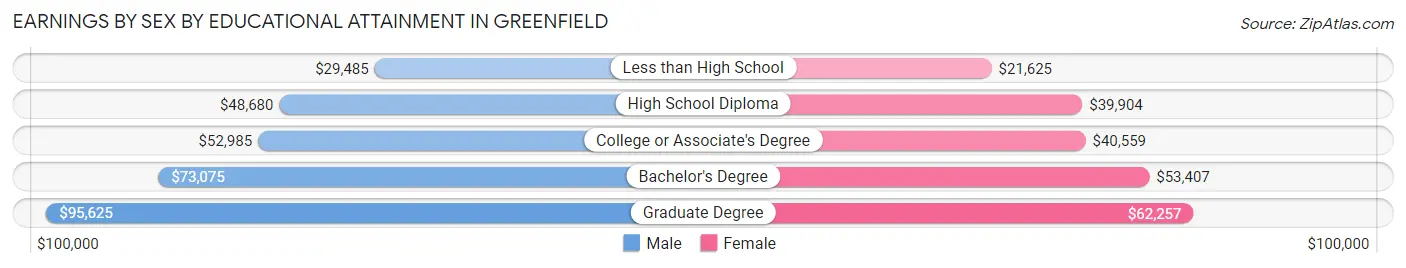
Earnings by Sex by Educational Attainment in Greenfield
Average earnings in Greenfield are $57,561 for men and $44,691 for women, a difference of 22.4%. Men with an educational attainment of graduate degree enjoy the highest average annual earnings of $95,625, while those with less than high school education earn the least with $29,485. Women with an educational attainment of graduate degree earn the most with the average annual earnings of $62,257, while those with less than high school education have the smallest earnings of $21,625.
| Educational Attainment | Male Income | Female Income |
| Less than High School | $29,485 | $21,625 |
| High School Diploma | $48,680 | $39,904 |
| College or Associate's Degree | $52,985 | $40,559 |
| Bachelor's Degree | $73,075 | $53,407 |
| Graduate Degree | $95,625 | $62,257 |
| Total | $57,561 | $44,691 |
Family Income in Greenfield
Family Income Brackets in Greenfield
According to the Greenfield family income data, there are 2,106 families falling into the $50,000 to $74,999 income range, which is the most common income bracket and makes up 23.3% of all families. Conversely, the $10,000 to $14,999 income bracket is the least frequent group with only 154 families (1.7%) belonging to this category.
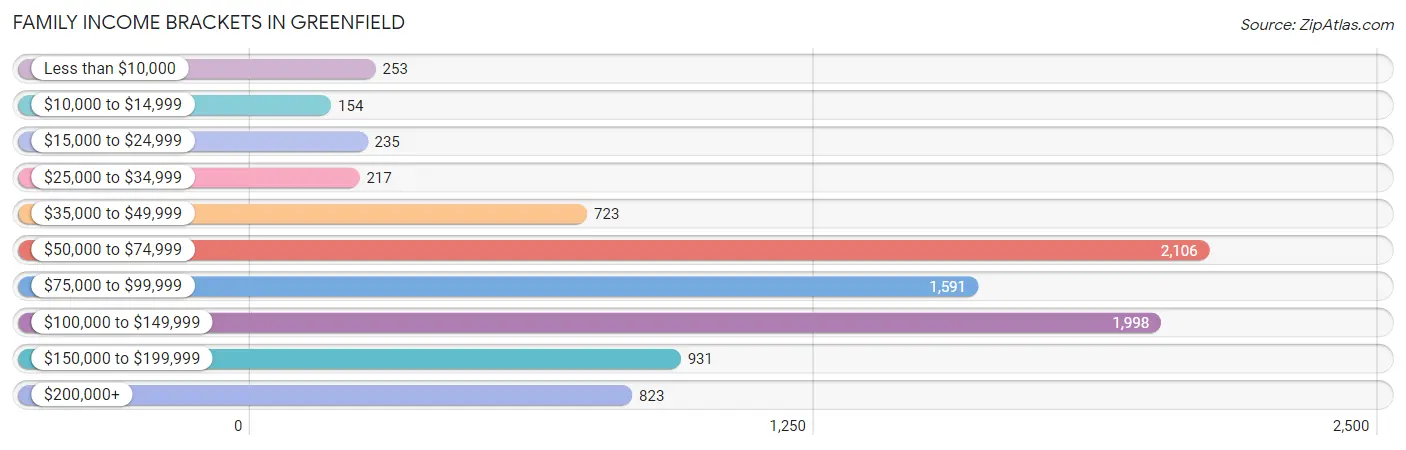
| Income Bracket | # Families | % Families |
| Less than $10,000 | 253 | 2.8% |
| $10,000 to $14,999 | 154 | 1.7% |
| $15,000 to $24,999 | 235 | 2.6% |
| $25,000 to $34,999 | 217 | 2.4% |
| $35,000 to $49,999 | 723 | 8.0% |
| $50,000 to $74,999 | 2,106 | 23.3% |
| $75,000 to $99,999 | 1,591 | 17.6% |
| $100,000 to $149,999 | 1,998 | 22.1% |
| $150,000 to $199,999 | 931 | 10.3% |
| $200,000+ | 823 | 9.1% |
Family Income by Famaliy Size in Greenfield
6-person families (142 | 1.6%) account for the highest median family income in Greenfield with $240,085 per family, while 6-person families (142 | 1.6%) have the highest median income of $40,014 per family member.
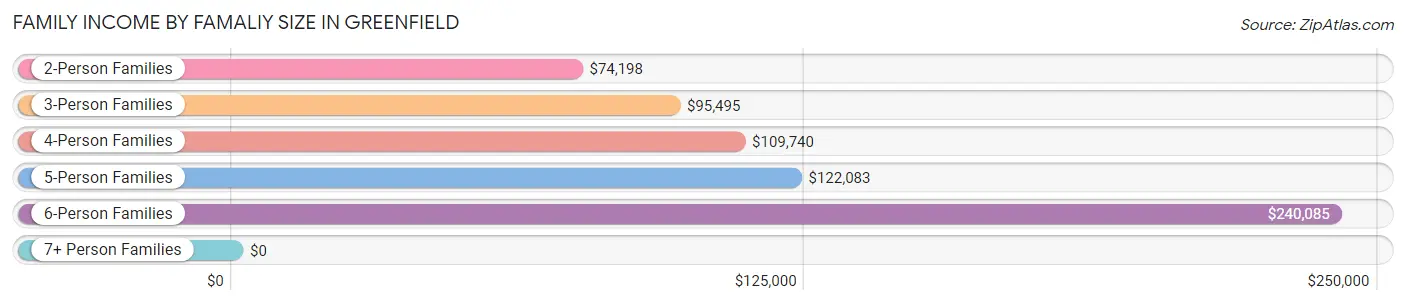
| Income Bracket | # Families | Median Income |
| 2-Person Families | 4,981 (55.1%) | $74,198 |
| 3-Person Families | 2,000 (22.1%) | $95,495 |
| 4-Person Families | 1,375 (15.2%) | $109,740 |
| 5-Person Families | 508 (5.6%) | $122,083 |
| 6-Person Families | 142 (1.6%) | $240,085 |
| 7+ Person Families | 33 (0.4%) | $0 |
| Total | 9,039 (100.0%) | $87,011 |
Family Income by Number of Earners in Greenfield
The median family income in Greenfield is $87,011, with families comprising 3+ earners (918) having the highest median family income of $141,422, while families with no earners (1,451) have the lowest median family income of $58,180, accounting for 10.2% and 16.1% of families, respectively.
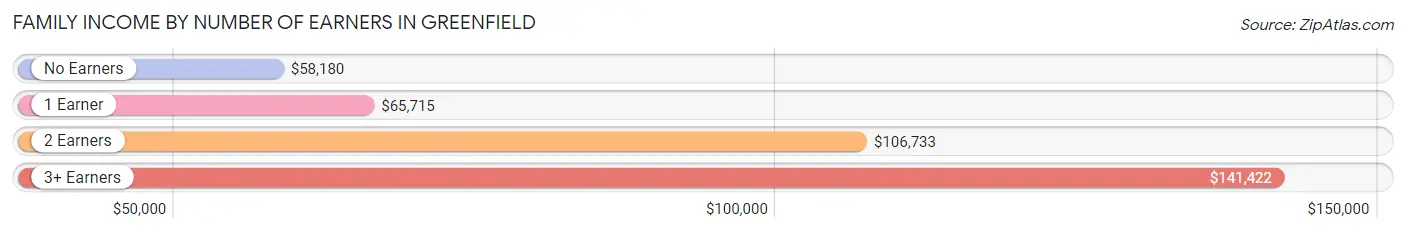
| Number of Earners | # Families | Median Income |
| No Earners | 1,451 (16.1%) | $58,180 |
| 1 Earner | 2,589 (28.6%) | $65,715 |
| 2 Earners | 4,081 (45.2%) | $106,733 |
| 3+ Earners | 918 (10.2%) | $141,422 |
| Total | 9,039 (100.0%) | $87,011 |
Household Income in Greenfield
Household Income Brackets in Greenfield
With 4,006 households falling in the category, the $50,000 to $74,999 income range is the most frequent in Greenfield, accounting for 22.4% of all households. In contrast, only 393 households (2.2%) fall into the $10,000 to $14,999 income bracket, making it the least populous group.
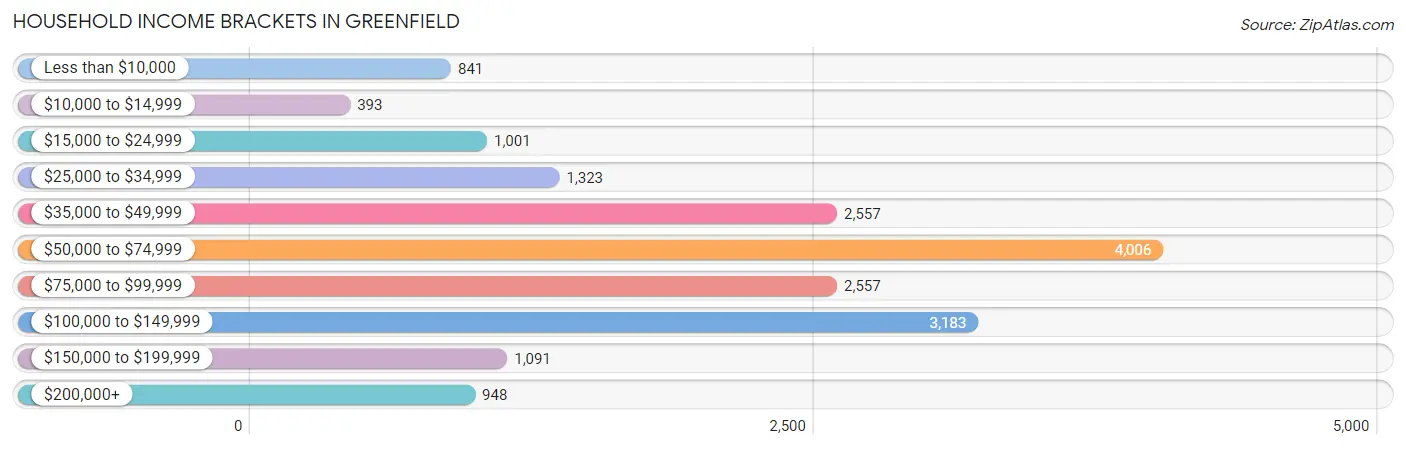
| Income Bracket | # Households | % Households |
| Less than $10,000 | 841 | 4.7% |
| $10,000 to $14,999 | 393 | 2.2% |
| $15,000 to $24,999 | 1,001 | 5.6% |
| $25,000 to $34,999 | 1,323 | 7.4% |
| $35,000 to $49,999 | 2,557 | 14.3% |
| $50,000 to $74,999 | 4,006 | 22.4% |
| $75,000 to $99,999 | 2,557 | 14.3% |
| $100,000 to $149,999 | 3,183 | 17.8% |
| $150,000 to $199,999 | 1,091 | 6.1% |
| $200,000+ | 948 | 5.3% |
Household Income by Householder Age in Greenfield
The median household income in Greenfield is $67,536, with the highest median household income of $81,126 found in the 25 to 44 years age bracket for the primary householder. A total of 5,824 households (32.6%) fall into this category. Meanwhile, the 65+ years age bracket for the primary householder has the lowest median household income of $49,675, with 5,515 households (30.8%) in this group.
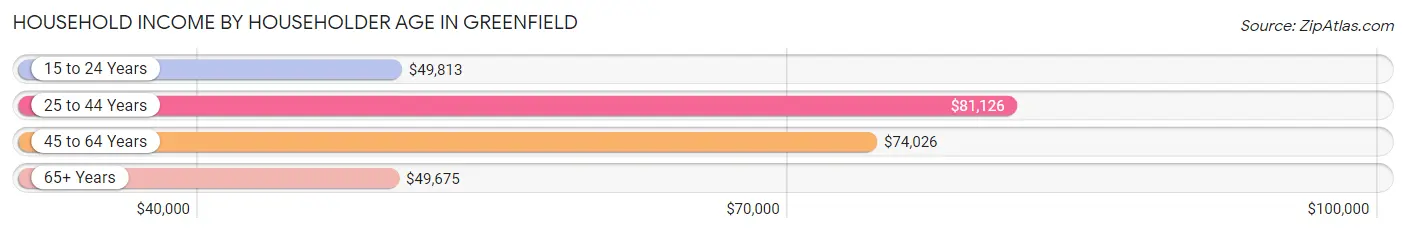
| Income Bracket | # Households | Median Income |
| 15 to 24 Years | 474 (2.6%) | $49,813 |
| 25 to 44 Years | 5,824 (32.6%) | $81,126 |
| 45 to 64 Years | 6,070 (33.9%) | $74,026 |
| 65+ Years | 5,515 (30.8%) | $49,675 |
| Total | 17,883 (100.0%) | $67,536 |
Poverty in Greenfield
Income Below Poverty by Sex and Age in Greenfield
With 7.7% poverty level for males and 7.9% for females among the residents of Greenfield, 65 to 74 year old males and 15 year old females are the most vulnerable to poverty, with 260 males (13.9%) and 50 females (30.7%) in their respective age groups living below the poverty level.
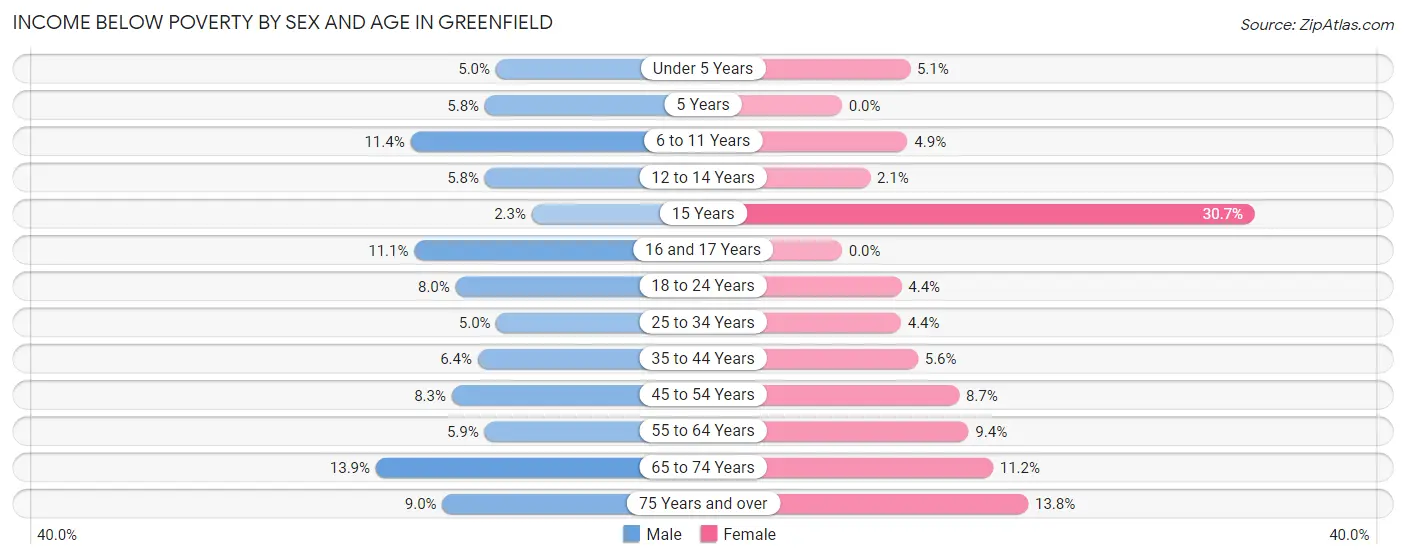
| Age Bracket | Male | Female |
| Under 5 Years | 44 (5.0%) | 52 (5.1%) |
| 5 Years | 11 (5.8%) | 0 (0.0%) |
| 6 to 11 Years | 146 (11.4%) | 54 (4.9%) |
| 12 to 14 Years | 28 (5.8%) | 8 (2.1%) |
| 15 Years | 3 (2.3%) | 50 (30.7%) |
| 16 and 17 Years | 33 (11.1%) | 0 (0.0%) |
| 18 to 24 Years | 87 (8.0%) | 46 (4.4%) |
| 25 to 34 Years | 143 (5.0%) | 132 (4.4%) |
| 35 to 44 Years | 159 (6.4%) | 137 (5.6%) |
| 45 to 54 Years | 199 (8.3%) | 180 (8.7%) |
| 55 to 64 Years | 142 (5.9%) | 278 (9.4%) |
| 65 to 74 Years | 260 (13.9%) | 281 (11.2%) |
| 75 Years and over | 106 (9.0%) | 311 (13.8%) |
| Total | 1,361 (7.7%) | 1,529 (7.9%) |
Income Above Poverty by Sex and Age in Greenfield
According to the poverty statistics in Greenfield, males aged 15 years and females aged 5 years are the age groups that are most secure financially, with 97.7% of males and 100.0% of females in these age groups living above the poverty line.
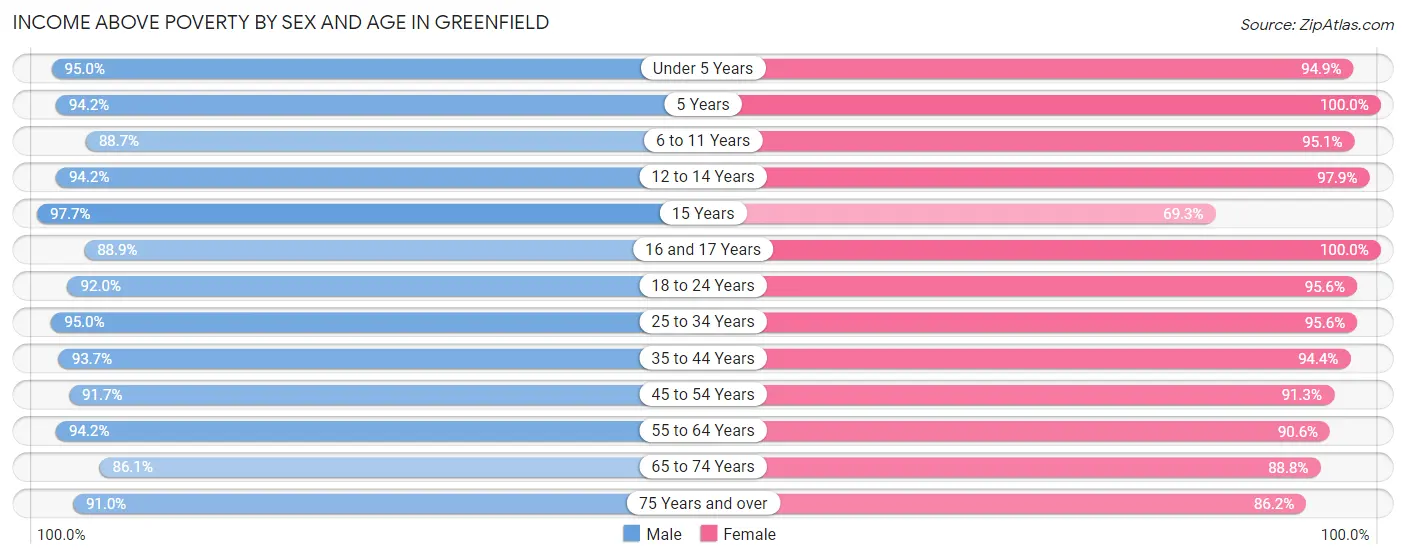
| Age Bracket | Male | Female |
| Under 5 Years | 835 (95.0%) | 975 (94.9%) |
| 5 Years | 178 (94.2%) | 153 (100.0%) |
| 6 to 11 Years | 1,140 (88.6%) | 1,055 (95.1%) |
| 12 to 14 Years | 452 (94.2%) | 375 (97.9%) |
| 15 Years | 125 (97.7%) | 113 (69.3%) |
| 16 and 17 Years | 265 (88.9%) | 280 (100.0%) |
| 18 to 24 Years | 1,000 (92.0%) | 994 (95.6%) |
| 25 to 34 Years | 2,735 (95.0%) | 2,881 (95.6%) |
| 35 to 44 Years | 2,346 (93.6%) | 2,292 (94.4%) |
| 45 to 54 Years | 2,203 (91.7%) | 1,888 (91.3%) |
| 55 to 64 Years | 2,286 (94.2%) | 2,681 (90.6%) |
| 65 to 74 Years | 1,608 (86.1%) | 2,225 (88.8%) |
| 75 Years and over | 1,075 (91.0%) | 1,937 (86.2%) |
| Total | 16,248 (92.3%) | 17,849 (92.1%) |
Income Below Poverty Among Married-Couple Families in Greenfield
The poverty statistics for married-couple families in Greenfield show that 5.0% or 330 of the total 6,668 families live below the poverty line. Families with no children have the highest poverty rate of 6.9%, comprising of 288 families. On the other hand, families with 3 or 4 children have the lowest poverty rate of 0.7%, which includes 3 families.
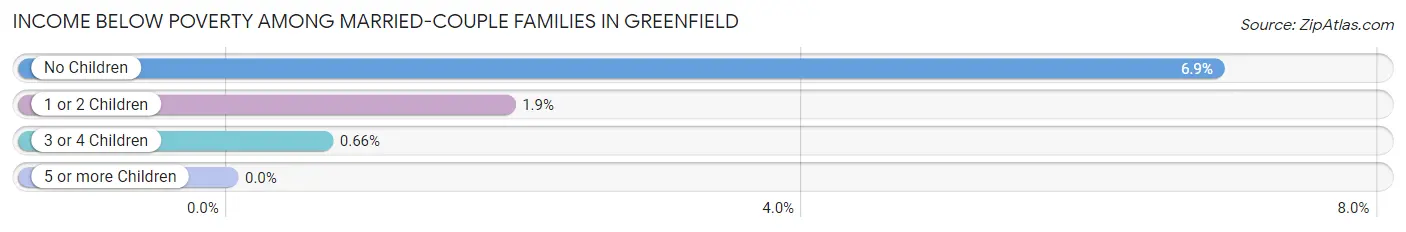
| Children | Above Poverty | Below Poverty |
| No Children | 3,905 (93.1%) | 288 (6.9%) |
| 1 or 2 Children | 1,983 (98.1%) | 39 (1.9%) |
| 3 or 4 Children | 450 (99.3%) | 3 (0.7%) |
| 5 or more Children | 0 (0.0%) | 0 (0.0%) |
| Total | 6,338 (95.1%) | 330 (5.0%) |
Income Below Poverty Among Single-Parent Households in Greenfield
According to the poverty data in Greenfield, 6.0% or 47 single-father households and 13.5% or 215 single-mother households are living below the poverty line. Among single-father households, those with 1 or 2 children have the highest poverty rate, with 47 households (12.8%) experiencing poverty. Likewise, among single-mother households, those with 3 or 4 children have the highest poverty rate, with 25 households (26.3%) falling below the poverty line.
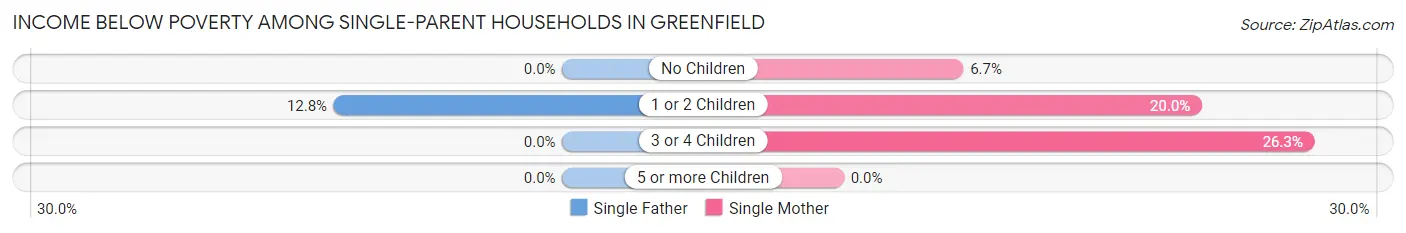
| Children | Single Father | Single Mother |
| No Children | 0 (0.0%) | 55 (6.7%) |
| 1 or 2 Children | 47 (12.8%) | 135 (20.0%) |
| 3 or 4 Children | 0 (0.0%) | 25 (26.3%) |
| 5 or more Children | 0 (0.0%) | 0 (0.0%) |
| Total | 47 (6.0%) | 215 (13.5%) |
Income Below Poverty Among Married-Couple vs Single-Parent Households in Greenfield
The poverty data for Greenfield shows that 330 of the married-couple family households (5.0%) and 262 of the single-parent households (11.1%) are living below the poverty level. Within the married-couple family households, those with no children have the highest poverty rate, with 288 households (6.9%) falling below the poverty line. Among the single-parent households, those with 3 or 4 children have the highest poverty rate, with 25 household (21.4%) living below poverty.
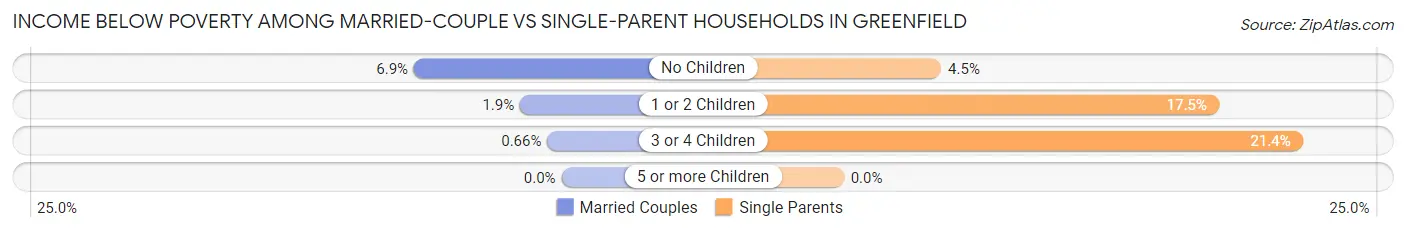
| Children | Married-Couple Families | Single-Parent Households |
| No Children | 288 (6.9%) | 55 (4.5%) |
| 1 or 2 Children | 39 (1.9%) | 182 (17.5%) |
| 3 or 4 Children | 3 (0.7%) | 25 (21.4%) |
| 5 or more Children | 0 (0.0%) | 0 (0.0%) |
| Total | 330 (5.0%) | 262 (11.1%) |
Race in Greenfield
The most populous races in Greenfield are White / Caucasian (27,904 | 74.4%), Hispanic or Latino (5,378 | 14.3%), and Two or more Races (3,453 | 9.2%).
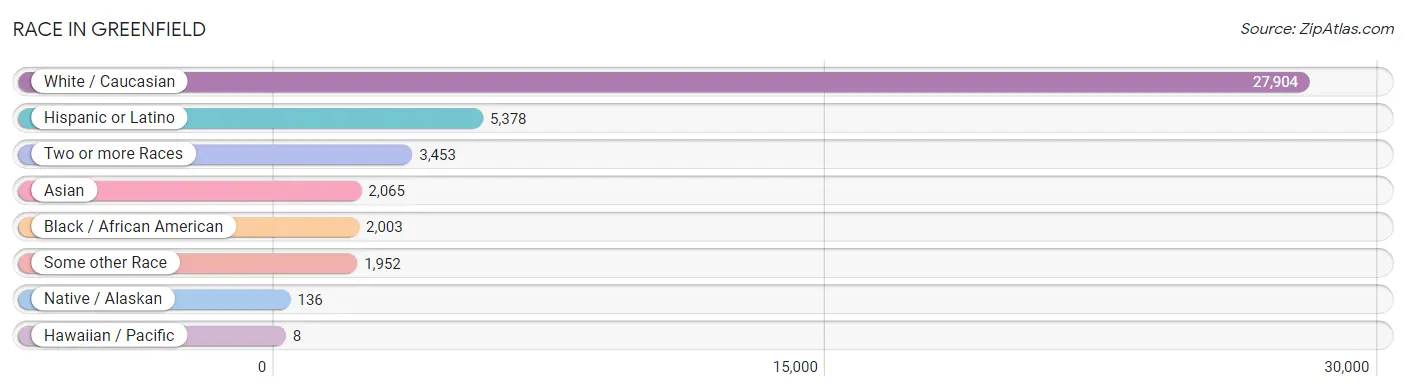
| Race | # Population | % Population |
| Asian | 2,065 | 5.5% |
| Black / African American | 2,003 | 5.3% |
| Hawaiian / Pacific | 8 | 0.0% |
| Hispanic or Latino | 5,378 | 14.3% |
| Native / Alaskan | 136 | 0.4% |
| White / Caucasian | 27,904 | 74.4% |
| Two or more Races | 3,453 | 9.2% |
| Some other Race | 1,952 | 5.2% |
| Total | 37,521 | 100.0% |
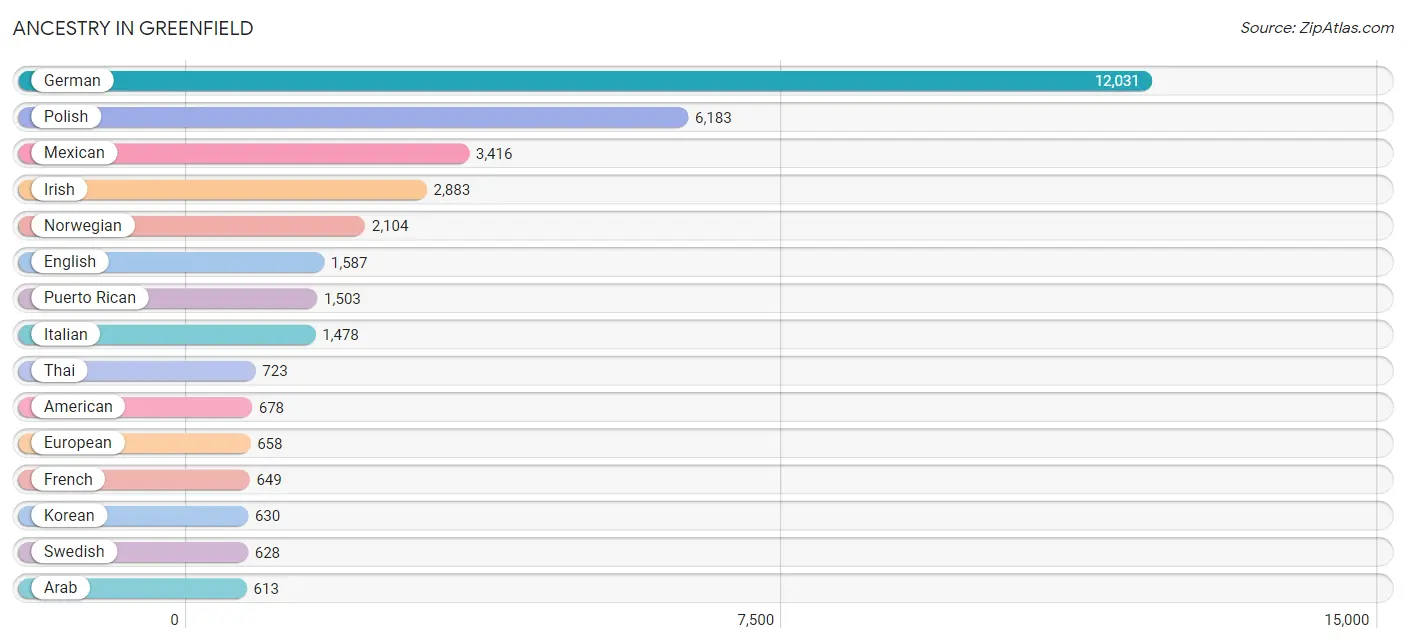
Ancestry in Greenfield
The most populous ancestries reported in Greenfield are German (12,031 | 32.1%), Polish (6,183 | 16.5%), Mexican (3,416 | 9.1%), Irish (2,883 | 7.7%), and Norwegian (2,104 | 5.6%), together accounting for 70.9% of all Greenfield residents.
| Ancestry | # Population | % Population |
| African | 54 | 0.1% |
| Albanian | 11 | 0.0% |
| Alsatian | 14 | 0.0% |
| American | 678 | 1.8% |
| Apache | 3 | 0.0% |
| Arab | 613 | 1.6% |
| Armenian | 111 | 0.3% |
| Assyrian / Chaldean / Syriac | 9 | 0.0% |
| Australian | 9 | 0.0% |
| Austrian | 222 | 0.6% |
| Bangladeshi | 163 | 0.4% |
| Belgian | 91 | 0.2% |
| Bhutanese | 141 | 0.4% |
| Blackfeet | 5 | 0.0% |
| British | 93 | 0.3% |
| Burmese | 116 | 0.3% |
| Canadian | 8 | 0.0% |
| Central American | 118 | 0.3% |
| Central American Indian | 50 | 0.1% |
| Cherokee | 44 | 0.1% |
| Chickasaw | 8 | 0.0% |
| Chilean | 8 | 0.0% |
| Chippewa | 83 | 0.2% |
| Choctaw | 7 | 0.0% |
| Colombian | 63 | 0.2% |
| Croatian | 266 | 0.7% |
| Cuban | 35 | 0.1% |
| Czech | 416 | 1.1% |
| Czechoslovakian | 90 | 0.2% |
| Danish | 220 | 0.6% |
| Dominican | 25 | 0.1% |
| Dutch | 257 | 0.7% |
| Eastern European | 24 | 0.1% |
| Egyptian | 200 | 0.5% |
| English | 1,587 | 4.2% |
| Estonian | 10 | 0.0% |
| European | 658 | 1.8% |
| Finnish | 133 | 0.4% |
| French | 649 | 1.7% |
| French Canadian | 106 | 0.3% |
| German | 12,031 | 32.1% |
| German Russian | 68 | 0.2% |
| Greek | 327 | 0.9% |
| Guamanian / Chamorro | 16 | 0.0% |
| Guatemalan | 56 | 0.2% |
| Haitian | 82 | 0.2% |
| Hungarian | 211 | 0.6% |
| Indian (Asian) | 399 | 1.1% |
| Indonesian | 175 | 0.5% |
| Irish | 2,883 | 7.7% |
| Iroquois | 84 | 0.2% |
| Italian | 1,478 | 3.9% |
| Japanese | 17 | 0.1% |
| Jordanian | 163 | 0.4% |
| Korean | 630 | 1.7% |
| Laotian | 1 | 0.0% |
| Latvian | 7 | 0.0% |
| Lebanese | 10 | 0.0% |
| Lithuanian | 20 | 0.1% |
| Luxembourger | 59 | 0.2% |
| Malaysian | 145 | 0.4% |
| Menominee | 17 | 0.1% |
| Mexican | 3,416 | 9.1% |
| Mexican American Indian | 35 | 0.1% |
| Moroccan | 72 | 0.2% |
| Nicaraguan | 18 | 0.1% |
| Nigerian | 140 | 0.4% |
| Northern European | 6 | 0.0% |
| Norwegian | 2,104 | 5.6% |
| Pakistani | 34 | 0.1% |
| Palestinian | 57 | 0.2% |
| Panamanian | 21 | 0.1% |
| Pennsylvania German | 9 | 0.0% |
| Peruvian | 65 | 0.2% |
| Polish | 6,183 | 16.5% |
| Portuguese | 6 | 0.0% |
| Puerto Rican | 1,503 | 4.0% |
| Romanian | 35 | 0.1% |
| Russian | 120 | 0.3% |
| Salvadoran | 23 | 0.1% |
| Scandinavian | 101 | 0.3% |
| Scotch-Irish | 147 | 0.4% |
| Scottish | 256 | 0.7% |
| Serbian | 431 | 1.1% |
| Slovak | 235 | 0.6% |
| Slovene | 287 | 0.8% |
| South American | 163 | 0.4% |
| Spaniard | 30 | 0.1% |
| Spanish | 7 | 0.0% |
| Sri Lankan | 197 | 0.5% |
| Subsaharan African | 194 | 0.5% |
| Swedish | 628 | 1.7% |
| Swiss | 115 | 0.3% |
| Thai | 723 | 1.9% |
| Ukrainian | 19 | 0.1% |
| Uruguayan | 13 | 0.0% |
| Venezuelan | 14 | 0.0% |
| Welsh | 13 | 0.0% |
| Yugoslavian | 87 | 0.2% | View All 99 Rows |
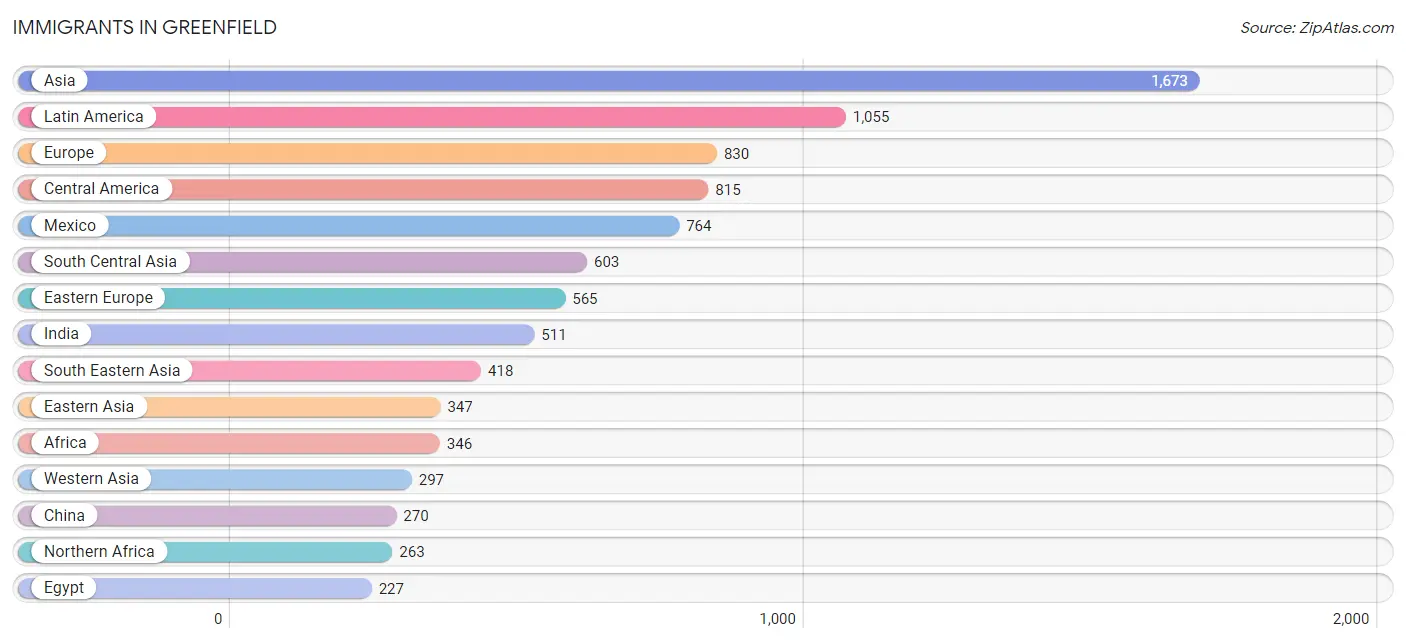
Immigrants in Greenfield
The most numerous immigrant groups reported in Greenfield came from Asia (1,673 | 4.5%), Latin America (1,055 | 2.8%), Europe (830 | 2.2%), Central America (815 | 2.2%), and Mexico (764 | 2.0%), together accounting for 13.7% of all Greenfield residents.
| Immigration Origin | # Population | % Population |
| Africa | 346 | 0.9% |
| Asia | 1,673 | 4.5% |
| Bangladesh | 17 | 0.1% |
| Bosnia and Herzegovina | 22 | 0.1% |
| Canada | 45 | 0.1% |
| Caribbean | 50 | 0.1% |
| Central America | 815 | 2.2% |
| Chile | 8 | 0.0% |
| China | 270 | 0.7% |
| Colombia | 84 | 0.2% |
| Croatia | 119 | 0.3% |
| Cuba | 25 | 0.1% |
| Czechoslovakia | 113 | 0.3% |
| Dominican Republic | 25 | 0.1% |
| Eastern Asia | 347 | 0.9% |
| Eastern Europe | 565 | 1.5% |
| Egypt | 227 | 0.6% |
| El Salvador | 3 | 0.0% |
| England | 11 | 0.0% |
| Europe | 830 | 2.2% |
| Germany | 148 | 0.4% |
| Greece | 23 | 0.1% |
| Guatemala | 28 | 0.1% |
| Guyana | 8 | 0.0% |
| Hong Kong | 8 | 0.0% |
| Hungary | 5 | 0.0% |
| India | 511 | 1.4% |
| Indonesia | 1 | 0.0% |
| Iraq | 48 | 0.1% |
| Ireland | 43 | 0.1% |
| Italy | 40 | 0.1% |
| Jordan | 225 | 0.6% |
| Korea | 77 | 0.2% |
| Kuwait | 8 | 0.0% |
| Laos | 84 | 0.2% |
| Latin America | 1,055 | 2.8% |
| Malaysia | 6 | 0.0% |
| Mexico | 764 | 2.0% |
| Morocco | 36 | 0.1% |
| Nepal | 11 | 0.0% |
| Nicaragua | 6 | 0.0% |
| Nigeria | 83 | 0.2% |
| Northern Africa | 263 | 0.7% |
| Northern Europe | 54 | 0.1% |
| Pakistan | 64 | 0.2% |
| Panama | 14 | 0.0% |
| Peru | 90 | 0.2% |
| Philippines | 174 | 0.5% |
| Poland | 96 | 0.3% |
| Romania | 36 | 0.1% |
| Serbia | 66 | 0.2% |
| Singapore | 5 | 0.0% |
| South America | 190 | 0.5% |
| South Central Asia | 603 | 1.6% |
| South Eastern Asia | 418 | 1.1% |
| Southern Europe | 63 | 0.2% |
| Thailand | 4 | 0.0% |
| Vietnam | 144 | 0.4% |
| Western Africa | 83 | 0.2% |
| Western Asia | 297 | 0.8% |
| Western Europe | 148 | 0.4% |
| Yemen | 4 | 0.0% | View All 62 Rows |
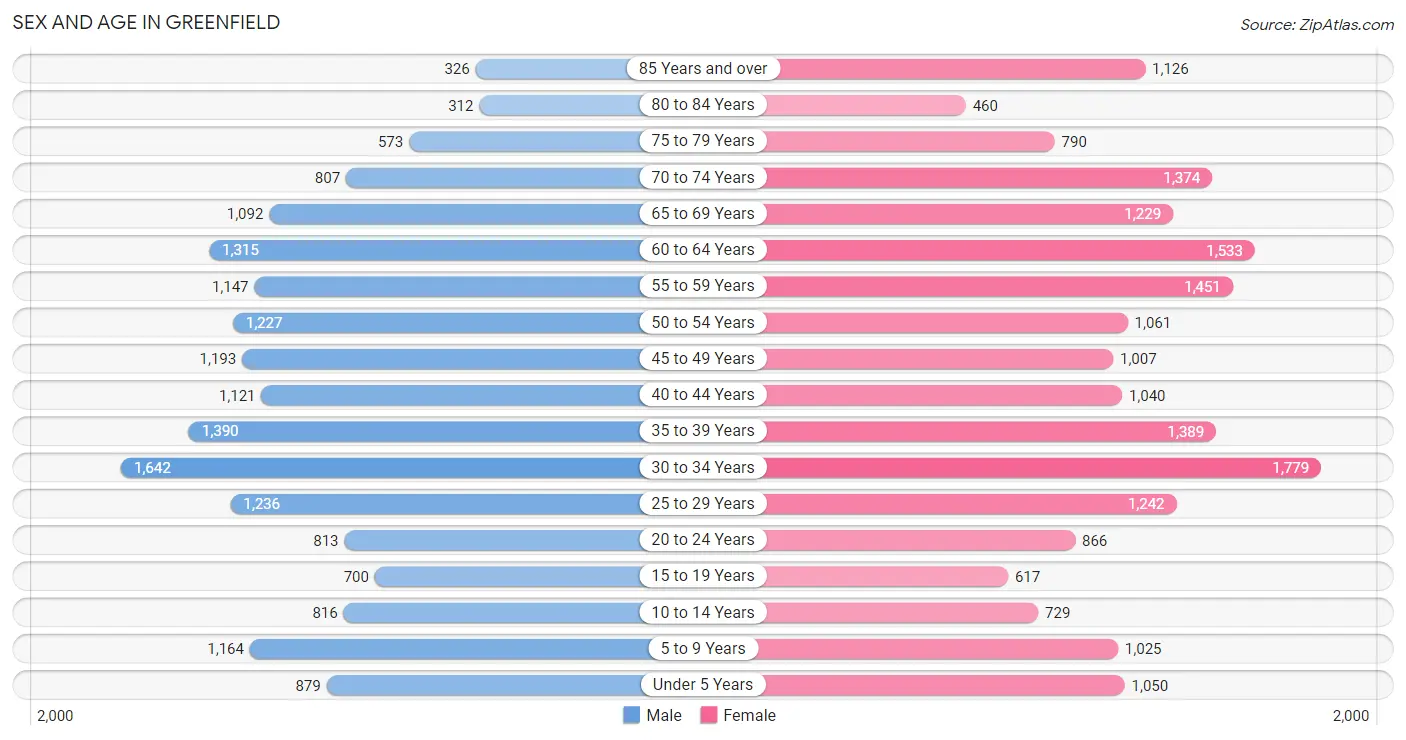
Sex and Age in Greenfield
Sex and Age in Greenfield
The most populous age groups in Greenfield are 30 to 34 Years (1,642 | 9.2%) for men and 30 to 34 Years (1,779 | 9.0%) for women.
| Age Bracket | Male | Female |
| Under 5 Years | 879 (5.0%) | 1,050 (5.3%) |
| 5 to 9 Years | 1,164 (6.6%) | 1,025 (5.2%) |
| 10 to 14 Years | 816 (4.6%) | 729 (3.7%) |
| 15 to 19 Years | 700 (3.9%) | 617 (3.1%) |
| 20 to 24 Years | 813 (4.6%) | 866 (4.4%) |
| 25 to 29 Years | 1,236 (7.0%) | 1,242 (6.3%) |
| 30 to 34 Years | 1,642 (9.2%) | 1,779 (9.0%) |
| 35 to 39 Years | 1,390 (7.8%) | 1,389 (7.0%) |
| 40 to 44 Years | 1,121 (6.3%) | 1,040 (5.3%) |
| 45 to 49 Years | 1,193 (6.7%) | 1,007 (5.1%) |
| 50 to 54 Years | 1,227 (6.9%) | 1,061 (5.4%) |
| 55 to 59 Years | 1,147 (6.5%) | 1,451 (7.3%) |
| 60 to 64 Years | 1,315 (7.4%) | 1,533 (7.7%) |
| 65 to 69 Years | 1,092 (6.1%) | 1,229 (6.2%) |
| 70 to 74 Years | 807 (4.5%) | 1,374 (7.0%) |
| 75 to 79 Years | 573 (3.2%) | 790 (4.0%) |
| 80 to 84 Years | 312 (1.8%) | 460 (2.3%) |
| 85 Years and over | 326 (1.8%) | 1,126 (5.7%) |
| Total | 17,753 (100.0%) | 19,768 (100.0%) |
Families and Households in Greenfield
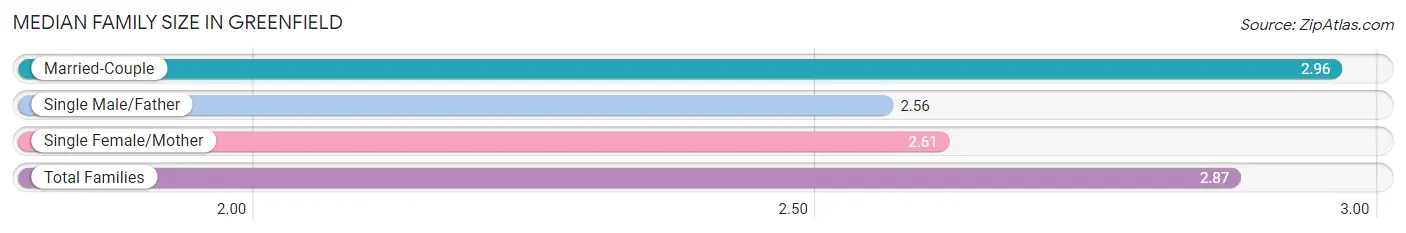
Median Family Size in Greenfield
The median family size in Greenfield is 2.87 persons per family, with married-couple families (6,668 | 73.8%) accounting for the largest median family size of 2.96 persons per family. On the other hand, single male/father families (779 | 8.6%) represent the smallest median family size with 2.56 persons per family.
| Family Type | # Families | Family Size |
| Married-Couple | 6,668 (73.8%) | 2.96 |
| Single Male/Father | 779 (8.6%) | 2.56 |
| Single Female/Mother | 1,592 (17.6%) | 2.61 |
| Total Families | 9,039 (100.0%) | 2.87 |
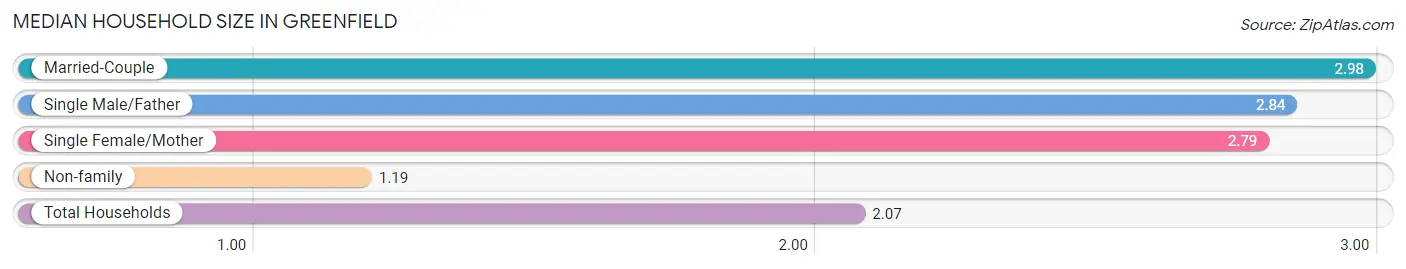
Median Household Size in Greenfield
The median household size in Greenfield is 2.07 persons per household, with married-couple households (6,668 | 37.3%) accounting for the largest median household size of 2.98 persons per household. non-family households (8,844 | 49.4%) represent the smallest median household size with 1.19 persons per household.
| Household Type | # Households | Household Size |
| Married-Couple | 6,668 (37.3%) | 2.98 |
| Single Male/Father | 779 (4.4%) | 2.84 |
| Single Female/Mother | 1,592 (8.9%) | 2.79 |
| Non-family | 8,844 (49.4%) | 1.19 |
| Total Households | 17,883 (100.0%) | 2.07 |
Household Size by Marriage Status in Greenfield
Out of a total of 17,883 households in Greenfield, 9,039 (50.5%) are family households, while 8,844 (49.4%) are nonfamily households. The most numerous type of family households are 2-person households, comprising 4,692, and the most common type of nonfamily households are 1-person households, comprising 7,476.
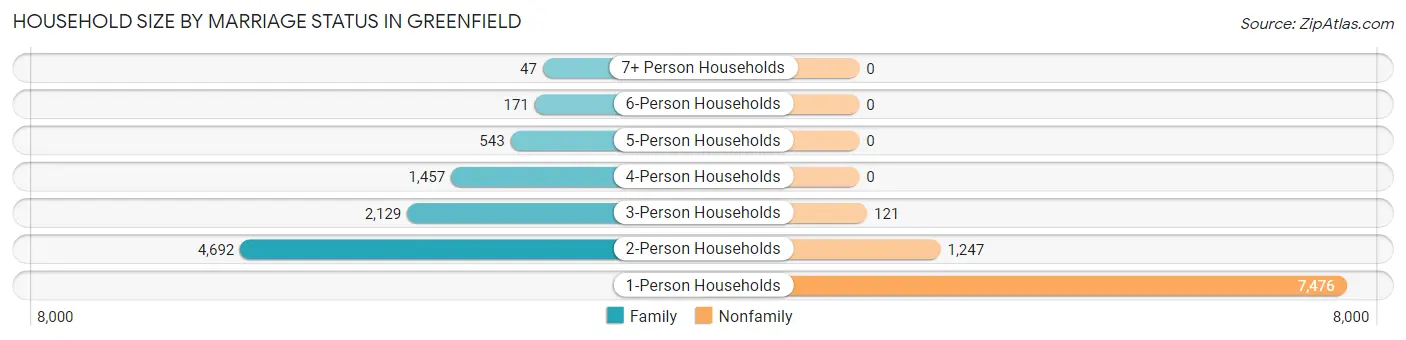
| Household Size | Family Households | Nonfamily Households |
| 1-Person Households | - | 7,476 (41.8%) |
| 2-Person Households | 4,692 (26.2%) | 1,247 (7.0%) |
| 3-Person Households | 2,129 (11.9%) | 121 (0.7%) |
| 4-Person Households | 1,457 (8.2%) | 0 (0.0%) |
| 5-Person Households | 543 (3.0%) | 0 (0.0%) |
| 6-Person Households | 171 (1.0%) | 0 (0.0%) |
| 7+ Person Households | 47 (0.3%) | 0 (0.0%) |
| Total | 9,039 (50.5%) | 8,844 (49.4%) |
Female Fertility in Greenfield
Fertility by Age in Greenfield
Average fertility rate in Greenfield is 42.0 births per 1,000 women. Women in the age bracket of 20 to 34 years have the highest fertility rate with 58.0 births per 1,000 women. Women in the age bracket of 20 to 34 years acount for 65.3% of all women with births.
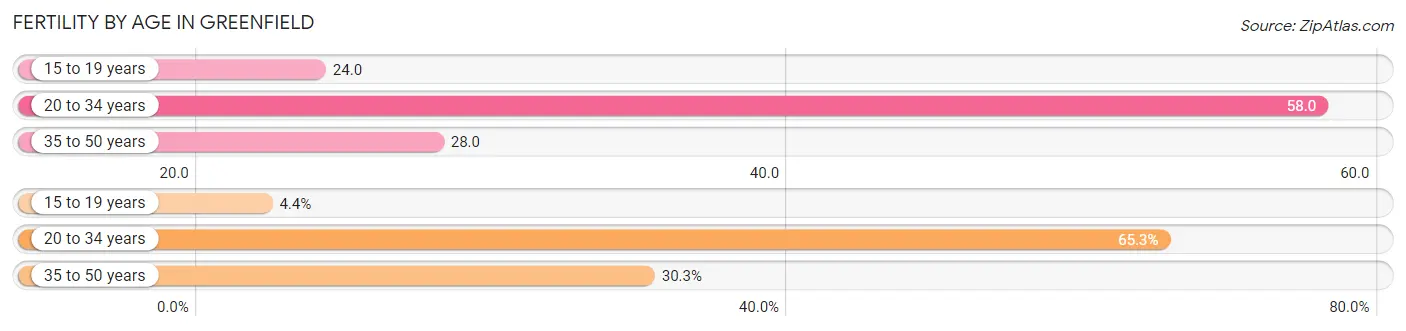
| Age Bracket | Women with Births | Births / 1,000 Women |
| 15 to 19 years | 15 (4.4%) | 24.0 |
| 20 to 34 years | 224 (65.3%) | 58.0 |
| 35 to 50 years | 104 (30.3%) | 28.0 |
| Total | 343 (100.0%) | 42.0 |
Fertility by Age by Marriage Status in Greenfield
81.6% of women with births (343) in Greenfield are married. The highest percentage of unmarried women with births falls into 15 to 19 years age bracket with 100.0% of them unmarried at the time of birth, while the lowest percentage of unmarried women with births belong to 20 to 34 years age bracket with 13.4% of them unmarried.
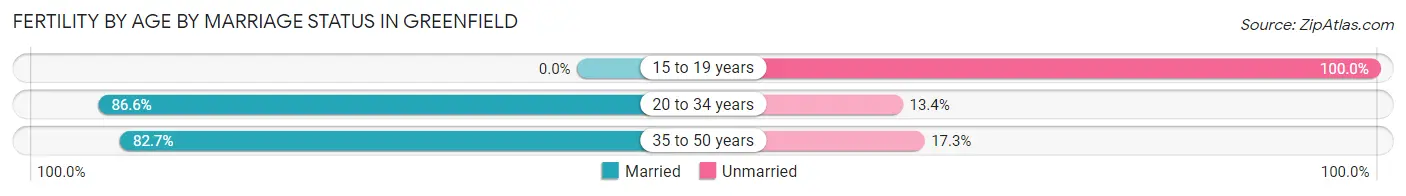
| Age Bracket | Married | Unmarried |
| 15 to 19 years | 0 (0.0%) | 15 (100.0%) |
| 20 to 34 years | 194 (86.6%) | 30 (13.4%) |
| 35 to 50 years | 86 (82.7%) | 18 (17.3%) |
| Total | 280 (81.6%) | 63 (18.4%) |
Fertility by Education in Greenfield
Average fertility rate in Greenfield is 42.0 births per 1,000 women. Women with the education attainment of graduate degree have the highest fertility rate of 124.0 births per 1,000 women, while women with the education attainment of less than high school have the lowest fertility at 20.0 births per 1,000 women. Women with the education attainment of bachelor's degree represent 32.9% of all women with births.
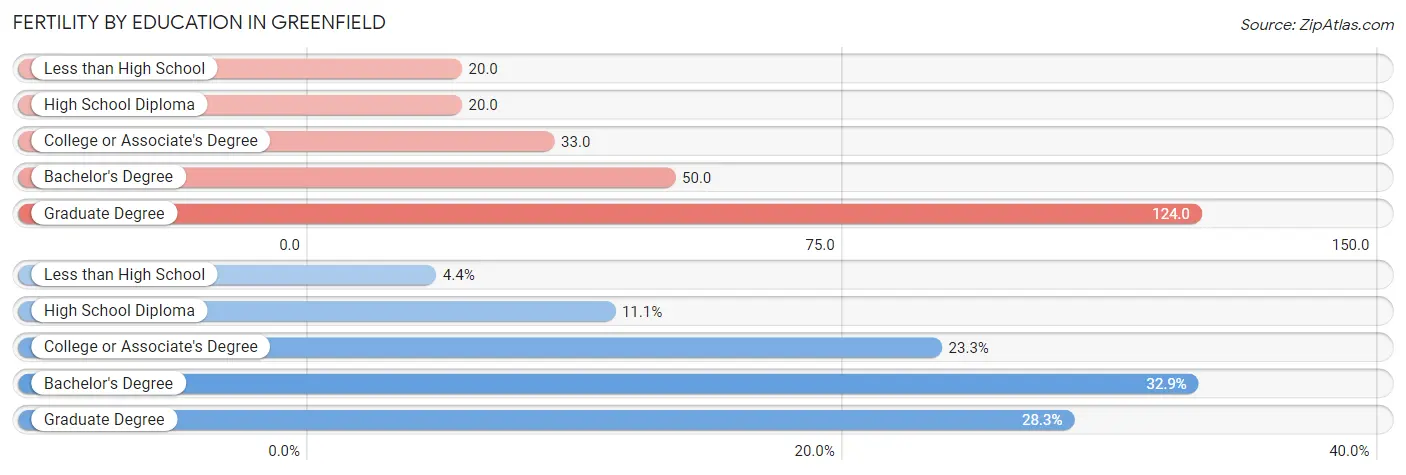
| Educational Attainment | Women with Births | Births / 1,000 Women |
| Less than High School | 15 (4.4%) | 20.0 |
| High School Diploma | 38 (11.1%) | 20.0 |
| College or Associate's Degree | 80 (23.3%) | 33.0 |
| Bachelor's Degree | 113 (32.9%) | 50.0 |
| Graduate Degree | 97 (28.3%) | 124.0 |
| Total | 343 (100.0%) | 42.0 |
Fertility by Education by Marriage Status in Greenfield
18.4% of women with births in Greenfield are unmarried. Women with the educational attainment of high school diploma are most likely to be married with 100.0% of them married at childbirth, while women with the educational attainment of less than high school are least likely to be married with 100.0% of them unmarried at childbirth.
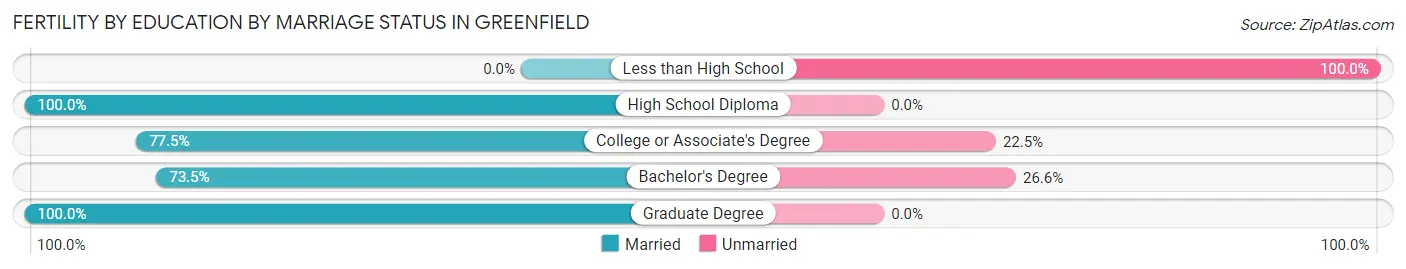
| Educational Attainment | Married | Unmarried |
| Less than High School | 0 (0.0%) | 15 (100.0%) |
| High School Diploma | 38 (100.0%) | 0 (0.0%) |
| College or Associate's Degree | 62 (77.5%) | 18 (22.5%) |
| Bachelor's Degree | 83 (73.5%) | 30 (26.6%) |
| Graduate Degree | 97 (100.0%) | 0 (0.0%) |
| Total | 280 (81.6%) | 63 (18.4%) |
Employment Characteristics in Greenfield
Employment by Class of Employer in Greenfield
Among the 19,802 employed individuals in Greenfield, private company employees (14,449 | 73.0%), not-for-profit organizations (2,168 | 11.0%), and local government employees (1,159 | 5.9%) make up the most common classes of employment.
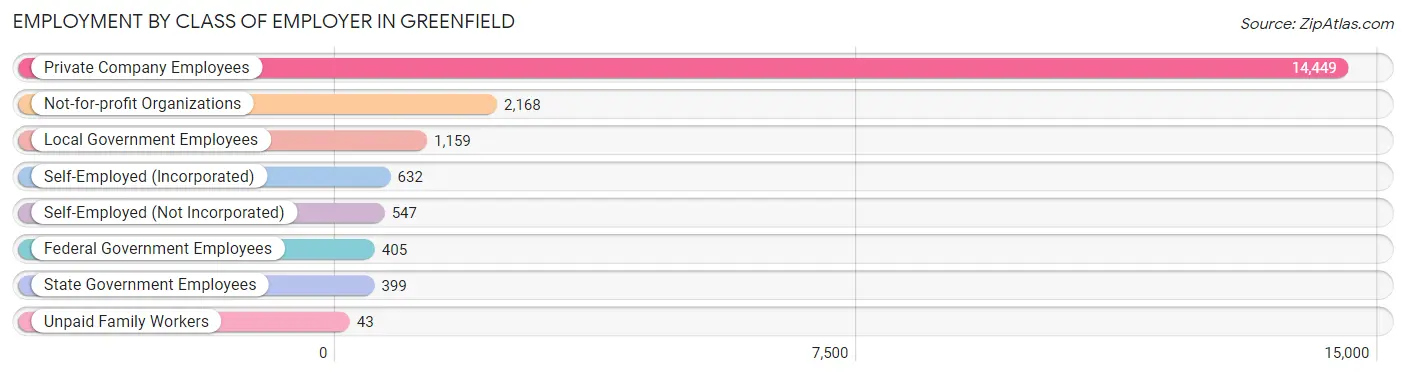
| Employer Class | # Employees | % Employees |
| Private Company Employees | 14,449 | 73.0% |
| Self-Employed (Incorporated) | 632 | 3.2% |
| Self-Employed (Not Incorporated) | 547 | 2.8% |
| Not-for-profit Organizations | 2,168 | 11.0% |
| Local Government Employees | 1,159 | 5.9% |
| State Government Employees | 399 | 2.0% |
| Federal Government Employees | 405 | 2.1% |
| Unpaid Family Workers | 43 | 0.2% |
| Total | 19,802 | 100.0% |
Employment Status by Age in Greenfield
According to the labor force statistics for Greenfield, out of the total population over 16 years of age (31,567), 65.4% or 20,645 individuals are in the labor force, with 3.5% or 723 of them unemployed. The age group with the highest labor force participation rate is 30 to 34 years, with 94.9% or 3,247 individuals in the labor force. Within the labor force, the 16 to 19 years age range has the highest percentage of unemployed individuals, with 11.9% or 62 of them being unemployed.
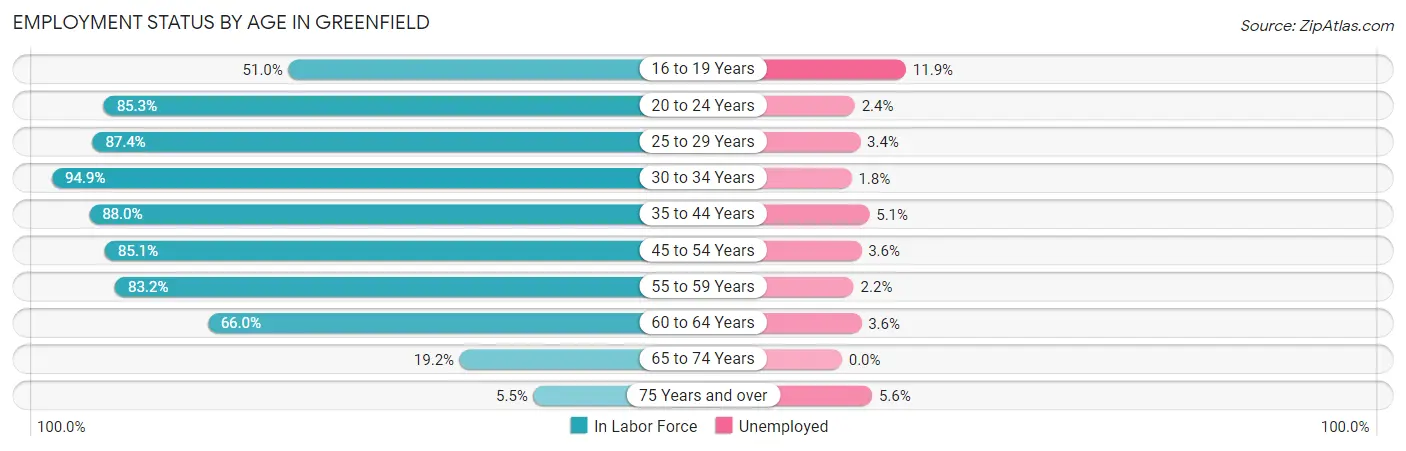
| Age Bracket | In Labor Force | Unemployed |
| 16 to 19 Years | 523 (51.0%) | 62 (11.9%) |
| 20 to 24 Years | 1,432 (85.3%) | 34 (2.4%) |
| 25 to 29 Years | 2,166 (87.4%) | 74 (3.4%) |
| 30 to 34 Years | 3,247 (94.9%) | 58 (1.8%) |
| 35 to 44 Years | 4,347 (88.0%) | 222 (5.1%) |
| 45 to 54 Years | 3,819 (85.1%) | 137 (3.6%) |
| 55 to 59 Years | 2,162 (83.2%) | 48 (2.2%) |
| 60 to 64 Years | 1,880 (66.0%) | 68 (3.6%) |
| 65 to 74 Years | 864 (19.2%) | 0 (0.0%) |
| 75 Years and over | 197 (5.5%) | 11 (5.6%) |
| Total | 20,645 (65.4%) | 723 (3.5%) |
Employment Status by Educational Attainment in Greenfield
According to labor force statistics for Greenfield, 84.8% of individuals (17,616) out of the total population between 25 and 64 years of age (20,773) are in the labor force, with 3.4% or 599 of them being unemployed. The group with the highest labor force participation rate are those with the educational attainment of bachelor's degree or higher, with 90.5% or 6,530 individuals in the labor force. Within the labor force, individuals with high school diploma education have the highest percentage of unemployment, with 5.5% or 250 of them being unemployed.
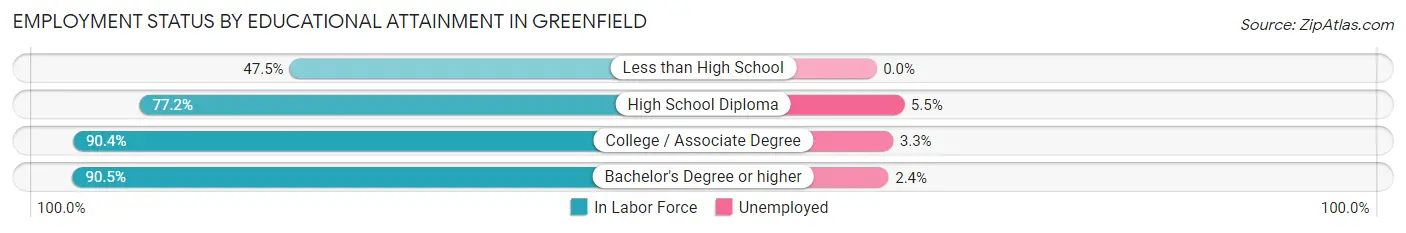
| Educational Attainment | In Labor Force | Unemployed |
| Less than High School | 422 (47.5%) | 0 (0.0%) |
| High School Diploma | 4,551 (77.2%) | 324 (5.5%) |
| College / Associate Degree | 6,124 (90.4%) | 224 (3.3%) |
| Bachelor's Degree or higher | 6,530 (90.5%) | 173 (2.4%) |
| Total | 17,616 (84.8%) | 706 (3.4%) |
Employment Occupations by Sex in Greenfield
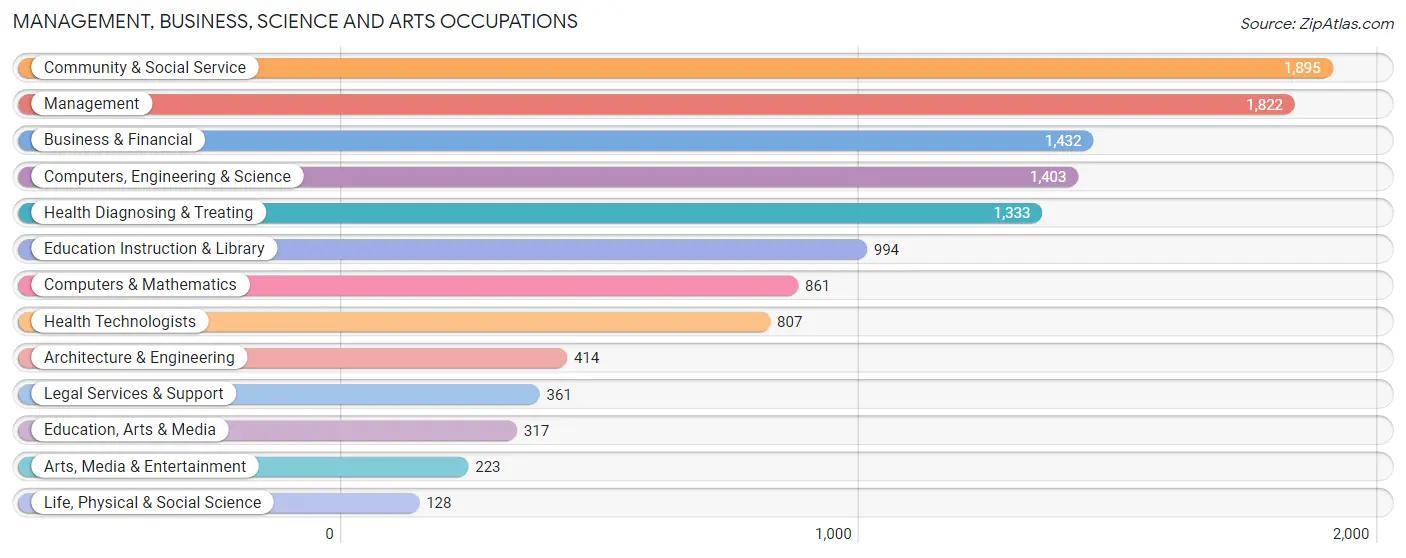
Management, Business, Science and Arts Occupations
The most common Management, Business, Science and Arts occupations in Greenfield are Community & Social Service (1,895 | 9.5%), Management (1,822 | 9.2%), Business & Financial (1,432 | 7.2%), Computers, Engineering & Science (1,403 | 7.0%), and Health Diagnosing & Treating (1,333 | 6.7%).
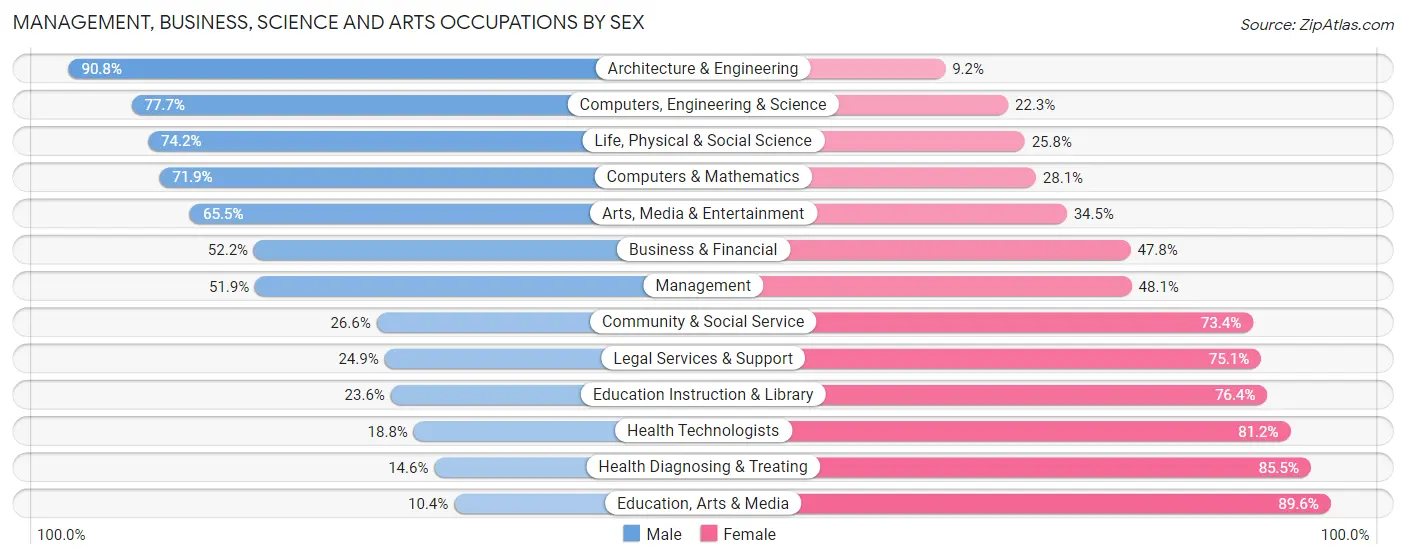
Management, Business, Science and Arts Occupations by Sex
Within the Management, Business, Science and Arts occupations in Greenfield, the most male-oriented occupations are Architecture & Engineering (90.8%), Computers, Engineering & Science (77.7%), and Life, Physical & Social Science (74.2%), while the most female-oriented occupations are Education, Arts & Media (89.6%), Health Diagnosing & Treating (85.5%), and Health Technologists (81.2%).
| Occupation | Male | Female |
| Management | 946 (51.9%) | 876 (48.1%) |
| Business & Financial | 747 (52.2%) | 685 (47.8%) |
| Computers, Engineering & Science | 1,090 (77.7%) | 313 (22.3%) |
| Computers & Mathematics | 619 (71.9%) | 242 (28.1%) |
| Architecture & Engineering | 376 (90.8%) | 38 (9.2%) |
| Life, Physical & Social Science | 95 (74.2%) | 33 (25.8%) |
| Community & Social Service | 504 (26.6%) | 1,391 (73.4%) |
| Education, Arts & Media | 33 (10.4%) | 284 (89.6%) |
| Legal Services & Support | 90 (24.9%) | 271 (75.1%) |
| Education Instruction & Library | 235 (23.6%) | 759 (76.4%) |
| Arts, Media & Entertainment | 146 (65.5%) | 77 (34.5%) |
| Health Diagnosing & Treating | 194 (14.5%) | 1,139 (85.5%) |
| Health Technologists | 152 (18.8%) | 655 (81.2%) |
| Total (Category) | 3,481 (44.2%) | 4,404 (55.8%) |
| Total (Overall) | 10,069 (50.6%) | 9,818 (49.4%) |
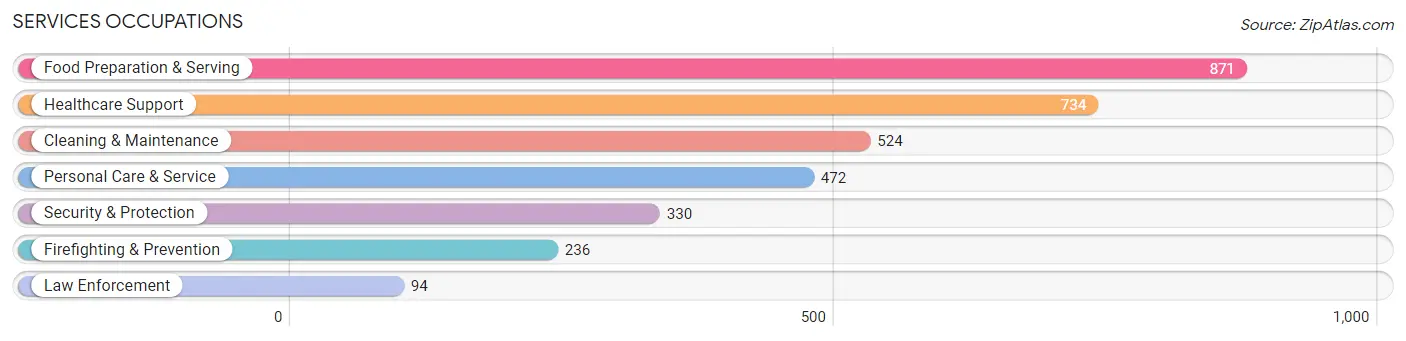
Services Occupations
The most common Services occupations in Greenfield are Food Preparation & Serving (871 | 4.4%), Healthcare Support (734 | 3.7%), Cleaning & Maintenance (524 | 2.6%), Personal Care & Service (472 | 2.4%), and Security & Protection (330 | 1.7%).
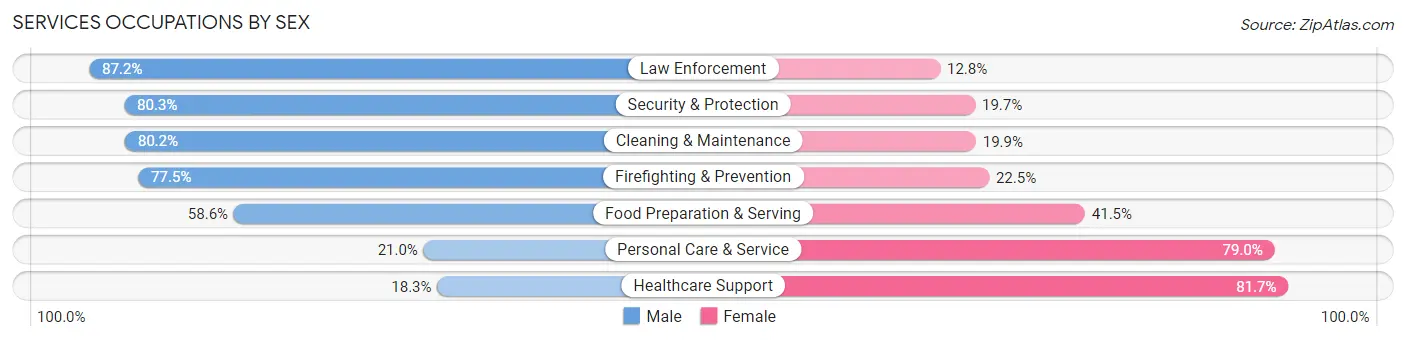
Services Occupations by Sex
Within the Services occupations in Greenfield, the most male-oriented occupations are Law Enforcement (87.2%), Security & Protection (80.3%), and Cleaning & Maintenance (80.1%), while the most female-oriented occupations are Healthcare Support (81.7%), Personal Care & Service (79.0%), and Food Preparation & Serving (41.4%).
| Occupation | Male | Female |
| Healthcare Support | 134 (18.3%) | 600 (81.7%) |
| Security & Protection | 265 (80.3%) | 65 (19.7%) |
| Firefighting & Prevention | 183 (77.5%) | 53 (22.5%) |
| Law Enforcement | 82 (87.2%) | 12 (12.8%) |
| Food Preparation & Serving | 510 (58.6%) | 361 (41.4%) |
| Cleaning & Maintenance | 420 (80.1%) | 104 (19.9%) |
| Personal Care & Service | 99 (21.0%) | 373 (79.0%) |
| Total (Category) | 1,428 (48.7%) | 1,503 (51.3%) |
| Total (Overall) | 10,069 (50.6%) | 9,818 (49.4%) |
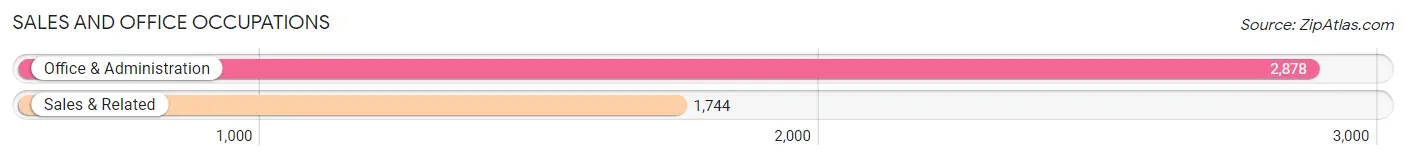
Sales and Office Occupations
The most common Sales and Office occupations in Greenfield are Office & Administration (2,878 | 14.5%), and Sales & Related (1,744 | 8.8%).
Sales and Office Occupations by Sex
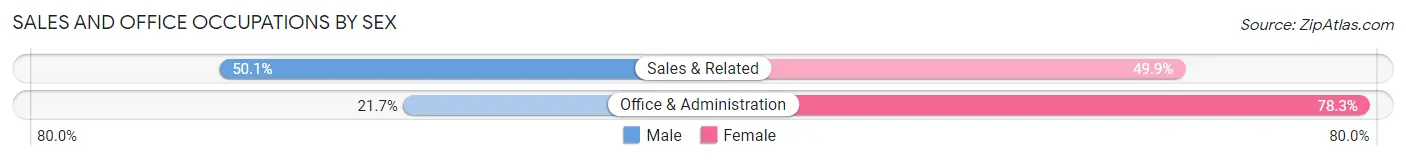
| Occupation | Male | Female |
| Sales & Related | 873 (50.1%) | 871 (49.9%) |
| Office & Administration | 624 (21.7%) | 2,254 (78.3%) |
| Total (Category) | 1,497 (32.4%) | 3,125 (67.6%) |
| Total (Overall) | 10,069 (50.6%) | 9,818 (49.4%) |
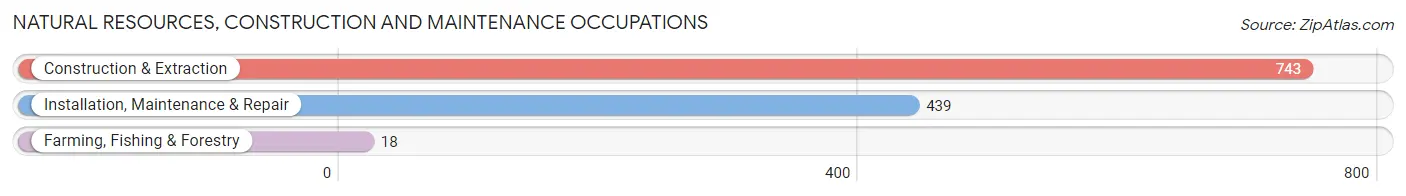
Natural Resources, Construction and Maintenance Occupations
The most common Natural Resources, Construction and Maintenance occupations in Greenfield are Construction & Extraction (743 | 3.7%), Installation, Maintenance & Repair (439 | 2.2%), and Farming, Fishing & Forestry (18 | 0.1%).
Natural Resources, Construction and Maintenance Occupations by Sex
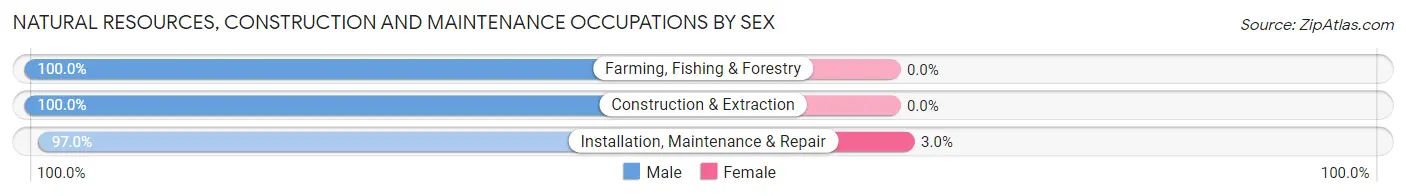
| Occupation | Male | Female |
| Farming, Fishing & Forestry | 18 (100.0%) | 0 (0.0%) |
| Construction & Extraction | 743 (100.0%) | 0 (0.0%) |
| Installation, Maintenance & Repair | 426 (97.0%) | 13 (3.0%) |
| Total (Category) | 1,187 (98.9%) | 13 (1.1%) |
| Total (Overall) | 10,069 (50.6%) | 9,818 (49.4%) |
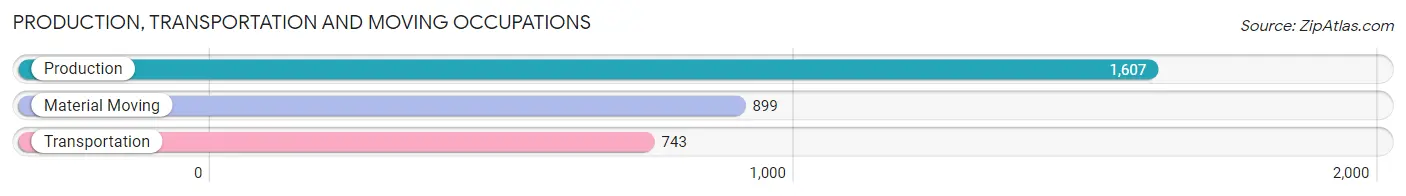
Production, Transportation and Moving Occupations
The most common Production, Transportation and Moving occupations in Greenfield are Production (1,607 | 8.1%), Material Moving (899 | 4.5%), and Transportation (743 | 3.7%).
Production, Transportation and Moving Occupations by Sex
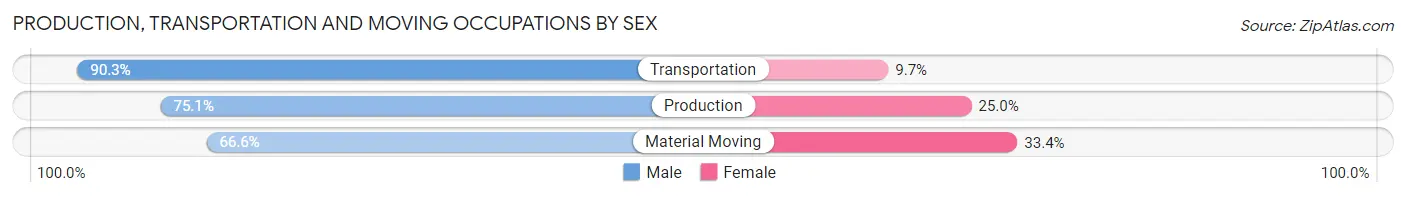
| Occupation | Male | Female |
| Production | 1,206 (75.0%) | 401 (24.9%) |
| Transportation | 671 (90.3%) | 72 (9.7%) |
| Material Moving | 599 (66.6%) | 300 (33.4%) |
| Total (Category) | 2,476 (76.2%) | 773 (23.8%) |
| Total (Overall) | 10,069 (50.6%) | 9,818 (49.4%) |
Employment Industries by Sex in Greenfield
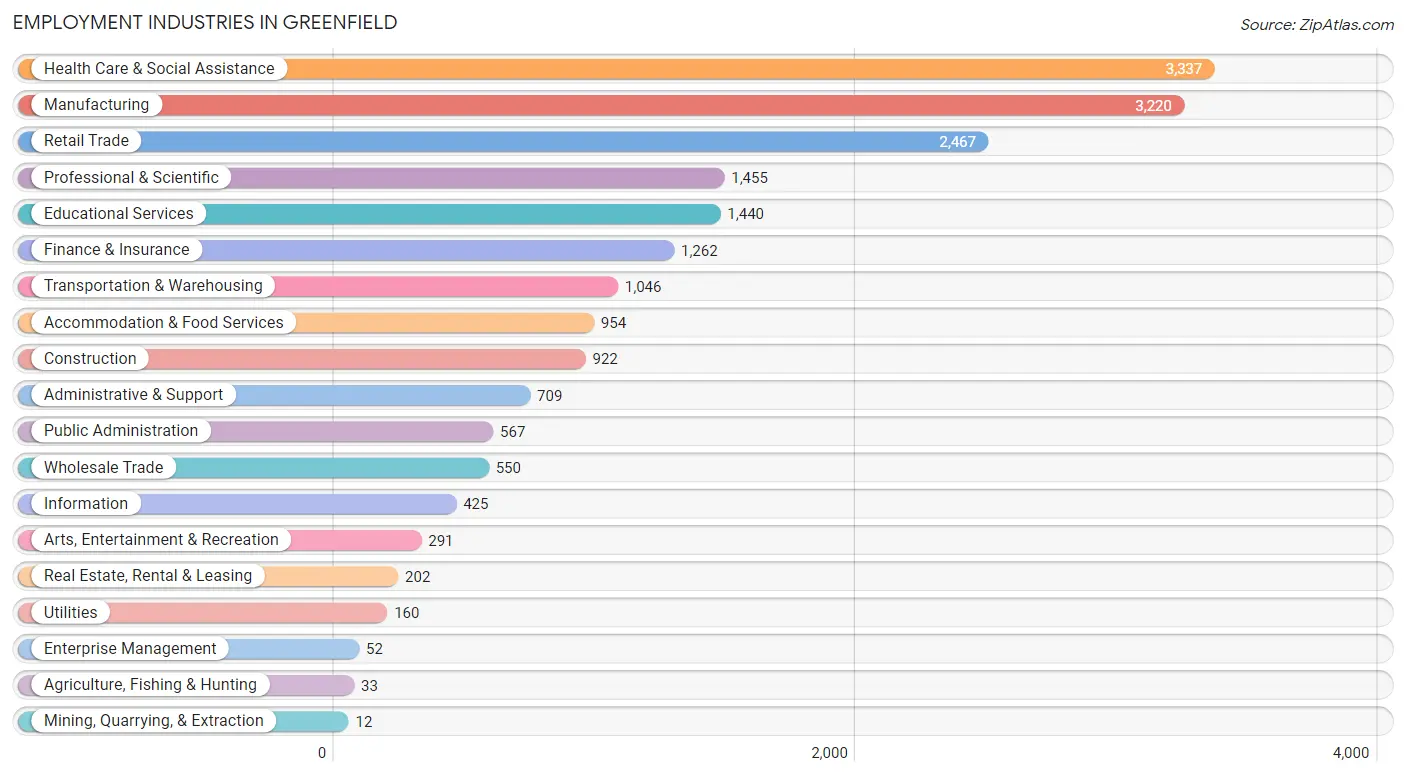
Employment Industries in Greenfield
The major employment industries in Greenfield include Health Care & Social Assistance (3,337 | 16.8%), Manufacturing (3,220 | 16.2%), Retail Trade (2,467 | 12.4%), Professional & Scientific (1,455 | 7.3%), and Educational Services (1,440 | 7.2%).
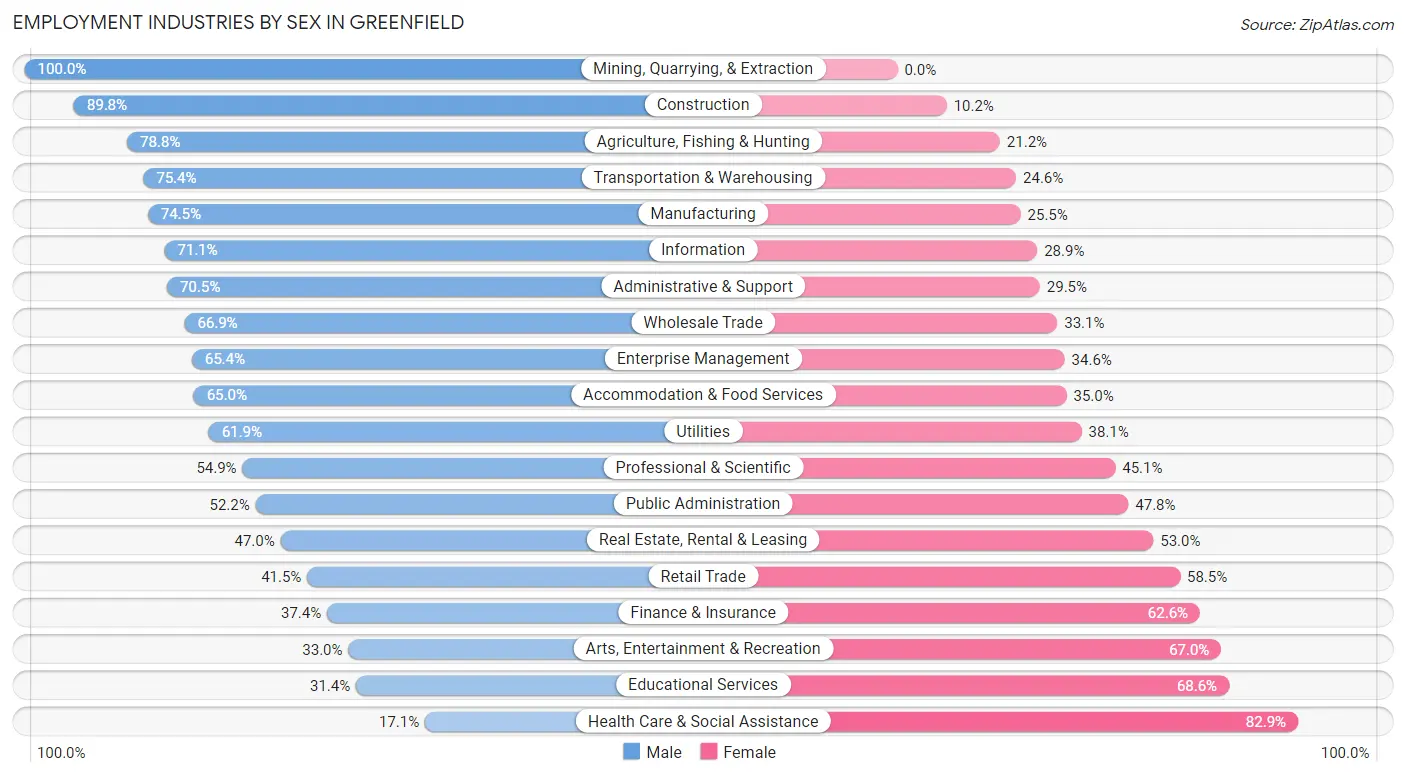
Employment Industries by Sex in Greenfield
The Greenfield industries that see more men than women are Mining, Quarrying, & Extraction (100.0%), Construction (89.8%), and Agriculture, Fishing & Hunting (78.8%), whereas the industries that tend to have a higher number of women are Health Care & Social Assistance (82.9%), Educational Services (68.6%), and Arts, Entertainment & Recreation (67.0%).
| Industry | Male | Female |
| Agriculture, Fishing & Hunting | 26 (78.8%) | 7 (21.2%) |
| Mining, Quarrying, & Extraction | 12 (100.0%) | 0 (0.0%) |
| Construction | 828 (89.8%) | 94 (10.2%) |
| Manufacturing | 2,399 (74.5%) | 821 (25.5%) |
| Wholesale Trade | 368 (66.9%) | 182 (33.1%) |
| Retail Trade | 1,024 (41.5%) | 1,443 (58.5%) |
| Transportation & Warehousing | 789 (75.4%) | 257 (24.6%) |
| Utilities | 99 (61.9%) | 61 (38.1%) |
| Information | 302 (71.1%) | 123 (28.9%) |
| Finance & Insurance | 472 (37.4%) | 790 (62.6%) |
| Real Estate, Rental & Leasing | 95 (47.0%) | 107 (53.0%) |
| Professional & Scientific | 799 (54.9%) | 656 (45.1%) |
| Enterprise Management | 34 (65.4%) | 18 (34.6%) |
| Administrative & Support | 500 (70.5%) | 209 (29.5%) |
| Educational Services | 452 (31.4%) | 988 (68.6%) |
| Health Care & Social Assistance | 571 (17.1%) | 2,766 (82.9%) |
| Arts, Entertainment & Recreation | 96 (33.0%) | 195 (67.0%) |
| Accommodation & Food Services | 620 (65.0%) | 334 (35.0%) |
| Public Administration | 296 (52.2%) | 271 (47.8%) |
| Total | 10,069 (50.6%) | 9,818 (49.4%) |
Education in Greenfield
School Enrollment in Greenfield
The most common levels of schooling among the 6,769 students in Greenfield are elementary school (1,719 | 25.4%), middle school (1,237 | 18.3%), and college / undergraduate (1,214 | 17.9%).
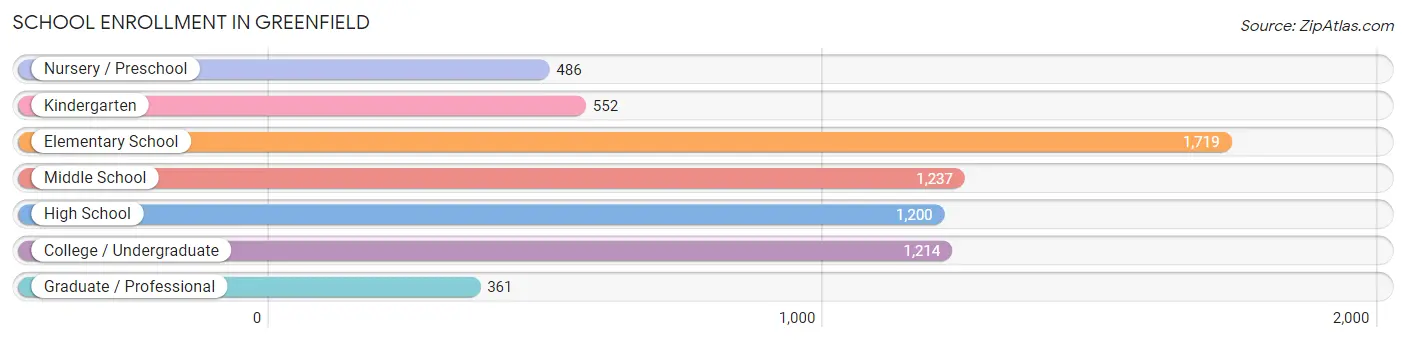
| School Level | # Students | % Students |
| Nursery / Preschool | 486 | 7.2% |
| Kindergarten | 552 | 8.2% |
| Elementary School | 1,719 | 25.4% |
| Middle School | 1,237 | 18.3% |
| High School | 1,200 | 17.7% |
| College / Undergraduate | 1,214 | 17.9% |
| Graduate / Professional | 361 | 5.3% |
| Total | 6,769 | 100.0% |
School Enrollment by Age by Funding Source in Greenfield
Out of a total of 6,769 students who are enrolled in schools in Greenfield, 1,157 (17.1%) attend a private institution, while the remaining 5,612 (82.9%) are enrolled in public schools. The age group of 3 to 4 year olds has the highest likelihood of being enrolled in private schools, with 239 (53.0% in the age bracket) enrolled. Conversely, the age group of 10 to 14 year olds has the lowest likelihood of being enrolled in a private school, with 1,398 (92.6% in the age bracket) attending a public institution.
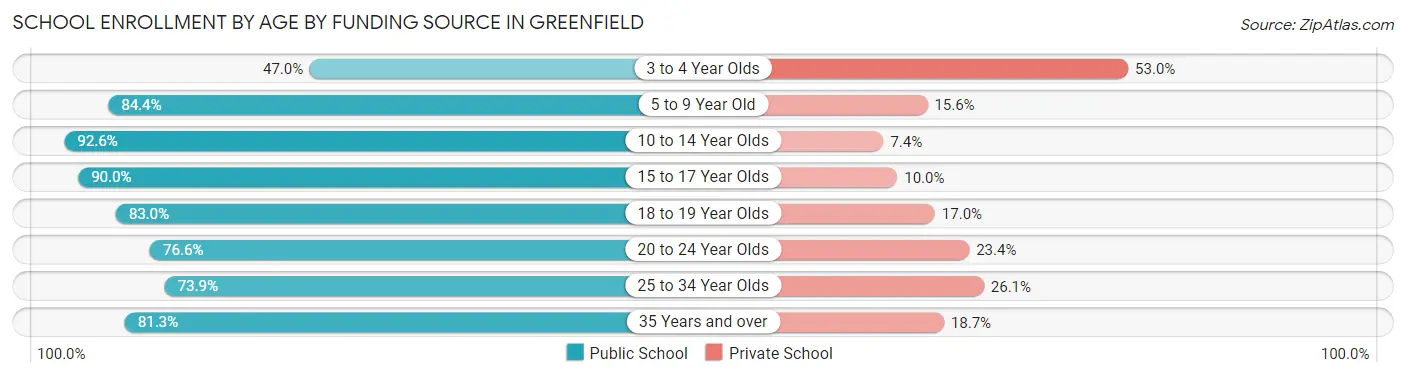
| Age Bracket | Public School | Private School |
| 3 to 4 Year Olds | 212 (47.0%) | 239 (53.0%) |
| 5 to 9 Year Old | 1,823 (84.4%) | 337 (15.6%) |
| 10 to 14 Year Olds | 1,398 (92.6%) | 112 (7.4%) |
| 15 to 17 Year Olds | 775 (90.0%) | 86 (10.0%) |
| 18 to 19 Year Olds | 254 (83.0%) | 52 (17.0%) |
| 20 to 24 Year Olds | 465 (76.6%) | 142 (23.4%) |
| 25 to 34 Year Olds | 266 (73.9%) | 94 (26.1%) |
| 35 Years and over | 418 (81.3%) | 96 (18.7%) |
| Total | 5,612 (82.9%) | 1,157 (17.1%) |
Educational Attainment by Field of Study in Greenfield
Business (2,141 | 21.9%), science & technology (1,289 | 13.2%), education (1,235 | 12.7%), arts & humanities (693 | 7.1%), and bio, nature & agricultural (683 | 7.0%) are the most common fields of study among 9,758 individuals in Greenfield who have obtained a bachelor's degree or higher.
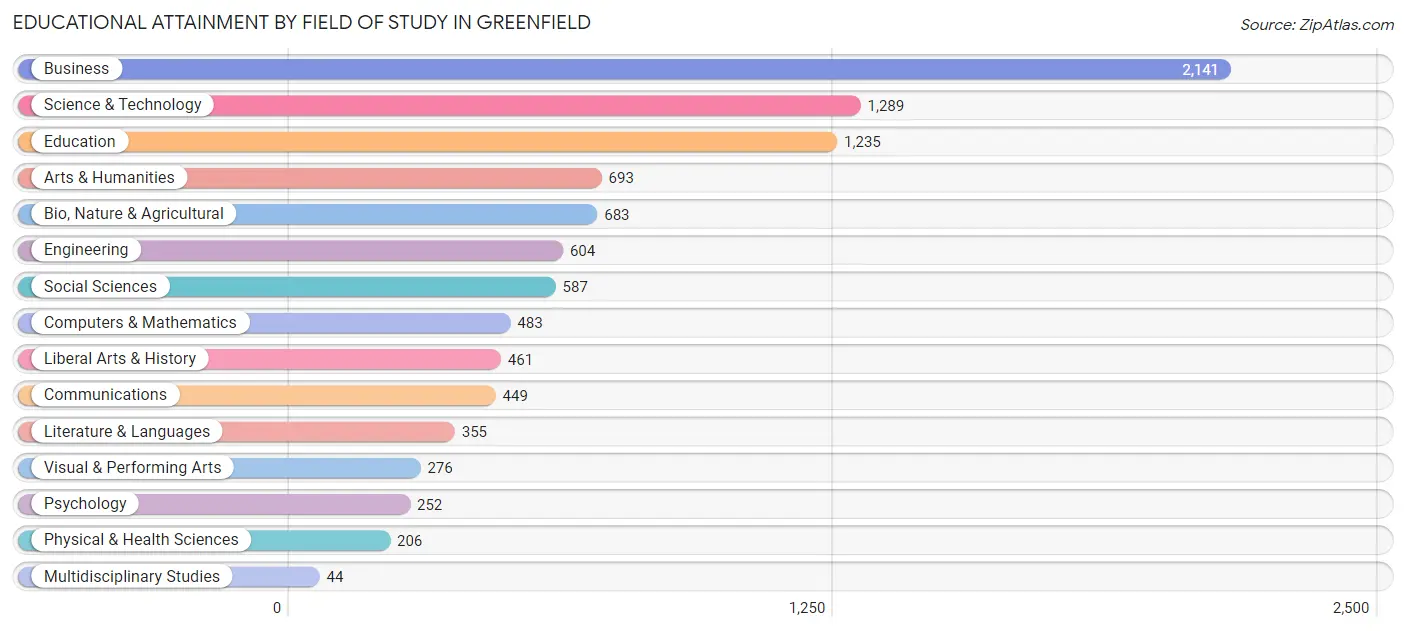
| Field of Study | # Graduates | % Graduates |
| Computers & Mathematics | 483 | 5.0% |
| Bio, Nature & Agricultural | 683 | 7.0% |
| Physical & Health Sciences | 206 | 2.1% |
| Psychology | 252 | 2.6% |
| Social Sciences | 587 | 6.0% |
| Engineering | 604 | 6.2% |
| Multidisciplinary Studies | 44 | 0.4% |
| Science & Technology | 1,289 | 13.2% |
| Business | 2,141 | 21.9% |
| Education | 1,235 | 12.7% |
| Literature & Languages | 355 | 3.6% |
| Liberal Arts & History | 461 | 4.7% |
| Visual & Performing Arts | 276 | 2.8% |
| Communications | 449 | 4.6% |
| Arts & Humanities | 693 | 7.1% |
| Total | 9,758 | 100.0% |
Transportation & Commute in Greenfield
Vehicle Availability by Sex in Greenfield
The most prevalent vehicle ownership categories in Greenfield are males with 2 vehicles (5,981, accounting for 59.6%) and females with 2 vehicles (4,737, making up 61.3%).
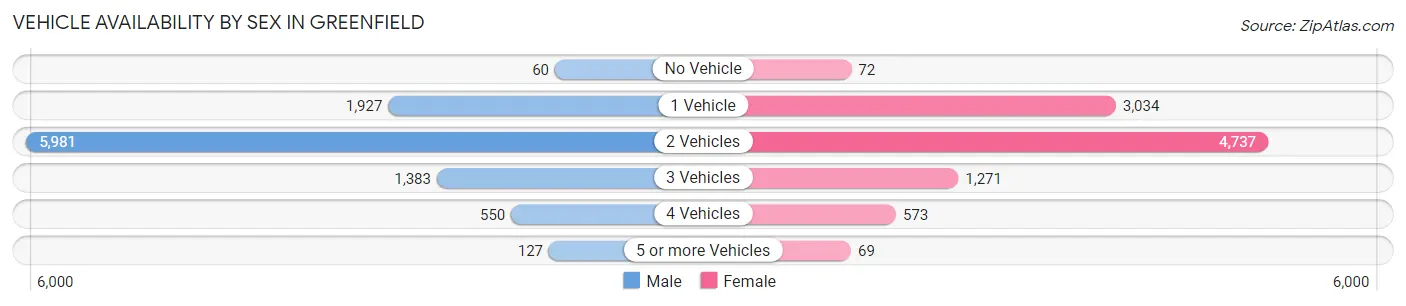
| Vehicles Available | Male | Female |
| No Vehicle | 60 (0.6%) | 72 (0.7%) |
| 1 Vehicle | 1,927 (19.2%) | 3,034 (31.1%) |
| 2 Vehicles | 5,981 (59.6%) | 4,737 (48.5%) |
| 3 Vehicles | 1,383 (13.8%) | 1,271 (13.0%) |
| 4 Vehicles | 550 (5.5%) | 573 (5.9%) |
| 5 or more Vehicles | 127 (1.3%) | 69 (0.7%) |
| Total | 10,028 (100.0%) | 9,756 (100.0%) |
Commute Time in Greenfield
The most frequently occuring commute durations in Greenfield are 15 to 19 minutes (4,110 commuters, 23.2%), 20 to 24 minutes (3,360 commuters, 19.0%), and 30 to 34 minutes (2,301 commuters, 13.0%).
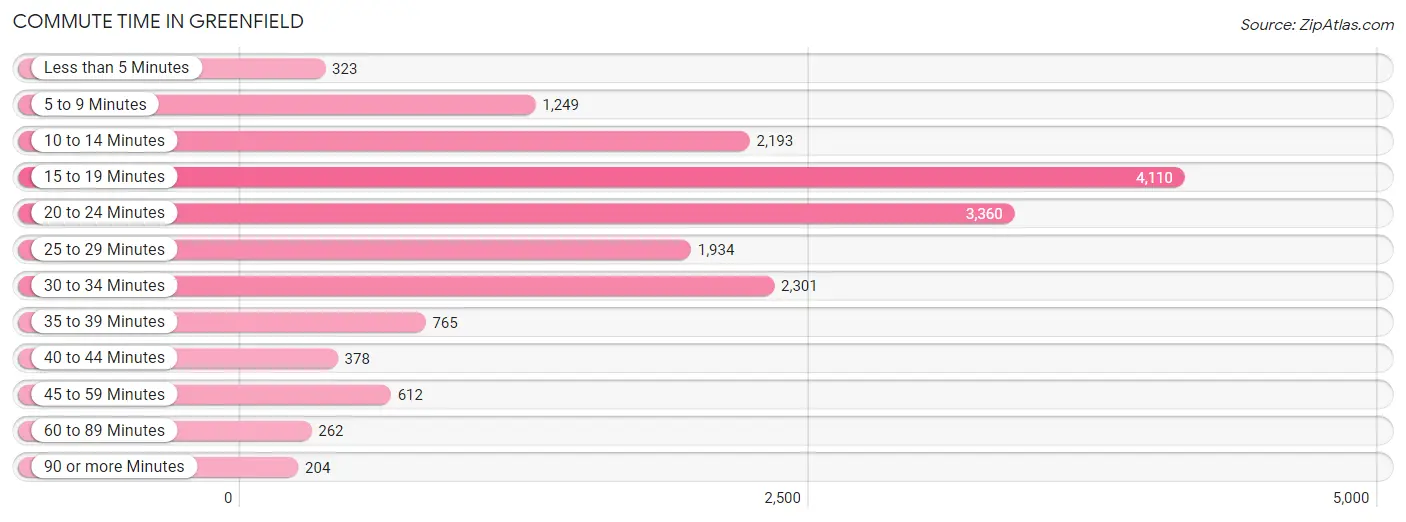
| Commute Time | # Commuters | % Commuters |
| Less than 5 Minutes | 323 | 1.8% |
| 5 to 9 Minutes | 1,249 | 7.1% |
| 10 to 14 Minutes | 2,193 | 12.4% |
| 15 to 19 Minutes | 4,110 | 23.2% |
| 20 to 24 Minutes | 3,360 | 19.0% |
| 25 to 29 Minutes | 1,934 | 10.9% |
| 30 to 34 Minutes | 2,301 | 13.0% |
| 35 to 39 Minutes | 765 | 4.3% |
| 40 to 44 Minutes | 378 | 2.1% |
| 45 to 59 Minutes | 612 | 3.5% |
| 60 to 89 Minutes | 262 | 1.5% |
| 90 or more Minutes | 204 | 1.1% |
Commute Time by Sex in Greenfield
The most common commute times in Greenfield are 15 to 19 minutes (2,011 commuters, 22.3%) for males and 15 to 19 minutes (2,099 commuters, 24.2%) for females.
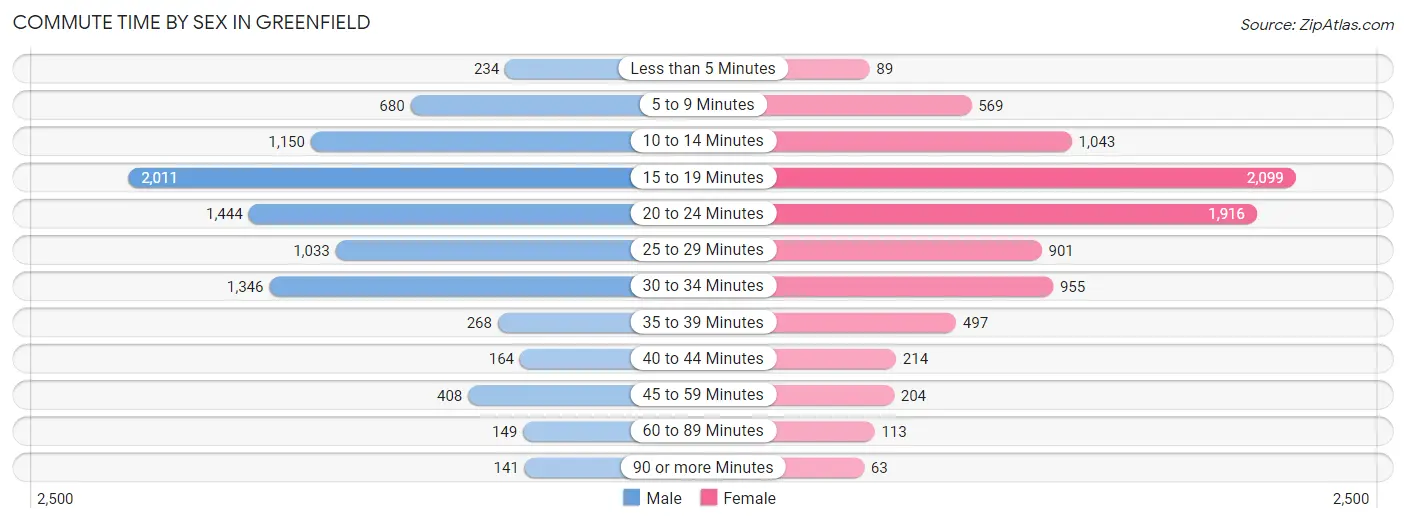
| Commute Time | Male | Female |
| Less than 5 Minutes | 234 (2.6%) | 89 (1.0%) |
| 5 to 9 Minutes | 680 (7.5%) | 569 (6.6%) |
| 10 to 14 Minutes | 1,150 (12.7%) | 1,043 (12.0%) |
| 15 to 19 Minutes | 2,011 (22.3%) | 2,099 (24.2%) |
| 20 to 24 Minutes | 1,444 (16.0%) | 1,916 (22.1%) |
| 25 to 29 Minutes | 1,033 (11.4%) | 901 (10.4%) |
| 30 to 34 Minutes | 1,346 (14.9%) | 955 (11.0%) |
| 35 to 39 Minutes | 268 (3.0%) | 497 (5.7%) |
| 40 to 44 Minutes | 164 (1.8%) | 214 (2.5%) |
| 45 to 59 Minutes | 408 (4.5%) | 204 (2.4%) |
| 60 to 89 Minutes | 149 (1.7%) | 113 (1.3%) |
| 90 or more Minutes | 141 (1.6%) | 63 (0.7%) |
Time of Departure to Work by Sex in Greenfield
The most frequent times of departure to work in Greenfield are 7:00 AM to 7:29 AM (1,607, 17.8%) for males and 7:00 AM to 7:29 AM (1,553, 17.9%) for females.
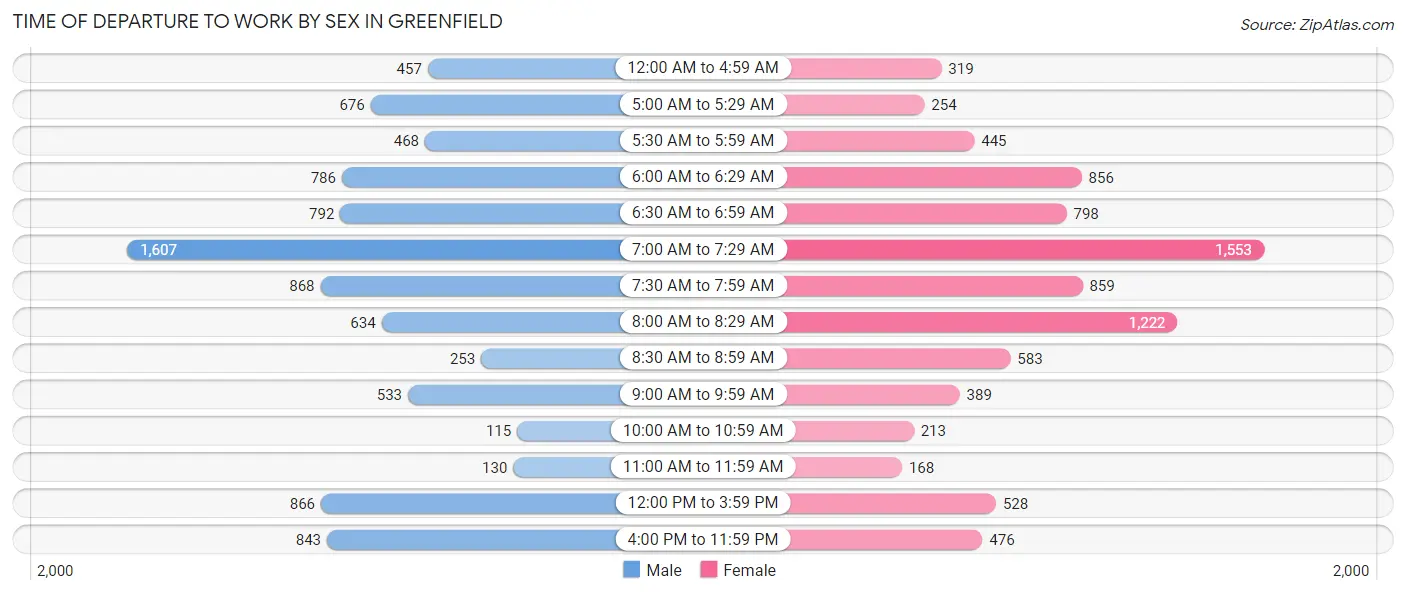
| Time of Departure | Male | Female |
| 12:00 AM to 4:59 AM | 457 (5.1%) | 319 (3.7%) |
| 5:00 AM to 5:29 AM | 676 (7.5%) | 254 (2.9%) |
| 5:30 AM to 5:59 AM | 468 (5.2%) | 445 (5.1%) |
| 6:00 AM to 6:29 AM | 786 (8.7%) | 856 (9.9%) |
| 6:30 AM to 6:59 AM | 792 (8.8%) | 798 (9.2%) |
| 7:00 AM to 7:29 AM | 1,607 (17.8%) | 1,553 (17.9%) |
| 7:30 AM to 7:59 AM | 868 (9.6%) | 859 (9.9%) |
| 8:00 AM to 8:29 AM | 634 (7.0%) | 1,222 (14.1%) |
| 8:30 AM to 8:59 AM | 253 (2.8%) | 583 (6.7%) |
| 9:00 AM to 9:59 AM | 533 (5.9%) | 389 (4.5%) |
| 10:00 AM to 10:59 AM | 115 (1.3%) | 213 (2.5%) |
| 11:00 AM to 11:59 AM | 130 (1.4%) | 168 (1.9%) |
| 12:00 PM to 3:59 PM | 866 (9.6%) | 528 (6.1%) |
| 4:00 PM to 11:59 PM | 843 (9.3%) | 476 (5.5%) |
| Total | 9,028 (100.0%) | 8,663 (100.0%) |
Housing Occupancy in Greenfield
Occupancy by Ownership in Greenfield
Of the total 17,883 dwellings in Greenfield, owner-occupied units account for 9,953 (55.7%), while renter-occupied units make up 7,930 (44.3%).
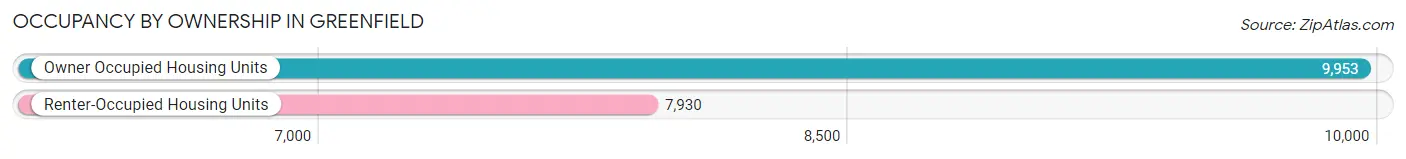
| Occupancy | # Housing Units | % Housing Units |
| Owner Occupied Housing Units | 9,953 | 55.7% |
| Renter-Occupied Housing Units | 7,930 | 44.3% |
| Total Occupied Housing Units | 17,883 | 100.0% |
Occupancy by Household Size in Greenfield
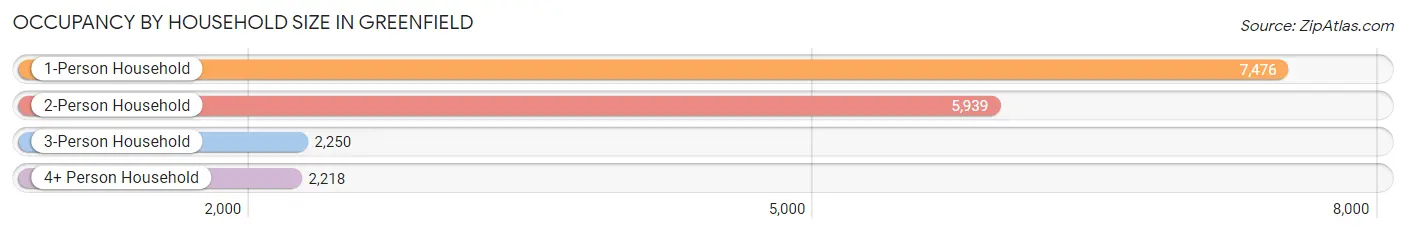
| Household Size | # Housing Units | % Housing Units |
| 1-Person Household | 7,476 | 41.8% |
| 2-Person Household | 5,939 | 33.2% |
| 3-Person Household | 2,250 | 12.6% |
| 4+ Person Household | 2,218 | 12.4% |
| Total Housing Units | 17,883 | 100.0% |
Occupancy by Ownership by Household Size in Greenfield
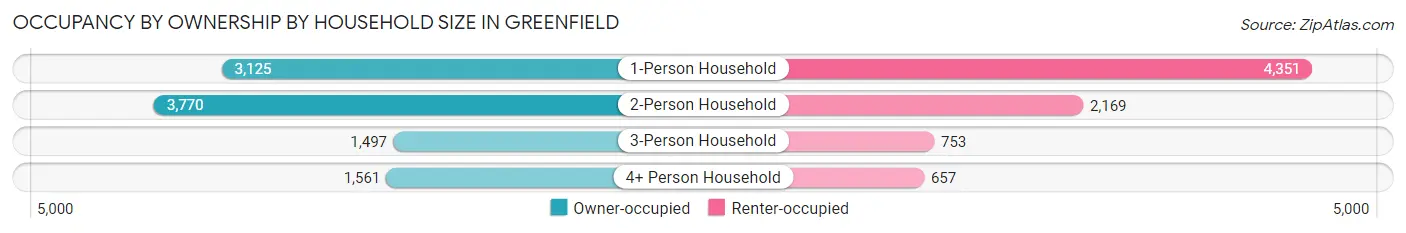
| Household Size | Owner-occupied | Renter-occupied |
| 1-Person Household | 3,125 (41.8%) | 4,351 (58.2%) |
| 2-Person Household | 3,770 (63.5%) | 2,169 (36.5%) |
| 3-Person Household | 1,497 (66.5%) | 753 (33.5%) |
| 4+ Person Household | 1,561 (70.4%) | 657 (29.6%) |
| Total Housing Units | 9,953 (55.7%) | 7,930 (44.3%) |
Occupancy by Educational Attainment in Greenfield
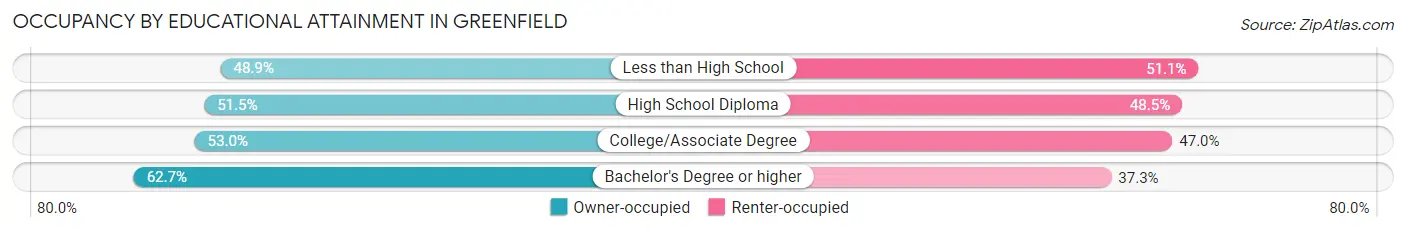
| Household Size | Owner-occupied | Renter-occupied |
| Less than High School | 337 (48.9%) | 352 (51.1%) |
| High School Diploma | 2,820 (51.5%) | 2,656 (48.5%) |
| College/Associate Degree | 3,017 (53.0%) | 2,673 (47.0%) |
| Bachelor's Degree or higher | 3,779 (62.7%) | 2,249 (37.3%) |
Occupancy by Age of Householder in Greenfield
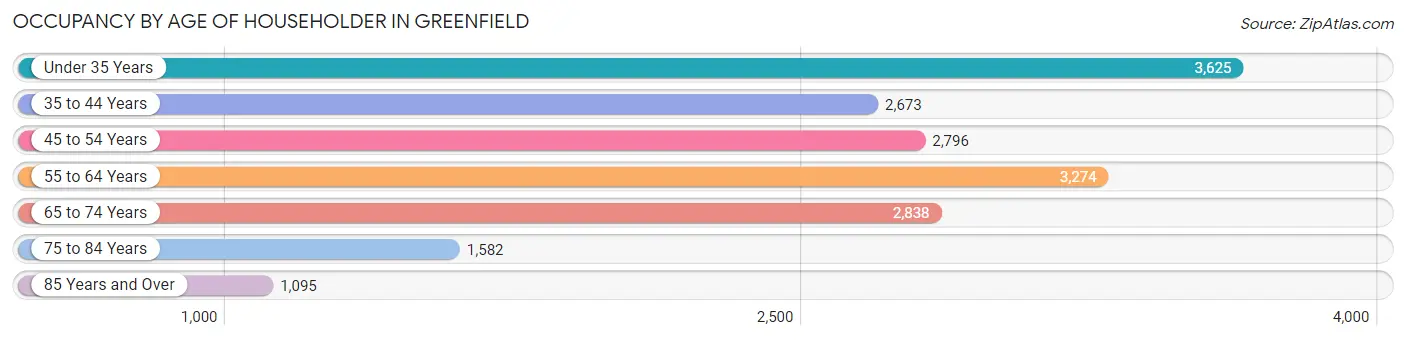
| Age Bracket | # Households | % Households |
| Under 35 Years | 3,625 | 20.3% |
| 35 to 44 Years | 2,673 | 14.9% |
| 45 to 54 Years | 2,796 | 15.6% |
| 55 to 64 Years | 3,274 | 18.3% |
| 65 to 74 Years | 2,838 | 15.9% |
| 75 to 84 Years | 1,582 | 8.8% |
| 85 Years and Over | 1,095 | 6.1% |
| Total | 17,883 | 100.0% |
Housing Finances in Greenfield
Median Income by Occupancy in Greenfield
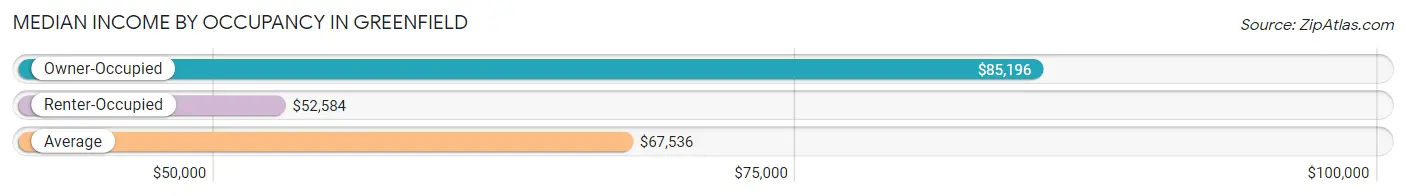
| Occupancy Type | # Households | Median Income |
| Owner-Occupied | 9,953 (55.7%) | $85,196 |
| Renter-Occupied | 7,930 (44.3%) | $52,584 |
| Average | 17,883 (100.0%) | $67,536 |
Occupancy by Householder Income Bracket in Greenfield
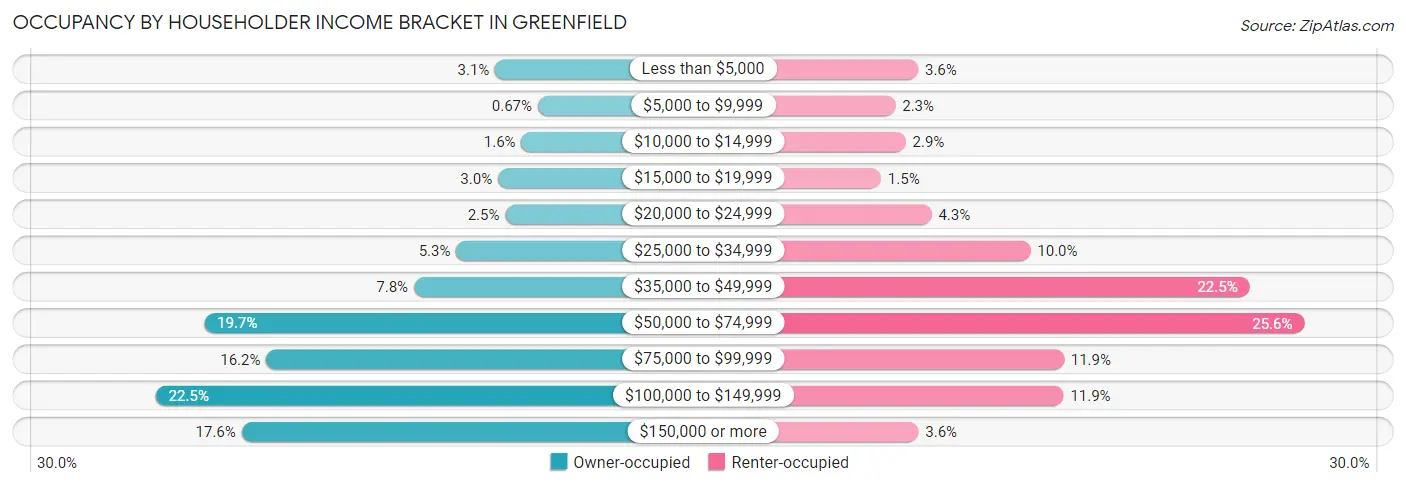
| Income Bracket | Owner-occupied | Renter-occupied |
| Less than $5,000 | 310 (3.1%) | 283 (3.6%) |
| $5,000 to $9,999 | 67 (0.7%) | 180 (2.3%) |
| $10,000 to $14,999 | 160 (1.6%) | 227 (2.9%) |
| $15,000 to $19,999 | 294 (2.9%) | 115 (1.5%) |
| $20,000 to $24,999 | 252 (2.5%) | 344 (4.3%) |
| $25,000 to $34,999 | 530 (5.3%) | 792 (10.0%) |
| $35,000 to $49,999 | 771 (7.7%) | 1,785 (22.5%) |
| $50,000 to $74,999 | 1,965 (19.7%) | 2,033 (25.6%) |
| $75,000 to $99,999 | 1,611 (16.2%) | 944 (11.9%) |
| $100,000 to $149,999 | 2,241 (22.5%) | 942 (11.9%) |
| $150,000 or more | 1,752 (17.6%) | 285 (3.6%) |
| Total | 9,953 (100.0%) | 7,930 (100.0%) |
Monthly Housing Cost Tiers in Greenfield
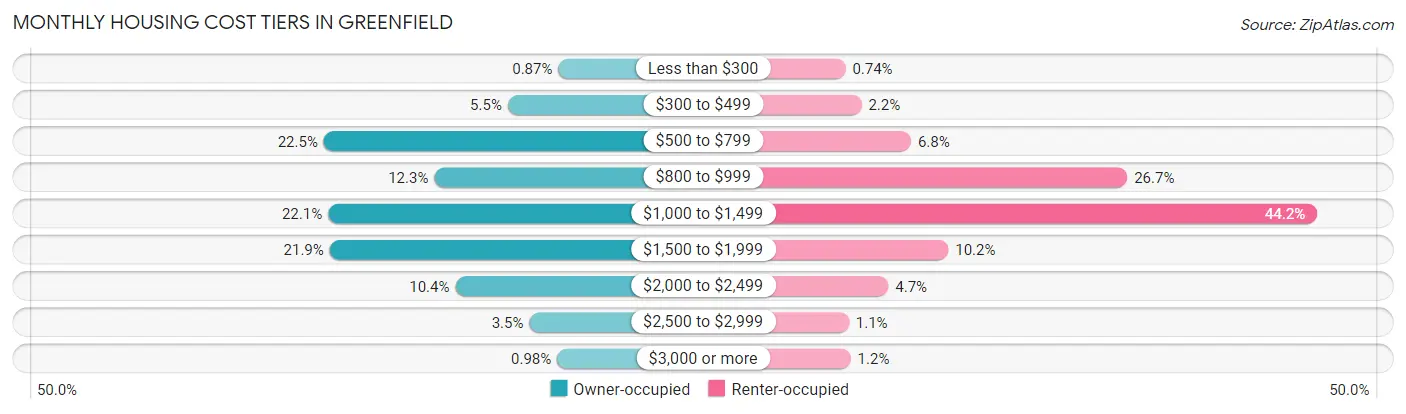
| Monthly Cost | Owner-occupied | Renter-occupied |
| Less than $300 | 87 (0.9%) | 59 (0.7%) |
| $300 to $499 | 549 (5.5%) | 175 (2.2%) |
| $500 to $799 | 2,235 (22.5%) | 537 (6.8%) |
| $800 to $999 | 1,223 (12.3%) | 2,116 (26.7%) |
| $1,000 to $1,499 | 2,197 (22.1%) | 3,502 (44.2%) |
| $1,500 to $1,999 | 2,182 (21.9%) | 810 (10.2%) |
| $2,000 to $2,499 | 1,030 (10.3%) | 372 (4.7%) |
| $2,500 to $2,999 | 352 (3.5%) | 83 (1.1%) |
| $3,000 or more | 98 (1.0%) | 97 (1.2%) |
| Total | 9,953 (100.0%) | 7,930 (100.0%) |
Physical Housing Characteristics in Greenfield
Housing Structures in Greenfield
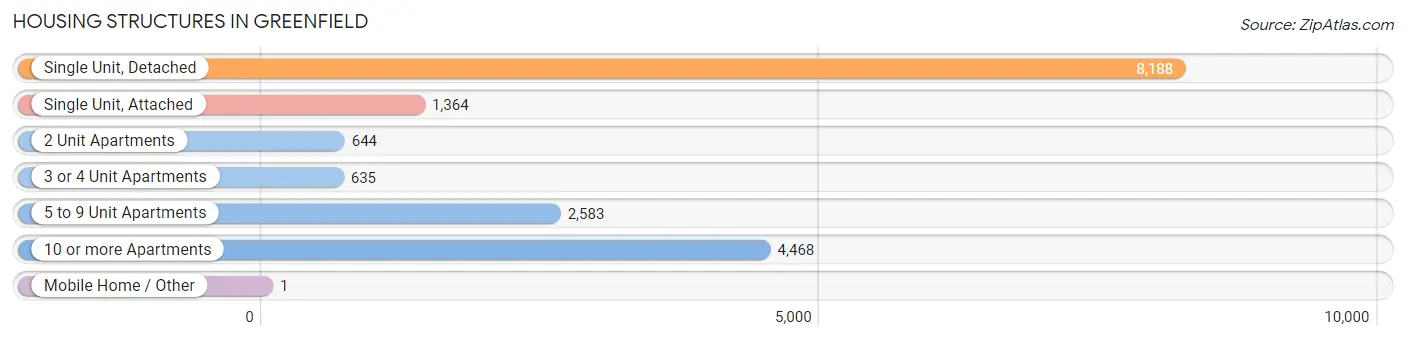
| Structure Type | # Housing Units | % Housing Units |
| Single Unit, Detached | 8,188 | 45.8% |
| Single Unit, Attached | 1,364 | 7.6% |
| 2 Unit Apartments | 644 | 3.6% |
| 3 or 4 Unit Apartments | 635 | 3.5% |
| 5 to 9 Unit Apartments | 2,583 | 14.4% |
| 10 or more Apartments | 4,468 | 25.0% |
| Mobile Home / Other | 1 | 0.0% |
| Total | 17,883 | 100.0% |
Housing Structures by Occupancy in Greenfield
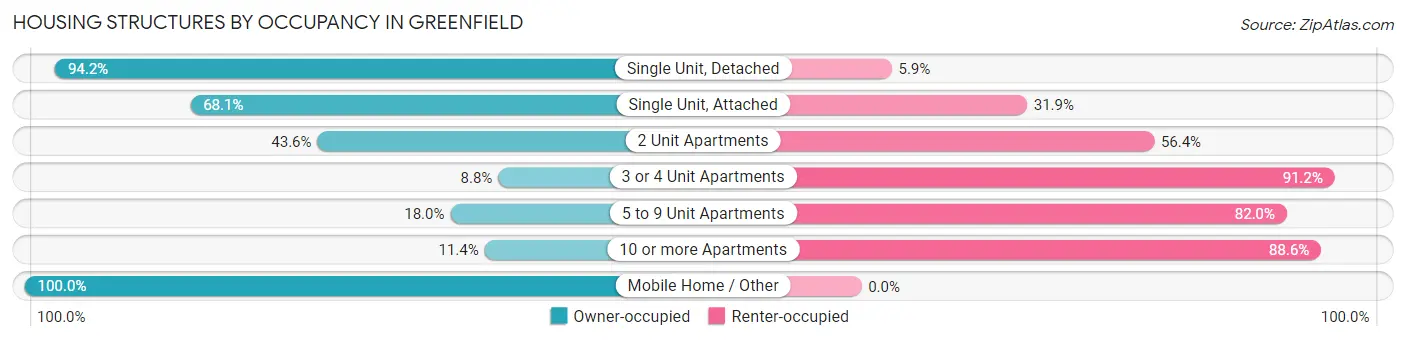
| Structure Type | Owner-occupied | Renter-occupied |
| Single Unit, Detached | 7,709 (94.2%) | 479 (5.9%) |
| Single Unit, Attached | 929 (68.1%) | 435 (31.9%) |
| 2 Unit Apartments | 281 (43.6%) | 363 (56.4%) |
| 3 or 4 Unit Apartments | 56 (8.8%) | 579 (91.2%) |
| 5 to 9 Unit Apartments | 466 (18.0%) | 2,117 (82.0%) |
| 10 or more Apartments | 511 (11.4%) | 3,957 (88.6%) |
| Mobile Home / Other | 1 (100.0%) | 0 (0.0%) |
| Total | 9,953 (55.7%) | 7,930 (44.3%) |
Housing Structures by Number of Rooms in Greenfield
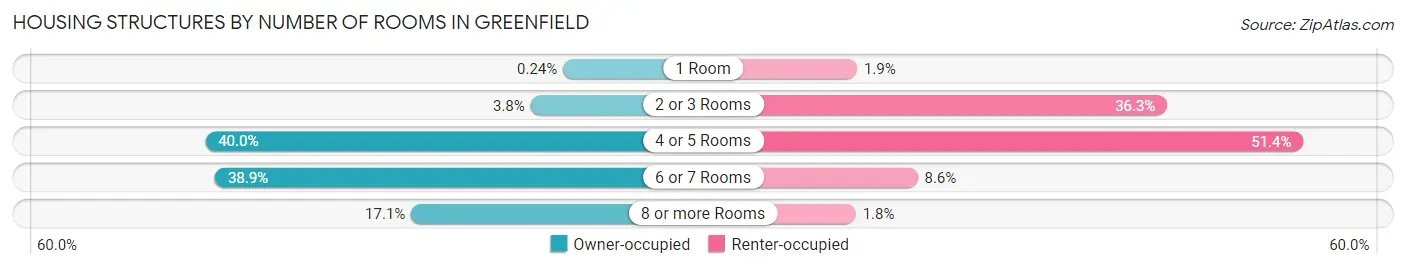
| Number of Rooms | Owner-occupied | Renter-occupied |
| 1 Room | 24 (0.2%) | 150 (1.9%) |
| 2 or 3 Rooms | 382 (3.8%) | 2,880 (36.3%) |
| 4 or 5 Rooms | 3,976 (40.0%) | 4,078 (51.4%) |
| 6 or 7 Rooms | 3,869 (38.9%) | 683 (8.6%) |
| 8 or more Rooms | 1,702 (17.1%) | 139 (1.8%) |
| Total | 9,953 (100.0%) | 7,930 (100.0%) |
Housing Structure by Heating Type in Greenfield
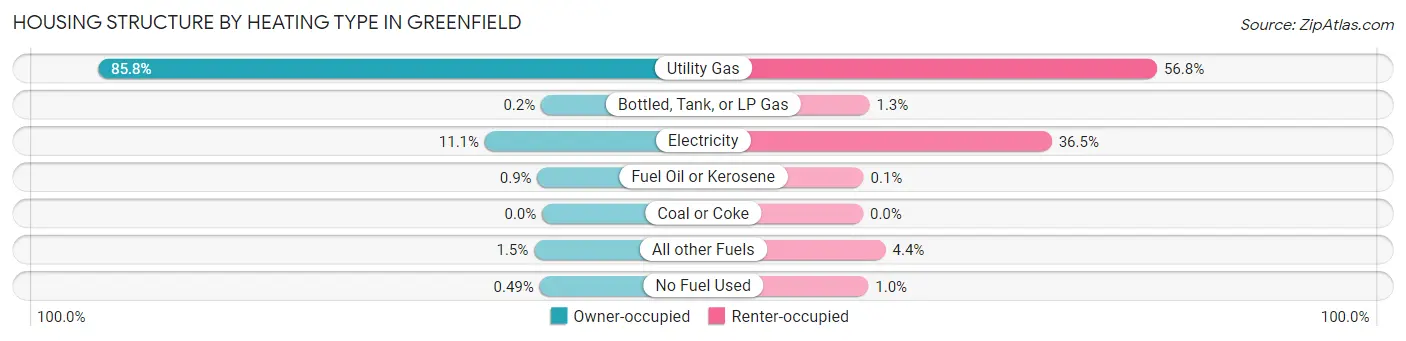
| Heating Type | Owner-occupied | Renter-occupied |
| Utility Gas | 8,540 (85.8%) | 4,504 (56.8%) |
| Bottled, Tank, or LP Gas | 20 (0.2%) | 100 (1.3%) |
| Electricity | 1,101 (11.1%) | 2,891 (36.5%) |
| Fuel Oil or Kerosene | 90 (0.9%) | 8 (0.1%) |
| Coal or Coke | 0 (0.0%) | 0 (0.0%) |
| All other Fuels | 153 (1.5%) | 346 (4.4%) |
| No Fuel Used | 49 (0.5%) | 81 (1.0%) |
| Total | 9,953 (100.0%) | 7,930 (100.0%) |
Household Vehicle Usage in Greenfield
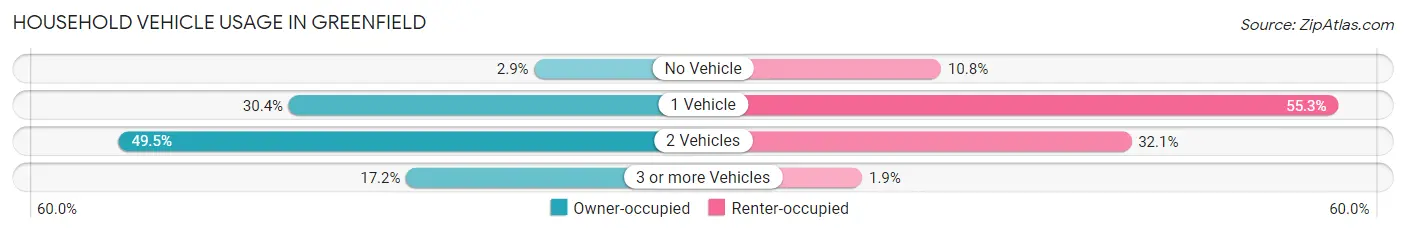
| Vehicles per Household | Owner-occupied | Renter-occupied |
| No Vehicle | 288 (2.9%) | 853 (10.8%) |
| 1 Vehicle | 3,025 (30.4%) | 4,382 (55.3%) |
| 2 Vehicles | 4,924 (49.5%) | 2,543 (32.1%) |
| 3 or more Vehicles | 1,716 (17.2%) | 152 (1.9%) |
| Total | 9,953 (100.0%) | 7,930 (100.0%) |
Real Estate & Mortgages in Greenfield
Real Estate and Mortgage Overview in Greenfield
| Characteristic | Without Mortgage | With Mortgage |
| Housing Units | 4,065 | 5,888 |
| Median Property Value | $216,600 | $240,900 |
| Median Household Income | $64,529 | $1,234 |
| Monthly Housing Costs | $734 | $98 |
| Real Estate Taxes | $4,555 | $20 |
Property Value by Mortgage Status in Greenfield
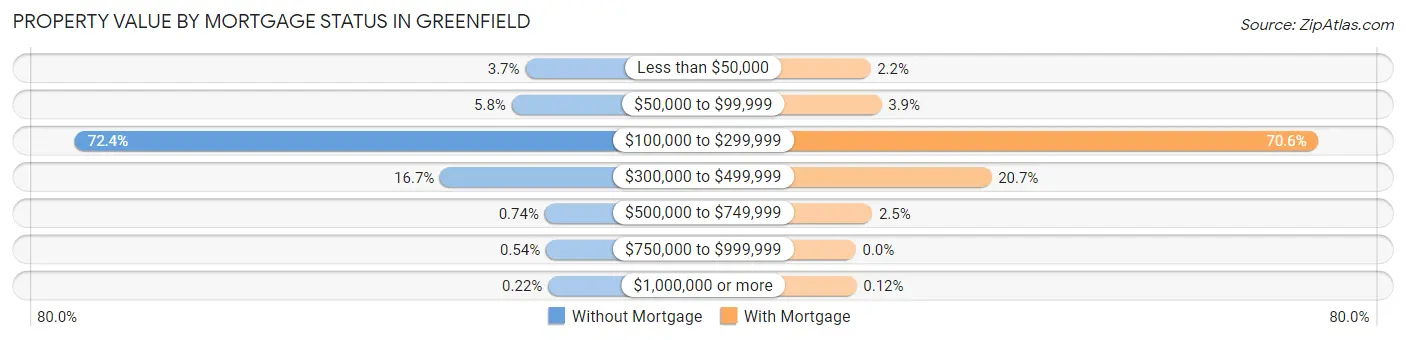
| Property Value | Without Mortgage | With Mortgage |
| Less than $50,000 | 150 (3.7%) | 132 (2.2%) |
| $50,000 to $99,999 | 235 (5.8%) | 231 (3.9%) |
| $100,000 to $299,999 | 2,941 (72.4%) | 4,154 (70.6%) |
| $300,000 to $499,999 | 678 (16.7%) | 1,217 (20.7%) |
| $500,000 to $749,999 | 30 (0.7%) | 147 (2.5%) |
| $750,000 to $999,999 | 22 (0.5%) | 0 (0.0%) |
| $1,000,000 or more | 9 (0.2%) | 7 (0.1%) |
| Total | 4,065 (100.0%) | 5,888 (100.0%) |
Household Income by Mortgage Status in Greenfield
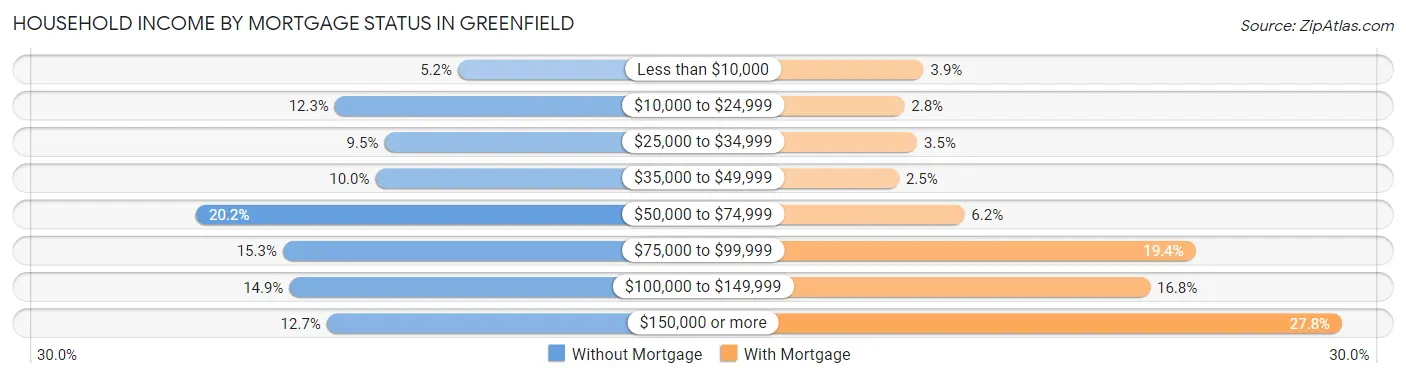
| Household Income | Without Mortgage | With Mortgage |
| Less than $10,000 | 213 (5.2%) | 229 (3.9%) |
| $10,000 to $24,999 | 499 (12.3%) | 164 (2.8%) |
| $25,000 to $34,999 | 384 (9.5%) | 207 (3.5%) |
| $35,000 to $49,999 | 405 (10.0%) | 146 (2.5%) |
| $50,000 to $74,999 | 821 (20.2%) | 366 (6.2%) |
| $75,000 to $99,999 | 620 (15.2%) | 1,144 (19.4%) |
| $100,000 to $149,999 | 605 (14.9%) | 991 (16.8%) |
| $150,000 or more | 518 (12.7%) | 1,636 (27.8%) |
| Total | 4,065 (100.0%) | 5,888 (100.0%) |
Property Value to Household Income Ratio in Greenfield
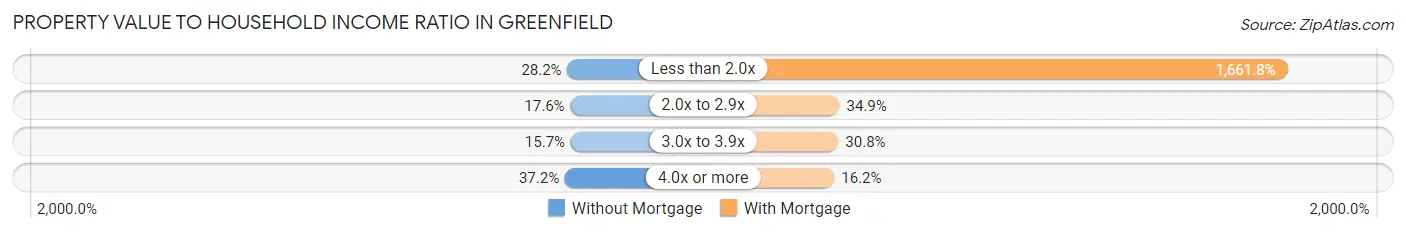
| Value-to-Income Ratio | Without Mortgage | With Mortgage |
| Less than 2.0x | 1,148 (28.2%) | 97,849 (1,661.8%) |
| 2.0x to 2.9x | 715 (17.6%) | 2,056 (34.9%) |
| 3.0x to 3.9x | 639 (15.7%) | 1,812 (30.8%) |
| 4.0x or more | 1,514 (37.2%) | 953 (16.2%) |
| Total | 4,065 (100.0%) | 5,888 (100.0%) |
Real Estate Taxes by Mortgage Status in Greenfield
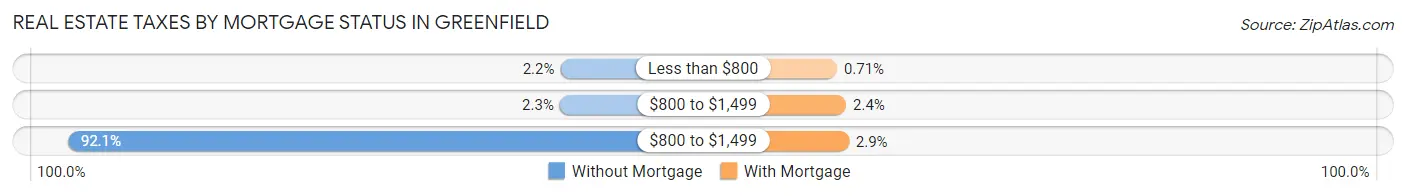
| Property Taxes | Without Mortgage | With Mortgage |
| Less than $800 | 88 (2.2%) | 42 (0.7%) |
| $800 to $1,499 | 92 (2.3%) | 141 (2.4%) |
| $800 to $1,499 | 3,744 (92.1%) | 170 (2.9%) |
| Total | 4,065 (100.0%) | 5,888 (100.0%) |
Health & Disability in Greenfield
Health Insurance Coverage by Age in Greenfield
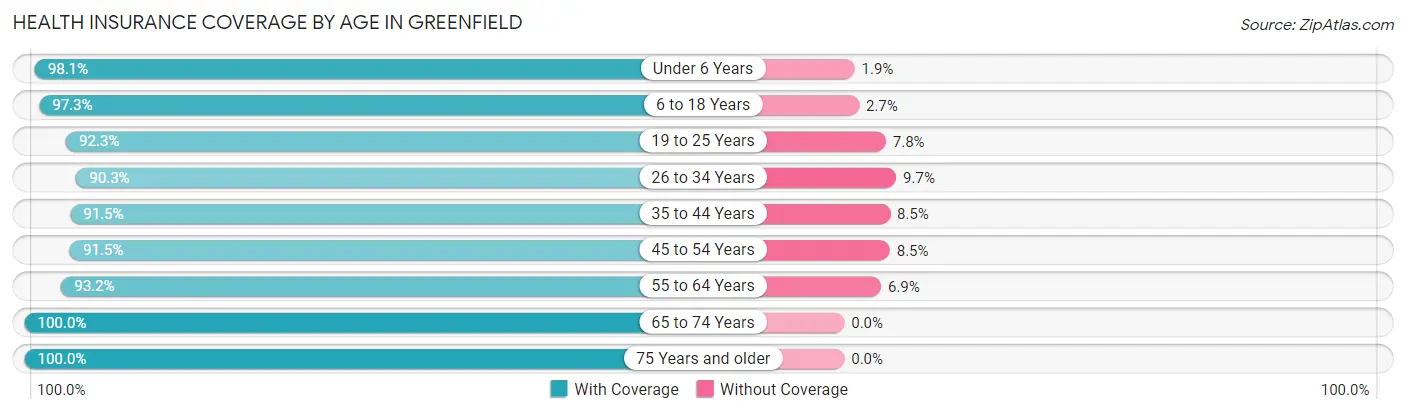
| Age Bracket | With Coverage | Without Coverage |
| Under 6 Years | 2,252 (98.1%) | 44 (1.9%) |
| 6 to 18 Years | 4,396 (97.3%) | 124 (2.7%) |
| 19 to 25 Years | 2,166 (92.2%) | 182 (7.7%) |
| 26 to 34 Years | 4,832 (90.3%) | 517 (9.7%) |
| 35 to 44 Years | 4,513 (91.5%) | 421 (8.5%) |
| 45 to 54 Years | 4,091 (91.5%) | 379 (8.5%) |
| 55 to 64 Years | 5,018 (93.1%) | 369 (6.9%) |
| 65 to 74 Years | 4,374 (100.0%) | 0 (0.0%) |
| 75 Years and older | 3,429 (100.0%) | 0 (0.0%) |
| Total | 35,071 (94.5%) | 2,036 (5.5%) |
Health Insurance Coverage by Citizenship Status in Greenfield
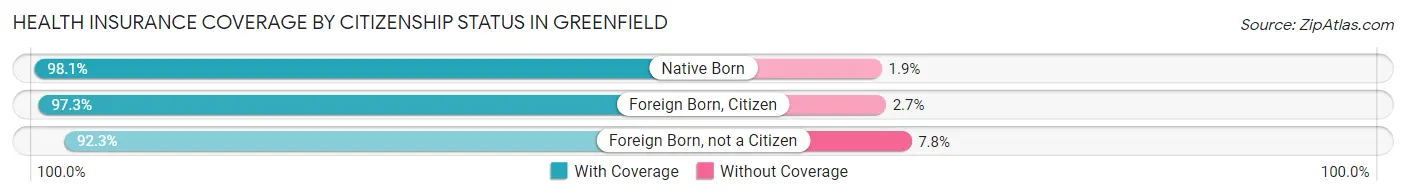
| Citizenship Status | With Coverage | Without Coverage |
| Native Born | 2,252 (98.1%) | 44 (1.9%) |
| Foreign Born, Citizen | 4,396 (97.3%) | 124 (2.7%) |
| Foreign Born, not a Citizen | 2,166 (92.2%) | 182 (7.7%) |
Health Insurance Coverage by Household Income in Greenfield
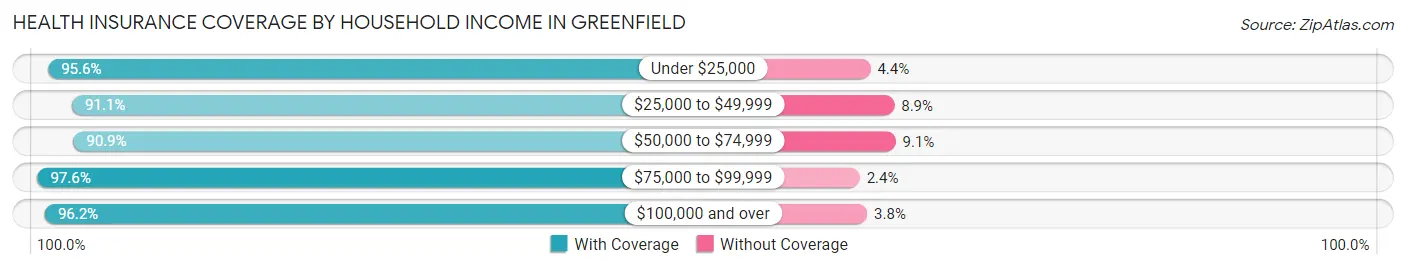
| Household Income | With Coverage | Without Coverage |
| Under $25,000 | 2,915 (95.6%) | 135 (4.4%) |
| $25,000 to $49,999 | 4,759 (91.1%) | 465 (8.9%) |
| $50,000 to $74,999 | 7,111 (90.9%) | 715 (9.1%) |
| $75,000 to $99,999 | 5,593 (97.6%) | 139 (2.4%) |
| $100,000 and over | 14,560 (96.2%) | 579 (3.8%) |
Public vs Private Health Insurance Coverage by Age in Greenfield
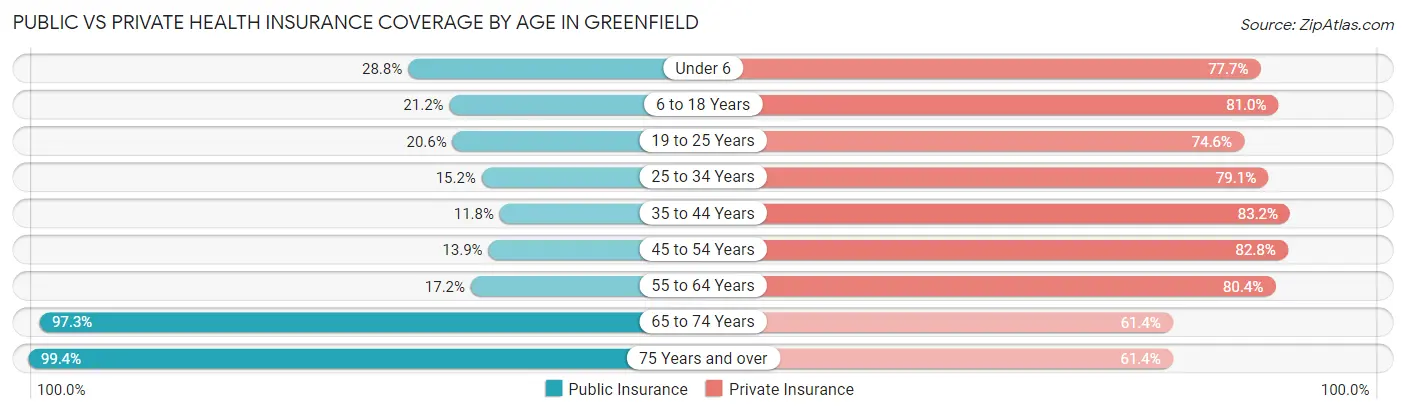
| Age Bracket | Public Insurance | Private Insurance |
| Under 6 | 662 (28.8%) | 1,783 (77.7%) |
| 6 to 18 Years | 956 (21.1%) | 3,662 (81.0%) |
| 19 to 25 Years | 483 (20.6%) | 1,752 (74.6%) |
| 25 to 34 Years | 811 (15.2%) | 4,231 (79.1%) |
| 35 to 44 Years | 582 (11.8%) | 4,103 (83.2%) |
| 45 to 54 Years | 622 (13.9%) | 3,699 (82.8%) |
| 55 to 64 Years | 925 (17.2%) | 4,333 (80.4%) |
| 65 to 74 Years | 4,257 (97.3%) | 2,686 (61.4%) |
| 75 Years and over | 3,408 (99.4%) | 2,105 (61.4%) |
| Total | 12,706 (34.2%) | 28,354 (76.4%) |
Disability Status by Sex by Age in Greenfield
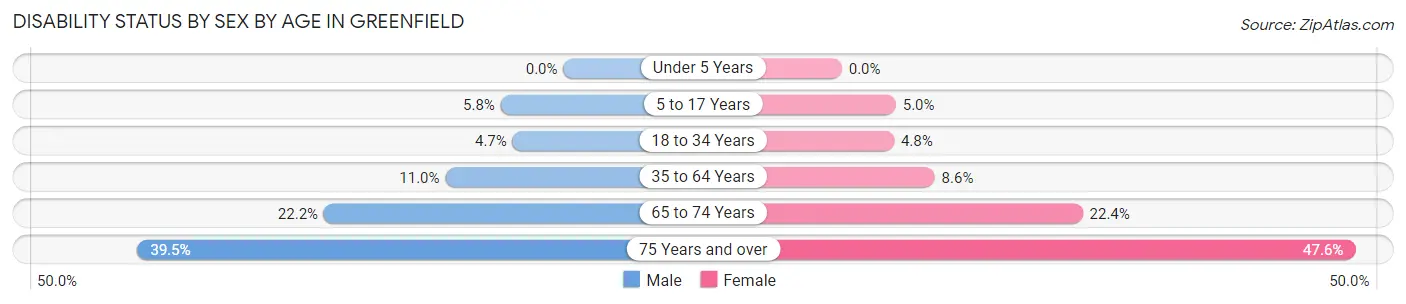
| Age Bracket | Male | Female |
| Under 5 Years | 0 (0.0%) | 0 (0.0%) |
| 5 to 17 Years | 140 (5.8%) | 110 (5.0%) |
| 18 to 34 Years | 185 (4.7%) | 196 (4.8%) |
| 35 to 64 Years | 803 (11.0%) | 643 (8.6%) |
| 65 to 74 Years | 415 (22.2%) | 560 (22.4%) |
| 75 Years and over | 467 (39.5%) | 1,071 (47.6%) |
Disability Class by Sex by Age in Greenfield
Disability Class: Hearing Difficulty
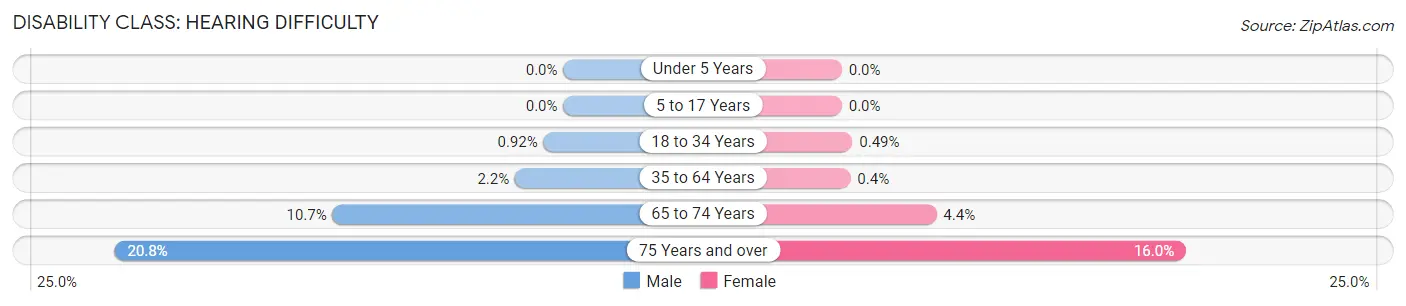
| Age Bracket | Male | Female |
| Under 5 Years | 0 (0.0%) | 0 (0.0%) |
| 5 to 17 Years | 0 (0.0%) | 0 (0.0%) |
| 18 to 34 Years | 36 (0.9%) | 20 (0.5%) |
| 35 to 64 Years | 164 (2.2%) | 30 (0.4%) |
| 65 to 74 Years | 200 (10.7%) | 110 (4.4%) |
| 75 Years and over | 246 (20.8%) | 359 (16.0%) |
Disability Class: Vision Difficulty
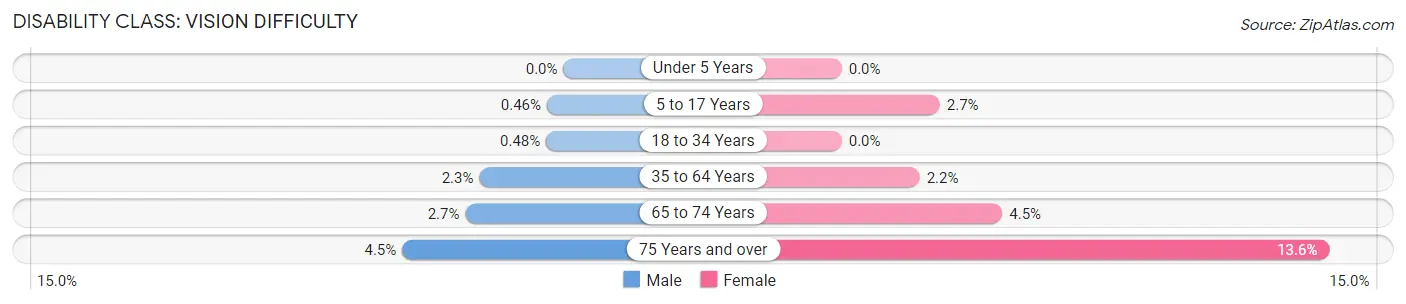
| Age Bracket | Male | Female |
| Under 5 Years | 0 (0.0%) | 0 (0.0%) |
| 5 to 17 Years | 11 (0.5%) | 60 (2.7%) |
| 18 to 34 Years | 19 (0.5%) | 0 (0.0%) |
| 35 to 64 Years | 172 (2.3%) | 162 (2.2%) |
| 65 to 74 Years | 51 (2.7%) | 112 (4.5%) |
| 75 Years and over | 53 (4.5%) | 305 (13.6%) |
Disability Class: Cognitive Difficulty
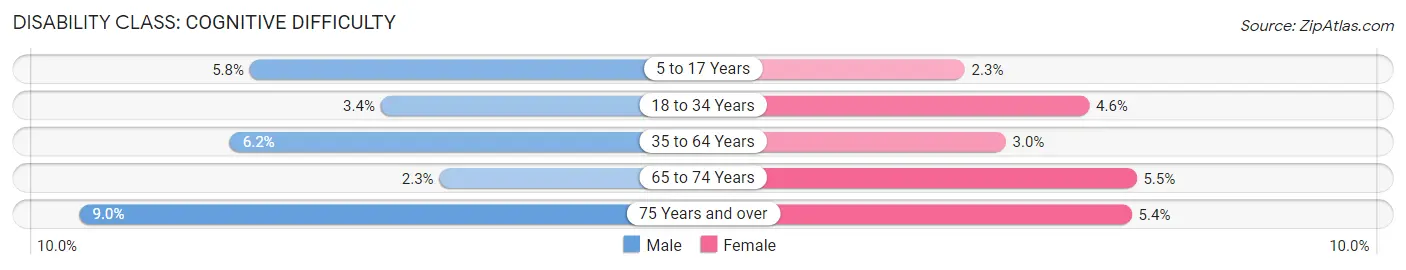
| Age Bracket | Male | Female |
| 5 to 17 Years | 140 (5.8%) | 50 (2.3%) |
| 18 to 34 Years | 133 (3.4%) | 186 (4.6%) |
| 35 to 64 Years | 454 (6.2%) | 227 (3.0%) |
| 65 to 74 Years | 43 (2.3%) | 137 (5.5%) |
| 75 Years and over | 106 (9.0%) | 121 (5.4%) |
Disability Class: Ambulatory Difficulty
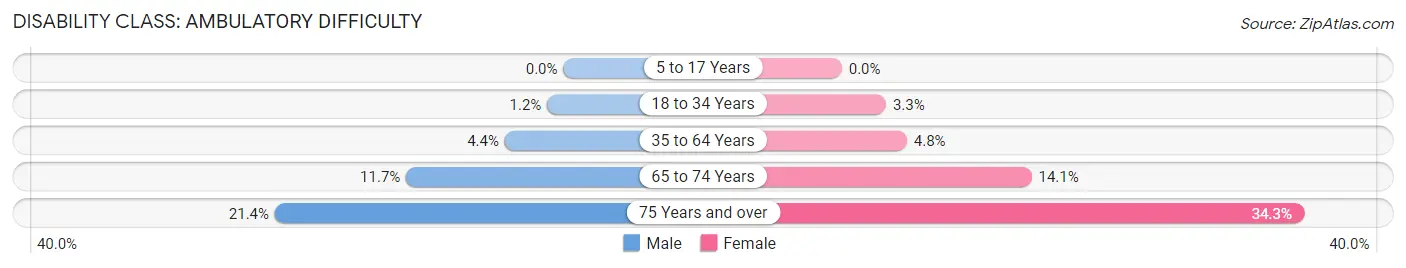
| Age Bracket | Male | Female |
| 5 to 17 Years | 0 (0.0%) | 0 (0.0%) |
| 18 to 34 Years | 47 (1.2%) | 133 (3.3%) |
| 35 to 64 Years | 319 (4.3%) | 360 (4.8%) |
| 65 to 74 Years | 218 (11.7%) | 353 (14.1%) |
| 75 Years and over | 253 (21.4%) | 771 (34.3%) |
Disability Class: Self-Care Difficulty
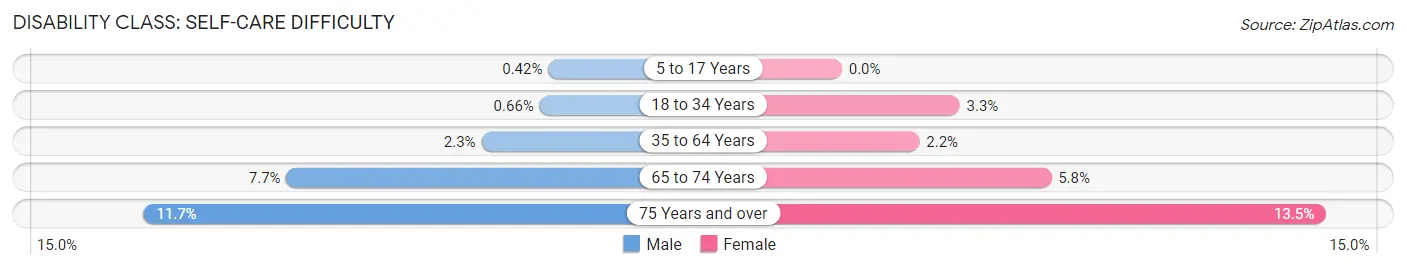
| Age Bracket | Male | Female |
| 5 to 17 Years | 10 (0.4%) | 0 (0.0%) |
| 18 to 34 Years | 26 (0.7%) | 133 (3.3%) |
| 35 to 64 Years | 167 (2.3%) | 161 (2.2%) |
| 65 to 74 Years | 144 (7.7%) | 146 (5.8%) |
| 75 Years and over | 138 (11.7%) | 303 (13.5%) |
Technology Access in Greenfield
Computing Device Access in Greenfield
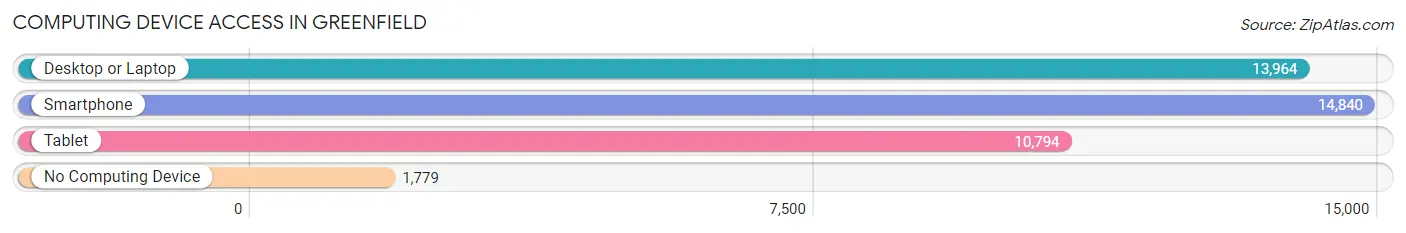
| Device Type | # Households | % Households |
| Desktop or Laptop | 13,964 | 78.1% |
| Smartphone | 14,840 | 83.0% |
| Tablet | 10,794 | 60.4% |
| No Computing Device | 1,779 | 10.0% |
| Total | 17,883 | 100.0% |
Internet Access in Greenfield
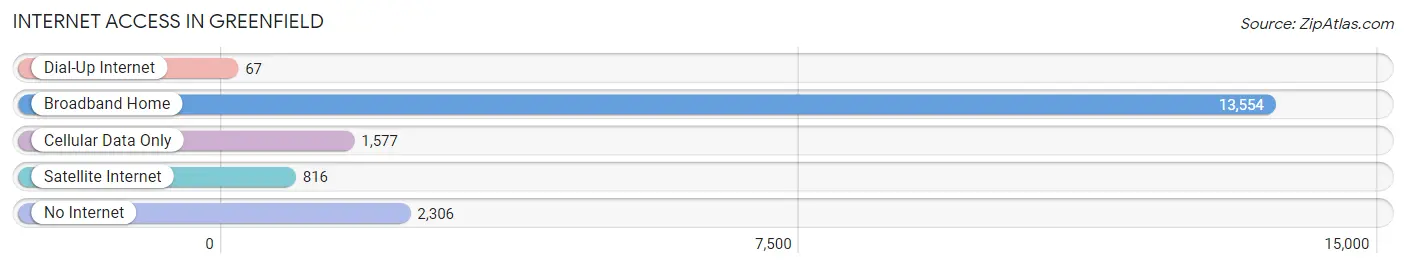
| Internet Type | # Households | % Households |
| Dial-Up Internet | 67 | 0.4% |
| Broadband Home | 13,554 | 75.8% |
| Cellular Data Only | 1,577 | 8.8% |
| Satellite Internet | 816 | 4.6% |
| No Internet | 2,306 | 12.9% |
| Total | 17,883 | 100.0% |
Greenfield Summary
Greenfield, Wisconsin is a city located in Milwaukee County, Wisconsin. It is a suburb of Milwaukee and is located just south of the city. The population of Greenfield was 36,720 at the 2010 census.
History
Greenfield was first settled in 1839 by a group of settlers from New York. The town was originally called "Honey Creek" and was later renamed "Greenfield" in 1841. The name was chosen to reflect the lush green landscape of the area. The first post office was established in 1842.
In 1846, the first school was built in Greenfield. The first church was built in 1848. The first newspaper, the Greenfield Gazette, was established in 1851.
In 1853, the Milwaukee and Mississippi Railroad was built through Greenfield, connecting the city to Milwaukee. This allowed for the growth of the city and the development of industry.
In 1872 the first fire station was built in Greenfield The first library was established in 1876
In 1891, the first electric streetcars began running in Greenfield. This allowed for the growth of the city and the development of industry.
In the early 1900s, Greenfield experienced a period of rapid growth. The population increased from 1,000 in 1900 to over 10,000 by 1920.
In the 1950s, Greenfield experienced a period of suburbanization. Many people moved from Milwaukee to Greenfield, and the population increased to over 20,000 by 1960.
Geography
Greenfield is located at 43°3'N 88°2'W (43.05, -88.03). It is situated on the Milwaukee River, just south of Milwaukee.
The city has a total area of 8.3 square miles, of which 8.2 square miles is land and 0.1 square miles is water.
Economy
Greenfield's economy is largely based on manufacturing and retail. The city is home to several large manufacturing companies, including Briggs & Stratton, Rockwell Automation, and Johnson Controls.
Retail is also an important part of the economy. The Southridge Mall, located in Greenfield, is one of the largest shopping malls in the Milwaukee area.
Demographics
As of the 2010 census, the population of Greenfield was 36,720. The racial makeup of the city was 87.2% White, 4.7% African American, 0.4% Native American, 3.2% Asian, 0.1% Pacific Islander, 2.2% from other races, and 2.2% from two or more races. Hispanic or Latino of any race were 6.3% of the population.
The median income for a household in Greenfield was $50,945, and the median income for a family was $62,917. The per capita income for the city was $25,845. About 5.2% of families and 7.2% of the population were below the poverty line, including 9.2% of those under age 18 and 5.2% of those age 65 or over.
Common Questions
What is Per Capita Income in Greenfield?
Per Capita income in Greenfield is $40,221.
What is the Median Family Income in Greenfield?
Median Family Income in Greenfield is $87,011.
What is the Median Household income in Greenfield?
Median Household Income in Greenfield is $67,536.
What is Income or Wage Gap in Greenfield?
Income or Wage Gap in Greenfield is 20.8%.
Women in Greenfield earn 79.2 cents for every dollar earned by a man.
What is Family Income Deficit in Greenfield?
Family Income Deficit in Greenfield is $9,698.
Families that are below poverty line in Greenfield earn $9,698 less on average than the poverty threshold level.
What is Inequality or Gini Index in Greenfield?
Inequality or Gini Index in Greenfield is 0.39.
What is the Total Population of Greenfield?
Total Population of Greenfield is 37,521.
What is the Total Male Population of Greenfield?
Total Male Population of Greenfield is 17,753.
What is the Total Female Population of Greenfield?
Total Female Population of Greenfield is 19,768.
What is the Ratio of Males per 100 Females in Greenfield?
There are 89.81 Males per 100 Females in Greenfield.
What is the Ratio of Females per 100 Males in Greenfield?
There are 111.35 Females per 100 Males in Greenfield.
What is the Median Population Age in Greenfield?
Median Population Age in Greenfield is 43.3 Years.
What is the Average Family Size in Greenfield
Average Family Size in Greenfield is 2.9 People.
What is the Average Household Size in Greenfield
Average Household Size in Greenfield is 2.1 People.
How Large is the Labor Force in Greenfield?
There are 20,645 People in the Labor Forcein in Greenfield.
What is the Percentage of People in the Labor Force in Greenfield?
65.4% of People are in the Labor Force in Greenfield.
What is the Unemployment Rate in Greenfield?
Unemployment Rate in Greenfield is 3.5%.