Racine, WI Map & Demographics
Racine Map
Racine Overview
$27,087
PER CAPITA INCOME
$62,126
AVG FAMILY INCOME
$52,766
AVG HOUSEHOLD INCOME
21.6%
WAGE / INCOME GAP [ % ]
78.4¢/ $1
WAGE / INCOME GAP [ $ ]
$12,323
FAMILY INCOME DEFICIT
0.42
INEQUALITY / GINI INDEX
77,453
TOTAL POPULATION
37,219
MALE POPULATION
40,234
FEMALE POPULATION
92.51
MALES / 100 FEMALES
108.10
FEMALES / 100 MALES
35.0
MEDIAN AGE
3.1
AVG FAMILY SIZE
2.4
AVG HOUSEHOLD SIZE
38,039
LABOR FORCE [ PEOPLE ]
64.3%
PERCENT IN LABOR FORCE
6.0%
UNEMPLOYMENT RATE
Racine Area Codes
Income in Racine
Income Overview in Racine
Per Capita Income in Racine is $27,087, while median incomes of families and households are $62,126 and $52,766 respectively.
| Characteristic | Number | Measure |
| Per Capita Income | 77,453 | $27,087 |
| Median Family Income | 18,661 | $62,126 |
| Mean Family Income | 18,661 | $74,981 |
| Median Household Income | 31,282 | $52,766 |
| Mean Household Income | 31,282 | $66,724 |
| Income Deficit | 18,661 | $12,323 |
| Wage / Income Gap (%) | 77,453 | 21.63% |
| Wage / Income Gap ($) | 77,453 | 78.37¢ per $1 |
| Gini / Inequality Index | 77,453 | 0.42 |
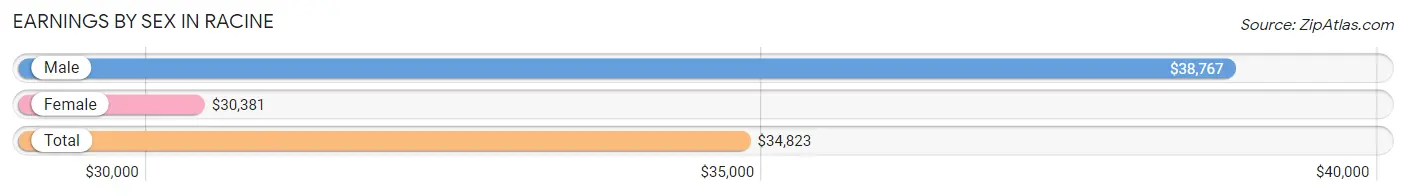
Earnings by Sex in Racine
Average Earnings in Racine are $34,823, $38,767 for men and $30,381 for women, a difference of 21.6%.
| Sex | Number | Average Earnings |
| Male | 19,315 (49.4%) | $38,767 |
| Female | 19,747 (50.5%) | $30,381 |
| Total | 39,062 (100.0%) | $34,823 |
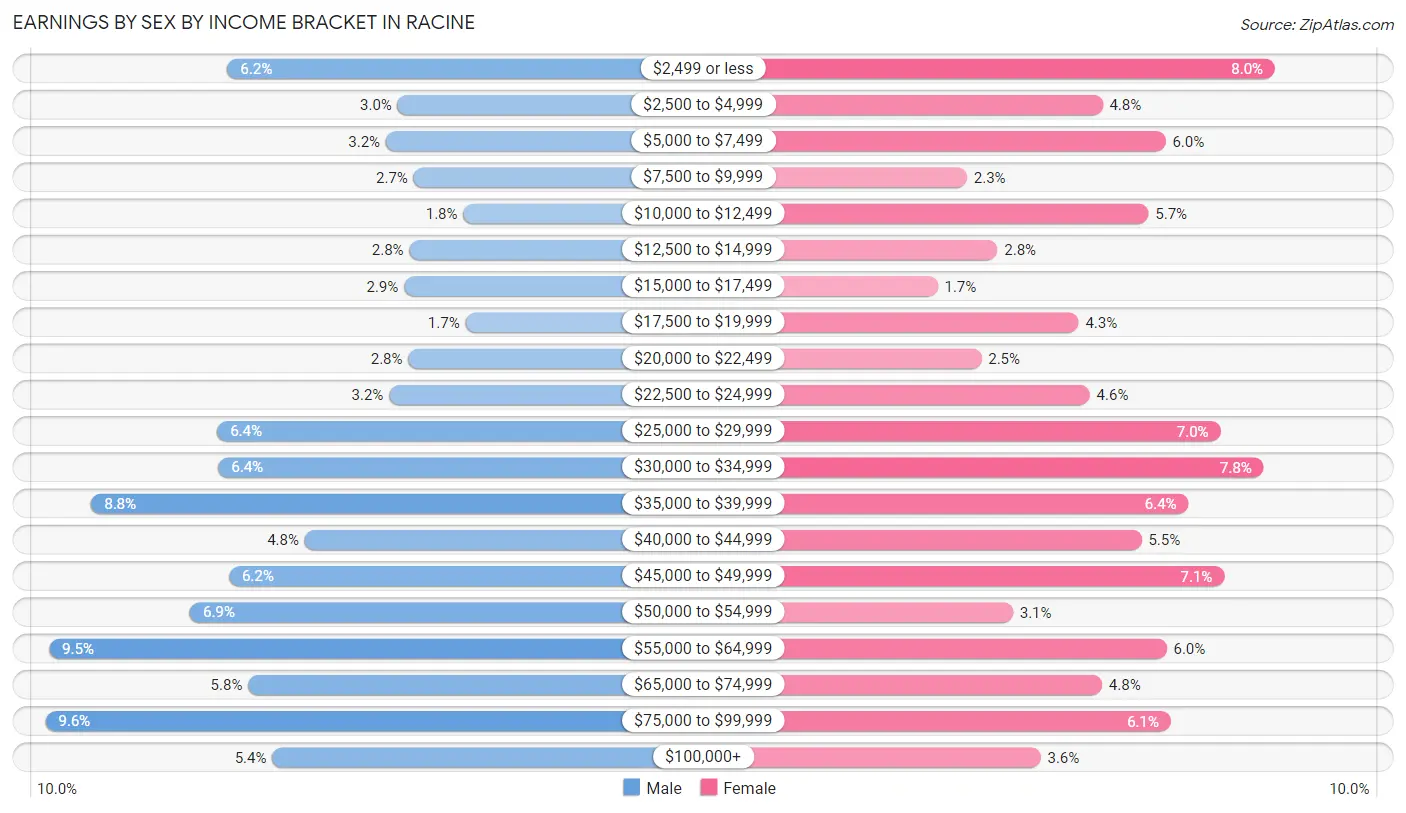
Earnings by Sex by Income Bracket in Racine
The most common earnings brackets in Racine are $75,000 to $99,999 for men (1,857 | 9.6%) and $2,499 or less for women (1,584 | 8.0%).
| Income | Male | Female |
| $2,499 or less | 1,197 (6.2%) | 1,584 (8.0%) |
| $2,500 to $4,999 | 582 (3.0%) | 946 (4.8%) |
| $5,000 to $7,499 | 623 (3.2%) | 1,179 (6.0%) |
| $7,500 to $9,999 | 524 (2.7%) | 444 (2.2%) |
| $10,000 to $12,499 | 344 (1.8%) | 1,116 (5.7%) |
| $12,500 to $14,999 | 539 (2.8%) | 557 (2.8%) |
| $15,000 to $17,499 | 559 (2.9%) | 336 (1.7%) |
| $17,500 to $19,999 | 337 (1.7%) | 858 (4.3%) |
| $20,000 to $22,499 | 543 (2.8%) | 498 (2.5%) |
| $22,500 to $24,999 | 613 (3.2%) | 898 (4.5%) |
| $25,000 to $29,999 | 1,234 (6.4%) | 1,383 (7.0%) |
| $30,000 to $34,999 | 1,231 (6.4%) | 1,543 (7.8%) |
| $35,000 to $39,999 | 1,691 (8.7%) | 1,264 (6.4%) |
| $40,000 to $44,999 | 917 (4.8%) | 1,090 (5.5%) |
| $45,000 to $49,999 | 1,191 (6.2%) | 1,397 (7.1%) |
| $50,000 to $54,999 | 1,333 (6.9%) | 614 (3.1%) |
| $55,000 to $64,999 | 1,842 (9.5%) | 1,183 (6.0%) |
| $65,000 to $74,999 | 1,123 (5.8%) | 943 (4.8%) |
| $75,000 to $99,999 | 1,857 (9.6%) | 1,198 (6.1%) |
| $100,000+ | 1,035 (5.4%) | 716 (3.6%) |
| Total | 19,315 (100.0%) | 19,747 (100.0%) |
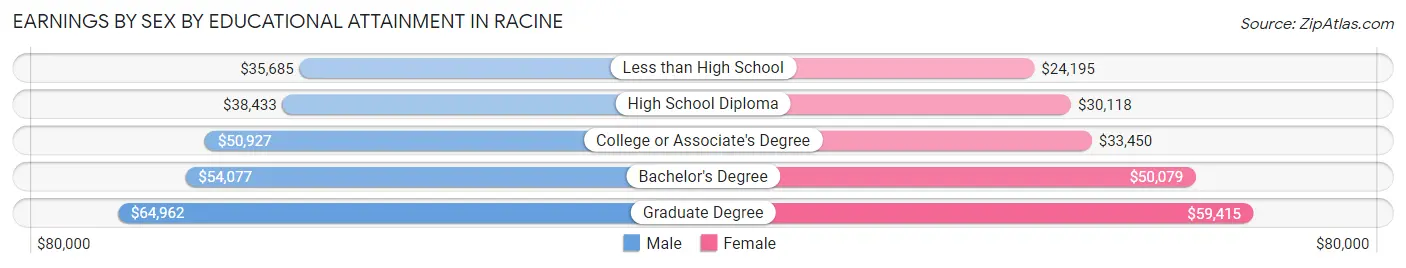
Earnings by Sex by Educational Attainment in Racine
Average earnings in Racine are $45,137 for men and $35,347 for women, a difference of 21.7%. Men with an educational attainment of graduate degree enjoy the highest average annual earnings of $64,962, while those with less than high school education earn the least with $35,685. Women with an educational attainment of graduate degree earn the most with the average annual earnings of $59,415, while those with less than high school education have the smallest earnings of $24,195.
| Educational Attainment | Male Income | Female Income |
| Less than High School | $35,685 | $24,195 |
| High School Diploma | $38,433 | $30,118 |
| College or Associate's Degree | $50,927 | $33,450 |
| Bachelor's Degree | $54,077 | $50,079 |
| Graduate Degree | $64,962 | $59,415 |
| Total | $45,137 | $35,347 |
Family Income in Racine
Family Income Brackets in Racine
According to the Racine family income data, there are 4,255 families falling into the $50,000 to $74,999 income range, which is the most common income bracket and makes up 22.8% of all families. Conversely, the $200,000+ income bracket is the least frequent group with only 653 families (3.5%) belonging to this category.
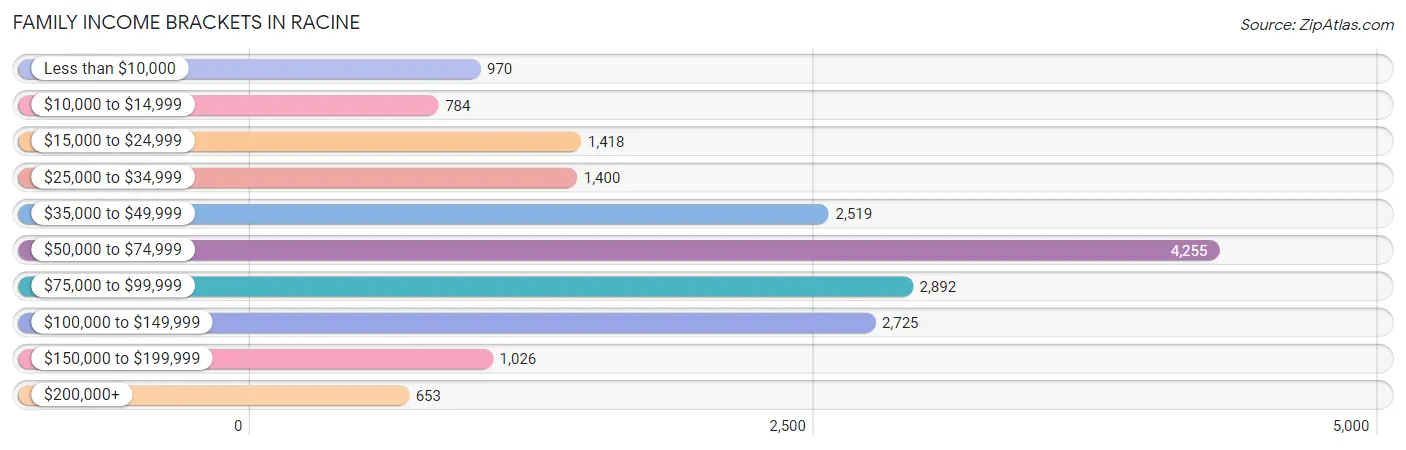
| Income Bracket | # Families | % Families |
| Less than $10,000 | 970 | 5.2% |
| $10,000 to $14,999 | 784 | 4.2% |
| $15,000 to $24,999 | 1,418 | 7.6% |
| $25,000 to $34,999 | 1,400 | 7.5% |
| $35,000 to $49,999 | 2,519 | 13.5% |
| $50,000 to $74,999 | 4,255 | 22.8% |
| $75,000 to $99,999 | 2,892 | 15.5% |
| $100,000 to $149,999 | 2,725 | 14.6% |
| $150,000 to $199,999 | 1,026 | 5.5% |
| $200,000+ | 653 | 3.5% |
Family Income by Famaliy Size in Racine
7+ person families (303 | 1.6%) account for the highest median family income in Racine with $87,578 per family, while 2-person families (8,601 | 46.1%) have the highest median income of $30,377 per family member.
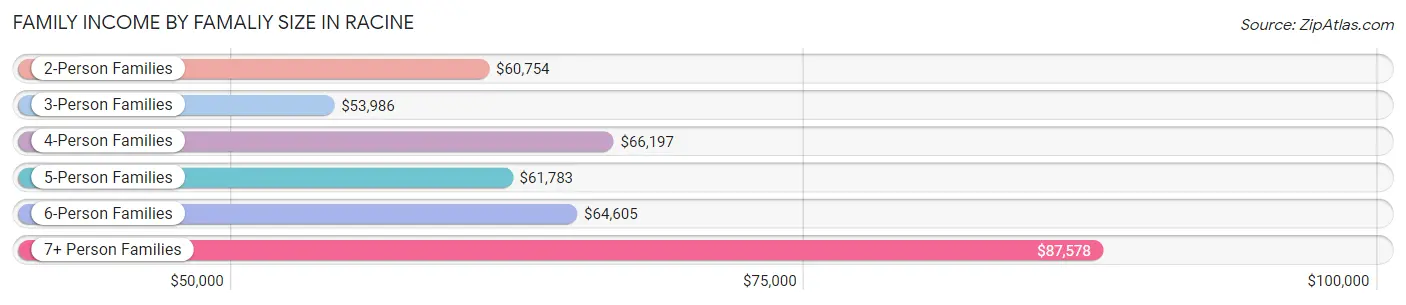
| Income Bracket | # Families | Median Income |
| 2-Person Families | 8,601 (46.1%) | $60,754 |
| 3-Person Families | 4,374 (23.4%) | $53,986 |
| 4-Person Families | 2,906 (15.6%) | $66,197 |
| 5-Person Families | 1,757 (9.4%) | $61,783 |
| 6-Person Families | 720 (3.9%) | $64,605 |
| 7+ Person Families | 303 (1.6%) | $87,578 |
| Total | 18,661 (100.0%) | $62,126 |
Family Income by Number of Earners in Racine
The median family income in Racine is $62,126, with families comprising 3+ earners (2,000) having the highest median family income of $97,805, while families with no earners (2,665) have the lowest median family income of $43,683, accounting for 10.7% and 14.3% of families, respectively.
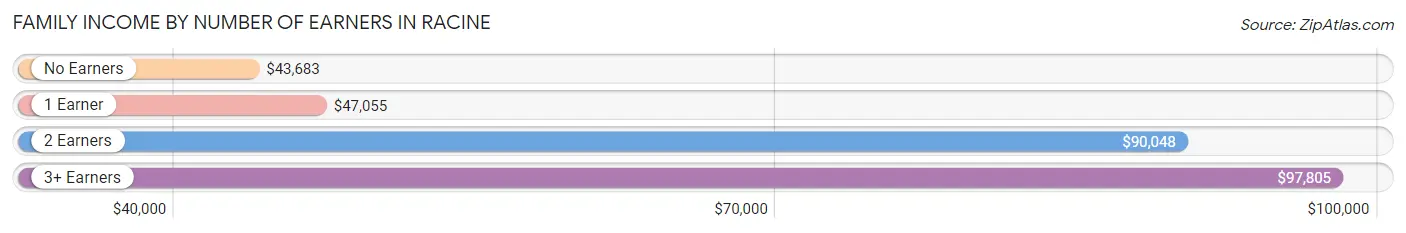
| Number of Earners | # Families | Median Income |
| No Earners | 2,665 (14.3%) | $43,683 |
| 1 Earner | 7,930 (42.5%) | $47,055 |
| 2 Earners | 6,066 (32.5%) | $90,048 |
| 3+ Earners | 2,000 (10.7%) | $97,805 |
| Total | 18,661 (100.0%) | $62,126 |
Household Income in Racine
Household Income Brackets in Racine
With 6,913 households falling in the category, the $50,000 to $74,999 income range is the most frequent in Racine, accounting for 22.1% of all households. In contrast, only 813 households (2.6%) fall into the $200,000+ income bracket, making it the least populous group.
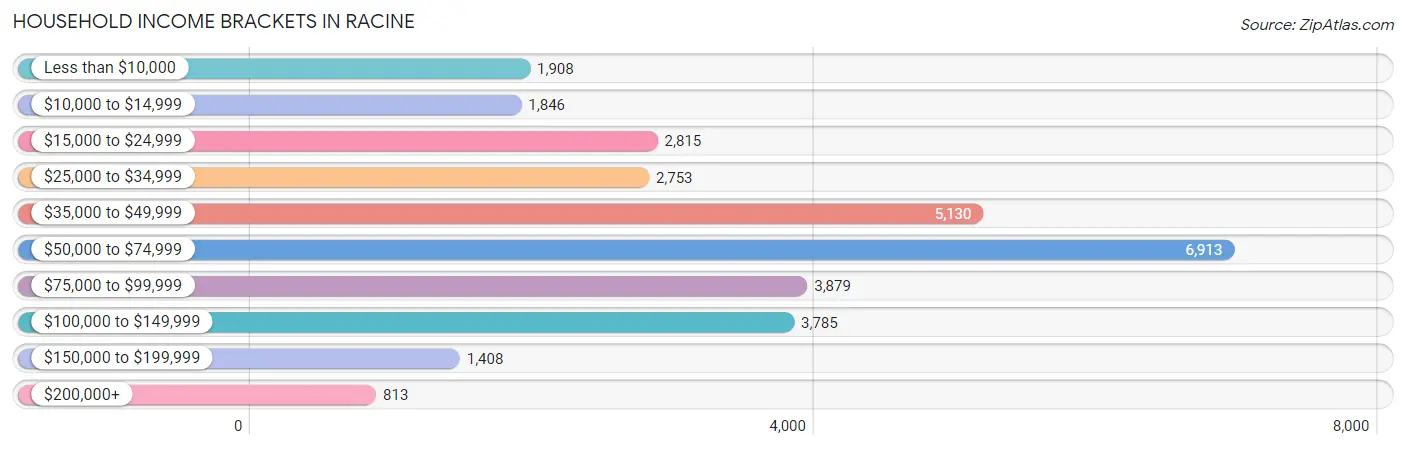
| Income Bracket | # Households | % Households |
| Less than $10,000 | 1,908 | 6.1% |
| $10,000 to $14,999 | 1,846 | 5.9% |
| $15,000 to $24,999 | 2,815 | 9.0% |
| $25,000 to $34,999 | 2,753 | 8.8% |
| $35,000 to $49,999 | 5,130 | 16.4% |
| $50,000 to $74,999 | 6,913 | 22.1% |
| $75,000 to $99,999 | 3,879 | 12.4% |
| $100,000 to $149,999 | 3,785 | 12.1% |
| $150,000 to $199,999 | 1,408 | 4.5% |
| $200,000+ | 813 | 2.6% |
Household Income by Householder Age in Racine
The median household income in Racine is $52,766, with the highest median household income of $54,521 found in the 25 to 44 years age bracket for the primary householder. A total of 11,295 households (36.1%) fall into this category. Meanwhile, the 15 to 24 years age bracket for the primary householder has the lowest median household income of $48,917, with 1,192 households (3.8%) in this group.
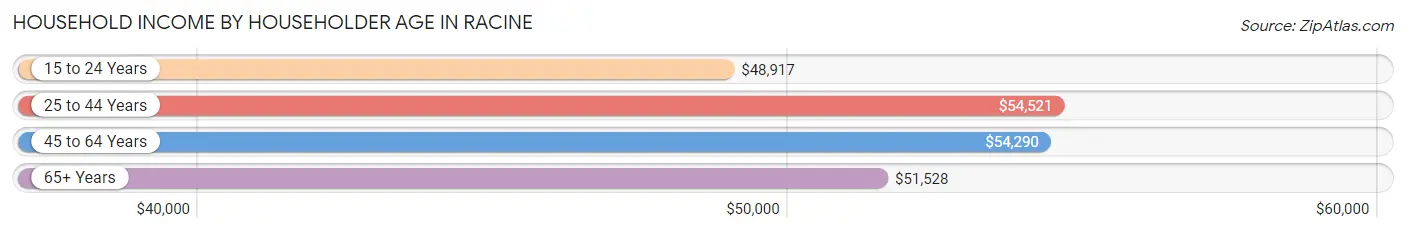
| Income Bracket | # Households | Median Income |
| 15 to 24 Years | 1,192 (3.8%) | $48,917 |
| 25 to 44 Years | 11,295 (36.1%) | $54,521 |
| 45 to 64 Years | 11,314 (36.2%) | $54,290 |
| 65+ Years | 7,481 (23.9%) | $51,528 |
| Total | 31,282 (100.0%) | $52,766 |
Poverty in Racine
Income Below Poverty by Sex and Age in Racine
With 16.8% poverty level for males and 21.3% for females among the residents of Racine, under 5 year old males and 18 to 24 year old females are the most vulnerable to poverty, with 803 males (34.1%) and 1,081 females (30.1%) in their respective age groups living below the poverty level.
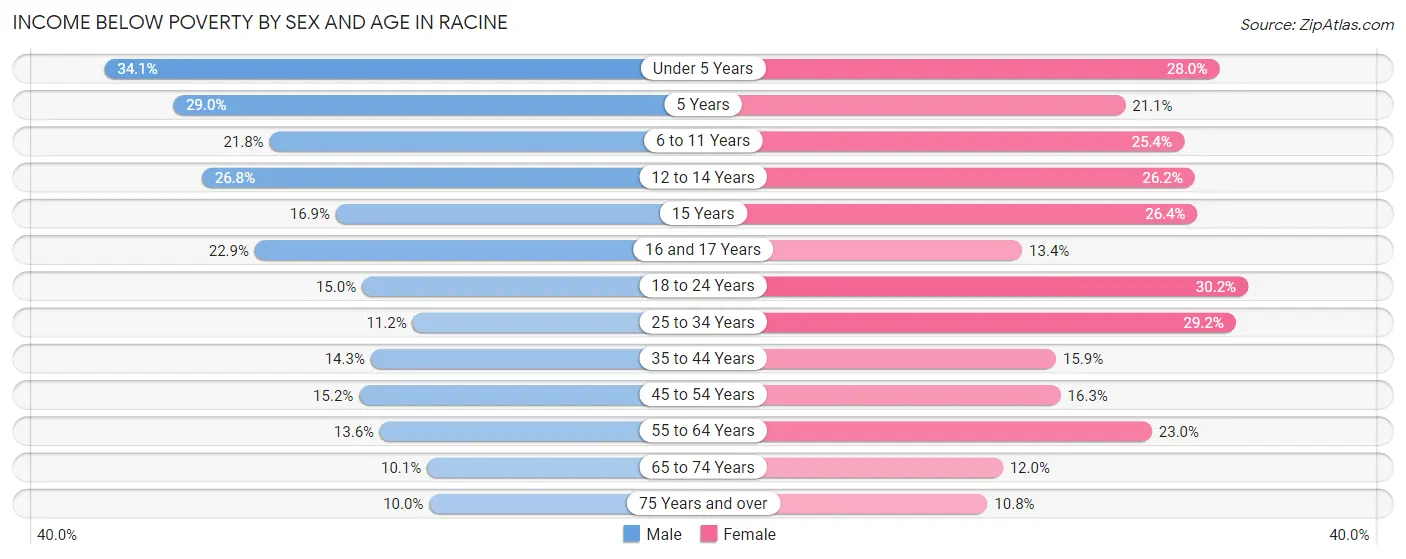
| Age Bracket | Male | Female |
| Under 5 Years | 803 (34.1%) | 635 (28.0%) |
| 5 Years | 164 (29.0%) | 161 (21.0%) |
| 6 to 11 Years | 847 (21.8%) | 836 (25.4%) |
| 12 to 14 Years | 542 (26.8%) | 467 (26.2%) |
| 15 Years | 88 (16.9%) | 137 (26.4%) |
| 16 and 17 Years | 288 (22.9%) | 198 (13.4%) |
| 18 to 24 Years | 461 (14.9%) | 1,081 (30.1%) |
| 25 to 34 Years | 559 (11.2%) | 1,624 (29.2%) |
| 35 to 44 Years | 633 (14.3%) | 843 (15.9%) |
| 45 to 54 Years | 672 (15.2%) | 776 (16.3%) |
| 55 to 64 Years | 629 (13.6%) | 1,040 (23.0%) |
| 65 to 74 Years | 279 (10.1%) | 408 (11.9%) |
| 75 Years and over | 138 (10.0%) | 279 (10.8%) |
| Total | 6,103 (16.8%) | 8,485 (21.3%) |
Income Above Poverty by Sex and Age in Racine
According to the poverty statistics in Racine, males aged 75 years and over and females aged 75 years and over are the age groups that are most secure financially, with 90.0% of males and 89.2% of females in these age groups living above the poverty line.
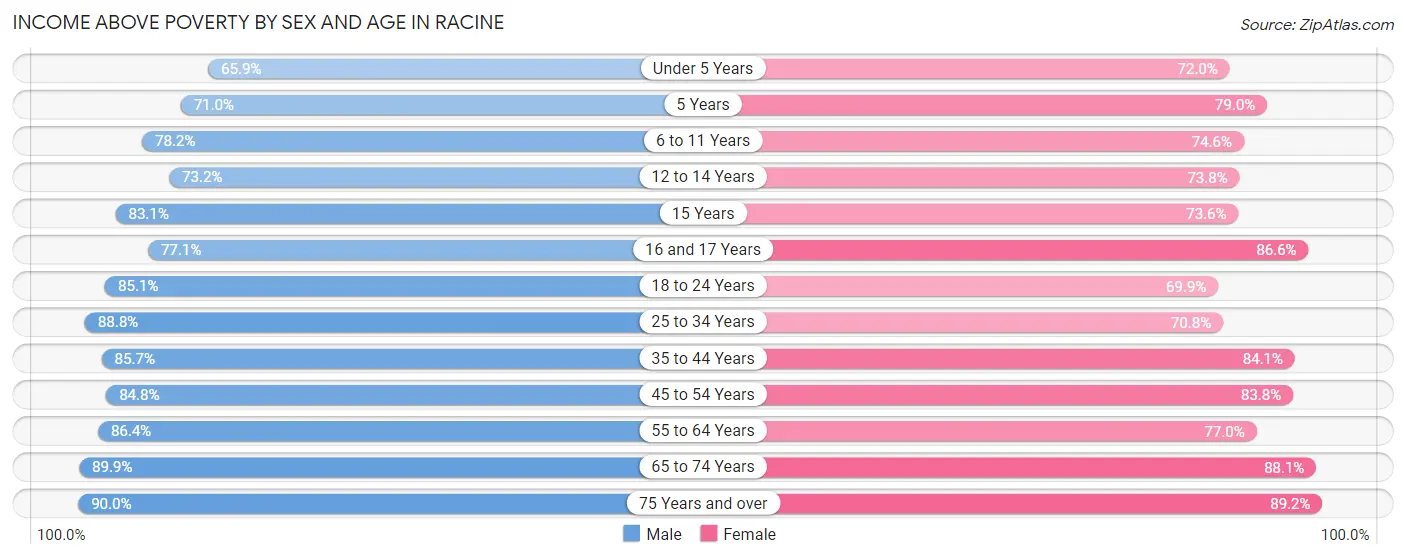
| Age Bracket | Male | Female |
| Under 5 Years | 1,553 (65.9%) | 1,632 (72.0%) |
| 5 Years | 402 (71.0%) | 604 (78.9%) |
| 6 to 11 Years | 3,034 (78.2%) | 2,457 (74.6%) |
| 12 to 14 Years | 1,477 (73.2%) | 1,316 (73.8%) |
| 15 Years | 433 (83.1%) | 382 (73.6%) |
| 16 and 17 Years | 969 (77.1%) | 1,281 (86.6%) |
| 18 to 24 Years | 2,622 (85.1%) | 2,504 (69.9%) |
| 25 to 34 Years | 4,434 (88.8%) | 3,930 (70.8%) |
| 35 to 44 Years | 3,795 (85.7%) | 4,455 (84.1%) |
| 45 to 54 Years | 3,762 (84.8%) | 3,998 (83.8%) |
| 55 to 64 Years | 3,990 (86.4%) | 3,478 (77.0%) |
| 65 to 74 Years | 2,477 (89.9%) | 3,007 (88.0%) |
| 75 Years and over | 1,247 (90.0%) | 2,303 (89.2%) |
| Total | 30,195 (83.2%) | 31,347 (78.7%) |
Income Below Poverty Among Married-Couple Families in Racine
The poverty statistics for married-couple families in Racine show that 4.0% or 412 of the total 10,245 families live below the poverty line. Families with 5 or more children have the highest poverty rate of 20.7%, comprising of 22 families. On the other hand, families with no children have the lowest poverty rate of 2.3%, which includes 141 families.
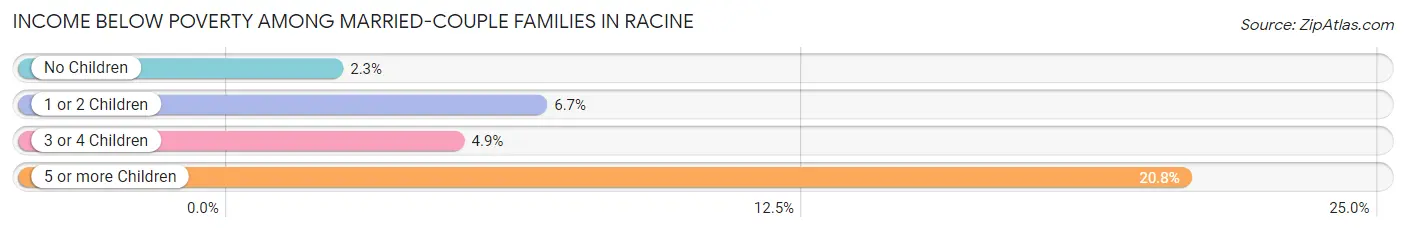
| Children | Above Poverty | Below Poverty |
| No Children | 6,028 (97.7%) | 141 (2.3%) |
| 1 or 2 Children | 2,757 (93.3%) | 199 (6.7%) |
| 3 or 4 Children | 964 (95.1%) | 50 (4.9%) |
| 5 or more Children | 84 (79.2%) | 22 (20.7%) |
| Total | 9,833 (96.0%) | 412 (4.0%) |
Income Below Poverty Among Single-Parent Households in Racine
According to the poverty data in Racine, 19.9% or 507 single-father households and 31.9% or 1,872 single-mother households are living below the poverty line. Among single-father households, those with 5 or more children have the highest poverty rate, with 32 households (100.0%) experiencing poverty. Likewise, among single-mother households, those with 5 or more children have the highest poverty rate, with 111 households (60.3%) falling below the poverty line.
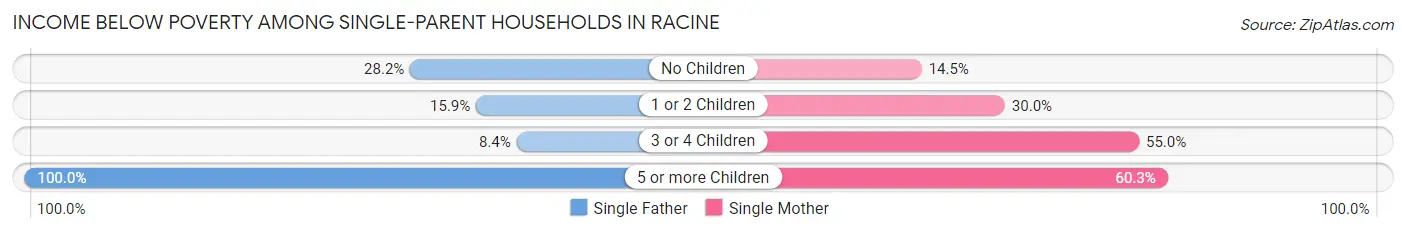
| Children | Single Father | Single Mother |
| No Children | 226 (28.2%) | 200 (14.5%) |
| 1 or 2 Children | 222 (15.9%) | 969 (30.0%) |
| 3 or 4 Children | 27 (8.4%) | 592 (55.0%) |
| 5 or more Children | 32 (100.0%) | 111 (60.3%) |
| Total | 507 (19.9%) | 1,872 (31.9%) |
Income Below Poverty Among Married-Couple vs Single-Parent Households in Racine
The poverty data for Racine shows that 412 of the married-couple family households (4.0%) and 2,379 of the single-parent households (28.3%) are living below the poverty level. Within the married-couple family households, those with 5 or more children have the highest poverty rate, with 22 households (20.7%) falling below the poverty line. Among the single-parent households, those with 5 or more children have the highest poverty rate, with 143 household (66.2%) living below poverty.
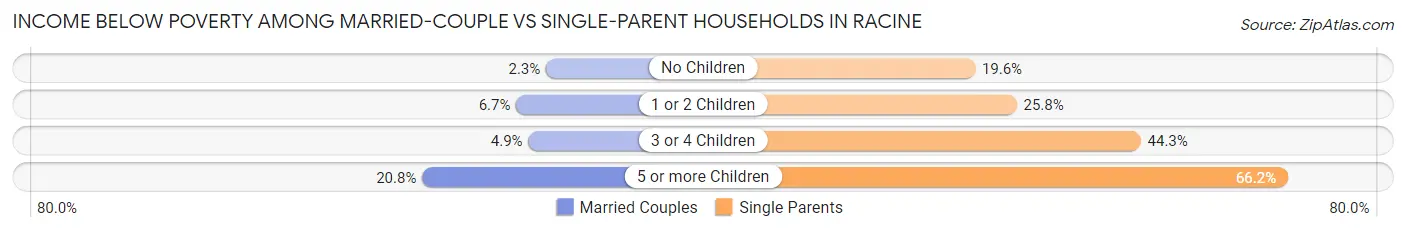
| Children | Married-Couple Families | Single-Parent Households |
| No Children | 141 (2.3%) | 426 (19.6%) |
| 1 or 2 Children | 199 (6.7%) | 1,191 (25.8%) |
| 3 or 4 Children | 50 (4.9%) | 619 (44.3%) |
| 5 or more Children | 22 (20.7%) | 143 (66.2%) |
| Total | 412 (4.0%) | 2,379 (28.3%) |
Race in Racine
The most populous races in Racine are White / Caucasian (45,798 | 59.1%), Hispanic or Latino (18,094 | 23.4%), and Black / African American (16,611 | 21.4%).
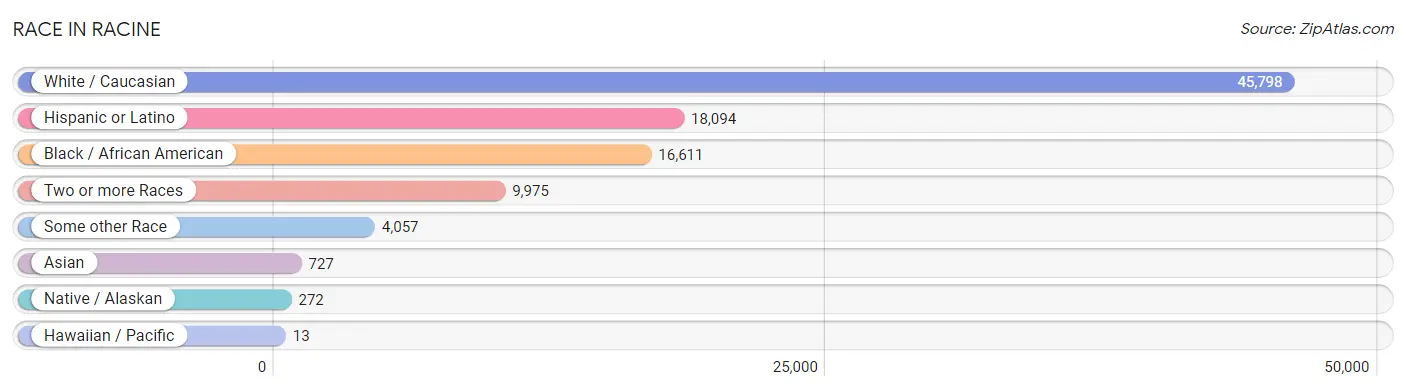
| Race | # Population | % Population |
| Asian | 727 | 0.9% |
| Black / African American | 16,611 | 21.4% |
| Hawaiian / Pacific | 13 | 0.0% |
| Hispanic or Latino | 18,094 | 23.4% |
| Native / Alaskan | 272 | 0.4% |
| White / Caucasian | 45,798 | 59.1% |
| Two or more Races | 9,975 | 12.9% |
| Some other Race | 4,057 | 5.2% |
| Total | 77,453 | 100.0% |
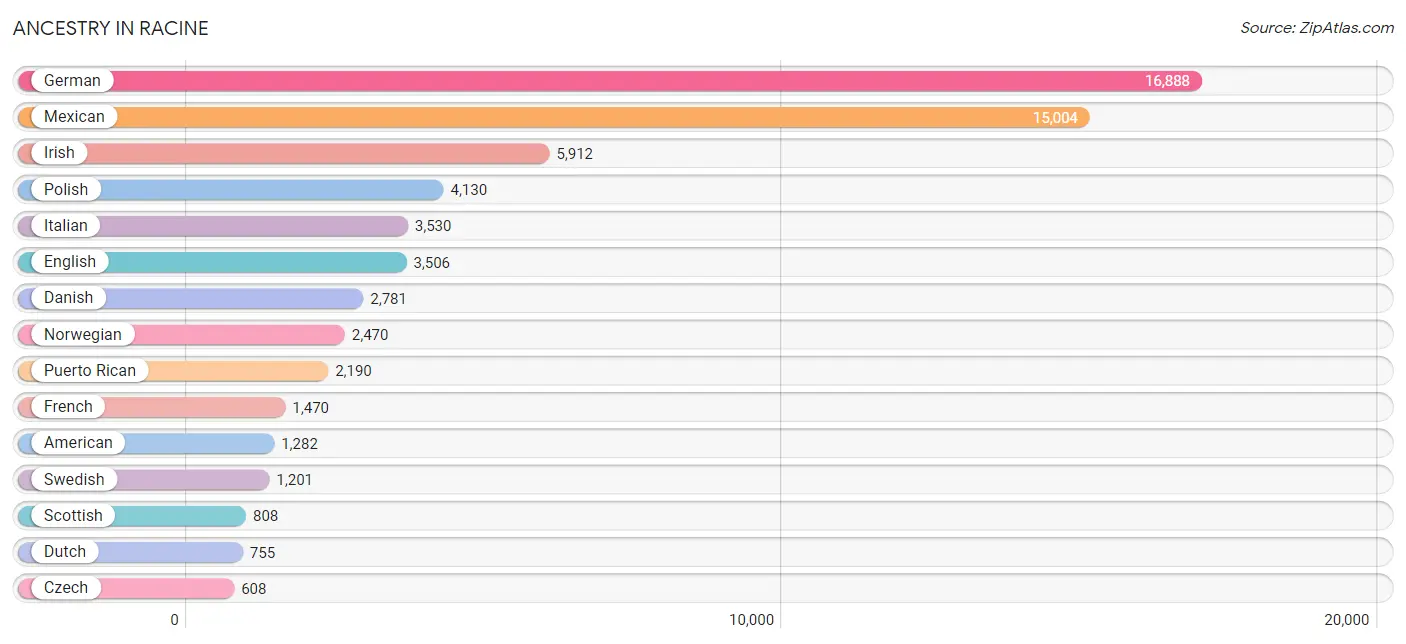
Ancestry in Racine
The most populous ancestries reported in Racine are German (16,888 | 21.8%), Mexican (15,004 | 19.4%), Irish (5,912 | 7.6%), Polish (4,130 | 5.3%), and Italian (3,530 | 4.6%), together accounting for 58.7% of all Racine residents.
| Ancestry | # Population | % Population |
| African | 367 | 0.5% |
| Albanian | 198 | 0.3% |
| American | 1,282 | 1.7% |
| Apache | 29 | 0.0% |
| Arab | 234 | 0.3% |
| Armenian | 319 | 0.4% |
| Assyrian / Chaldean / Syriac | 12 | 0.0% |
| Austrian | 101 | 0.1% |
| Bangladeshi | 24 | 0.0% |
| Belgian | 177 | 0.2% |
| Bhutanese | 49 | 0.1% |
| Blackfeet | 50 | 0.1% |
| Brazilian | 82 | 0.1% |
| British | 294 | 0.4% |
| Burmese | 109 | 0.1% |
| Canadian | 178 | 0.2% |
| Central American | 308 | 0.4% |
| Central American Indian | 24 | 0.0% |
| Cherokee | 168 | 0.2% |
| Chilean | 14 | 0.0% |
| Chippewa | 175 | 0.2% |
| Choctaw | 25 | 0.0% |
| Croatian | 160 | 0.2% |
| Cuban | 190 | 0.3% |
| Czech | 608 | 0.8% |
| Czechoslovakian | 74 | 0.1% |
| Danish | 2,781 | 3.6% |
| Dominican | 63 | 0.1% |
| Dutch | 755 | 1.0% |
| Eastern European | 81 | 0.1% |
| Egyptian | 53 | 0.1% |
| English | 3,506 | 4.5% |
| Ethiopian | 35 | 0.1% |
| European | 287 | 0.4% |
| Finnish | 187 | 0.2% |
| French | 1,470 | 1.9% |
| French American Indian | 11 | 0.0% |
| French Canadian | 501 | 0.6% |
| German | 16,888 | 21.8% |
| German Russian | 13 | 0.0% |
| Greek | 100 | 0.1% |
| Guatemalan | 170 | 0.2% |
| Haitian | 14 | 0.0% |
| Honduran | 42 | 0.1% |
| Hungarian | 285 | 0.4% |
| Indian (Asian) | 178 | 0.2% |
| Irish | 5,912 | 7.6% |
| Iroquois | 13 | 0.0% |
| Italian | 3,530 | 4.6% |
| Jamaican | 39 | 0.1% |
| Japanese | 15 | 0.0% |
| Korean | 307 | 0.4% |
| Laotian | 8 | 0.0% |
| Lebanese | 32 | 0.0% |
| Lithuanian | 179 | 0.2% |
| Macedonian | 38 | 0.1% |
| Menominee | 17 | 0.0% |
| Mexican | 15,004 | 19.4% |
| Mexican American Indian | 187 | 0.2% |
| Native Hawaiian | 16 | 0.0% |
| Nicaraguan | 16 | 0.0% |
| Nigerian | 14 | 0.0% |
| Northern European | 100 | 0.1% |
| Norwegian | 2,470 | 3.2% |
| Ottawa | 4 | 0.0% |
| Pakistani | 48 | 0.1% |
| Panamanian | 24 | 0.0% |
| Paraguayan | 10 | 0.0% |
| Pennsylvania German | 7 | 0.0% |
| Peruvian | 30 | 0.0% |
| Polish | 4,130 | 5.3% |
| Portuguese | 25 | 0.0% |
| Puerto Rican | 2,190 | 2.8% |
| Russian | 247 | 0.3% |
| Salvadoran | 56 | 0.1% |
| Scandinavian | 301 | 0.4% |
| Scotch-Irish | 211 | 0.3% |
| Scottish | 808 | 1.0% |
| Serbian | 450 | 0.6% |
| Sioux | 56 | 0.1% |
| Slavic | 5 | 0.0% |
| Slovak | 76 | 0.1% |
| Slovene | 117 | 0.2% |
| South African | 15 | 0.0% |
| South American | 54 | 0.1% |
| Spaniard | 85 | 0.1% |
| Spanish | 60 | 0.1% |
| Sri Lankan | 16 | 0.0% |
| Subsaharan African | 541 | 0.7% |
| Swedish | 1,201 | 1.5% |
| Swiss | 133 | 0.2% |
| Syrian | 10 | 0.0% |
| Thai | 168 | 0.2% |
| Ukrainian | 90 | 0.1% |
| Welsh | 260 | 0.3% |
| West Indian | 4 | 0.0% | View All 96 Rows |
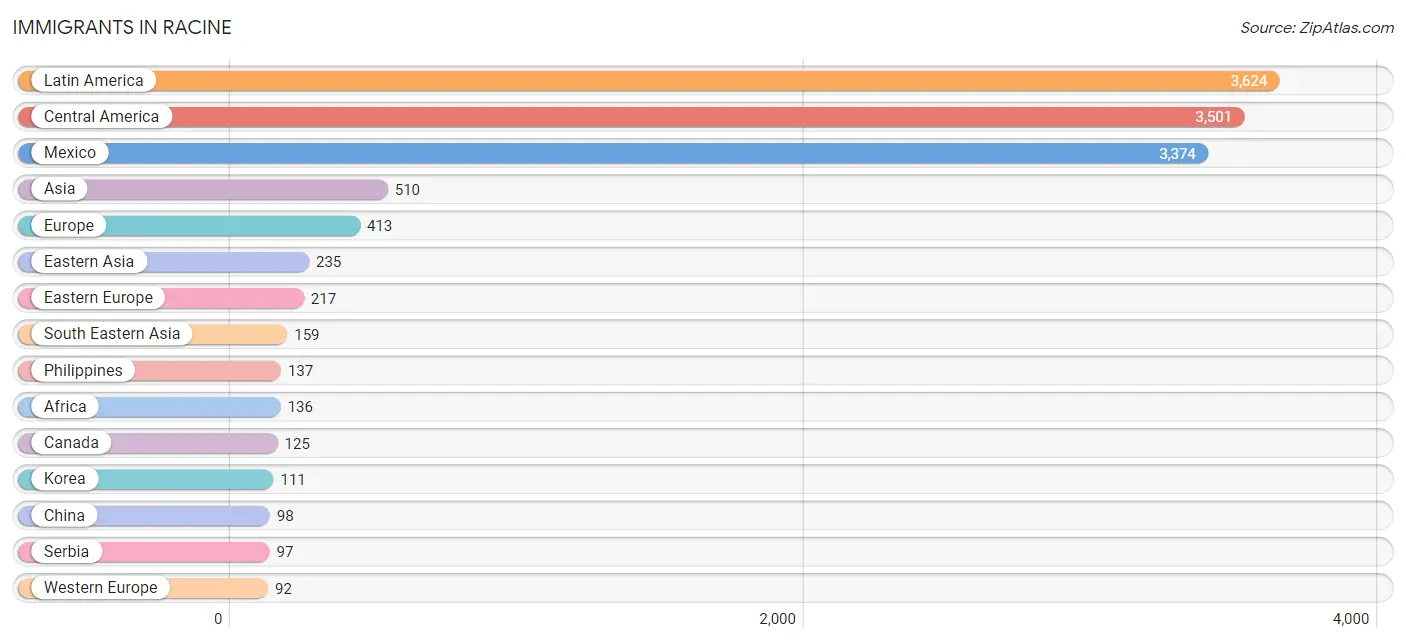
Immigrants in Racine
The most numerous immigrant groups reported in Racine came from Latin America (3,624 | 4.7%), Central America (3,501 | 4.5%), Mexico (3,374 | 4.4%), Asia (510 | 0.7%), and Europe (413 | 0.5%), together accounting for 14.7% of all Racine residents.
| Immigration Origin | # Population | % Population |
| Africa | 136 | 0.2% |
| Armenia | 4 | 0.0% |
| Asia | 510 | 0.7% |
| Australia | 16 | 0.0% |
| Brazil | 10 | 0.0% |
| Canada | 125 | 0.2% |
| Caribbean | 75 | 0.1% |
| Central America | 3,501 | 4.5% |
| Chile | 14 | 0.0% |
| China | 98 | 0.1% |
| Cuba | 7 | 0.0% |
| Czechoslovakia | 6 | 0.0% |
| Eastern Africa | 35 | 0.1% |
| Eastern Asia | 235 | 0.3% |
| Eastern Europe | 217 | 0.3% |
| Egypt | 14 | 0.0% |
| Ethiopia | 35 | 0.1% |
| Europe | 413 | 0.5% |
| France | 6 | 0.0% |
| Germany | 79 | 0.1% |
| Greece | 14 | 0.0% |
| Guatemala | 91 | 0.1% |
| Haiti | 14 | 0.0% |
| Honduras | 36 | 0.1% |
| India | 83 | 0.1% |
| Italy | 39 | 0.1% |
| Jamaica | 39 | 0.1% |
| Japan | 26 | 0.0% |
| Korea | 111 | 0.1% |
| Latin America | 3,624 | 4.7% |
| Lebanon | 10 | 0.0% |
| Lithuania | 18 | 0.0% |
| Mexico | 3,374 | 4.4% |
| Netherlands | 7 | 0.0% |
| Nigeria | 15 | 0.0% |
| North Macedonia | 40 | 0.1% |
| Northern Africa | 14 | 0.0% |
| Northern Europe | 51 | 0.1% |
| Oceania | 16 | 0.0% |
| Peru | 24 | 0.0% |
| Philippines | 137 | 0.2% |
| Poland | 32 | 0.0% |
| Scotland | 9 | 0.0% |
| Serbia | 97 | 0.1% |
| South Africa | 29 | 0.0% |
| South America | 48 | 0.1% |
| South Central Asia | 83 | 0.1% |
| South Eastern Asia | 159 | 0.2% |
| Southern Europe | 53 | 0.1% |
| Thailand | 22 | 0.0% |
| Western Africa | 15 | 0.0% |
| Western Asia | 14 | 0.0% |
| Western Europe | 92 | 0.1% | View All 53 Rows |
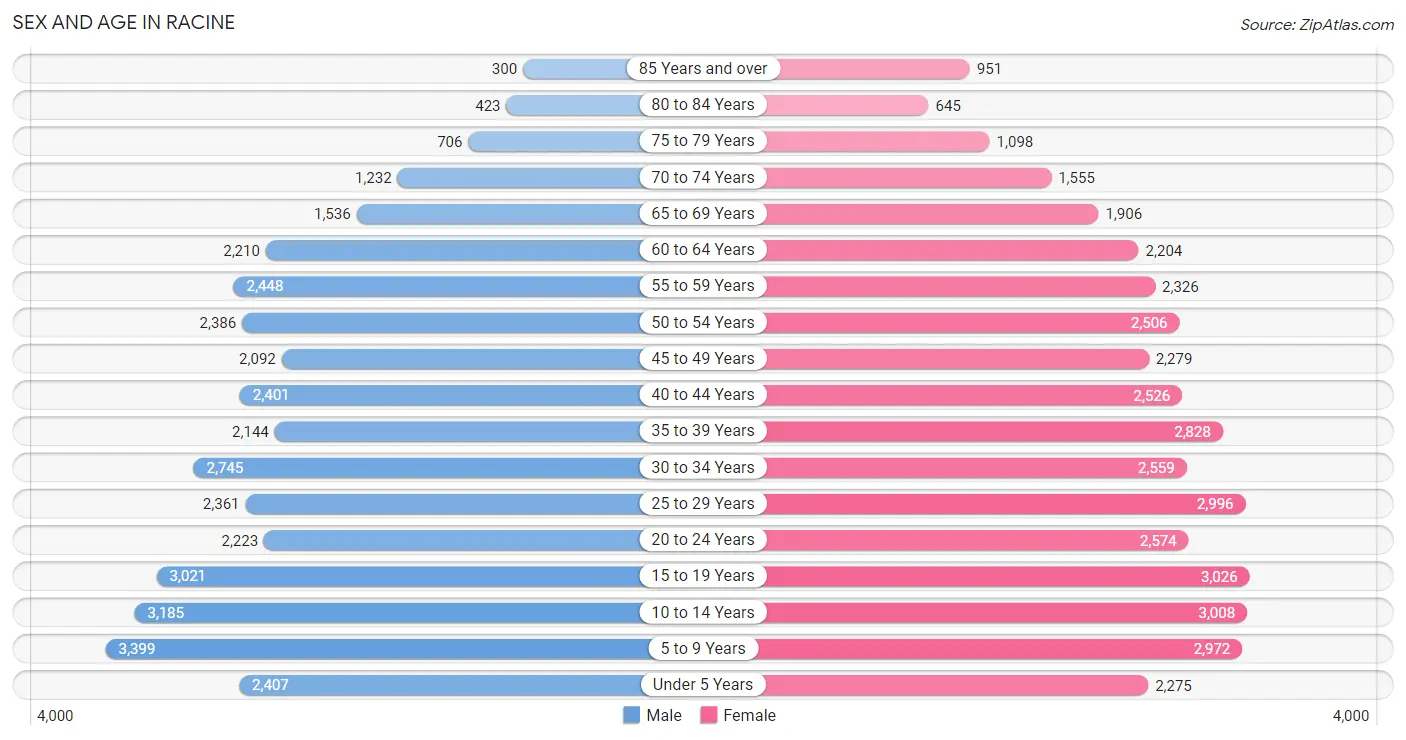
Sex and Age in Racine
Sex and Age in Racine
The most populous age groups in Racine are 5 to 9 Years (3,399 | 9.1%) for men and 15 to 19 Years (3,026 | 7.5%) for women.
| Age Bracket | Male | Female |
| Under 5 Years | 2,407 (6.5%) | 2,275 (5.7%) |
| 5 to 9 Years | 3,399 (9.1%) | 2,972 (7.4%) |
| 10 to 14 Years | 3,185 (8.6%) | 3,008 (7.5%) |
| 15 to 19 Years | 3,021 (8.1%) | 3,026 (7.5%) |
| 20 to 24 Years | 2,223 (6.0%) | 2,574 (6.4%) |
| 25 to 29 Years | 2,361 (6.3%) | 2,996 (7.4%) |
| 30 to 34 Years | 2,745 (7.4%) | 2,559 (6.4%) |
| 35 to 39 Years | 2,144 (5.8%) | 2,828 (7.0%) |
| 40 to 44 Years | 2,401 (6.5%) | 2,526 (6.3%) |
| 45 to 49 Years | 2,092 (5.6%) | 2,279 (5.7%) |
| 50 to 54 Years | 2,386 (6.4%) | 2,506 (6.2%) |
| 55 to 59 Years | 2,448 (6.6%) | 2,326 (5.8%) |
| 60 to 64 Years | 2,210 (5.9%) | 2,204 (5.5%) |
| 65 to 69 Years | 1,536 (4.1%) | 1,906 (4.7%) |
| 70 to 74 Years | 1,232 (3.3%) | 1,555 (3.9%) |
| 75 to 79 Years | 706 (1.9%) | 1,098 (2.7%) |
| 80 to 84 Years | 423 (1.1%) | 645 (1.6%) |
| 85 Years and over | 300 (0.8%) | 951 (2.4%) |
| Total | 37,219 (100.0%) | 40,234 (100.0%) |
Families and Households in Racine
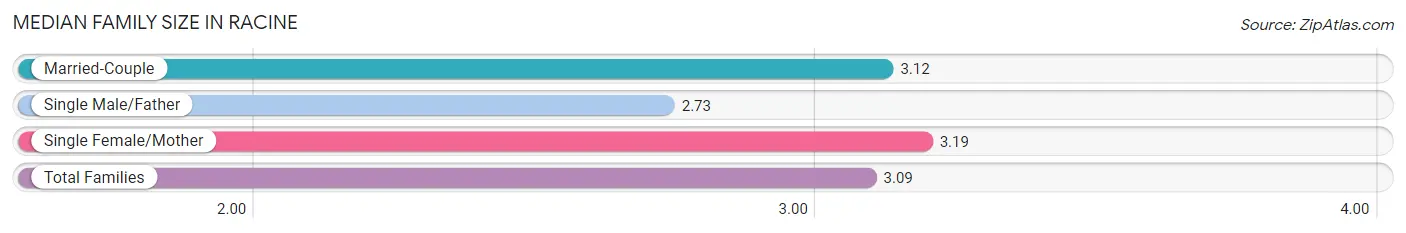
Median Family Size in Racine
The median family size in Racine is 3.09 persons per family, with single female/mother families (5,863 | 31.4%) accounting for the largest median family size of 3.19 persons per family. On the other hand, single male/father families (2,553 | 13.7%) represent the smallest median family size with 2.73 persons per family.
| Family Type | # Families | Family Size |
| Married-Couple | 10,245 (54.9%) | 3.12 |
| Single Male/Father | 2,553 (13.7%) | 2.73 |
| Single Female/Mother | 5,863 (31.4%) | 3.19 |
| Total Families | 18,661 (100.0%) | 3.09 |
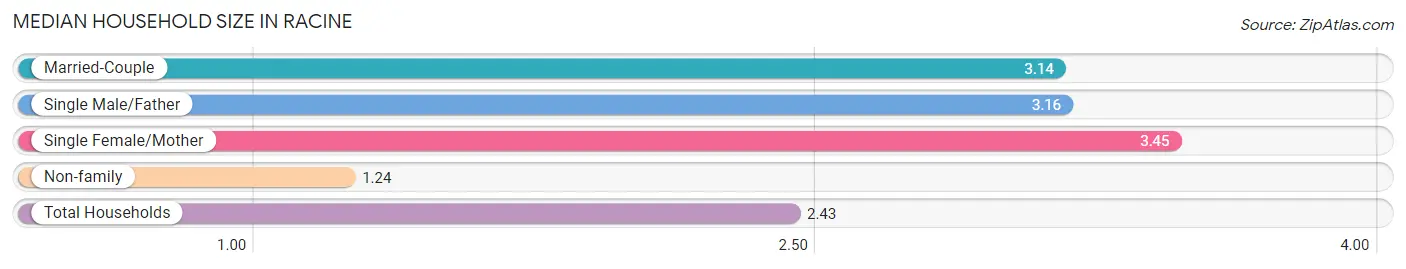
Median Household Size in Racine
The median household size in Racine is 2.43 persons per household, with single female/mother households (5,863 | 18.7%) accounting for the largest median household size of 3.45 persons per household. non-family households (12,621 | 40.4%) represent the smallest median household size with 1.24 persons per household.
| Household Type | # Households | Household Size |
| Married-Couple | 10,245 (32.8%) | 3.14 |
| Single Male/Father | 2,553 (8.2%) | 3.16 |
| Single Female/Mother | 5,863 (18.7%) | 3.45 |
| Non-family | 12,621 (40.4%) | 1.24 |
| Total Households | 31,282 (100.0%) | 2.43 |
Household Size by Marriage Status in Racine
Out of a total of 31,282 households in Racine, 18,661 (59.7%) are family households, while 12,621 (40.4%) are nonfamily households. The most numerous type of family households are 2-person households, comprising 7,199, and the most common type of nonfamily households are 1-person households, comprising 10,440.
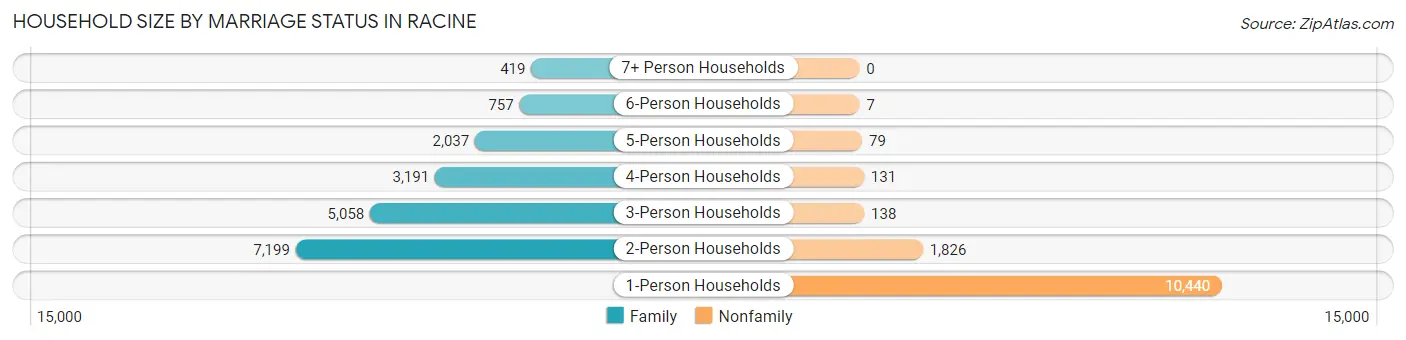
| Household Size | Family Households | Nonfamily Households |
| 1-Person Households | - | 10,440 (33.4%) |
| 2-Person Households | 7,199 (23.0%) | 1,826 (5.8%) |
| 3-Person Households | 5,058 (16.2%) | 138 (0.4%) |
| 4-Person Households | 3,191 (10.2%) | 131 (0.4%) |
| 5-Person Households | 2,037 (6.5%) | 79 (0.3%) |
| 6-Person Households | 757 (2.4%) | 7 (0.0%) |
| 7+ Person Households | 419 (1.3%) | 0 (0.0%) |
| Total | 18,661 (59.7%) | 12,621 (40.4%) |
Female Fertility in Racine
Fertility by Age in Racine
Average fertility rate in Racine is 41.0 births per 1,000 women. Women in the age bracket of 20 to 34 years have the highest fertility rate with 82.0 births per 1,000 women. Women in the age bracket of 20 to 34 years acount for 84.7% of all women with births.
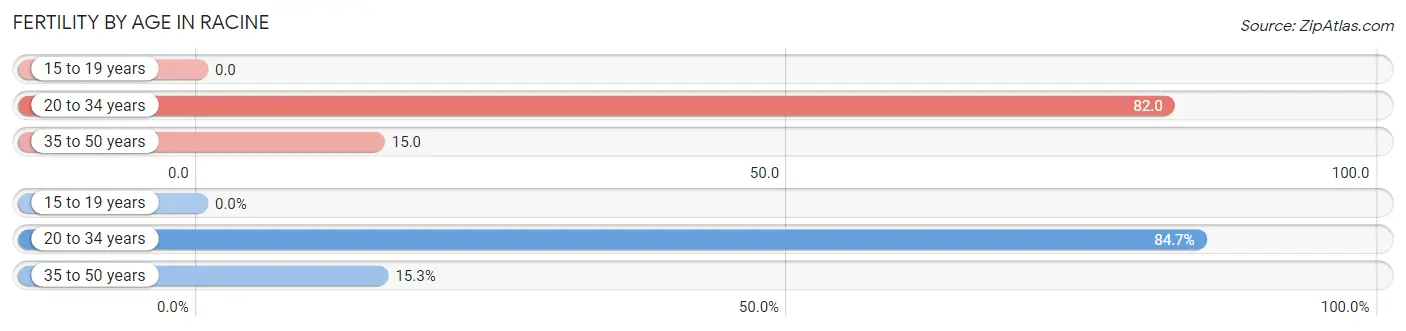
| Age Bracket | Women with Births | Births / 1,000 Women |
| 15 to 19 years | 0 (0.0%) | 0.0 |
| 20 to 34 years | 664 (84.7%) | 82.0 |
| 35 to 50 years | 120 (15.3%) | 15.0 |
| Total | 784 (100.0%) | 41.0 |
Fertility by Age by Marriage Status in Racine
30.6% of women with births (784) in Racine are married. The highest percentage of unmarried women with births falls into 20 to 34 years age bracket with 71.1% of them unmarried at the time of birth, while the lowest percentage of unmarried women with births belong to 35 to 50 years age bracket with 60.0% of them unmarried.
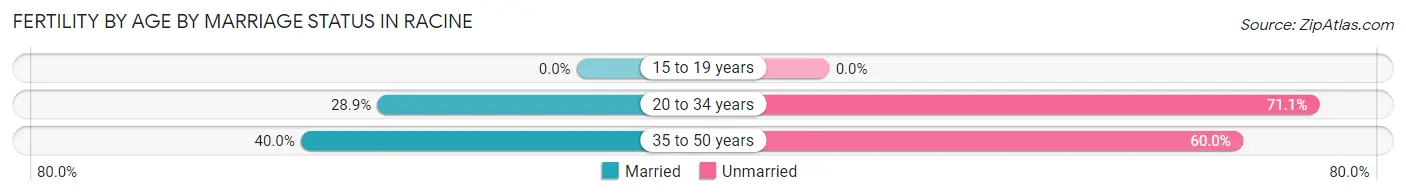
| Age Bracket | Married | Unmarried |
| 15 to 19 years | 0 (0.0%) | 0 (0.0%) |
| 20 to 34 years | 192 (28.9%) | 472 (71.1%) |
| 35 to 50 years | 48 (40.0%) | 72 (60.0%) |
| Total | 240 (30.6%) | 544 (69.4%) |
Fertility by Education in Racine
Average fertility rate in Racine is 41.0 births per 1,000 women. Women with the education attainment of graduate degree have the highest fertility rate of 70.0 births per 1,000 women, while women with the education attainment of bachelor's degree have the lowest fertility at 13.0 births per 1,000 women. Women with the education attainment of college or associate's degree represent 41.1% of all women with births.
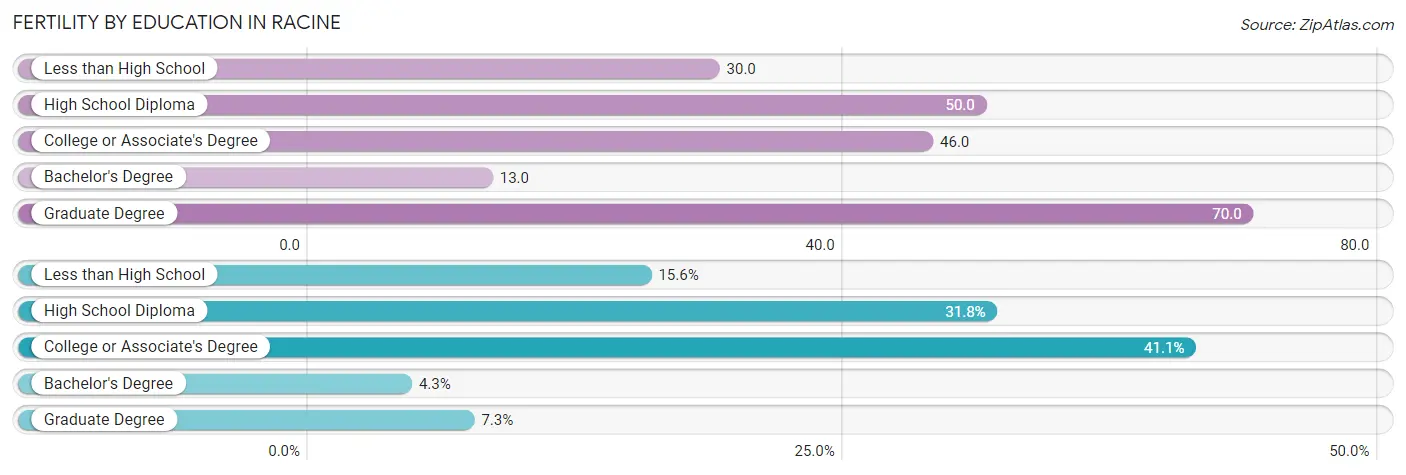
| Educational Attainment | Women with Births | Births / 1,000 Women |
| Less than High School | 122 (15.6%) | 30.0 |
| High School Diploma | 249 (31.8%) | 50.0 |
| College or Associate's Degree | 322 (41.1%) | 46.0 |
| Bachelor's Degree | 34 (4.3%) | 13.0 |
| Graduate Degree | 57 (7.3%) | 70.0 |
| Total | 784 (100.0%) | 41.0 |
Fertility by Education by Marriage Status in Racine
69.4% of women with births in Racine are unmarried. Women with the educational attainment of graduate degree are most likely to be married with 84.2% of them married at childbirth, while women with the educational attainment of high school diploma are least likely to be married with 76.7% of them unmarried at childbirth.
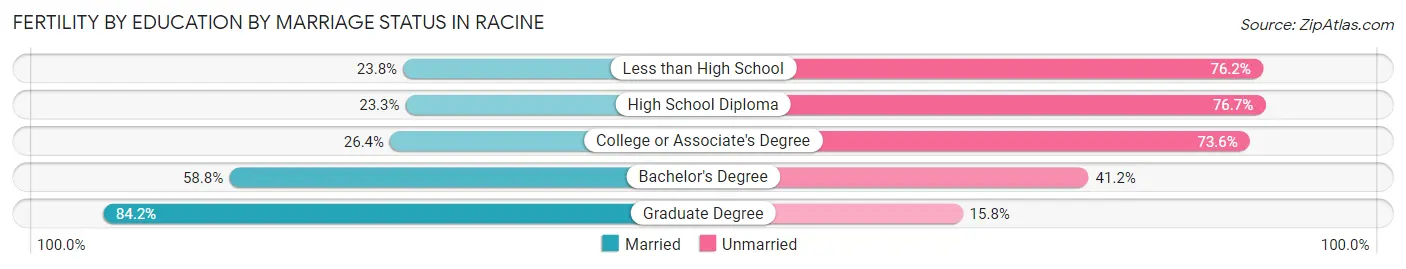
| Educational Attainment | Married | Unmarried |
| Less than High School | 29 (23.8%) | 93 (76.2%) |
| High School Diploma | 58 (23.3%) | 191 (76.7%) |
| College or Associate's Degree | 85 (26.4%) | 237 (73.6%) |
| Bachelor's Degree | 20 (58.8%) | 14 (41.2%) |
| Graduate Degree | 48 (84.2%) | 9 (15.8%) |
| Total | 240 (30.6%) | 544 (69.4%) |
Employment Characteristics in Racine
Employment by Class of Employer in Racine
Among the 35,091 employed individuals in Racine, private company employees (26,978 | 76.9%), not-for-profit organizations (2,268 | 6.5%), and local government employees (2,249 | 6.4%) make up the most common classes of employment.
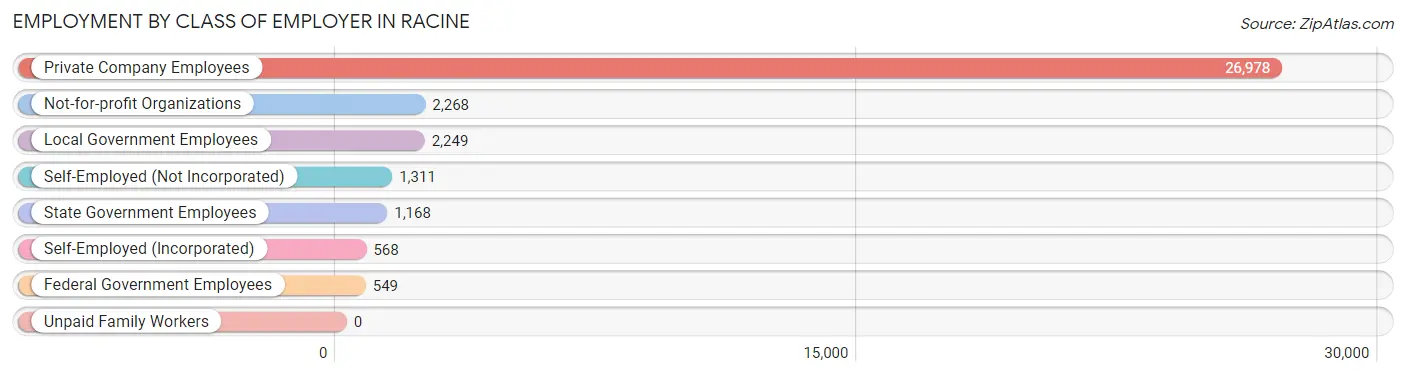
| Employer Class | # Employees | % Employees |
| Private Company Employees | 26,978 | 76.9% |
| Self-Employed (Incorporated) | 568 | 1.6% |
| Self-Employed (Not Incorporated) | 1,311 | 3.7% |
| Not-for-profit Organizations | 2,268 | 6.5% |
| Local Government Employees | 2,249 | 6.4% |
| State Government Employees | 1,168 | 3.3% |
| Federal Government Employees | 549 | 1.6% |
| Unpaid Family Workers | 0 | 0.0% |
| Total | 35,091 | 100.0% |
Employment Status by Age in Racine
According to the labor force statistics for Racine, out of the total population over 16 years of age (59,158), 64.3% or 38,039 individuals are in the labor force, with 6.0% or 2,282 of them unemployed. The age group with the highest labor force participation rate is 35 to 44 years, with 84.2% or 8,335 individuals in the labor force. Within the labor force, the 16 to 19 years age range has the highest percentage of unemployed individuals, with 15.1% or 398 of them being unemployed.
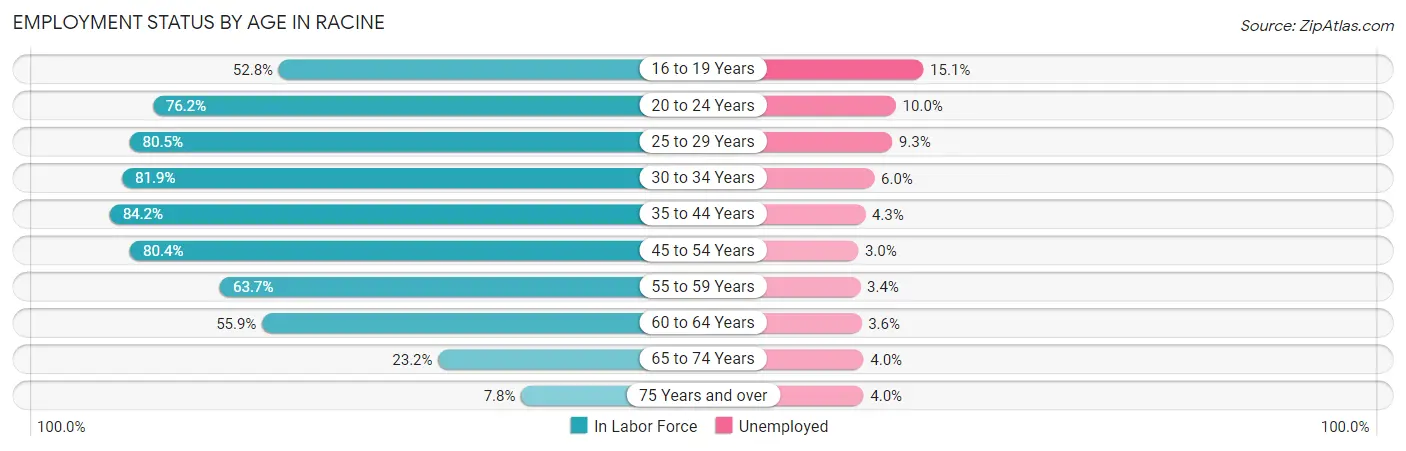
| Age Bracket | In Labor Force | Unemployed |
| 16 to 19 Years | 2,639 (52.8%) | 398 (15.1%) |
| 20 to 24 Years | 3,655 (76.2%) | 366 (10.0%) |
| 25 to 29 Years | 4,312 (80.5%) | 401 (9.3%) |
| 30 to 34 Years | 4,344 (81.9%) | 261 (6.0%) |
| 35 to 44 Years | 8,335 (84.2%) | 358 (4.3%) |
| 45 to 54 Years | 7,447 (80.4%) | 223 (3.0%) |
| 55 to 59 Years | 3,041 (63.7%) | 103 (3.4%) |
| 60 to 64 Years | 2,467 (55.9%) | 89 (3.6%) |
| 65 to 74 Years | 1,445 (23.2%) | 58 (4.0%) |
| 75 Years and over | 322 (7.8%) | 13 (4.0%) |
| Total | 38,039 (64.3%) | 2,282 (6.0%) |
Employment Status by Educational Attainment in Racine
According to labor force statistics for Racine, 76.8% of individuals (29,960) out of the total population between 25 and 64 years of age (39,011) are in the labor force, with 4.8% or 1,438 of them being unemployed. The group with the highest labor force participation rate are those with the educational attainment of bachelor's degree or higher, with 87.4% or 6,330 individuals in the labor force. Within the labor force, individuals with less than high school education have the highest percentage of unemployment, with 13.5% or 436 of them being unemployed.
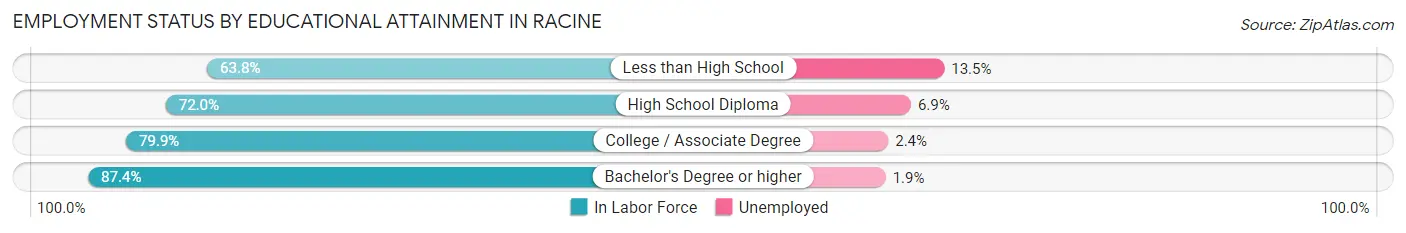
| Educational Attainment | In Labor Force | Unemployed |
| Less than High School | 3,226 (63.8%) | 683 (13.5%) |
| High School Diploma | 8,699 (72.0%) | 834 (6.9%) |
| College / Associate Degree | 11,689 (79.9%) | 351 (2.4%) |
| Bachelor's Degree or higher | 6,330 (87.4%) | 138 (1.9%) |
| Total | 29,960 (76.8%) | 1,873 (4.8%) |
Employment Occupations by Sex in Racine
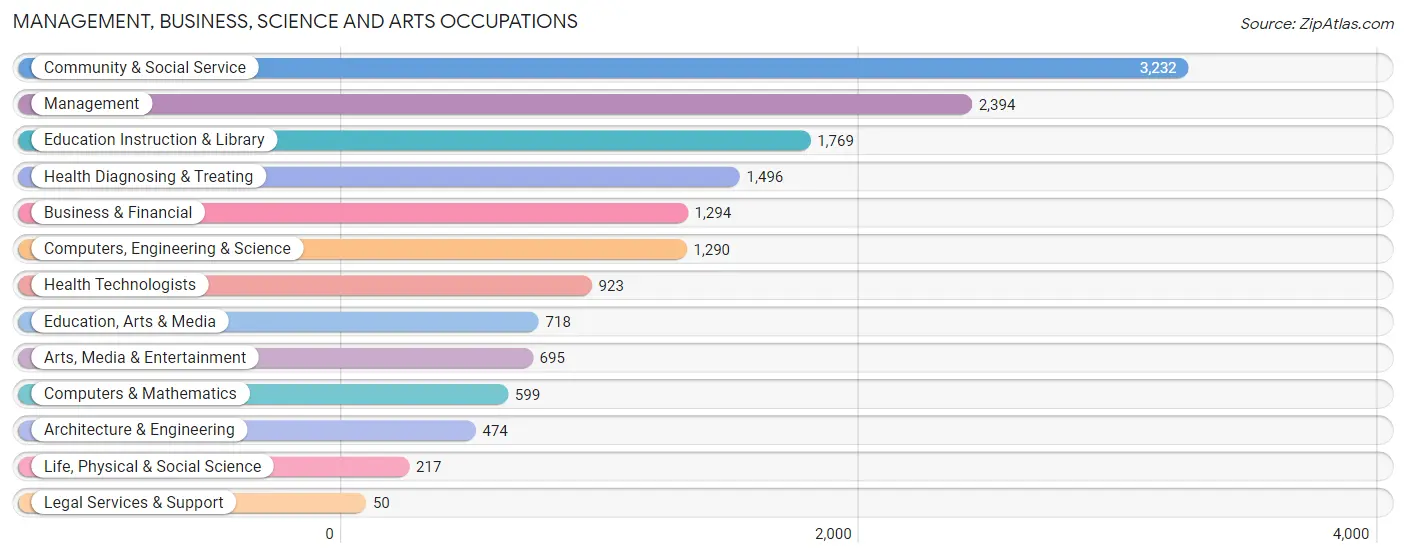
Management, Business, Science and Arts Occupations
The most common Management, Business, Science and Arts occupations in Racine are Community & Social Service (3,232 | 9.0%), Management (2,394 | 6.7%), Education Instruction & Library (1,769 | 5.0%), Health Diagnosing & Treating (1,496 | 4.2%), and Business & Financial (1,294 | 3.6%).
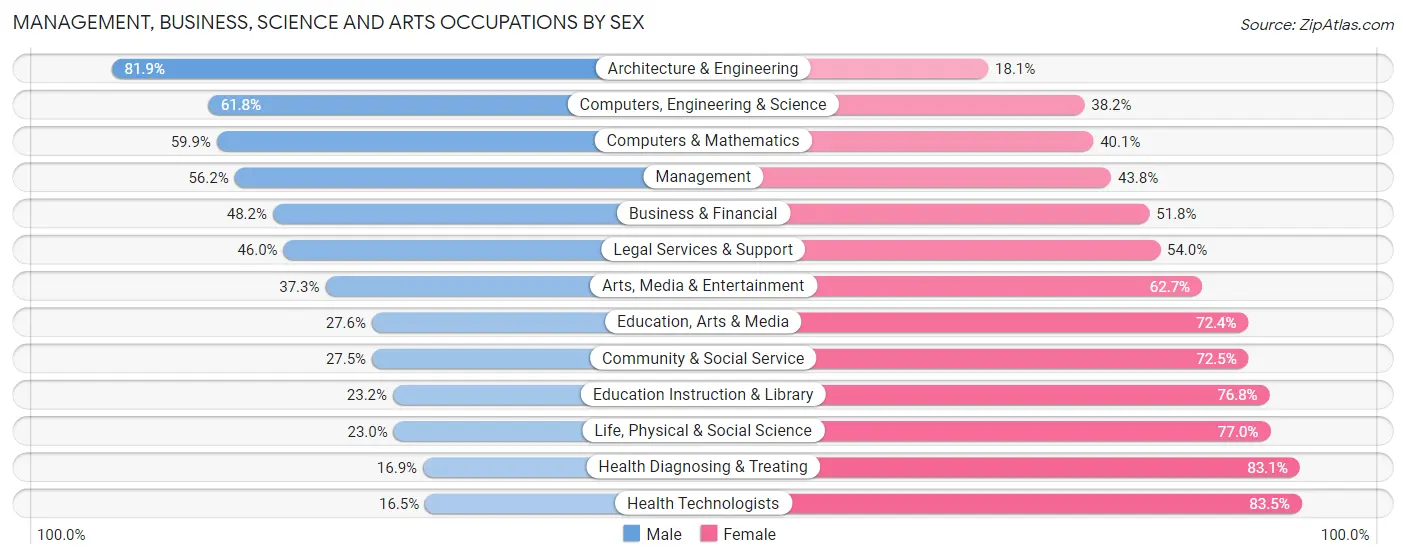
Management, Business, Science and Arts Occupations by Sex
Within the Management, Business, Science and Arts occupations in Racine, the most male-oriented occupations are Architecture & Engineering (81.9%), Computers, Engineering & Science (61.8%), and Computers & Mathematics (59.9%), while the most female-oriented occupations are Health Technologists (83.5%), Health Diagnosing & Treating (83.1%), and Life, Physical & Social Science (77.0%).
| Occupation | Male | Female |
| Management | 1,346 (56.2%) | 1,048 (43.8%) |
| Business & Financial | 624 (48.2%) | 670 (51.8%) |
| Computers, Engineering & Science | 797 (61.8%) | 493 (38.2%) |
| Computers & Mathematics | 359 (59.9%) | 240 (40.1%) |
| Architecture & Engineering | 388 (81.9%) | 86 (18.1%) |
| Life, Physical & Social Science | 50 (23.0%) | 167 (77.0%) |
| Community & Social Service | 890 (27.5%) | 2,342 (72.5%) |
| Education, Arts & Media | 198 (27.6%) | 520 (72.4%) |
| Legal Services & Support | 23 (46.0%) | 27 (54.0%) |
| Education Instruction & Library | 410 (23.2%) | 1,359 (76.8%) |
| Arts, Media & Entertainment | 259 (37.3%) | 436 (62.7%) |
| Health Diagnosing & Treating | 253 (16.9%) | 1,243 (83.1%) |
| Health Technologists | 152 (16.5%) | 771 (83.5%) |
| Total (Category) | 3,910 (40.3%) | 5,796 (59.7%) |
| Total (Overall) | 17,367 (48.6%) | 18,373 (51.4%) |
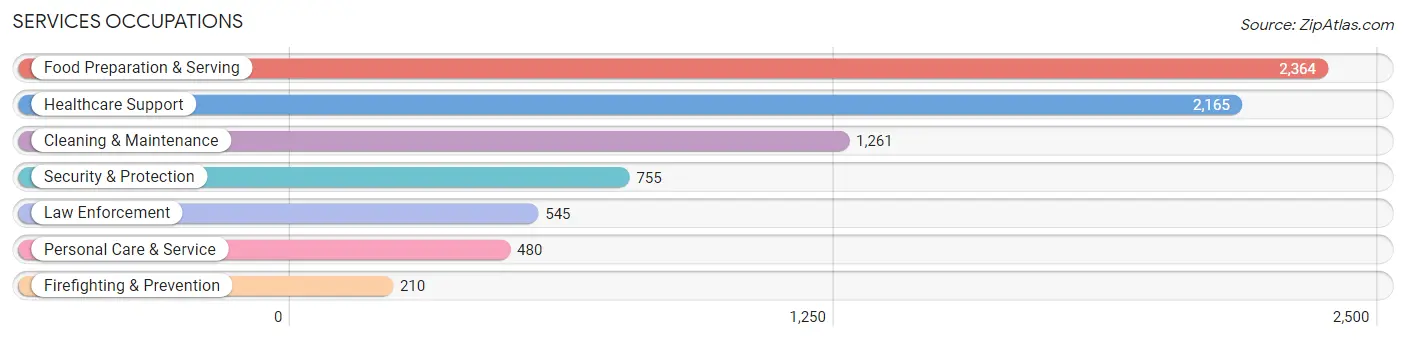
Services Occupations
The most common Services occupations in Racine are Food Preparation & Serving (2,364 | 6.6%), Healthcare Support (2,165 | 6.1%), Cleaning & Maintenance (1,261 | 3.5%), Security & Protection (755 | 2.1%), and Law Enforcement (545 | 1.5%).
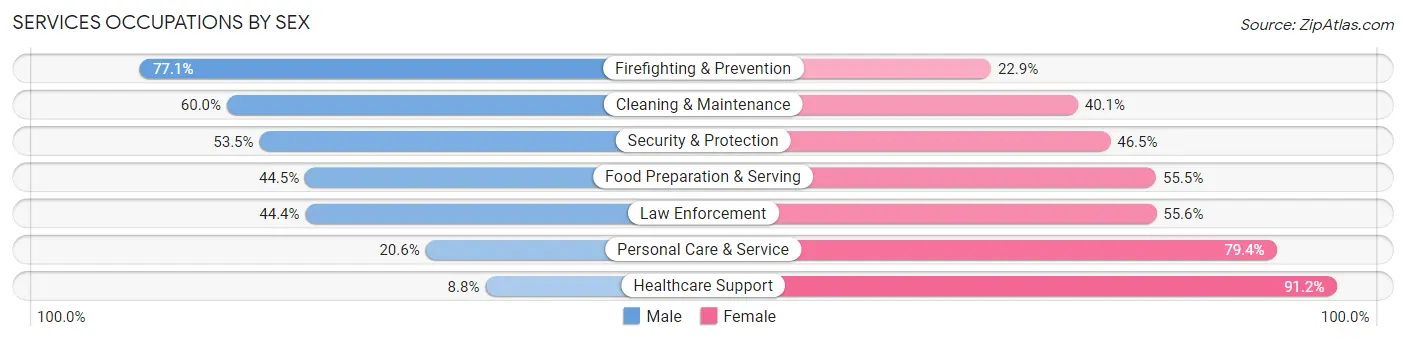
Services Occupations by Sex
Within the Services occupations in Racine, the most male-oriented occupations are Firefighting & Prevention (77.1%), Cleaning & Maintenance (60.0%), and Security & Protection (53.5%), while the most female-oriented occupations are Healthcare Support (91.2%), Personal Care & Service (79.4%), and Law Enforcement (55.6%).
| Occupation | Male | Female |
| Healthcare Support | 190 (8.8%) | 1,975 (91.2%) |
| Security & Protection | 404 (53.5%) | 351 (46.5%) |
| Firefighting & Prevention | 162 (77.1%) | 48 (22.9%) |
| Law Enforcement | 242 (44.4%) | 303 (55.6%) |
| Food Preparation & Serving | 1,051 (44.5%) | 1,313 (55.5%) |
| Cleaning & Maintenance | 756 (60.0%) | 505 (40.1%) |
| Personal Care & Service | 99 (20.6%) | 381 (79.4%) |
| Total (Category) | 2,500 (35.6%) | 4,525 (64.4%) |
| Total (Overall) | 17,367 (48.6%) | 18,373 (51.4%) |
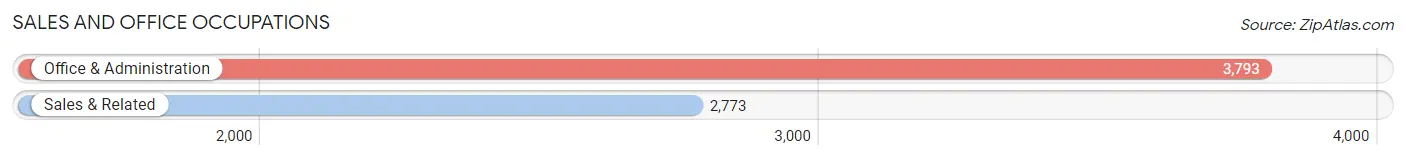
Sales and Office Occupations
The most common Sales and Office occupations in Racine are Office & Administration (3,793 | 10.6%), and Sales & Related (2,773 | 7.8%).
Sales and Office Occupations by Sex
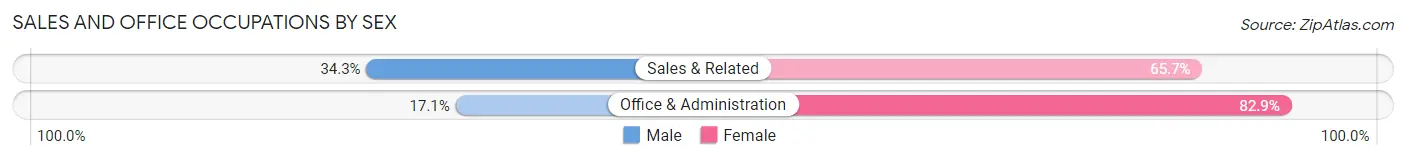
| Occupation | Male | Female |
| Sales & Related | 950 (34.3%) | 1,823 (65.7%) |
| Office & Administration | 649 (17.1%) | 3,144 (82.9%) |
| Total (Category) | 1,599 (24.3%) | 4,967 (75.6%) |
| Total (Overall) | 17,367 (48.6%) | 18,373 (51.4%) |
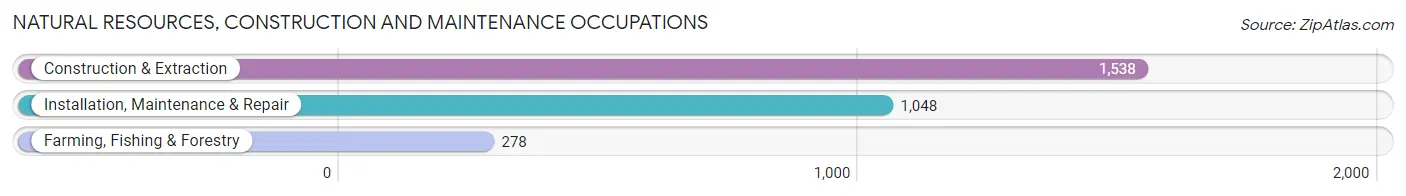
Natural Resources, Construction and Maintenance Occupations
The most common Natural Resources, Construction and Maintenance occupations in Racine are Construction & Extraction (1,538 | 4.3%), Installation, Maintenance & Repair (1,048 | 2.9%), and Farming, Fishing & Forestry (278 | 0.8%).
Natural Resources, Construction and Maintenance Occupations by Sex
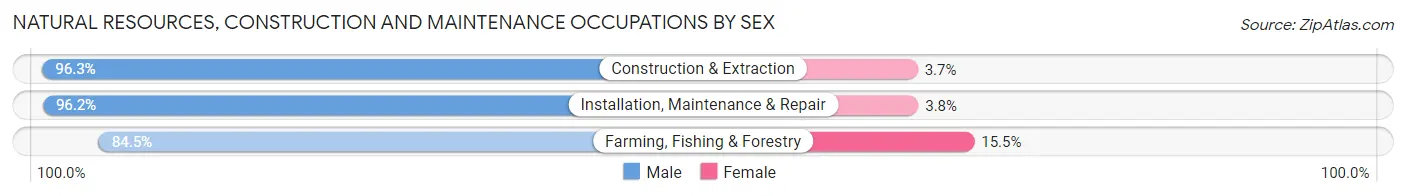
| Occupation | Male | Female |
| Farming, Fishing & Forestry | 235 (84.5%) | 43 (15.5%) |
| Construction & Extraction | 1,481 (96.3%) | 57 (3.7%) |
| Installation, Maintenance & Repair | 1,008 (96.2%) | 40 (3.8%) |
| Total (Category) | 2,724 (95.1%) | 140 (4.9%) |
| Total (Overall) | 17,367 (48.6%) | 18,373 (51.4%) |
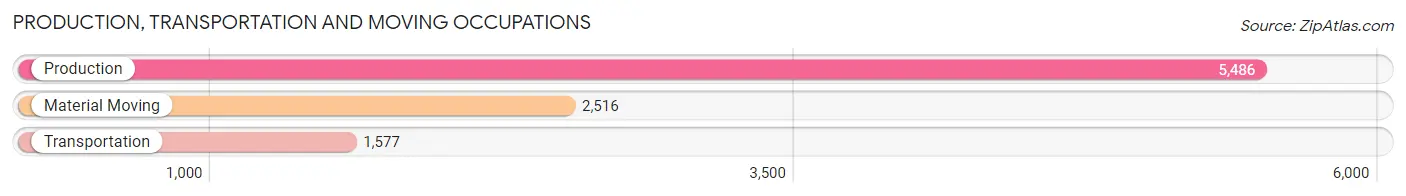
Production, Transportation and Moving Occupations
The most common Production, Transportation and Moving occupations in Racine are Production (5,486 | 15.3%), Material Moving (2,516 | 7.0%), and Transportation (1,577 | 4.4%).
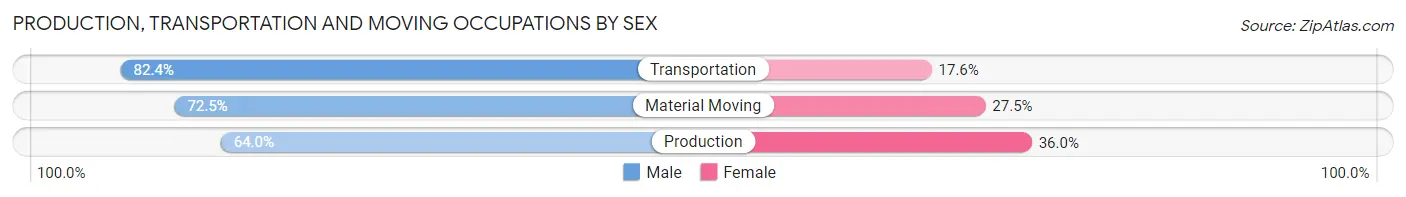
Production, Transportation and Moving Occupations by Sex
| Occupation | Male | Female |
| Production | 3,511 (64.0%) | 1,975 (36.0%) |
| Transportation | 1,299 (82.4%) | 278 (17.6%) |
| Material Moving | 1,824 (72.5%) | 692 (27.5%) |
| Total (Category) | 6,634 (69.3%) | 2,945 (30.7%) |
| Total (Overall) | 17,367 (48.6%) | 18,373 (51.4%) |
Employment Industries by Sex in Racine
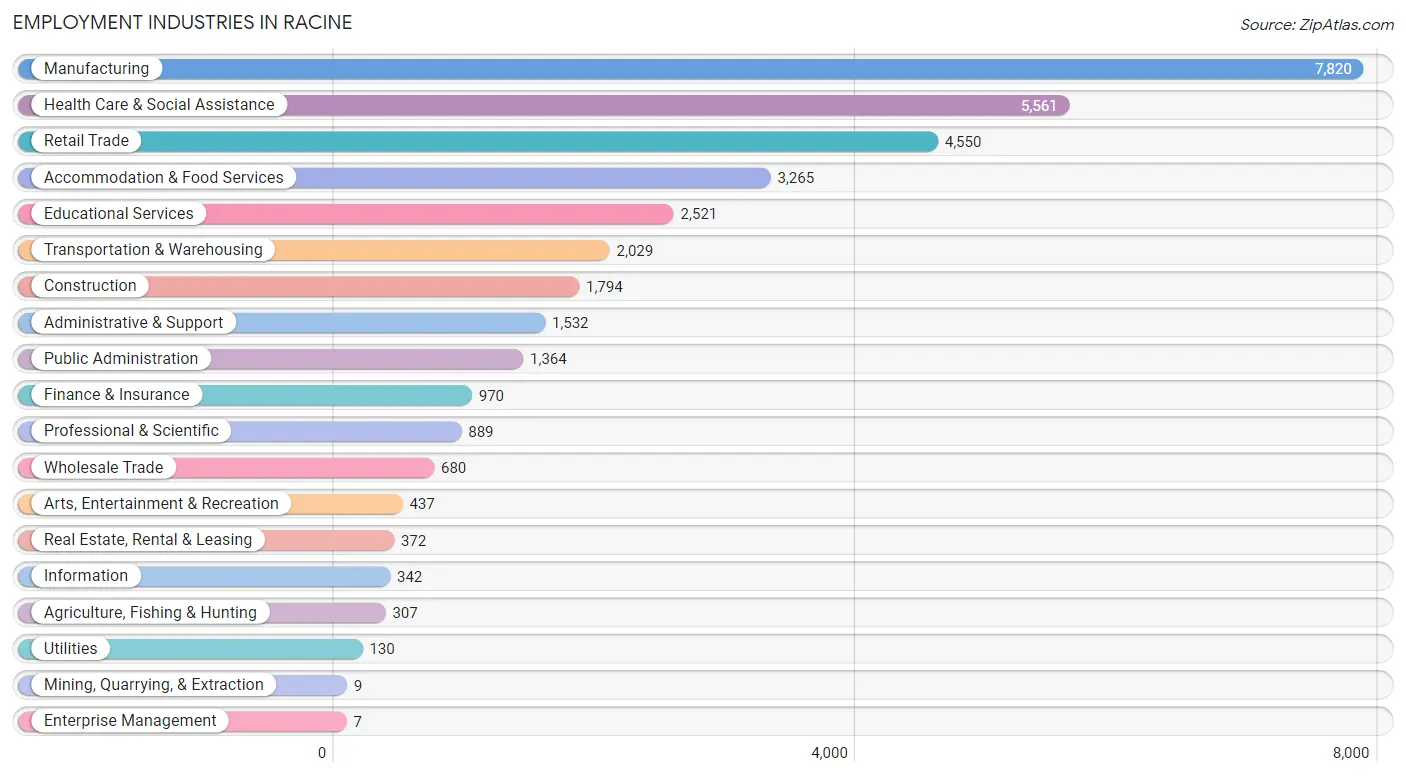
Employment Industries in Racine
The major employment industries in Racine include Manufacturing (7,820 | 21.9%), Health Care & Social Assistance (5,561 | 15.6%), Retail Trade (4,550 | 12.7%), Accommodation & Food Services (3,265 | 9.1%), and Educational Services (2,521 | 7.0%).
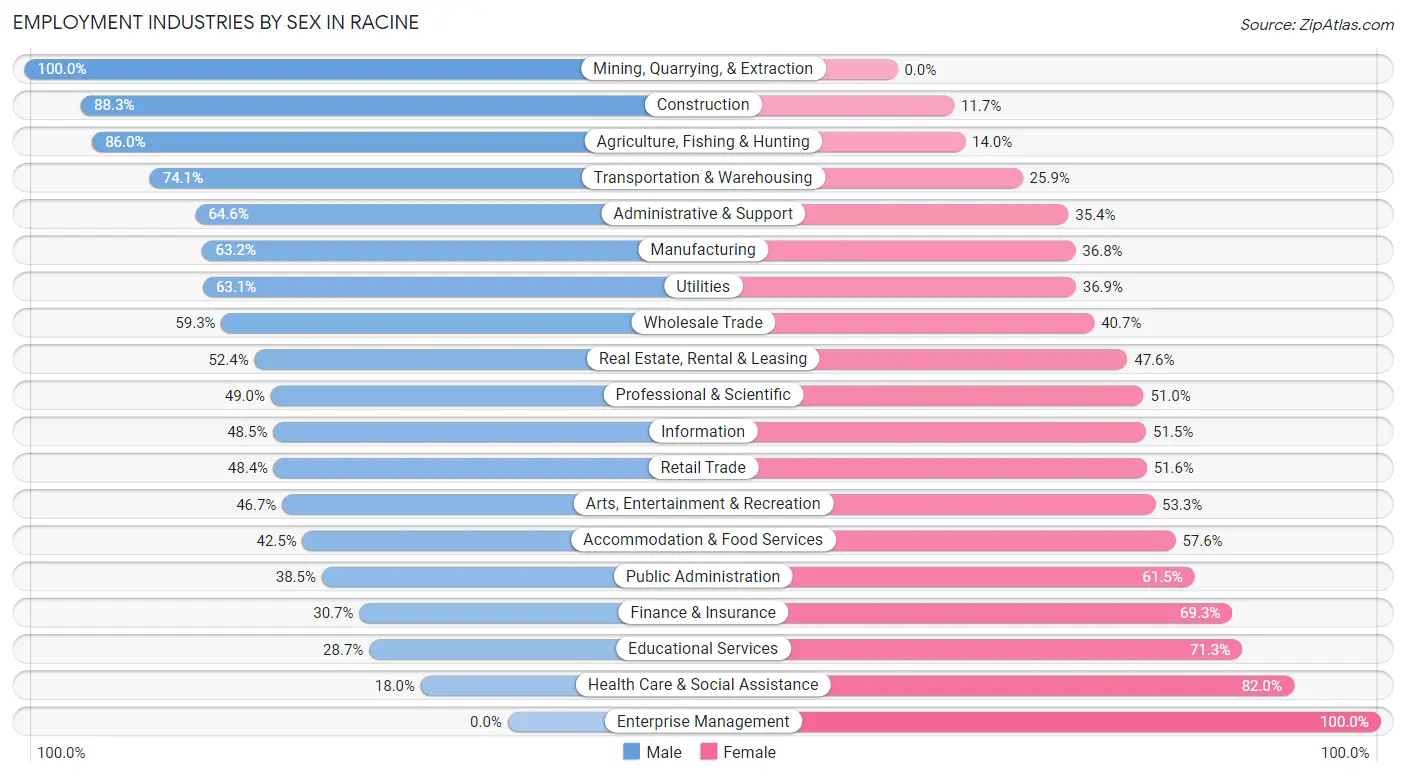
Employment Industries by Sex in Racine
The Racine industries that see more men than women are Mining, Quarrying, & Extraction (100.0%), Construction (88.3%), and Agriculture, Fishing & Hunting (86.0%), whereas the industries that tend to have a higher number of women are Enterprise Management (100.0%), Health Care & Social Assistance (82.0%), and Educational Services (71.3%).
| Industry | Male | Female |
| Agriculture, Fishing & Hunting | 264 (86.0%) | 43 (14.0%) |
| Mining, Quarrying, & Extraction | 9 (100.0%) | 0 (0.0%) |
| Construction | 1,584 (88.3%) | 210 (11.7%) |
| Manufacturing | 4,939 (63.2%) | 2,881 (36.8%) |
| Wholesale Trade | 403 (59.3%) | 277 (40.7%) |
| Retail Trade | 2,202 (48.4%) | 2,348 (51.6%) |
| Transportation & Warehousing | 1,503 (74.1%) | 526 (25.9%) |
| Utilities | 82 (63.1%) | 48 (36.9%) |
| Information | 166 (48.5%) | 176 (51.5%) |
| Finance & Insurance | 298 (30.7%) | 672 (69.3%) |
| Real Estate, Rental & Leasing | 195 (52.4%) | 177 (47.6%) |
| Professional & Scientific | 436 (49.0%) | 453 (51.0%) |
| Enterprise Management | 0 (0.0%) | 7 (100.0%) |
| Administrative & Support | 990 (64.6%) | 542 (35.4%) |
| Educational Services | 723 (28.7%) | 1,798 (71.3%) |
| Health Care & Social Assistance | 1,000 (18.0%) | 4,561 (82.0%) |
| Arts, Entertainment & Recreation | 204 (46.7%) | 233 (53.3%) |
| Accommodation & Food Services | 1,386 (42.4%) | 1,879 (57.6%) |
| Public Administration | 525 (38.5%) | 839 (61.5%) |
| Total | 17,367 (48.6%) | 18,373 (51.4%) |
Education in Racine
School Enrollment in Racine
The most common levels of schooling among the 21,133 students in Racine are high school (5,489 | 26.0%), middle school (4,946 | 23.4%), and elementary school (4,900 | 23.2%).
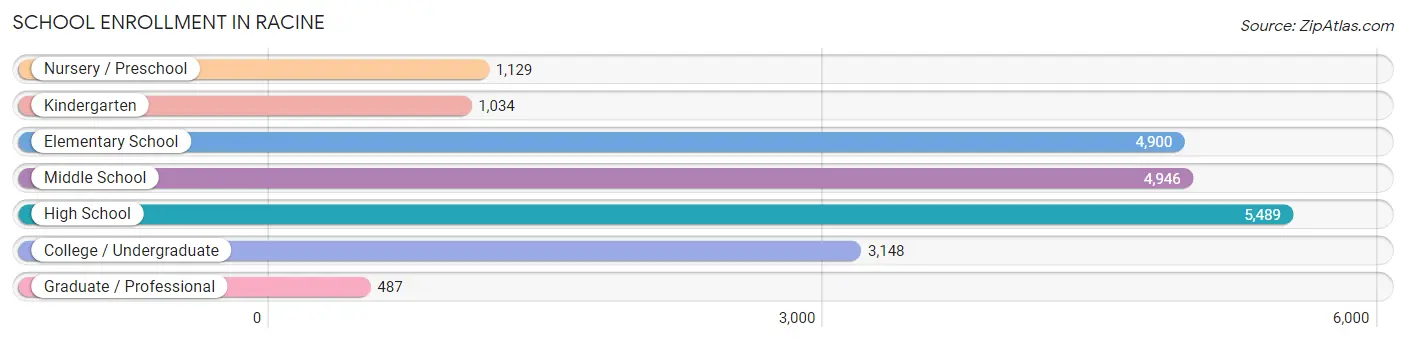
| School Level | # Students | % Students |
| Nursery / Preschool | 1,129 | 5.3% |
| Kindergarten | 1,034 | 4.9% |
| Elementary School | 4,900 | 23.2% |
| Middle School | 4,946 | 23.4% |
| High School | 5,489 | 26.0% |
| College / Undergraduate | 3,148 | 14.9% |
| Graduate / Professional | 487 | 2.3% |
| Total | 21,133 | 100.0% |
School Enrollment by Age by Funding Source in Racine
Out of a total of 21,133 students who are enrolled in schools in Racine, 3,931 (18.6%) attend a private institution, while the remaining 17,202 (81.4%) are enrolled in public schools. The age group of 3 to 4 year olds has the highest likelihood of being enrolled in private schools, with 304 (42.9% in the age bracket) enrolled. Conversely, the age group of 18 to 19 year olds has the lowest likelihood of being enrolled in a private school, with 963 (92.7% in the age bracket) attending a public institution.
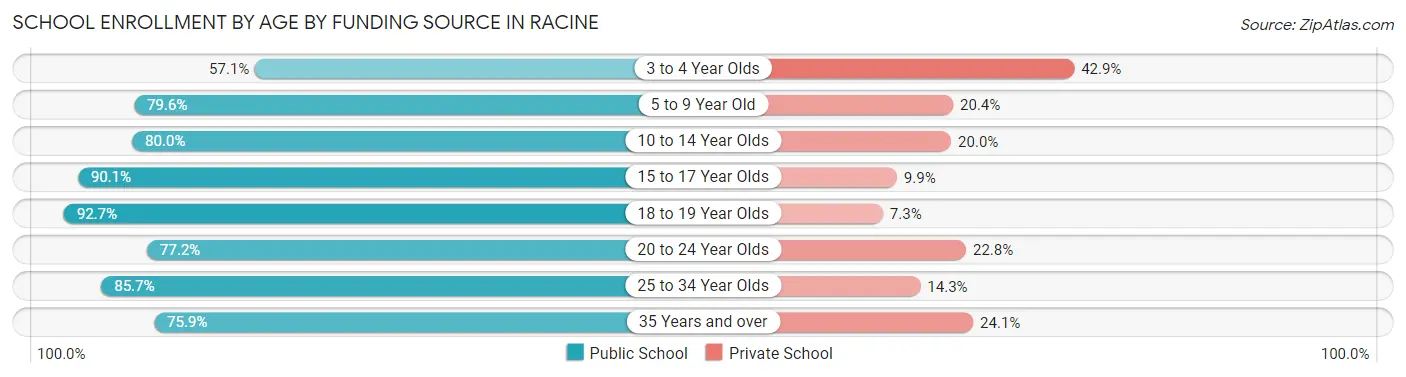
| Age Bracket | Public School | Private School |
| 3 to 4 Year Olds | 404 (57.1%) | 304 (42.9%) |
| 5 to 9 Year Old | 4,724 (79.6%) | 1,209 (20.4%) |
| 10 to 14 Year Olds | 4,923 (80.0%) | 1,232 (20.0%) |
| 15 to 17 Year Olds | 3,398 (90.1%) | 374 (9.9%) |
| 18 to 19 Year Olds | 963 (92.7%) | 76 (7.3%) |
| 20 to 24 Year Olds | 1,006 (77.2%) | 297 (22.8%) |
| 25 to 34 Year Olds | 804 (85.7%) | 134 (14.3%) |
| 35 Years and over | 975 (75.9%) | 310 (24.1%) |
| Total | 17,202 (81.4%) | 3,931 (18.6%) |
Educational Attainment by Field of Study in Racine
Business (1,932 | 16.9%), education (1,851 | 16.2%), science & technology (1,043 | 9.1%), arts & humanities (944 | 8.3%), and visual & performing arts (848 | 7.4%) are the most common fields of study among 11,439 individuals in Racine who have obtained a bachelor's degree or higher.
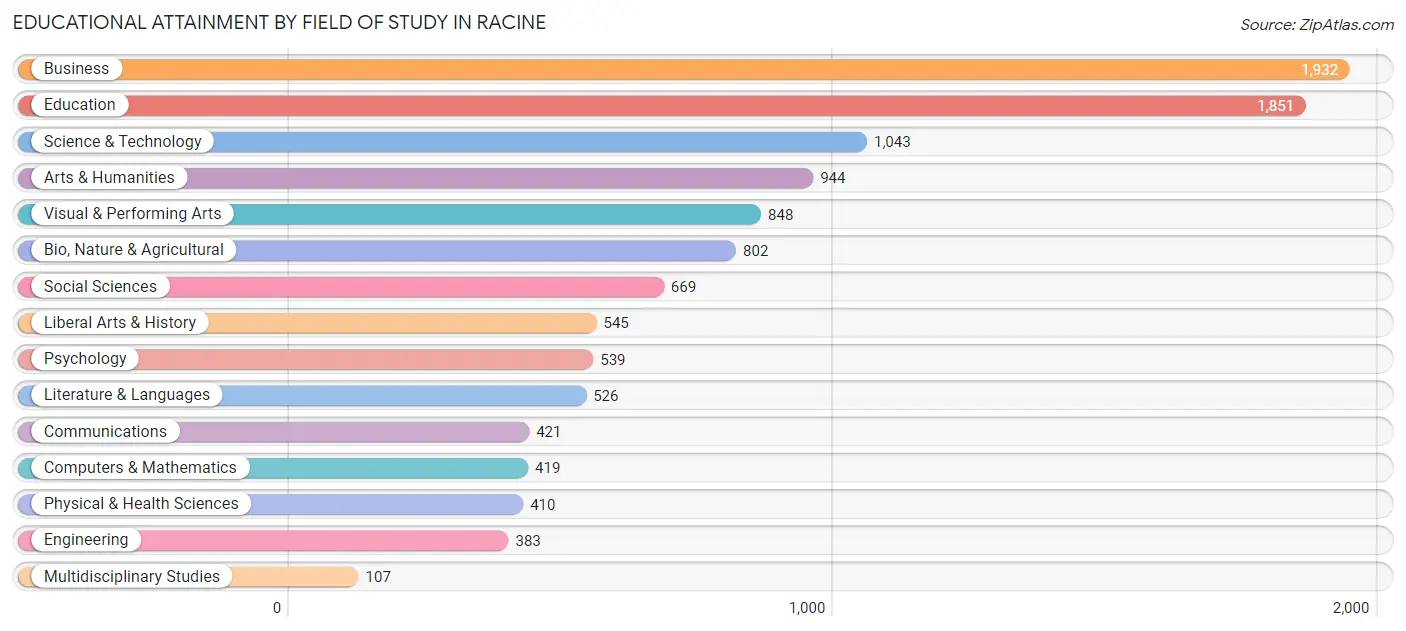
| Field of Study | # Graduates | % Graduates |
| Computers & Mathematics | 419 | 3.7% |
| Bio, Nature & Agricultural | 802 | 7.0% |
| Physical & Health Sciences | 410 | 3.6% |
| Psychology | 539 | 4.7% |
| Social Sciences | 669 | 5.9% |
| Engineering | 383 | 3.4% |
| Multidisciplinary Studies | 107 | 0.9% |
| Science & Technology | 1,043 | 9.1% |
| Business | 1,932 | 16.9% |
| Education | 1,851 | 16.2% |
| Literature & Languages | 526 | 4.6% |
| Liberal Arts & History | 545 | 4.8% |
| Visual & Performing Arts | 848 | 7.4% |
| Communications | 421 | 3.7% |
| Arts & Humanities | 944 | 8.3% |
| Total | 11,439 | 100.0% |
Transportation & Commute in Racine
Vehicle Availability by Sex in Racine
The most prevalent vehicle ownership categories in Racine are males with 2 vehicles (7,169, accounting for 42.2%) and females with 2 vehicles (7,146, making up 39.6%).
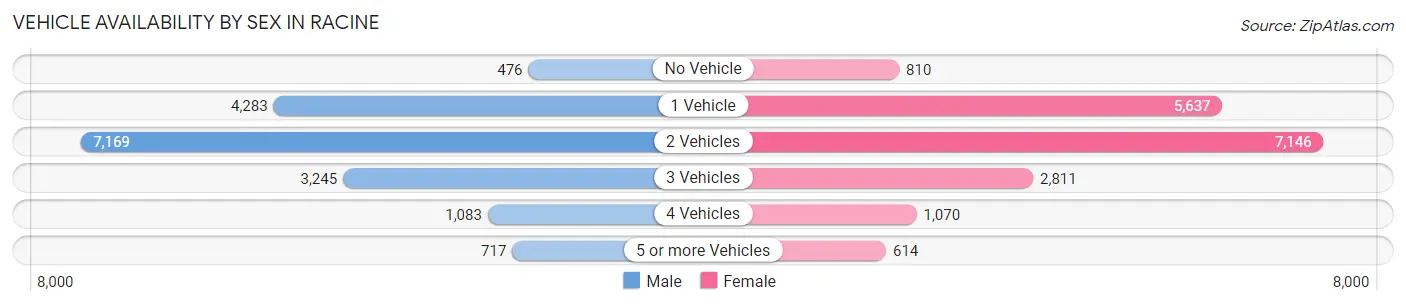
| Vehicles Available | Male | Female |
| No Vehicle | 476 (2.8%) | 810 (4.5%) |
| 1 Vehicle | 4,283 (25.2%) | 5,637 (31.2%) |
| 2 Vehicles | 7,169 (42.2%) | 7,146 (39.5%) |
| 3 Vehicles | 3,245 (19.1%) | 2,811 (15.5%) |
| 4 Vehicles | 1,083 (6.4%) | 1,070 (5.9%) |
| 5 or more Vehicles | 717 (4.2%) | 614 (3.4%) |
| Total | 16,973 (100.0%) | 18,088 (100.0%) |
Commute Time in Racine
The most frequently occuring commute durations in Racine are 10 to 14 minutes (6,219 commuters, 18.7%), 15 to 19 minutes (5,397 commuters, 16.2%), and 5 to 9 minutes (4,620 commuters, 13.9%).
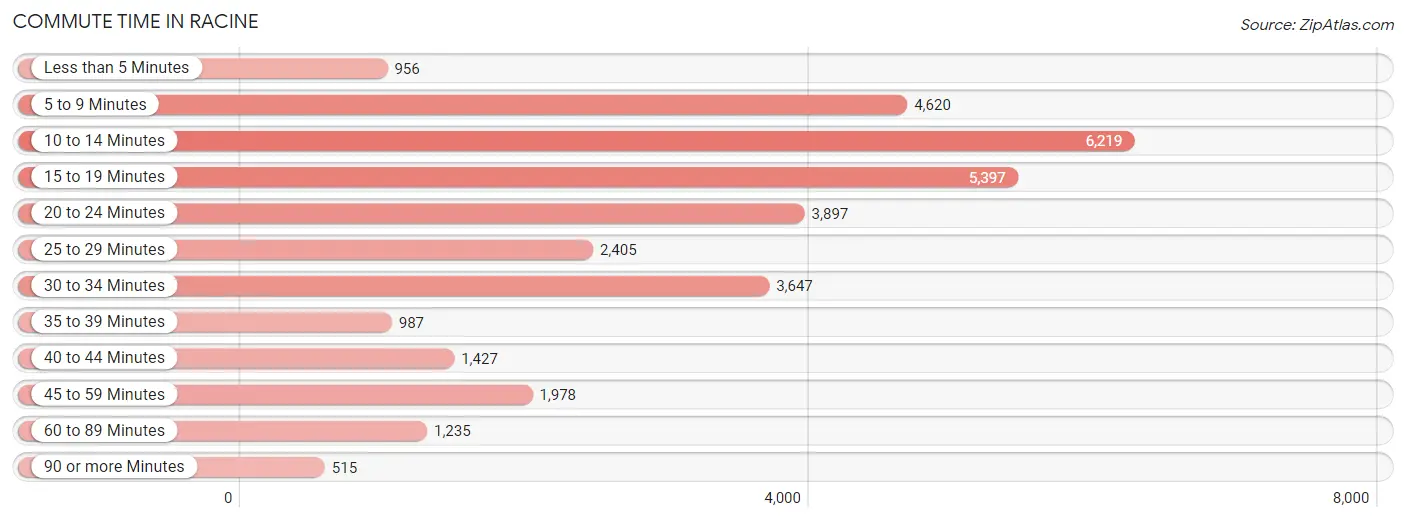
| Commute Time | # Commuters | % Commuters |
| Less than 5 Minutes | 956 | 2.9% |
| 5 to 9 Minutes | 4,620 | 13.9% |
| 10 to 14 Minutes | 6,219 | 18.7% |
| 15 to 19 Minutes | 5,397 | 16.2% |
| 20 to 24 Minutes | 3,897 | 11.7% |
| 25 to 29 Minutes | 2,405 | 7.2% |
| 30 to 34 Minutes | 3,647 | 11.0% |
| 35 to 39 Minutes | 987 | 3.0% |
| 40 to 44 Minutes | 1,427 | 4.3% |
| 45 to 59 Minutes | 1,978 | 5.9% |
| 60 to 89 Minutes | 1,235 | 3.7% |
| 90 or more Minutes | 515 | 1.5% |
Commute Time by Sex in Racine
The most common commute times in Racine are 15 to 19 minutes (2,867 commuters, 17.7%) for males and 10 to 14 minutes (3,644 commuters, 21.3%) for females.
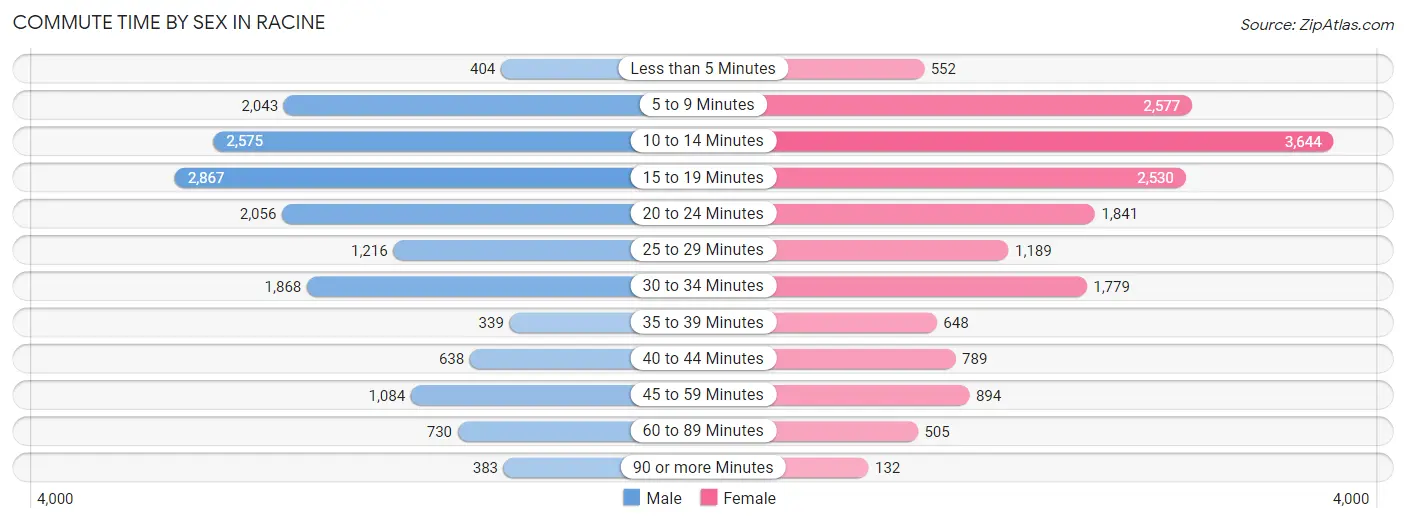
| Commute Time | Male | Female |
| Less than 5 Minutes | 404 (2.5%) | 552 (3.2%) |
| 5 to 9 Minutes | 2,043 (12.6%) | 2,577 (15.1%) |
| 10 to 14 Minutes | 2,575 (15.9%) | 3,644 (21.3%) |
| 15 to 19 Minutes | 2,867 (17.7%) | 2,530 (14.8%) |
| 20 to 24 Minutes | 2,056 (12.7%) | 1,841 (10.8%) |
| 25 to 29 Minutes | 1,216 (7.5%) | 1,189 (7.0%) |
| 30 to 34 Minutes | 1,868 (11.5%) | 1,779 (10.4%) |
| 35 to 39 Minutes | 339 (2.1%) | 648 (3.8%) |
| 40 to 44 Minutes | 638 (3.9%) | 789 (4.6%) |
| 45 to 59 Minutes | 1,084 (6.7%) | 894 (5.2%) |
| 60 to 89 Minutes | 730 (4.5%) | 505 (3.0%) |
| 90 or more Minutes | 383 (2.4%) | 132 (0.8%) |
Time of Departure to Work by Sex in Racine
The most frequent times of departure to work in Racine are 7:00 AM to 7:29 AM (2,296, 14.2%) for males and 6:30 AM to 6:59 AM (2,149, 12.6%) for females.
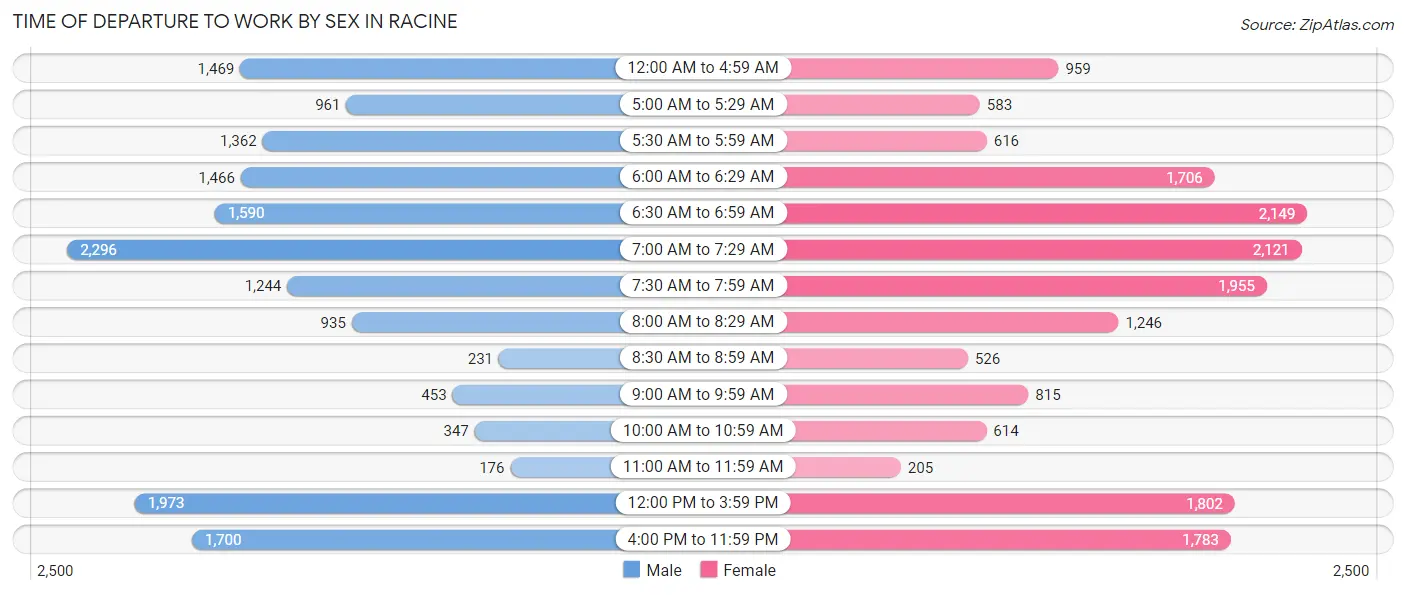
| Time of Departure | Male | Female |
| 12:00 AM to 4:59 AM | 1,469 (9.1%) | 959 (5.6%) |
| 5:00 AM to 5:29 AM | 961 (5.9%) | 583 (3.4%) |
| 5:30 AM to 5:59 AM | 1,362 (8.4%) | 616 (3.6%) |
| 6:00 AM to 6:29 AM | 1,466 (9.0%) | 1,706 (10.0%) |
| 6:30 AM to 6:59 AM | 1,590 (9.8%) | 2,149 (12.6%) |
| 7:00 AM to 7:29 AM | 2,296 (14.2%) | 2,121 (12.4%) |
| 7:30 AM to 7:59 AM | 1,244 (7.7%) | 1,955 (11.5%) |
| 8:00 AM to 8:29 AM | 935 (5.8%) | 1,246 (7.3%) |
| 8:30 AM to 8:59 AM | 231 (1.4%) | 526 (3.1%) |
| 9:00 AM to 9:59 AM | 453 (2.8%) | 815 (4.8%) |
| 10:00 AM to 10:59 AM | 347 (2.1%) | 614 (3.6%) |
| 11:00 AM to 11:59 AM | 176 (1.1%) | 205 (1.2%) |
| 12:00 PM to 3:59 PM | 1,973 (12.2%) | 1,802 (10.5%) |
| 4:00 PM to 11:59 PM | 1,700 (10.5%) | 1,783 (10.4%) |
| Total | 16,203 (100.0%) | 17,080 (100.0%) |
Housing Occupancy in Racine
Occupancy by Ownership in Racine
Of the total 31,282 dwellings in Racine, owner-occupied units account for 18,119 (57.9%), while renter-occupied units make up 13,163 (42.1%).
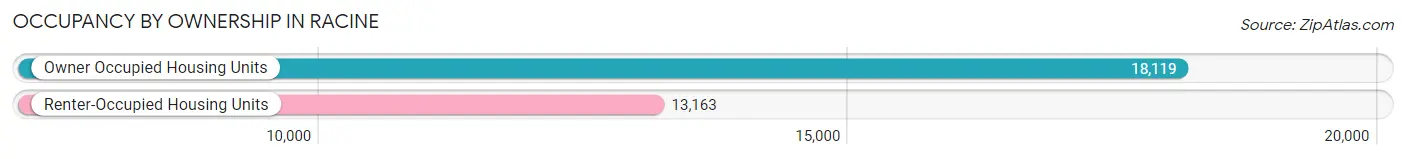
| Occupancy | # Housing Units | % Housing Units |
| Owner Occupied Housing Units | 18,119 | 57.9% |
| Renter-Occupied Housing Units | 13,163 | 42.1% |
| Total Occupied Housing Units | 31,282 | 100.0% |
Occupancy by Household Size in Racine
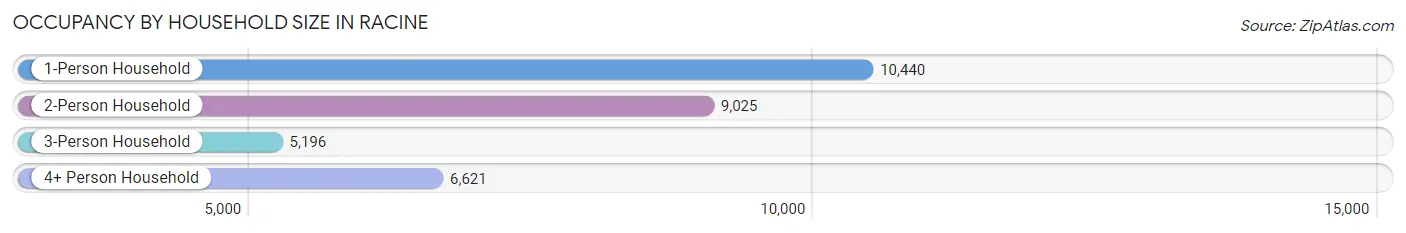
| Household Size | # Housing Units | % Housing Units |
| 1-Person Household | 10,440 | 33.4% |
| 2-Person Household | 9,025 | 28.8% |
| 3-Person Household | 5,196 | 16.6% |
| 4+ Person Household | 6,621 | 21.2% |
| Total Housing Units | 31,282 | 100.0% |
Occupancy by Ownership by Household Size in Racine
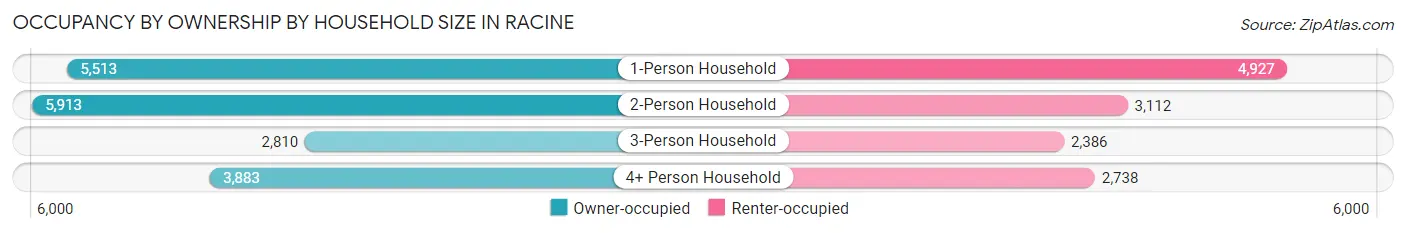
| Household Size | Owner-occupied | Renter-occupied |
| 1-Person Household | 5,513 (52.8%) | 4,927 (47.2%) |
| 2-Person Household | 5,913 (65.5%) | 3,112 (34.5%) |
| 3-Person Household | 2,810 (54.1%) | 2,386 (45.9%) |
| 4+ Person Household | 3,883 (58.7%) | 2,738 (41.3%) |
| Total Housing Units | 18,119 (57.9%) | 13,163 (42.1%) |
Occupancy by Educational Attainment in Racine
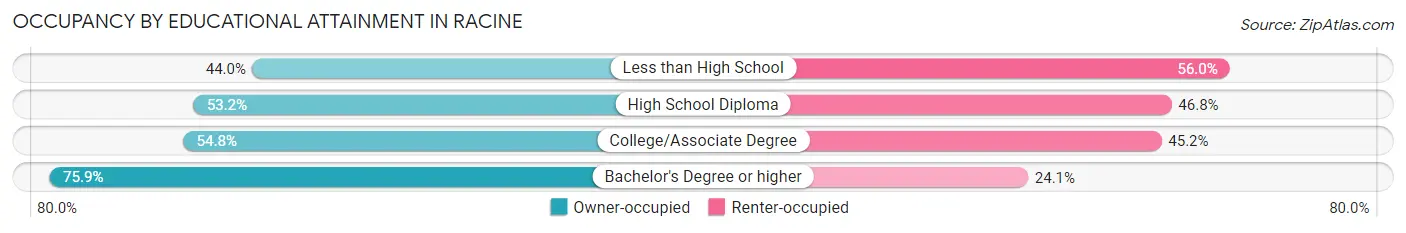
| Household Size | Owner-occupied | Renter-occupied |
| Less than High School | 1,562 (44.0%) | 1,991 (56.0%) |
| High School Diploma | 4,783 (53.2%) | 4,212 (46.8%) |
| College/Associate Degree | 6,343 (54.8%) | 5,239 (45.2%) |
| Bachelor's Degree or higher | 5,431 (75.9%) | 1,721 (24.1%) |
Occupancy by Age of Householder in Racine
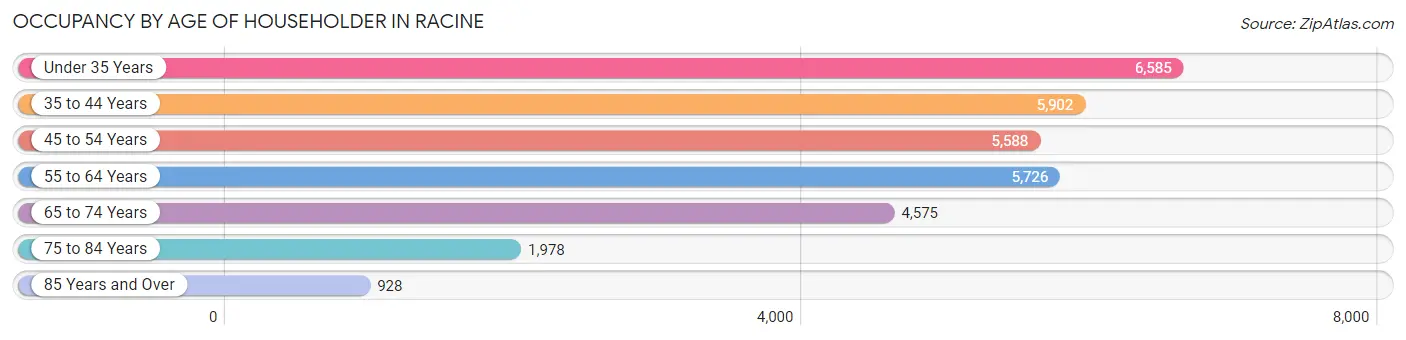
| Age Bracket | # Households | % Households |
| Under 35 Years | 6,585 | 21.0% |
| 35 to 44 Years | 5,902 | 18.9% |
| 45 to 54 Years | 5,588 | 17.9% |
| 55 to 64 Years | 5,726 | 18.3% |
| 65 to 74 Years | 4,575 | 14.6% |
| 75 to 84 Years | 1,978 | 6.3% |
| 85 Years and Over | 928 | 3.0% |
| Total | 31,282 | 100.0% |
Housing Finances in Racine
Median Income by Occupancy in Racine
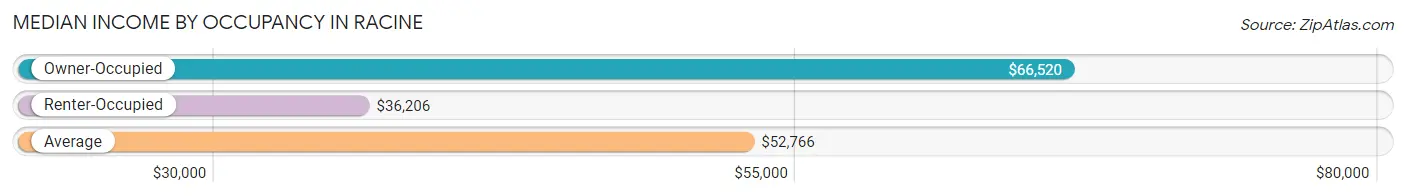
| Occupancy Type | # Households | Median Income |
| Owner-Occupied | 18,119 (57.9%) | $66,520 |
| Renter-Occupied | 13,163 (42.1%) | $36,206 |
| Average | 31,282 (100.0%) | $52,766 |
Occupancy by Householder Income Bracket in Racine
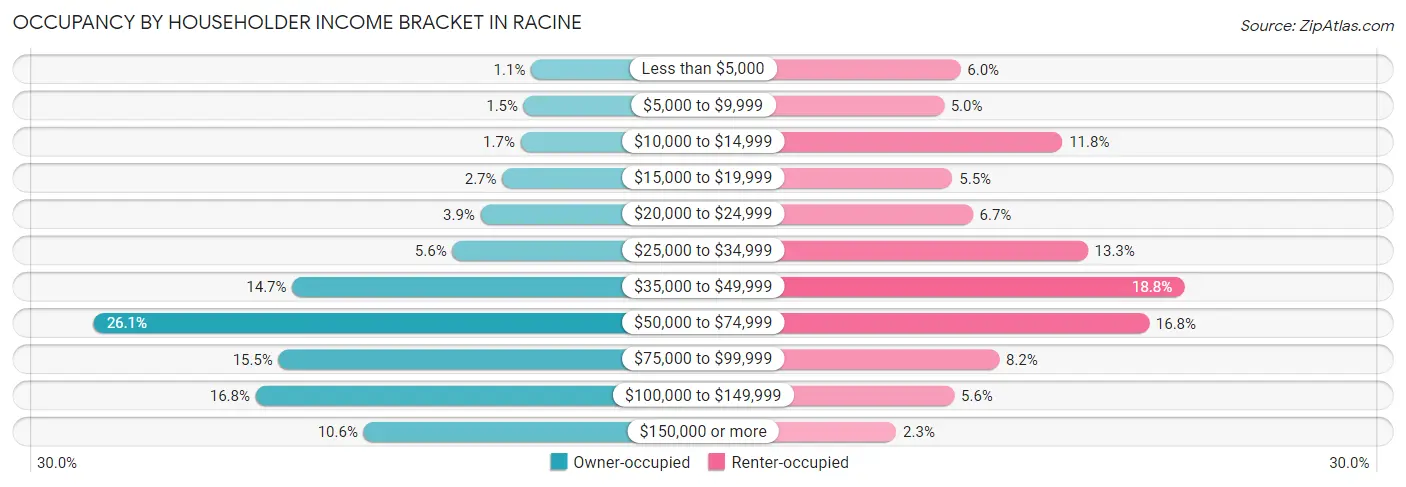
| Income Bracket | Owner-occupied | Renter-occupied |
| Less than $5,000 | 190 (1.1%) | 788 (6.0%) |
| $5,000 to $9,999 | 266 (1.5%) | 664 (5.0%) |
| $10,000 to $14,999 | 299 (1.7%) | 1,554 (11.8%) |
| $15,000 to $19,999 | 490 (2.7%) | 728 (5.5%) |
| $20,000 to $24,999 | 714 (3.9%) | 881 (6.7%) |
| $25,000 to $34,999 | 1,006 (5.6%) | 1,745 (13.3%) |
| $35,000 to $49,999 | 2,663 (14.7%) | 2,471 (18.8%) |
| $50,000 to $74,999 | 4,720 (26.1%) | 2,206 (16.8%) |
| $75,000 to $99,999 | 2,804 (15.5%) | 1,079 (8.2%) |
| $100,000 to $149,999 | 3,042 (16.8%) | 741 (5.6%) |
| $150,000 or more | 1,925 (10.6%) | 306 (2.3%) |
| Total | 18,119 (100.0%) | 13,163 (100.0%) |
Monthly Housing Cost Tiers in Racine
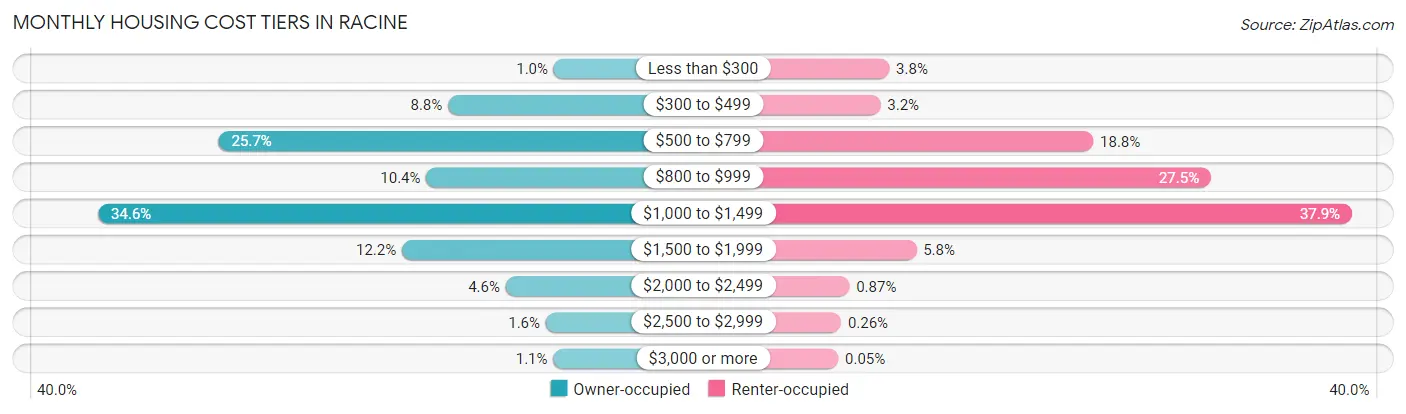
| Monthly Cost | Owner-occupied | Renter-occupied |
| Less than $300 | 184 (1.0%) | 502 (3.8%) |
| $300 to $499 | 1,597 (8.8%) | 416 (3.2%) |
| $500 to $799 | 4,661 (25.7%) | 2,479 (18.8%) |
| $800 to $999 | 1,887 (10.4%) | 3,621 (27.5%) |
| $1,000 to $1,499 | 6,270 (34.6%) | 4,987 (37.9%) |
| $1,500 to $1,999 | 2,210 (12.2%) | 763 (5.8%) |
| $2,000 to $2,499 | 826 (4.6%) | 115 (0.9%) |
| $2,500 to $2,999 | 292 (1.6%) | 34 (0.3%) |
| $3,000 or more | 192 (1.1%) | 7 (0.1%) |
| Total | 18,119 (100.0%) | 13,163 (100.0%) |
Physical Housing Characteristics in Racine
Housing Structures in Racine
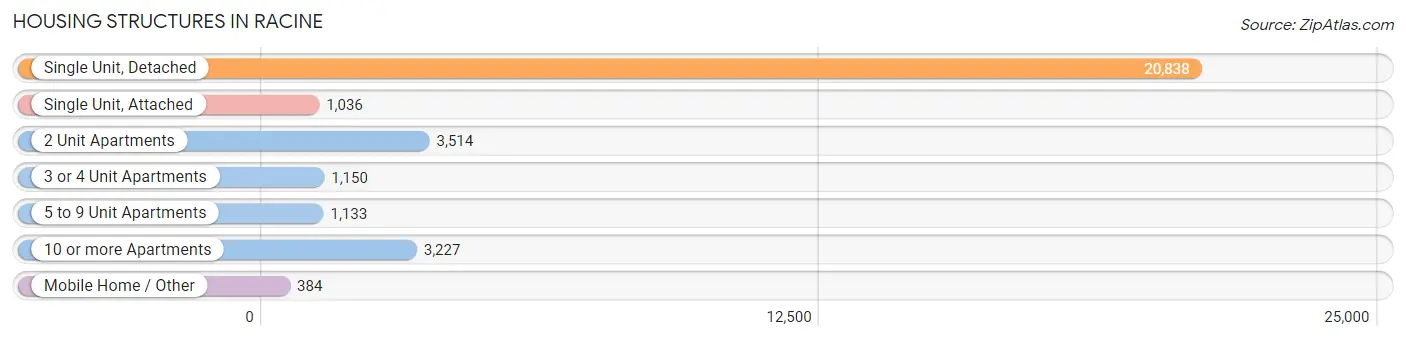
| Structure Type | # Housing Units | % Housing Units |
| Single Unit, Detached | 20,838 | 66.6% |
| Single Unit, Attached | 1,036 | 3.3% |
| 2 Unit Apartments | 3,514 | 11.2% |
| 3 or 4 Unit Apartments | 1,150 | 3.7% |
| 5 to 9 Unit Apartments | 1,133 | 3.6% |
| 10 or more Apartments | 3,227 | 10.3% |
| Mobile Home / Other | 384 | 1.2% |
| Total | 31,282 | 100.0% |
Housing Structures by Occupancy in Racine
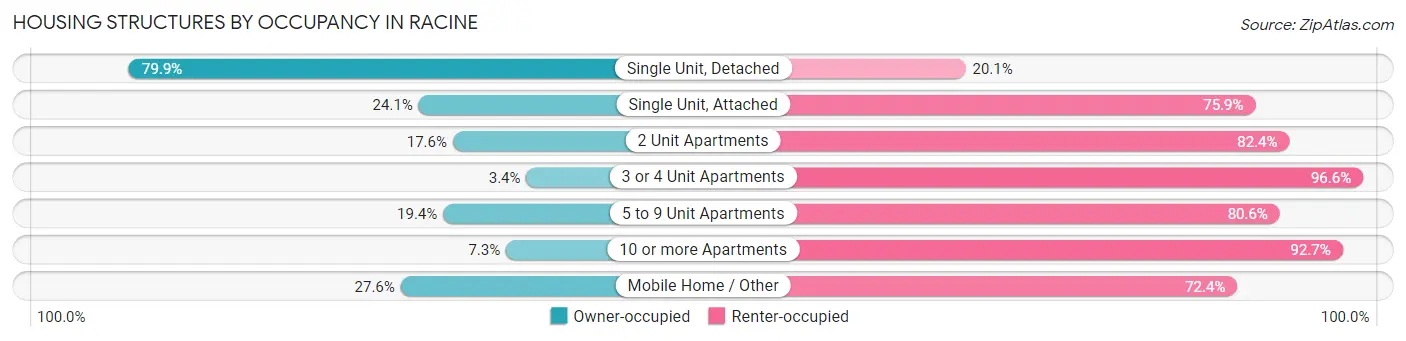
| Structure Type | Owner-occupied | Renter-occupied |
| Single Unit, Detached | 16,651 (79.9%) | 4,187 (20.1%) |
| Single Unit, Attached | 250 (24.1%) | 786 (75.9%) |
| 2 Unit Apartments | 617 (17.6%) | 2,897 (82.4%) |
| 3 or 4 Unit Apartments | 39 (3.4%) | 1,111 (96.6%) |
| 5 to 9 Unit Apartments | 220 (19.4%) | 913 (80.6%) |
| 10 or more Apartments | 236 (7.3%) | 2,991 (92.7%) |
| Mobile Home / Other | 106 (27.6%) | 278 (72.4%) |
| Total | 18,119 (57.9%) | 13,163 (42.1%) |
Housing Structures by Number of Rooms in Racine
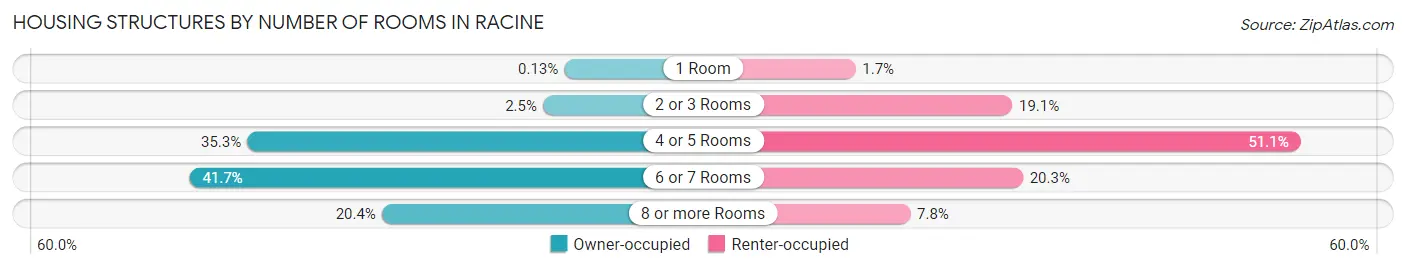
| Number of Rooms | Owner-occupied | Renter-occupied |
| 1 Room | 24 (0.1%) | 225 (1.7%) |
| 2 or 3 Rooms | 452 (2.5%) | 2,514 (19.1%) |
| 4 or 5 Rooms | 6,397 (35.3%) | 6,728 (51.1%) |
| 6 or 7 Rooms | 7,556 (41.7%) | 2,671 (20.3%) |
| 8 or more Rooms | 3,690 (20.4%) | 1,025 (7.8%) |
| Total | 18,119 (100.0%) | 13,163 (100.0%) |
Housing Structure by Heating Type in Racine
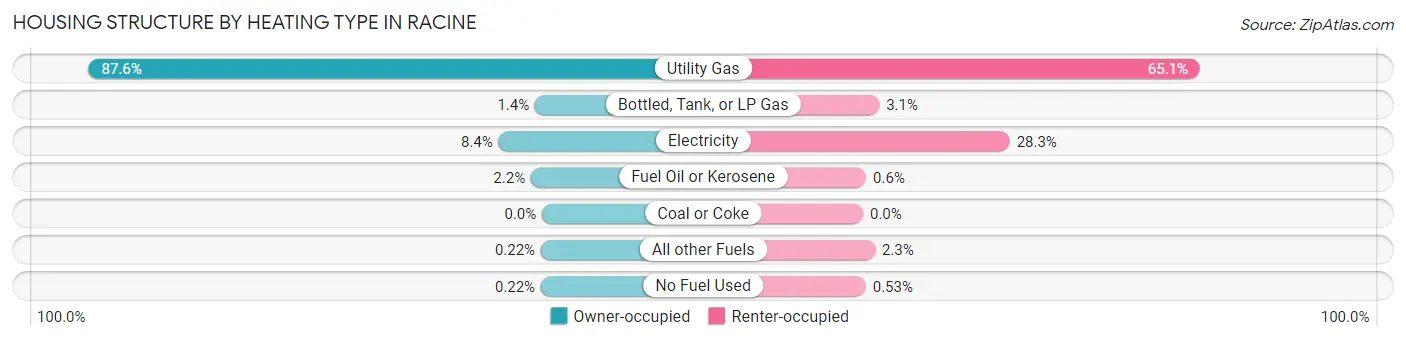
| Heating Type | Owner-occupied | Renter-occupied |
| Utility Gas | 15,880 (87.6%) | 8,568 (65.1%) |
| Bottled, Tank, or LP Gas | 248 (1.4%) | 412 (3.1%) |
| Electricity | 1,522 (8.4%) | 3,730 (28.3%) |
| Fuel Oil or Kerosene | 389 (2.1%) | 79 (0.6%) |
| Coal or Coke | 0 (0.0%) | 0 (0.0%) |
| All other Fuels | 40 (0.2%) | 304 (2.3%) |
| No Fuel Used | 40 (0.2%) | 70 (0.5%) |
| Total | 18,119 (100.0%) | 13,163 (100.0%) |
Household Vehicle Usage in Racine
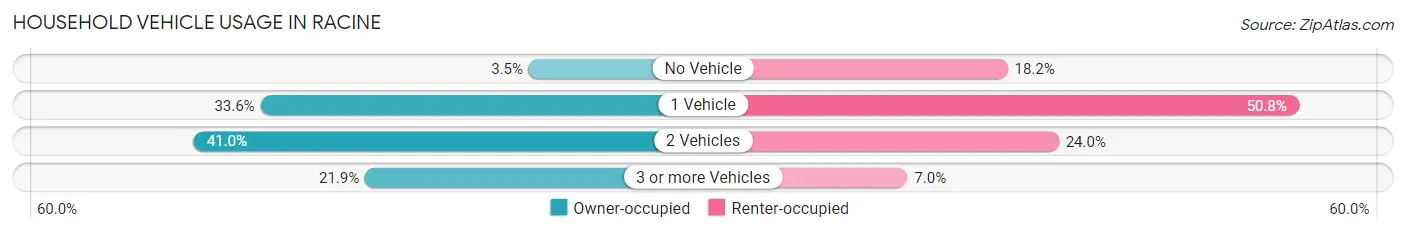
| Vehicles per Household | Owner-occupied | Renter-occupied |
| No Vehicle | 637 (3.5%) | 2,398 (18.2%) |
| 1 Vehicle | 6,085 (33.6%) | 6,691 (50.8%) |
| 2 Vehicles | 7,436 (41.0%) | 3,152 (23.9%) |
| 3 or more Vehicles | 3,961 (21.9%) | 922 (7.0%) |
| Total | 18,119 (100.0%) | 13,163 (100.0%) |
Real Estate & Mortgages in Racine
Real Estate and Mortgage Overview in Racine
| Characteristic | Without Mortgage | With Mortgage |
| Housing Units | 6,383 | 11,736 |
| Median Property Value | $139,900 | $150,900 |
| Median Household Income | $59,688 | $1,343 |
| Monthly Housing Costs | $588 | $177 |
| Real Estate Taxes | $3,445 | $37 |
Property Value by Mortgage Status in Racine
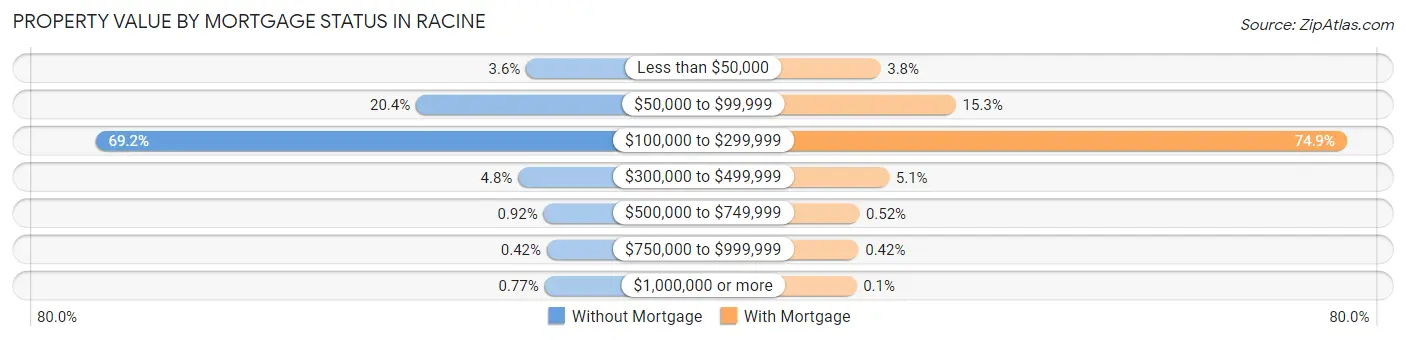
| Property Value | Without Mortgage | With Mortgage |
| Less than $50,000 | 228 (3.6%) | 443 (3.8%) |
| $50,000 to $99,999 | 1,299 (20.3%) | 1,790 (15.2%) |
| $100,000 to $299,999 | 4,415 (69.2%) | 8,785 (74.9%) |
| $300,000 to $499,999 | 306 (4.8%) | 596 (5.1%) |
| $500,000 to $749,999 | 59 (0.9%) | 61 (0.5%) |
| $750,000 to $999,999 | 27 (0.4%) | 49 (0.4%) |
| $1,000,000 or more | 49 (0.8%) | 12 (0.1%) |
| Total | 6,383 (100.0%) | 11,736 (100.0%) |
Household Income by Mortgage Status in Racine
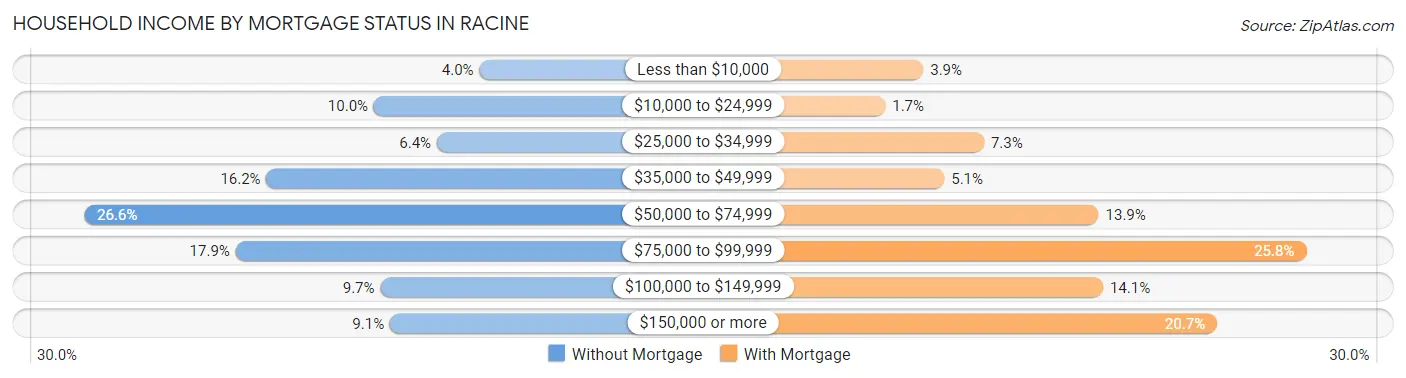
| Household Income | Without Mortgage | With Mortgage |
| Less than $10,000 | 256 (4.0%) | 454 (3.9%) |
| $10,000 to $24,999 | 641 (10.0%) | 200 (1.7%) |
| $25,000 to $34,999 | 411 (6.4%) | 862 (7.3%) |
| $35,000 to $49,999 | 1,033 (16.2%) | 595 (5.1%) |
| $50,000 to $74,999 | 1,698 (26.6%) | 1,630 (13.9%) |
| $75,000 to $99,999 | 1,145 (17.9%) | 3,022 (25.8%) |
| $100,000 to $149,999 | 617 (9.7%) | 1,659 (14.1%) |
| $150,000 or more | 582 (9.1%) | 2,425 (20.7%) |
| Total | 6,383 (100.0%) | 11,736 (100.0%) |
Property Value to Household Income Ratio in Racine
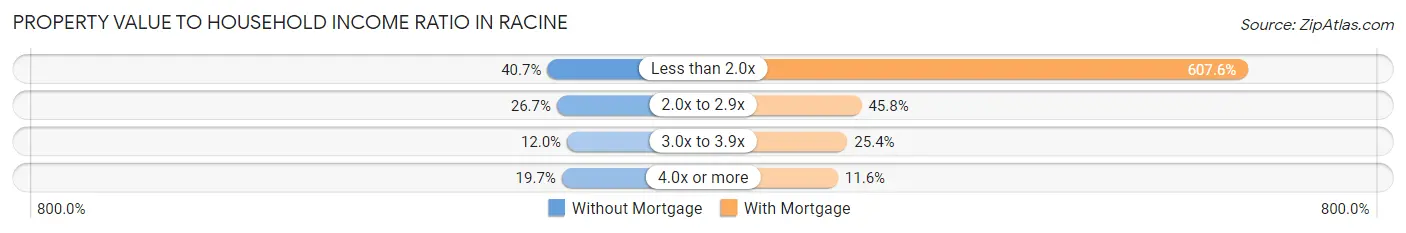
| Value-to-Income Ratio | Without Mortgage | With Mortgage |
| Less than 2.0x | 2,595 (40.6%) | 71,311 (607.6%) |
| 2.0x to 2.9x | 1,707 (26.7%) | 5,380 (45.8%) |
| 3.0x to 3.9x | 767 (12.0%) | 2,983 (25.4%) |
| 4.0x or more | 1,258 (19.7%) | 1,362 (11.6%) |
| Total | 6,383 (100.0%) | 11,736 (100.0%) |
Real Estate Taxes by Mortgage Status in Racine
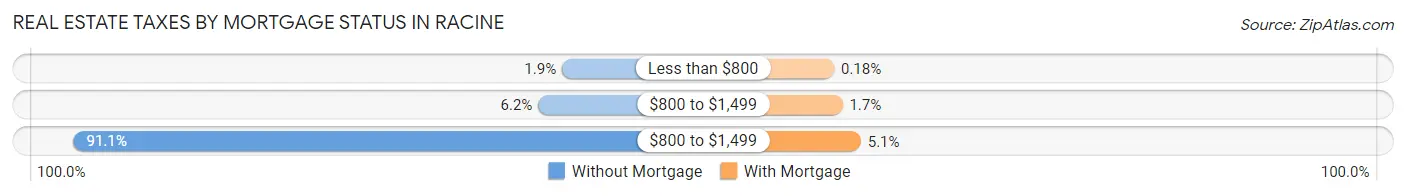
| Property Taxes | Without Mortgage | With Mortgage |
| Less than $800 | 118 (1.8%) | 21 (0.2%) |
| $800 to $1,499 | 396 (6.2%) | 202 (1.7%) |
| $800 to $1,499 | 5,812 (91.0%) | 595 (5.1%) |
| Total | 6,383 (100.0%) | 11,736 (100.0%) |
Health & Disability in Racine
Health Insurance Coverage by Age in Racine
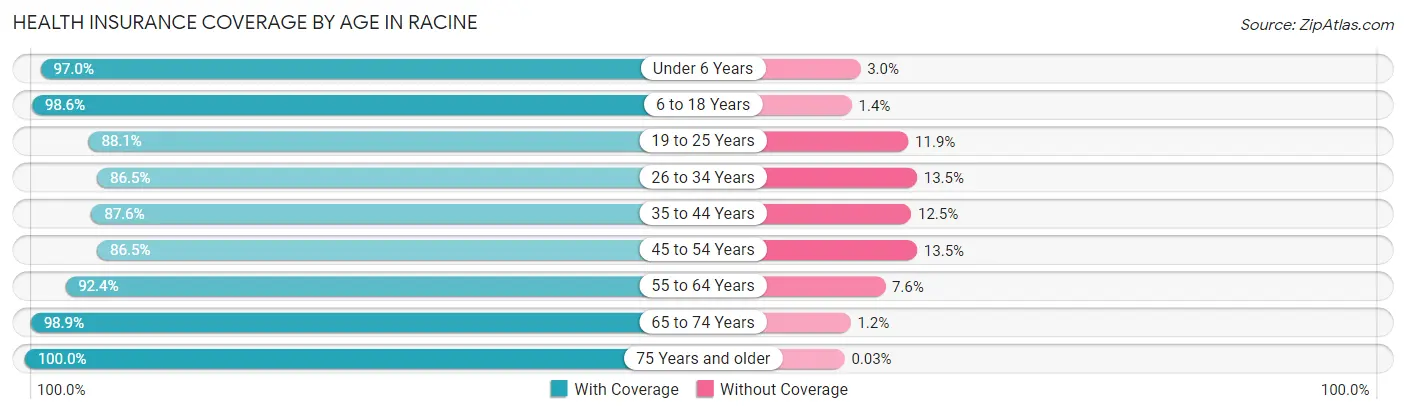
| Age Bracket | With Coverage | Without Coverage |
| Under 6 Years | 5,840 (97.0%) | 179 (3.0%) |
| 6 to 18 Years | 16,050 (98.6%) | 222 (1.4%) |
| 19 to 25 Years | 5,527 (88.1%) | 747 (11.9%) |
| 26 to 34 Years | 8,348 (86.5%) | 1,305 (13.5%) |
| 35 to 44 Years | 8,515 (87.5%) | 1,211 (12.4%) |
| 45 to 54 Years | 7,961 (86.5%) | 1,247 (13.5%) |
| 55 to 64 Years | 8,444 (92.4%) | 693 (7.6%) |
| 65 to 74 Years | 6,100 (98.9%) | 71 (1.1%) |
| 75 Years and older | 3,966 (100.0%) | 1 (0.0%) |
| Total | 70,751 (92.6%) | 5,676 (7.4%) |
Health Insurance Coverage by Citizenship Status in Racine
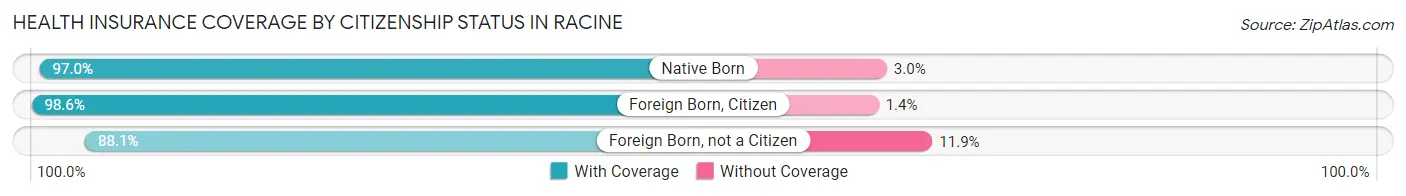
| Citizenship Status | With Coverage | Without Coverage |
| Native Born | 5,840 (97.0%) | 179 (3.0%) |
| Foreign Born, Citizen | 16,050 (98.6%) | 222 (1.4%) |
| Foreign Born, not a Citizen | 5,527 (88.1%) | 747 (11.9%) |
Health Insurance Coverage by Household Income in Racine
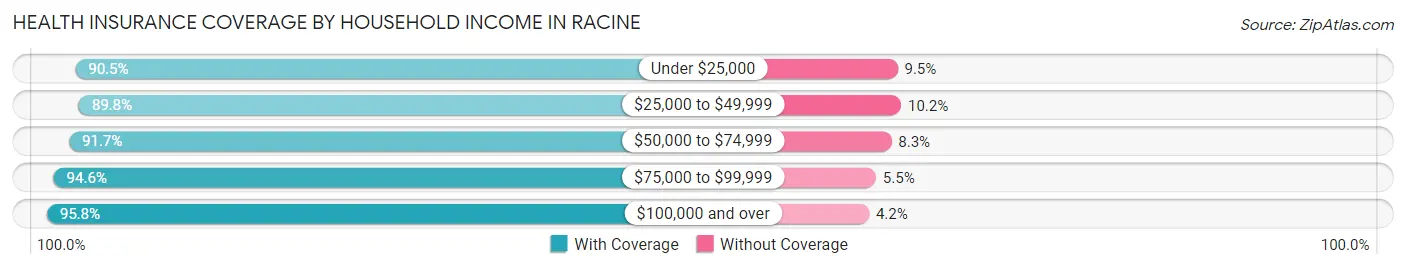
| Household Income | With Coverage | Without Coverage |
| Under $25,000 | 11,690 (90.5%) | 1,228 (9.5%) |
| $25,000 to $49,999 | 14,592 (89.8%) | 1,651 (10.2%) |
| $50,000 to $74,999 | 15,559 (91.7%) | 1,415 (8.3%) |
| $75,000 to $99,999 | 9,667 (94.6%) | 557 (5.4%) |
| $100,000 and over | 18,920 (95.8%) | 821 (4.2%) |
Public vs Private Health Insurance Coverage by Age in Racine
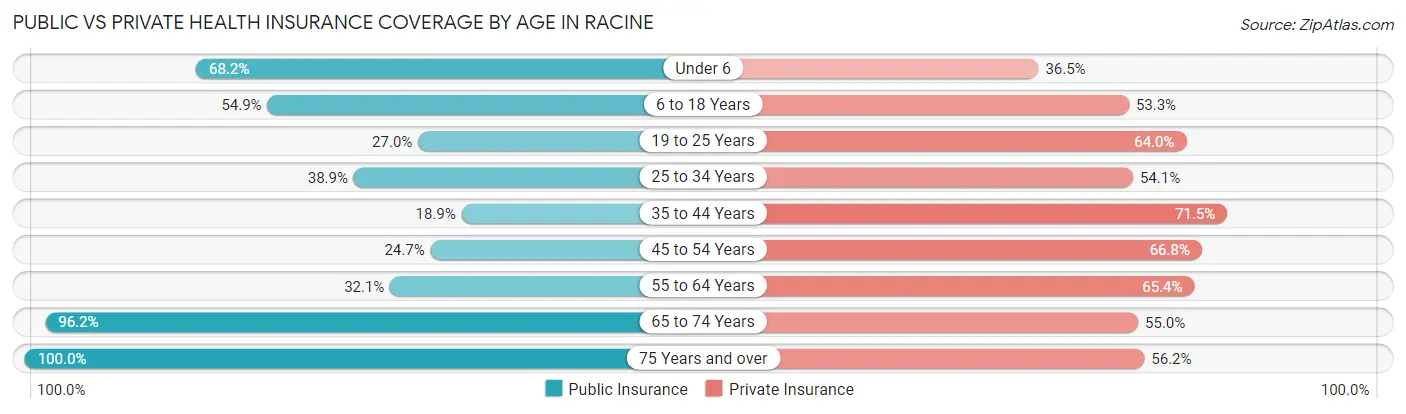
| Age Bracket | Public Insurance | Private Insurance |
| Under 6 | 4,103 (68.2%) | 2,197 (36.5%) |
| 6 to 18 Years | 8,936 (54.9%) | 8,673 (53.3%) |
| 19 to 25 Years | 1,691 (27.0%) | 4,012 (63.9%) |
| 25 to 34 Years | 3,754 (38.9%) | 5,217 (54.0%) |
| 35 to 44 Years | 1,838 (18.9%) | 6,957 (71.5%) |
| 45 to 54 Years | 2,271 (24.7%) | 6,151 (66.8%) |
| 55 to 64 Years | 2,937 (32.1%) | 5,979 (65.4%) |
| 65 to 74 Years | 5,934 (96.2%) | 3,394 (55.0%) |
| 75 Years and over | 3,966 (100.0%) | 2,228 (56.2%) |
| Total | 35,430 (46.4%) | 44,808 (58.6%) |
Disability Status by Sex by Age in Racine
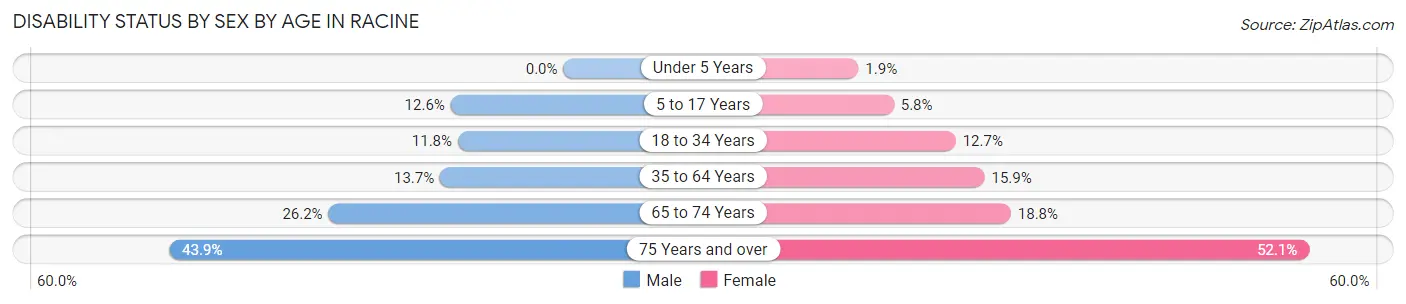
| Age Bracket | Male | Female |
| Under 5 Years | 0 (0.0%) | 42 (1.8%) |
| 5 to 17 Years | 1,047 (12.6%) | 462 (5.8%) |
| 18 to 34 Years | 949 (11.7%) | 1,160 (12.7%) |
| 35 to 64 Years | 1,851 (13.7%) | 2,320 (15.9%) |
| 65 to 74 Years | 721 (26.2%) | 643 (18.8%) |
| 75 Years and over | 608 (43.9%) | 1,344 (52.0%) |
Disability Class by Sex by Age in Racine
Disability Class: Hearing Difficulty
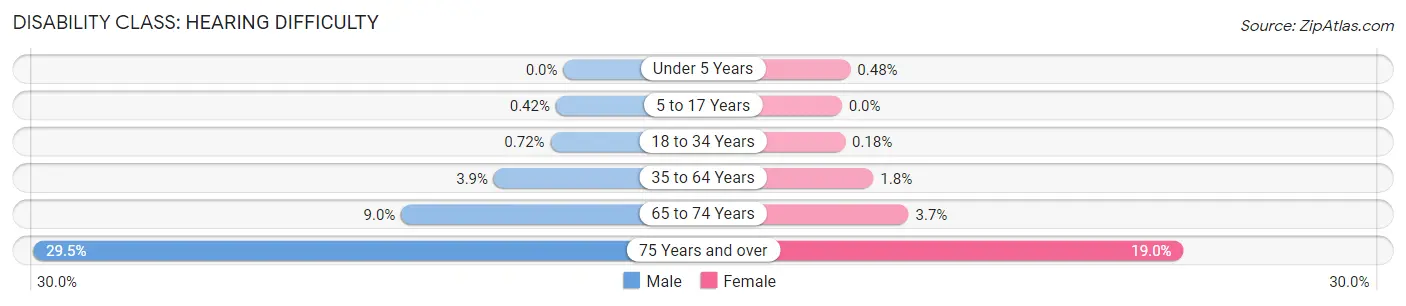
| Age Bracket | Male | Female |
| Under 5 Years | 0 (0.0%) | 11 (0.5%) |
| 5 to 17 Years | 35 (0.4%) | 0 (0.0%) |
| 18 to 34 Years | 58 (0.7%) | 16 (0.2%) |
| 35 to 64 Years | 522 (3.9%) | 257 (1.8%) |
| 65 to 74 Years | 249 (9.0%) | 127 (3.7%) |
| 75 Years and over | 409 (29.5%) | 491 (19.0%) |
Disability Class: Vision Difficulty

| Age Bracket | Male | Female |
| Under 5 Years | 0 (0.0%) | 42 (1.8%) |
| 5 to 17 Years | 25 (0.3%) | 56 (0.7%) |
| 18 to 34 Years | 138 (1.7%) | 84 (0.9%) |
| 35 to 64 Years | 262 (1.9%) | 455 (3.1%) |
| 65 to 74 Years | 88 (3.2%) | 75 (2.2%) |
| 75 Years and over | 56 (4.0%) | 115 (4.4%) |
Disability Class: Cognitive Difficulty
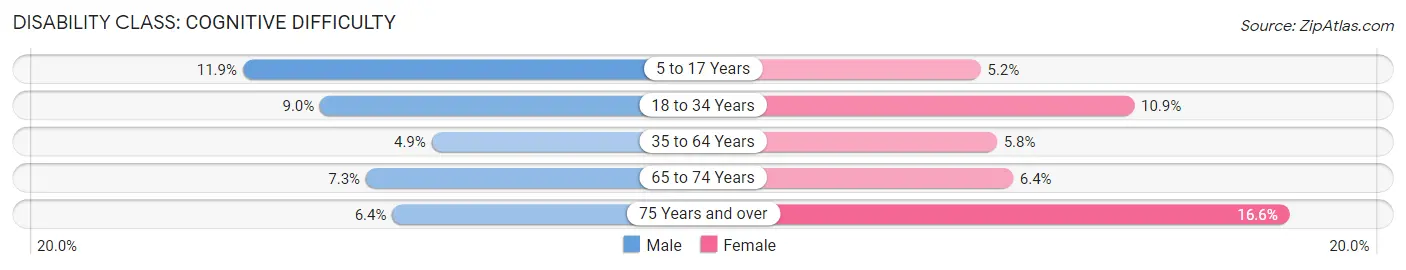
| Age Bracket | Male | Female |
| 5 to 17 Years | 993 (11.9%) | 411 (5.1%) |
| 18 to 34 Years | 729 (9.0%) | 992 (10.8%) |
| 35 to 64 Years | 659 (4.9%) | 839 (5.8%) |
| 65 to 74 Years | 202 (7.3%) | 217 (6.4%) |
| 75 Years and over | 88 (6.4%) | 429 (16.6%) |
Disability Class: Ambulatory Difficulty
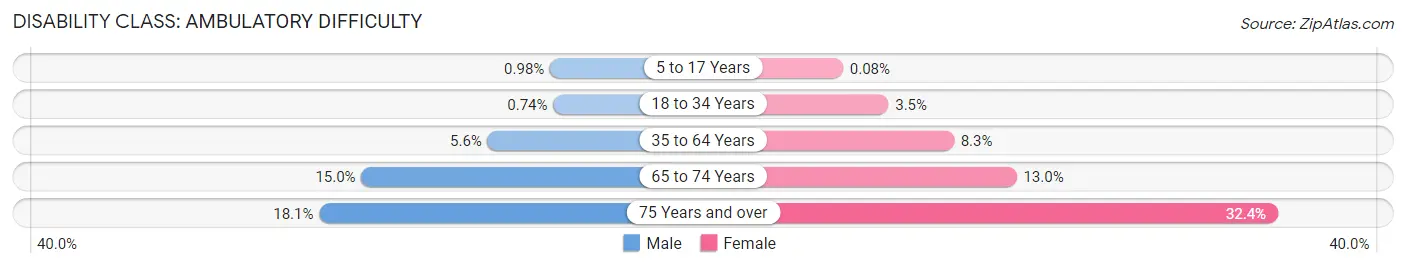
| Age Bracket | Male | Female |
| 5 to 17 Years | 82 (1.0%) | 6 (0.1%) |
| 18 to 34 Years | 60 (0.7%) | 315 (3.5%) |
| 35 to 64 Years | 757 (5.6%) | 1,213 (8.3%) |
| 65 to 74 Years | 413 (15.0%) | 443 (13.0%) |
| 75 Years and over | 251 (18.1%) | 836 (32.4%) |
Disability Class: Self-Care Difficulty
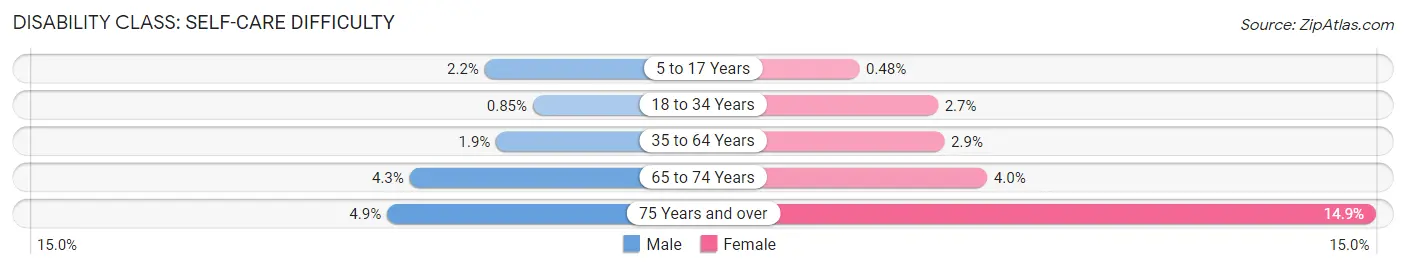
| Age Bracket | Male | Female |
| 5 to 17 Years | 183 (2.2%) | 38 (0.5%) |
| 18 to 34 Years | 69 (0.9%) | 244 (2.7%) |
| 35 to 64 Years | 252 (1.9%) | 416 (2.9%) |
| 65 to 74 Years | 118 (4.3%) | 138 (4.0%) |
| 75 Years and over | 68 (4.9%) | 384 (14.9%) |
Technology Access in Racine
Computing Device Access in Racine
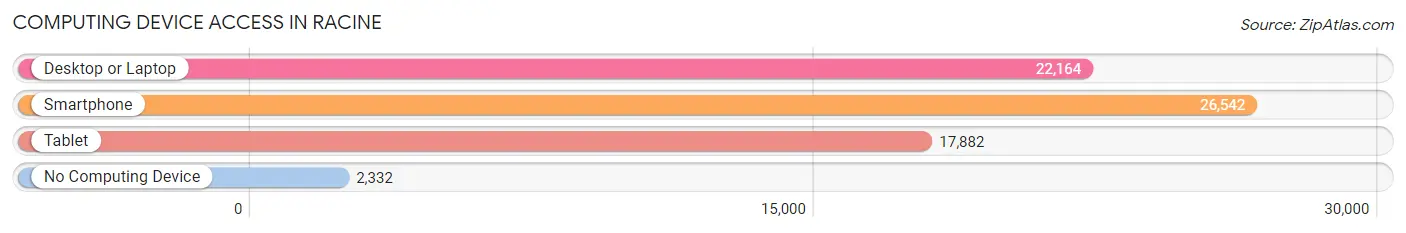
| Device Type | # Households | % Households |
| Desktop or Laptop | 22,164 | 70.9% |
| Smartphone | 26,542 | 84.9% |
| Tablet | 17,882 | 57.2% |
| No Computing Device | 2,332 | 7.4% |
| Total | 31,282 | 100.0% |
Internet Access in Racine
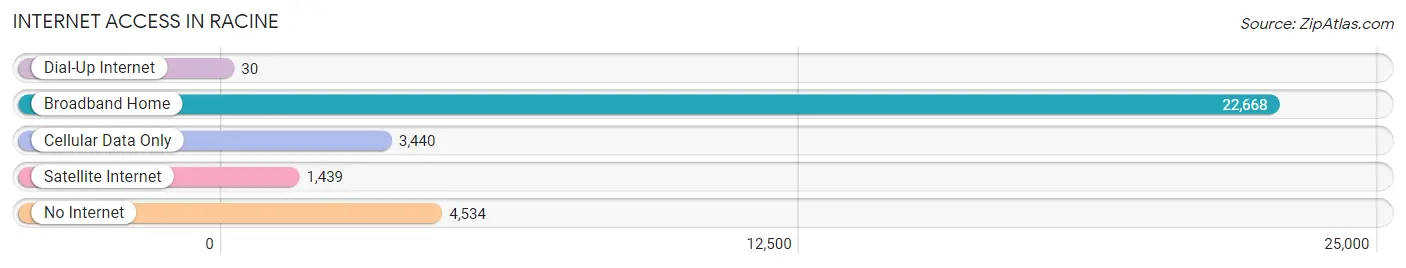
| Internet Type | # Households | % Households |
| Dial-Up Internet | 30 | 0.1% |
| Broadband Home | 22,668 | 72.5% |
| Cellular Data Only | 3,440 | 11.0% |
| Satellite Internet | 1,439 | 4.6% |
| No Internet | 4,534 | 14.5% |
| Total | 31,282 | 100.0% |
Racine Summary
Racine, Wisconsin is a city located in the southeastern corner of the state, on the shores of Lake Michigan. It is the fifth-largest city in Wisconsin, with a population of 78,860 as of the 2010 census. Racine is known for its strong industrial heritage, having been home to several major manufacturing companies, including J.I. Case, S.C. Johnson & Son, and Dremel.
Racine was founded in 1834 by Gilbert Knapp, a New Yorker who had previously founded the nearby town of Southport. Knapp named the city after the French word for “root”, as he believed the city would become the “root” of a great industrial center. The city was incorporated in 1848, and by the late 19th century, Racine had become a major industrial center, with several large factories producing a variety of products, including agricultural equipment, furniture, and automobiles.
Geographically, Racine is located on the western shore of Lake Michigan, about 40 miles north of Chicago. The city is situated on the banks of the Root River, which flows into the lake. The city is divided into several distinct neighborhoods, including the downtown area, the Northside, the Southside, and the Westside.
Racine has a humid continental climate, with cold winters and hot, humid summers. The average annual temperature is around 50 degrees Fahrenheit, and the average annual precipitation is around 33 inches.
Racine’s economy is largely based on manufacturing, with several large companies having their headquarters in the city. The largest employers in the city are S.C. Johnson & Son, J.I. Case, and Dremel. Other major employers include Racine Unified School District, Racine County, and the City of Racine.
Racine’s population is diverse, with a large African American population, as well as a significant Hispanic population. As of the 2010 census, the city’s population was 78,860, with a median age of 36.7 years. The median household income was $41,945, and the median home value was $118,400.
Racine is home to several cultural attractions, including the Racine Art Museum, the Racine Zoo, and the Racine Heritage Museum. The city also hosts several annual festivals, including the Racine Art Fair, the Racine Kite Festival, and the Racine County Fair.
Racine is a vibrant city with a rich history and a strong industrial heritage. It is home to several major employers, and its diverse population makes it a great place to live and work. With its beautiful lakefront location and its many cultural attractions, Racine is a great place to visit and explore.
Common Questions
What is Per Capita Income in Racine?
Per Capita income in Racine is $27,087.
What is the Median Family Income in Racine?
Median Family Income in Racine is $62,126.
What is the Median Household income in Racine?
Median Household Income in Racine is $52,766.
What is Income or Wage Gap in Racine?
Income or Wage Gap in Racine is 21.6%.
Women in Racine earn 78.4 cents for every dollar earned by a man.
What is Family Income Deficit in Racine?
Family Income Deficit in Racine is $12,323.
Families that are below poverty line in Racine earn $12,323 less on average than the poverty threshold level.
What is Inequality or Gini Index in Racine?
Inequality or Gini Index in Racine is 0.42.
What is the Total Population of Racine?
Total Population of Racine is 77,453.
What is the Total Male Population of Racine?
Total Male Population of Racine is 37,219.
What is the Total Female Population of Racine?
Total Female Population of Racine is 40,234.
What is the Ratio of Males per 100 Females in Racine?
There are 92.51 Males per 100 Females in Racine.
What is the Ratio of Females per 100 Males in Racine?
There are 108.10 Females per 100 Males in Racine.
What is the Median Population Age in Racine?
Median Population Age in Racine is 35.0 Years.
What is the Average Family Size in Racine
Average Family Size in Racine is 3.1 People.
What is the Average Household Size in Racine
Average Household Size in Racine is 2.4 People.
How Large is the Labor Force in Racine?
There are 38,039 People in the Labor Forcein in Racine.
What is the Percentage of People in the Labor Force in Racine?
64.3% of People are in the Labor Force in Racine.
What is the Unemployment Rate in Racine?
Unemployment Rate in Racine is 6.0%.