Janesville, WI Map & Demographics
Janesville Map
Janesville Overview
$35,135
PER CAPITA INCOME
$82,461
AVG FAMILY INCOME
$68,610
AVG HOUSEHOLD INCOME
26.2%
WAGE / INCOME GAP [ % ]
73.8¢/ $1
WAGE / INCOME GAP [ $ ]
$11,496
FAMILY INCOME DEFICIT
0.39
INEQUALITY / GINI INDEX
65,669
TOTAL POPULATION
32,499
MALE POPULATION
33,170
FEMALE POPULATION
97.98
MALES / 100 FEMALES
102.06
FEMALES / 100 MALES
39.5
MEDIAN AGE
2.9
AVG FAMILY SIZE
2.3
AVG HOUSEHOLD SIZE
34,645
LABOR FORCE [ PEOPLE ]
65.5%
PERCENT IN LABOR FORCE
4.1%
UNEMPLOYMENT RATE
Janesville Area Codes
Income in Janesville
Income Overview in Janesville
Per Capita Income in Janesville is $35,135, while median incomes of families and households are $82,461 and $68,610 respectively.
| Characteristic | Number | Measure |
| Per Capita Income | 65,669 | $35,135 |
| Median Family Income | 16,719 | $82,461 |
| Mean Family Income | 16,719 | $93,737 |
| Median Household Income | 27,895 | $68,610 |
| Mean Household Income | 27,895 | $80,441 |
| Income Deficit | 16,719 | $11,496 |
| Wage / Income Gap (%) | 65,669 | 26.20% |
| Wage / Income Gap ($) | 65,669 | 73.80¢ per $1 |
| Gini / Inequality Index | 65,669 | 0.39 |
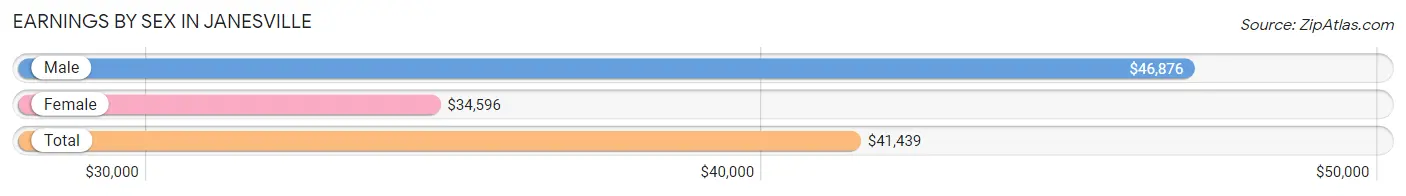
Earnings by Sex in Janesville
Average Earnings in Janesville are $41,439, $46,876 for men and $34,596 for women, a difference of 26.2%.
| Sex | Number | Average Earnings |
| Male | 18,726 (51.9%) | $46,876 |
| Female | 17,374 (48.1%) | $34,596 |
| Total | 36,100 (100.0%) | $41,439 |
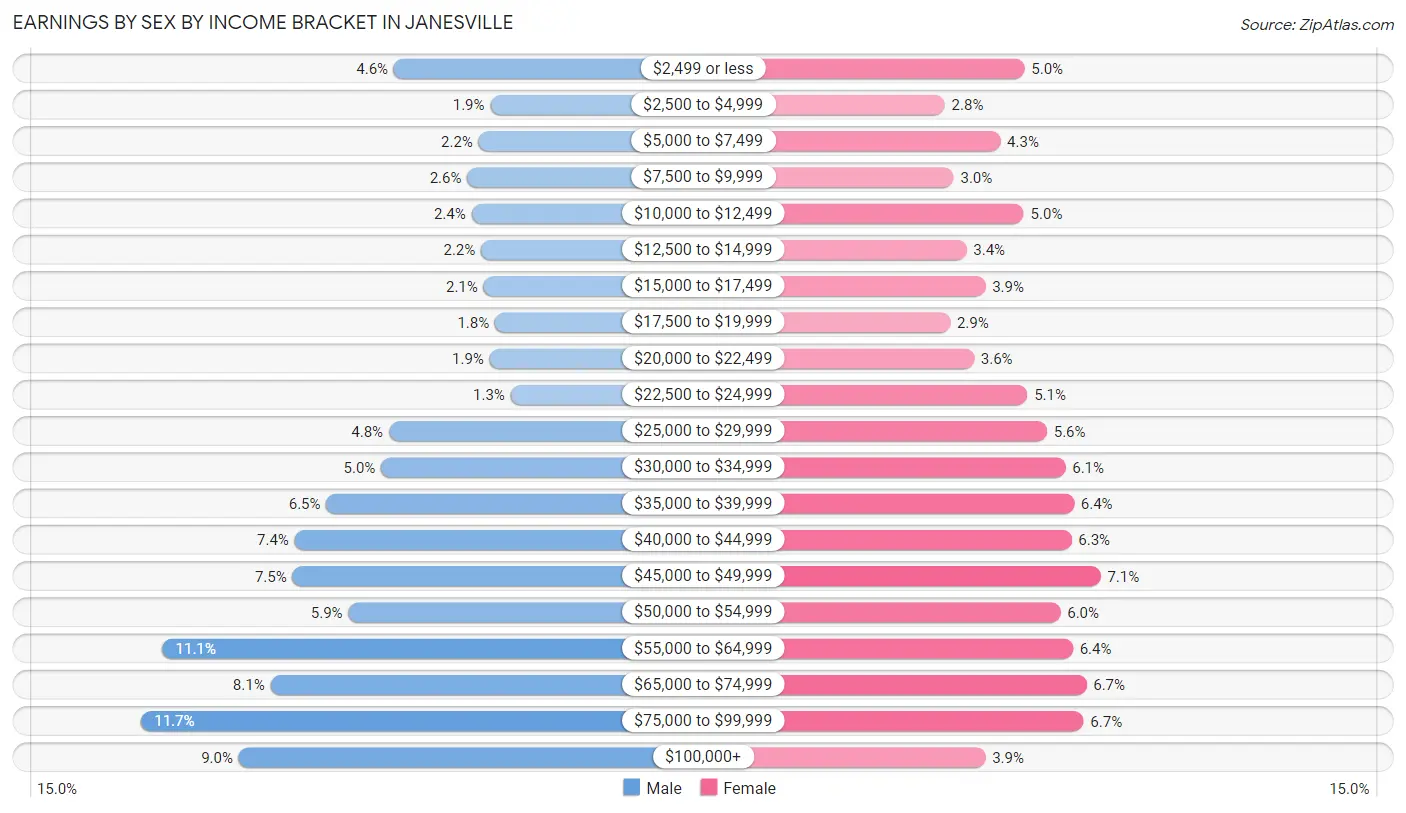
Earnings by Sex by Income Bracket in Janesville
The most common earnings brackets in Janesville are $75,000 to $99,999 for men (2,195 | 11.7%) and $45,000 to $49,999 for women (1,239 | 7.1%).
| Income | Male | Female |
| $2,499 or less | 865 (4.6%) | 867 (5.0%) |
| $2,500 to $4,999 | 357 (1.9%) | 478 (2.8%) |
| $5,000 to $7,499 | 419 (2.2%) | 749 (4.3%) |
| $7,500 to $9,999 | 479 (2.6%) | 522 (3.0%) |
| $10,000 to $12,499 | 456 (2.4%) | 863 (5.0%) |
| $12,500 to $14,999 | 406 (2.2%) | 583 (3.4%) |
| $15,000 to $17,499 | 393 (2.1%) | 676 (3.9%) |
| $17,500 to $19,999 | 333 (1.8%) | 503 (2.9%) |
| $20,000 to $22,499 | 361 (1.9%) | 620 (3.6%) |
| $22,500 to $24,999 | 250 (1.3%) | 881 (5.1%) |
| $25,000 to $29,999 | 891 (4.8%) | 976 (5.6%) |
| $30,000 to $34,999 | 932 (5.0%) | 1,067 (6.1%) |
| $35,000 to $39,999 | 1,220 (6.5%) | 1,108 (6.4%) |
| $40,000 to $44,999 | 1,388 (7.4%) | 1,096 (6.3%) |
| $45,000 to $49,999 | 1,398 (7.5%) | 1,239 (7.1%) |
| $50,000 to $54,999 | 1,104 (5.9%) | 1,042 (6.0%) |
| $55,000 to $64,999 | 2,083 (11.1%) | 1,104 (6.4%) |
| $65,000 to $74,999 | 1,515 (8.1%) | 1,169 (6.7%) |
| $75,000 to $99,999 | 2,195 (11.7%) | 1,155 (6.7%) |
| $100,000+ | 1,681 (9.0%) | 676 (3.9%) |
| Total | 18,726 (100.0%) | 17,374 (100.0%) |
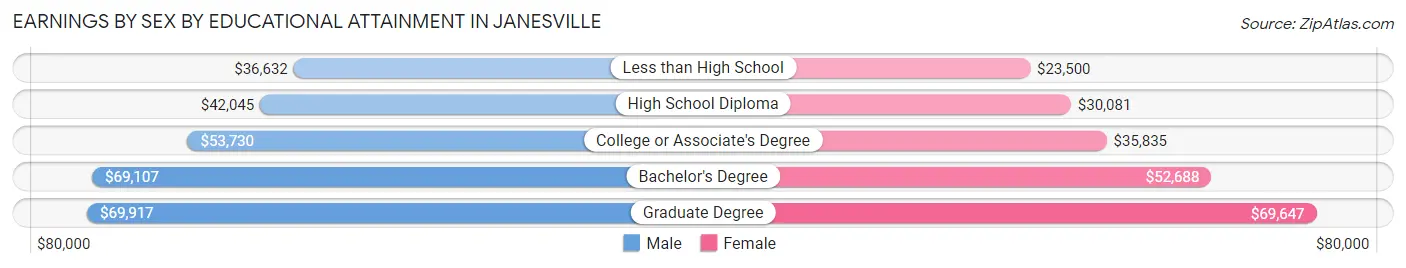
Earnings by Sex by Educational Attainment in Janesville
Average earnings in Janesville are $51,711 for men and $39,541 for women, a difference of 23.5%. Men with an educational attainment of graduate degree enjoy the highest average annual earnings of $69,917, while those with less than high school education earn the least with $36,632. Women with an educational attainment of graduate degree earn the most with the average annual earnings of $69,647, while those with less than high school education have the smallest earnings of $23,500.
| Educational Attainment | Male Income | Female Income |
| Less than High School | $36,632 | $23,500 |
| High School Diploma | $42,045 | $30,081 |
| College or Associate's Degree | $53,730 | $35,835 |
| Bachelor's Degree | $69,107 | $52,688 |
| Graduate Degree | $69,917 | $69,647 |
| Total | $51,711 | $39,541 |
Family Income in Janesville
Family Income Brackets in Janesville
According to the Janesville family income data, there are 3,795 families falling into the $100,000 to $149,999 income range, which is the most common income bracket and makes up 22.7% of all families. Conversely, the $10,000 to $14,999 income bracket is the least frequent group with only 251 families (1.5%) belonging to this category.
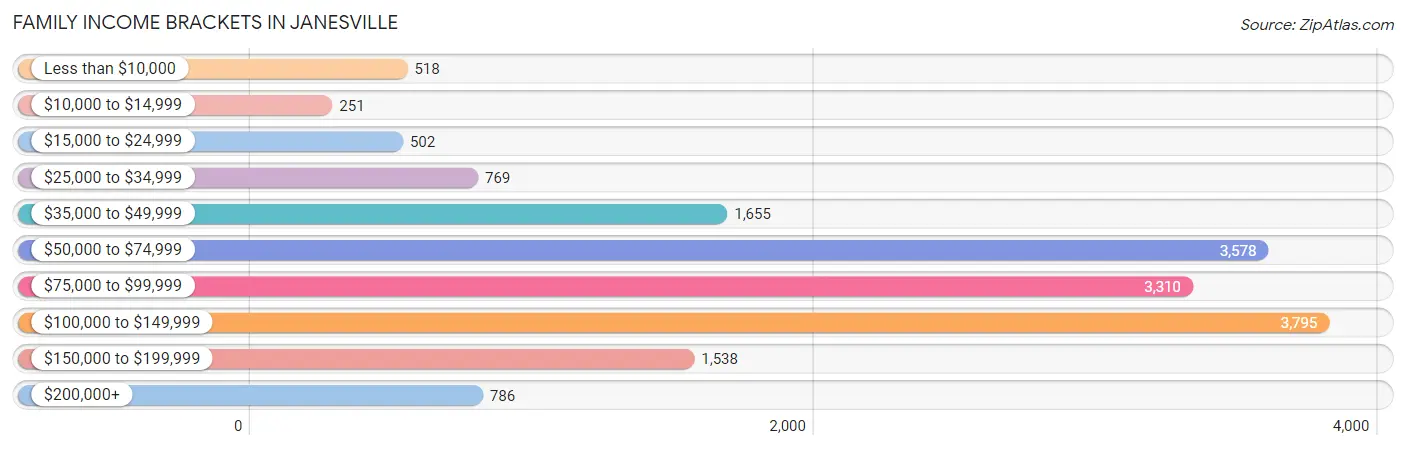
| Income Bracket | # Families | % Families |
| Less than $10,000 | 518 | 3.1% |
| $10,000 to $14,999 | 251 | 1.5% |
| $15,000 to $24,999 | 502 | 3.0% |
| $25,000 to $34,999 | 769 | 4.6% |
| $35,000 to $49,999 | 1,655 | 9.9% |
| $50,000 to $74,999 | 3,578 | 21.4% |
| $75,000 to $99,999 | 3,310 | 19.8% |
| $100,000 to $149,999 | 3,795 | 22.7% |
| $150,000 to $199,999 | 1,538 | 9.2% |
| $200,000+ | 786 | 4.7% |
Family Income by Famaliy Size in Janesville
5-person families (1,022 | 6.1%) account for the highest median family income in Janesville with $117,353 per family, while 2-person families (9,183 | 54.9%) have the highest median income of $36,718 per family member.
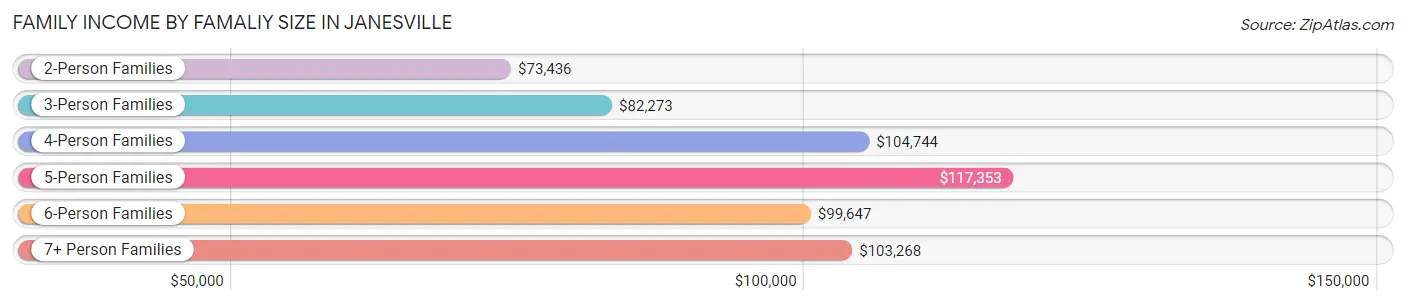
| Income Bracket | # Families | Median Income |
| 2-Person Families | 9,183 (54.9%) | $73,436 |
| 3-Person Families | 3,140 (18.8%) | $82,273 |
| 4-Person Families | 2,822 (16.9%) | $104,744 |
| 5-Person Families | 1,022 (6.1%) | $117,353 |
| 6-Person Families | 375 (2.2%) | $99,647 |
| 7+ Person Families | 177 (1.1%) | $103,268 |
| Total | 16,719 (100.0%) | $82,461 |
Family Income by Number of Earners in Janesville
The median family income in Janesville is $82,461, with families comprising 3+ earners (1,615) having the highest median family income of $134,517, while families with 1 earner (4,999) have the lowest median family income of $58,967, accounting for 9.7% and 29.9% of families, respectively.
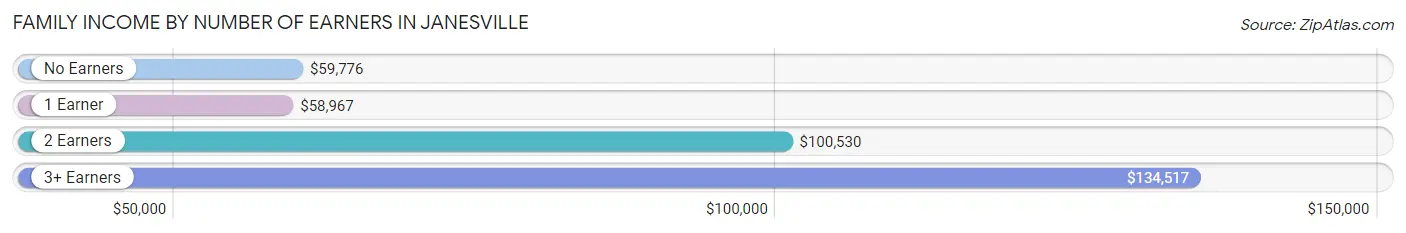
| Number of Earners | # Families | Median Income |
| No Earners | 2,918 (17.4%) | $59,776 |
| 1 Earner | 4,999 (29.9%) | $58,967 |
| 2 Earners | 7,187 (43.0%) | $100,530 |
| 3+ Earners | 1,615 (9.7%) | $134,517 |
| Total | 16,719 (100.0%) | $82,461 |
Household Income in Janesville
Household Income Brackets in Janesville
With 5,746 households falling in the category, the $50,000 to $74,999 income range is the most frequent in Janesville, accounting for 20.6% of all households. In contrast, only 948 households (3.4%) fall into the $200,000+ income bracket, making it the least populous group.
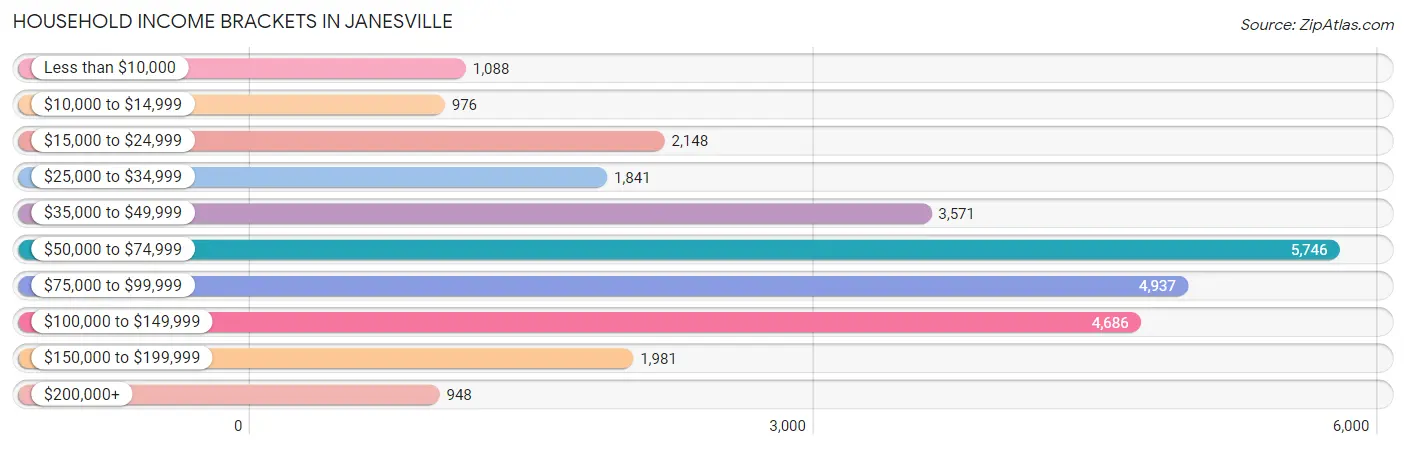
| Income Bracket | # Households | % Households |
| Less than $10,000 | 1,088 | 3.9% |
| $10,000 to $14,999 | 976 | 3.5% |
| $15,000 to $24,999 | 2,148 | 7.7% |
| $25,000 to $34,999 | 1,841 | 6.6% |
| $35,000 to $49,999 | 3,571 | 12.8% |
| $50,000 to $74,999 | 5,746 | 20.6% |
| $75,000 to $99,999 | 4,937 | 17.7% |
| $100,000 to $149,999 | 4,686 | 16.8% |
| $150,000 to $199,999 | 1,981 | 7.1% |
| $200,000+ | 948 | 3.4% |
Household Income by Householder Age in Janesville
The median household income in Janesville is $68,610, with the highest median household income of $76,342 found in the 45 to 64 years age bracket for the primary householder. A total of 10,322 households (37.0%) fall into this category. Meanwhile, the 65+ years age bracket for the primary householder has the lowest median household income of $54,195, with 7,477 households (26.8%) in this group.
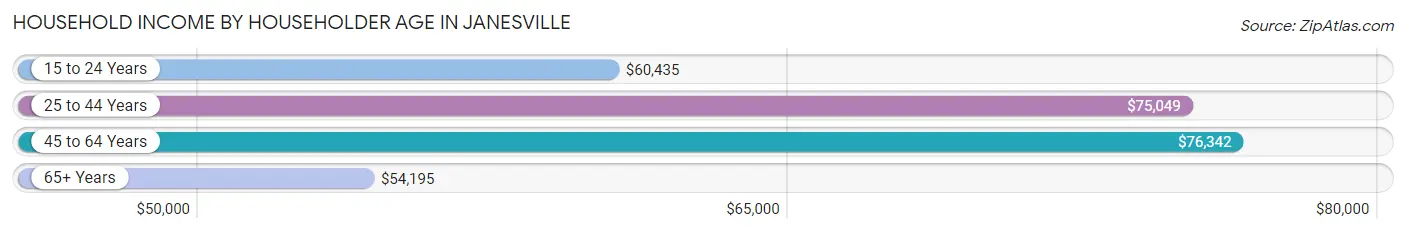
| Income Bracket | # Households | Median Income |
| 15 to 24 Years | 1,024 (3.7%) | $60,435 |
| 25 to 44 Years | 9,072 (32.5%) | $75,049 |
| 45 to 64 Years | 10,322 (37.0%) | $76,342 |
| 65+ Years | 7,477 (26.8%) | $54,195 |
| Total | 27,895 (100.0%) | $68,610 |
Poverty in Janesville
Income Below Poverty by Sex and Age in Janesville
With 8.8% poverty level for males and 10.9% for females among the residents of Janesville, 6 to 11 year old males and 15 year old females are the most vulnerable to poverty, with 545 males (24.8%) and 82 females (20.7%) in their respective age groups living below the poverty level.
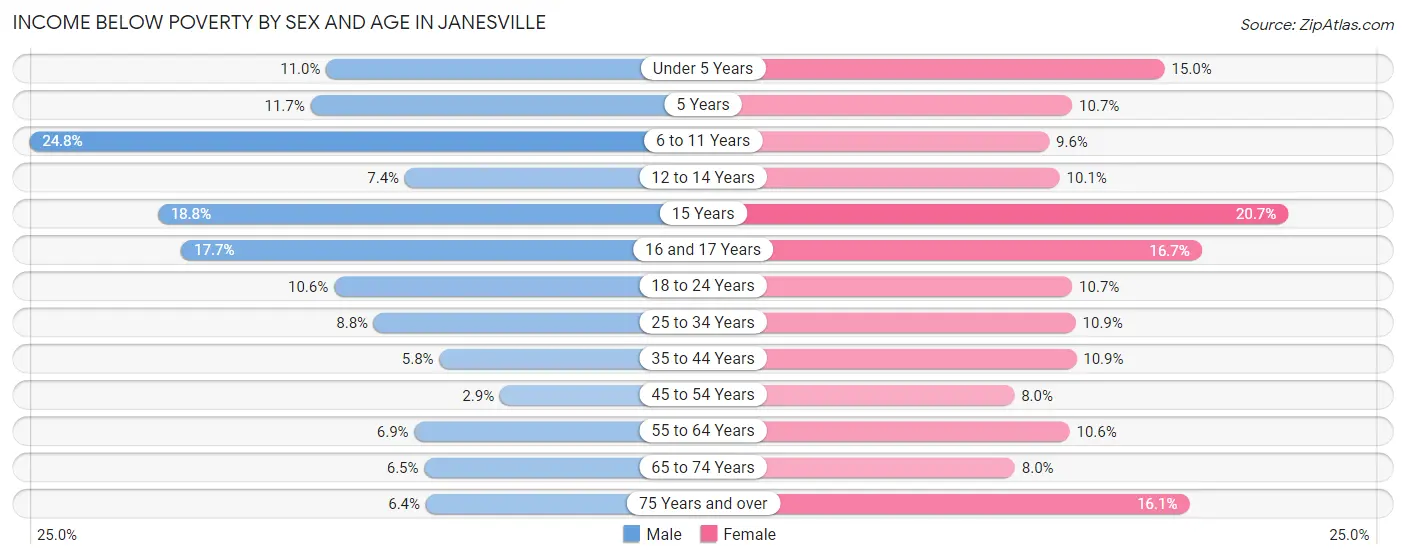
| Age Bracket | Male | Female |
| Under 5 Years | 199 (11.0%) | 225 (15.0%) |
| 5 Years | 67 (11.7%) | 34 (10.7%) |
| 6 to 11 Years | 545 (24.8%) | 249 (9.6%) |
| 12 to 14 Years | 109 (7.3%) | 106 (10.1%) |
| 15 Years | 70 (18.8%) | 82 (20.7%) |
| 16 and 17 Years | 190 (17.7%) | 115 (16.7%) |
| 18 to 24 Years | 298 (10.6%) | 275 (10.7%) |
| 25 to 34 Years | 382 (8.8%) | 442 (10.8%) |
| 35 to 44 Years | 256 (5.8%) | 513 (10.9%) |
| 45 to 54 Years | 124 (2.9%) | 323 (8.0%) |
| 55 to 64 Years | 285 (6.9%) | 470 (10.6%) |
| 65 to 74 Years | 177 (6.5%) | 282 (8.0%) |
| 75 Years and over | 113 (6.4%) | 453 (16.1%) |
| Total | 2,815 (8.8%) | 3,569 (10.9%) |
Income Above Poverty by Sex and Age in Janesville
According to the poverty statistics in Janesville, males aged 45 to 54 years and females aged 45 to 54 years are the age groups that are most secure financially, with 97.1% of males and 92.0% of females in these age groups living above the poverty line.
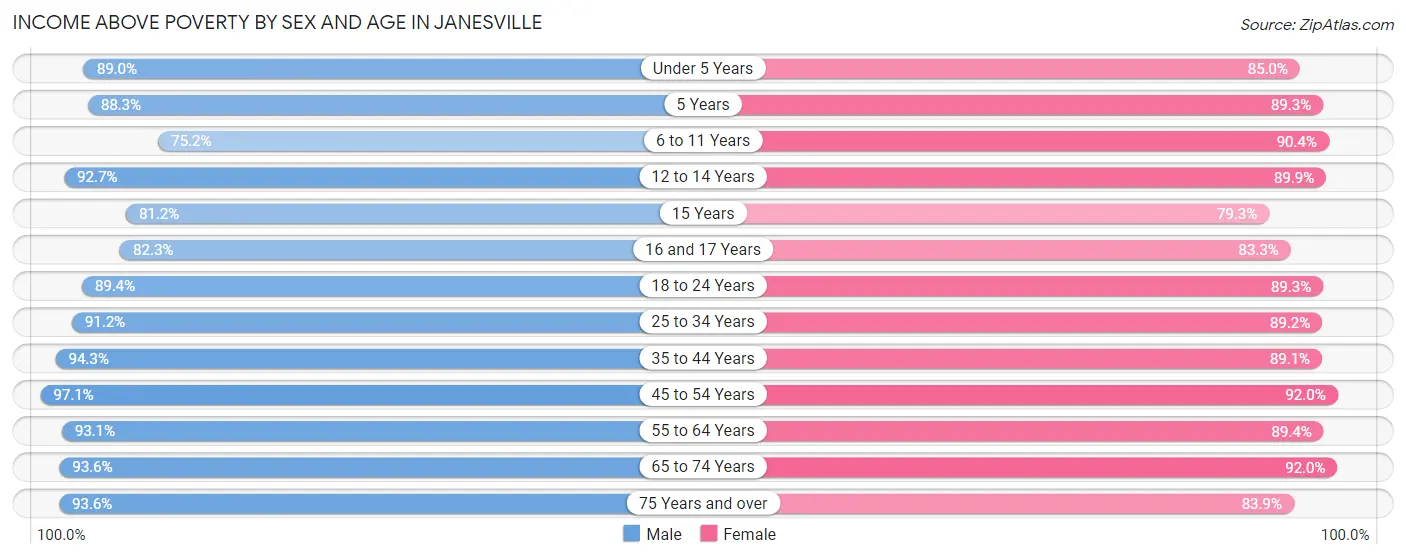
| Age Bracket | Male | Female |
| Under 5 Years | 1,610 (89.0%) | 1,277 (85.0%) |
| 5 Years | 504 (88.3%) | 284 (89.3%) |
| 6 to 11 Years | 1,654 (75.2%) | 2,339 (90.4%) |
| 12 to 14 Years | 1,373 (92.6%) | 942 (89.9%) |
| 15 Years | 302 (81.2%) | 314 (79.3%) |
| 16 and 17 Years | 881 (82.3%) | 574 (83.3%) |
| 18 to 24 Years | 2,503 (89.4%) | 2,298 (89.3%) |
| 25 to 34 Years | 3,965 (91.2%) | 3,633 (89.1%) |
| 35 to 44 Years | 4,193 (94.3%) | 4,203 (89.1%) |
| 45 to 54 Years | 4,090 (97.1%) | 3,715 (92.0%) |
| 55 to 64 Years | 3,841 (93.1%) | 3,975 (89.4%) |
| 65 to 74 Years | 2,569 (93.5%) | 3,230 (92.0%) |
| 75 Years and over | 1,658 (93.6%) | 2,357 (83.9%) |
| Total | 29,143 (91.2%) | 29,141 (89.1%) |
Income Below Poverty Among Married-Couple Families in Janesville
The poverty statistics for married-couple families in Janesville show that 1.9% or 227 of the total 11,970 families live below the poverty line. Families with 3 or 4 children have the highest poverty rate of 8.6%, comprising of 78 families. On the other hand, families with 1 or 2 children have the lowest poverty rate of 0.3%, which includes 11 families.
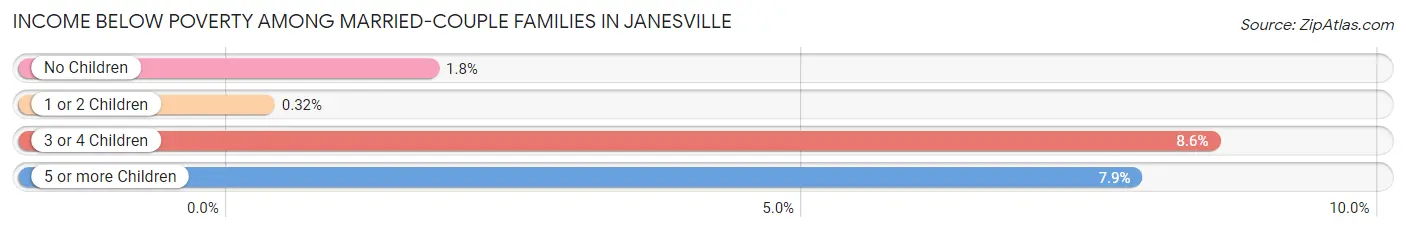
| Children | Above Poverty | Below Poverty |
| No Children | 7,373 (98.3%) | 131 (1.8%) |
| 1 or 2 Children | 3,454 (99.7%) | 11 (0.3%) |
| 3 or 4 Children | 834 (91.4%) | 78 (8.6%) |
| 5 or more Children | 82 (92.1%) | 7 (7.9%) |
| Total | 11,743 (98.1%) | 227 (1.9%) |
Income Below Poverty Among Single-Parent Households in Janesville
According to the poverty data in Janesville, 12.8% or 198 single-father households and 24.7% or 793 single-mother households are living below the poverty line. Among single-father households, those with 5 or more children have the highest poverty rate, with 19 households (100.0%) experiencing poverty. Likewise, among single-mother households, those with 3 or 4 children have the highest poverty rate, with 198 households (49.4%) falling below the poverty line.
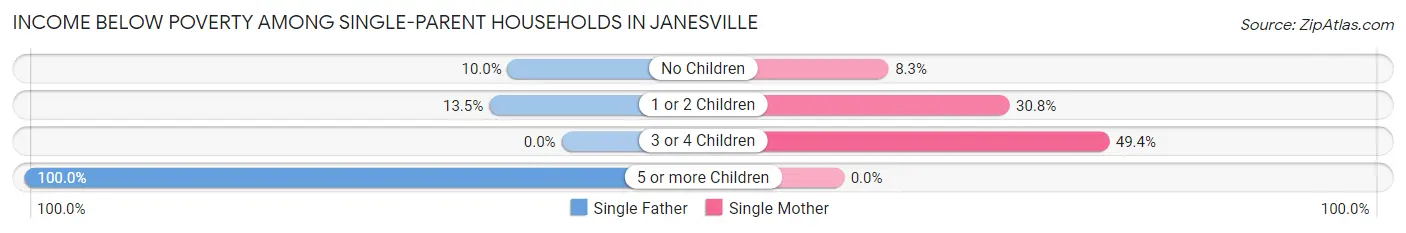
| Children | Single Father | Single Mother |
| No Children | 51 (10.0%) | 99 (8.3%) |
| 1 or 2 Children | 128 (13.5%) | 496 (30.8%) |
| 3 or 4 Children | 0 (0.0%) | 198 (49.4%) |
| 5 or more Children | 19 (100.0%) | 0 (0.0%) |
| Total | 198 (12.8%) | 793 (24.7%) |
Income Below Poverty Among Married-Couple vs Single-Parent Households in Janesville
The poverty data for Janesville shows that 227 of the married-couple family households (1.9%) and 991 of the single-parent households (20.9%) are living below the poverty level. Within the married-couple family households, those with 3 or 4 children have the highest poverty rate, with 78 households (8.6%) falling below the poverty line. Among the single-parent households, those with 5 or more children have the highest poverty rate, with 19 household (100.0%) living below poverty.
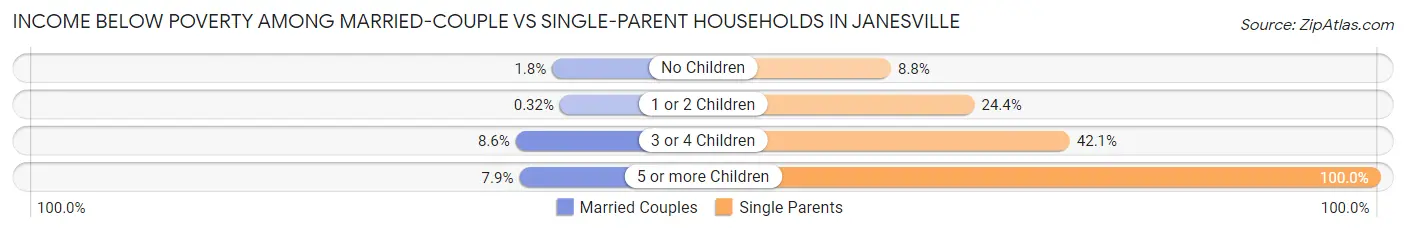
| Children | Married-Couple Families | Single-Parent Households |
| No Children | 131 (1.8%) | 150 (8.8%) |
| 1 or 2 Children | 11 (0.3%) | 624 (24.4%) |
| 3 or 4 Children | 78 (8.6%) | 198 (42.1%) |
| 5 or more Children | 7 (7.9%) | 19 (100.0%) |
| Total | 227 (1.9%) | 991 (20.9%) |
Race in Janesville
The most populous races in Janesville are White / Caucasian (57,724 | 87.9%), Hispanic or Latino (3,572 | 5.4%), and Two or more Races (3,094 | 4.7%).
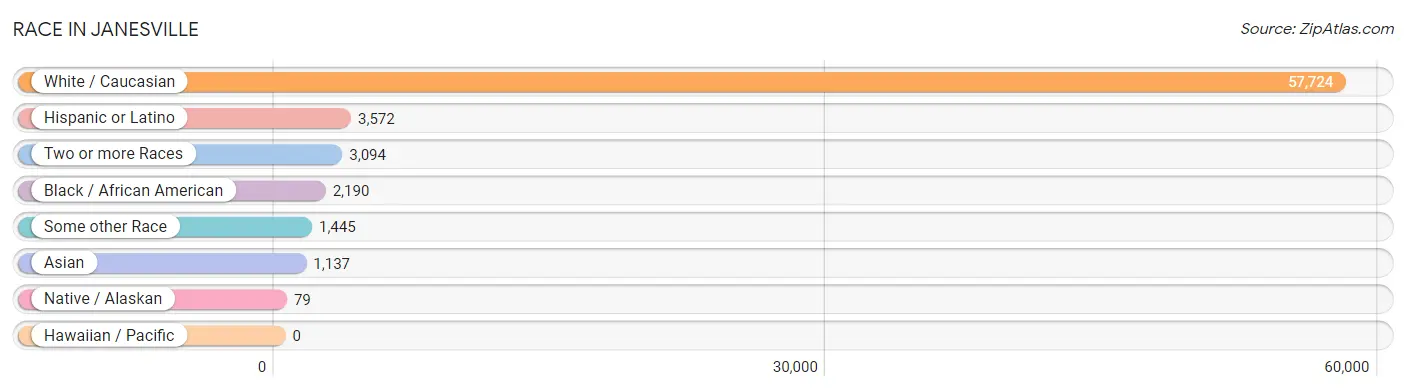
| Race | # Population | % Population |
| Asian | 1,137 | 1.7% |
| Black / African American | 2,190 | 3.3% |
| Hawaiian / Pacific | 0 | 0.0% |
| Hispanic or Latino | 3,572 | 5.4% |
| Native / Alaskan | 79 | 0.1% |
| White / Caucasian | 57,724 | 87.9% |
| Two or more Races | 3,094 | 4.7% |
| Some other Race | 1,445 | 2.2% |
| Total | 65,669 | 100.0% |
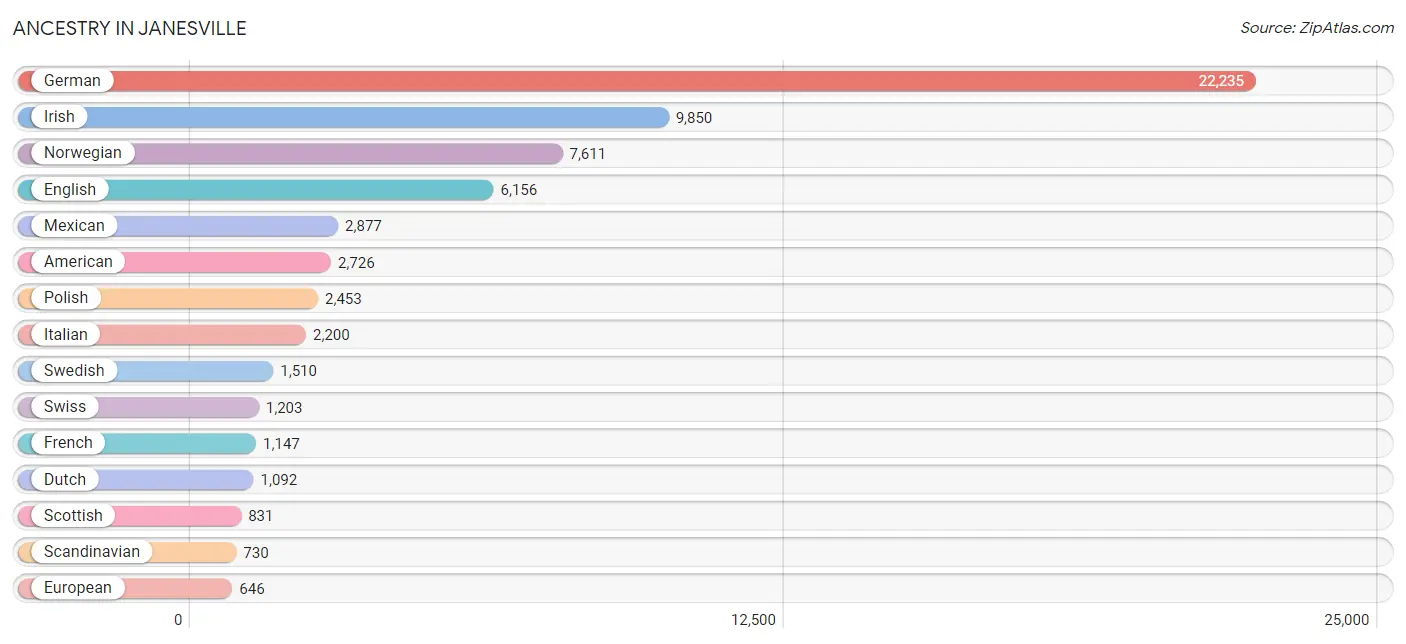
Ancestry in Janesville
The most populous ancestries reported in Janesville are German (22,235 | 33.9%), Irish (9,850 | 15.0%), Norwegian (7,611 | 11.6%), English (6,156 | 9.4%), and Mexican (2,877 | 4.4%), together accounting for 74.2% of all Janesville residents.
| Ancestry | # Population | % Population |
| African | 241 | 0.4% |
| Albanian | 82 | 0.1% |
| American | 2,726 | 4.2% |
| Arab | 41 | 0.1% |
| Argentinean | 185 | 0.3% |
| Armenian | 187 | 0.3% |
| Australian | 15 | 0.0% |
| Austrian | 91 | 0.1% |
| Bangladeshi | 112 | 0.2% |
| Belgian | 129 | 0.2% |
| Bermudan | 11 | 0.0% |
| Bhutanese | 63 | 0.1% |
| Blackfeet | 38 | 0.1% |
| British | 220 | 0.3% |
| Bulgarian | 8 | 0.0% |
| Burmese | 213 | 0.3% |
| Canadian | 145 | 0.2% |
| Central American | 46 | 0.1% |
| Cherokee | 82 | 0.1% |
| Chilean | 28 | 0.0% |
| Chippewa | 79 | 0.1% |
| Choctaw | 13 | 0.0% |
| Colombian | 68 | 0.1% |
| Croatian | 57 | 0.1% |
| Crow | 2 | 0.0% |
| Czech | 557 | 0.9% |
| Czechoslovakian | 170 | 0.3% |
| Danish | 409 | 0.6% |
| Dominican | 12 | 0.0% |
| Dutch | 1,092 | 1.7% |
| Eastern European | 90 | 0.1% |
| Egyptian | 13 | 0.0% |
| English | 6,156 | 9.4% |
| European | 646 | 1.0% |
| Finnish | 221 | 0.3% |
| French | 1,147 | 1.8% |
| French Canadian | 258 | 0.4% |
| German | 22,235 | 33.9% |
| Greek | 130 | 0.2% |
| Haitian | 4 | 0.0% |
| Honduran | 46 | 0.1% |
| Hungarian | 156 | 0.2% |
| Icelander | 4 | 0.0% |
| Indian (Asian) | 214 | 0.3% |
| Iranian | 47 | 0.1% |
| Irish | 9,850 | 15.0% |
| Italian | 2,200 | 3.4% |
| Jamaican | 62 | 0.1% |
| Japanese | 363 | 0.5% |
| Korean | 136 | 0.2% |
| Latvian | 32 | 0.1% |
| Lebanese | 20 | 0.0% |
| Lithuanian | 123 | 0.2% |
| Malaysian | 32 | 0.1% |
| Menominee | 7 | 0.0% |
| Mexican | 2,877 | 4.4% |
| Nigerian | 3 | 0.0% |
| Northern European | 32 | 0.1% |
| Norwegian | 7,611 | 11.6% |
| Okinawan | 10 | 0.0% |
| Pennsylvania German | 122 | 0.2% |
| Peruvian | 9 | 0.0% |
| Polish | 2,453 | 3.7% |
| Portuguese | 47 | 0.1% |
| Puerto Rican | 153 | 0.2% |
| Russian | 451 | 0.7% |
| Scandinavian | 730 | 1.1% |
| Scotch-Irish | 499 | 0.8% |
| Scottish | 831 | 1.3% |
| Sioux | 10 | 0.0% |
| Slavic | 41 | 0.1% |
| Slovak | 133 | 0.2% |
| Slovene | 6 | 0.0% |
| South American | 306 | 0.5% |
| Spaniard | 13 | 0.0% |
| Spanish | 21 | 0.0% |
| Sri Lankan | 51 | 0.1% |
| Subsaharan African | 253 | 0.4% |
| Swedish | 1,510 | 2.3% |
| Swiss | 1,203 | 1.8% |
| Thai | 69 | 0.1% |
| Turkish | 19 | 0.0% |
| Ukrainian | 76 | 0.1% |
| Venezuelan | 16 | 0.0% |
| Welsh | 445 | 0.7% |
| Yugoslavian | 15 | 0.0% | View All 86 Rows |
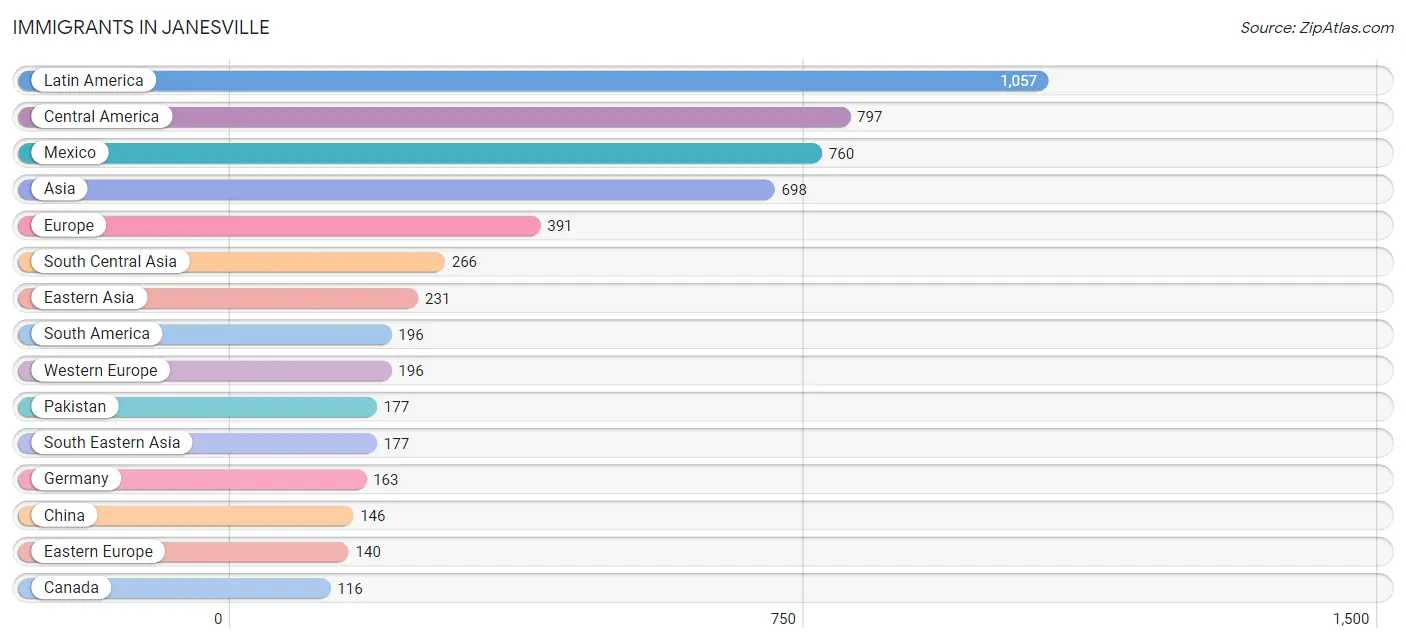
Immigrants in Janesville
The most numerous immigrant groups reported in Janesville came from Latin America (1,057 | 1.6%), Central America (797 | 1.2%), Mexico (760 | 1.2%), Asia (698 | 1.1%), and Europe (391 | 0.6%), together accounting for 5.6% of all Janesville residents.
| Immigration Origin | # Population | % Population |
| Africa | 16 | 0.0% |
| Albania | 12 | 0.0% |
| Argentina | 93 | 0.1% |
| Asia | 698 | 1.1% |
| Australia | 11 | 0.0% |
| Bulgaria | 8 | 0.0% |
| Cambodia | 60 | 0.1% |
| Cameroon | 16 | 0.0% |
| Canada | 116 | 0.2% |
| Caribbean | 64 | 0.1% |
| Central America | 797 | 1.2% |
| Chile | 28 | 0.0% |
| China | 146 | 0.2% |
| Colombia | 68 | 0.1% |
| Croatia | 16 | 0.0% |
| Czechoslovakia | 11 | 0.0% |
| Dominican Republic | 12 | 0.0% |
| Eastern Asia | 231 | 0.4% |
| Eastern Europe | 140 | 0.2% |
| England | 12 | 0.0% |
| Europe | 391 | 0.6% |
| Germany | 163 | 0.3% |
| Honduras | 37 | 0.1% |
| Hong Kong | 11 | 0.0% |
| India | 37 | 0.1% |
| Iran | 34 | 0.1% |
| Italy | 20 | 0.0% |
| Jamaica | 25 | 0.0% |
| Japan | 22 | 0.0% |
| Korea | 63 | 0.1% |
| Kuwait | 7 | 0.0% |
| Latin America | 1,057 | 1.6% |
| Mexico | 760 | 1.2% |
| Middle Africa | 16 | 0.0% |
| Netherlands | 33 | 0.1% |
| Northern Europe | 35 | 0.1% |
| Oceania | 11 | 0.0% |
| Pakistan | 177 | 0.3% |
| Peru | 5 | 0.0% |
| Philippines | 19 | 0.0% |
| Russia | 23 | 0.0% |
| Saudi Arabia | 17 | 0.0% |
| South America | 196 | 0.3% |
| South Central Asia | 266 | 0.4% |
| South Eastern Asia | 177 | 0.3% |
| Southern Europe | 20 | 0.0% |
| Thailand | 60 | 0.1% |
| Trinidad and Tobago | 27 | 0.0% |
| Uzbekistan | 18 | 0.0% |
| Venezuela | 2 | 0.0% |
| Vietnam | 38 | 0.1% |
| Western Asia | 24 | 0.0% |
| Western Europe | 196 | 0.3% | View All 53 Rows |
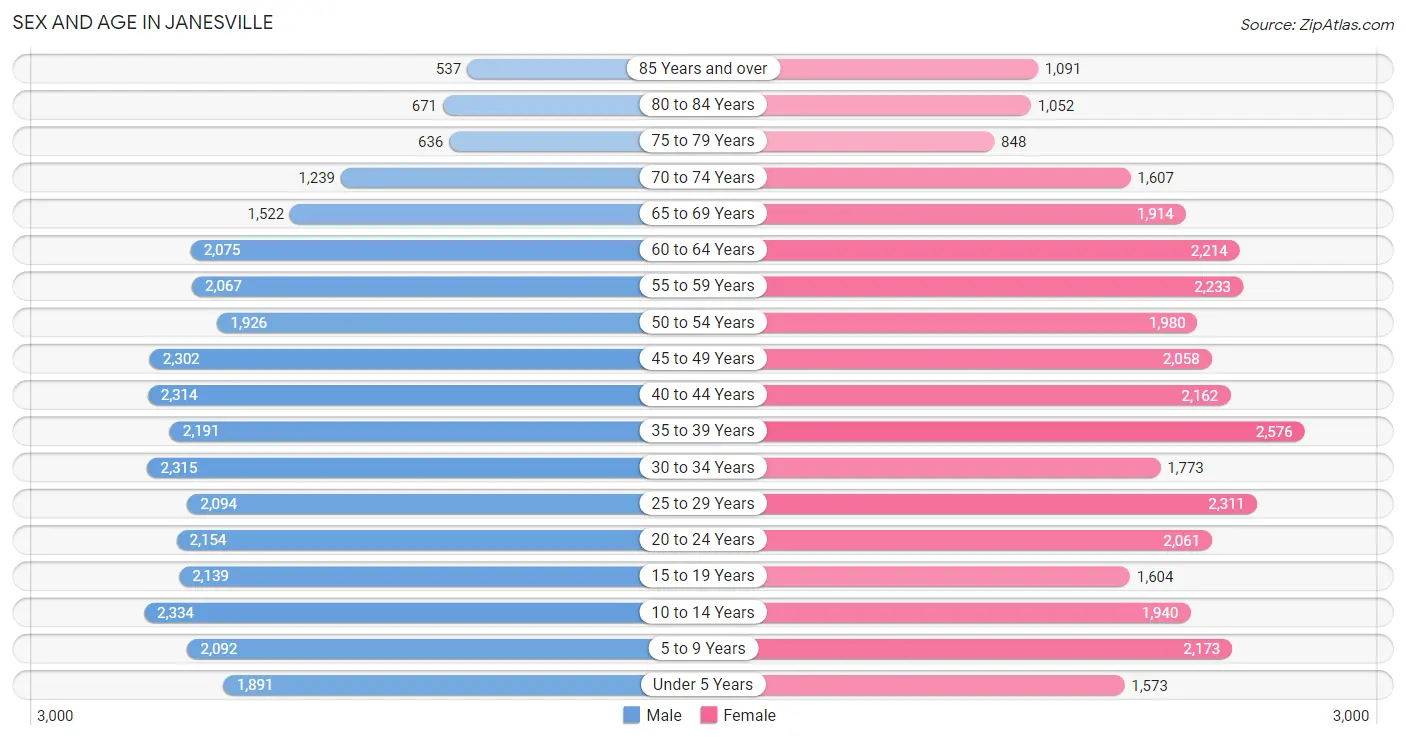
Sex and Age in Janesville
Sex and Age in Janesville
The most populous age groups in Janesville are 10 to 14 Years (2,334 | 7.2%) for men and 35 to 39 Years (2,576 | 7.8%) for women.
| Age Bracket | Male | Female |
| Under 5 Years | 1,891 (5.8%) | 1,573 (4.7%) |
| 5 to 9 Years | 2,092 (6.4%) | 2,173 (6.6%) |
| 10 to 14 Years | 2,334 (7.2%) | 1,940 (5.9%) |
| 15 to 19 Years | 2,139 (6.6%) | 1,604 (4.8%) |
| 20 to 24 Years | 2,154 (6.6%) | 2,061 (6.2%) |
| 25 to 29 Years | 2,094 (6.4%) | 2,311 (7.0%) |
| 30 to 34 Years | 2,315 (7.1%) | 1,773 (5.3%) |
| 35 to 39 Years | 2,191 (6.7%) | 2,576 (7.8%) |
| 40 to 44 Years | 2,314 (7.1%) | 2,162 (6.5%) |
| 45 to 49 Years | 2,302 (7.1%) | 2,058 (6.2%) |
| 50 to 54 Years | 1,926 (5.9%) | 1,980 (6.0%) |
| 55 to 59 Years | 2,067 (6.4%) | 2,233 (6.7%) |
| 60 to 64 Years | 2,075 (6.4%) | 2,214 (6.7%) |
| 65 to 69 Years | 1,522 (4.7%) | 1,914 (5.8%) |
| 70 to 74 Years | 1,239 (3.8%) | 1,607 (4.8%) |
| 75 to 79 Years | 636 (2.0%) | 848 (2.6%) |
| 80 to 84 Years | 671 (2.1%) | 1,052 (3.2%) |
| 85 Years and over | 537 (1.7%) | 1,091 (3.3%) |
| Total | 32,499 (100.0%) | 33,170 (100.0%) |
Families and Households in Janesville
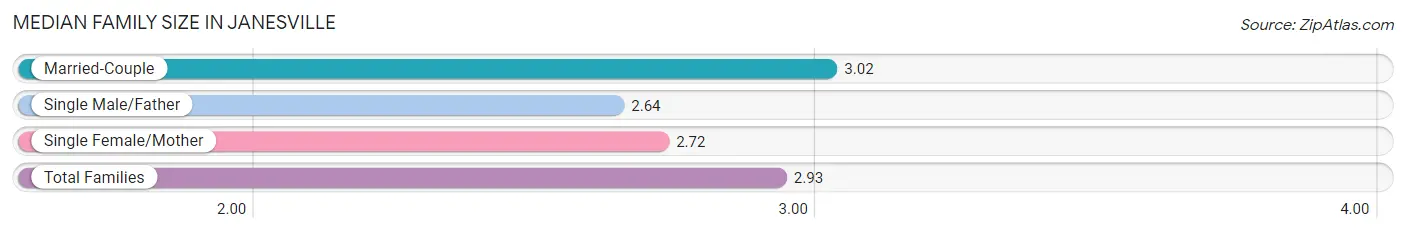
Median Family Size in Janesville
The median family size in Janesville is 2.93 persons per family, with married-couple families (11,970 | 71.6%) accounting for the largest median family size of 3.02 persons per family. On the other hand, single male/father families (1,545 | 9.2%) represent the smallest median family size with 2.64 persons per family.
| Family Type | # Families | Family Size |
| Married-Couple | 11,970 (71.6%) | 3.02 |
| Single Male/Father | 1,545 (9.2%) | 2.64 |
| Single Female/Mother | 3,204 (19.2%) | 2.72 |
| Total Families | 16,719 (100.0%) | 2.93 |
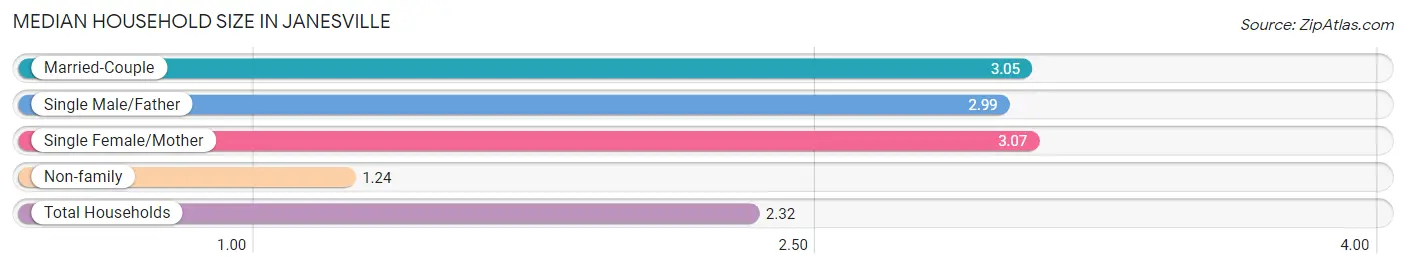
Median Household Size in Janesville
The median household size in Janesville is 2.32 persons per household, with single female/mother households (3,204 | 11.5%) accounting for the largest median household size of 3.07 persons per household. non-family households (11,176 | 40.1%) represent the smallest median household size with 1.24 persons per household.
| Household Type | # Households | Household Size |
| Married-Couple | 11,970 (42.9%) | 3.05 |
| Single Male/Father | 1,545 (5.5%) | 2.99 |
| Single Female/Mother | 3,204 (11.5%) | 3.07 |
| Non-family | 11,176 (40.1%) | 1.24 |
| Total Households | 27,895 (100.0%) | 2.32 |
Household Size by Marriage Status in Janesville
Out of a total of 27,895 households in Janesville, 16,719 (59.9%) are family households, while 11,176 (40.1%) are nonfamily households. The most numerous type of family households are 2-person households, comprising 8,316, and the most common type of nonfamily households are 1-person households, comprising 9,030.
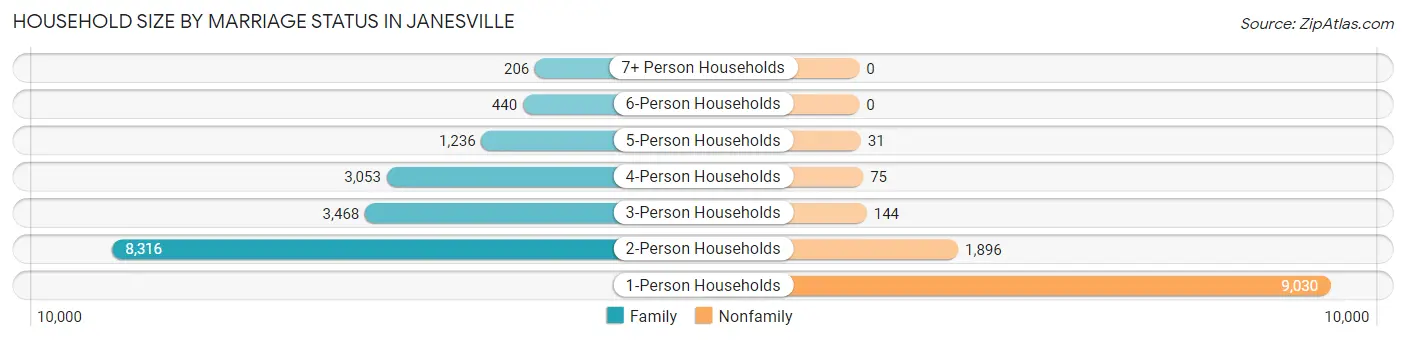
| Household Size | Family Households | Nonfamily Households |
| 1-Person Households | - | 9,030 (32.4%) |
| 2-Person Households | 8,316 (29.8%) | 1,896 (6.8%) |
| 3-Person Households | 3,468 (12.4%) | 144 (0.5%) |
| 4-Person Households | 3,053 (10.9%) | 75 (0.3%) |
| 5-Person Households | 1,236 (4.4%) | 31 (0.1%) |
| 6-Person Households | 440 (1.6%) | 0 (0.0%) |
| 7+ Person Households | 206 (0.7%) | 0 (0.0%) |
| Total | 16,719 (59.9%) | 11,176 (40.1%) |
Female Fertility in Janesville
Fertility by Age in Janesville
Average fertility rate in Janesville is 52.0 births per 1,000 women. Women in the age bracket of 20 to 34 years have the highest fertility rate with 103.0 births per 1,000 women. Women in the age bracket of 20 to 34 years acount for 81.4% of all women with births.
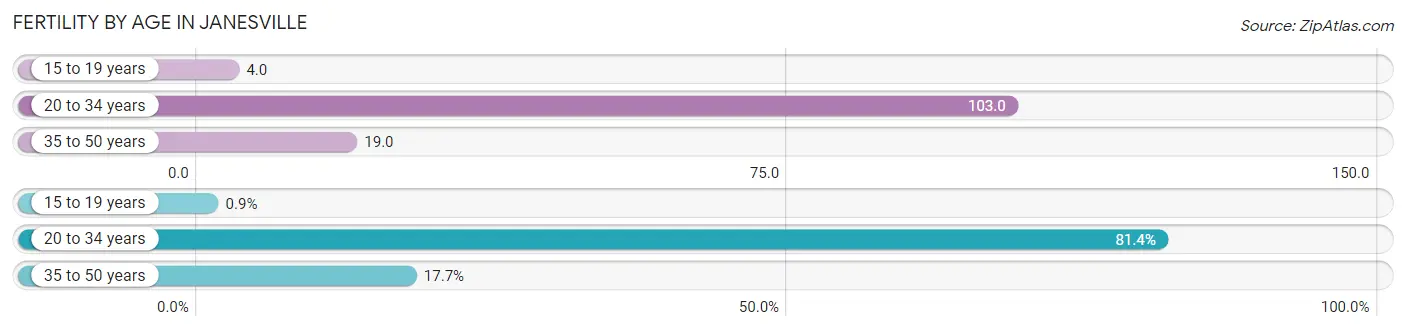
| Age Bracket | Women with Births | Births / 1,000 Women |
| 15 to 19 years | 7 (0.9%) | 4.0 |
| 20 to 34 years | 634 (81.4%) | 103.0 |
| 35 to 50 years | 138 (17.7%) | 19.0 |
| Total | 779 (100.0%) | 52.0 |
Fertility by Age by Marriage Status in Janesville
63.5% of women with births (779) in Janesville are married. The highest percentage of unmarried women with births falls into 15 to 19 years age bracket with 100.0% of them unmarried at the time of birth, while the lowest percentage of unmarried women with births belong to 35 to 50 years age bracket with 31.9% of them unmarried.
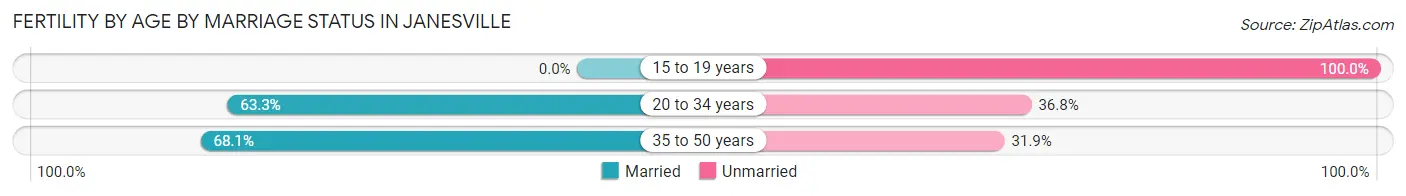
| Age Bracket | Married | Unmarried |
| 15 to 19 years | 0 (0.0%) | 7 (100.0%) |
| 20 to 34 years | 401 (63.2%) | 233 (36.7%) |
| 35 to 50 years | 94 (68.1%) | 44 (31.9%) |
| Total | 495 (63.5%) | 284 (36.5%) |
Fertility by Education in Janesville
Average fertility rate in Janesville is 52.0 births per 1,000 women. Women with the education attainment of bachelor's degree have the highest fertility rate of 112.0 births per 1,000 women, while women with the education attainment of less than high school have the lowest fertility at 14.0 births per 1,000 women. Women with the education attainment of college or associate's degree represent 38.9% of all women with births.
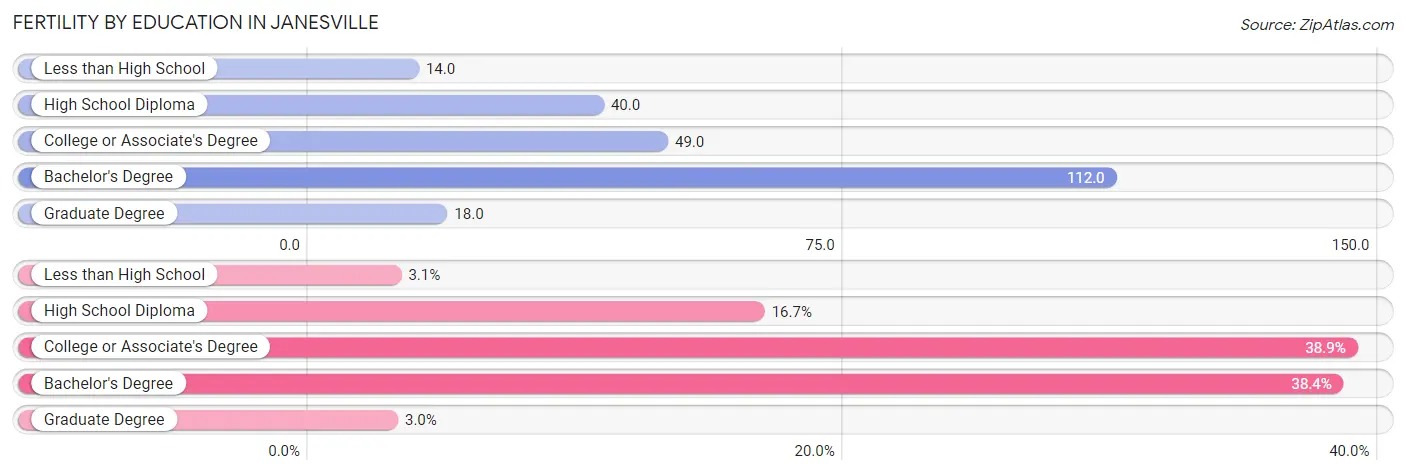
| Educational Attainment | Women with Births | Births / 1,000 Women |
| Less than High School | 24 (3.1%) | 14.0 |
| High School Diploma | 130 (16.7%) | 40.0 |
| College or Associate's Degree | 303 (38.9%) | 49.0 |
| Bachelor's Degree | 299 (38.4%) | 112.0 |
| Graduate Degree | 23 (2.9%) | 18.0 |
| Total | 779 (100.0%) | 52.0 |
Fertility by Education by Marriage Status in Janesville
36.5% of women with births in Janesville are unmarried. Women with the educational attainment of bachelor's degree are most likely to be married with 82.3% of them married at childbirth, while women with the educational attainment of less than high school are least likely to be married with 79.2% of them unmarried at childbirth.
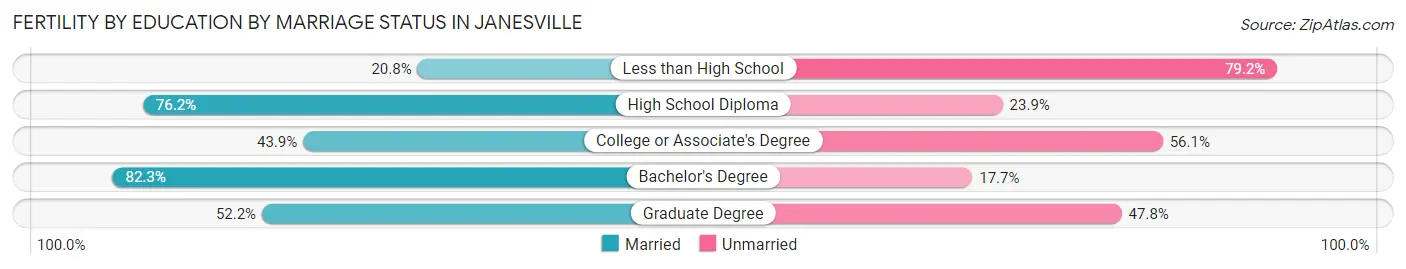
| Educational Attainment | Married | Unmarried |
| Less than High School | 5 (20.8%) | 19 (79.2%) |
| High School Diploma | 99 (76.1%) | 31 (23.8%) |
| College or Associate's Degree | 133 (43.9%) | 170 (56.1%) |
| Bachelor's Degree | 246 (82.3%) | 53 (17.7%) |
| Graduate Degree | 12 (52.2%) | 11 (47.8%) |
| Total | 495 (63.5%) | 284 (36.5%) |
Employment Characteristics in Janesville
Employment by Class of Employer in Janesville
Among the 32,755 employed individuals in Janesville, private company employees (24,285 | 74.1%), local government employees (2,587 | 7.9%), and not-for-profit organizations (2,556 | 7.8%) make up the most common classes of employment.
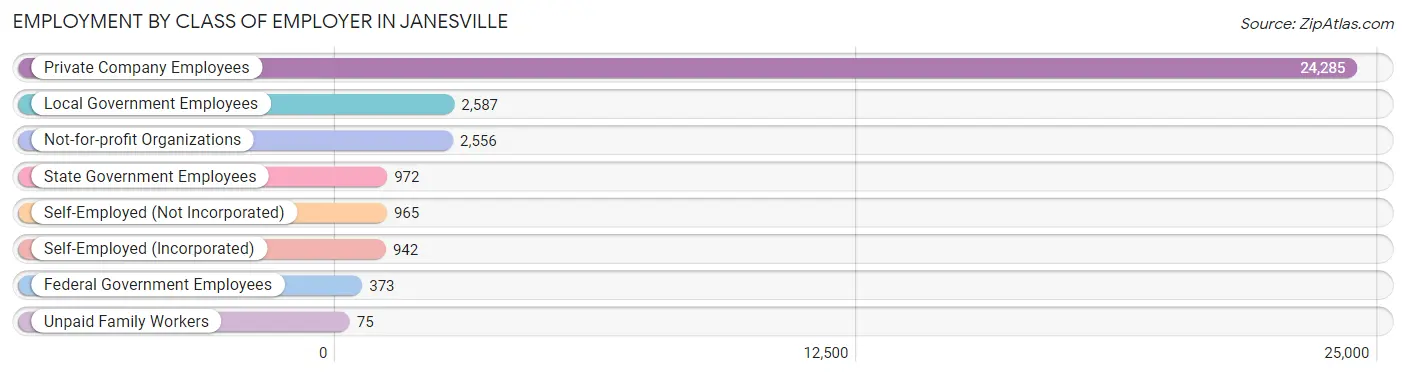
| Employer Class | # Employees | % Employees |
| Private Company Employees | 24,285 | 74.1% |
| Self-Employed (Incorporated) | 942 | 2.9% |
| Self-Employed (Not Incorporated) | 965 | 2.9% |
| Not-for-profit Organizations | 2,556 | 7.8% |
| Local Government Employees | 2,587 | 7.9% |
| State Government Employees | 972 | 3.0% |
| Federal Government Employees | 373 | 1.1% |
| Unpaid Family Workers | 75 | 0.2% |
| Total | 32,755 | 100.0% |
Employment Status by Age in Janesville
According to the labor force statistics for Janesville, out of the total population over 16 years of age (52,893), 65.5% or 34,645 individuals are in the labor force, with 4.1% or 1,420 of them unemployed. The age group with the highest labor force participation rate is 20 to 24 years, with 89.9% or 3,789 individuals in the labor force. Within the labor force, the 75 years and over age range has the highest percentage of unemployed individuals, with 17.4% or 34 of them being unemployed.
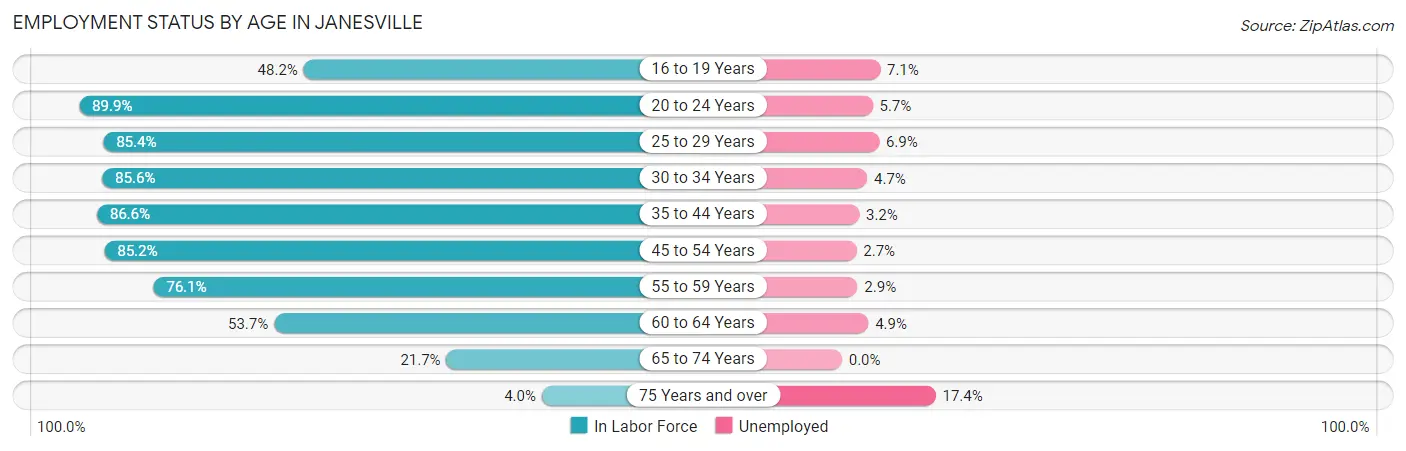
| Age Bracket | In Labor Force | Unemployed |
| 16 to 19 Years | 1,432 (48.2%) | 102 (7.1%) |
| 20 to 24 Years | 3,789 (89.9%) | 216 (5.7%) |
| 25 to 29 Years | 3,762 (85.4%) | 260 (6.9%) |
| 30 to 34 Years | 3,499 (85.6%) | 164 (4.7%) |
| 35 to 44 Years | 8,004 (86.6%) | 256 (3.2%) |
| 45 to 54 Years | 7,043 (85.2%) | 190 (2.7%) |
| 55 to 59 Years | 3,272 (76.1%) | 95 (2.9%) |
| 60 to 64 Years | 2,303 (53.7%) | 113 (4.9%) |
| 65 to 74 Years | 1,363 (21.7%) | 0 (0.0%) |
| 75 Years and over | 193 (4.0%) | 34 (17.4%) |
| Total | 34,645 (65.5%) | 1,420 (4.1%) |
Employment Status by Educational Attainment in Janesville
According to labor force statistics for Janesville, 80.6% of individuals (27,880) out of the total population between 25 and 64 years of age (34,591) are in the labor force, with 3.9% or 1,087 of them being unemployed. The group with the highest labor force participation rate are those with the educational attainment of bachelor's degree or higher, with 85.9% or 7,787 individuals in the labor force. Within the labor force, individuals with less than high school education have the highest percentage of unemployment, with 14.6% or 217 of them being unemployed.
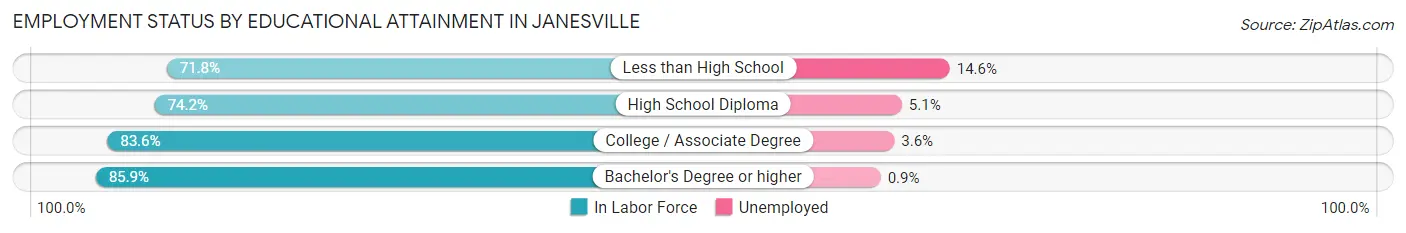
| Educational Attainment | In Labor Force | Unemployed |
| Less than High School | 1,483 (71.8%) | 301 (14.6%) |
| High School Diploma | 7,847 (74.2%) | 539 (5.1%) |
| College / Associate Degree | 10,773 (83.6%) | 464 (3.6%) |
| Bachelor's Degree or higher | 7,787 (85.9%) | 82 (0.9%) |
| Total | 27,880 (80.6%) | 1,349 (3.9%) |
Employment Occupations by Sex in Janesville
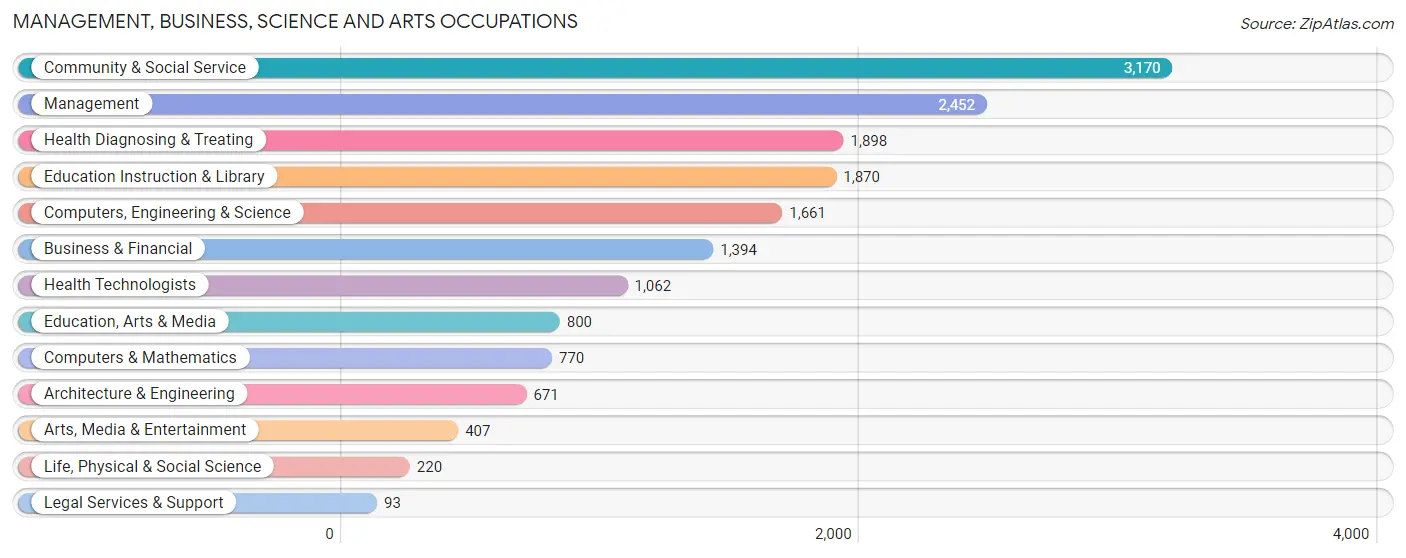
Management, Business, Science and Arts Occupations
The most common Management, Business, Science and Arts occupations in Janesville are Community & Social Service (3,170 | 9.6%), Management (2,452 | 7.4%), Health Diagnosing & Treating (1,898 | 5.7%), Education Instruction & Library (1,870 | 5.6%), and Computers, Engineering & Science (1,661 | 5.0%).
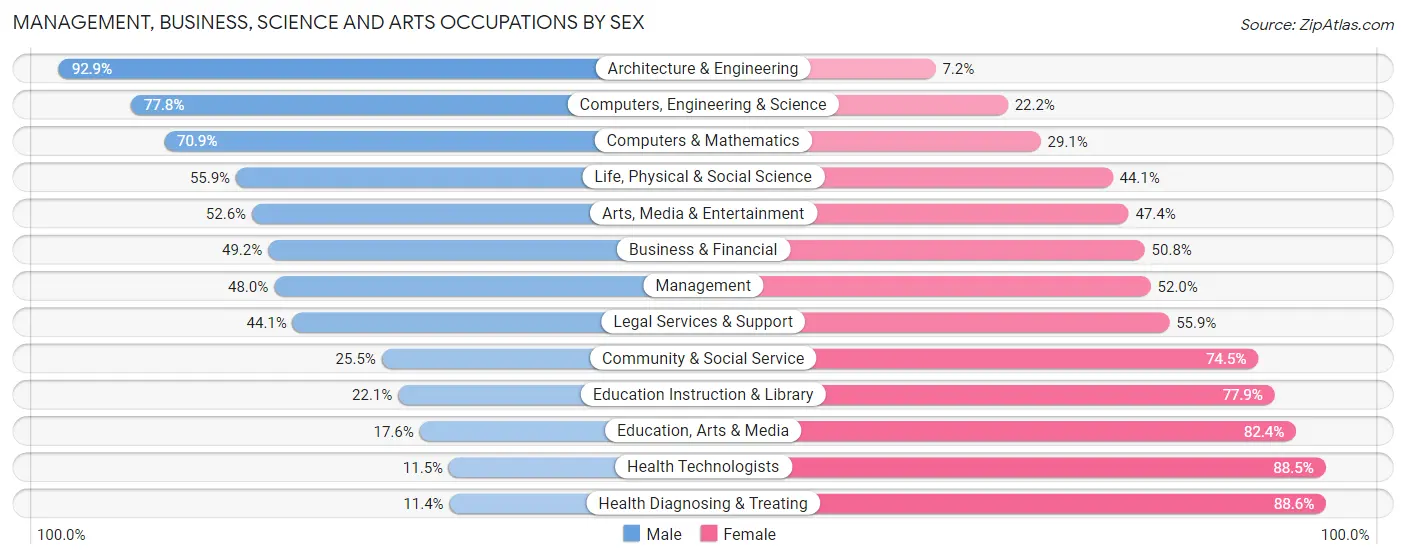
Management, Business, Science and Arts Occupations by Sex
Within the Management, Business, Science and Arts occupations in Janesville, the most male-oriented occupations are Architecture & Engineering (92.8%), Computers, Engineering & Science (77.8%), and Computers & Mathematics (70.9%), while the most female-oriented occupations are Health Diagnosing & Treating (88.6%), Health Technologists (88.5%), and Education, Arts & Media (82.4%).
| Occupation | Male | Female |
| Management | 1,176 (48.0%) | 1,276 (52.0%) |
| Business & Financial | 686 (49.2%) | 708 (50.8%) |
| Computers, Engineering & Science | 1,292 (77.8%) | 369 (22.2%) |
| Computers & Mathematics | 546 (70.9%) | 224 (29.1%) |
| Architecture & Engineering | 623 (92.8%) | 48 (7.1%) |
| Life, Physical & Social Science | 123 (55.9%) | 97 (44.1%) |
| Community & Social Service | 809 (25.5%) | 2,361 (74.5%) |
| Education, Arts & Media | 141 (17.6%) | 659 (82.4%) |
| Legal Services & Support | 41 (44.1%) | 52 (55.9%) |
| Education Instruction & Library | 413 (22.1%) | 1,457 (77.9%) |
| Arts, Media & Entertainment | 214 (52.6%) | 193 (47.4%) |
| Health Diagnosing & Treating | 216 (11.4%) | 1,682 (88.6%) |
| Health Technologists | 122 (11.5%) | 940 (88.5%) |
| Total (Category) | 4,179 (39.5%) | 6,396 (60.5%) |
| Total (Overall) | 17,269 (52.0%) | 15,933 (48.0%) |
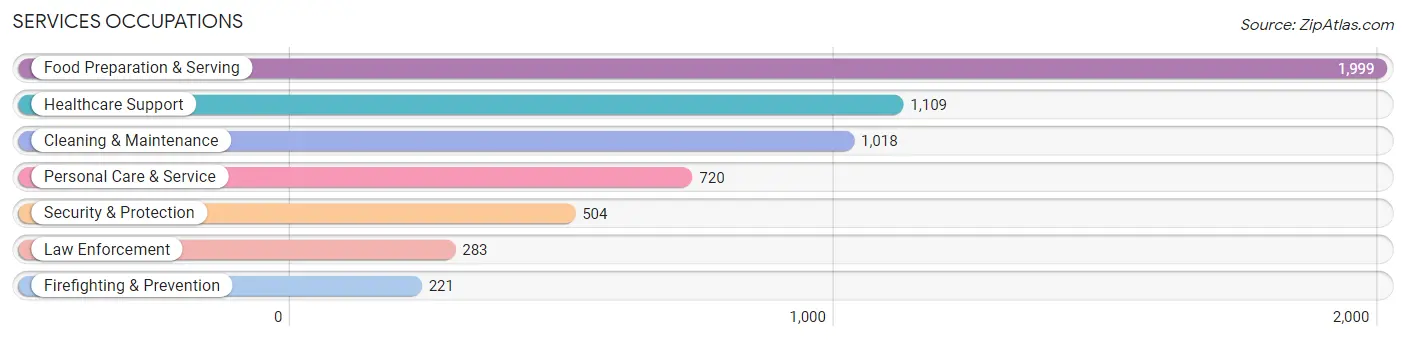
Services Occupations
The most common Services occupations in Janesville are Food Preparation & Serving (1,999 | 6.0%), Healthcare Support (1,109 | 3.3%), Cleaning & Maintenance (1,018 | 3.1%), Personal Care & Service (720 | 2.2%), and Security & Protection (504 | 1.5%).
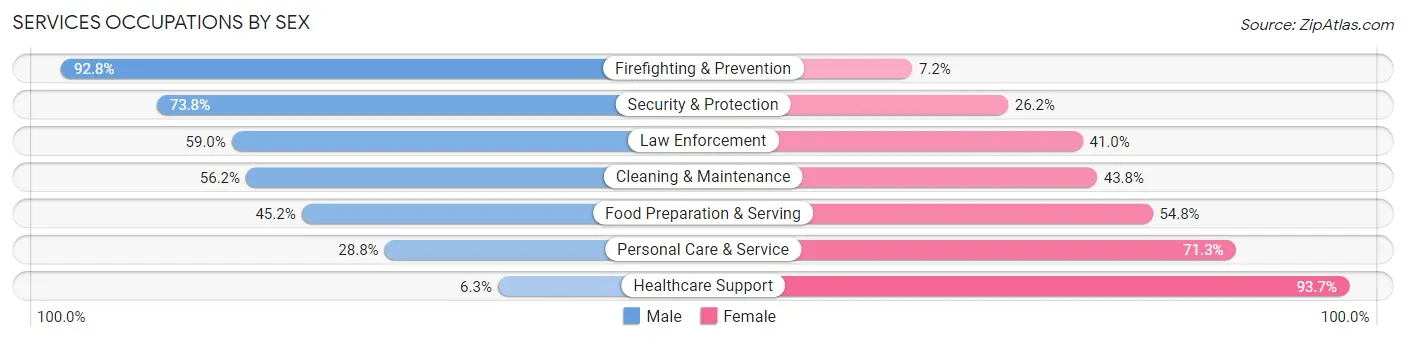
Services Occupations by Sex
Within the Services occupations in Janesville, the most male-oriented occupations are Firefighting & Prevention (92.8%), Security & Protection (73.8%), and Law Enforcement (59.0%), while the most female-oriented occupations are Healthcare Support (93.7%), Personal Care & Service (71.3%), and Food Preparation & Serving (54.8%).
| Occupation | Male | Female |
| Healthcare Support | 70 (6.3%) | 1,039 (93.7%) |
| Security & Protection | 372 (73.8%) | 132 (26.2%) |
| Firefighting & Prevention | 205 (92.8%) | 16 (7.2%) |
| Law Enforcement | 167 (59.0%) | 116 (41.0%) |
| Food Preparation & Serving | 903 (45.2%) | 1,096 (54.8%) |
| Cleaning & Maintenance | 572 (56.2%) | 446 (43.8%) |
| Personal Care & Service | 207 (28.7%) | 513 (71.3%) |
| Total (Category) | 2,124 (39.7%) | 3,226 (60.3%) |
| Total (Overall) | 17,269 (52.0%) | 15,933 (48.0%) |
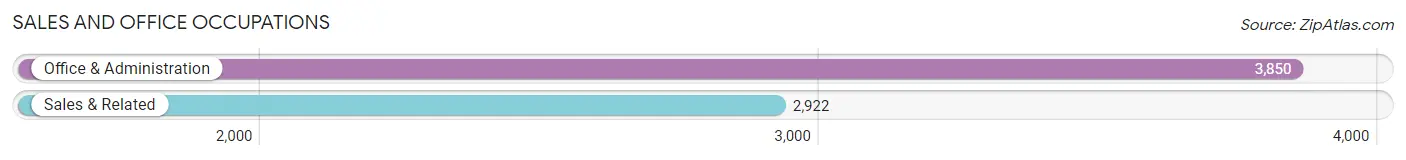
Sales and Office Occupations
The most common Sales and Office occupations in Janesville are Office & Administration (3,850 | 11.6%), and Sales & Related (2,922 | 8.8%).
Sales and Office Occupations by Sex
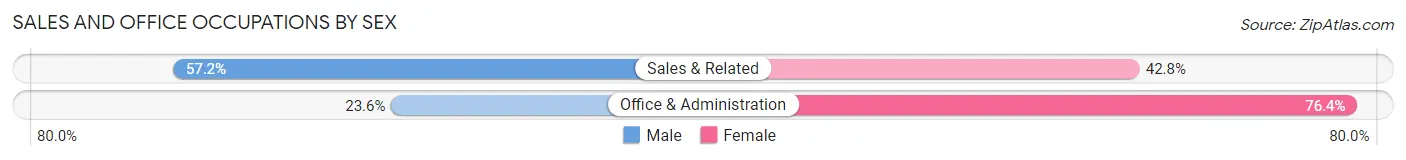
| Occupation | Male | Female |
| Sales & Related | 1,671 (57.2%) | 1,251 (42.8%) |
| Office & Administration | 908 (23.6%) | 2,942 (76.4%) |
| Total (Category) | 2,579 (38.1%) | 4,193 (61.9%) |
| Total (Overall) | 17,269 (52.0%) | 15,933 (48.0%) |
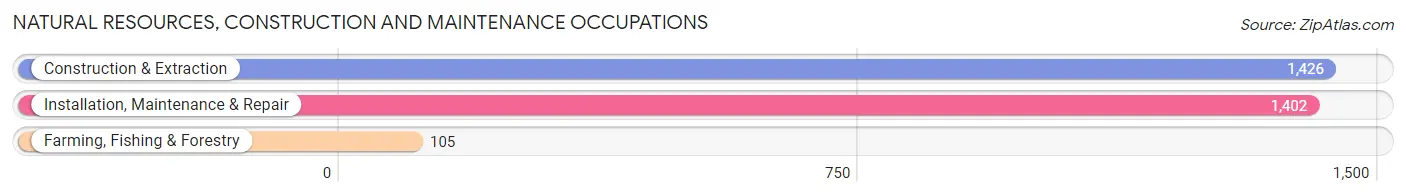
Natural Resources, Construction and Maintenance Occupations
The most common Natural Resources, Construction and Maintenance occupations in Janesville are Construction & Extraction (1,426 | 4.3%), Installation, Maintenance & Repair (1,402 | 4.2%), and Farming, Fishing & Forestry (105 | 0.3%).
Natural Resources, Construction and Maintenance Occupations by Sex
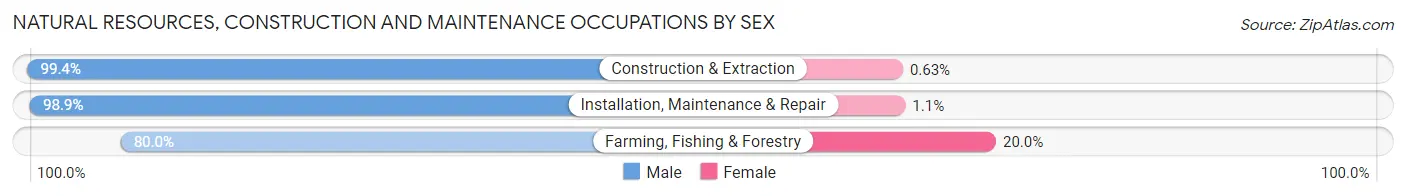
| Occupation | Male | Female |
| Farming, Fishing & Forestry | 84 (80.0%) | 21 (20.0%) |
| Construction & Extraction | 1,417 (99.4%) | 9 (0.6%) |
| Installation, Maintenance & Repair | 1,386 (98.9%) | 16 (1.1%) |
| Total (Category) | 2,887 (98.4%) | 46 (1.6%) |
| Total (Overall) | 17,269 (52.0%) | 15,933 (48.0%) |
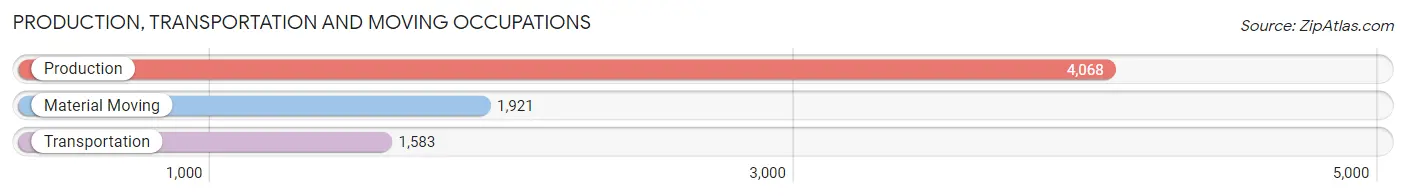
Production, Transportation and Moving Occupations
The most common Production, Transportation and Moving occupations in Janesville are Production (4,068 | 12.2%), Material Moving (1,921 | 5.8%), and Transportation (1,583 | 4.8%).
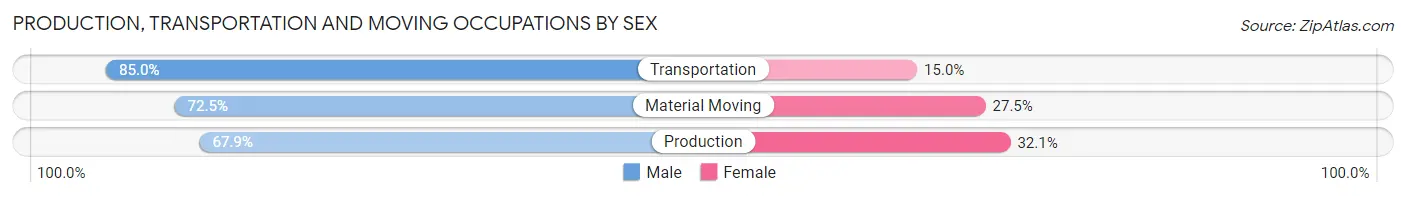
Production, Transportation and Moving Occupations by Sex
| Occupation | Male | Female |
| Production | 2,762 (67.9%) | 1,306 (32.1%) |
| Transportation | 1,346 (85.0%) | 237 (15.0%) |
| Material Moving | 1,392 (72.5%) | 529 (27.5%) |
| Total (Category) | 5,500 (72.6%) | 2,072 (27.4%) |
| Total (Overall) | 17,269 (52.0%) | 15,933 (48.0%) |
Employment Industries by Sex in Janesville
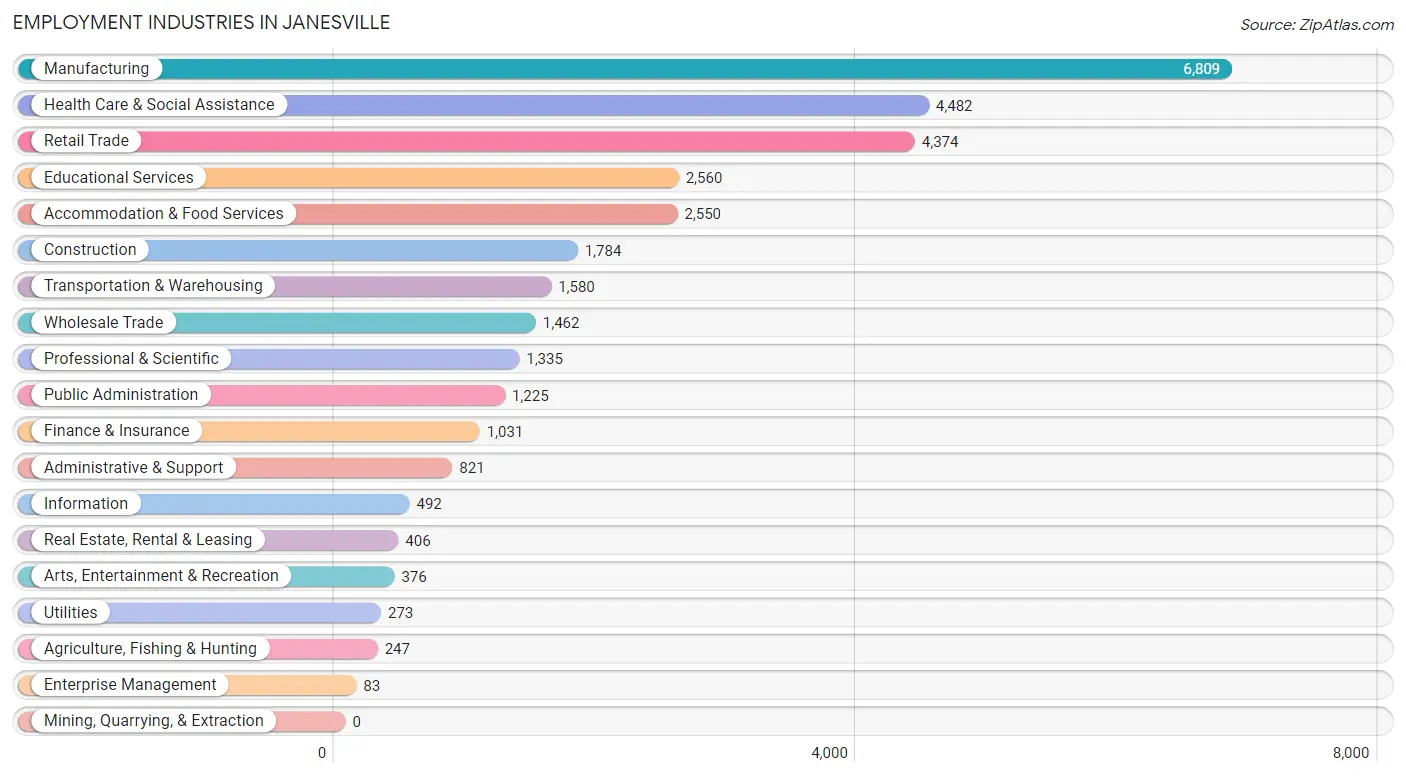
Employment Industries in Janesville
The major employment industries in Janesville include Manufacturing (6,809 | 20.5%), Health Care & Social Assistance (4,482 | 13.5%), Retail Trade (4,374 | 13.2%), Educational Services (2,560 | 7.7%), and Accommodation & Food Services (2,550 | 7.7%).
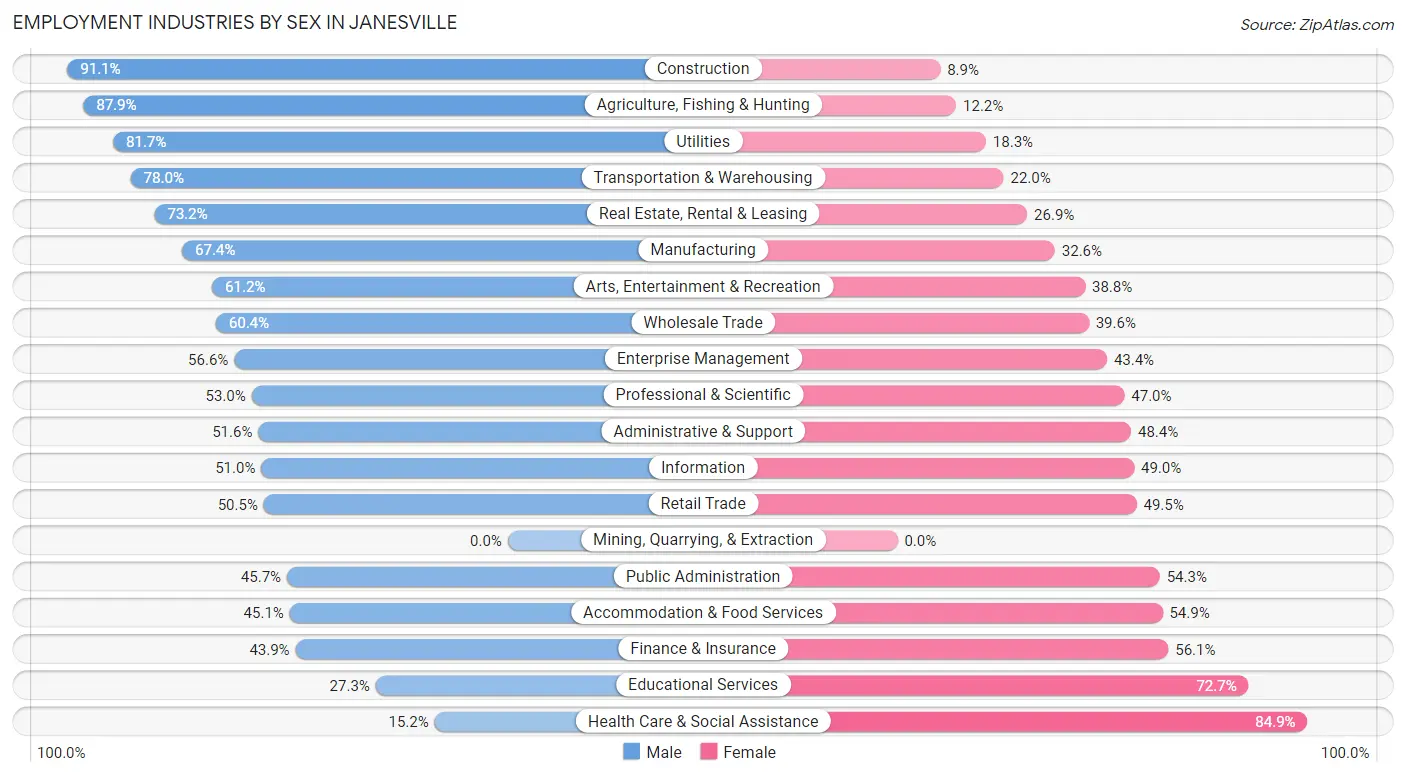
Employment Industries by Sex in Janesville
The Janesville industries that see more men than women are Construction (91.1%), Agriculture, Fishing & Hunting (87.8%), and Utilities (81.7%), whereas the industries that tend to have a higher number of women are Health Care & Social Assistance (84.9%), Educational Services (72.7%), and Finance & Insurance (56.1%).
| Industry | Male | Female |
| Agriculture, Fishing & Hunting | 217 (87.8%) | 30 (12.1%) |
| Mining, Quarrying, & Extraction | 0 (0.0%) | 0 (0.0%) |
| Construction | 1,626 (91.1%) | 158 (8.9%) |
| Manufacturing | 4,590 (67.4%) | 2,219 (32.6%) |
| Wholesale Trade | 883 (60.4%) | 579 (39.6%) |
| Retail Trade | 2,209 (50.5%) | 2,165 (49.5%) |
| Transportation & Warehousing | 1,233 (78.0%) | 347 (22.0%) |
| Utilities | 223 (81.7%) | 50 (18.3%) |
| Information | 251 (51.0%) | 241 (49.0%) |
| Finance & Insurance | 453 (43.9%) | 578 (56.1%) |
| Real Estate, Rental & Leasing | 297 (73.2%) | 109 (26.9%) |
| Professional & Scientific | 708 (53.0%) | 627 (47.0%) |
| Enterprise Management | 47 (56.6%) | 36 (43.4%) |
| Administrative & Support | 424 (51.6%) | 397 (48.4%) |
| Educational Services | 700 (27.3%) | 1,860 (72.7%) |
| Health Care & Social Assistance | 679 (15.1%) | 3,803 (84.9%) |
| Arts, Entertainment & Recreation | 230 (61.2%) | 146 (38.8%) |
| Accommodation & Food Services | 1,151 (45.1%) | 1,399 (54.9%) |
| Public Administration | 560 (45.7%) | 665 (54.3%) |
| Total | 17,269 (52.0%) | 15,933 (48.0%) |
Education in Janesville
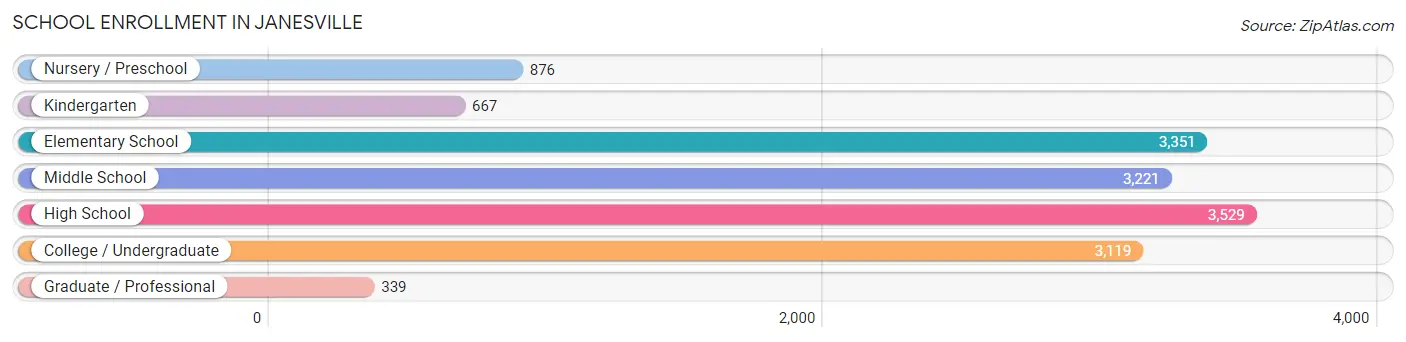
School Enrollment in Janesville
The most common levels of schooling among the 15,102 students in Janesville are high school (3,529 | 23.4%), elementary school (3,351 | 22.2%), and middle school (3,221 | 21.3%).
| School Level | # Students | % Students |
| Nursery / Preschool | 876 | 5.8% |
| Kindergarten | 667 | 4.4% |
| Elementary School | 3,351 | 22.2% |
| Middle School | 3,221 | 21.3% |
| High School | 3,529 | 23.4% |
| College / Undergraduate | 3,119 | 20.6% |
| Graduate / Professional | 339 | 2.2% |
| Total | 15,102 | 100.0% |
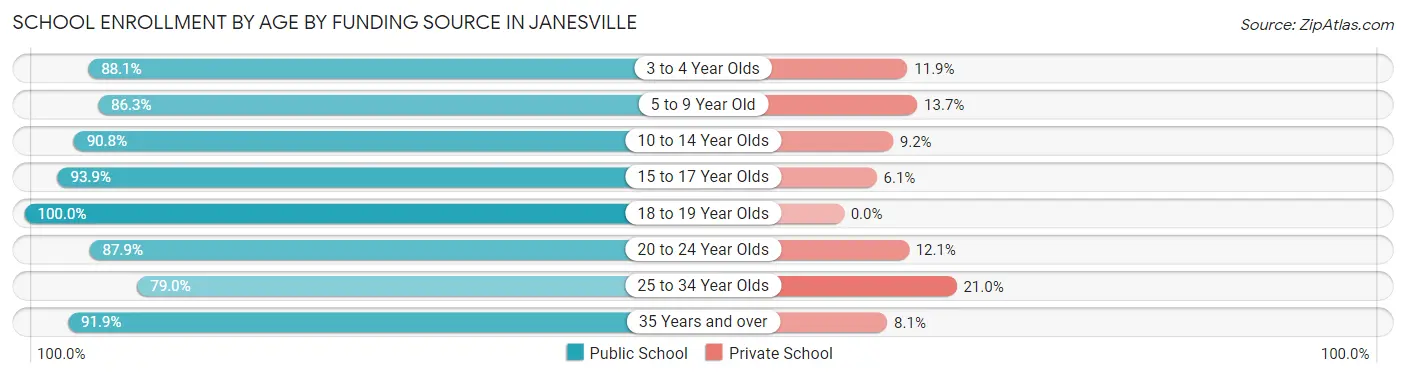
School Enrollment by Age by Funding Source in Janesville
Out of a total of 15,102 students who are enrolled in schools in Janesville, 1,571 (10.4%) attend a private institution, while the remaining 13,531 (89.6%) are enrolled in public schools. The age group of 25 to 34 year olds has the highest likelihood of being enrolled in private schools, with 175 (21.0% in the age bracket) enrolled. Conversely, the age group of 18 to 19 year olds has the lowest likelihood of being enrolled in a private school, with 860 (100.0% in the age bracket) attending a public institution.
| Age Bracket | Public School | Private School |
| 3 to 4 Year Olds | 327 (88.1%) | 44 (11.9%) |
| 5 to 9 Year Old | 3,576 (86.3%) | 567 (13.7%) |
| 10 to 14 Year Olds | 3,789 (90.8%) | 382 (9.2%) |
| 15 to 17 Year Olds | 2,340 (93.9%) | 153 (6.1%) |
| 18 to 19 Year Olds | 860 (100.0%) | 0 (0.0%) |
| 20 to 24 Year Olds | 1,386 (87.9%) | 191 (12.1%) |
| 25 to 34 Year Olds | 658 (79.0%) | 175 (21.0%) |
| 35 Years and over | 601 (91.9%) | 53 (8.1%) |
| Total | 13,531 (89.6%) | 1,571 (10.4%) |
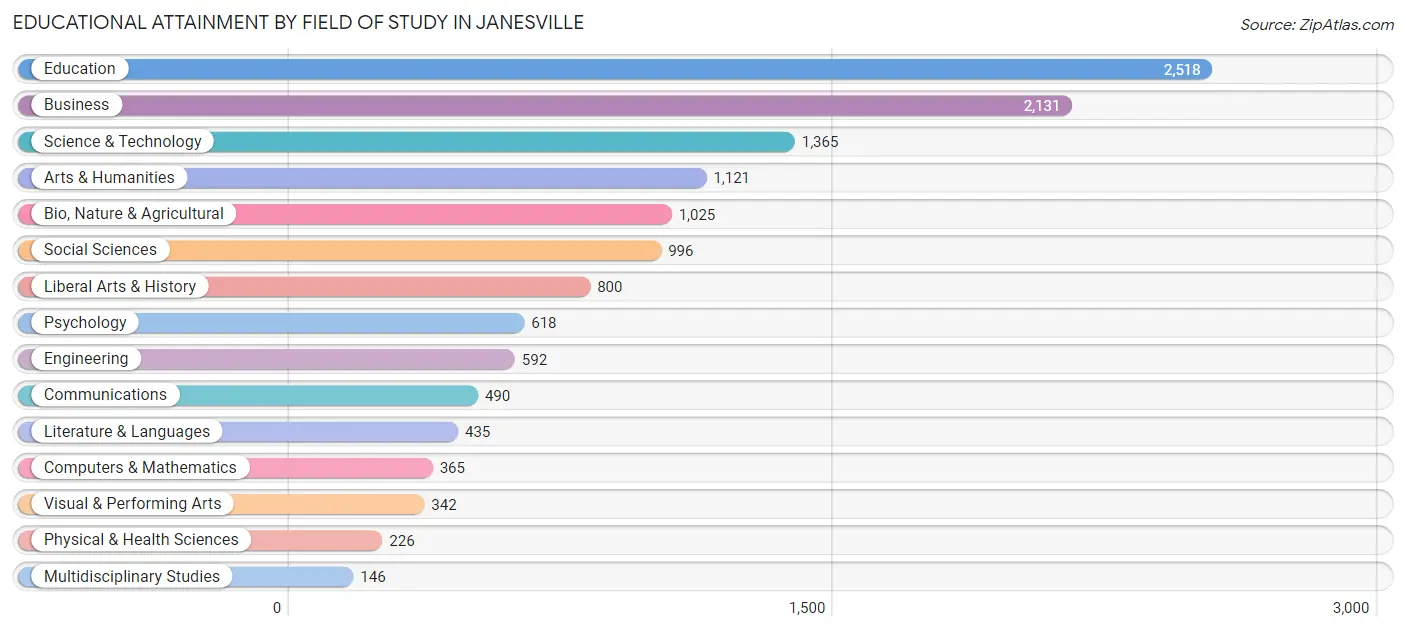
Educational Attainment by Field of Study in Janesville
Education (2,518 | 19.1%), business (2,131 | 16.2%), science & technology (1,365 | 10.4%), arts & humanities (1,121 | 8.5%), and bio, nature & agricultural (1,025 | 7.8%) are the most common fields of study among 13,170 individuals in Janesville who have obtained a bachelor's degree or higher.
| Field of Study | # Graduates | % Graduates |
| Computers & Mathematics | 365 | 2.8% |
| Bio, Nature & Agricultural | 1,025 | 7.8% |
| Physical & Health Sciences | 226 | 1.7% |
| Psychology | 618 | 4.7% |
| Social Sciences | 996 | 7.6% |
| Engineering | 592 | 4.5% |
| Multidisciplinary Studies | 146 | 1.1% |
| Science & Technology | 1,365 | 10.4% |
| Business | 2,131 | 16.2% |
| Education | 2,518 | 19.1% |
| Literature & Languages | 435 | 3.3% |
| Liberal Arts & History | 800 | 6.1% |
| Visual & Performing Arts | 342 | 2.6% |
| Communications | 490 | 3.7% |
| Arts & Humanities | 1,121 | 8.5% |
| Total | 13,170 | 100.0% |
Transportation & Commute in Janesville
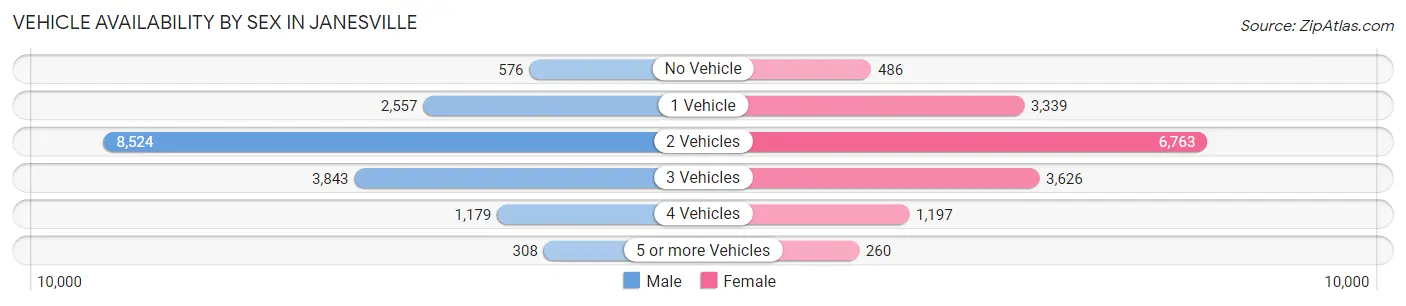
Vehicle Availability by Sex in Janesville
The most prevalent vehicle ownership categories in Janesville are males with 2 vehicles (8,524, accounting for 50.2%) and females with 2 vehicles (6,763, making up 54.4%).
| Vehicles Available | Male | Female |
| No Vehicle | 576 (3.4%) | 486 (3.1%) |
| 1 Vehicle | 2,557 (15.0%) | 3,339 (21.3%) |
| 2 Vehicles | 8,524 (50.2%) | 6,763 (43.2%) |
| 3 Vehicles | 3,843 (22.6%) | 3,626 (23.1%) |
| 4 Vehicles | 1,179 (6.9%) | 1,197 (7.6%) |
| 5 or more Vehicles | 308 (1.8%) | 260 (1.7%) |
| Total | 16,987 (100.0%) | 15,671 (100.0%) |
Commute Time in Janesville
The most frequently occuring commute durations in Janesville are 10 to 14 minutes (6,994 commuters, 22.9%), 15 to 19 minutes (5,195 commuters, 17.0%), and 5 to 9 minutes (4,918 commuters, 16.1%).
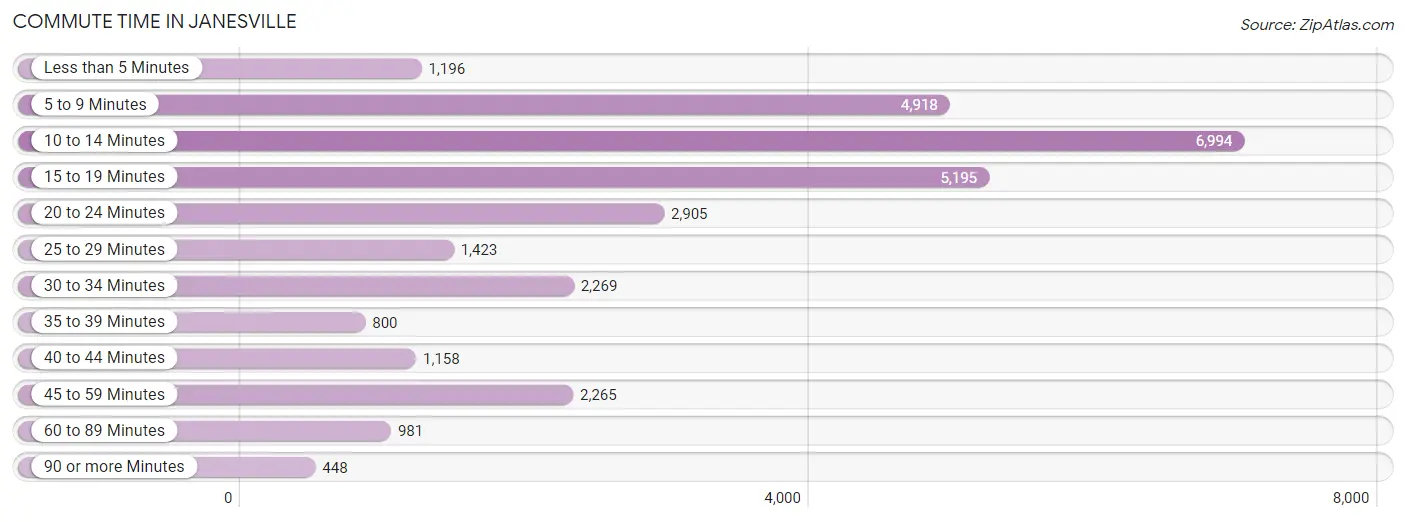
| Commute Time | # Commuters | % Commuters |
| Less than 5 Minutes | 1,196 | 3.9% |
| 5 to 9 Minutes | 4,918 | 16.1% |
| 10 to 14 Minutes | 6,994 | 22.9% |
| 15 to 19 Minutes | 5,195 | 17.0% |
| 20 to 24 Minutes | 2,905 | 9.5% |
| 25 to 29 Minutes | 1,423 | 4.7% |
| 30 to 34 Minutes | 2,269 | 7.4% |
| 35 to 39 Minutes | 800 | 2.6% |
| 40 to 44 Minutes | 1,158 | 3.8% |
| 45 to 59 Minutes | 2,265 | 7.4% |
| 60 to 89 Minutes | 981 | 3.2% |
| 90 or more Minutes | 448 | 1.5% |
Commute Time by Sex in Janesville
The most common commute times in Janesville are 10 to 14 minutes (3,365 commuters, 21.0%) for males and 10 to 14 minutes (3,629 commuters, 24.9%) for females.
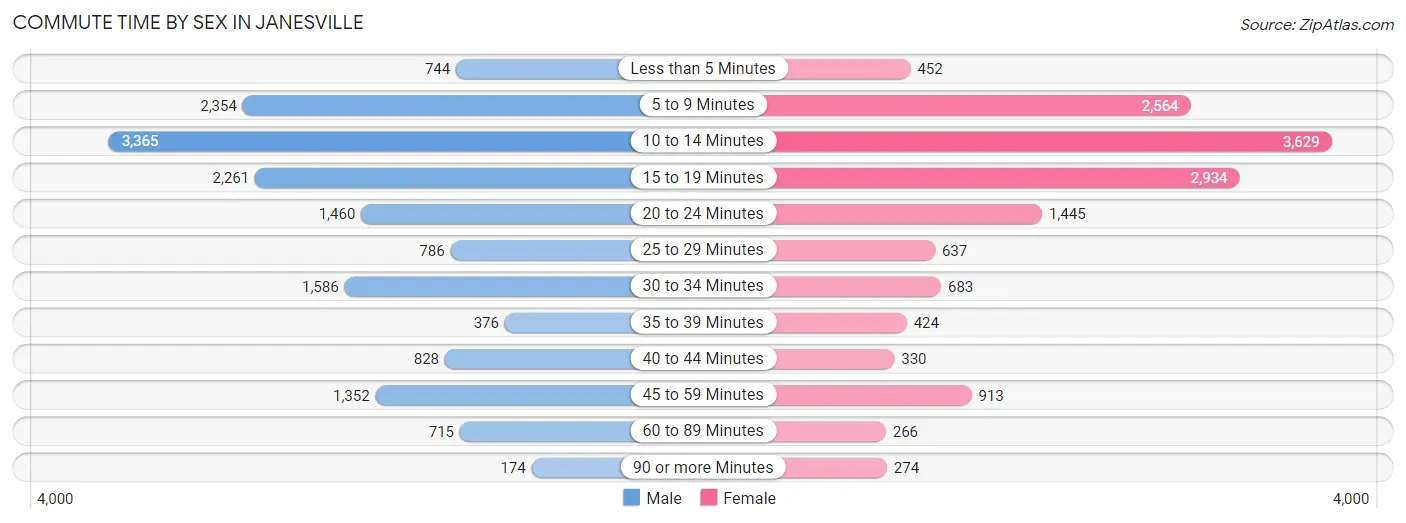
| Commute Time | Male | Female |
| Less than 5 Minutes | 744 (4.6%) | 452 (3.1%) |
| 5 to 9 Minutes | 2,354 (14.7%) | 2,564 (17.6%) |
| 10 to 14 Minutes | 3,365 (21.0%) | 3,629 (24.9%) |
| 15 to 19 Minutes | 2,261 (14.1%) | 2,934 (20.2%) |
| 20 to 24 Minutes | 1,460 (9.1%) | 1,445 (9.9%) |
| 25 to 29 Minutes | 786 (4.9%) | 637 (4.4%) |
| 30 to 34 Minutes | 1,586 (9.9%) | 683 (4.7%) |
| 35 to 39 Minutes | 376 (2.4%) | 424 (2.9%) |
| 40 to 44 Minutes | 828 (5.2%) | 330 (2.3%) |
| 45 to 59 Minutes | 1,352 (8.5%) | 913 (6.3%) |
| 60 to 89 Minutes | 715 (4.5%) | 266 (1.8%) |
| 90 or more Minutes | 174 (1.1%) | 274 (1.9%) |
Time of Departure to Work by Sex in Janesville
The most frequent times of departure to work in Janesville are 5:30 AM to 5:59 AM (1,693, 10.6%) for males and 7:30 AM to 7:59 AM (2,607, 17.9%) for females.
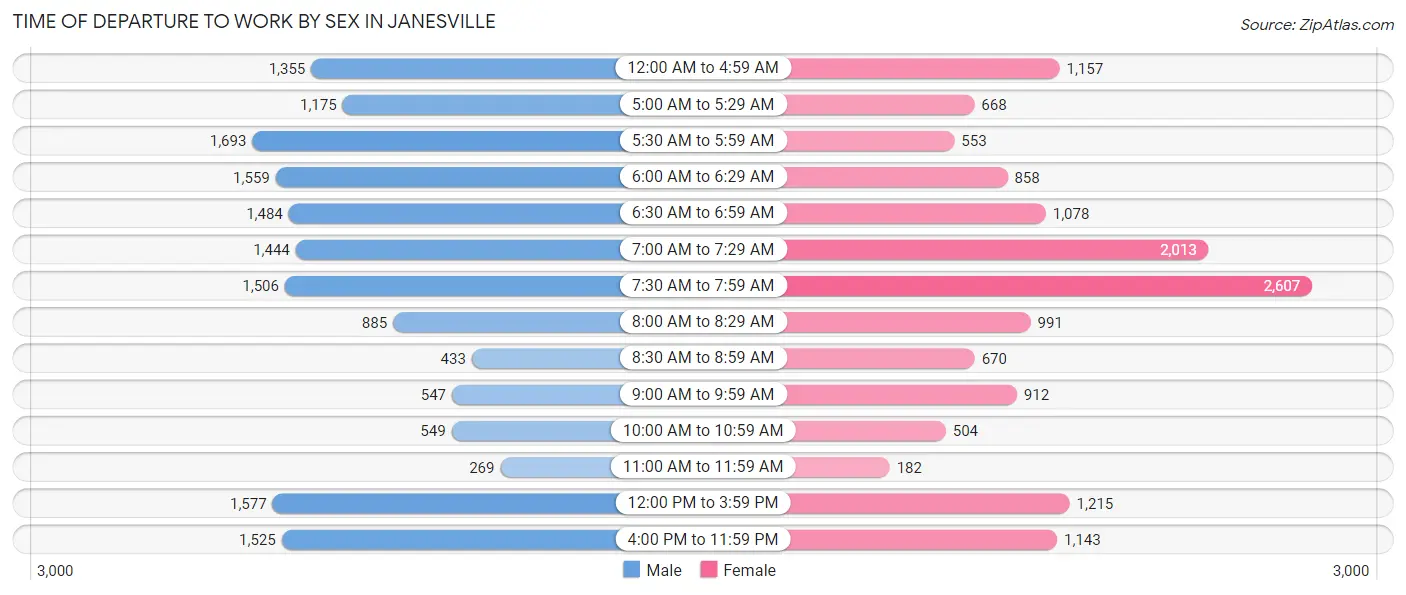
| Time of Departure | Male | Female |
| 12:00 AM to 4:59 AM | 1,355 (8.5%) | 1,157 (8.0%) |
| 5:00 AM to 5:29 AM | 1,175 (7.3%) | 668 (4.6%) |
| 5:30 AM to 5:59 AM | 1,693 (10.6%) | 553 (3.8%) |
| 6:00 AM to 6:29 AM | 1,559 (9.7%) | 858 (5.9%) |
| 6:30 AM to 6:59 AM | 1,484 (9.3%) | 1,078 (7.4%) |
| 7:00 AM to 7:29 AM | 1,444 (9.0%) | 2,013 (13.8%) |
| 7:30 AM to 7:59 AM | 1,506 (9.4%) | 2,607 (17.9%) |
| 8:00 AM to 8:29 AM | 885 (5.5%) | 991 (6.8%) |
| 8:30 AM to 8:59 AM | 433 (2.7%) | 670 (4.6%) |
| 9:00 AM to 9:59 AM | 547 (3.4%) | 912 (6.3%) |
| 10:00 AM to 10:59 AM | 549 (3.4%) | 504 (3.5%) |
| 11:00 AM to 11:59 AM | 269 (1.7%) | 182 (1.3%) |
| 12:00 PM to 3:59 PM | 1,577 (9.9%) | 1,215 (8.4%) |
| 4:00 PM to 11:59 PM | 1,525 (9.5%) | 1,143 (7.9%) |
| Total | 16,001 (100.0%) | 14,551 (100.0%) |
Housing Occupancy in Janesville
Occupancy by Ownership in Janesville
Of the total 27,895 dwellings in Janesville, owner-occupied units account for 18,532 (66.4%), while renter-occupied units make up 9,363 (33.6%).
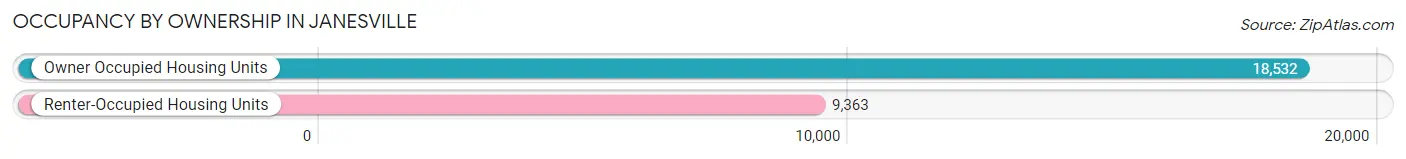
| Occupancy | # Housing Units | % Housing Units |
| Owner Occupied Housing Units | 18,532 | 66.4% |
| Renter-Occupied Housing Units | 9,363 | 33.6% |
| Total Occupied Housing Units | 27,895 | 100.0% |
Occupancy by Household Size in Janesville
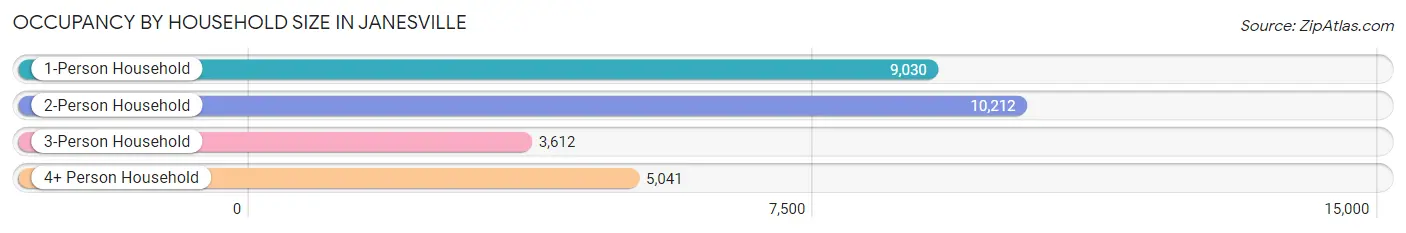
| Household Size | # Housing Units | % Housing Units |
| 1-Person Household | 9,030 | 32.4% |
| 2-Person Household | 10,212 | 36.6% |
| 3-Person Household | 3,612 | 13.0% |
| 4+ Person Household | 5,041 | 18.1% |
| Total Housing Units | 27,895 | 100.0% |
Occupancy by Ownership by Household Size in Janesville
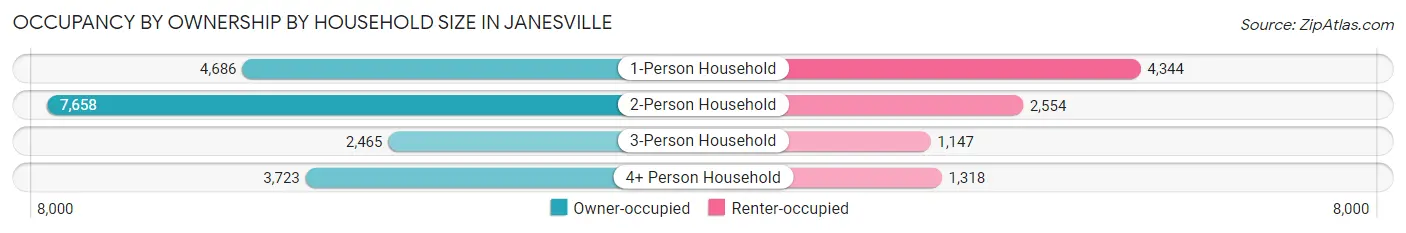
| Household Size | Owner-occupied | Renter-occupied |
| 1-Person Household | 4,686 (51.9%) | 4,344 (48.1%) |
| 2-Person Household | 7,658 (75.0%) | 2,554 (25.0%) |
| 3-Person Household | 2,465 (68.2%) | 1,147 (31.8%) |
| 4+ Person Household | 3,723 (73.9%) | 1,318 (26.2%) |
| Total Housing Units | 18,532 (66.4%) | 9,363 (33.6%) |
Occupancy by Educational Attainment in Janesville
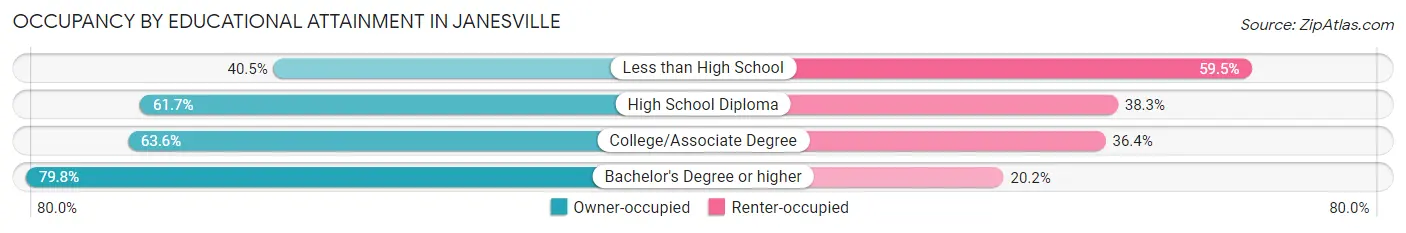
| Household Size | Owner-occupied | Renter-occupied |
| Less than High School | 549 (40.5%) | 806 (59.5%) |
| High School Diploma | 5,026 (61.7%) | 3,124 (38.3%) |
| College/Associate Degree | 6,756 (63.6%) | 3,863 (36.4%) |
| Bachelor's Degree or higher | 6,201 (79.8%) | 1,570 (20.2%) |
Occupancy by Age of Householder in Janesville
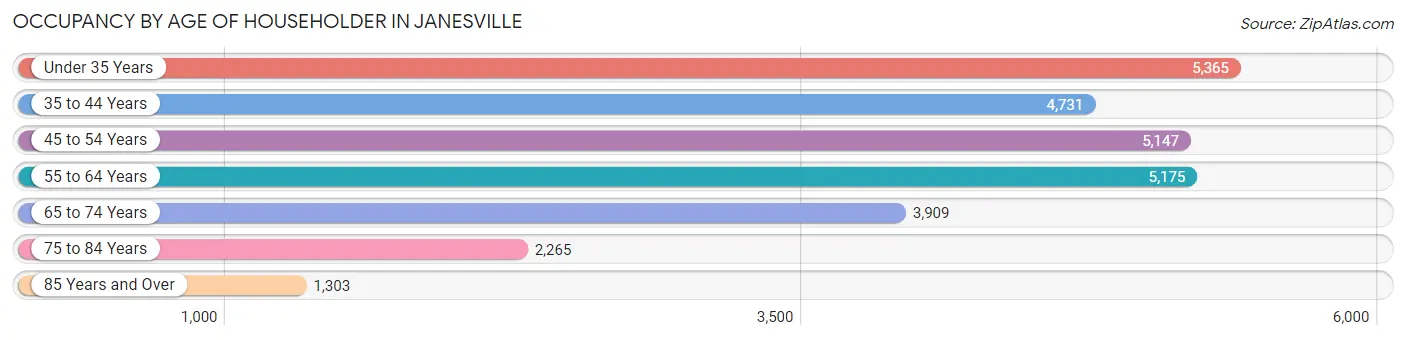
| Age Bracket | # Households | % Households |
| Under 35 Years | 5,365 | 19.2% |
| 35 to 44 Years | 4,731 | 17.0% |
| 45 to 54 Years | 5,147 | 18.4% |
| 55 to 64 Years | 5,175 | 18.5% |
| 65 to 74 Years | 3,909 | 14.0% |
| 75 to 84 Years | 2,265 | 8.1% |
| 85 Years and Over | 1,303 | 4.7% |
| Total | 27,895 | 100.0% |
Housing Finances in Janesville
Median Income by Occupancy in Janesville
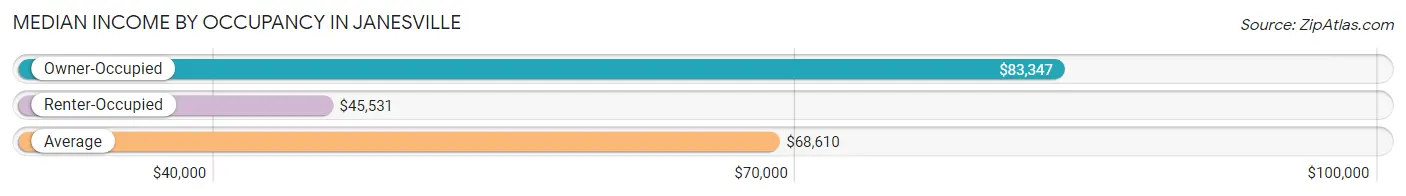
| Occupancy Type | # Households | Median Income |
| Owner-Occupied | 18,532 (66.4%) | $83,347 |
| Renter-Occupied | 9,363 (33.6%) | $45,531 |
| Average | 27,895 (100.0%) | $68,610 |
Occupancy by Householder Income Bracket in Janesville
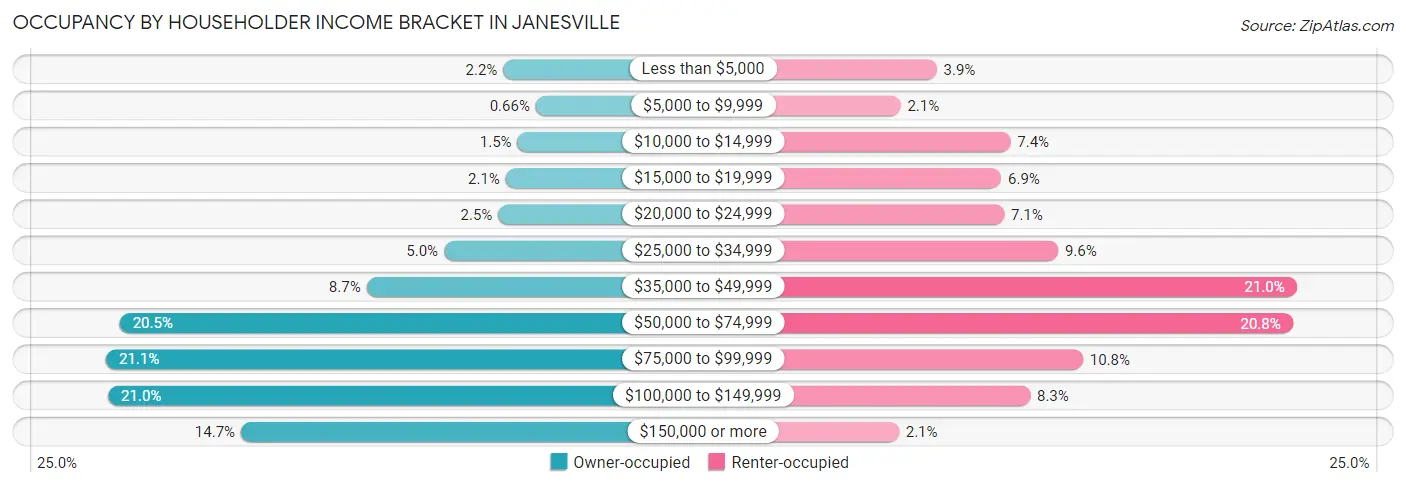
| Income Bracket | Owner-occupied | Renter-occupied |
| Less than $5,000 | 409 (2.2%) | 361 (3.9%) |
| $5,000 to $9,999 | 122 (0.7%) | 200 (2.1%) |
| $10,000 to $14,999 | 283 (1.5%) | 690 (7.4%) |
| $15,000 to $19,999 | 387 (2.1%) | 649 (6.9%) |
| $20,000 to $24,999 | 454 (2.5%) | 662 (7.1%) |
| $25,000 to $34,999 | 933 (5.0%) | 903 (9.6%) |
| $35,000 to $49,999 | 1,616 (8.7%) | 1,966 (21.0%) |
| $50,000 to $74,999 | 3,793 (20.5%) | 1,948 (20.8%) |
| $75,000 to $99,999 | 3,914 (21.1%) | 1,013 (10.8%) |
| $100,000 to $149,999 | 3,896 (21.0%) | 778 (8.3%) |
| $150,000 or more | 2,725 (14.7%) | 193 (2.1%) |
| Total | 18,532 (100.0%) | 9,363 (100.0%) |
Monthly Housing Cost Tiers in Janesville
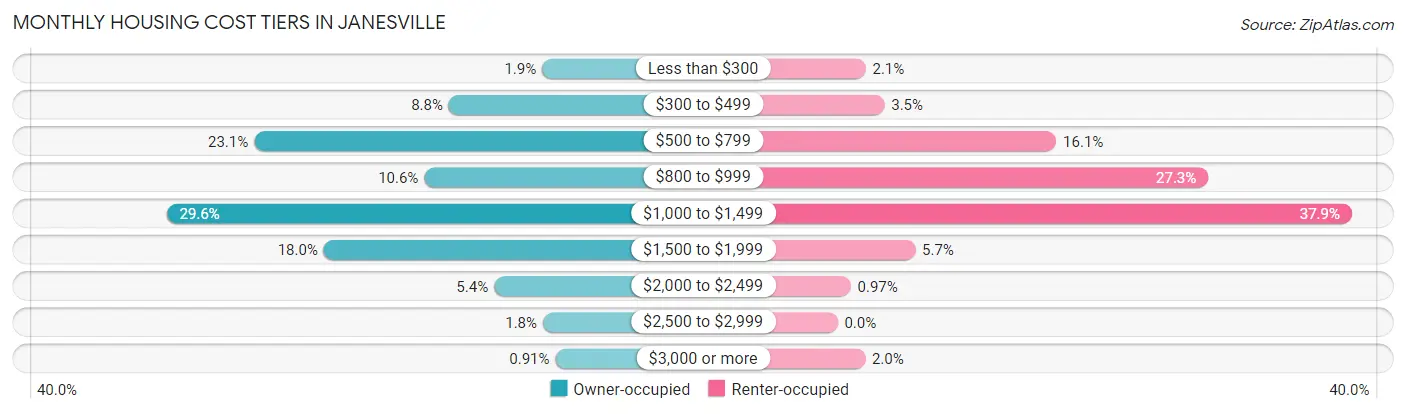
| Monthly Cost | Owner-occupied | Renter-occupied |
| Less than $300 | 351 (1.9%) | 194 (2.1%) |
| $300 to $499 | 1,623 (8.8%) | 323 (3.5%) |
| $500 to $799 | 4,280 (23.1%) | 1,508 (16.1%) |
| $800 to $999 | 1,958 (10.6%) | 2,556 (27.3%) |
| $1,000 to $1,499 | 5,477 (29.5%) | 3,547 (37.9%) |
| $1,500 to $1,999 | 3,330 (18.0%) | 536 (5.7%) |
| $2,000 to $2,499 | 1,006 (5.4%) | 91 (1.0%) |
| $2,500 to $2,999 | 339 (1.8%) | 0 (0.0%) |
| $3,000 or more | 168 (0.9%) | 190 (2.0%) |
| Total | 18,532 (100.0%) | 9,363 (100.0%) |
Physical Housing Characteristics in Janesville
Housing Structures in Janesville
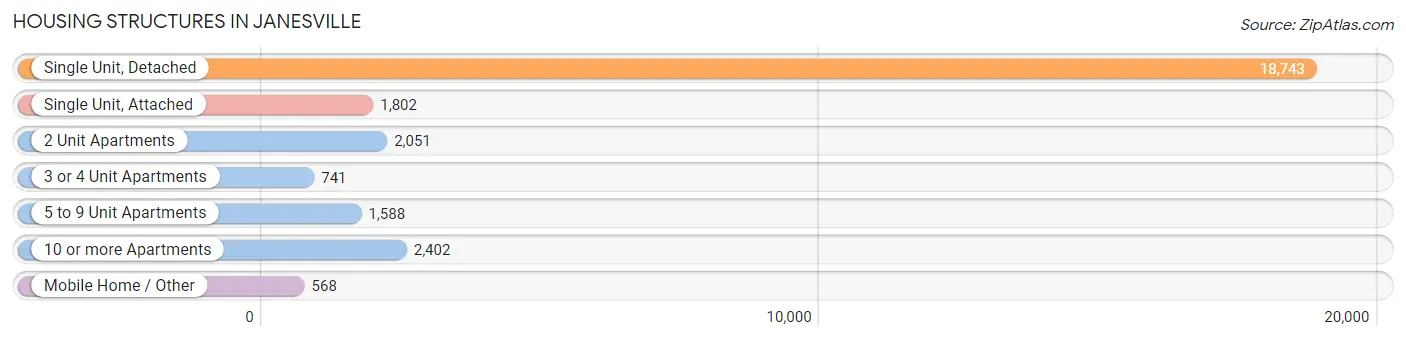
| Structure Type | # Housing Units | % Housing Units |
| Single Unit, Detached | 18,743 | 67.2% |
| Single Unit, Attached | 1,802 | 6.5% |
| 2 Unit Apartments | 2,051 | 7.3% |
| 3 or 4 Unit Apartments | 741 | 2.7% |
| 5 to 9 Unit Apartments | 1,588 | 5.7% |
| 10 or more Apartments | 2,402 | 8.6% |
| Mobile Home / Other | 568 | 2.0% |
| Total | 27,895 | 100.0% |
Housing Structures by Occupancy in Janesville
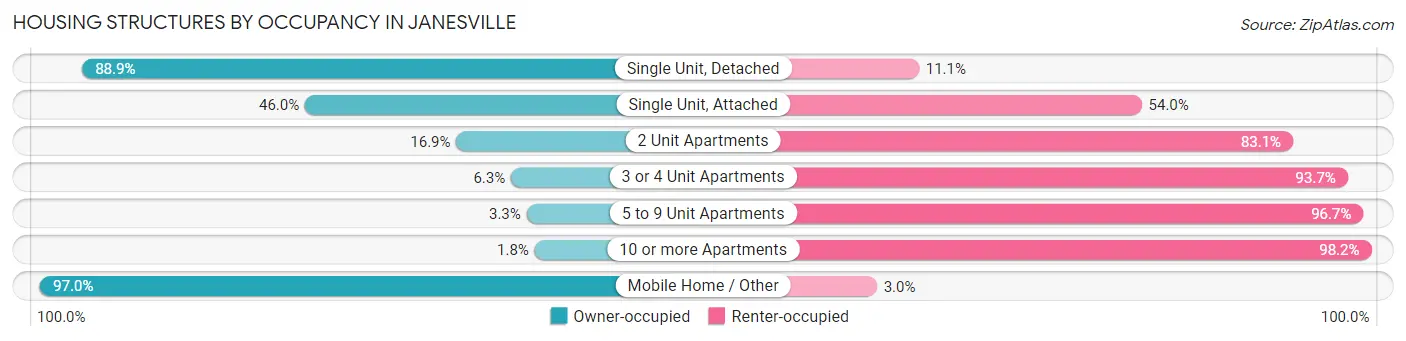
| Structure Type | Owner-occupied | Renter-occupied |
| Single Unit, Detached | 16,663 (88.9%) | 2,080 (11.1%) |
| Single Unit, Attached | 829 (46.0%) | 973 (54.0%) |
| 2 Unit Apartments | 346 (16.9%) | 1,705 (83.1%) |
| 3 or 4 Unit Apartments | 47 (6.3%) | 694 (93.7%) |
| 5 to 9 Unit Apartments | 53 (3.3%) | 1,535 (96.7%) |
| 10 or more Apartments | 43 (1.8%) | 2,359 (98.2%) |
| Mobile Home / Other | 551 (97.0%) | 17 (3.0%) |
| Total | 18,532 (66.4%) | 9,363 (33.6%) |
Housing Structures by Number of Rooms in Janesville
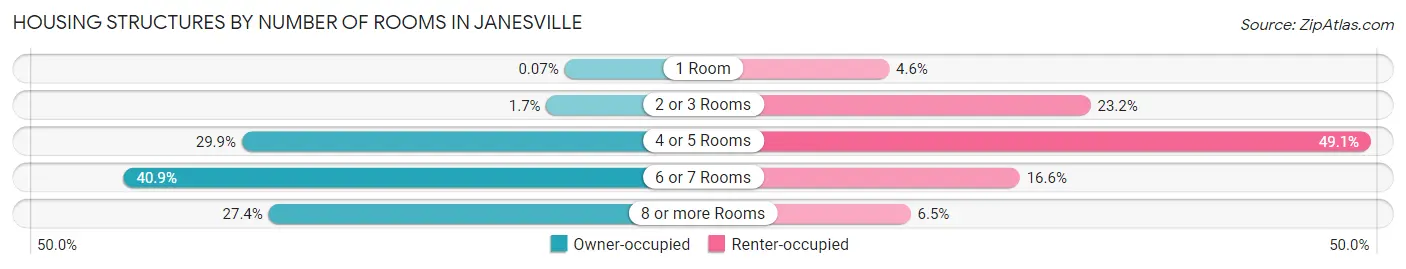
| Number of Rooms | Owner-occupied | Renter-occupied |
| 1 Room | 13 (0.1%) | 426 (4.5%) |
| 2 or 3 Rooms | 323 (1.7%) | 2,170 (23.2%) |
| 4 or 5 Rooms | 5,542 (29.9%) | 4,598 (49.1%) |
| 6 or 7 Rooms | 7,570 (40.8%) | 1,557 (16.6%) |
| 8 or more Rooms | 5,084 (27.4%) | 612 (6.5%) |
| Total | 18,532 (100.0%) | 9,363 (100.0%) |
Housing Structure by Heating Type in Janesville
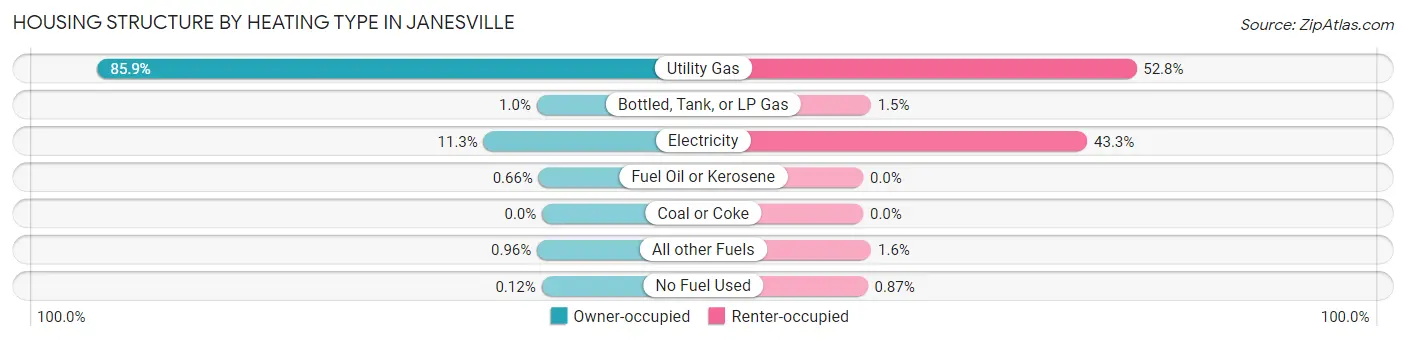
| Heating Type | Owner-occupied | Renter-occupied |
| Utility Gas | 15,922 (85.9%) | 4,944 (52.8%) |
| Bottled, Tank, or LP Gas | 192 (1.0%) | 139 (1.5%) |
| Electricity | 2,095 (11.3%) | 4,054 (43.3%) |
| Fuel Oil or Kerosene | 122 (0.7%) | 0 (0.0%) |
| Coal or Coke | 0 (0.0%) | 0 (0.0%) |
| All other Fuels | 178 (1.0%) | 145 (1.5%) |
| No Fuel Used | 23 (0.1%) | 81 (0.9%) |
| Total | 18,532 (100.0%) | 9,363 (100.0%) |
Household Vehicle Usage in Janesville
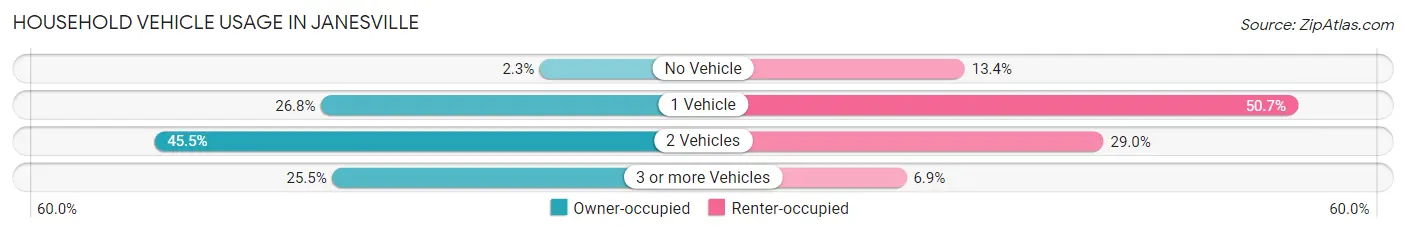
| Vehicles per Household | Owner-occupied | Renter-occupied |
| No Vehicle | 419 (2.3%) | 1,257 (13.4%) |
| 1 Vehicle | 4,960 (26.8%) | 4,749 (50.7%) |
| 2 Vehicles | 8,428 (45.5%) | 2,712 (29.0%) |
| 3 or more Vehicles | 4,725 (25.5%) | 645 (6.9%) |
| Total | 18,532 (100.0%) | 9,363 (100.0%) |
Real Estate & Mortgages in Janesville
Real Estate and Mortgage Overview in Janesville
| Characteristic | Without Mortgage | With Mortgage |
| Housing Units | 7,119 | 11,413 |
| Median Property Value | $179,300 | $189,800 |
| Median Household Income | $64,720 | $1,958 |
| Monthly Housing Costs | $595 | $168 |
| Real Estate Taxes | $3,466 | $37 |
Property Value by Mortgage Status in Janesville
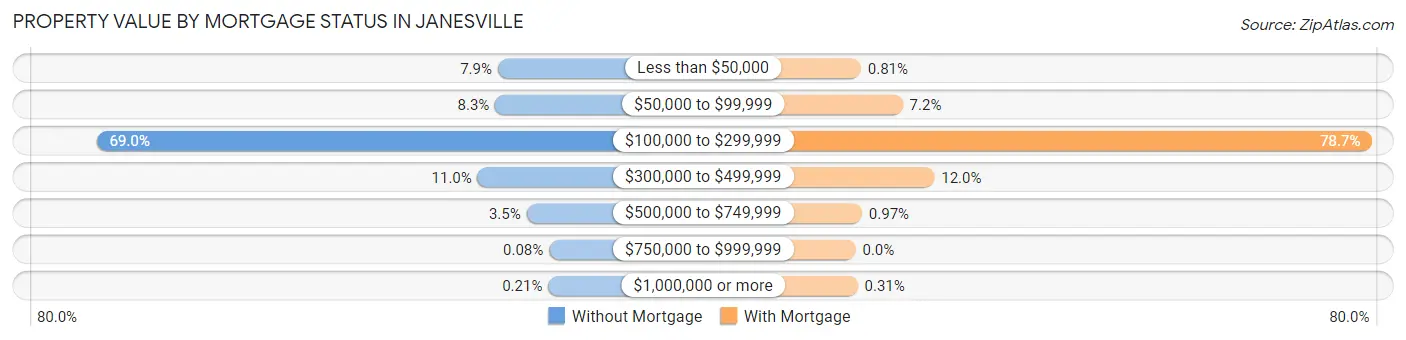
| Property Value | Without Mortgage | With Mortgage |
| Less than $50,000 | 562 (7.9%) | 93 (0.8%) |
| $50,000 to $99,999 | 590 (8.3%) | 819 (7.2%) |
| $100,000 to $299,999 | 4,915 (69.0%) | 8,986 (78.7%) |
| $300,000 to $499,999 | 781 (11.0%) | 1,369 (12.0%) |
| $500,000 to $749,999 | 250 (3.5%) | 111 (1.0%) |
| $750,000 to $999,999 | 6 (0.1%) | 0 (0.0%) |
| $1,000,000 or more | 15 (0.2%) | 35 (0.3%) |
| Total | 7,119 (100.0%) | 11,413 (100.0%) |
Household Income by Mortgage Status in Janesville
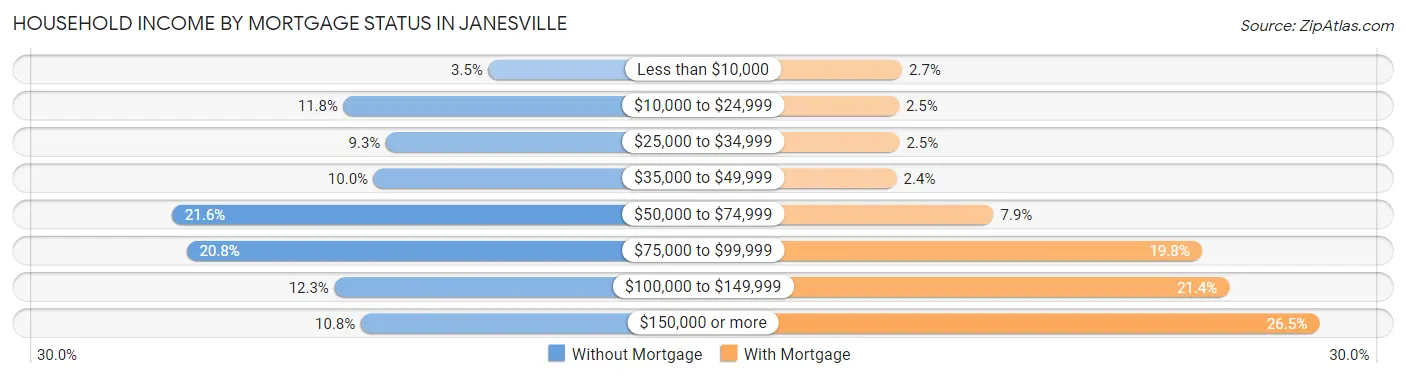
| Household Income | Without Mortgage | With Mortgage |
| Less than $10,000 | 248 (3.5%) | 304 (2.7%) |
| $10,000 to $24,999 | 837 (11.8%) | 283 (2.5%) |
| $25,000 to $34,999 | 665 (9.3%) | 287 (2.5%) |
| $35,000 to $49,999 | 715 (10.0%) | 268 (2.4%) |
| $50,000 to $74,999 | 1,536 (21.6%) | 901 (7.9%) |
| $75,000 to $99,999 | 1,477 (20.7%) | 2,257 (19.8%) |
| $100,000 to $149,999 | 874 (12.3%) | 2,437 (21.3%) |
| $150,000 or more | 767 (10.8%) | 3,022 (26.5%) |
| Total | 7,119 (100.0%) | 11,413 (100.0%) |
Property Value to Household Income Ratio in Janesville
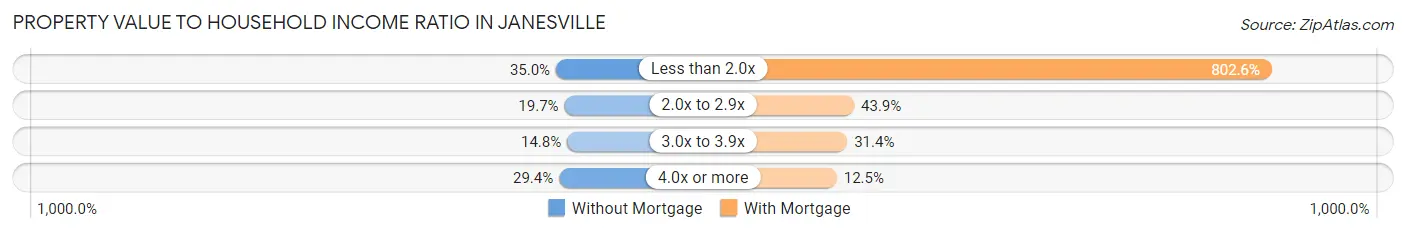
| Value-to-Income Ratio | Without Mortgage | With Mortgage |
| Less than 2.0x | 2,492 (35.0%) | 91,599 (802.6%) |
| 2.0x to 2.9x | 1,401 (19.7%) | 5,013 (43.9%) |
| 3.0x to 3.9x | 1,055 (14.8%) | 3,588 (31.4%) |
| 4.0x or more | 2,091 (29.4%) | 1,431 (12.5%) |
| Total | 7,119 (100.0%) | 11,413 (100.0%) |
Real Estate Taxes by Mortgage Status in Janesville

| Property Taxes | Without Mortgage | With Mortgage |
| Less than $800 | 200 (2.8%) | 62 (0.5%) |
| $800 to $1,499 | 289 (4.1%) | 57 (0.5%) |
| $800 to $1,499 | 6,205 (87.2%) | 407 (3.6%) |
| Total | 7,119 (100.0%) | 11,413 (100.0%) |
Health & Disability in Janesville
Health Insurance Coverage by Age in Janesville
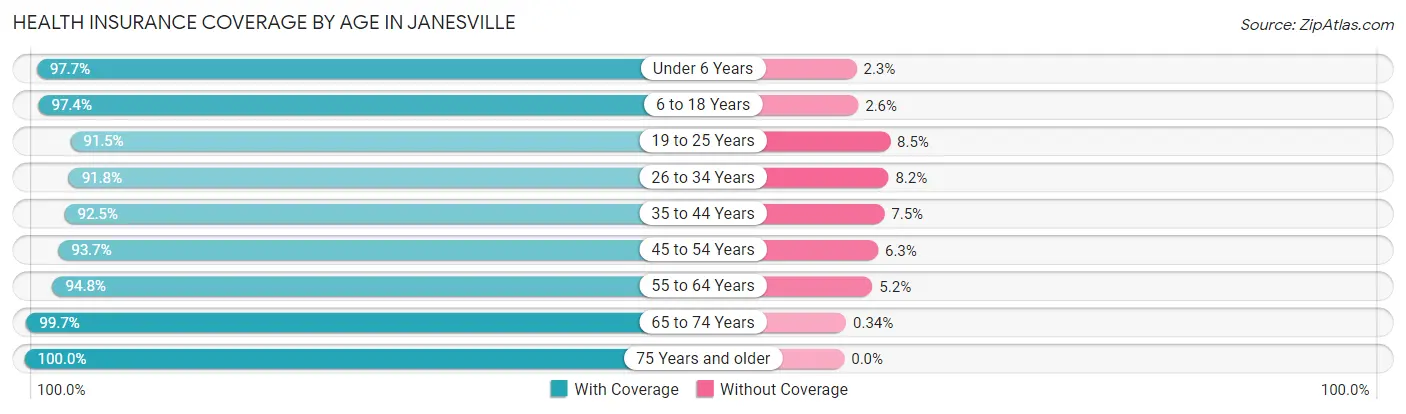
| Age Bracket | With Coverage | Without Coverage |
| Under 6 Years | 4,330 (97.7%) | 101 (2.3%) |
| 6 to 18 Years | 10,429 (97.4%) | 279 (2.6%) |
| 19 to 25 Years | 5,142 (91.5%) | 480 (8.5%) |
| 26 to 34 Years | 6,904 (91.8%) | 620 (8.2%) |
| 35 to 44 Years | 8,480 (92.5%) | 685 (7.5%) |
| 45 to 54 Years | 7,733 (93.7%) | 519 (6.3%) |
| 55 to 64 Years | 8,122 (94.8%) | 449 (5.2%) |
| 65 to 74 Years | 6,237 (99.7%) | 21 (0.3%) |
| 75 Years and older | 4,581 (100.0%) | 0 (0.0%) |
| Total | 61,958 (95.2%) | 3,154 (4.8%) |
Health Insurance Coverage by Citizenship Status in Janesville
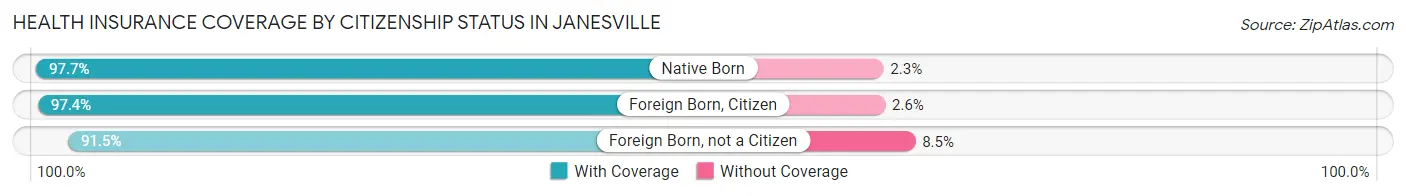
| Citizenship Status | With Coverage | Without Coverage |
| Native Born | 4,330 (97.7%) | 101 (2.3%) |
| Foreign Born, Citizen | 10,429 (97.4%) | 279 (2.6%) |
| Foreign Born, not a Citizen | 5,142 (91.5%) | 480 (8.5%) |
Health Insurance Coverage by Household Income in Janesville
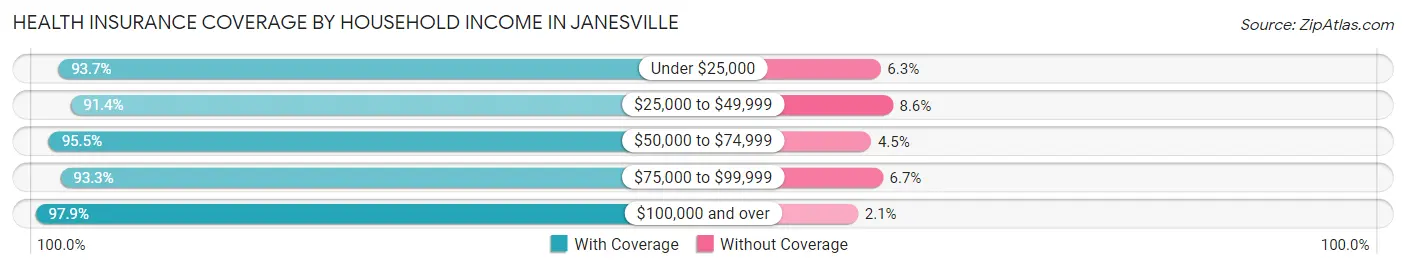
| Household Income | With Coverage | Without Coverage |
| Under $25,000 | 5,737 (93.7%) | 386 (6.3%) |
| $25,000 to $49,999 | 8,868 (91.4%) | 831 (8.6%) |
| $50,000 to $74,999 | 11,591 (95.5%) | 550 (4.5%) |
| $75,000 to $99,999 | 11,738 (93.3%) | 844 (6.7%) |
| $100,000 and over | 23,726 (97.9%) | 502 (2.1%) |
Public vs Private Health Insurance Coverage by Age in Janesville
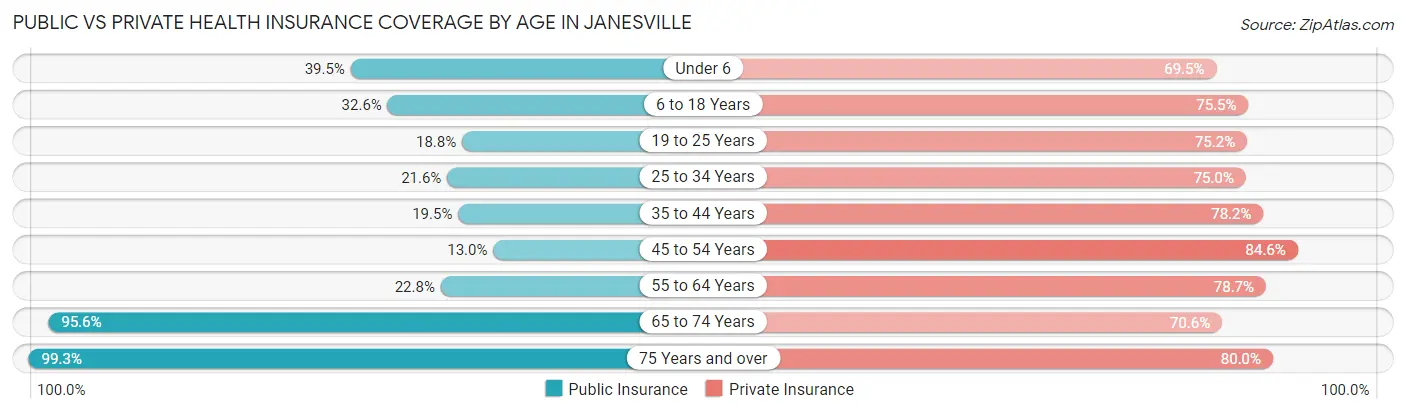
| Age Bracket | Public Insurance | Private Insurance |
| Under 6 | 1,749 (39.5%) | 3,080 (69.5%) |
| 6 to 18 Years | 3,492 (32.6%) | 8,080 (75.5%) |
| 19 to 25 Years | 1,057 (18.8%) | 4,228 (75.2%) |
| 25 to 34 Years | 1,622 (21.6%) | 5,641 (75.0%) |
| 35 to 44 Years | 1,788 (19.5%) | 7,170 (78.2%) |
| 45 to 54 Years | 1,073 (13.0%) | 6,982 (84.6%) |
| 55 to 64 Years | 1,951 (22.8%) | 6,746 (78.7%) |
| 65 to 74 Years | 5,982 (95.6%) | 4,416 (70.6%) |
| 75 Years and over | 4,547 (99.3%) | 3,665 (80.0%) |
| Total | 23,261 (35.7%) | 50,008 (76.8%) |
Disability Status by Sex by Age in Janesville
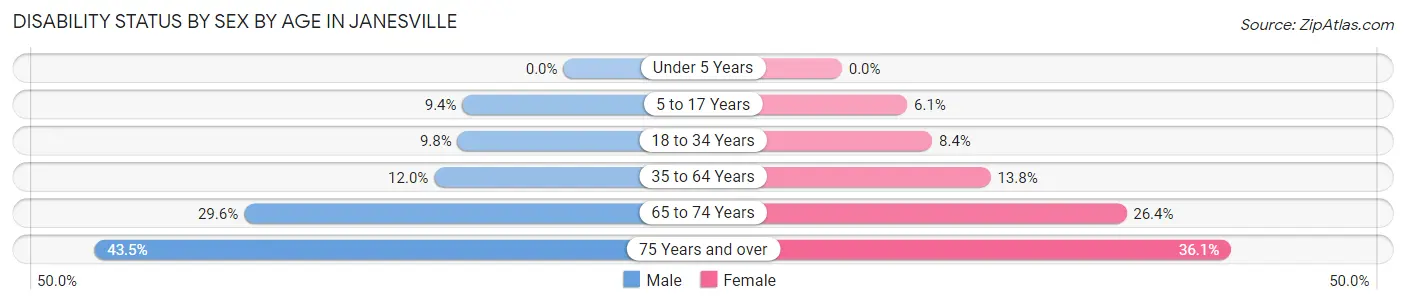
| Age Bracket | Male | Female |
| Under 5 Years | 0 (0.0%) | 0 (0.0%) |
| 5 to 17 Years | 550 (9.4%) | 315 (6.1%) |
| 18 to 34 Years | 702 (9.8%) | 554 (8.4%) |
| 35 to 64 Years | 1,534 (12.0%) | 1,822 (13.8%) |
| 65 to 74 Years | 814 (29.6%) | 927 (26.4%) |
| 75 Years and over | 771 (43.5%) | 1,015 (36.1%) |
Disability Class by Sex by Age in Janesville
Disability Class: Hearing Difficulty
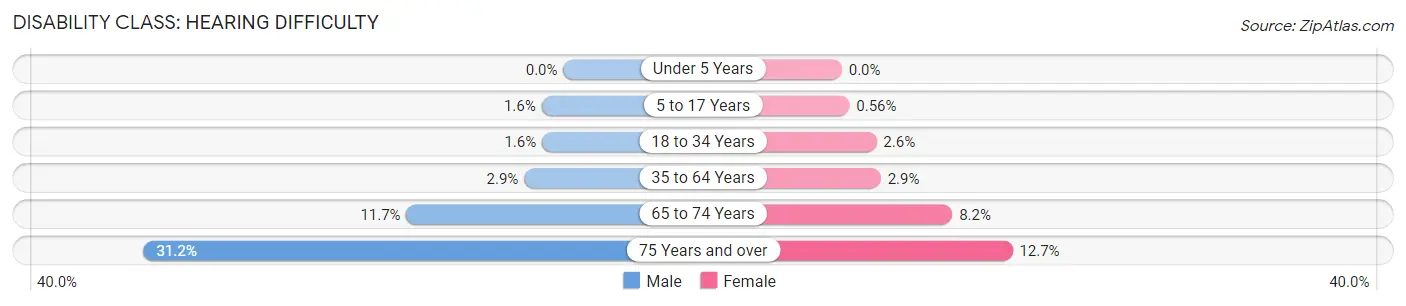
| Age Bracket | Male | Female |
| Under 5 Years | 0 (0.0%) | 0 (0.0%) |
| 5 to 17 Years | 95 (1.6%) | 29 (0.6%) |
| 18 to 34 Years | 113 (1.6%) | 170 (2.6%) |
| 35 to 64 Years | 372 (2.9%) | 382 (2.9%) |
| 65 to 74 Years | 320 (11.7%) | 288 (8.2%) |
| 75 Years and over | 552 (31.2%) | 356 (12.7%) |
Disability Class: Vision Difficulty
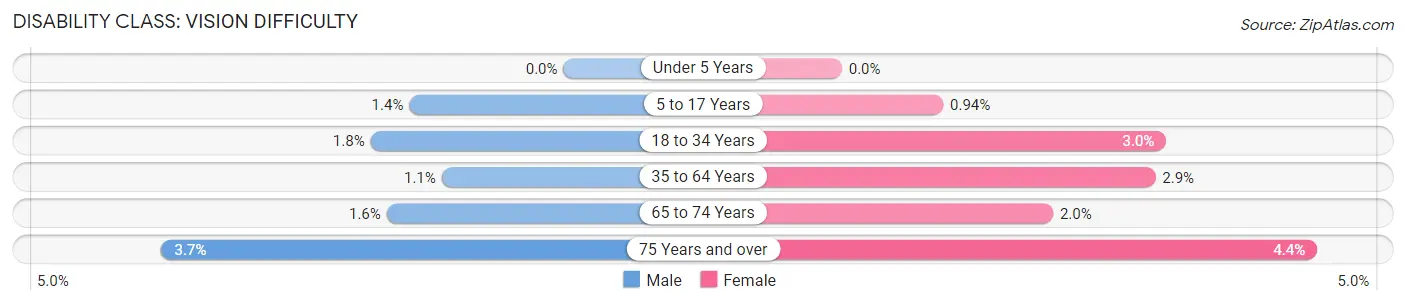
| Age Bracket | Male | Female |
| Under 5 Years | 0 (0.0%) | 0 (0.0%) |
| 5 to 17 Years | 84 (1.4%) | 49 (0.9%) |
| 18 to 34 Years | 128 (1.8%) | 199 (3.0%) |
| 35 to 64 Years | 145 (1.1%) | 384 (2.9%) |
| 65 to 74 Years | 45 (1.6%) | 69 (2.0%) |
| 75 Years and over | 66 (3.7%) | 124 (4.4%) |
Disability Class: Cognitive Difficulty
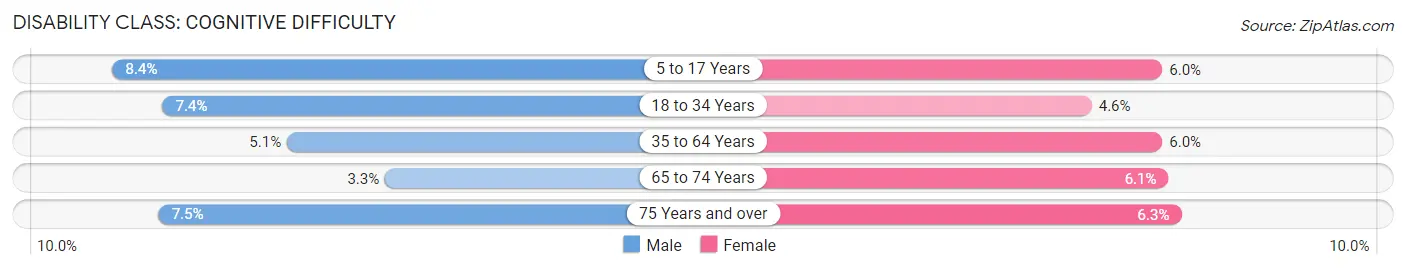
| Age Bracket | Male | Female |
| 5 to 17 Years | 491 (8.4%) | 309 (5.9%) |
| 18 to 34 Years | 532 (7.4%) | 307 (4.6%) |
| 35 to 64 Years | 656 (5.1%) | 785 (5.9%) |
| 65 to 74 Years | 91 (3.3%) | 213 (6.1%) |
| 75 Years and over | 133 (7.5%) | 177 (6.3%) |
Disability Class: Ambulatory Difficulty
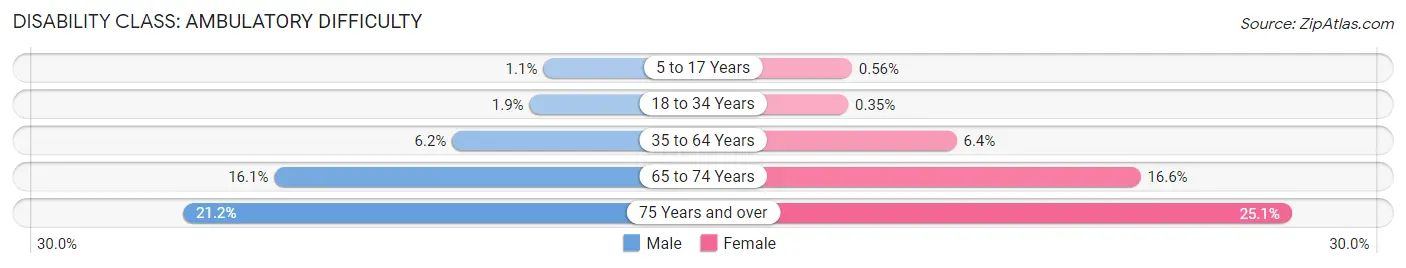
| Age Bracket | Male | Female |
| 5 to 17 Years | 66 (1.1%) | 29 (0.6%) |
| 18 to 34 Years | 135 (1.9%) | 23 (0.4%) |
| 35 to 64 Years | 791 (6.2%) | 844 (6.4%) |
| 65 to 74 Years | 442 (16.1%) | 584 (16.6%) |
| 75 Years and over | 375 (21.2%) | 704 (25.1%) |
Disability Class: Self-Care Difficulty
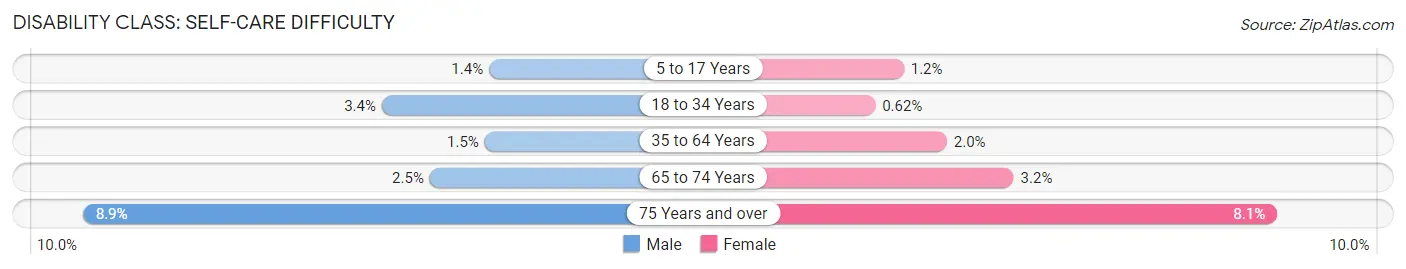
| Age Bracket | Male | Female |
| 5 to 17 Years | 81 (1.4%) | 60 (1.1%) |
| 18 to 34 Years | 241 (3.4%) | 41 (0.6%) |
| 35 to 64 Years | 187 (1.5%) | 258 (1.9%) |
| 65 to 74 Years | 68 (2.5%) | 112 (3.2%) |
| 75 Years and over | 158 (8.9%) | 227 (8.1%) |
Technology Access in Janesville
Computing Device Access in Janesville
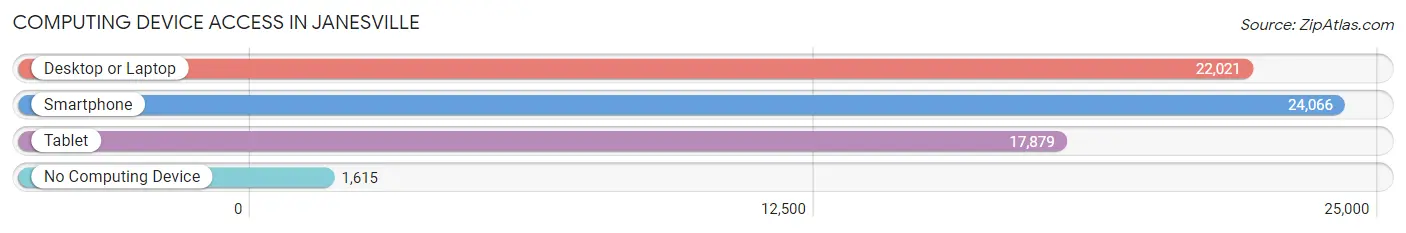
| Device Type | # Households | % Households |
| Desktop or Laptop | 22,021 | 78.9% |
| Smartphone | 24,066 | 86.3% |
| Tablet | 17,879 | 64.1% |
| No Computing Device | 1,615 | 5.8% |
| Total | 27,895 | 100.0% |
Internet Access in Janesville
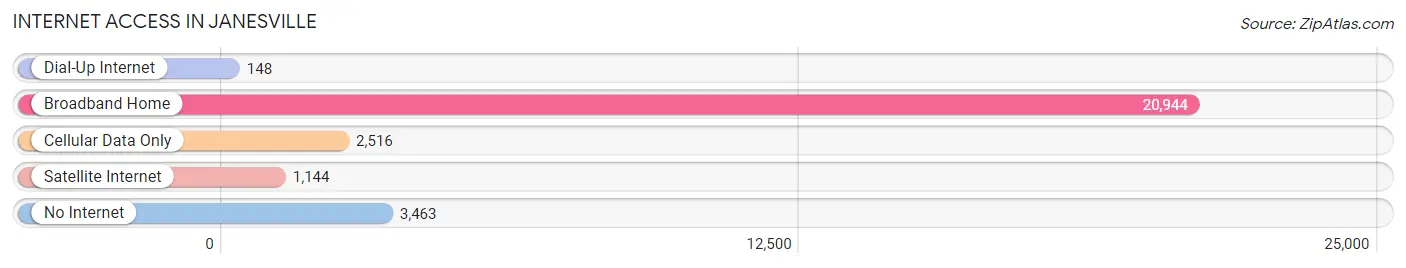
| Internet Type | # Households | % Households |
| Dial-Up Internet | 148 | 0.5% |
| Broadband Home | 20,944 | 75.1% |
| Cellular Data Only | 2,516 | 9.0% |
| Satellite Internet | 1,144 | 4.1% |
| No Internet | 3,463 | 12.4% |
| Total | 27,895 | 100.0% |
Janesville Summary
Janesville, Wisconsin is a city located in Rock County, Wisconsin, United States. It is the county seat of Rock County and the principal city of the Janesville Metropolitan Statistical Area. As of the 2010 census, the city had a population of 63,575, making it the tenth largest city in the state of Wisconsin.
History
Janesville was first settled in 1835 by Henry Janes, a settler from New York. Janes had been a member of the Black Hawk War and was a prominent figure in the early history of the city. The city was named after him and incorporated in 1845.
In the late 19th century, Janesville was a major center for the production of agricultural equipment, including threshing machines, plows, and wagons. The city was also home to several large manufacturing companies, including the Janesville Machine Company, which produced engines for the U.S. Navy during World War II.
Geography
Janesville is located in south-central Wisconsin, approximately 75 miles southwest of Milwaukee and 60 miles southeast of Madison. The city is situated on the banks of the Rock River, which flows through the city and is a major tributary of the Mississippi River.
The city has a total area of 24.2 square miles, of which 23.7 square miles is land and 0.5 square miles is water. Janesville is located in the Central Plain region of Wisconsin, which is characterized by rolling hills and flat plains.
Economy
Janesville has a diversified economy, with a mix of manufacturing, retail, and service industries. The city is home to several large employers, including the Janesville Machine Company, which produces engines for the U.S. Navy, and the Parker Pen Company, which manufactures pens and other writing instruments.
The city is also home to several smaller businesses, including several restaurants, bars, and retail stores. The city is also home to several educational institutions, including the University of Wisconsin-Whitewater, Blackhawk Technical College, and the University of Wisconsin-Rock County.
Demographics
As of the 2010 census, the city had a population of 63,575, with a population density of 2,619.7 people per square mile. The racial makeup of the city was 87.2% White, 5.7% African American, 0.5% Native American, 1.7% Asian, 0.1% Pacific Islander, 2.7% from other races, and 2.1% from two or more races. Hispanic or Latino of any race were 6.3% of the population.
The median income for a household in the city was $45,945, and the median income for a family was $56,945. The per capita income for the city was $23,845. About 8.3% of families and 11.2% of the population were below the poverty line, including 15.2% of those under age 18 and 6.2% of those age 65 or over.
Common Questions
What is Per Capita Income in Janesville?
Per Capita income in Janesville is $35,135.
What is the Median Family Income in Janesville?
Median Family Income in Janesville is $82,461.
What is the Median Household income in Janesville?
Median Household Income in Janesville is $68,610.
What is Income or Wage Gap in Janesville?
Income or Wage Gap in Janesville is 26.2%.
Women in Janesville earn 73.8 cents for every dollar earned by a man.
What is Family Income Deficit in Janesville?
Family Income Deficit in Janesville is $11,496.
Families that are below poverty line in Janesville earn $11,496 less on average than the poverty threshold level.
What is Inequality or Gini Index in Janesville?
Inequality or Gini Index in Janesville is 0.39.
What is the Total Population of Janesville?
Total Population of Janesville is 65,669.
What is the Total Male Population of Janesville?
Total Male Population of Janesville is 32,499.
What is the Total Female Population of Janesville?
Total Female Population of Janesville is 33,170.
What is the Ratio of Males per 100 Females in Janesville?
There are 97.98 Males per 100 Females in Janesville.
What is the Ratio of Females per 100 Males in Janesville?
There are 102.06 Females per 100 Males in Janesville.
What is the Median Population Age in Janesville?
Median Population Age in Janesville is 39.5 Years.
What is the Average Family Size in Janesville
Average Family Size in Janesville is 2.9 People.
What is the Average Household Size in Janesville
Average Household Size in Janesville is 2.3 People.
How Large is the Labor Force in Janesville?
There are 34,645 People in the Labor Forcein in Janesville.
What is the Percentage of People in the Labor Force in Janesville?
65.5% of People are in the Labor Force in Janesville.
What is the Unemployment Rate in Janesville?
Unemployment Rate in Janesville is 4.1%.