Beloit, WI Map & Demographics
Beloit Map
Beloit Overview
$29,529
PER CAPITA INCOME
$67,686
AVG FAMILY INCOME
$57,168
AVG HOUSEHOLD INCOME
23.4%
WAGE / INCOME GAP [ % ]
76.6¢/ $1
WAGE / INCOME GAP [ $ ]
$10,738
FAMILY INCOME DEFICIT
0.43
INEQUALITY / GINI INDEX
36,642
TOTAL POPULATION
17,963
MALE POPULATION
18,679
FEMALE POPULATION
96.17
MALES / 100 FEMALES
103.99
FEMALES / 100 MALES
33.9
MEDIAN AGE
3.3
AVG FAMILY SIZE
2.5
AVG HOUSEHOLD SIZE
18,178
LABOR FORCE [ PEOPLE ]
63.7%
PERCENT IN LABOR FORCE
6.0%
UNEMPLOYMENT RATE
Beloit Zip Codes
Income in Beloit
Income Overview in Beloit
Per Capita Income in Beloit is $29,529, while median incomes of families and households are $67,686 and $57,168 respectively.
| Characteristic | Number | Measure |
| Per Capita Income | 36,642 | $29,529 |
| Median Family Income | 7,882 | $67,686 |
| Mean Family Income | 7,882 | $80,646 |
| Median Household Income | 13,919 | $57,168 |
| Mean Household Income | 13,919 | $74,660 |
| Income Deficit | 7,882 | $10,738 |
| Wage / Income Gap (%) | 36,642 | 23.38% |
| Wage / Income Gap ($) | 36,642 | 76.62¢ per $1 |
| Gini / Inequality Index | 36,642 | 0.43 |
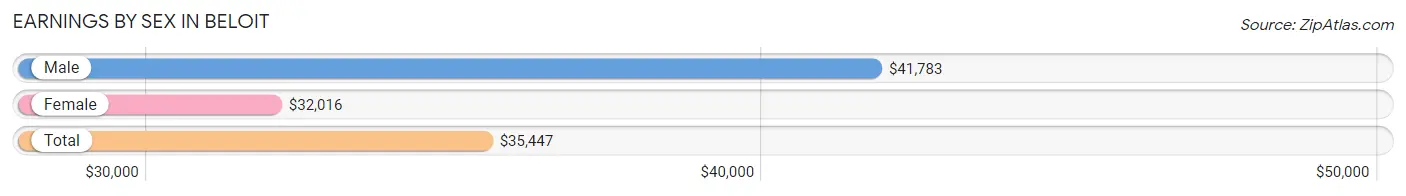
Earnings by Sex in Beloit
Average Earnings in Beloit are $35,447, $41,783 for men and $32,016 for women, a difference of 23.4%.
| Sex | Number | Average Earnings |
| Male | 9,449 (49.1%) | $41,783 |
| Female | 9,780 (50.9%) | $32,016 |
| Total | 19,229 (100.0%) | $35,447 |
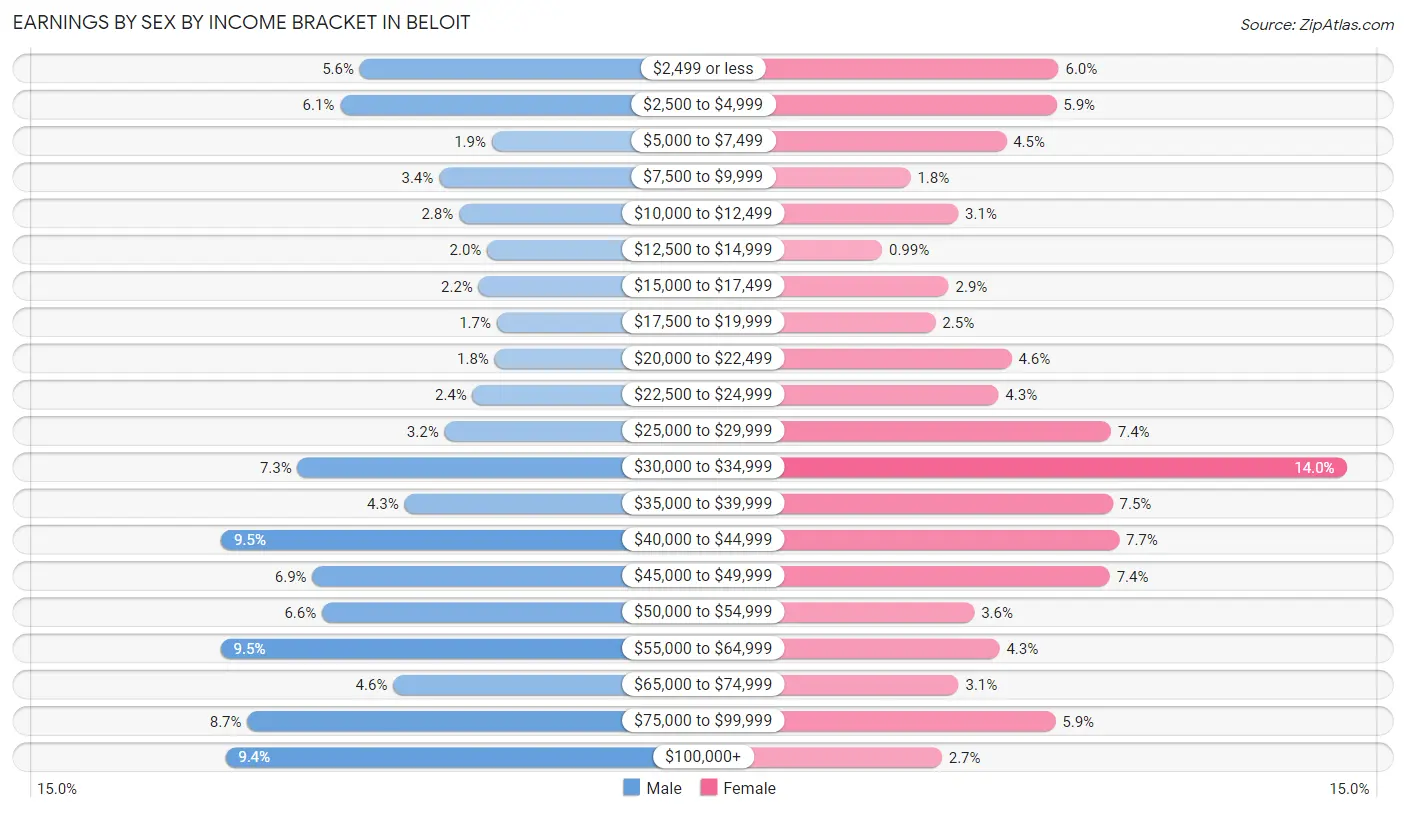
Earnings by Sex by Income Bracket in Beloit
The most common earnings brackets in Beloit are $55,000 to $64,999 for men (897 | 9.5%) and $30,000 to $34,999 for women (1,373 | 14.0%).
| Income | Male | Female |
| $2,499 or less | 527 (5.6%) | 582 (5.9%) |
| $2,500 to $4,999 | 579 (6.1%) | 576 (5.9%) |
| $5,000 to $7,499 | 177 (1.9%) | 438 (4.5%) |
| $7,500 to $9,999 | 317 (3.4%) | 175 (1.8%) |
| $10,000 to $12,499 | 264 (2.8%) | 306 (3.1%) |
| $12,500 to $14,999 | 189 (2.0%) | 97 (1.0%) |
| $15,000 to $17,499 | 212 (2.2%) | 280 (2.9%) |
| $17,500 to $19,999 | 163 (1.7%) | 244 (2.5%) |
| $20,000 to $22,499 | 169 (1.8%) | 453 (4.6%) |
| $22,500 to $24,999 | 228 (2.4%) | 417 (4.3%) |
| $25,000 to $29,999 | 302 (3.2%) | 726 (7.4%) |
| $30,000 to $34,999 | 693 (7.3%) | 1,373 (14.0%) |
| $35,000 to $39,999 | 408 (4.3%) | 731 (7.5%) |
| $40,000 to $44,999 | 896 (9.5%) | 748 (7.6%) |
| $45,000 to $49,999 | 653 (6.9%) | 723 (7.4%) |
| $50,000 to $54,999 | 627 (6.6%) | 350 (3.6%) |
| $55,000 to $64,999 | 897 (9.5%) | 420 (4.3%) |
| $65,000 to $74,999 | 438 (4.6%) | 307 (3.1%) |
| $75,000 to $99,999 | 826 (8.7%) | 573 (5.9%) |
| $100,000+ | 884 (9.4%) | 261 (2.7%) |
| Total | 9,449 (100.0%) | 9,780 (100.0%) |
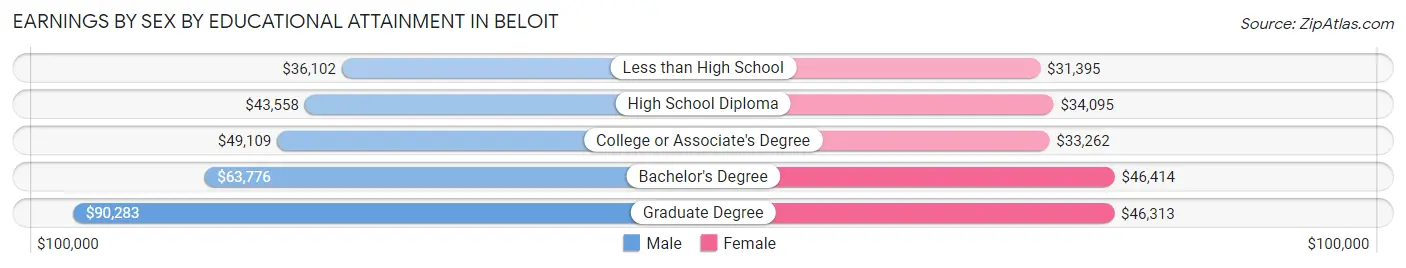
Earnings by Sex by Educational Attainment in Beloit
Average earnings in Beloit are $47,940 for men and $35,537 for women, a difference of 25.9%. Men with an educational attainment of graduate degree enjoy the highest average annual earnings of $90,283, while those with less than high school education earn the least with $36,102. Women with an educational attainment of bachelor's degree earn the most with the average annual earnings of $46,414, while those with less than high school education have the smallest earnings of $31,395.
| Educational Attainment | Male Income | Female Income |
| Less than High School | $36,102 | $31,395 |
| High School Diploma | $43,558 | $34,095 |
| College or Associate's Degree | $49,109 | $33,262 |
| Bachelor's Degree | $63,776 | $46,414 |
| Graduate Degree | $90,283 | $46,313 |
| Total | $47,940 | $35,537 |
Family Income in Beloit
Family Income Brackets in Beloit
According to the Beloit family income data, there are 1,639 families falling into the $50,000 to $74,999 income range, which is the most common income bracket and makes up 20.8% of all families. Conversely, the less than $10,000 income bracket is the least frequent group with only 189 families (2.4%) belonging to this category.
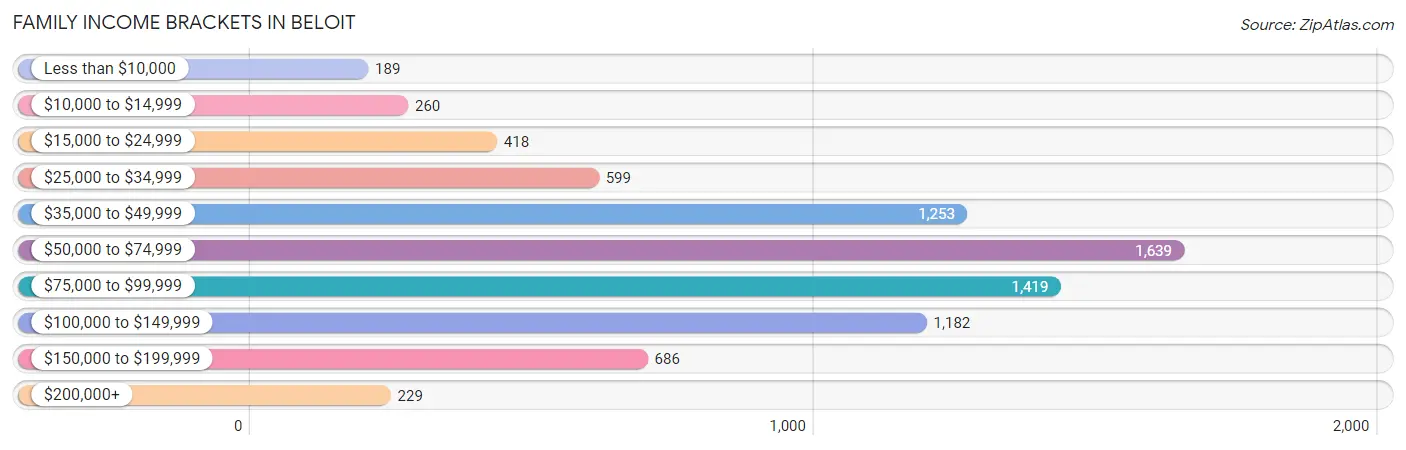
| Income Bracket | # Families | % Families |
| Less than $10,000 | 189 | 2.4% |
| $10,000 to $14,999 | 260 | 3.3% |
| $15,000 to $24,999 | 418 | 5.3% |
| $25,000 to $34,999 | 599 | 7.6% |
| $35,000 to $49,999 | 1,253 | 15.9% |
| $50,000 to $74,999 | 1,639 | 20.8% |
| $75,000 to $99,999 | 1,419 | 18.0% |
| $100,000 to $149,999 | 1,182 | 15.0% |
| $150,000 to $199,999 | 686 | 8.7% |
| $200,000+ | 229 | 2.9% |
Family Income by Famaliy Size in Beloit
4-person families (1,795 | 22.8%) account for the highest median family income in Beloit with $78,971 per family, while 2-person families (3,497 | 44.4%) have the highest median income of $29,200 per family member.
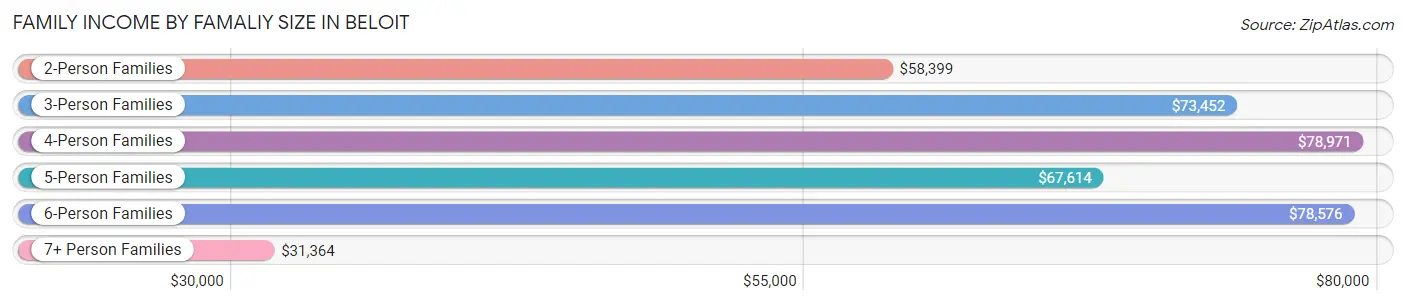
| Income Bracket | # Families | Median Income |
| 2-Person Families | 3,497 (44.4%) | $58,399 |
| 3-Person Families | 1,600 (20.3%) | $73,452 |
| 4-Person Families | 1,795 (22.8%) | $78,971 |
| 5-Person Families | 597 (7.6%) | $67,614 |
| 6-Person Families | 259 (3.3%) | $78,576 |
| 7+ Person Families | 134 (1.7%) | $31,364 |
| Total | 7,882 (100.0%) | $67,686 |
Family Income by Number of Earners in Beloit
The median family income in Beloit is $67,686, with families comprising 3+ earners (1,091) having the highest median family income of $104,464, while families with no earners (1,105) have the lowest median family income of $43,019, accounting for 13.8% and 14.0% of families, respectively.
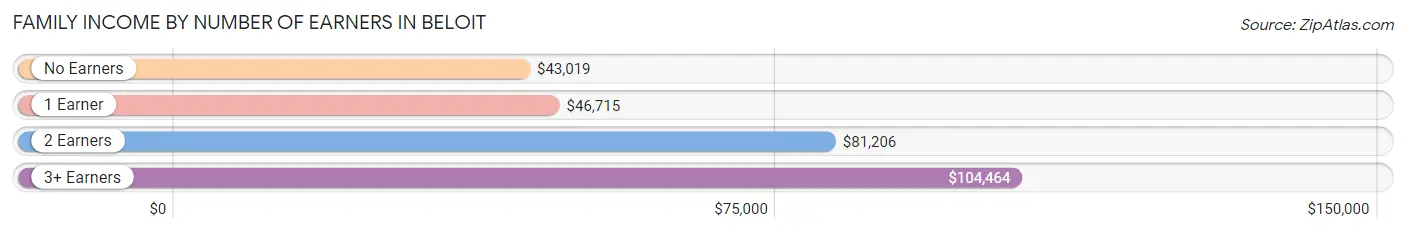
| Number of Earners | # Families | Median Income |
| No Earners | 1,105 (14.0%) | $43,019 |
| 1 Earner | 3,143 (39.9%) | $46,715 |
| 2 Earners | 2,543 (32.3%) | $81,206 |
| 3+ Earners | 1,091 (13.8%) | $104,464 |
| Total | 7,882 (100.0%) | $67,686 |
Household Income in Beloit
Household Income Brackets in Beloit
With 2,728 households falling in the category, the $50,000 to $74,999 income range is the most frequent in Beloit, accounting for 19.6% of all households. In contrast, only 543 households (3.9%) fall into the $200,000+ income bracket, making it the least populous group.
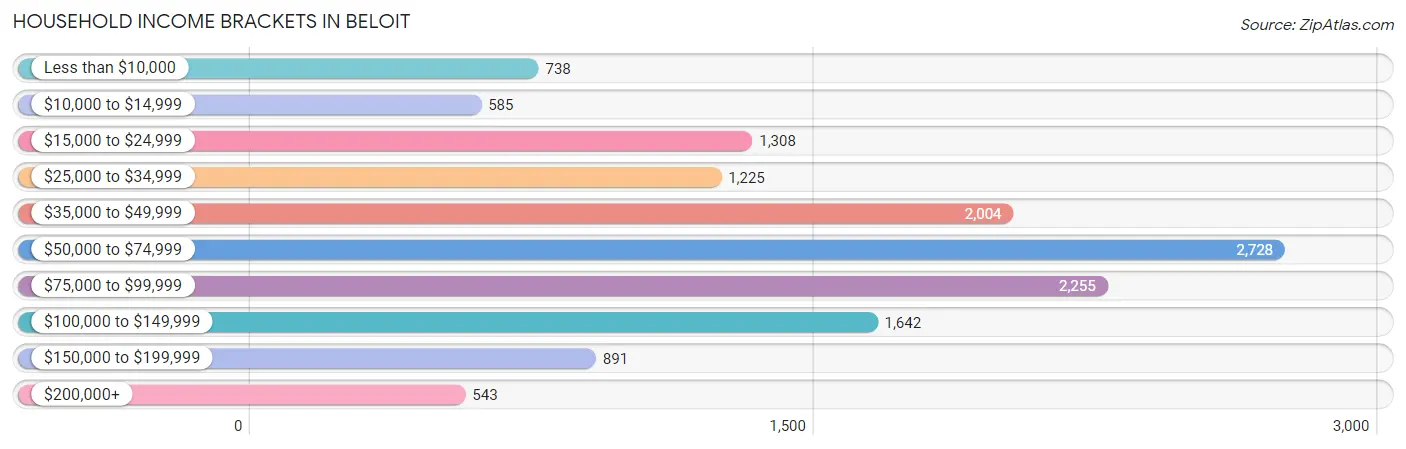
| Income Bracket | # Households | % Households |
| Less than $10,000 | 738 | 5.3% |
| $10,000 to $14,999 | 585 | 4.2% |
| $15,000 to $24,999 | 1,308 | 9.4% |
| $25,000 to $34,999 | 1,225 | 8.8% |
| $35,000 to $49,999 | 2,004 | 14.4% |
| $50,000 to $74,999 | 2,728 | 19.6% |
| $75,000 to $99,999 | 2,255 | 16.2% |
| $100,000 to $149,999 | 1,642 | 11.8% |
| $150,000 to $199,999 | 891 | 6.4% |
| $200,000+ | 543 | 3.9% |
Household Income by Householder Age in Beloit
The median household income in Beloit is $57,168, with the highest median household income of $64,035 found in the 25 to 44 years age bracket for the primary householder. A total of 4,778 households (34.3%) fall into this category. Meanwhile, the 65+ years age bracket for the primary householder has the lowest median household income of $45,702, with 3,373 households (24.2%) in this group.
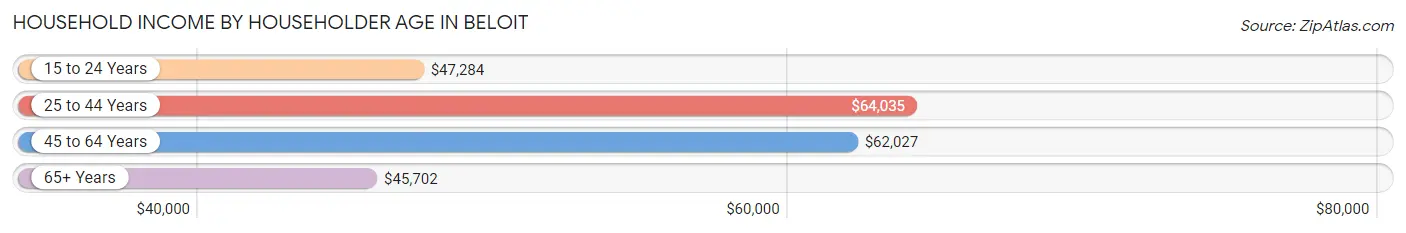
| Income Bracket | # Households | Median Income |
| 15 to 24 Years | 709 (5.1%) | $47,284 |
| 25 to 44 Years | 4,778 (34.3%) | $64,035 |
| 45 to 64 Years | 5,059 (36.3%) | $62,027 |
| 65+ Years | 3,373 (24.2%) | $45,702 |
| Total | 13,919 (100.0%) | $57,168 |
Poverty in Beloit
Income Below Poverty by Sex and Age in Beloit
With 15.5% poverty level for males and 15.4% for females among the residents of Beloit, 15 year old males and 12 to 14 year old females are the most vulnerable to poverty, with 45 males (32.1%) and 296 females (40.5%) in their respective age groups living below the poverty level.
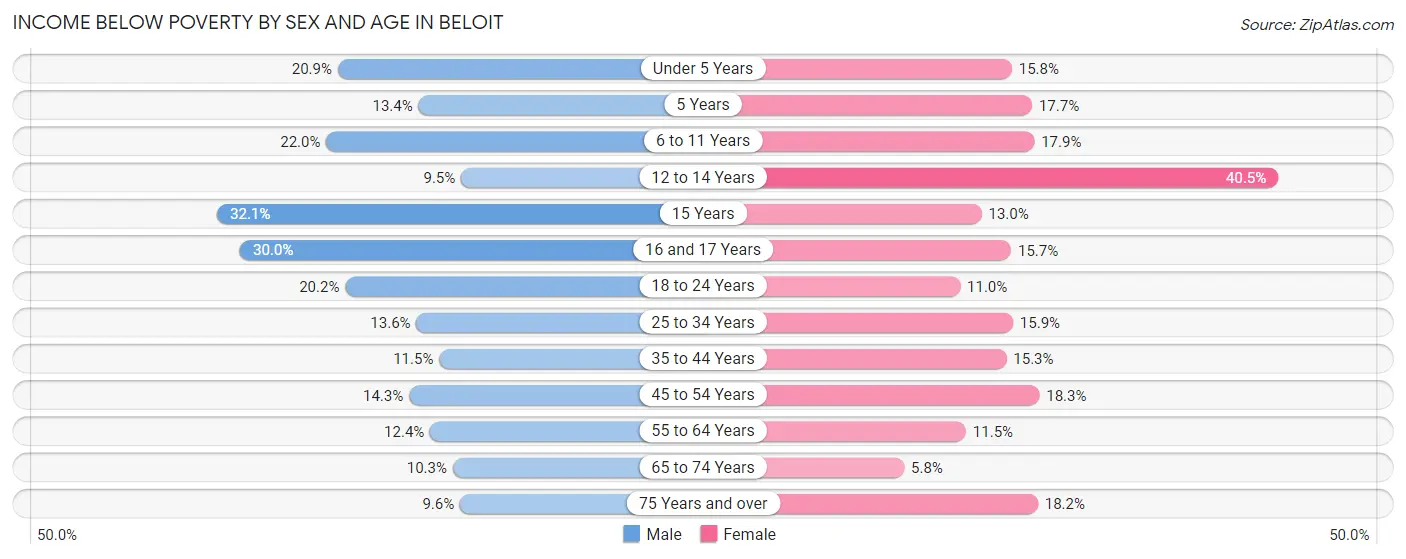
| Age Bracket | Male | Female |
| Under 5 Years | 311 (20.9%) | 161 (15.8%) |
| 5 Years | 52 (13.4%) | 27 (17.6%) |
| 6 to 11 Years | 360 (22.0%) | 284 (17.9%) |
| 12 to 14 Years | 48 (9.5%) | 296 (40.5%) |
| 15 Years | 45 (32.1%) | 31 (13.0%) |
| 16 and 17 Years | 183 (30.0%) | 55 (15.7%) |
| 18 to 24 Years | 341 (20.2%) | 196 (11.0%) |
| 25 to 34 Years | 309 (13.6%) | 446 (15.9%) |
| 35 to 44 Years | 242 (11.5%) | 300 (15.3%) |
| 45 to 54 Years | 243 (14.3%) | 394 (18.3%) |
| 55 to 64 Years | 310 (12.4%) | 271 (11.5%) |
| 65 to 74 Years | 151 (10.3%) | 97 (5.8%) |
| 75 Years and over | 61 (9.6%) | 175 (18.2%) |
| Total | 2,656 (15.5%) | 2,733 (15.4%) |
Income Above Poverty by Sex and Age in Beloit
According to the poverty statistics in Beloit, males aged 12 to 14 years and females aged 65 to 74 years are the age groups that are most secure financially, with 90.5% of males and 94.2% of females in these age groups living above the poverty line.
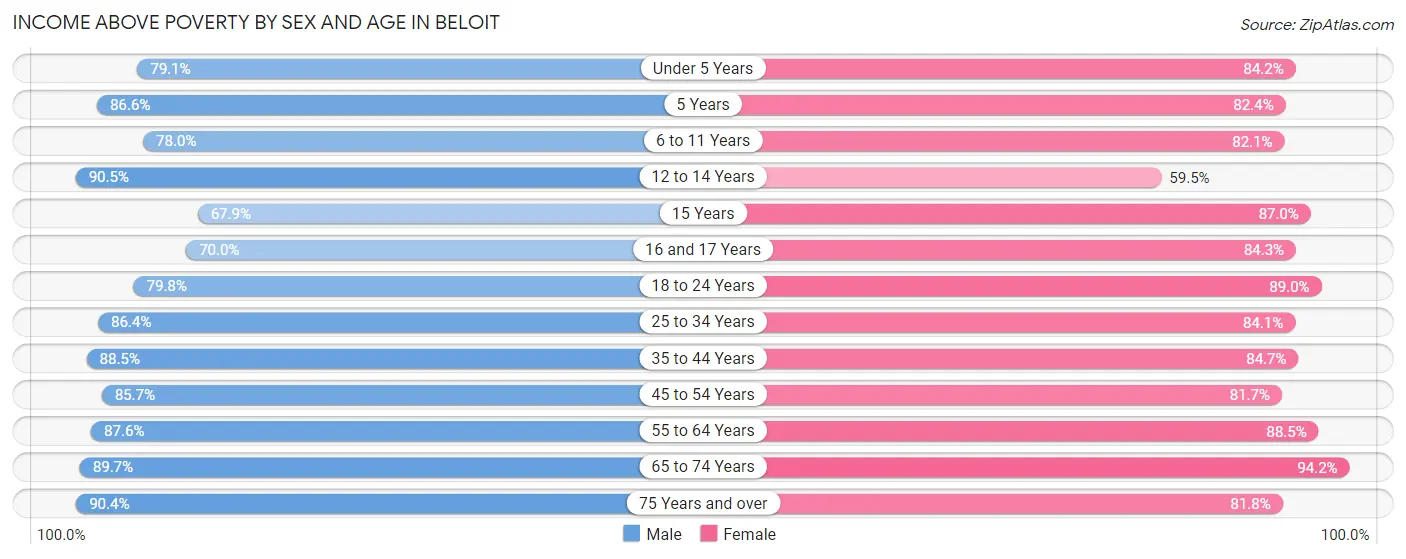
| Age Bracket | Male | Female |
| Under 5 Years | 1,175 (79.1%) | 859 (84.2%) |
| 5 Years | 335 (86.6%) | 126 (82.4%) |
| 6 to 11 Years | 1,276 (78.0%) | 1,306 (82.1%) |
| 12 to 14 Years | 458 (90.5%) | 435 (59.5%) |
| 15 Years | 95 (67.9%) | 208 (87.0%) |
| 16 and 17 Years | 427 (70.0%) | 295 (84.3%) |
| 18 to 24 Years | 1,344 (79.8%) | 1,589 (89.0%) |
| 25 to 34 Years | 1,956 (86.4%) | 2,363 (84.1%) |
| 35 to 44 Years | 1,859 (88.5%) | 1,665 (84.7%) |
| 45 to 54 Years | 1,454 (85.7%) | 1,756 (81.7%) |
| 55 to 64 Years | 2,199 (87.6%) | 2,082 (88.5%) |
| 65 to 74 Years | 1,321 (89.7%) | 1,581 (94.2%) |
| 75 Years and over | 575 (90.4%) | 787 (81.8%) |
| Total | 14,474 (84.5%) | 15,052 (84.6%) |
Income Below Poverty Among Married-Couple Families in Beloit
The poverty statistics for married-couple families in Beloit show that 7.4% or 388 of the total 5,230 families live below the poverty line. Families with 5 or more children have the highest poverty rate of 87.5%, comprising of 49 families. On the other hand, families with 1 or 2 children have the lowest poverty rate of 2.0%, which includes 32 families.
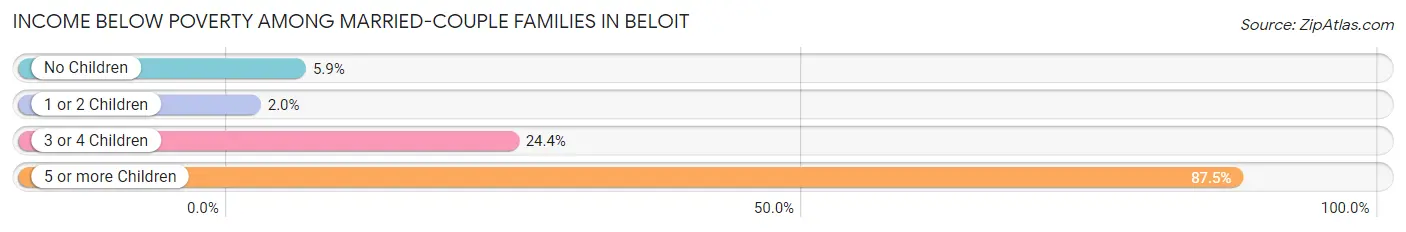
| Children | Above Poverty | Below Poverty |
| No Children | 2,852 (94.1%) | 179 (5.9%) |
| 1 or 2 Children | 1,587 (98.0%) | 32 (2.0%) |
| 3 or 4 Children | 396 (75.6%) | 128 (24.4%) |
| 5 or more Children | 7 (12.5%) | 49 (87.5%) |
| Total | 4,842 (92.6%) | 388 (7.4%) |
Income Below Poverty Among Single-Parent Households in Beloit
According to the poverty data in Beloit, 1.5% or 12 single-father households and 23.2% or 436 single-mother households are living below the poverty line. Among single-father households, those with no children have the highest poverty rate, with 6 households (1.8%) experiencing poverty. Likewise, among single-mother households, those with 3 or 4 children have the highest poverty rate, with 152 households (53.5%) falling below the poverty line.
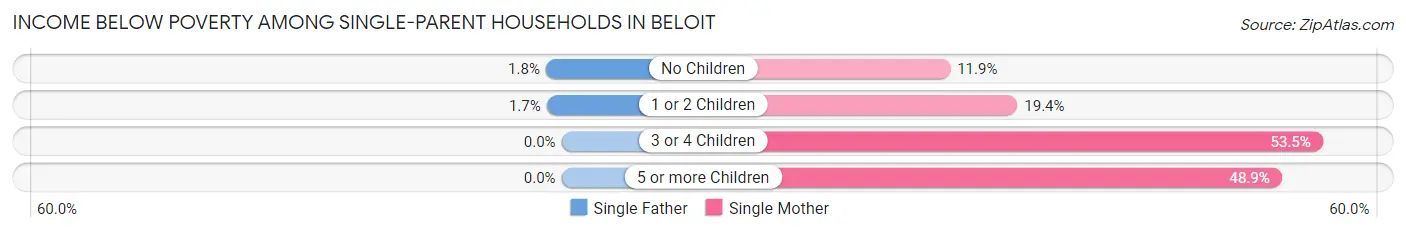
| Children | Single Father | Single Mother |
| No Children | 6 (1.8%) | 63 (11.9%) |
| 1 or 2 Children | 6 (1.7%) | 198 (19.4%) |
| 3 or 4 Children | 0 (0.0%) | 152 (53.5%) |
| 5 or more Children | 0 (0.0%) | 23 (48.9%) |
| Total | 12 (1.5%) | 436 (23.2%) |
Income Below Poverty Among Married-Couple vs Single-Parent Households in Beloit
The poverty data for Beloit shows that 388 of the married-couple family households (7.4%) and 448 of the single-parent households (16.9%) are living below the poverty level. Within the married-couple family households, those with 5 or more children have the highest poverty rate, with 49 households (87.5%) falling below the poverty line. Among the single-parent households, those with 5 or more children have the highest poverty rate, with 23 household (48.9%) living below poverty.
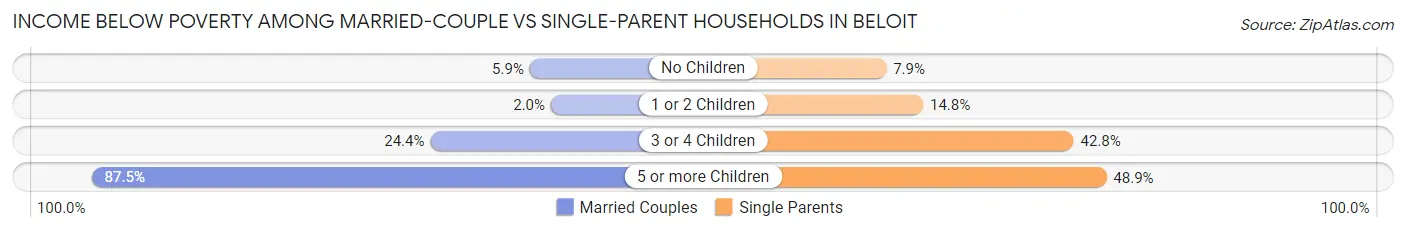
| Children | Married-Couple Families | Single-Parent Households |
| No Children | 179 (5.9%) | 69 (7.9%) |
| 1 or 2 Children | 32 (2.0%) | 204 (14.8%) |
| 3 or 4 Children | 128 (24.4%) | 152 (42.8%) |
| 5 or more Children | 49 (87.5%) | 23 (48.9%) |
| Total | 388 (7.4%) | 448 (16.9%) |
Race in Beloit
The most populous races in Beloit are White / Caucasian (23,497 | 64.1%), Hispanic or Latino (7,886 | 21.5%), and Two or more Races (4,904 | 13.4%).
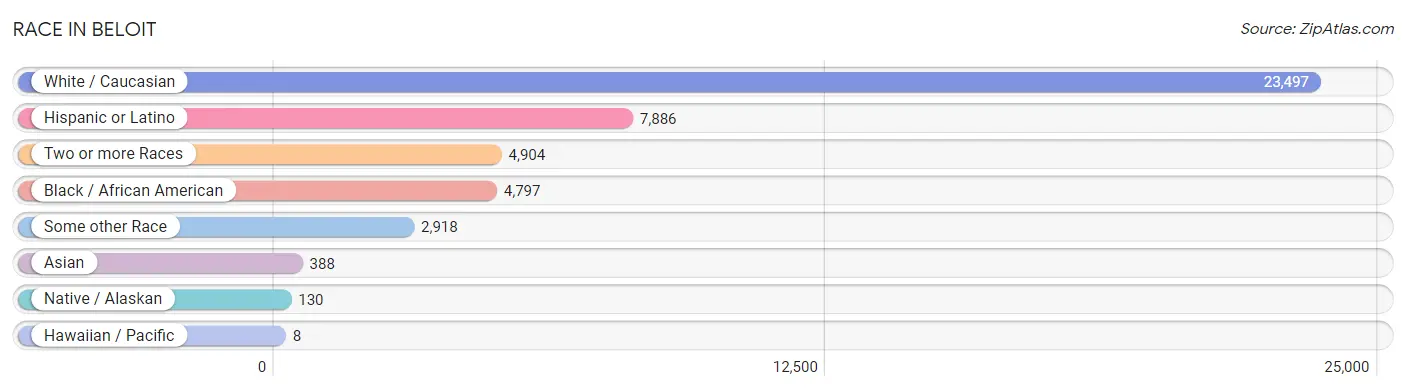
| Race | # Population | % Population |
| Asian | 388 | 1.1% |
| Black / African American | 4,797 | 13.1% |
| Hawaiian / Pacific | 8 | 0.0% |
| Hispanic or Latino | 7,886 | 21.5% |
| Native / Alaskan | 130 | 0.4% |
| White / Caucasian | 23,497 | 64.1% |
| Two or more Races | 4,904 | 13.4% |
| Some other Race | 2,918 | 8.0% |
| Total | 36,642 | 100.0% |
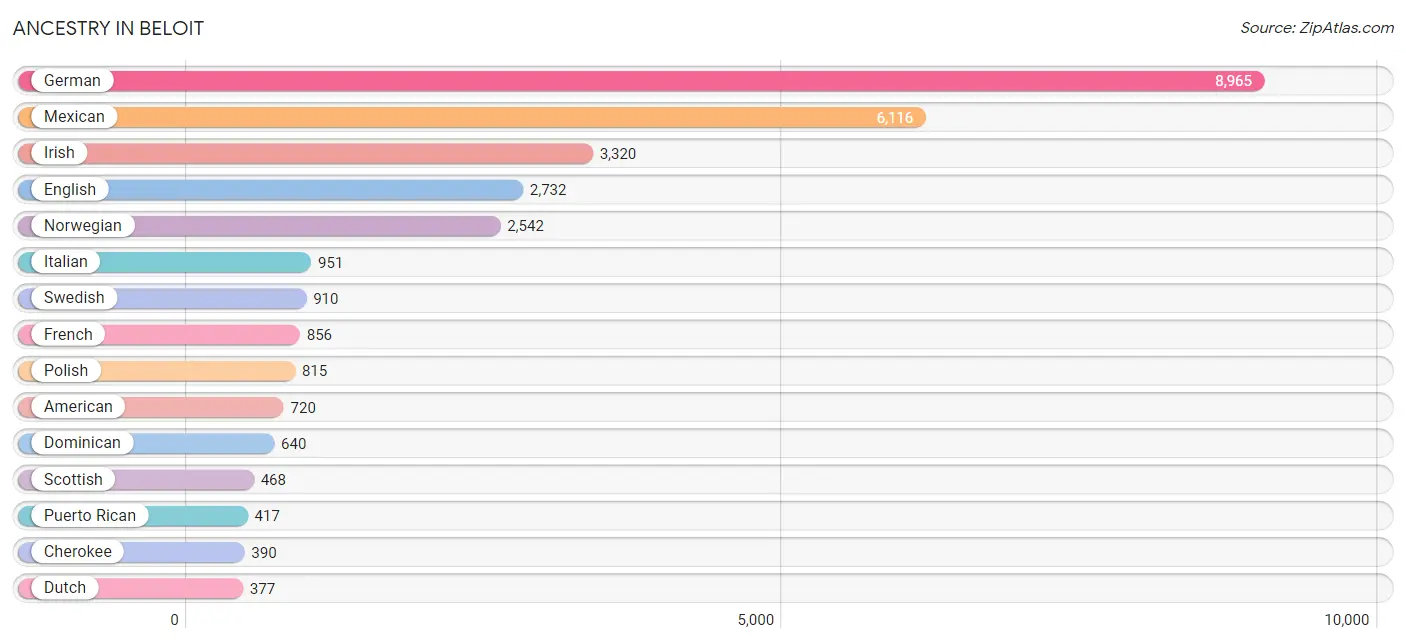
Ancestry in Beloit
The most populous ancestries reported in Beloit are German (8,965 | 24.5%), Mexican (6,116 | 16.7%), Irish (3,320 | 9.1%), English (2,732 | 7.5%), and Norwegian (2,542 | 6.9%), together accounting for 64.6% of all Beloit residents.
| Ancestry | # Population | % Population |
| African | 92 | 0.3% |
| American | 720 | 2.0% |
| Arab | 67 | 0.2% |
| Armenian | 39 | 0.1% |
| Austrian | 117 | 0.3% |
| Bangladeshi | 61 | 0.2% |
| Belgian | 22 | 0.1% |
| Bhutanese | 65 | 0.2% |
| Blackfeet | 157 | 0.4% |
| British | 135 | 0.4% |
| Burmese | 48 | 0.1% |
| Central American | 233 | 0.6% |
| Cherokee | 390 | 1.1% |
| Chippewa | 34 | 0.1% |
| Colombian | 66 | 0.2% |
| Costa Rican | 21 | 0.1% |
| Creek | 29 | 0.1% |
| Croatian | 85 | 0.2% |
| Cuban | 46 | 0.1% |
| Czech | 102 | 0.3% |
| Czechoslovakian | 42 | 0.1% |
| Danish | 198 | 0.5% |
| Dominican | 640 | 1.8% |
| Dutch | 377 | 1.0% |
| Eastern European | 24 | 0.1% |
| English | 2,732 | 7.5% |
| Ethiopian | 4 | 0.0% |
| European | 341 | 0.9% |
| Finnish | 76 | 0.2% |
| French | 856 | 2.3% |
| French Canadian | 93 | 0.3% |
| German | 8,965 | 24.5% |
| Greek | 34 | 0.1% |
| Guatemalan | 17 | 0.1% |
| Guyanese | 2 | 0.0% |
| Honduran | 98 | 0.3% |
| Hungarian | 46 | 0.1% |
| Indian (Asian) | 197 | 0.5% |
| Irish | 3,320 | 9.1% |
| Italian | 951 | 2.6% |
| Japanese | 50 | 0.1% |
| Korean | 105 | 0.3% |
| Laotian | 27 | 0.1% |
| Latvian | 10 | 0.0% |
| Lebanese | 67 | 0.2% |
| Lithuanian | 36 | 0.1% |
| Luxembourger | 10 | 0.0% |
| Malaysian | 49 | 0.1% |
| Menominee | 5 | 0.0% |
| Mexican | 6,116 | 16.7% |
| Mexican American Indian | 98 | 0.3% |
| Northern European | 20 | 0.1% |
| Norwegian | 2,542 | 6.9% |
| Pakistani | 147 | 0.4% |
| Panamanian | 14 | 0.0% |
| Peruvian | 11 | 0.0% |
| Polish | 815 | 2.2% |
| Portuguese | 18 | 0.1% |
| Puerto Rican | 417 | 1.1% |
| Romanian | 10 | 0.0% |
| Russian | 214 | 0.6% |
| Salvadoran | 83 | 0.2% |
| Samoan | 8 | 0.0% |
| Scandinavian | 311 | 0.9% |
| Scotch-Irish | 49 | 0.1% |
| Scottish | 468 | 1.3% |
| Serbian | 75 | 0.2% |
| Sioux | 5 | 0.0% |
| Slavic | 13 | 0.0% |
| Slovak | 14 | 0.0% |
| Slovene | 22 | 0.1% |
| South American | 77 | 0.2% |
| South American Indian | 6 | 0.0% |
| Spaniard | 14 | 0.0% |
| Spanish | 1 | 0.0% |
| Sri Lankan | 50 | 0.1% |
| Subsaharan African | 96 | 0.3% |
| Swedish | 910 | 2.5% |
| Swiss | 182 | 0.5% |
| Thai | 40 | 0.1% |
| Ukrainian | 45 | 0.1% |
| Welsh | 78 | 0.2% |
| Yugoslavian | 39 | 0.1% | View All 83 Rows |
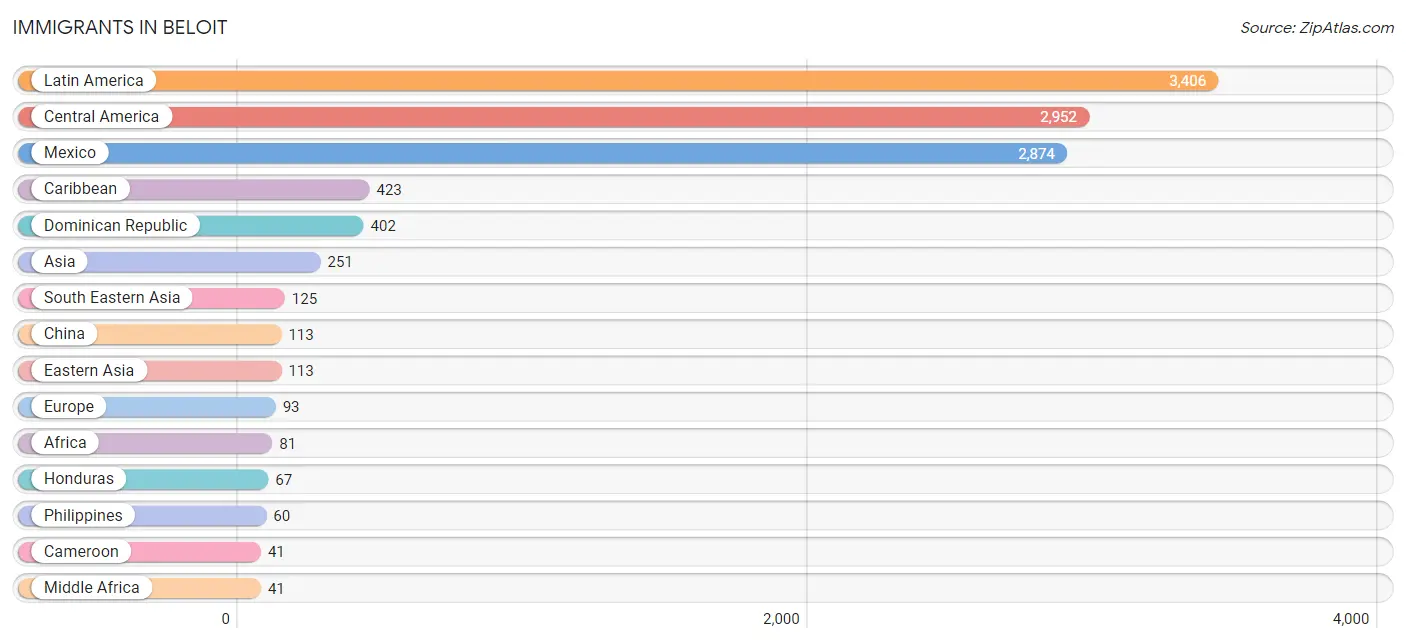
Immigrants in Beloit
The most numerous immigrant groups reported in Beloit came from Latin America (3,406 | 9.3%), Central America (2,952 | 8.1%), Mexico (2,874 | 7.8%), Caribbean (423 | 1.1%), and Dominican Republic (402 | 1.1%), together accounting for 27.5% of all Beloit residents.
| Immigration Origin | # Population | % Population |
| Africa | 81 | 0.2% |
| Asia | 251 | 0.7% |
| Cambodia | 14 | 0.0% |
| Cameroon | 41 | 0.1% |
| Canada | 5 | 0.0% |
| Caribbean | 423 | 1.1% |
| Central America | 2,952 | 8.1% |
| China | 113 | 0.3% |
| Colombia | 31 | 0.1% |
| Cuba | 21 | 0.1% |
| Czechoslovakia | 16 | 0.0% |
| Dominican Republic | 402 | 1.1% |
| Eastern Africa | 5 | 0.0% |
| Eastern Asia | 113 | 0.3% |
| Eastern Europe | 29 | 0.1% |
| England | 18 | 0.1% |
| Ethiopia | 4 | 0.0% |
| Europe | 93 | 0.3% |
| Germany | 20 | 0.1% |
| Ghana | 35 | 0.1% |
| Guatemala | 11 | 0.0% |
| Honduras | 67 | 0.2% |
| India | 11 | 0.0% |
| Indonesia | 14 | 0.0% |
| Italy | 5 | 0.0% |
| Latin America | 3,406 | 9.3% |
| Mexico | 2,874 | 7.8% |
| Middle Africa | 41 | 0.1% |
| Nepal | 2 | 0.0% |
| Northern Europe | 39 | 0.1% |
| Norway | 11 | 0.0% |
| Philippines | 60 | 0.2% |
| Scotland | 10 | 0.0% |
| South America | 31 | 0.1% |
| South Central Asia | 13 | 0.0% |
| South Eastern Asia | 125 | 0.3% |
| Southern Europe | 5 | 0.0% |
| Thailand | 19 | 0.1% |
| Western Africa | 35 | 0.1% |
| Western Europe | 20 | 0.1% | View All 40 Rows |
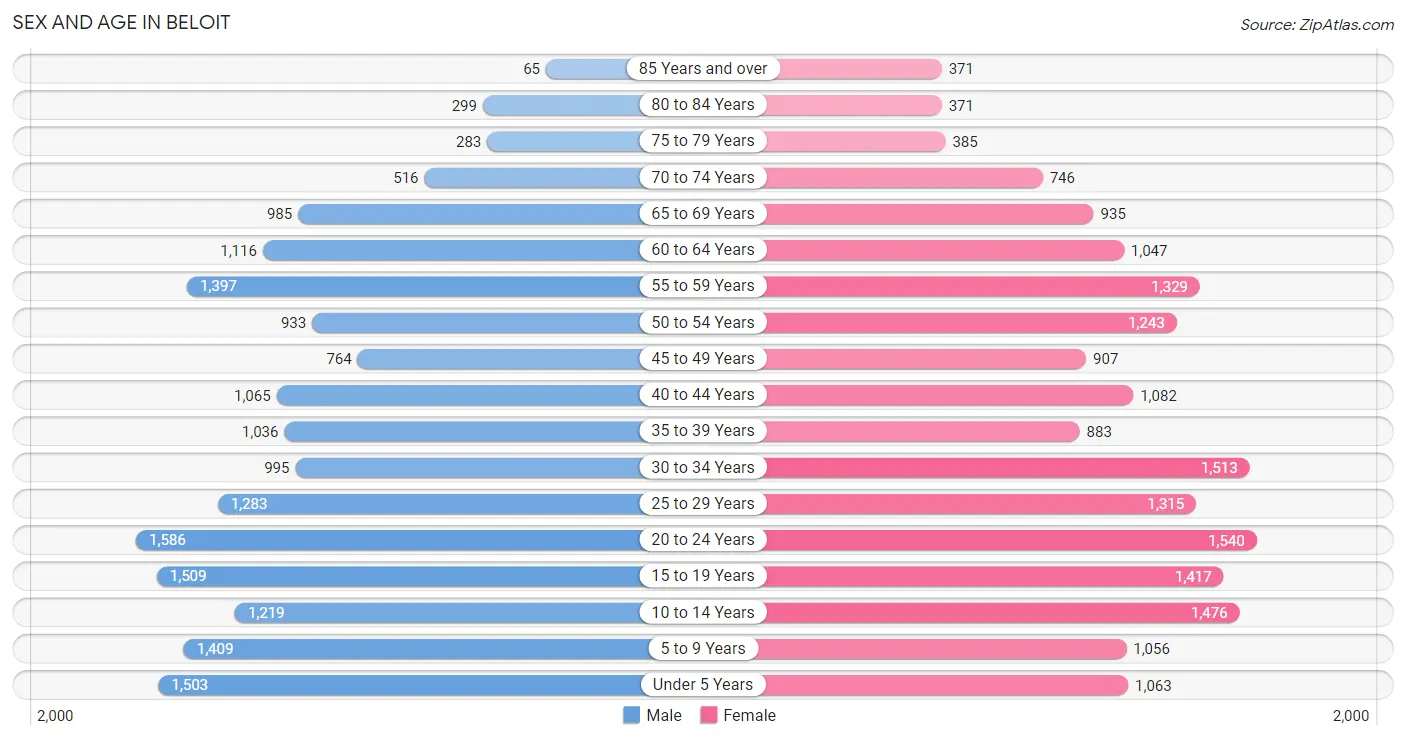
Sex and Age in Beloit
Sex and Age in Beloit
The most populous age groups in Beloit are 20 to 24 Years (1,586 | 8.8%) for men and 20 to 24 Years (1,540 | 8.2%) for women.
| Age Bracket | Male | Female |
| Under 5 Years | 1,503 (8.4%) | 1,063 (5.7%) |
| 5 to 9 Years | 1,409 (7.8%) | 1,056 (5.7%) |
| 10 to 14 Years | 1,219 (6.8%) | 1,476 (7.9%) |
| 15 to 19 Years | 1,509 (8.4%) | 1,417 (7.6%) |
| 20 to 24 Years | 1,586 (8.8%) | 1,540 (8.2%) |
| 25 to 29 Years | 1,283 (7.1%) | 1,315 (7.0%) |
| 30 to 34 Years | 995 (5.5%) | 1,513 (8.1%) |
| 35 to 39 Years | 1,036 (5.8%) | 883 (4.7%) |
| 40 to 44 Years | 1,065 (5.9%) | 1,082 (5.8%) |
| 45 to 49 Years | 764 (4.3%) | 907 (4.9%) |
| 50 to 54 Years | 933 (5.2%) | 1,243 (6.7%) |
| 55 to 59 Years | 1,397 (7.8%) | 1,329 (7.1%) |
| 60 to 64 Years | 1,116 (6.2%) | 1,047 (5.6%) |
| 65 to 69 Years | 985 (5.5%) | 935 (5.0%) |
| 70 to 74 Years | 516 (2.9%) | 746 (4.0%) |
| 75 to 79 Years | 283 (1.6%) | 385 (2.1%) |
| 80 to 84 Years | 299 (1.7%) | 371 (2.0%) |
| 85 Years and over | 65 (0.4%) | 371 (2.0%) |
| Total | 17,963 (100.0%) | 18,679 (100.0%) |
Families and Households in Beloit
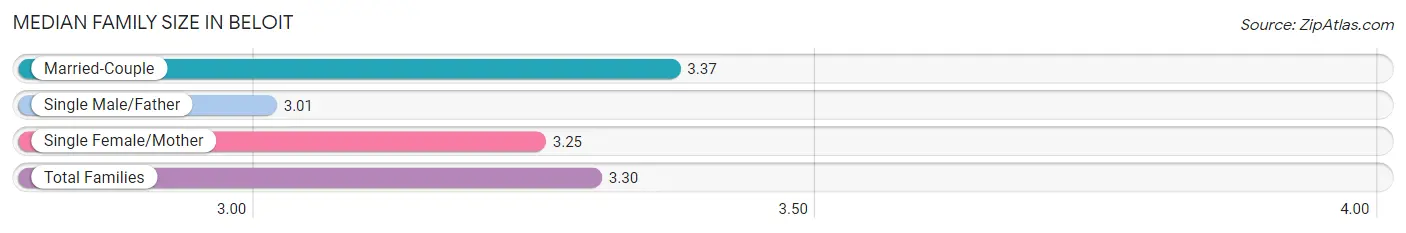
Median Family Size in Beloit
The median family size in Beloit is 3.30 persons per family, with married-couple families (5,230 | 66.3%) accounting for the largest median family size of 3.37 persons per family. On the other hand, single male/father families (772 | 9.8%) represent the smallest median family size with 3.01 persons per family.
| Family Type | # Families | Family Size |
| Married-Couple | 5,230 (66.3%) | 3.37 |
| Single Male/Father | 772 (9.8%) | 3.01 |
| Single Female/Mother | 1,880 (23.8%) | 3.25 |
| Total Families | 7,882 (100.0%) | 3.30 |
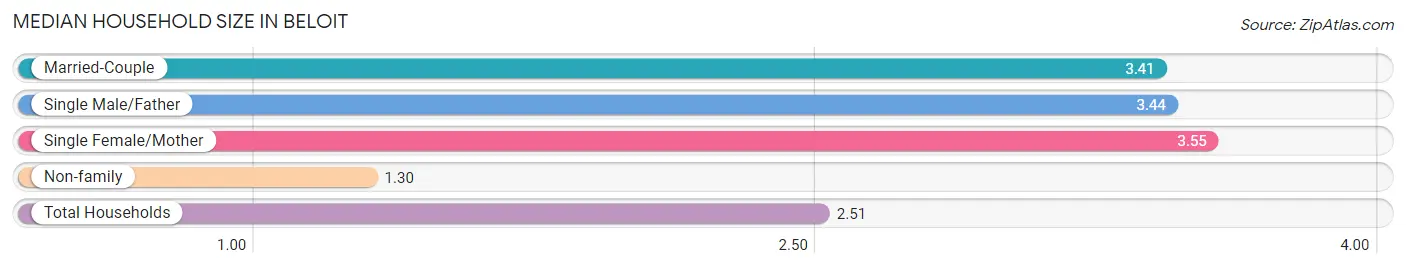
Median Household Size in Beloit
The median household size in Beloit is 2.51 persons per household, with single female/mother households (1,880 | 13.5%) accounting for the largest median household size of 3.55 persons per household. non-family households (6,037 | 43.4%) represent the smallest median household size with 1.30 persons per household.
| Household Type | # Households | Household Size |
| Married-Couple | 5,230 (37.6%) | 3.41 |
| Single Male/Father | 772 (5.6%) | 3.44 |
| Single Female/Mother | 1,880 (13.5%) | 3.55 |
| Non-family | 6,037 (43.4%) | 1.30 |
| Total Households | 13,919 (100.0%) | 2.51 |
Household Size by Marriage Status in Beloit
Out of a total of 13,919 households in Beloit, 7,882 (56.6%) are family households, while 6,037 (43.4%) are nonfamily households. The most numerous type of family households are 2-person households, comprising 3,047, and the most common type of nonfamily households are 1-person households, comprising 4,772.
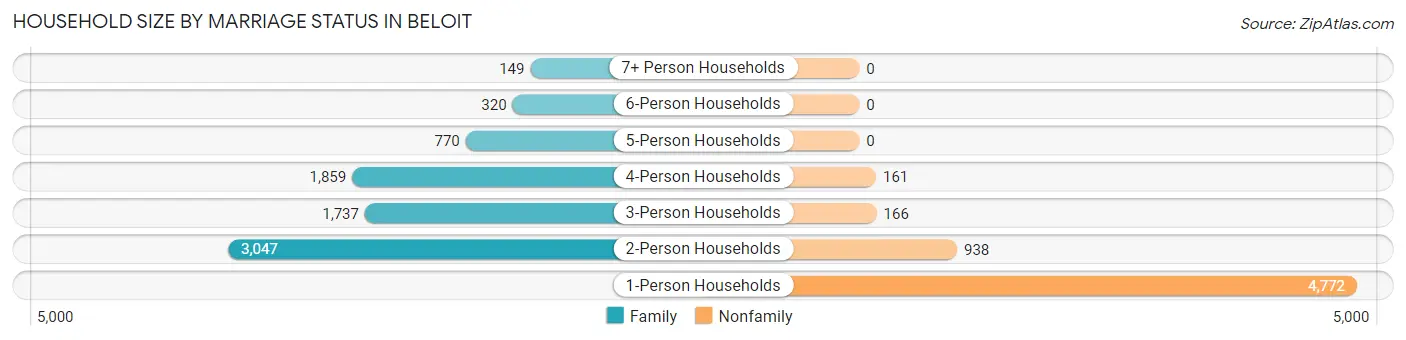
| Household Size | Family Households | Nonfamily Households |
| 1-Person Households | - | 4,772 (34.3%) |
| 2-Person Households | 3,047 (21.9%) | 938 (6.7%) |
| 3-Person Households | 1,737 (12.5%) | 166 (1.2%) |
| 4-Person Households | 1,859 (13.4%) | 161 (1.2%) |
| 5-Person Households | 770 (5.5%) | 0 (0.0%) |
| 6-Person Households | 320 (2.3%) | 0 (0.0%) |
| 7+ Person Households | 149 (1.1%) | 0 (0.0%) |
| Total | 7,882 (56.6%) | 6,037 (43.4%) |
Female Fertility in Beloit
Fertility by Age in Beloit
Average fertility rate in Beloit is 47.0 births per 1,000 women. Women in the age bracket of 20 to 34 years have the highest fertility rate with 74.0 births per 1,000 women. Women in the age bracket of 20 to 34 years acount for 78.0% of all women with births.
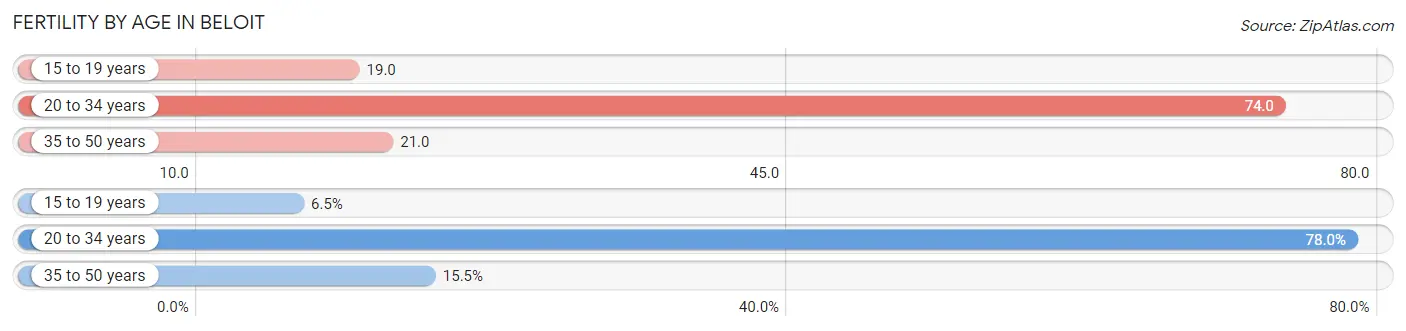
| Age Bracket | Women with Births | Births / 1,000 Women |
| 15 to 19 years | 27 (6.5%) | 19.0 |
| 20 to 34 years | 323 (78.0%) | 74.0 |
| 35 to 50 years | 64 (15.5%) | 21.0 |
| Total | 414 (100.0%) | 47.0 |
Fertility by Age by Marriage Status in Beloit
41.1% of women with births (414) in Beloit are married. The highest percentage of unmarried women with births falls into 15 to 19 years age bracket with 100.0% of them unmarried at the time of birth, while the lowest percentage of unmarried women with births belong to 35 to 50 years age bracket with 37.5% of them unmarried.
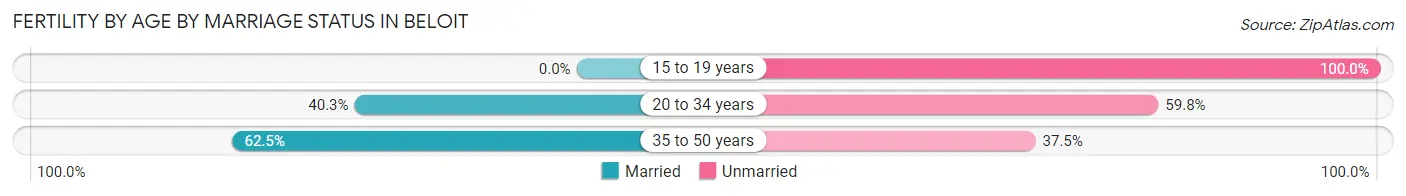
| Age Bracket | Married | Unmarried |
| 15 to 19 years | 0 (0.0%) | 27 (100.0%) |
| 20 to 34 years | 130 (40.3%) | 193 (59.8%) |
| 35 to 50 years | 40 (62.5%) | 24 (37.5%) |
| Total | 170 (41.1%) | 244 (58.9%) |
Fertility by Education in Beloit
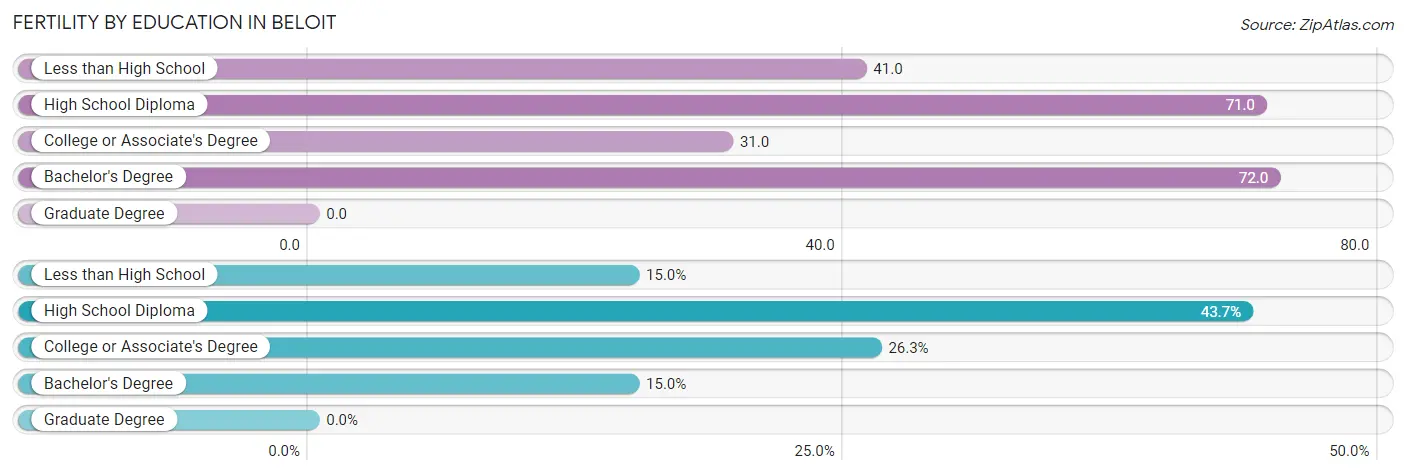
| Educational Attainment | Women with Births | Births / 1,000 Women |
| Less than High School | 62 (15.0%) | 41.0 |
| High School Diploma | 181 (43.7%) | 71.0 |
| College or Associate's Degree | 109 (26.3%) | 31.0 |
| Bachelor's Degree | 62 (15.0%) | 72.0 |
| Graduate Degree | 0 (0.0%) | 0.0 |
| Total | 414 (100.0%) | 47.0 |
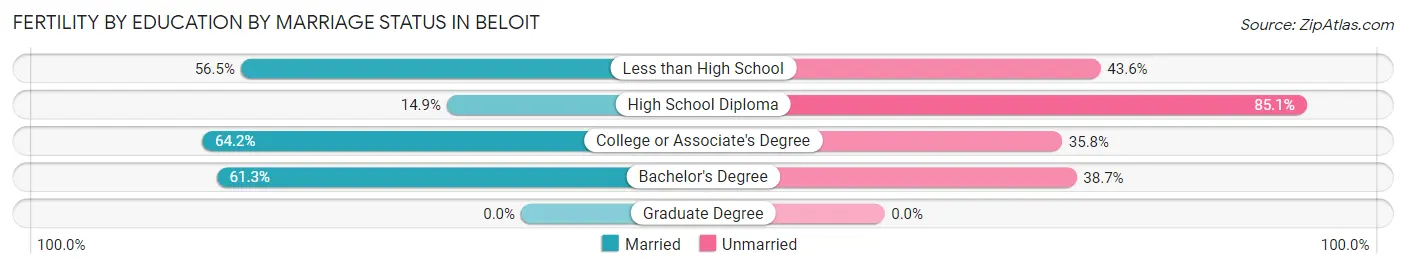
Fertility by Education by Marriage Status in Beloit
58.9% of women with births in Beloit are unmarried. Women with the educational attainment of college or associate's degree are most likely to be married with 64.2% of them married at childbirth, while women with the educational attainment of high school diploma are least likely to be married with 85.1% of them unmarried at childbirth.
| Educational Attainment | Married | Unmarried |
| Less than High School | 35 (56.5%) | 27 (43.5%) |
| High School Diploma | 27 (14.9%) | 154 (85.1%) |
| College or Associate's Degree | 70 (64.2%) | 39 (35.8%) |
| Bachelor's Degree | 38 (61.3%) | 24 (38.7%) |
| Graduate Degree | 0 (0.0%) | 0 (0.0%) |
| Total | 170 (41.1%) | 244 (58.9%) |
Employment Characteristics in Beloit
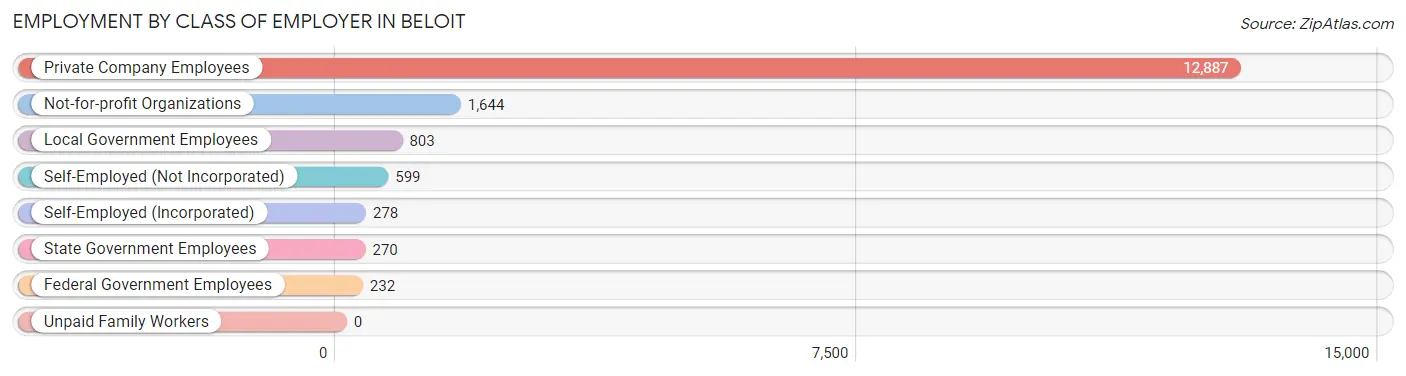
Employment by Class of Employer in Beloit
Among the 16,713 employed individuals in Beloit, private company employees (12,887 | 77.1%), not-for-profit organizations (1,644 | 9.8%), and local government employees (803 | 4.8%) make up the most common classes of employment.
| Employer Class | # Employees | % Employees |
| Private Company Employees | 12,887 | 77.1% |
| Self-Employed (Incorporated) | 278 | 1.7% |
| Self-Employed (Not Incorporated) | 599 | 3.6% |
| Not-for-profit Organizations | 1,644 | 9.8% |
| Local Government Employees | 803 | 4.8% |
| State Government Employees | 270 | 1.6% |
| Federal Government Employees | 232 | 1.4% |
| Unpaid Family Workers | 0 | 0.0% |
| Total | 16,713 | 100.0% |
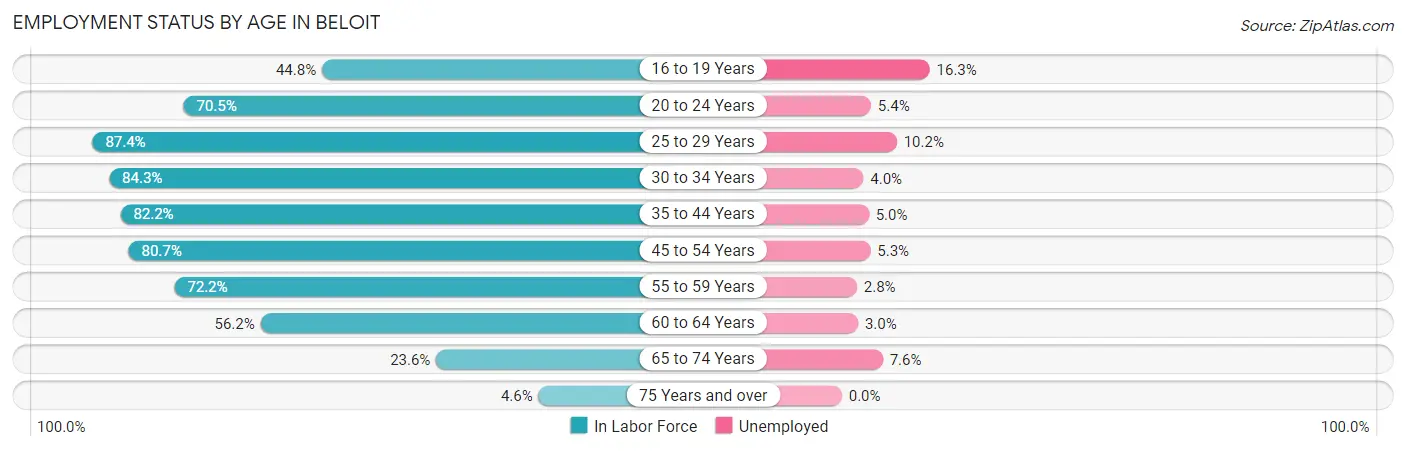
Employment Status by Age in Beloit
According to the labor force statistics for Beloit, out of the total population over 16 years of age (28,537), 63.7% or 18,178 individuals are in the labor force, with 6.0% or 1,091 of them unemployed. The age group with the highest labor force participation rate is 25 to 29 years, with 87.4% or 2,271 individuals in the labor force. Within the labor force, the 16 to 19 years age range has the highest percentage of unemployed individuals, with 16.3% or 186 of them being unemployed.
| Age Bracket | In Labor Force | Unemployed |
| 16 to 19 Years | 1,141 (44.8%) | 186 (16.3%) |
| 20 to 24 Years | 2,204 (70.5%) | 119 (5.4%) |
| 25 to 29 Years | 2,271 (87.4%) | 232 (10.2%) |
| 30 to 34 Years | 2,114 (84.3%) | 85 (4.0%) |
| 35 to 44 Years | 3,342 (82.2%) | 167 (5.0%) |
| 45 to 54 Years | 3,105 (80.7%) | 165 (5.3%) |
| 55 to 59 Years | 1,968 (72.2%) | 55 (2.8%) |
| 60 to 64 Years | 1,216 (56.2%) | 36 (3.0%) |
| 65 to 74 Years | 751 (23.6%) | 57 (7.6%) |
| 75 Years and over | 82 (4.6%) | 0 (0.0%) |
| Total | 18,178 (63.7%) | 1,091 (6.0%) |
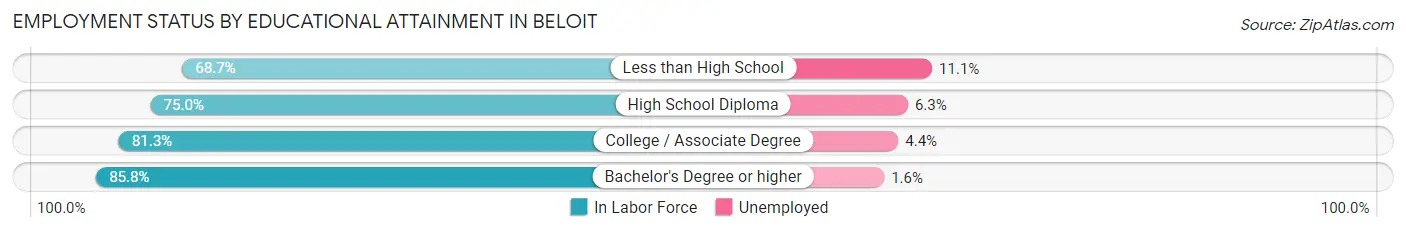
Employment Status by Educational Attainment in Beloit
According to labor force statistics for Beloit, 78.2% of individuals (14,004) out of the total population between 25 and 64 years of age (17,908) are in the labor force, with 5.3% or 742 of them being unemployed. The group with the highest labor force participation rate are those with the educational attainment of bachelor's degree or higher, with 85.8% or 2,810 individuals in the labor force. Within the labor force, individuals with less than high school education have the highest percentage of unemployment, with 11.1% or 183 of them being unemployed.
| Educational Attainment | In Labor Force | Unemployed |
| Less than High School | 1,651 (68.7%) | 267 (11.1%) |
| High School Diploma | 4,661 (75.0%) | 392 (6.3%) |
| College / Associate Degree | 4,890 (81.3%) | 265 (4.4%) |
| Bachelor's Degree or higher | 2,810 (85.8%) | 52 (1.6%) |
| Total | 14,004 (78.2%) | 949 (5.3%) |
Employment Occupations by Sex in Beloit
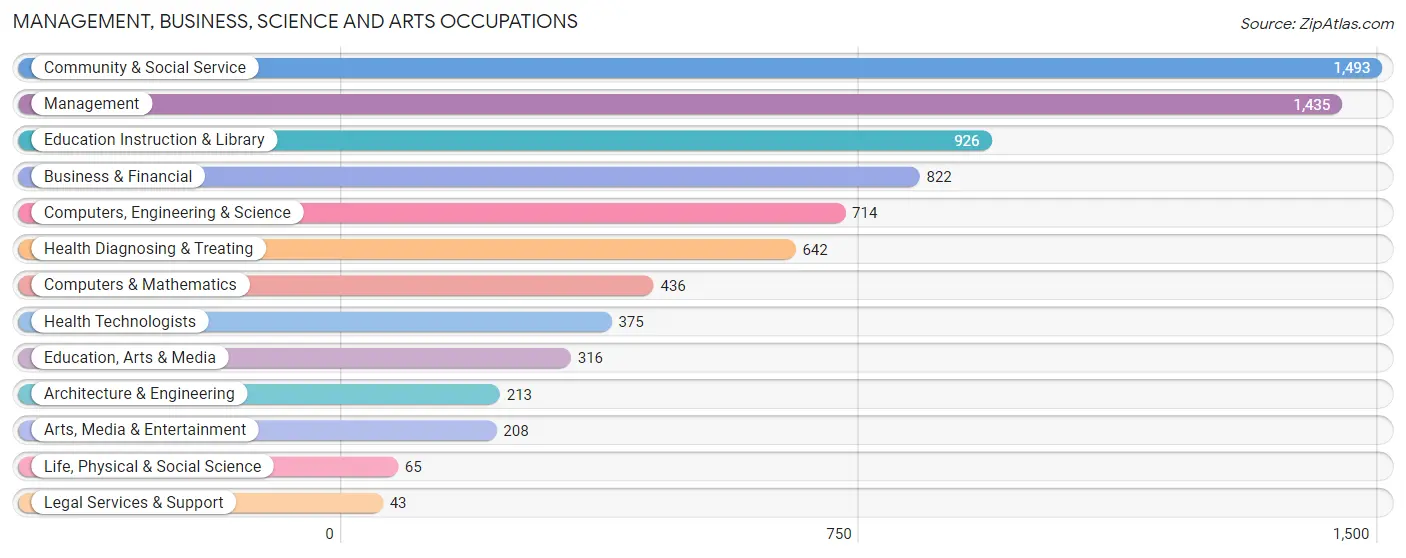
Management, Business, Science and Arts Occupations
The most common Management, Business, Science and Arts occupations in Beloit are Community & Social Service (1,493 | 8.8%), Management (1,435 | 8.4%), Education Instruction & Library (926 | 5.4%), Business & Financial (822 | 4.8%), and Computers, Engineering & Science (714 | 4.2%).
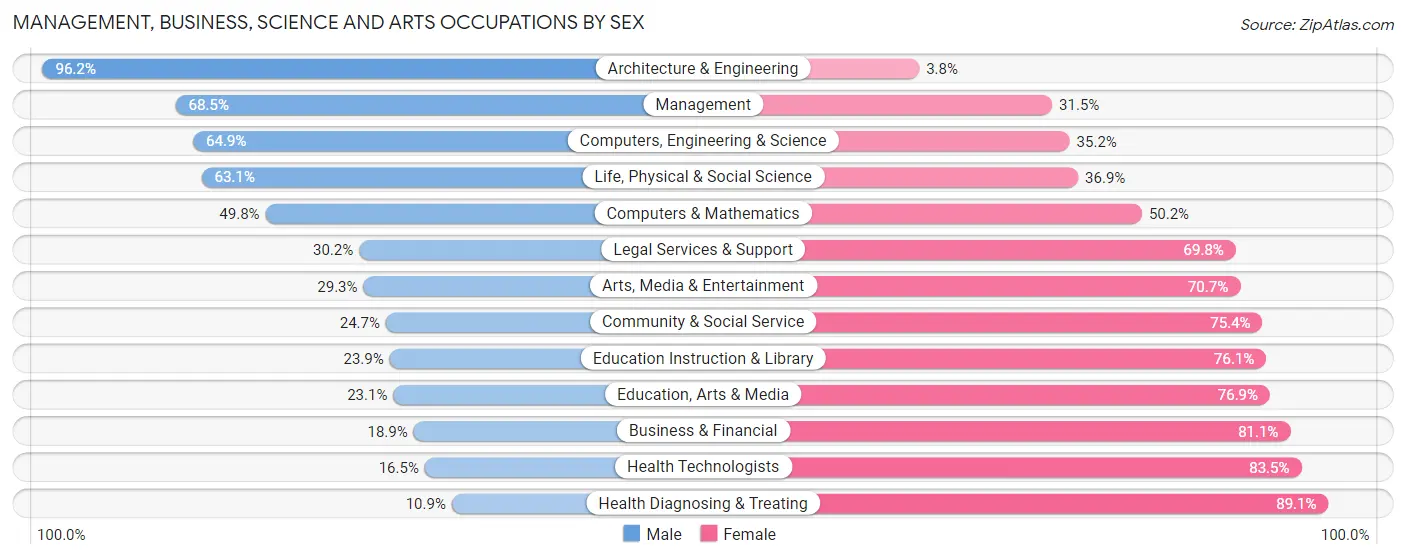
Management, Business, Science and Arts Occupations by Sex
Within the Management, Business, Science and Arts occupations in Beloit, the most male-oriented occupations are Architecture & Engineering (96.2%), Management (68.5%), and Computers, Engineering & Science (64.8%), while the most female-oriented occupations are Health Diagnosing & Treating (89.1%), Health Technologists (83.5%), and Business & Financial (81.1%).
| Occupation | Male | Female |
| Management | 983 (68.5%) | 452 (31.5%) |
| Business & Financial | 155 (18.9%) | 667 (81.1%) |
| Computers, Engineering & Science | 463 (64.8%) | 251 (35.1%) |
| Computers & Mathematics | 217 (49.8%) | 219 (50.2%) |
| Architecture & Engineering | 205 (96.2%) | 8 (3.8%) |
| Life, Physical & Social Science | 41 (63.1%) | 24 (36.9%) |
| Community & Social Service | 368 (24.6%) | 1,125 (75.3%) |
| Education, Arts & Media | 73 (23.1%) | 243 (76.9%) |
| Legal Services & Support | 13 (30.2%) | 30 (69.8%) |
| Education Instruction & Library | 221 (23.9%) | 705 (76.1%) |
| Arts, Media & Entertainment | 61 (29.3%) | 147 (70.7%) |
| Health Diagnosing & Treating | 70 (10.9%) | 572 (89.1%) |
| Health Technologists | 62 (16.5%) | 313 (83.5%) |
| Total (Category) | 2,039 (39.9%) | 3,067 (60.1%) |
| Total (Overall) | 8,440 (49.5%) | 8,605 (50.5%) |
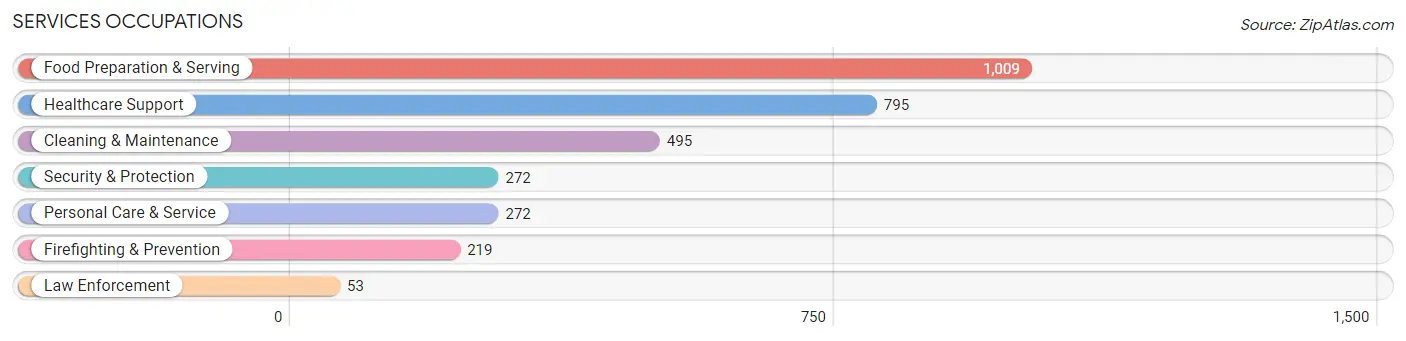
Services Occupations
The most common Services occupations in Beloit are Food Preparation & Serving (1,009 | 5.9%), Healthcare Support (795 | 4.7%), Cleaning & Maintenance (495 | 2.9%), Security & Protection (272 | 1.6%), and Personal Care & Service (272 | 1.6%).
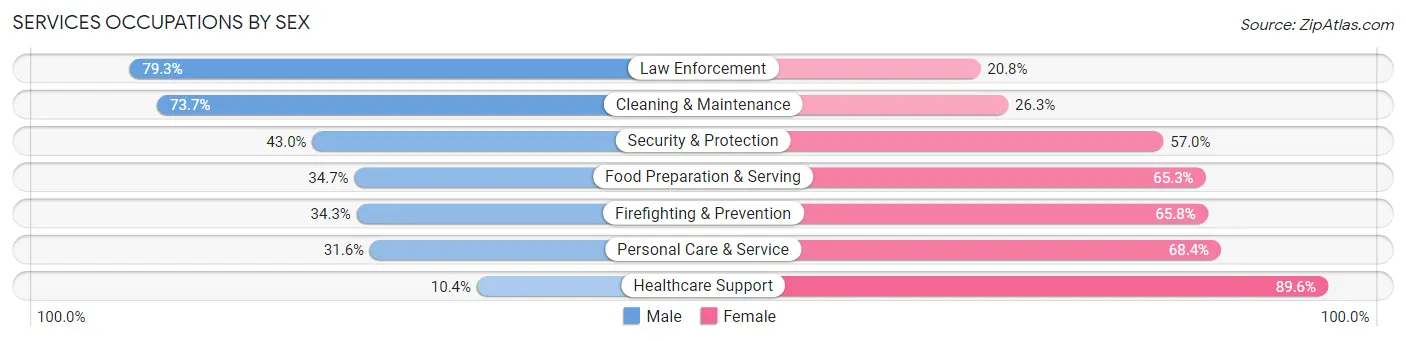
Services Occupations by Sex
Within the Services occupations in Beloit, the most male-oriented occupations are Law Enforcement (79.2%), Cleaning & Maintenance (73.7%), and Security & Protection (43.0%), while the most female-oriented occupations are Healthcare Support (89.6%), Personal Care & Service (68.4%), and Firefighting & Prevention (65.7%).
| Occupation | Male | Female |
| Healthcare Support | 83 (10.4%) | 712 (89.6%) |
| Security & Protection | 117 (43.0%) | 155 (57.0%) |
| Firefighting & Prevention | 75 (34.3%) | 144 (65.7%) |
| Law Enforcement | 42 (79.2%) | 11 (20.7%) |
| Food Preparation & Serving | 350 (34.7%) | 659 (65.3%) |
| Cleaning & Maintenance | 365 (73.7%) | 130 (26.3%) |
| Personal Care & Service | 86 (31.6%) | 186 (68.4%) |
| Total (Category) | 1,001 (35.2%) | 1,842 (64.8%) |
| Total (Overall) | 8,440 (49.5%) | 8,605 (50.5%) |
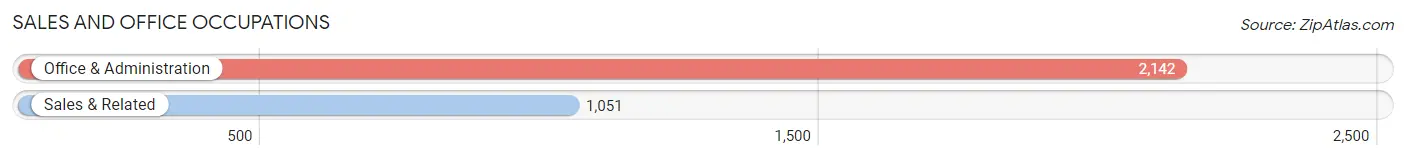
Sales and Office Occupations
The most common Sales and Office occupations in Beloit are Office & Administration (2,142 | 12.6%), and Sales & Related (1,051 | 6.2%).
Sales and Office Occupations by Sex
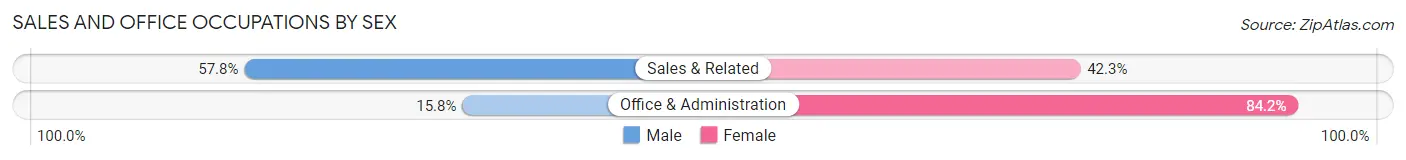
| Occupation | Male | Female |
| Sales & Related | 607 (57.8%) | 444 (42.2%) |
| Office & Administration | 339 (15.8%) | 1,803 (84.2%) |
| Total (Category) | 946 (29.6%) | 2,247 (70.4%) |
| Total (Overall) | 8,440 (49.5%) | 8,605 (50.5%) |
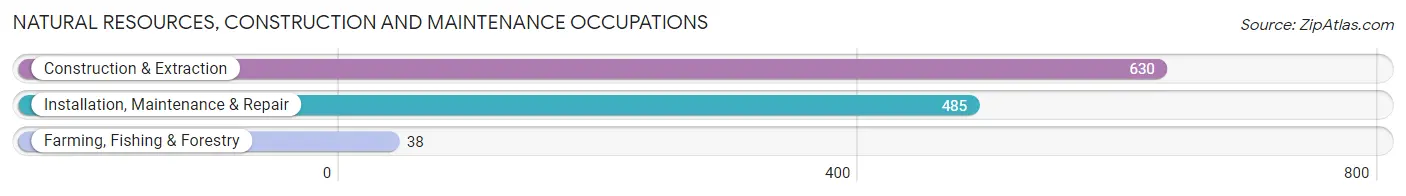
Natural Resources, Construction and Maintenance Occupations
The most common Natural Resources, Construction and Maintenance occupations in Beloit are Construction & Extraction (630 | 3.7%), Installation, Maintenance & Repair (485 | 2.9%), and Farming, Fishing & Forestry (38 | 0.2%).
Natural Resources, Construction and Maintenance Occupations by Sex
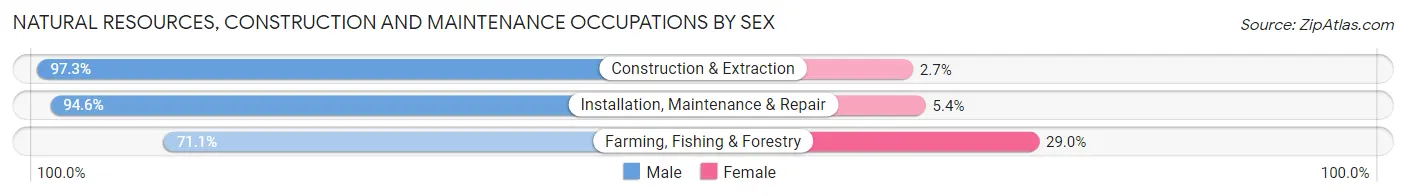
| Occupation | Male | Female |
| Farming, Fishing & Forestry | 27 (71.1%) | 11 (28.9%) |
| Construction & Extraction | 613 (97.3%) | 17 (2.7%) |
| Installation, Maintenance & Repair | 459 (94.6%) | 26 (5.4%) |
| Total (Category) | 1,099 (95.3%) | 54 (4.7%) |
| Total (Overall) | 8,440 (49.5%) | 8,605 (50.5%) |
Production, Transportation and Moving Occupations
The most common Production, Transportation and Moving occupations in Beloit are Production (2,560 | 15.0%), Material Moving (1,609 | 9.4%), and Transportation (581 | 3.4%).
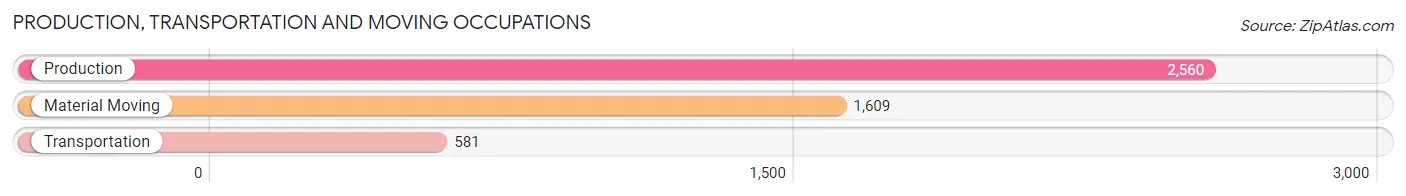
Production, Transportation and Moving Occupations by Sex
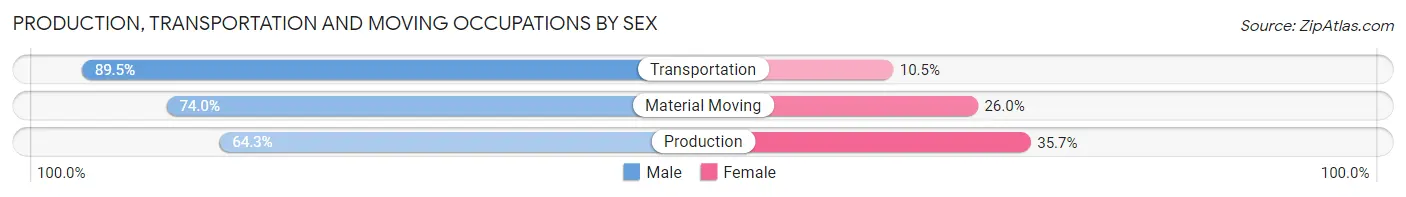
| Occupation | Male | Female |
| Production | 1,645 (64.3%) | 915 (35.7%) |
| Transportation | 520 (89.5%) | 61 (10.5%) |
| Material Moving | 1,190 (74.0%) | 419 (26.0%) |
| Total (Category) | 3,355 (70.6%) | 1,395 (29.4%) |
| Total (Overall) | 8,440 (49.5%) | 8,605 (50.5%) |
Employment Industries by Sex in Beloit
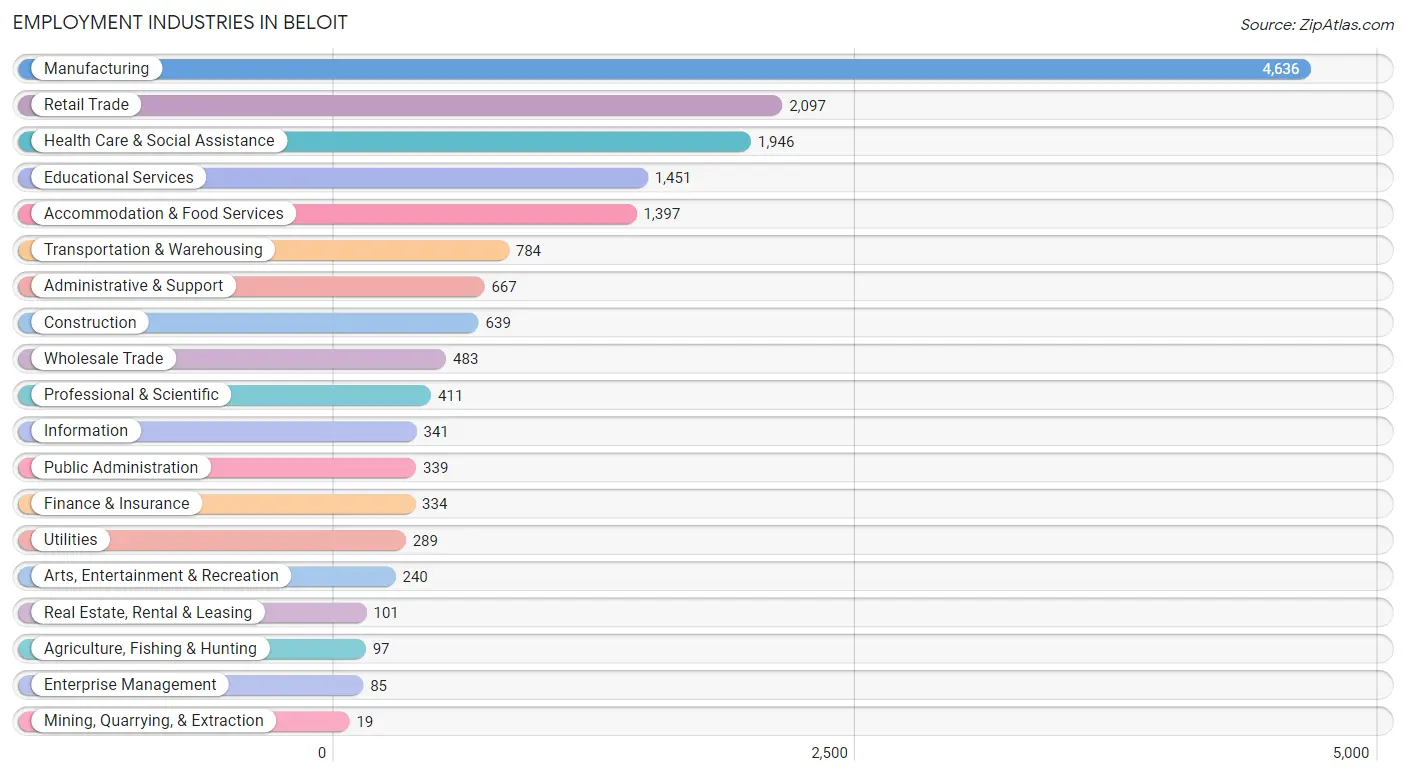
Employment Industries in Beloit
The major employment industries in Beloit include Manufacturing (4,636 | 27.2%), Retail Trade (2,097 | 12.3%), Health Care & Social Assistance (1,946 | 11.4%), Educational Services (1,451 | 8.5%), and Accommodation & Food Services (1,397 | 8.2%).
Employment Industries by Sex in Beloit
The Beloit industries that see more men than women are Mining, Quarrying, & Extraction (100.0%), Construction (94.5%), and Agriculture, Fishing & Hunting (88.7%), whereas the industries that tend to have a higher number of women are Enterprise Management (92.9%), Health Care & Social Assistance (86.3%), and Information (81.2%).
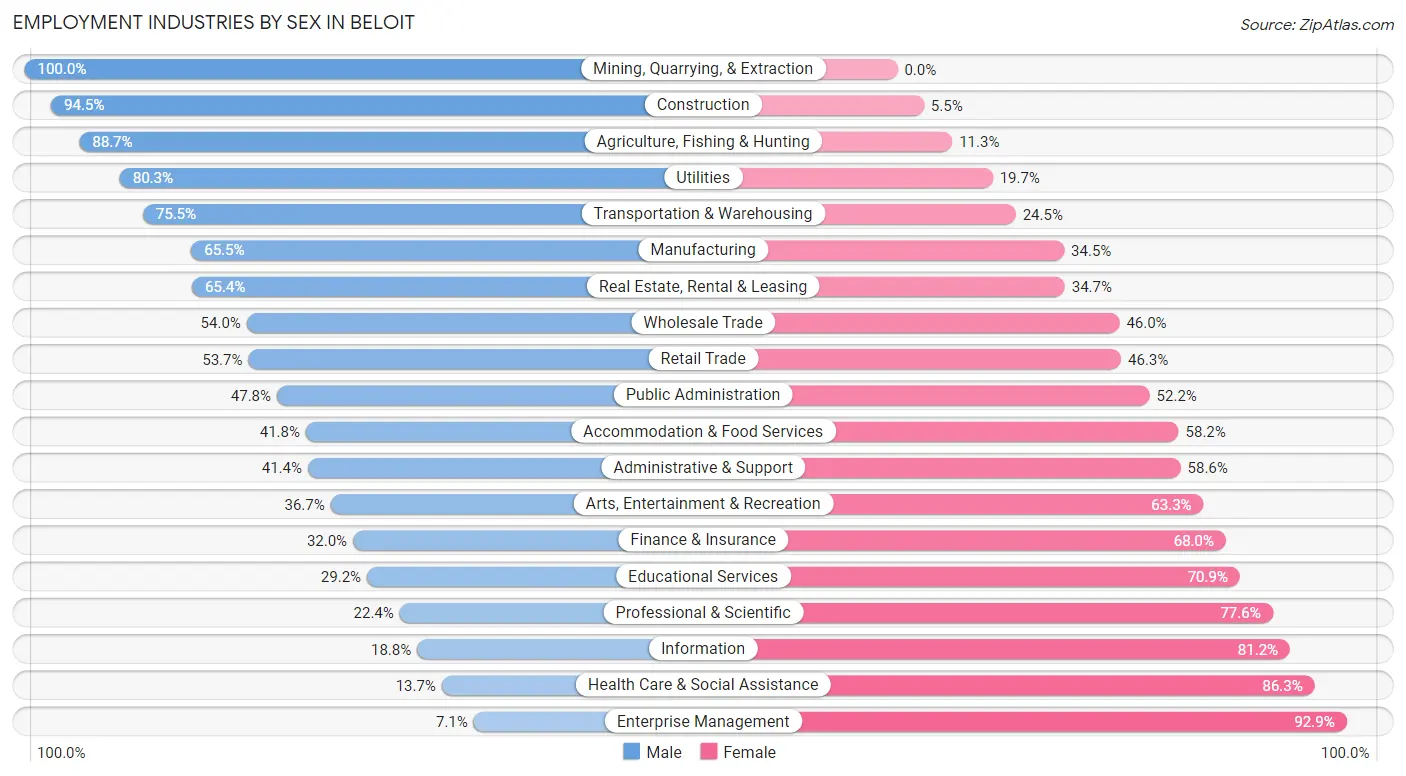
| Industry | Male | Female |
| Agriculture, Fishing & Hunting | 86 (88.7%) | 11 (11.3%) |
| Mining, Quarrying, & Extraction | 19 (100.0%) | 0 (0.0%) |
| Construction | 604 (94.5%) | 35 (5.5%) |
| Manufacturing | 3,036 (65.5%) | 1,600 (34.5%) |
| Wholesale Trade | 261 (54.0%) | 222 (46.0%) |
| Retail Trade | 1,126 (53.7%) | 971 (46.3%) |
| Transportation & Warehousing | 592 (75.5%) | 192 (24.5%) |
| Utilities | 232 (80.3%) | 57 (19.7%) |
| Information | 64 (18.8%) | 277 (81.2%) |
| Finance & Insurance | 107 (32.0%) | 227 (68.0%) |
| Real Estate, Rental & Leasing | 66 (65.3%) | 35 (34.6%) |
| Professional & Scientific | 92 (22.4%) | 319 (77.6%) |
| Enterprise Management | 6 (7.1%) | 79 (92.9%) |
| Administrative & Support | 276 (41.4%) | 391 (58.6%) |
| Educational Services | 423 (29.1%) | 1,028 (70.9%) |
| Health Care & Social Assistance | 266 (13.7%) | 1,680 (86.3%) |
| Arts, Entertainment & Recreation | 88 (36.7%) | 152 (63.3%) |
| Accommodation & Food Services | 584 (41.8%) | 813 (58.2%) |
| Public Administration | 162 (47.8%) | 177 (52.2%) |
| Total | 8,440 (49.5%) | 8,605 (50.5%) |
Education in Beloit
School Enrollment in Beloit
The most common levels of schooling among the 9,584 students in Beloit are college / undergraduate (2,651 | 27.7%), middle school (1,987 | 20.7%), and high school (1,955 | 20.4%).
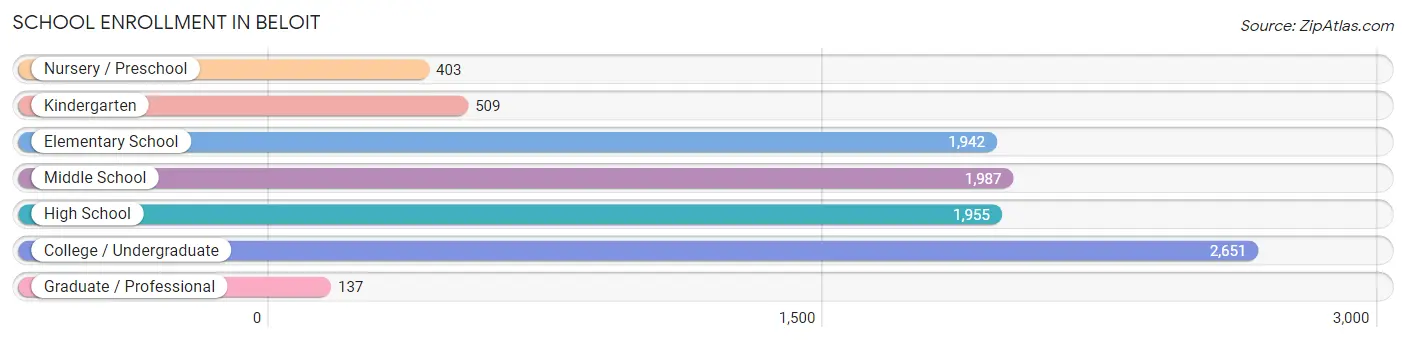
| School Level | # Students | % Students |
| Nursery / Preschool | 403 | 4.2% |
| Kindergarten | 509 | 5.3% |
| Elementary School | 1,942 | 20.3% |
| Middle School | 1,987 | 20.7% |
| High School | 1,955 | 20.4% |
| College / Undergraduate | 2,651 | 27.7% |
| Graduate / Professional | 137 | 1.4% |
| Total | 9,584 | 100.0% |
School Enrollment by Age by Funding Source in Beloit
Out of a total of 9,584 students who are enrolled in schools in Beloit, 2,032 (21.2%) attend a private institution, while the remaining 7,552 (78.8%) are enrolled in public schools. The age group of 20 to 24 year olds has the highest likelihood of being enrolled in private schools, with 694 (52.6% in the age bracket) enrolled. Conversely, the age group of 5 to 9 year old has the lowest likelihood of being enrolled in a private school, with 2,256 (96.4% in the age bracket) attending a public institution.
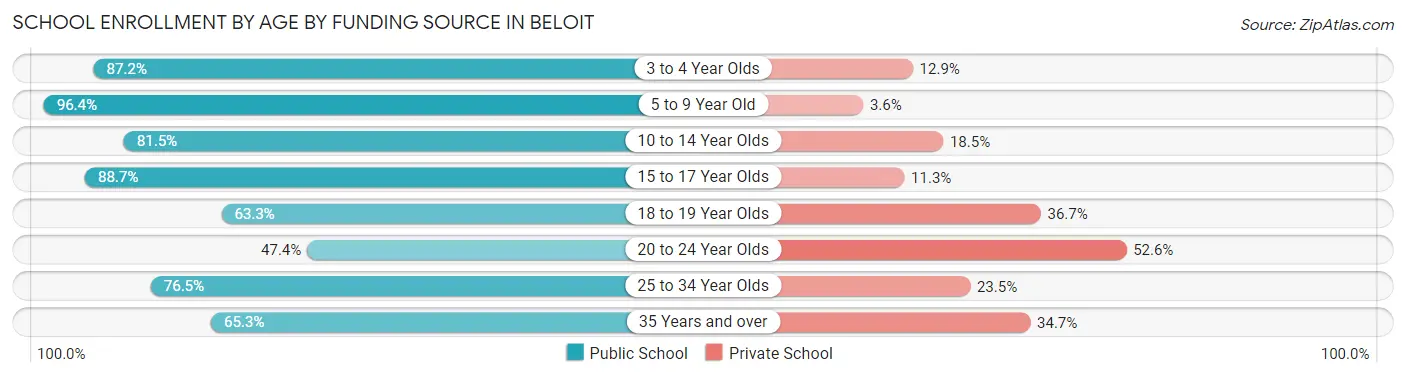
| Age Bracket | Public School | Private School |
| 3 to 4 Year Olds | 217 (87.2%) | 32 (12.9%) |
| 5 to 9 Year Old | 2,256 (96.4%) | 84 (3.6%) |
| 10 to 14 Year Olds | 2,124 (81.5%) | 482 (18.5%) |
| 15 to 17 Year Olds | 1,126 (88.7%) | 143 (11.3%) |
| 18 to 19 Year Olds | 684 (63.3%) | 396 (36.7%) |
| 20 to 24 Year Olds | 625 (47.4%) | 694 (52.6%) |
| 25 to 34 Year Olds | 351 (76.5%) | 108 (23.5%) |
| 35 Years and over | 171 (65.3%) | 91 (34.7%) |
| Total | 7,552 (78.8%) | 2,032 (21.2%) |
Educational Attainment by Field of Study in Beloit
Business (910 | 20.2%), education (856 | 19.0%), science & technology (355 | 7.9%), social sciences (352 | 7.8%), and arts & humanities (332 | 7.4%) are the most common fields of study among 4,501 individuals in Beloit who have obtained a bachelor's degree or higher.
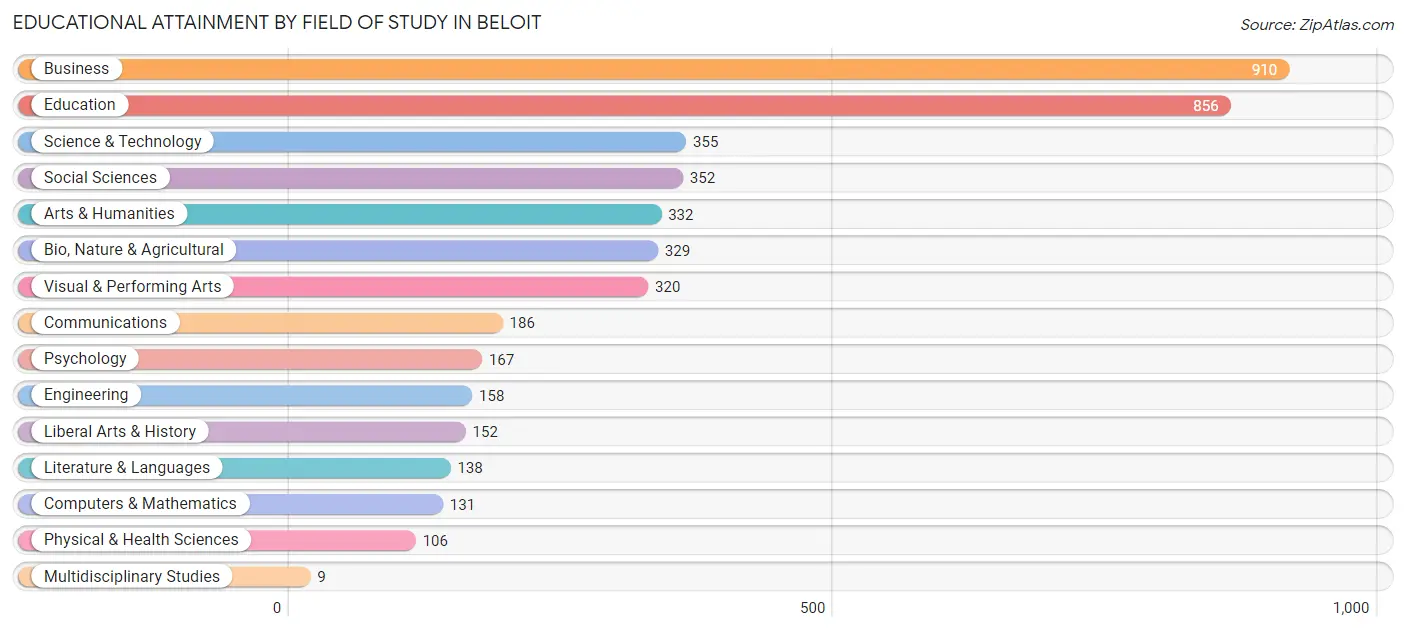
| Field of Study | # Graduates | % Graduates |
| Computers & Mathematics | 131 | 2.9% |
| Bio, Nature & Agricultural | 329 | 7.3% |
| Physical & Health Sciences | 106 | 2.4% |
| Psychology | 167 | 3.7% |
| Social Sciences | 352 | 7.8% |
| Engineering | 158 | 3.5% |
| Multidisciplinary Studies | 9 | 0.2% |
| Science & Technology | 355 | 7.9% |
| Business | 910 | 20.2% |
| Education | 856 | 19.0% |
| Literature & Languages | 138 | 3.1% |
| Liberal Arts & History | 152 | 3.4% |
| Visual & Performing Arts | 320 | 7.1% |
| Communications | 186 | 4.1% |
| Arts & Humanities | 332 | 7.4% |
| Total | 4,501 | 100.0% |
Transportation & Commute in Beloit
Vehicle Availability by Sex in Beloit
The most prevalent vehicle ownership categories in Beloit are males with 2 vehicles (3,424, accounting for 42.4%) and females with 2 vehicles (3,524, making up 42.0%).
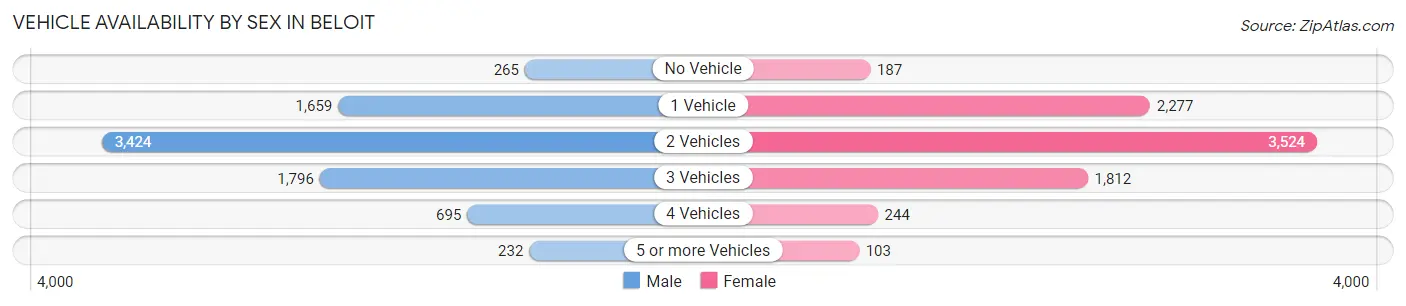
| Vehicles Available | Male | Female |
| No Vehicle | 265 (3.3%) | 187 (2.3%) |
| 1 Vehicle | 1,659 (20.6%) | 2,277 (28.0%) |
| 2 Vehicles | 3,424 (42.4%) | 3,524 (43.3%) |
| 3 Vehicles | 1,796 (22.3%) | 1,812 (22.2%) |
| 4 Vehicles | 695 (8.6%) | 244 (3.0%) |
| 5 or more Vehicles | 232 (2.9%) | 103 (1.3%) |
| Total | 8,071 (100.0%) | 8,147 (100.0%) |
Commute Time in Beloit
The most frequently occuring commute durations in Beloit are 10 to 14 minutes (2,973 commuters, 18.7%), 5 to 9 minutes (2,667 commuters, 16.8%), and 15 to 19 minutes (1,998 commuters, 12.6%).
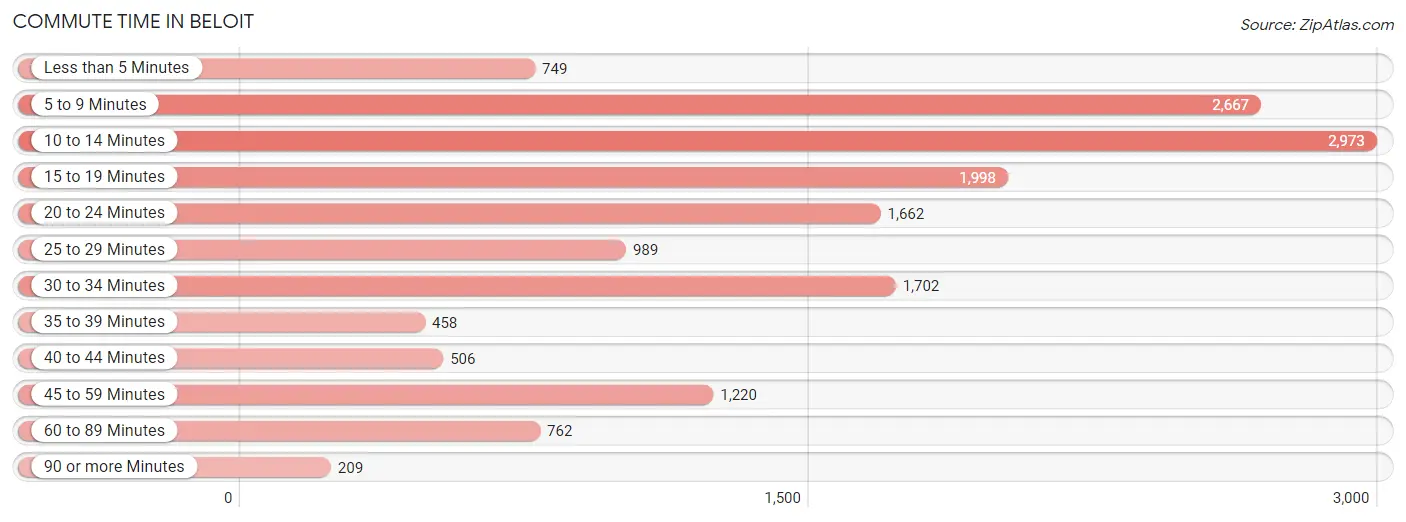
| Commute Time | # Commuters | % Commuters |
| Less than 5 Minutes | 749 | 4.7% |
| 5 to 9 Minutes | 2,667 | 16.8% |
| 10 to 14 Minutes | 2,973 | 18.7% |
| 15 to 19 Minutes | 1,998 | 12.6% |
| 20 to 24 Minutes | 1,662 | 10.5% |
| 25 to 29 Minutes | 989 | 6.2% |
| 30 to 34 Minutes | 1,702 | 10.7% |
| 35 to 39 Minutes | 458 | 2.9% |
| 40 to 44 Minutes | 506 | 3.2% |
| 45 to 59 Minutes | 1,220 | 7.7% |
| 60 to 89 Minutes | 762 | 4.8% |
| 90 or more Minutes | 209 | 1.3% |
Commute Time by Sex in Beloit
The most common commute times in Beloit are 10 to 14 minutes (1,388 commuters, 17.4%) for males and 10 to 14 minutes (1,585 commuters, 20.0%) for females.
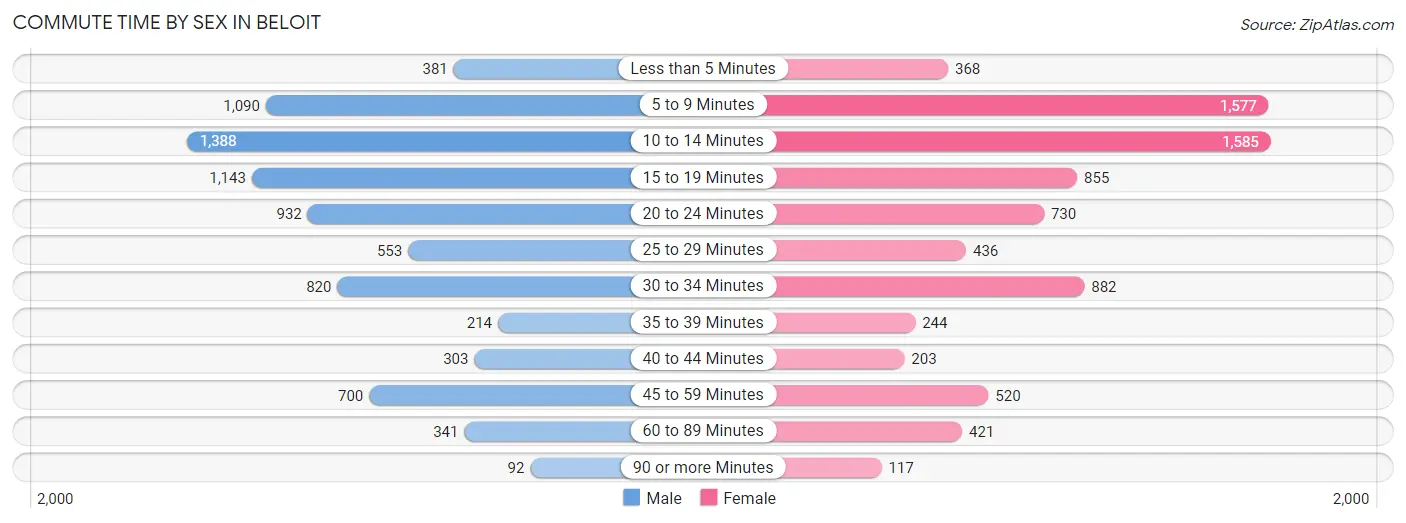
| Commute Time | Male | Female |
| Less than 5 Minutes | 381 (4.8%) | 368 (4.6%) |
| 5 to 9 Minutes | 1,090 (13.7%) | 1,577 (19.9%) |
| 10 to 14 Minutes | 1,388 (17.4%) | 1,585 (20.0%) |
| 15 to 19 Minutes | 1,143 (14.4%) | 855 (10.8%) |
| 20 to 24 Minutes | 932 (11.7%) | 730 (9.2%) |
| 25 to 29 Minutes | 553 (7.0%) | 436 (5.5%) |
| 30 to 34 Minutes | 820 (10.3%) | 882 (11.1%) |
| 35 to 39 Minutes | 214 (2.7%) | 244 (3.1%) |
| 40 to 44 Minutes | 303 (3.8%) | 203 (2.6%) |
| 45 to 59 Minutes | 700 (8.8%) | 520 (6.6%) |
| 60 to 89 Minutes | 341 (4.3%) | 421 (5.3%) |
| 90 or more Minutes | 92 (1.2%) | 117 (1.5%) |
Time of Departure to Work by Sex in Beloit
The most frequent times of departure to work in Beloit are 7:00 AM to 7:29 AM (1,052, 13.2%) for males and 7:30 AM to 7:59 AM (1,143, 14.4%) for females.
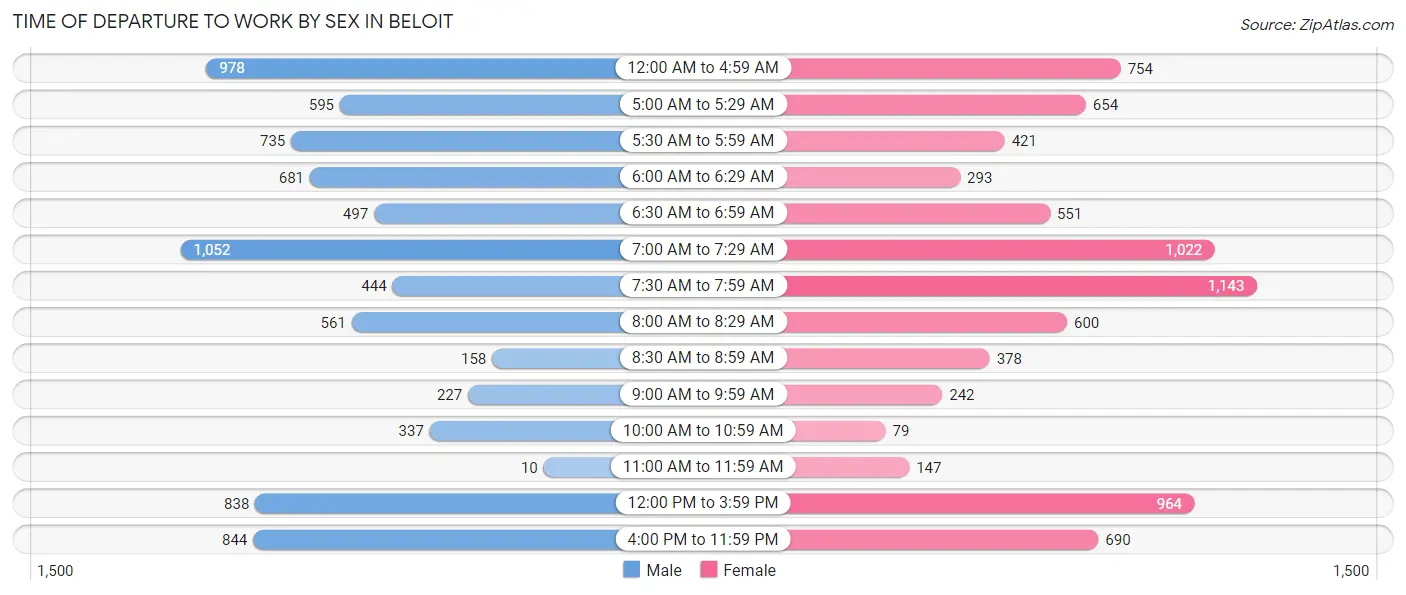
| Time of Departure | Male | Female |
| 12:00 AM to 4:59 AM | 978 (12.3%) | 754 (9.5%) |
| 5:00 AM to 5:29 AM | 595 (7.5%) | 654 (8.2%) |
| 5:30 AM to 5:59 AM | 735 (9.2%) | 421 (5.3%) |
| 6:00 AM to 6:29 AM | 681 (8.6%) | 293 (3.7%) |
| 6:30 AM to 6:59 AM | 497 (6.2%) | 551 (6.9%) |
| 7:00 AM to 7:29 AM | 1,052 (13.2%) | 1,022 (12.9%) |
| 7:30 AM to 7:59 AM | 444 (5.6%) | 1,143 (14.4%) |
| 8:00 AM to 8:29 AM | 561 (7.0%) | 600 (7.6%) |
| 8:30 AM to 8:59 AM | 158 (2.0%) | 378 (4.8%) |
| 9:00 AM to 9:59 AM | 227 (2.9%) | 242 (3.0%) |
| 10:00 AM to 10:59 AM | 337 (4.2%) | 79 (1.0%) |
| 11:00 AM to 11:59 AM | 10 (0.1%) | 147 (1.8%) |
| 12:00 PM to 3:59 PM | 838 (10.5%) | 964 (12.1%) |
| 4:00 PM to 11:59 PM | 844 (10.6%) | 690 (8.7%) |
| Total | 7,957 (100.0%) | 7,938 (100.0%) |
Housing Occupancy in Beloit
Occupancy by Ownership in Beloit
Of the total 13,919 dwellings in Beloit, owner-occupied units account for 8,256 (59.3%), while renter-occupied units make up 5,663 (40.7%).
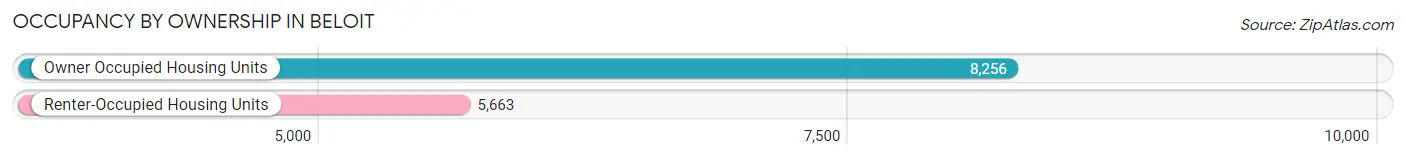
| Occupancy | # Housing Units | % Housing Units |
| Owner Occupied Housing Units | 8,256 | 59.3% |
| Renter-Occupied Housing Units | 5,663 | 40.7% |
| Total Occupied Housing Units | 13,919 | 100.0% |
Occupancy by Household Size in Beloit
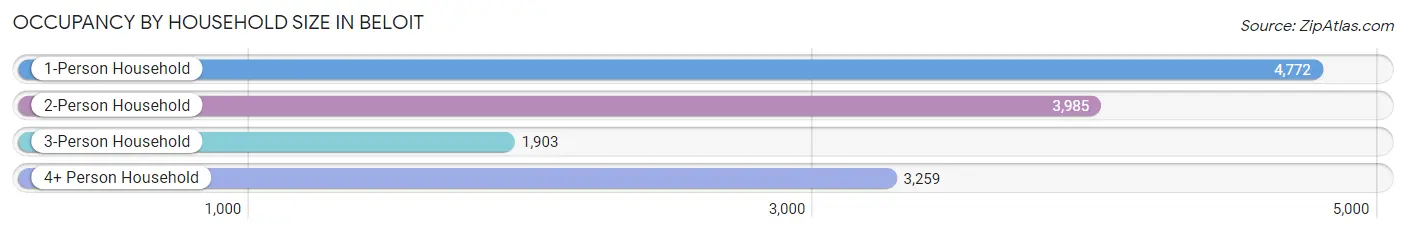
| Household Size | # Housing Units | % Housing Units |
| 1-Person Household | 4,772 | 34.3% |
| 2-Person Household | 3,985 | 28.6% |
| 3-Person Household | 1,903 | 13.7% |
| 4+ Person Household | 3,259 | 23.4% |
| Total Housing Units | 13,919 | 100.0% |
Occupancy by Ownership by Household Size in Beloit
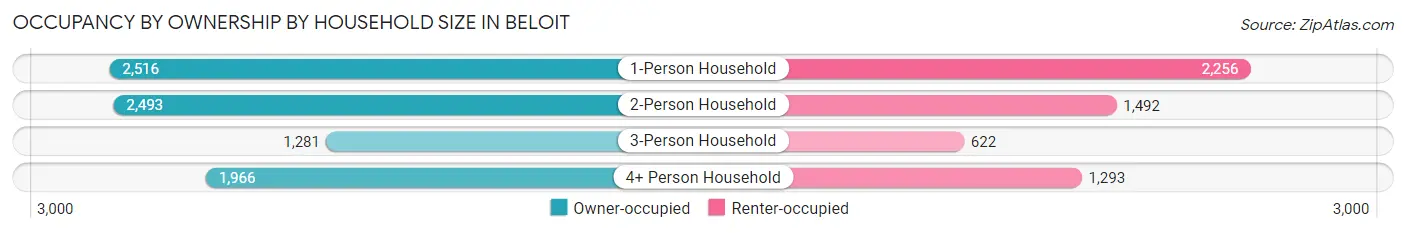
| Household Size | Owner-occupied | Renter-occupied |
| 1-Person Household | 2,516 (52.7%) | 2,256 (47.3%) |
| 2-Person Household | 2,493 (62.6%) | 1,492 (37.4%) |
| 3-Person Household | 1,281 (67.3%) | 622 (32.7%) |
| 4+ Person Household | 1,966 (60.3%) | 1,293 (39.7%) |
| Total Housing Units | 8,256 (59.3%) | 5,663 (40.7%) |
Occupancy by Educational Attainment in Beloit
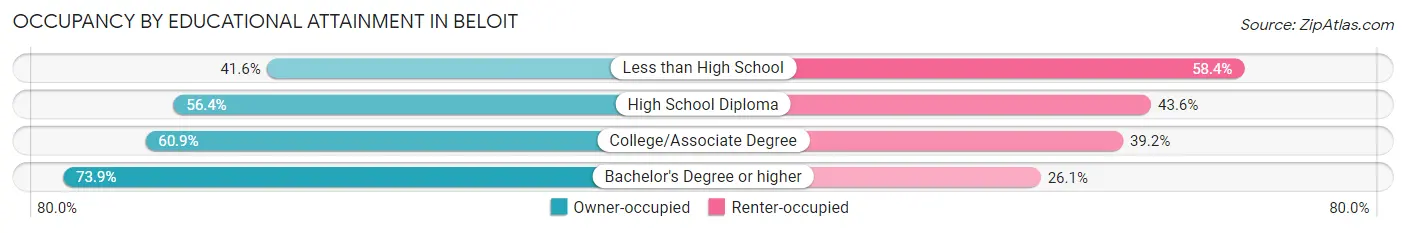
| Household Size | Owner-occupied | Renter-occupied |
| Less than High School | 746 (41.6%) | 1,046 (58.4%) |
| High School Diploma | 2,861 (56.4%) | 2,213 (43.6%) |
| College/Associate Degree | 2,625 (60.9%) | 1,689 (39.2%) |
| Bachelor's Degree or higher | 2,024 (73.9%) | 715 (26.1%) |
Occupancy by Age of Householder in Beloit
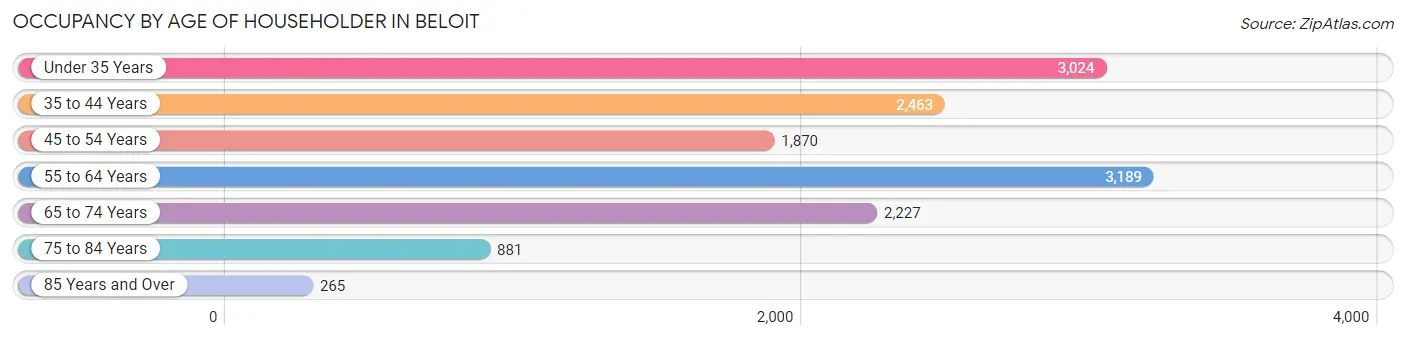
| Age Bracket | # Households | % Households |
| Under 35 Years | 3,024 | 21.7% |
| 35 to 44 Years | 2,463 | 17.7% |
| 45 to 54 Years | 1,870 | 13.4% |
| 55 to 64 Years | 3,189 | 22.9% |
| 65 to 74 Years | 2,227 | 16.0% |
| 75 to 84 Years | 881 | 6.3% |
| 85 Years and Over | 265 | 1.9% |
| Total | 13,919 | 100.0% |
Housing Finances in Beloit
Median Income by Occupancy in Beloit
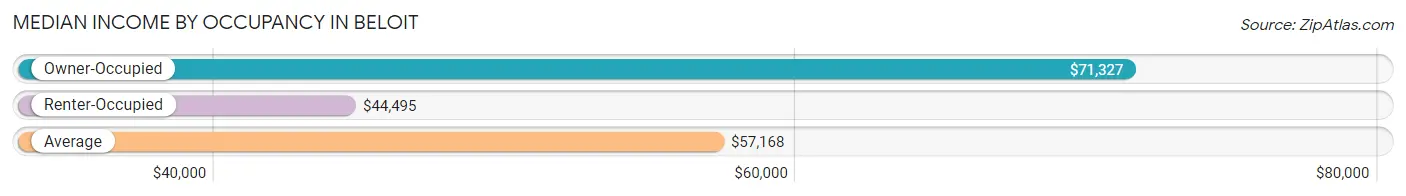
| Occupancy Type | # Households | Median Income |
| Owner-Occupied | 8,256 (59.3%) | $71,327 |
| Renter-Occupied | 5,663 (40.7%) | $44,495 |
| Average | 13,919 (100.0%) | $57,168 |
Occupancy by Householder Income Bracket in Beloit
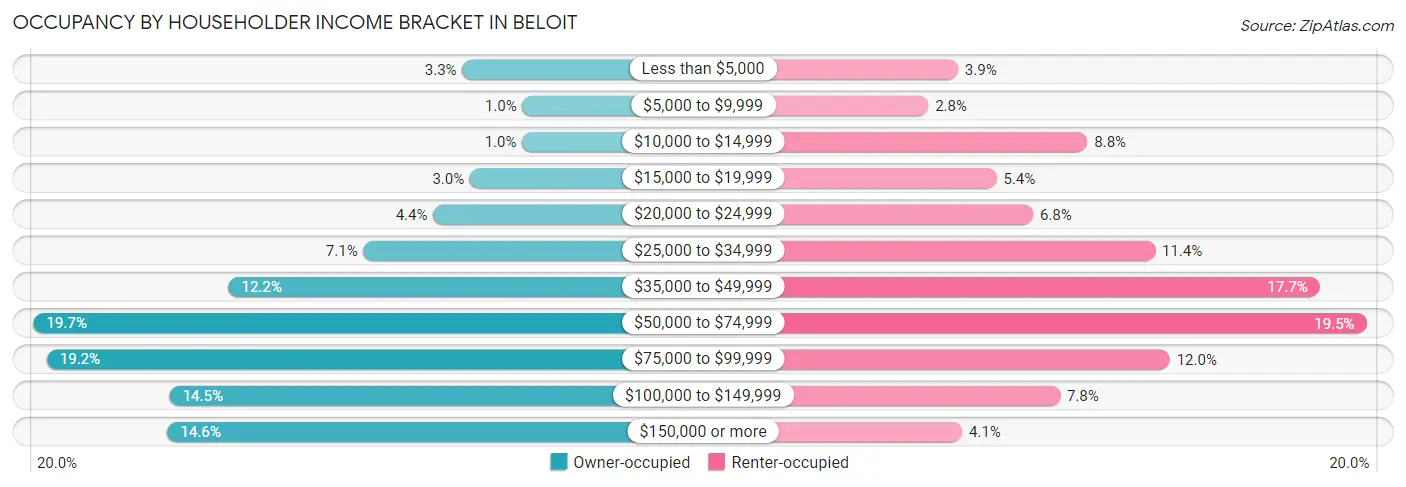
| Income Bracket | Owner-occupied | Renter-occupied |
| Less than $5,000 | 274 (3.3%) | 221 (3.9%) |
| $5,000 to $9,999 | 85 (1.0%) | 157 (2.8%) |
| $10,000 to $14,999 | 86 (1.0%) | 500 (8.8%) |
| $15,000 to $19,999 | 250 (3.0%) | 304 (5.4%) |
| $20,000 to $24,999 | 366 (4.4%) | 383 (6.8%) |
| $25,000 to $34,999 | 585 (7.1%) | 646 (11.4%) |
| $35,000 to $49,999 | 1,010 (12.2%) | 1,001 (17.7%) |
| $50,000 to $74,999 | 1,623 (19.7%) | 1,102 (19.5%) |
| $75,000 to $99,999 | 1,581 (19.2%) | 678 (12.0%) |
| $100,000 to $149,999 | 1,195 (14.5%) | 441 (7.8%) |
| $150,000 or more | 1,201 (14.5%) | 230 (4.1%) |
| Total | 8,256 (100.0%) | 5,663 (100.0%) |
Monthly Housing Cost Tiers in Beloit
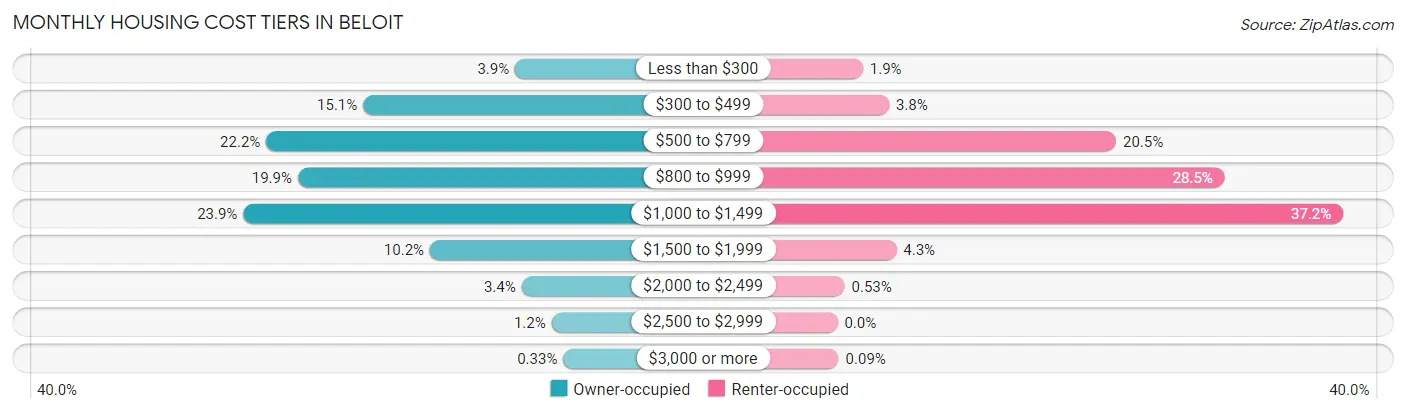
| Monthly Cost | Owner-occupied | Renter-occupied |
| Less than $300 | 320 (3.9%) | 106 (1.9%) |
| $300 to $499 | 1,244 (15.1%) | 215 (3.8%) |
| $500 to $799 | 1,834 (22.2%) | 1,162 (20.5%) |
| $800 to $999 | 1,641 (19.9%) | 1,615 (28.5%) |
| $1,000 to $1,499 | 1,973 (23.9%) | 2,109 (37.2%) |
| $1,500 to $1,999 | 838 (10.2%) | 246 (4.3%) |
| $2,000 to $2,499 | 281 (3.4%) | 30 (0.5%) |
| $2,500 to $2,999 | 98 (1.2%) | 0 (0.0%) |
| $3,000 or more | 27 (0.3%) | 5 (0.1%) |
| Total | 8,256 (100.0%) | 5,663 (100.0%) |
Physical Housing Characteristics in Beloit
Housing Structures in Beloit
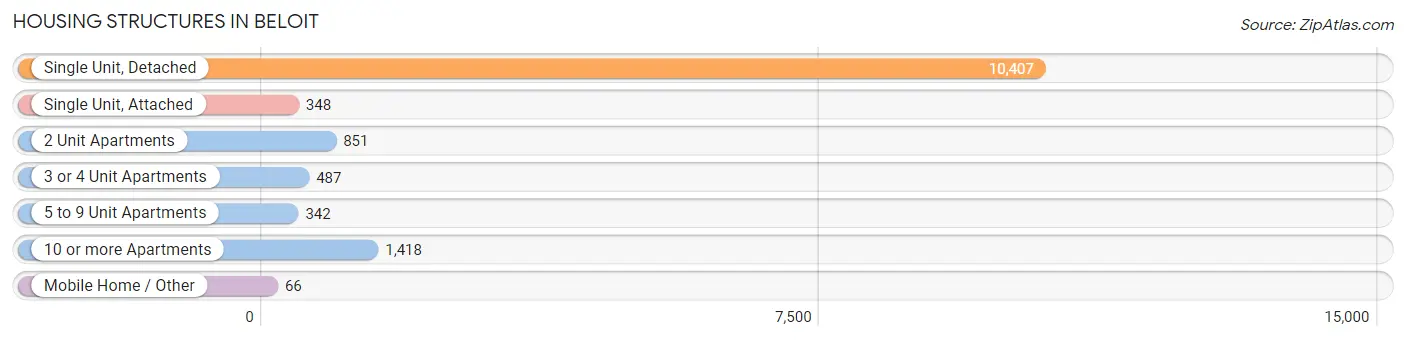
| Structure Type | # Housing Units | % Housing Units |
| Single Unit, Detached | 10,407 | 74.8% |
| Single Unit, Attached | 348 | 2.5% |
| 2 Unit Apartments | 851 | 6.1% |
| 3 or 4 Unit Apartments | 487 | 3.5% |
| 5 to 9 Unit Apartments | 342 | 2.5% |
| 10 or more Apartments | 1,418 | 10.2% |
| Mobile Home / Other | 66 | 0.5% |
| Total | 13,919 | 100.0% |
Housing Structures by Occupancy in Beloit
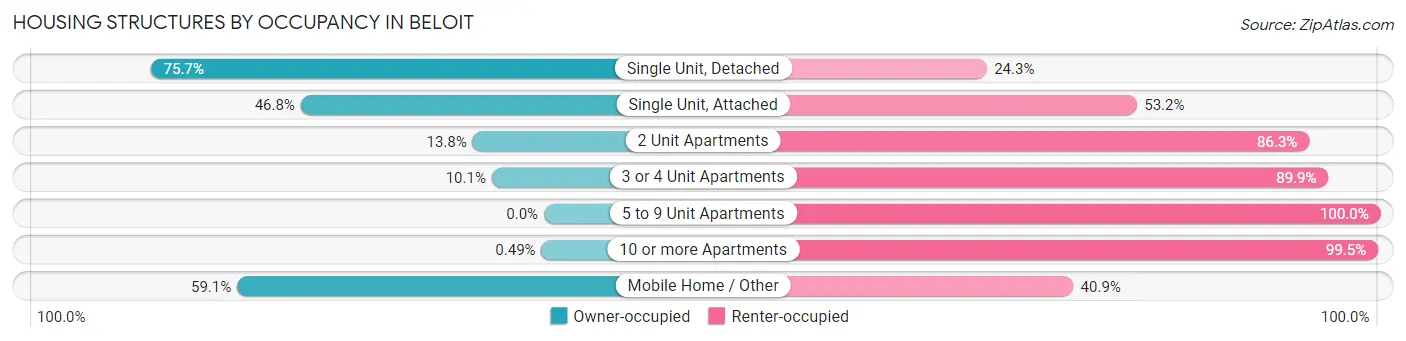
| Structure Type | Owner-occupied | Renter-occupied |
| Single Unit, Detached | 7,881 (75.7%) | 2,526 (24.3%) |
| Single Unit, Attached | 163 (46.8%) | 185 (53.2%) |
| 2 Unit Apartments | 117 (13.8%) | 734 (86.3%) |
| 3 or 4 Unit Apartments | 49 (10.1%) | 438 (89.9%) |
| 5 to 9 Unit Apartments | 0 (0.0%) | 342 (100.0%) |
| 10 or more Apartments | 7 (0.5%) | 1,411 (99.5%) |
| Mobile Home / Other | 39 (59.1%) | 27 (40.9%) |
| Total | 8,256 (59.3%) | 5,663 (40.7%) |
Housing Structures by Number of Rooms in Beloit
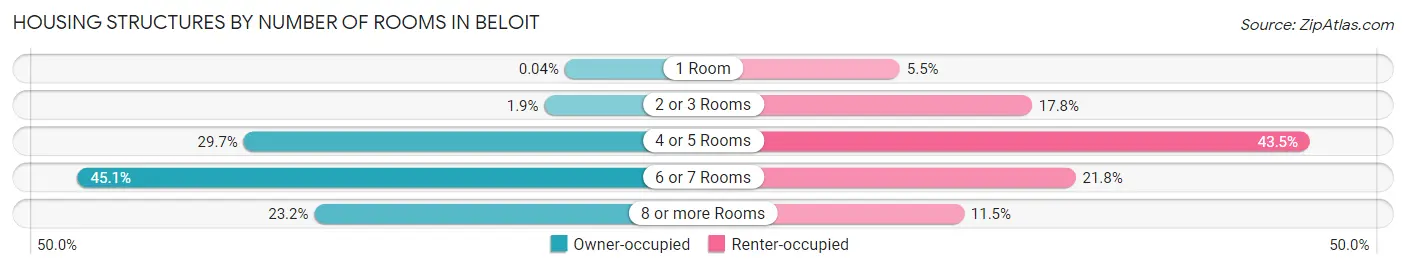
| Number of Rooms | Owner-occupied | Renter-occupied |
| 1 Room | 3 (0.0%) | 314 (5.5%) |
| 2 or 3 Rooms | 159 (1.9%) | 1,005 (17.7%) |
| 4 or 5 Rooms | 2,455 (29.7%) | 2,461 (43.5%) |
| 6 or 7 Rooms | 3,723 (45.1%) | 1,234 (21.8%) |
| 8 or more Rooms | 1,916 (23.2%) | 649 (11.5%) |
| Total | 8,256 (100.0%) | 5,663 (100.0%) |
Housing Structure by Heating Type in Beloit
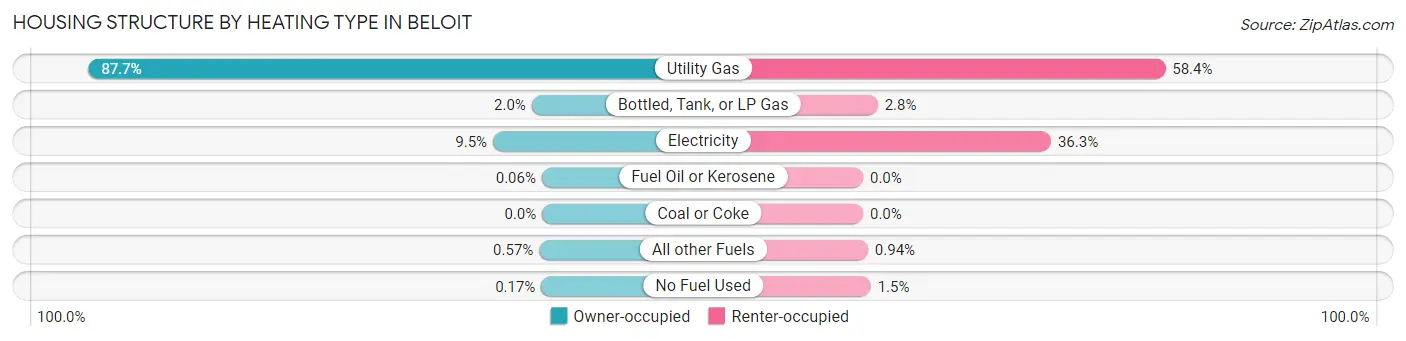
| Heating Type | Owner-occupied | Renter-occupied |
| Utility Gas | 7,240 (87.7%) | 3,308 (58.4%) |
| Bottled, Tank, or LP Gas | 166 (2.0%) | 161 (2.8%) |
| Electricity | 784 (9.5%) | 2,057 (36.3%) |
| Fuel Oil or Kerosene | 5 (0.1%) | 0 (0.0%) |
| Coal or Coke | 0 (0.0%) | 0 (0.0%) |
| All other Fuels | 47 (0.6%) | 53 (0.9%) |
| No Fuel Used | 14 (0.2%) | 84 (1.5%) |
| Total | 8,256 (100.0%) | 5,663 (100.0%) |
Household Vehicle Usage in Beloit
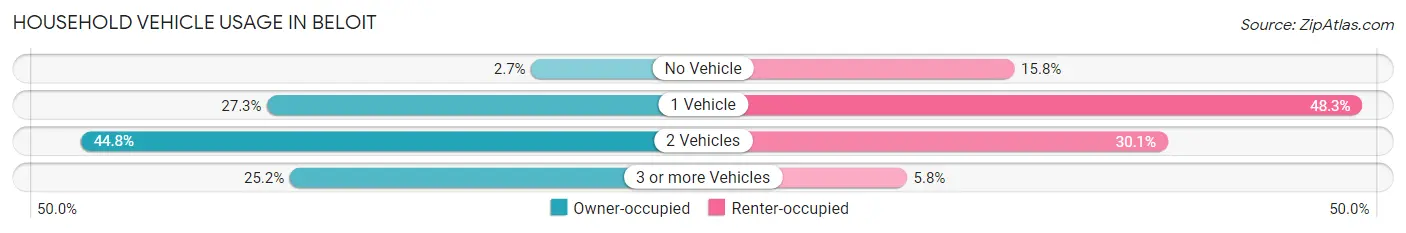
| Vehicles per Household | Owner-occupied | Renter-occupied |
| No Vehicle | 222 (2.7%) | 895 (15.8%) |
| 1 Vehicle | 2,257 (27.3%) | 2,735 (48.3%) |
| 2 Vehicles | 3,695 (44.8%) | 1,707 (30.1%) |
| 3 or more Vehicles | 2,082 (25.2%) | 326 (5.8%) |
| Total | 8,256 (100.0%) | 5,663 (100.0%) |
Real Estate & Mortgages in Beloit
Real Estate and Mortgage Overview in Beloit
| Characteristic | Without Mortgage | With Mortgage |
| Housing Units | 3,074 | 5,182 |
| Median Property Value | $114,500 | $126,500 |
| Median Household Income | $68,673 | $745 |
| Monthly Housing Costs | $501 | $15 |
| Real Estate Taxes | $2,305 | $47 |
Property Value by Mortgage Status in Beloit
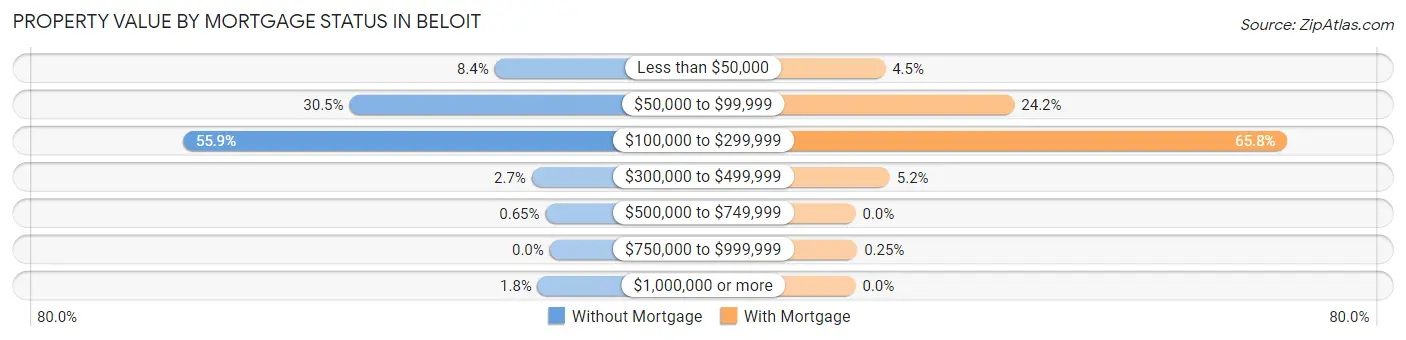
| Property Value | Without Mortgage | With Mortgage |
| Less than $50,000 | 258 (8.4%) | 234 (4.5%) |
| $50,000 to $99,999 | 938 (30.5%) | 1,254 (24.2%) |
| $100,000 to $299,999 | 1,718 (55.9%) | 3,410 (65.8%) |
| $300,000 to $499,999 | 84 (2.7%) | 271 (5.2%) |
| $500,000 to $749,999 | 20 (0.6%) | 0 (0.0%) |
| $750,000 to $999,999 | 0 (0.0%) | 13 (0.3%) |
| $1,000,000 or more | 56 (1.8%) | 0 (0.0%) |
| Total | 3,074 (100.0%) | 5,182 (100.0%) |
Household Income by Mortgage Status in Beloit
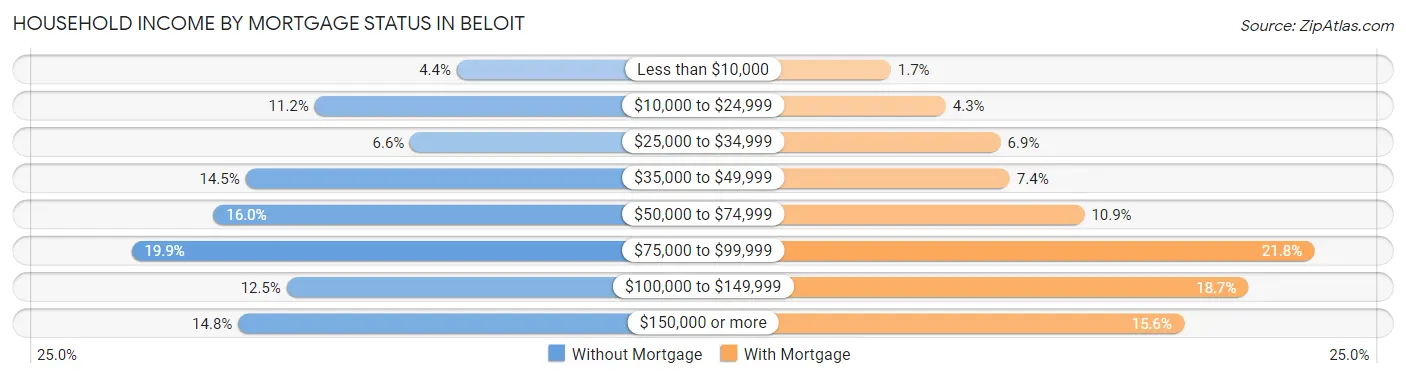
| Household Income | Without Mortgage | With Mortgage |
| Less than $10,000 | 136 (4.4%) | 87 (1.7%) |
| $10,000 to $24,999 | 344 (11.2%) | 223 (4.3%) |
| $25,000 to $34,999 | 204 (6.6%) | 358 (6.9%) |
| $35,000 to $49,999 | 445 (14.5%) | 381 (7.3%) |
| $50,000 to $74,999 | 492 (16.0%) | 565 (10.9%) |
| $75,000 to $99,999 | 612 (19.9%) | 1,131 (21.8%) |
| $100,000 to $149,999 | 385 (12.5%) | 969 (18.7%) |
| $150,000 or more | 456 (14.8%) | 810 (15.6%) |
| Total | 3,074 (100.0%) | 5,182 (100.0%) |
Property Value to Household Income Ratio in Beloit
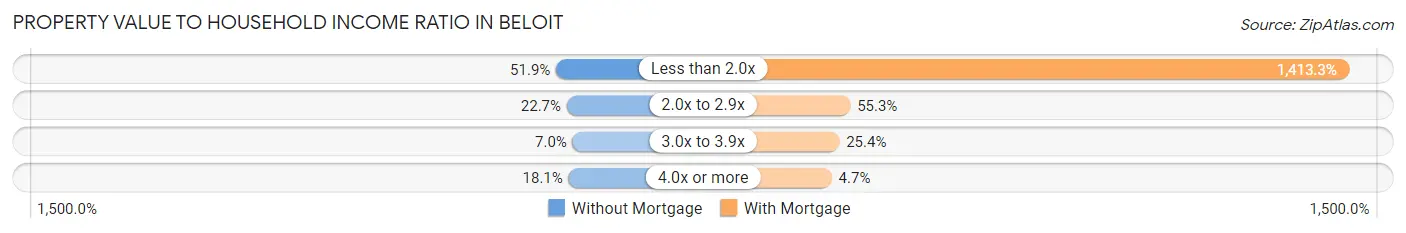
| Value-to-Income Ratio | Without Mortgage | With Mortgage |
| Less than 2.0x | 1,596 (51.9%) | 73,237 (1,413.3%) |
| 2.0x to 2.9x | 699 (22.7%) | 2,863 (55.2%) |
| 3.0x to 3.9x | 215 (7.0%) | 1,314 (25.4%) |
| 4.0x or more | 556 (18.1%) | 244 (4.7%) |
| Total | 3,074 (100.0%) | 5,182 (100.0%) |
Real Estate Taxes by Mortgage Status in Beloit
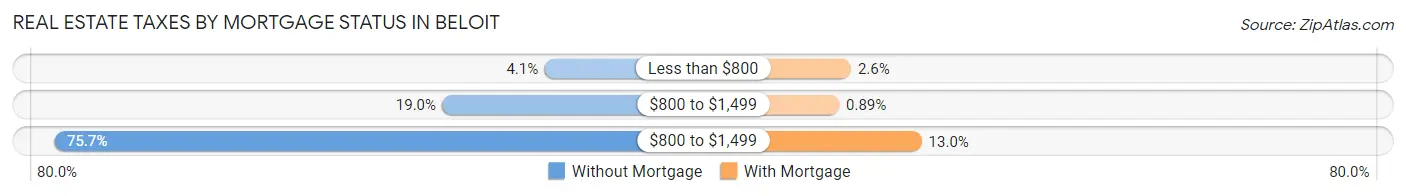
| Property Taxes | Without Mortgage | With Mortgage |
| Less than $800 | 126 (4.1%) | 136 (2.6%) |
| $800 to $1,499 | 585 (19.0%) | 46 (0.9%) |
| $800 to $1,499 | 2,327 (75.7%) | 671 (13.0%) |
| Total | 3,074 (100.0%) | 5,182 (100.0%) |
Health & Disability in Beloit
Health Insurance Coverage by Age in Beloit
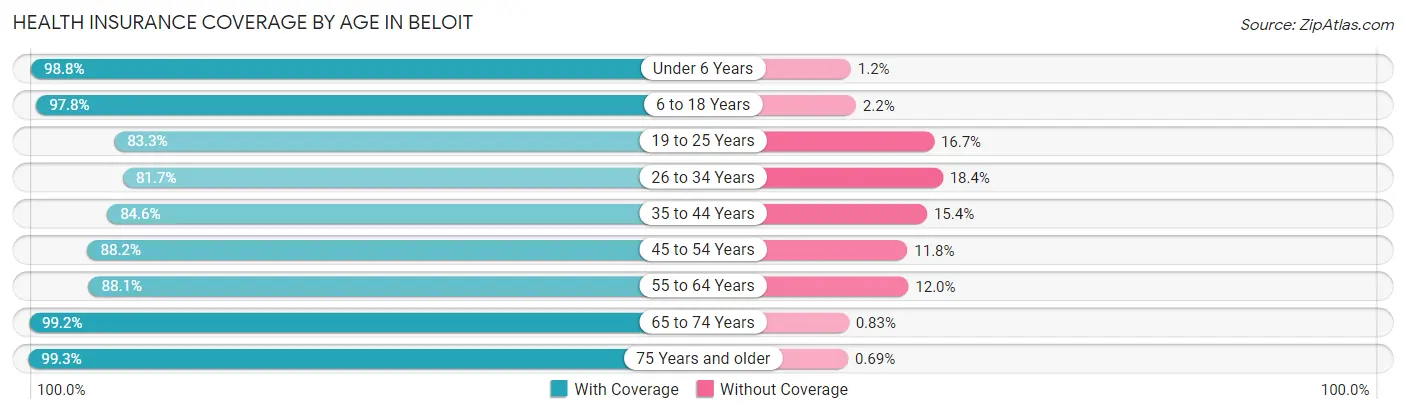
| Age Bracket | With Coverage | Without Coverage |
| Under 6 Years | 3,068 (98.8%) | 38 (1.2%) |
| 6 to 18 Years | 6,572 (97.8%) | 146 (2.2%) |
| 19 to 25 Years | 3,819 (83.3%) | 767 (16.7%) |
| 26 to 34 Years | 3,643 (81.7%) | 819 (18.3%) |
| 35 to 44 Years | 3,439 (84.6%) | 627 (15.4%) |
| 45 to 54 Years | 3,361 (88.2%) | 448 (11.8%) |
| 55 to 64 Years | 4,281 (88.0%) | 581 (11.9%) |
| 65 to 74 Years | 3,124 (99.2%) | 26 (0.8%) |
| 75 Years and older | 1,587 (99.3%) | 11 (0.7%) |
| Total | 32,894 (90.5%) | 3,463 (9.5%) |
Health Insurance Coverage by Citizenship Status in Beloit
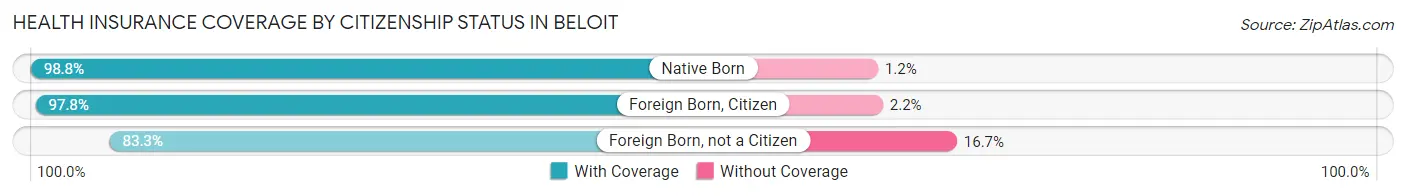
| Citizenship Status | With Coverage | Without Coverage |
| Native Born | 3,068 (98.8%) | 38 (1.2%) |
| Foreign Born, Citizen | 6,572 (97.8%) | 146 (2.2%) |
| Foreign Born, not a Citizen | 3,819 (83.3%) | 767 (16.7%) |
Health Insurance Coverage by Household Income in Beloit
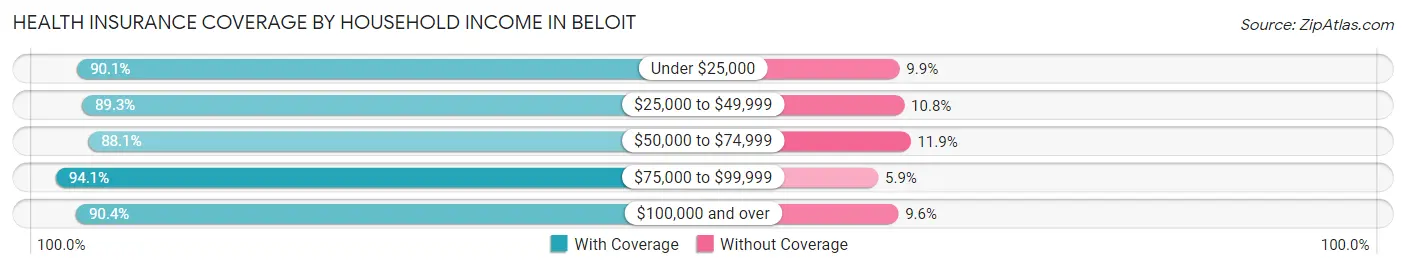
| Household Income | With Coverage | Without Coverage |
| Under $25,000 | 4,205 (90.1%) | 460 (9.9%) |
| $25,000 to $49,999 | 6,500 (89.2%) | 783 (10.7%) |
| $50,000 to $74,999 | 6,147 (88.1%) | 833 (11.9%) |
| $75,000 to $99,999 | 6,010 (94.1%) | 374 (5.9%) |
| $100,000 and over | 8,711 (90.4%) | 928 (9.6%) |
Public vs Private Health Insurance Coverage by Age in Beloit
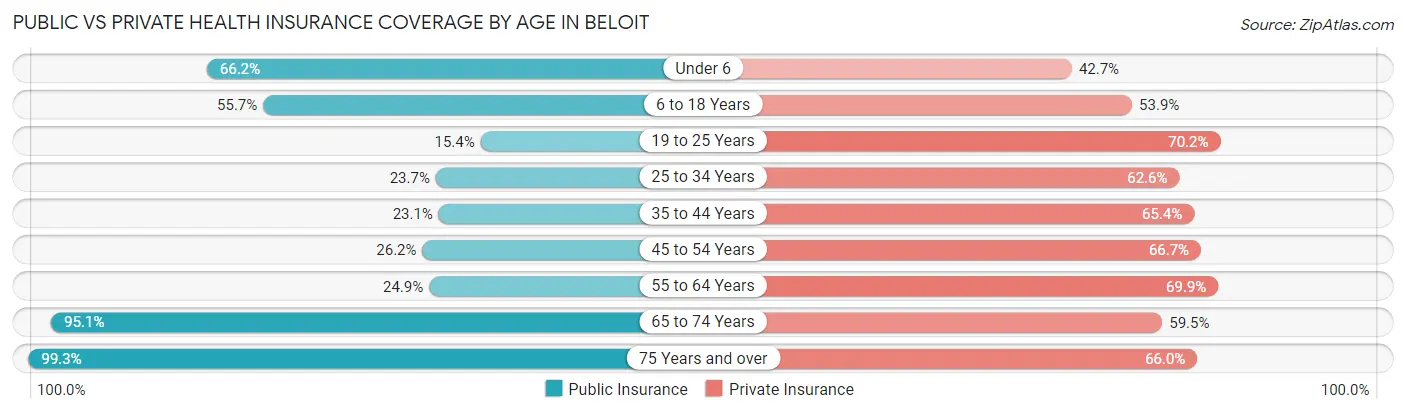
| Age Bracket | Public Insurance | Private Insurance |
| Under 6 | 2,055 (66.2%) | 1,327 (42.7%) |
| 6 to 18 Years | 3,744 (55.7%) | 3,621 (53.9%) |
| 19 to 25 Years | 705 (15.4%) | 3,221 (70.2%) |
| 25 to 34 Years | 1,057 (23.7%) | 2,795 (62.6%) |
| 35 to 44 Years | 941 (23.1%) | 2,659 (65.4%) |
| 45 to 54 Years | 997 (26.2%) | 2,539 (66.7%) |
| 55 to 64 Years | 1,212 (24.9%) | 3,396 (69.9%) |
| 65 to 74 Years | 2,995 (95.1%) | 1,874 (59.5%) |
| 75 Years and over | 1,587 (99.3%) | 1,054 (66.0%) |
| Total | 15,293 (42.1%) | 22,486 (61.9%) |
Disability Status by Sex by Age in Beloit
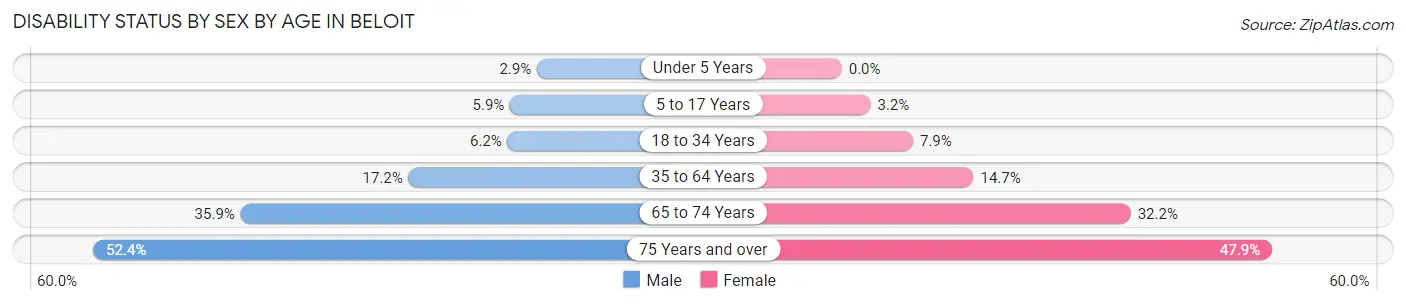
| Age Bracket | Male | Female |
| Under 5 Years | 44 (2.9%) | 0 (0.0%) |
| 5 to 17 Years | 200 (5.9%) | 100 (3.2%) |
| 18 to 34 Years | 286 (6.2%) | 412 (7.9%) |
| 35 to 64 Years | 1,080 (17.2%) | 949 (14.7%) |
| 65 to 74 Years | 529 (35.9%) | 540 (32.2%) |
| 75 Years and over | 333 (52.4%) | 461 (47.9%) |
Disability Class by Sex by Age in Beloit
Disability Class: Hearing Difficulty
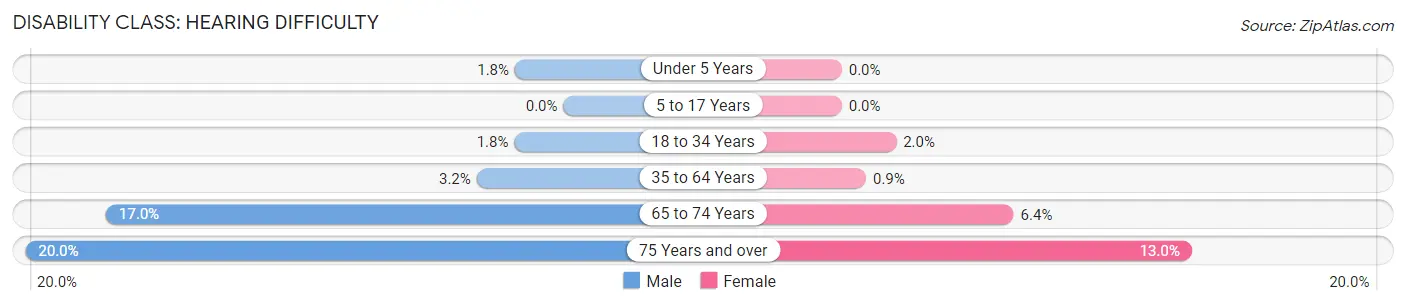
| Age Bracket | Male | Female |
| Under 5 Years | 27 (1.8%) | 0 (0.0%) |
| 5 to 17 Years | 0 (0.0%) | 0 (0.0%) |
| 18 to 34 Years | 84 (1.8%) | 105 (2.0%) |
| 35 to 64 Years | 202 (3.2%) | 58 (0.9%) |
| 65 to 74 Years | 250 (17.0%) | 107 (6.4%) |
| 75 Years and over | 127 (20.0%) | 125 (13.0%) |
Disability Class: Vision Difficulty
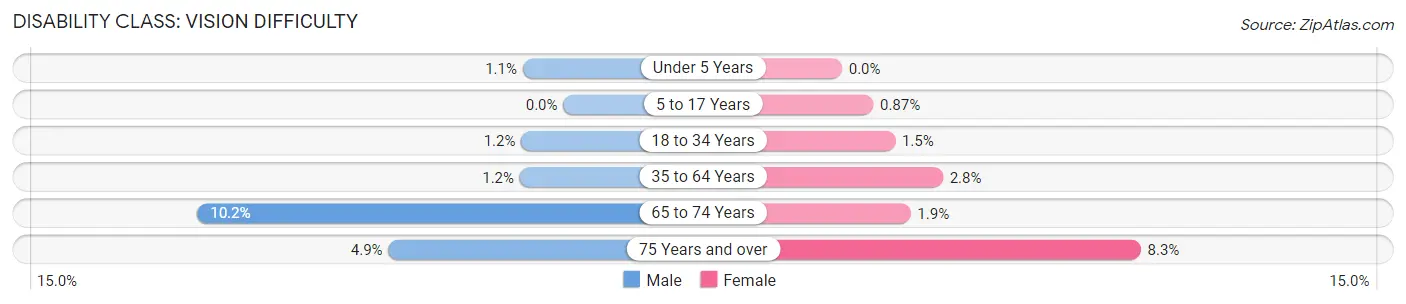
| Age Bracket | Male | Female |
| Under 5 Years | 17 (1.1%) | 0 (0.0%) |
| 5 to 17 Years | 0 (0.0%) | 27 (0.9%) |
| 18 to 34 Years | 54 (1.2%) | 77 (1.5%) |
| 35 to 64 Years | 76 (1.2%) | 182 (2.8%) |
| 65 to 74 Years | 150 (10.2%) | 32 (1.9%) |
| 75 Years and over | 31 (4.9%) | 80 (8.3%) |
Disability Class: Cognitive Difficulty
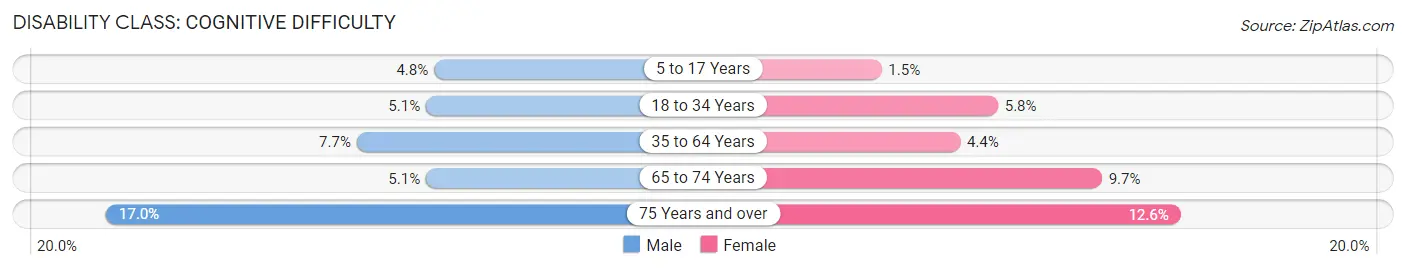
| Age Bracket | Male | Female |
| 5 to 17 Years | 162 (4.8%) | 46 (1.5%) |
| 18 to 34 Years | 235 (5.1%) | 301 (5.8%) |
| 35 to 64 Years | 481 (7.7%) | 284 (4.4%) |
| 65 to 74 Years | 75 (5.1%) | 162 (9.7%) |
| 75 Years and over | 108 (17.0%) | 121 (12.6%) |
Disability Class: Ambulatory Difficulty
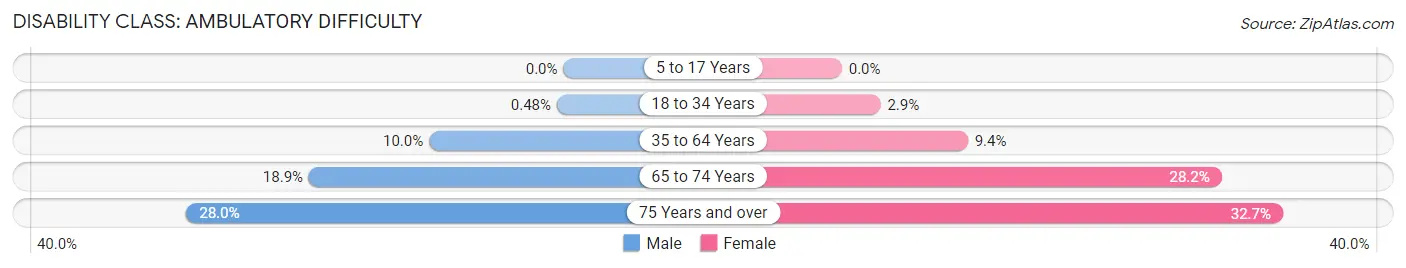
| Age Bracket | Male | Female |
| 5 to 17 Years | 0 (0.0%) | 0 (0.0%) |
| 18 to 34 Years | 22 (0.5%) | 149 (2.9%) |
| 35 to 64 Years | 625 (10.0%) | 605 (9.3%) |
| 65 to 74 Years | 278 (18.9%) | 473 (28.2%) |
| 75 Years and over | 178 (28.0%) | 315 (32.7%) |
Disability Class: Self-Care Difficulty
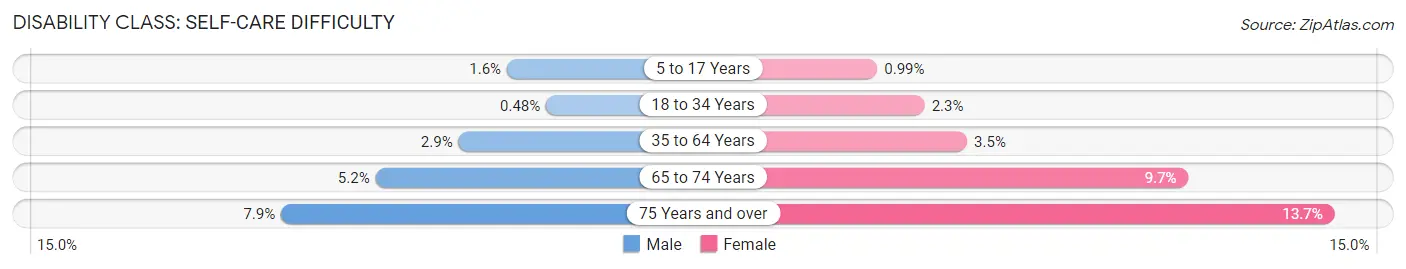
| Age Bracket | Male | Female |
| 5 to 17 Years | 53 (1.6%) | 31 (1.0%) |
| 18 to 34 Years | 22 (0.5%) | 120 (2.3%) |
| 35 to 64 Years | 183 (2.9%) | 226 (3.5%) |
| 65 to 74 Years | 77 (5.2%) | 162 (9.7%) |
| 75 Years and over | 50 (7.9%) | 132 (13.7%) |
Technology Access in Beloit
Computing Device Access in Beloit
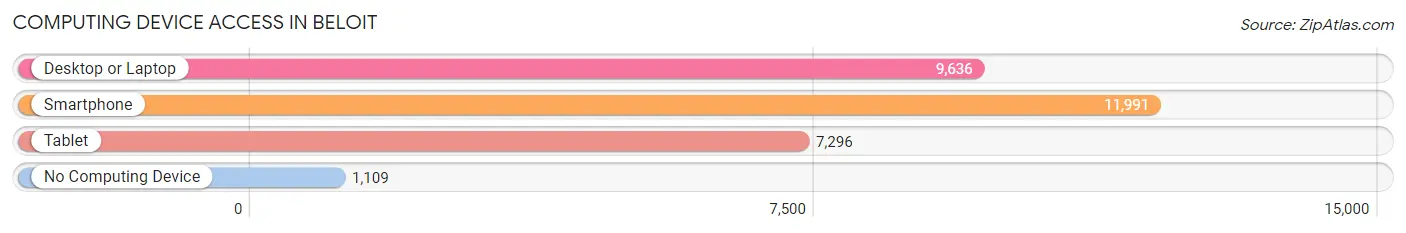
| Device Type | # Households | % Households |
| Desktop or Laptop | 9,636 | 69.2% |
| Smartphone | 11,991 | 86.2% |
| Tablet | 7,296 | 52.4% |
| No Computing Device | 1,109 | 8.0% |
| Total | 13,919 | 100.0% |
Internet Access in Beloit
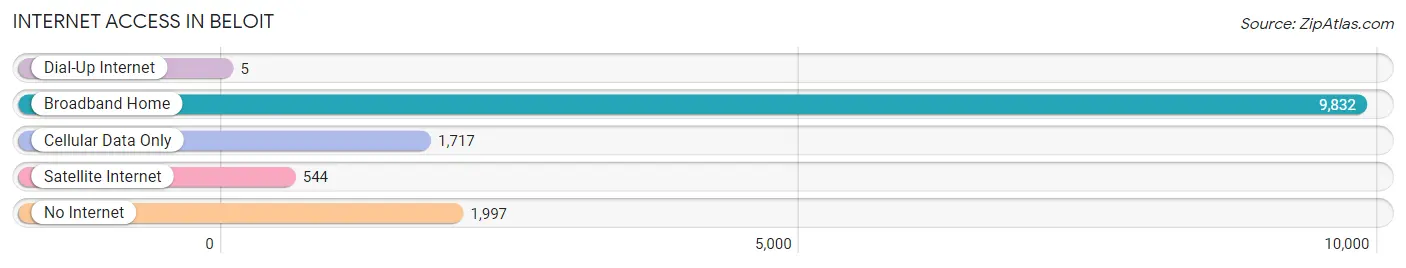
| Internet Type | # Households | % Households |
| Dial-Up Internet | 5 | 0.0% |
| Broadband Home | 9,832 | 70.6% |
| Cellular Data Only | 1,717 | 12.3% |
| Satellite Internet | 544 | 3.9% |
| No Internet | 1,997 | 14.3% |
| Total | 13,919 | 100.0% |
Beloit Summary
Beloit, Wisconsin is a city located in Rock County, Wisconsin, United States. It is situated on the banks of the Rock River, near the Illinois border. The city is home to Beloit College, a private liberal arts college, and the Beloit Memorial High School. As of the 2010 census, the city had a population of 36,966.
History
Beloit was founded in 1836 by New Englanders who were looking for a place to settle in the Midwest. The city was named after Henry Dodge's daughter, Belinda, who was born in the area. The city was incorporated in 1846 and was the first city in Wisconsin to be incorporated.
Beloit was an important stop on the Underground Railroad, and the city was home to many abolitionists. In 1854, the city was the site of the first Wisconsin State Fair.
Geography
Beloit is located at 42°30'N 89°2'W (42.50, -89.03). According to the United States Census Bureau, the city has a total area of 11.2 square miles (29.0 km2), of which 10.9 square miles (28.2 km2) is land and 0.3 square miles (0.8 km2) is water.
Economy
Beloit is home to several major employers, including Regal Beloit Corporation, a manufacturer of electric motors and generators; Beloit Corporation, a manufacturer of paper products; and Beloit Health System, a regional health care provider. The city is also home to several smaller businesses, including restaurants, retail stores, and service providers.
Demographics
As of the 2010 census, there were 36,966 people, 14,845 households, and 8,945 families residing in the city. The population density was 3,364.2 people per square mile (1,299.3/km2). There were 15,945 housing units at an average density of 1,461.2 per square mile (564.7/km2). The racial makeup of the city was 73.2% White, 17.2% African American, 0.4% Native American, 2.3% Asian, 0.1% Pacific Islander, 4.2% from other races, and 2.6% from two or more races. Hispanic or Latino of any race were 8.7% of the population.
Beloit is a diverse city, with a variety of cultures and backgrounds represented. The city has a large immigrant population, with many coming from Mexico, India, and other countries. The city also has a large African American population, with many coming from the nearby cities of Rockford and Chicago.
Conclusion
Beloit, Wisconsin is a city located in Rock County, Wisconsin, United States. It is situated on the banks of the Rock River, near the Illinois border. The city is home to Beloit College, a private liberal arts college, and the Beloit Memorial High School. As of the 2010 census, the city had a population of 36,966. Beloit was founded in 1836 by New Englanders who were looking for a place to settle in the Midwest. The city was an important stop on the Underground Railroad, and the city was home to many abolitionists. Beloit is home to several major employers, including Regal Beloit Corporation, a manufacturer of electric motors and generators; Beloit Corporation, a manufacturer of paper products; and Beloit Health System, a regional health care provider. The city is also home to several smaller businesses, including restaurants, retail stores, and service providers. Beloit is a diverse city, with a variety of cultures and backgrounds represented. The city has a large immigrant population, with many coming from Mexico, India, and other countries. The city also has a large African American population, with many coming from the nearby cities of Rockford and Chicago.
Common Questions
What is Per Capita Income in Beloit?
Per Capita income in Beloit is $29,529.
What is the Median Family Income in Beloit?
Median Family Income in Beloit is $67,686.
What is the Median Household income in Beloit?
Median Household Income in Beloit is $57,168.
What is Income or Wage Gap in Beloit?
Income or Wage Gap in Beloit is 23.4%.
Women in Beloit earn 76.6 cents for every dollar earned by a man.
What is Family Income Deficit in Beloit?
Family Income Deficit in Beloit is $10,738.
Families that are below poverty line in Beloit earn $10,738 less on average than the poverty threshold level.
What is Inequality or Gini Index in Beloit?
Inequality or Gini Index in Beloit is 0.43.
What is the Total Population of Beloit?
Total Population of Beloit is 36,642.
What is the Total Male Population of Beloit?
Total Male Population of Beloit is 17,963.
What is the Total Female Population of Beloit?
Total Female Population of Beloit is 18,679.
What is the Ratio of Males per 100 Females in Beloit?
There are 96.17 Males per 100 Females in Beloit.
What is the Ratio of Females per 100 Males in Beloit?
There are 103.99 Females per 100 Males in Beloit.
What is the Median Population Age in Beloit?
Median Population Age in Beloit is 33.9 Years.
What is the Average Family Size in Beloit
Average Family Size in Beloit is 3.3 People.
What is the Average Household Size in Beloit
Average Household Size in Beloit is 2.5 People.
How Large is the Labor Force in Beloit?
There are 18,178 People in the Labor Forcein in Beloit.
What is the Percentage of People in the Labor Force in Beloit?
63.7% of People are in the Labor Force in Beloit.
What is the Unemployment Rate in Beloit?
Unemployment Rate in Beloit is 6.0%.