Menomonee Falls, WI Map & Demographics
Menomonee Falls Map
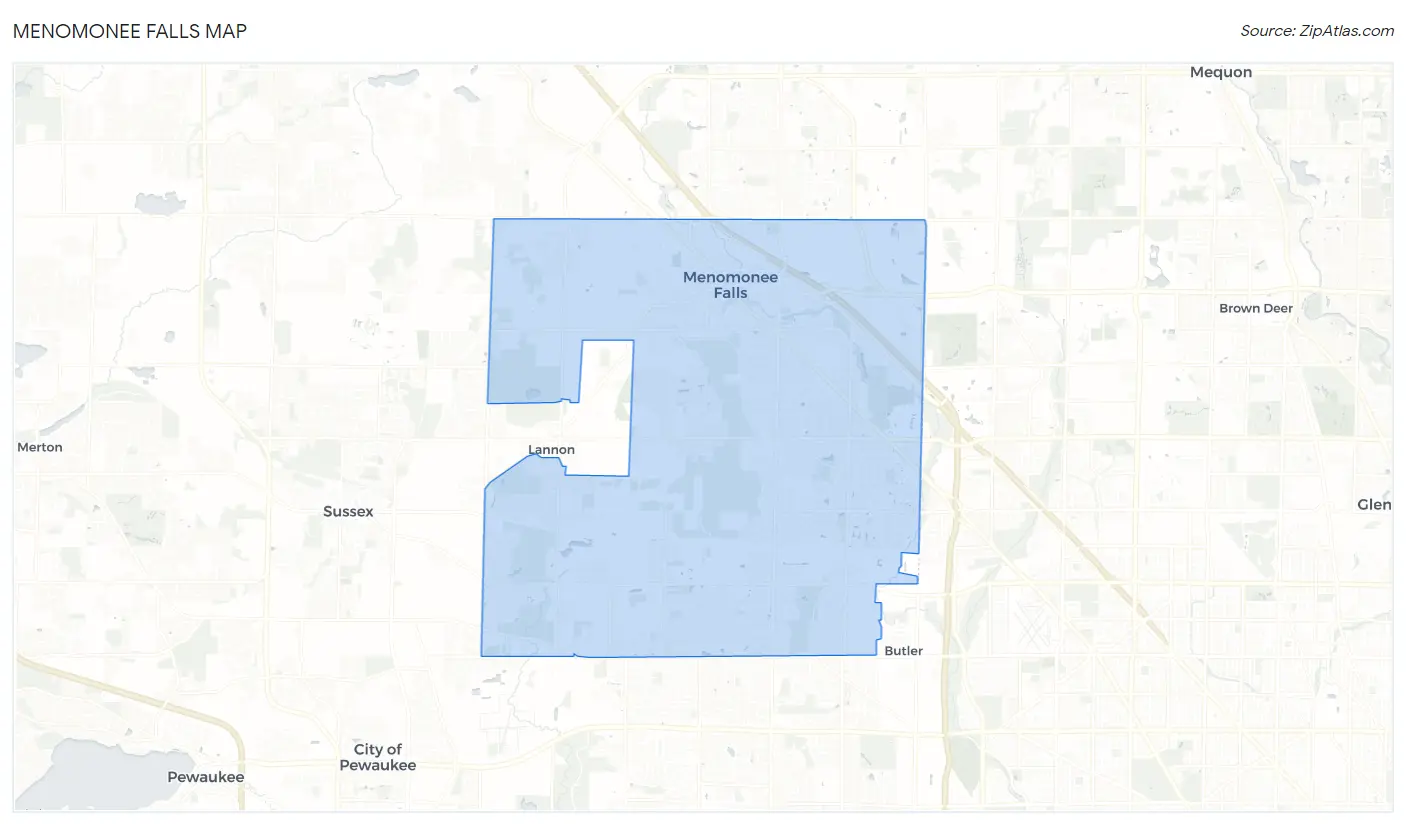
Menomonee Falls Overview
$55,576
PER CAPITA INCOME
$127,522
AVG FAMILY INCOME
$96,986
AVG HOUSEHOLD INCOME
37.0%
WAGE / INCOME GAP [ % ]
63.0¢/ $1
WAGE / INCOME GAP [ $ ]
$9,769
FAMILY INCOME DEFICIT
0.48
INEQUALITY / GINI INDEX
38,610
TOTAL POPULATION
18,379
MALE POPULATION
20,231
FEMALE POPULATION
90.85
MALES / 100 FEMALES
110.08
FEMALES / 100 MALES
41.9
MEDIAN AGE
3.0
AVG FAMILY SIZE
2.4
AVG HOUSEHOLD SIZE
20,689
LABOR FORCE [ PEOPLE ]
66.8%
PERCENT IN LABOR FORCE
2.1%
UNEMPLOYMENT RATE
Menomonee Falls Zip Codes
Menomonee Falls Area Codes
Income in Menomonee Falls
Income Overview in Menomonee Falls
Per Capita Income in Menomonee Falls is $55,576, while median incomes of families and households are $127,522 and $96,986 respectively.
| Characteristic | Number | Measure |
| Per Capita Income | 38,610 | $55,576 |
| Median Family Income | 10,537 | $127,522 |
| Mean Family Income | 10,537 | $168,550 |
| Median Household Income | 15,948 | $96,986 |
| Mean Household Income | 15,948 | $134,665 |
| Income Deficit | 10,537 | $9,769 |
| Wage / Income Gap (%) | 38,610 | 37.03% |
| Wage / Income Gap ($) | 38,610 | 62.97¢ per $1 |
| Gini / Inequality Index | 38,610 | 0.48 |
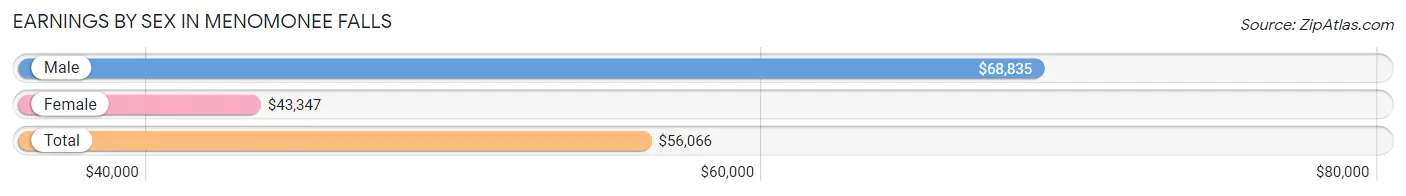
Earnings by Sex in Menomonee Falls
Average Earnings in Menomonee Falls are $56,066, $68,835 for men and $43,347 for women, a difference of 37.0%.
| Sex | Number | Average Earnings |
| Male | 11,407 (51.4%) | $68,835 |
| Female | 10,762 (48.5%) | $43,347 |
| Total | 22,169 (100.0%) | $56,066 |
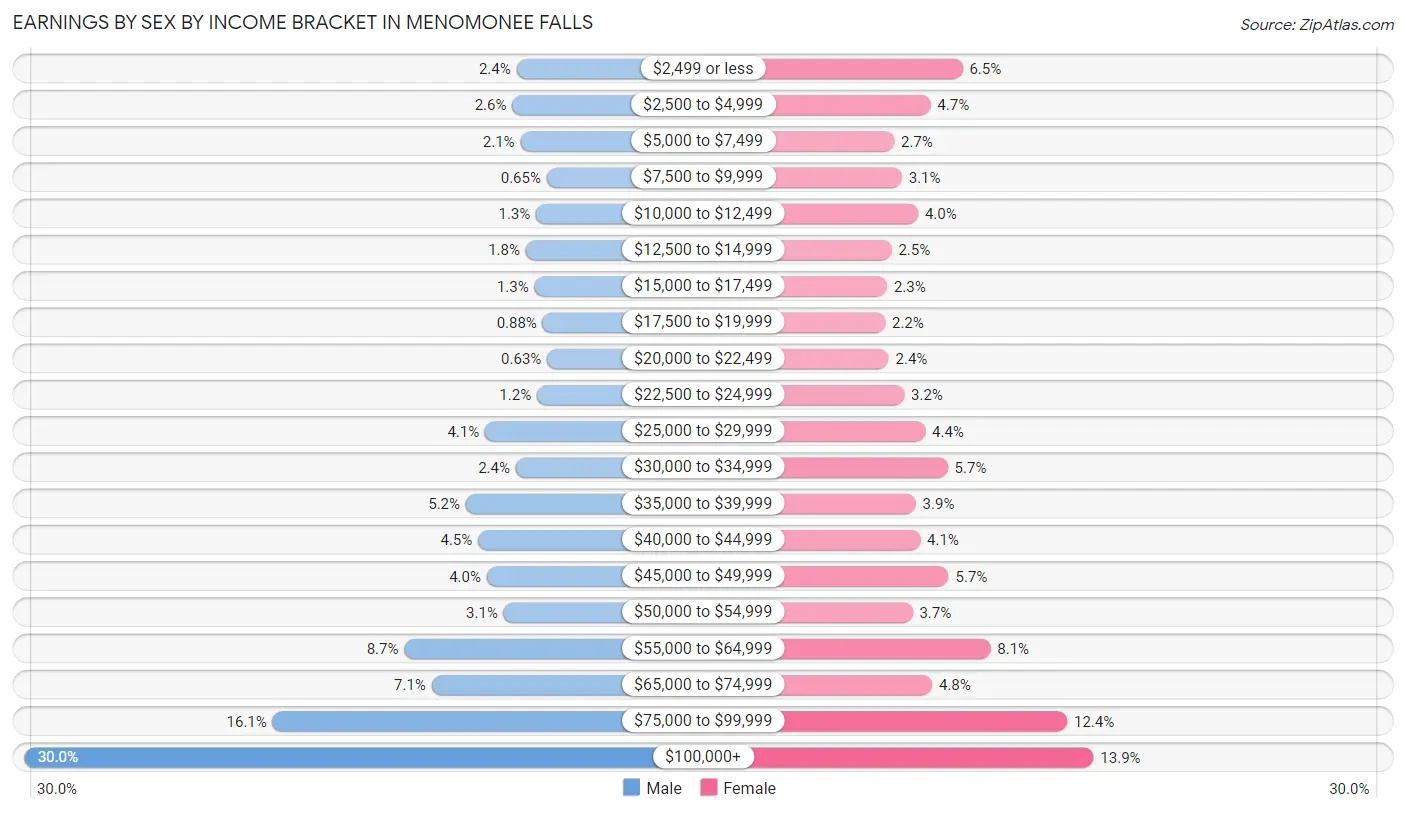
Earnings by Sex by Income Bracket in Menomonee Falls
The most common earnings brackets in Menomonee Falls are $100,000+ for men (3,421 | 30.0%) and $100,000+ for women (1,492 | 13.9%).
| Income | Male | Female |
| $2,499 or less | 268 (2.4%) | 699 (6.5%) |
| $2,500 to $4,999 | 296 (2.6%) | 506 (4.7%) |
| $5,000 to $7,499 | 243 (2.1%) | 285 (2.6%) |
| $7,500 to $9,999 | 74 (0.6%) | 333 (3.1%) |
| $10,000 to $12,499 | 143 (1.3%) | 431 (4.0%) |
| $12,500 to $14,999 | 209 (1.8%) | 270 (2.5%) |
| $15,000 to $17,499 | 153 (1.3%) | 243 (2.3%) |
| $17,500 to $19,999 | 100 (0.9%) | 231 (2.1%) |
| $20,000 to $22,499 | 72 (0.6%) | 253 (2.4%) |
| $22,500 to $24,999 | 137 (1.2%) | 346 (3.2%) |
| $25,000 to $29,999 | 470 (4.1%) | 474 (4.4%) |
| $30,000 to $34,999 | 273 (2.4%) | 610 (5.7%) |
| $35,000 to $39,999 | 593 (5.2%) | 417 (3.9%) |
| $40,000 to $44,999 | 514 (4.5%) | 443 (4.1%) |
| $45,000 to $49,999 | 459 (4.0%) | 616 (5.7%) |
| $50,000 to $54,999 | 350 (3.1%) | 397 (3.7%) |
| $55,000 to $64,999 | 988 (8.7%) | 869 (8.1%) |
| $65,000 to $74,999 | 812 (7.1%) | 515 (4.8%) |
| $75,000 to $99,999 | 1,832 (16.1%) | 1,332 (12.4%) |
| $100,000+ | 3,421 (30.0%) | 1,492 (13.9%) |
| Total | 11,407 (100.0%) | 10,762 (100.0%) |
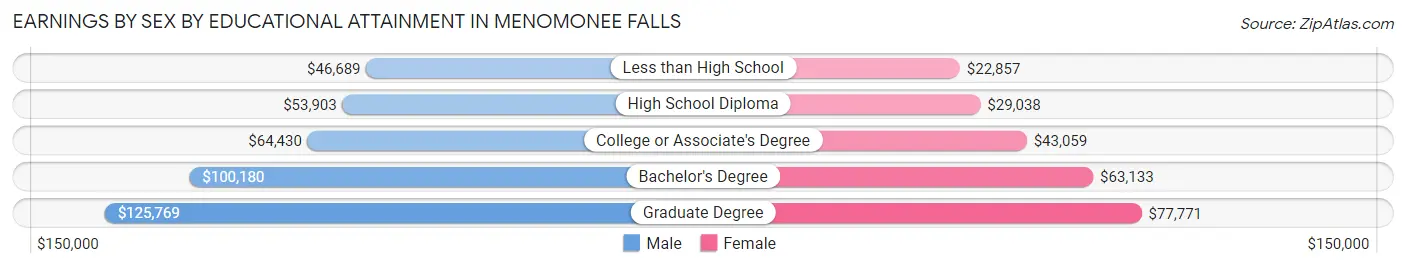
Earnings by Sex by Educational Attainment in Menomonee Falls
Average earnings in Menomonee Falls are $77,360 for men and $49,489 for women, a difference of 36.0%. Men with an educational attainment of graduate degree enjoy the highest average annual earnings of $125,769, while those with less than high school education earn the least with $46,689. Women with an educational attainment of graduate degree earn the most with the average annual earnings of $77,771, while those with less than high school education have the smallest earnings of $22,857.
| Educational Attainment | Male Income | Female Income |
| Less than High School | $46,689 | $22,857 |
| High School Diploma | $53,903 | $29,038 |
| College or Associate's Degree | $64,430 | $43,059 |
| Bachelor's Degree | $100,180 | $63,133 |
| Graduate Degree | $125,769 | $77,771 |
| Total | $77,360 | $49,489 |
Family Income in Menomonee Falls
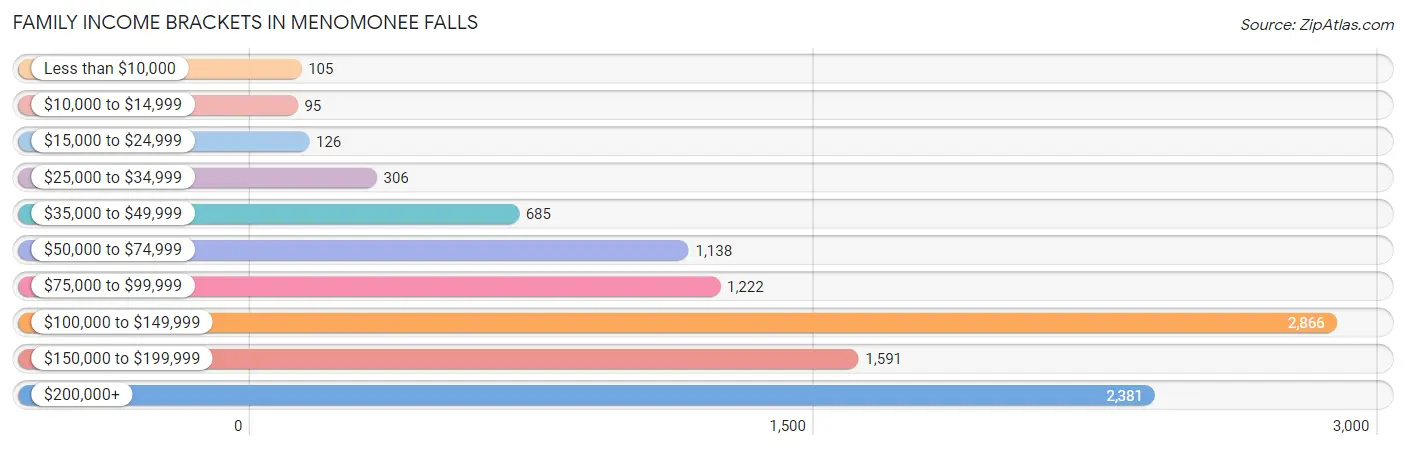
Family Income Brackets in Menomonee Falls
According to the Menomonee Falls family income data, there are 2,866 families falling into the $100,000 to $149,999 income range, which is the most common income bracket and makes up 27.2% of all families. Conversely, the $10,000 to $14,999 income bracket is the least frequent group with only 95 families (0.9%) belonging to this category.
| Income Bracket | # Families | % Families |
| Less than $10,000 | 105 | 1.0% |
| $10,000 to $14,999 | 95 | 0.9% |
| $15,000 to $24,999 | 126 | 1.2% |
| $25,000 to $34,999 | 306 | 2.9% |
| $35,000 to $49,999 | 685 | 6.5% |
| $50,000 to $74,999 | 1,138 | 10.8% |
| $75,000 to $99,999 | 1,222 | 11.6% |
| $100,000 to $149,999 | 2,866 | 27.2% |
| $150,000 to $199,999 | 1,591 | 15.1% |
| $200,000+ | 2,381 | 22.6% |
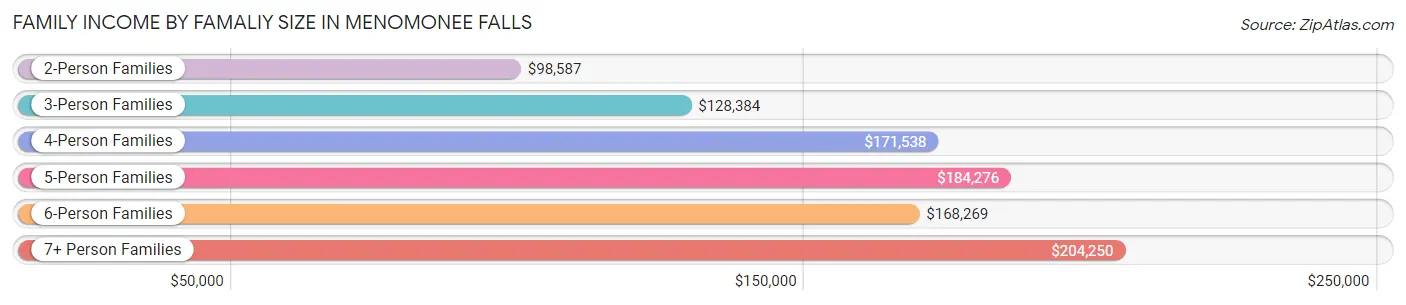
Family Income by Famaliy Size in Menomonee Falls
7+ person families (74 | 0.7%) account for the highest median family income in Menomonee Falls with $204,250 per family, while 2-person families (5,111 | 48.5%) have the highest median income of $49,294 per family member.
| Income Bracket | # Families | Median Income |
| 2-Person Families | 5,111 (48.5%) | $98,587 |
| 3-Person Families | 2,065 (19.6%) | $128,384 |
| 4-Person Families | 2,018 (19.2%) | $171,538 |
| 5-Person Families | 1,005 (9.5%) | $184,276 |
| 6-Person Families | 264 (2.5%) | $168,269 |
| 7+ Person Families | 74 (0.7%) | $204,250 |
| Total | 10,537 (100.0%) | $127,522 |
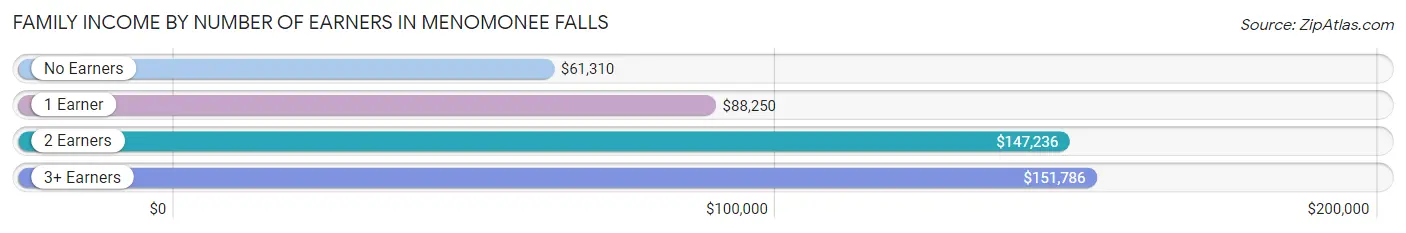
Family Income by Number of Earners in Menomonee Falls
The median family income in Menomonee Falls is $127,522, with families comprising 3+ earners (1,432) having the highest median family income of $151,786, while families with no earners (1,300) have the lowest median family income of $61,310, accounting for 13.6% and 12.3% of families, respectively.
| Number of Earners | # Families | Median Income |
| No Earners | 1,300 (12.3%) | $61,310 |
| 1 Earner | 2,386 (22.6%) | $88,250 |
| 2 Earners | 5,419 (51.4%) | $147,236 |
| 3+ Earners | 1,432 (13.6%) | $151,786 |
| Total | 10,537 (100.0%) | $127,522 |
Household Income in Menomonee Falls
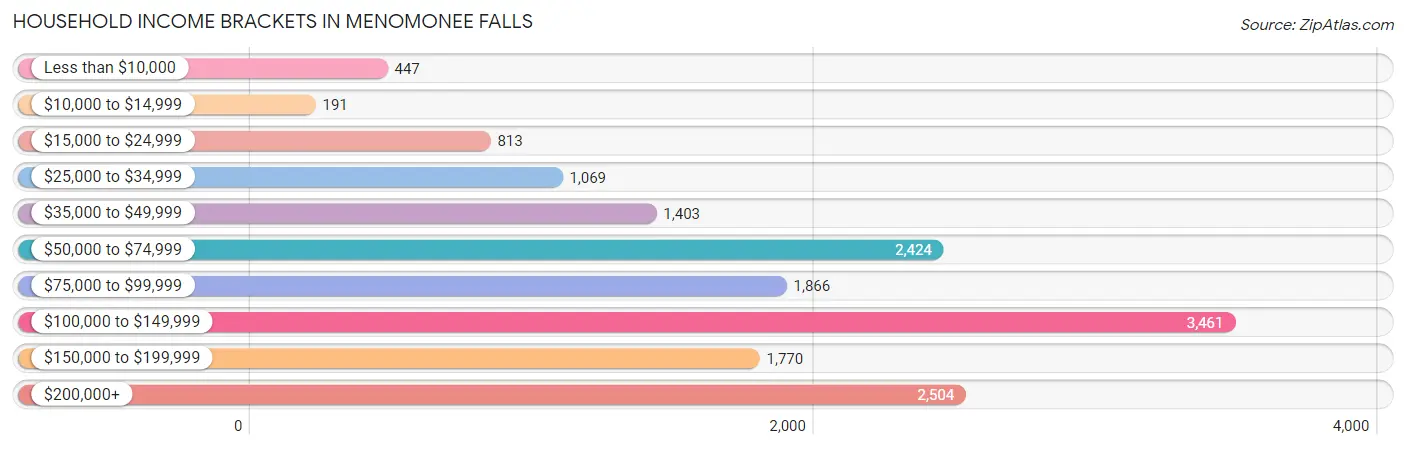
Household Income Brackets in Menomonee Falls
With 3,461 households falling in the category, the $100,000 to $149,999 income range is the most frequent in Menomonee Falls, accounting for 21.7% of all households. In contrast, only 191 households (1.2%) fall into the $10,000 to $14,999 income bracket, making it the least populous group.
| Income Bracket | # Households | % Households |
| Less than $10,000 | 447 | 2.8% |
| $10,000 to $14,999 | 191 | 1.2% |
| $15,000 to $24,999 | 813 | 5.1% |
| $25,000 to $34,999 | 1,069 | 6.7% |
| $35,000 to $49,999 | 1,403 | 8.8% |
| $50,000 to $74,999 | 2,424 | 15.2% |
| $75,000 to $99,999 | 1,866 | 11.7% |
| $100,000 to $149,999 | 3,461 | 21.7% |
| $150,000 to $199,999 | 1,770 | 11.1% |
| $200,000+ | 2,504 | 15.7% |
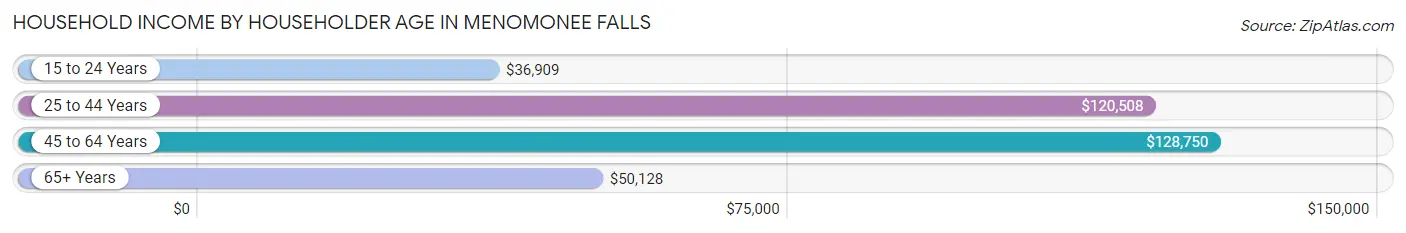
Household Income by Householder Age in Menomonee Falls
The median household income in Menomonee Falls is $96,986, with the highest median household income of $128,750 found in the 45 to 64 years age bracket for the primary householder. A total of 5,614 households (35.2%) fall into this category. Meanwhile, the 15 to 24 years age bracket for the primary householder has the lowest median household income of $36,909, with 213 households (1.3%) in this group.
| Income Bracket | # Households | Median Income |
| 15 to 24 Years | 213 (1.3%) | $36,909 |
| 25 to 44 Years | 4,975 (31.2%) | $120,508 |
| 45 to 64 Years | 5,614 (35.2%) | $128,750 |
| 65+ Years | 5,146 (32.3%) | $50,128 |
| Total | 15,948 (100.0%) | $96,986 |
Poverty in Menomonee Falls
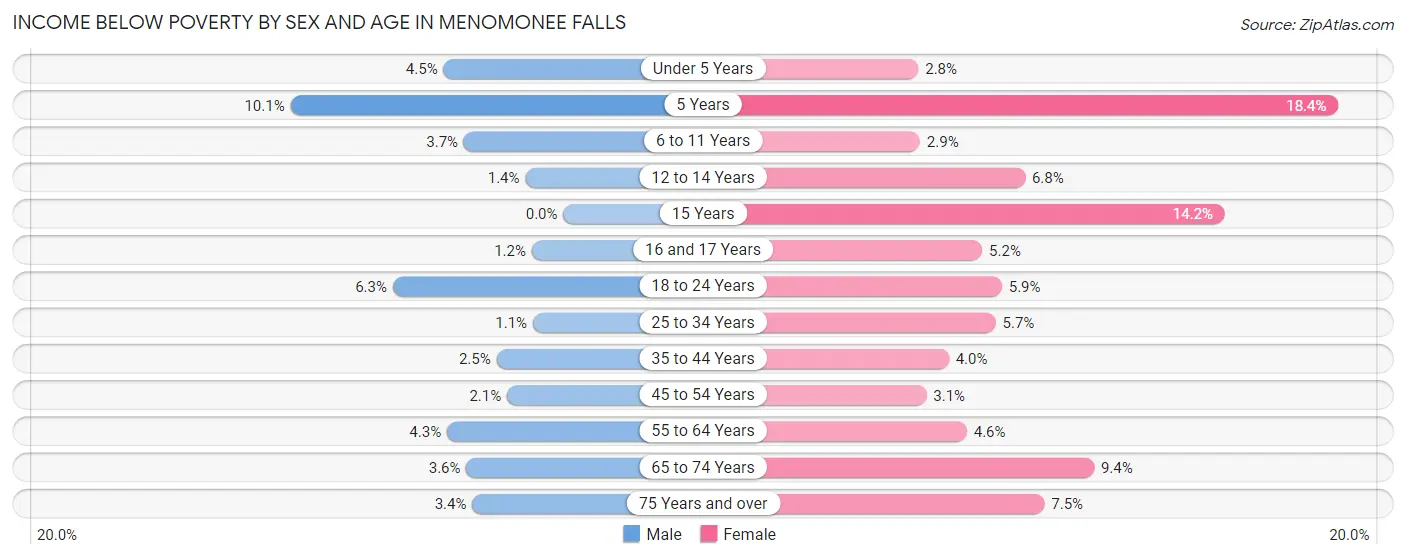
Income Below Poverty by Sex and Age in Menomonee Falls
With 3.1% poverty level for males and 5.5% for females among the residents of Menomonee Falls, 5 year old males and 5 year old females are the most vulnerable to poverty, with 32 males (10.1%) and 40 females (18.4%) in their respective age groups living below the poverty level.
| Age Bracket | Male | Female |
| Under 5 Years | 39 (4.4%) | 32 (2.8%) |
| 5 Years | 32 (10.1%) | 40 (18.4%) |
| 6 to 11 Years | 55 (3.7%) | 44 (2.9%) |
| 12 to 14 Years | 11 (1.4%) | 56 (6.8%) |
| 15 Years | 0 (0.0%) | 30 (14.2%) |
| 16 and 17 Years | 5 (1.2%) | 40 (5.2%) |
| 18 to 24 Years | 70 (6.3%) | 70 (5.9%) |
| 25 to 34 Years | 25 (1.1%) | 130 (5.7%) |
| 35 to 44 Years | 66 (2.5%) | 100 (4.0%) |
| 45 to 54 Years | 51 (2.1%) | 76 (3.1%) |
| 55 to 64 Years | 107 (4.3%) | 132 (4.6%) |
| 65 to 74 Years | 69 (3.6%) | 188 (9.4%) |
| 75 Years and over | 46 (3.4%) | 165 (7.5%) |
| Total | 576 (3.1%) | 1,103 (5.5%) |
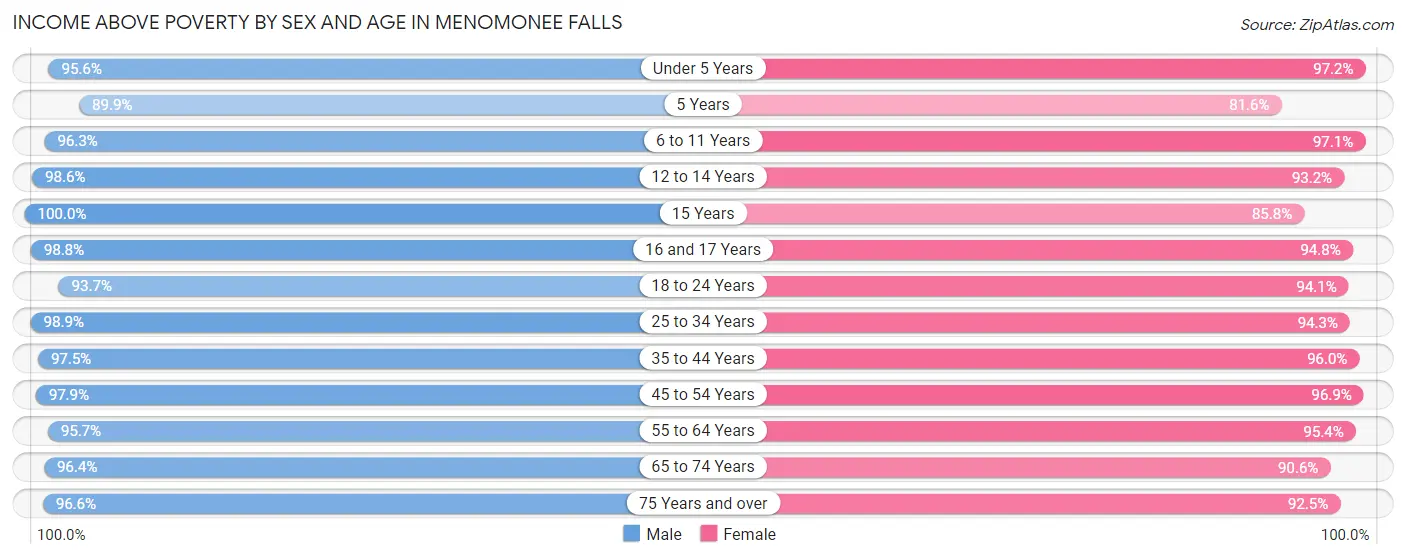
Income Above Poverty by Sex and Age in Menomonee Falls
According to the poverty statistics in Menomonee Falls, males aged 15 years and females aged under 5 years are the age groups that are most secure financially, with 100.0% of males and 97.2% of females in these age groups living above the poverty line.
| Age Bracket | Male | Female |
| Under 5 Years | 838 (95.6%) | 1,095 (97.2%) |
| 5 Years | 284 (89.9%) | 177 (81.6%) |
| 6 to 11 Years | 1,434 (96.3%) | 1,475 (97.1%) |
| 12 to 14 Years | 771 (98.6%) | 767 (93.2%) |
| 15 Years | 278 (100.0%) | 181 (85.8%) |
| 16 and 17 Years | 422 (98.8%) | 728 (94.8%) |
| 18 to 24 Years | 1,035 (93.7%) | 1,108 (94.1%) |
| 25 to 34 Years | 2,196 (98.9%) | 2,145 (94.3%) |
| 35 to 44 Years | 2,596 (97.5%) | 2,419 (96.0%) |
| 45 to 54 Years | 2,386 (97.9%) | 2,341 (96.9%) |
| 55 to 64 Years | 2,371 (95.7%) | 2,713 (95.4%) |
| 65 to 74 Years | 1,849 (96.4%) | 1,821 (90.6%) |
| 75 Years and over | 1,313 (96.6%) | 2,030 (92.5%) |
| Total | 17,773 (96.9%) | 19,000 (94.5%) |
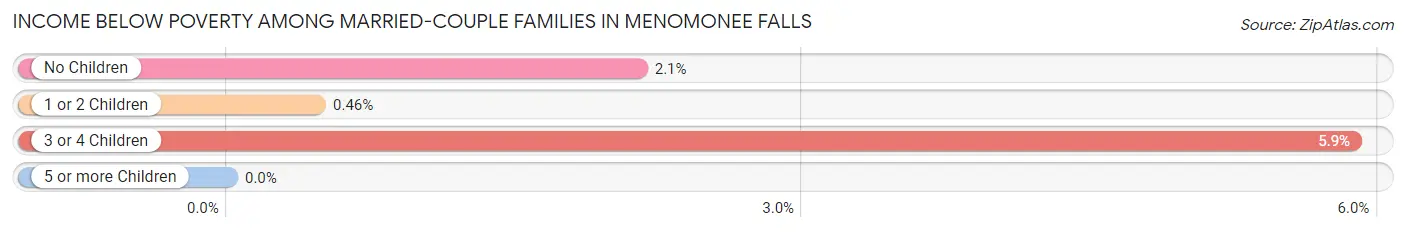
Income Below Poverty Among Married-Couple Families in Menomonee Falls
The poverty statistics for married-couple families in Menomonee Falls show that 2.1% or 183 of the total 8,768 families live below the poverty line. Families with 3 or 4 children have the highest poverty rate of 5.9%, comprising of 63 families. On the other hand, families with 5 or more children have the lowest poverty rate of 0.0%, which includes 0 families.
| Children | Above Poverty | Below Poverty |
| No Children | 4,935 (97.9%) | 108 (2.1%) |
| 1 or 2 Children | 2,590 (99.5%) | 12 (0.5%) |
| 3 or 4 Children | 1,010 (94.1%) | 63 (5.9%) |
| 5 or more Children | 50 (100.0%) | 0 (0.0%) |
| Total | 8,585 (97.9%) | 183 (2.1%) |
Income Below Poverty Among Single-Parent Households in Menomonee Falls
According to the poverty data in Menomonee Falls, 5.5% or 32 single-father households and 7.7% or 91 single-mother households are living below the poverty line. Among single-father households, those with 3 or 4 children have the highest poverty rate, with 7 households (46.7%) experiencing poverty. Likewise, among single-mother households, those with 3 or 4 children have the highest poverty rate, with 21 households (33.3%) falling below the poverty line.
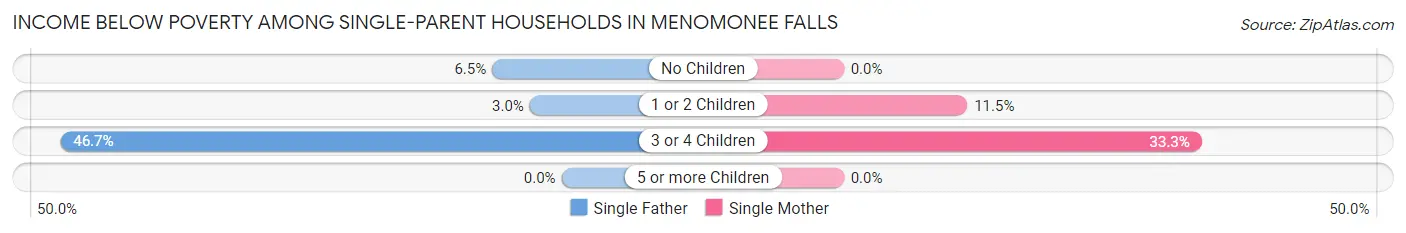
| Children | Single Father | Single Mother |
| No Children | 15 (6.5%) | 0 (0.0%) |
| 1 or 2 Children | 10 (3.0%) | 70 (11.5%) |
| 3 or 4 Children | 7 (46.7%) | 21 (33.3%) |
| 5 or more Children | 0 (0.0%) | 0 (0.0%) |
| Total | 32 (5.5%) | 91 (7.7%) |
Income Below Poverty Among Married-Couple vs Single-Parent Households in Menomonee Falls
The poverty data for Menomonee Falls shows that 183 of the married-couple family households (2.1%) and 123 of the single-parent households (7.0%) are living below the poverty level. Within the married-couple family households, those with 3 or 4 children have the highest poverty rate, with 63 households (5.9%) falling below the poverty line. Among the single-parent households, those with 3 or 4 children have the highest poverty rate, with 28 household (35.9%) living below poverty.
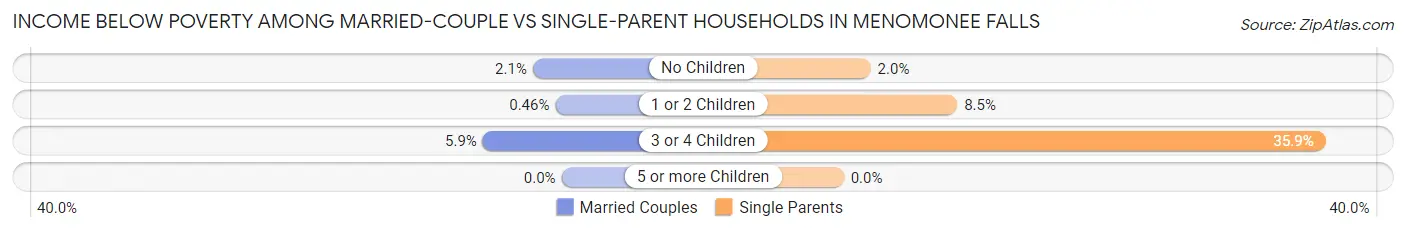
| Children | Married-Couple Families | Single-Parent Households |
| No Children | 108 (2.1%) | 15 (2.0%) |
| 1 or 2 Children | 12 (0.5%) | 80 (8.5%) |
| 3 or 4 Children | 63 (5.9%) | 28 (35.9%) |
| 5 or more Children | 0 (0.0%) | 0 (0.0%) |
| Total | 183 (2.1%) | 123 (7.0%) |
Race in Menomonee Falls
The most populous races in Menomonee Falls are White / Caucasian (32,918 | 85.3%), Hispanic or Latino (1,868 | 4.8%), and Asian (1,864 | 4.8%).
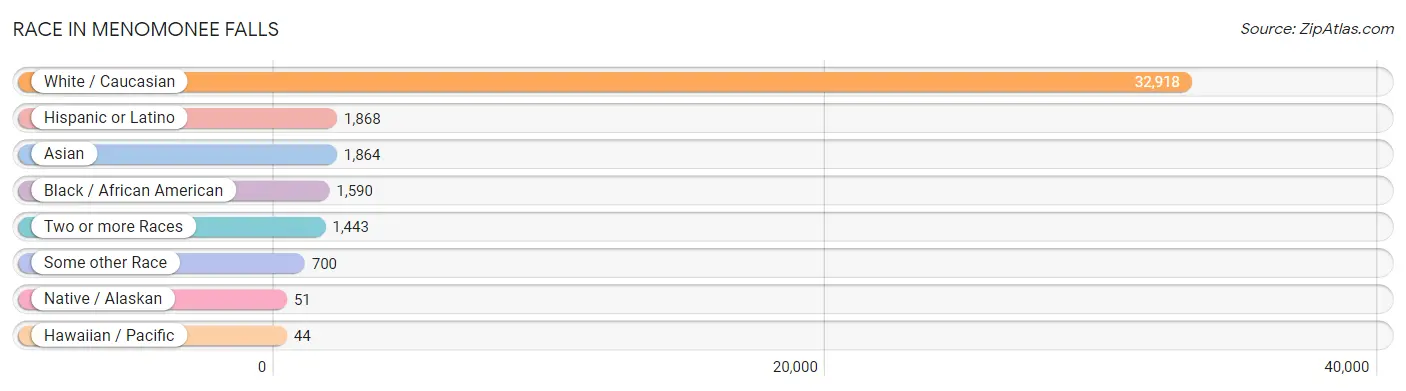
| Race | # Population | % Population |
| Asian | 1,864 | 4.8% |
| Black / African American | 1,590 | 4.1% |
| Hawaiian / Pacific | 44 | 0.1% |
| Hispanic or Latino | 1,868 | 4.8% |
| Native / Alaskan | 51 | 0.1% |
| White / Caucasian | 32,918 | 85.3% |
| Two or more Races | 1,443 | 3.7% |
| Some other Race | 700 | 1.8% |
| Total | 38,610 | 100.0% |
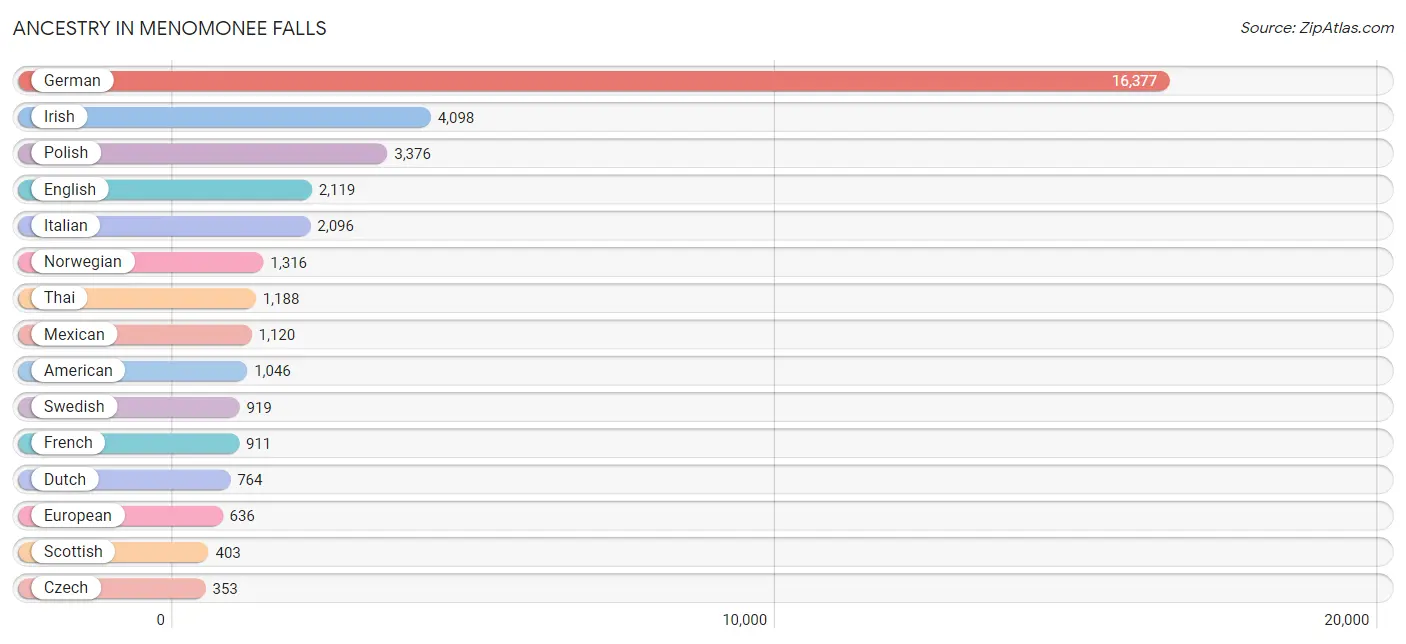
Ancestry in Menomonee Falls
The most populous ancestries reported in Menomonee Falls are German (16,377 | 42.4%), Irish (4,098 | 10.6%), Polish (3,376 | 8.7%), English (2,119 | 5.5%), and Italian (2,096 | 5.4%), together accounting for 72.7% of all Menomonee Falls residents.
| Ancestry | # Population | % Population |
| African | 12 | 0.0% |
| Aleut | 24 | 0.1% |
| American | 1,046 | 2.7% |
| Arab | 87 | 0.2% |
| Argentinean | 20 | 0.1% |
| Armenian | 21 | 0.1% |
| Austrian | 224 | 0.6% |
| Bangladeshi | 233 | 0.6% |
| Belgian | 41 | 0.1% |
| Bhutanese | 69 | 0.2% |
| Brazilian | 58 | 0.2% |
| British | 64 | 0.2% |
| Burmese | 57 | 0.2% |
| Canadian | 31 | 0.1% |
| Central American | 107 | 0.3% |
| Cherokee | 4 | 0.0% |
| Chippewa | 63 | 0.2% |
| Colombian | 22 | 0.1% |
| Croatian | 158 | 0.4% |
| Cuban | 130 | 0.3% |
| Czech | 353 | 0.9% |
| Czechoslovakian | 118 | 0.3% |
| Danish | 256 | 0.7% |
| Dutch | 764 | 2.0% |
| Eastern European | 125 | 0.3% |
| Ecuadorian | 162 | 0.4% |
| English | 2,119 | 5.5% |
| Ethiopian | 29 | 0.1% |
| European | 636 | 1.7% |
| Finnish | 208 | 0.5% |
| French | 911 | 2.4% |
| French Canadian | 171 | 0.4% |
| German | 16,377 | 42.4% |
| Ghanaian | 158 | 0.4% |
| Greek | 136 | 0.4% |
| Guatemalan | 107 | 0.3% |
| Haitian | 25 | 0.1% |
| Hungarian | 169 | 0.4% |
| Indian (Asian) | 228 | 0.6% |
| Irish | 4,098 | 10.6% |
| Iroquois | 17 | 0.0% |
| Italian | 2,096 | 5.4% |
| Jamaican | 44 | 0.1% |
| Korean | 66 | 0.2% |
| Lithuanian | 48 | 0.1% |
| Luxembourger | 22 | 0.1% |
| Macedonian | 7 | 0.0% |
| Mexican | 1,120 | 2.9% |
| Mexican American Indian | 56 | 0.2% |
| Northern European | 65 | 0.2% |
| Norwegian | 1,316 | 3.4% |
| Pakistani | 17 | 0.0% |
| Palestinian | 70 | 0.2% |
| Paraguayan | 15 | 0.0% |
| Peruvian | 16 | 0.0% |
| Polish | 3,376 | 8.7% |
| Puerto Rican | 164 | 0.4% |
| Romanian | 31 | 0.1% |
| Russian | 324 | 0.8% |
| Samoan | 44 | 0.1% |
| Scandinavian | 144 | 0.4% |
| Scotch-Irish | 225 | 0.6% |
| Scottish | 403 | 1.0% |
| Serbian | 113 | 0.3% |
| Slavic | 102 | 0.3% |
| Slovak | 309 | 0.8% |
| Slovene | 61 | 0.2% |
| South American | 268 | 0.7% |
| Spaniard | 9 | 0.0% |
| Spanish | 38 | 0.1% |
| Spanish American Indian | 22 | 0.1% |
| Sri Lankan | 59 | 0.2% |
| Subsaharan African | 199 | 0.5% |
| Swedish | 919 | 2.4% |
| Swiss | 294 | 0.8% |
| Thai | 1,188 | 3.1% |
| Trinidadian and Tobagonian | 10 | 0.0% |
| Turkish | 40 | 0.1% |
| Ukrainian | 104 | 0.3% |
| Uruguayan | 33 | 0.1% |
| Welsh | 135 | 0.4% |
| West Indian | 14 | 0.0% |
| Yugoslavian | 45 | 0.1% | View All 83 Rows |
Immigrants in Menomonee Falls
The most numerous immigrant groups reported in Menomonee Falls came from Asia (1,144 | 3.0%), South Central Asia (839 | 2.2%), India (746 | 1.9%), Europe (468 | 1.2%), and Latin America (416 | 1.1%), together accounting for 9.3% of all Menomonee Falls residents.
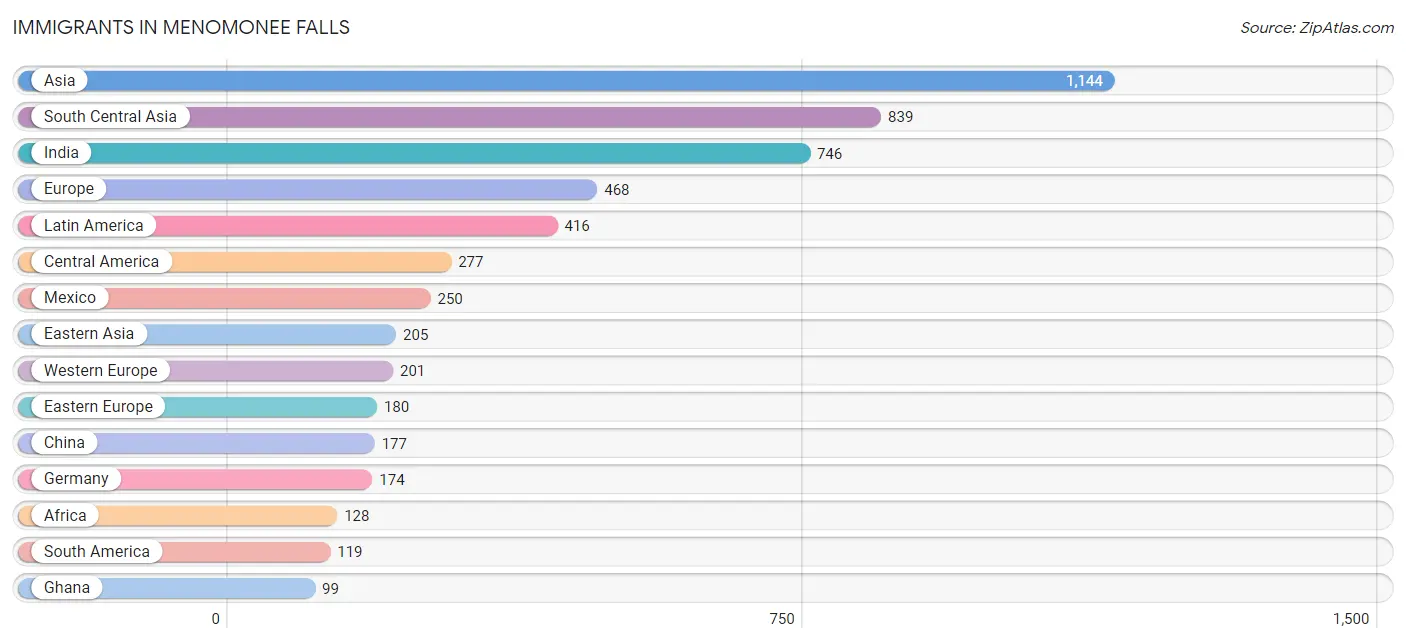
| Immigration Origin | # Population | % Population |
| Africa | 128 | 0.3% |
| Asia | 1,144 | 3.0% |
| Austria | 27 | 0.1% |
| Brazil | 14 | 0.0% |
| Canada | 55 | 0.1% |
| Caribbean | 20 | 0.1% |
| Central America | 277 | 0.7% |
| China | 177 | 0.5% |
| Colombia | 22 | 0.1% |
| Croatia | 23 | 0.1% |
| Eastern Africa | 29 | 0.1% |
| Eastern Asia | 205 | 0.5% |
| Eastern Europe | 180 | 0.5% |
| Ecuador | 68 | 0.2% |
| England | 8 | 0.0% |
| Eritrea | 18 | 0.1% |
| Ethiopia | 11 | 0.0% |
| Europe | 468 | 1.2% |
| Germany | 174 | 0.4% |
| Ghana | 99 | 0.3% |
| Greece | 11 | 0.0% |
| Guatemala | 27 | 0.1% |
| Hungary | 14 | 0.0% |
| India | 746 | 1.9% |
| Israel | 17 | 0.0% |
| Italy | 22 | 0.1% |
| Jamaica | 10 | 0.0% |
| Korea | 28 | 0.1% |
| Laos | 11 | 0.0% |
| Latin America | 416 | 1.1% |
| Mexico | 250 | 0.6% |
| Moldova | 13 | 0.0% |
| Northern Europe | 54 | 0.1% |
| Pakistan | 93 | 0.2% |
| Philippines | 35 | 0.1% |
| Romania | 9 | 0.0% |
| Russia | 50 | 0.1% |
| Serbia | 25 | 0.1% |
| South America | 119 | 0.3% |
| South Central Asia | 839 | 2.2% |
| South Eastern Asia | 73 | 0.2% |
| Southern Europe | 33 | 0.1% |
| Taiwan | 63 | 0.2% |
| Thailand | 17 | 0.0% |
| Trinidad and Tobago | 10 | 0.0% |
| Turkey | 10 | 0.0% |
| Ukraine | 25 | 0.1% |
| Vietnam | 10 | 0.0% |
| Western Africa | 99 | 0.3% |
| Western Asia | 27 | 0.1% |
| Western Europe | 201 | 0.5% | View All 51 Rows |
Sex and Age in Menomonee Falls
Sex and Age in Menomonee Falls
The most populous age groups in Menomonee Falls are 35 to 39 Years (1,470 | 8.0%) for men and 60 to 64 Years (1,534 | 7.6%) for women.
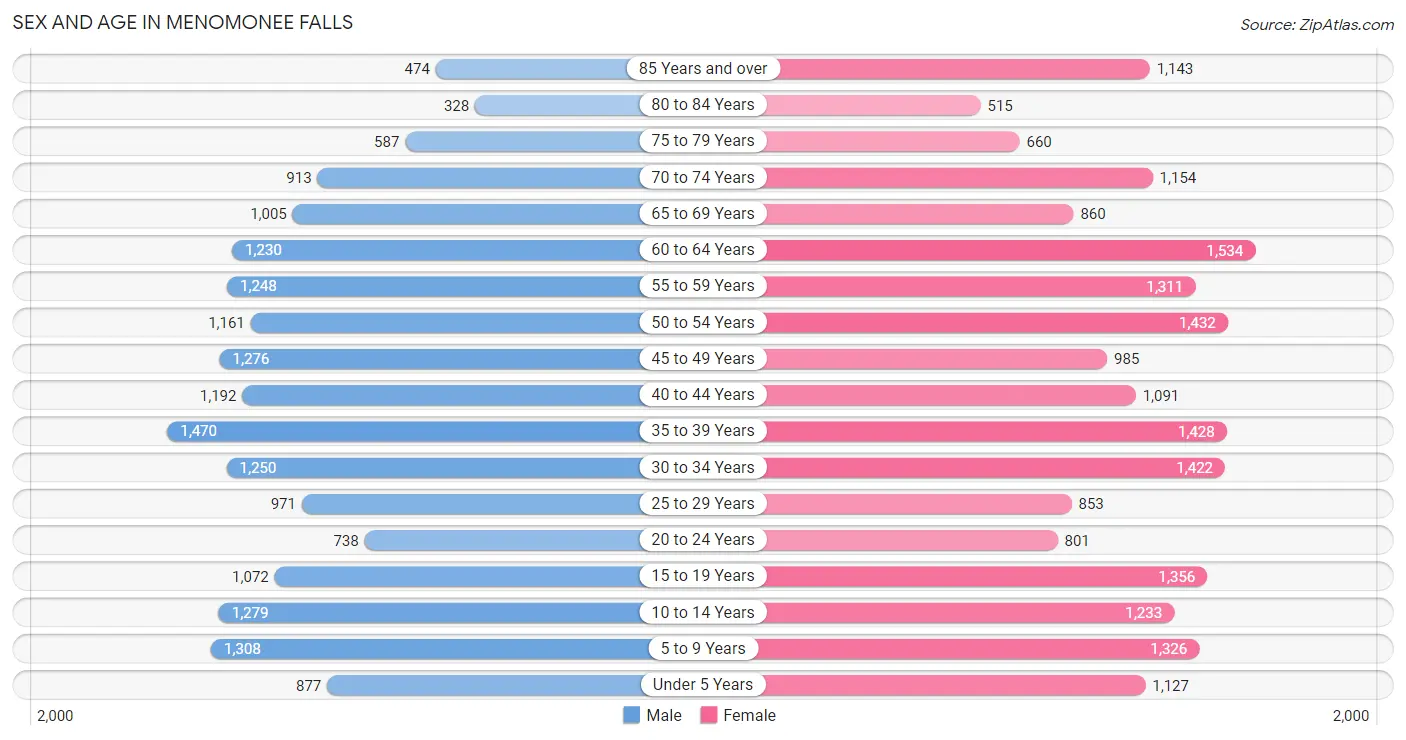
| Age Bracket | Male | Female |
| Under 5 Years | 877 (4.8%) | 1,127 (5.6%) |
| 5 to 9 Years | 1,308 (7.1%) | 1,326 (6.6%) |
| 10 to 14 Years | 1,279 (7.0%) | 1,233 (6.1%) |
| 15 to 19 Years | 1,072 (5.8%) | 1,356 (6.7%) |
| 20 to 24 Years | 738 (4.0%) | 801 (4.0%) |
| 25 to 29 Years | 971 (5.3%) | 853 (4.2%) |
| 30 to 34 Years | 1,250 (6.8%) | 1,422 (7.0%) |
| 35 to 39 Years | 1,470 (8.0%) | 1,428 (7.1%) |
| 40 to 44 Years | 1,192 (6.5%) | 1,091 (5.4%) |
| 45 to 49 Years | 1,276 (6.9%) | 985 (4.9%) |
| 50 to 54 Years | 1,161 (6.3%) | 1,432 (7.1%) |
| 55 to 59 Years | 1,248 (6.8%) | 1,311 (6.5%) |
| 60 to 64 Years | 1,230 (6.7%) | 1,534 (7.6%) |
| 65 to 69 Years | 1,005 (5.5%) | 860 (4.3%) |
| 70 to 74 Years | 913 (5.0%) | 1,154 (5.7%) |
| 75 to 79 Years | 587 (3.2%) | 660 (3.3%) |
| 80 to 84 Years | 328 (1.8%) | 515 (2.5%) |
| 85 Years and over | 474 (2.6%) | 1,143 (5.7%) |
| Total | 18,379 (100.0%) | 20,231 (100.0%) |
Families and Households in Menomonee Falls
Median Family Size in Menomonee Falls
The median family size in Menomonee Falls is 3.02 persons per family, with married-couple families (8,768 | 83.2%) accounting for the largest median family size of 3.1 persons per family. On the other hand, single male/father families (585 | 5.6%) represent the smallest median family size with 2.53 persons per family.
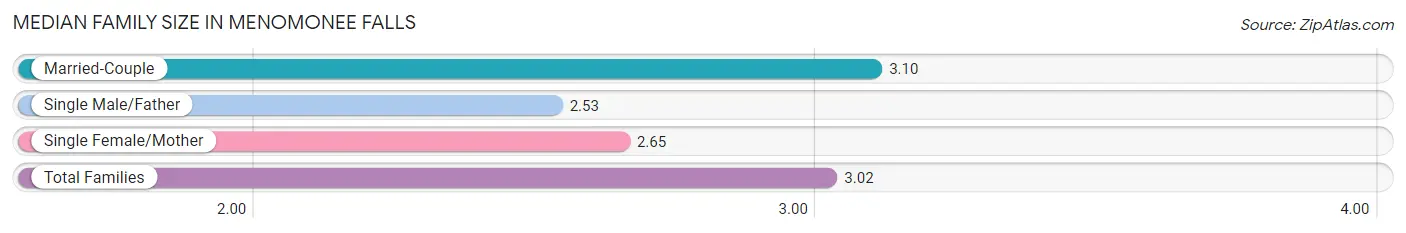
| Family Type | # Families | Family Size |
| Married-Couple | 8,768 (83.2%) | 3.10 |
| Single Male/Father | 585 (5.6%) | 2.53 |
| Single Female/Mother | 1,184 (11.2%) | 2.65 |
| Total Families | 10,537 (100.0%) | 3.02 |
Median Household Size in Menomonee Falls
The median household size in Menomonee Falls is 2.41 persons per household, with married-couple households (8,768 | 55.0%) accounting for the largest median household size of 3.11 persons per household. non-family households (5,411 | 33.9%) represent the smallest median household size with 1.16 persons per household.
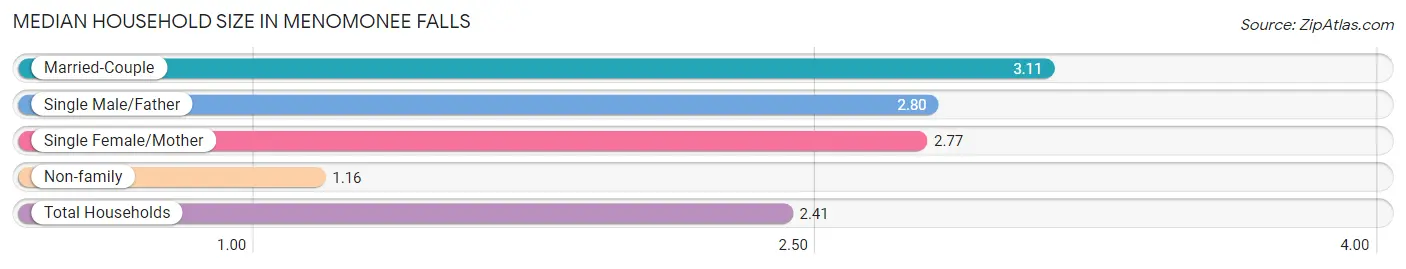
| Household Type | # Households | Household Size |
| Married-Couple | 8,768 (55.0%) | 3.11 |
| Single Male/Father | 585 (3.7%) | 2.80 |
| Single Female/Mother | 1,184 (7.4%) | 2.77 |
| Non-family | 5,411 (33.9%) | 1.16 |
| Total Households | 15,948 (100.0%) | 2.41 |
Household Size by Marriage Status in Menomonee Falls
Out of a total of 15,948 households in Menomonee Falls, 10,537 (66.1%) are family households, while 5,411 (33.9%) are nonfamily households. The most numerous type of family households are 2-person households, comprising 4,913, and the most common type of nonfamily households are 1-person households, comprising 4,670.
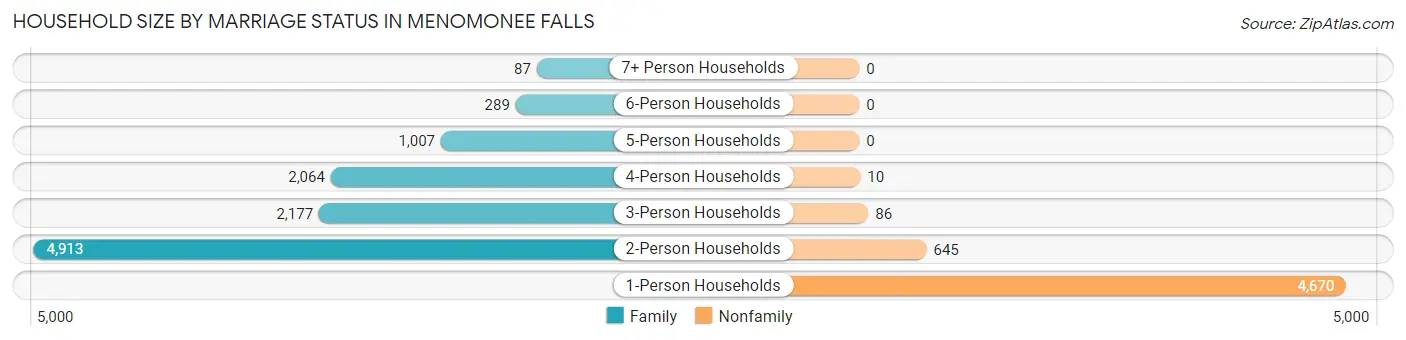
| Household Size | Family Households | Nonfamily Households |
| 1-Person Households | - | 4,670 (29.3%) |
| 2-Person Households | 4,913 (30.8%) | 645 (4.0%) |
| 3-Person Households | 2,177 (13.7%) | 86 (0.5%) |
| 4-Person Households | 2,064 (12.9%) | 10 (0.1%) |
| 5-Person Households | 1,007 (6.3%) | 0 (0.0%) |
| 6-Person Households | 289 (1.8%) | 0 (0.0%) |
| 7+ Person Households | 87 (0.5%) | 0 (0.0%) |
| Total | 10,537 (66.1%) | 5,411 (33.9%) |
Female Fertility in Menomonee Falls
Fertility by Age in Menomonee Falls
Average fertility rate in Menomonee Falls is 41.0 births per 1,000 women. Women in the age bracket of 20 to 34 years have the highest fertility rate with 68.0 births per 1,000 women. Women in the age bracket of 20 to 34 years acount for 61.1% of all women with births.
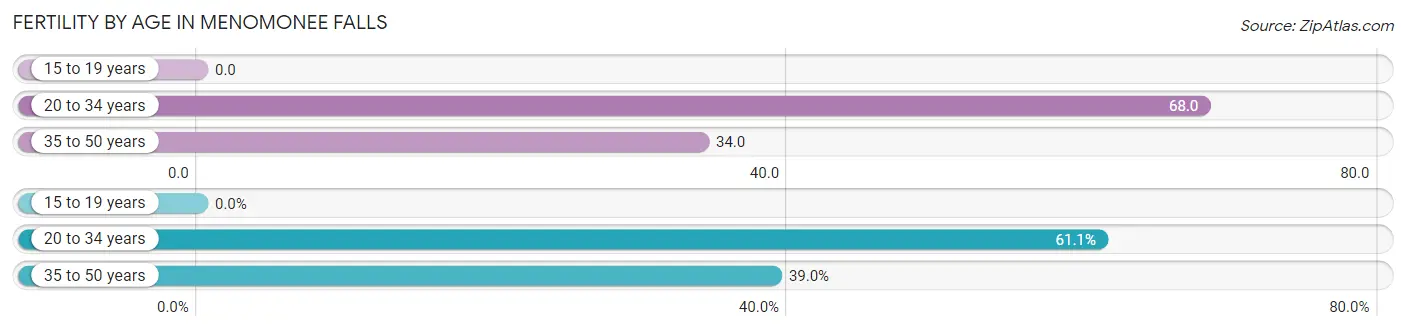
| Age Bracket | Women with Births | Births / 1,000 Women |
| 15 to 19 years | 0 (0.0%) | 0.0 |
| 20 to 34 years | 210 (61.1%) | 68.0 |
| 35 to 50 years | 134 (39.0%) | 34.0 |
| Total | 344 (100.0%) | 41.0 |
Fertility by Age by Marriage Status in Menomonee Falls
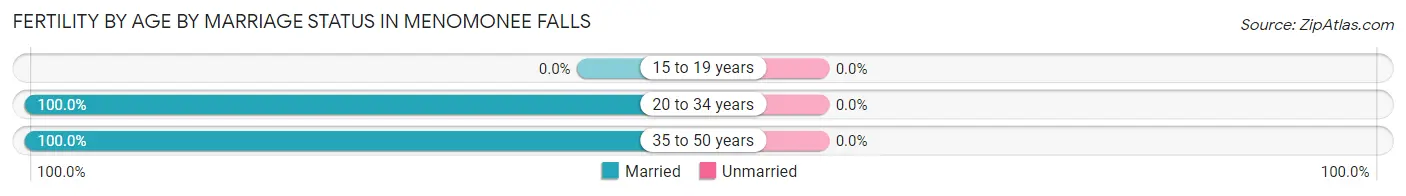
| Age Bracket | Married | Unmarried |
| 15 to 19 years | 0 (0.0%) | 0 (0.0%) |
| 20 to 34 years | 210 (100.0%) | 0 (0.0%) |
| 35 to 50 years | 134 (100.0%) | 0 (0.0%) |
| Total | 344 (100.0%) | 0 (0.0%) |
Fertility by Education in Menomonee Falls
Average fertility rate in Menomonee Falls is 41.0 births per 1,000 women. Women with the education attainment of graduate degree have the highest fertility rate of 64.0 births per 1,000 women, while women with the education attainment of high school diploma have the lowest fertility at 5.0 births per 1,000 women. Women with the education attainment of bachelor's degree represent 37.8% of all women with births.
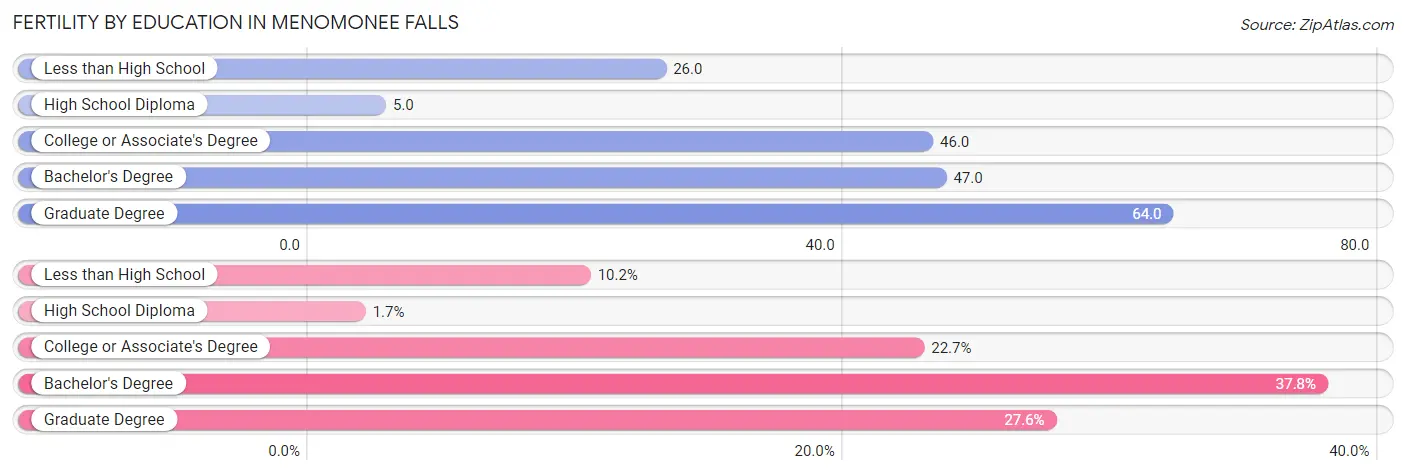
| Educational Attainment | Women with Births | Births / 1,000 Women |
| Less than High School | 35 (10.2%) | 26.0 |
| High School Diploma | 6 (1.7%) | 5.0 |
| College or Associate's Degree | 78 (22.7%) | 46.0 |
| Bachelor's Degree | 130 (37.8%) | 47.0 |
| Graduate Degree | 95 (27.6%) | 64.0 |
| Total | 344 (100.0%) | 41.0 |
Fertility by Education by Marriage Status in Menomonee Falls
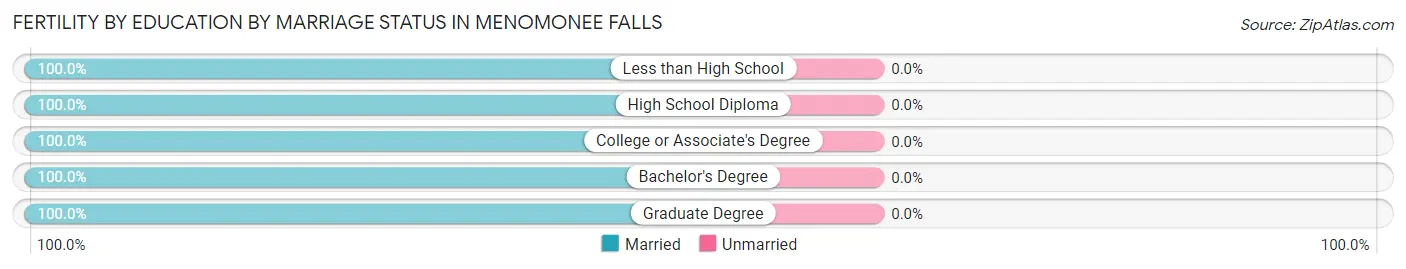
| Educational Attainment | Married | Unmarried |
| Less than High School | 35 (100.0%) | 0 (0.0%) |
| High School Diploma | 6 (100.0%) | 0 (0.0%) |
| College or Associate's Degree | 78 (100.0%) | 0 (0.0%) |
| Bachelor's Degree | 130 (100.0%) | 0 (0.0%) |
| Graduate Degree | 95 (100.0%) | 0 (0.0%) |
| Total | 344 (100.0%) | 0 (0.0%) |
Employment Characteristics in Menomonee Falls
Employment by Class of Employer in Menomonee Falls
Among the 20,093 employed individuals in Menomonee Falls, private company employees (14,597 | 72.7%), not-for-profit organizations (2,567 | 12.8%), and local government employees (1,001 | 5.0%) make up the most common classes of employment.
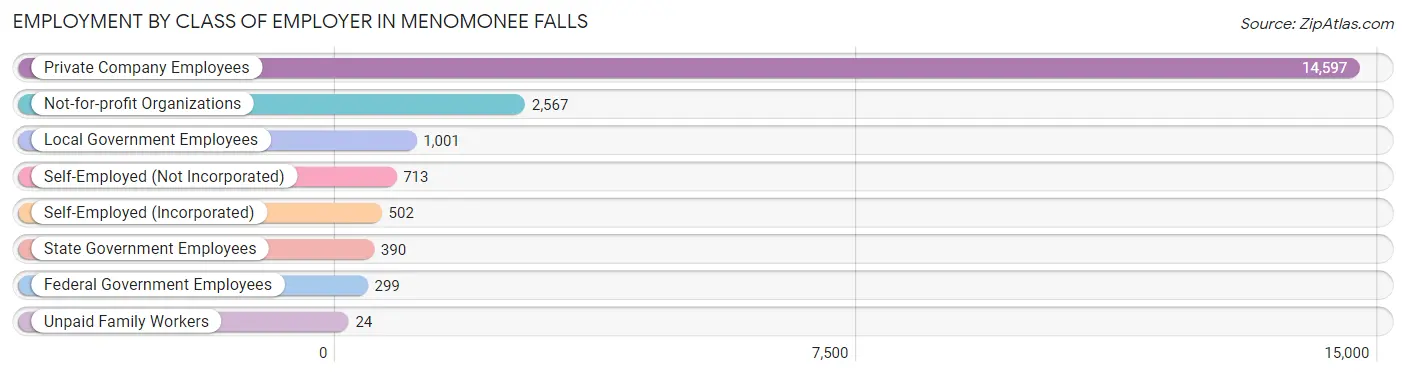
| Employer Class | # Employees | % Employees |
| Private Company Employees | 14,597 | 72.7% |
| Self-Employed (Incorporated) | 502 | 2.5% |
| Self-Employed (Not Incorporated) | 713 | 3.5% |
| Not-for-profit Organizations | 2,567 | 12.8% |
| Local Government Employees | 1,001 | 5.0% |
| State Government Employees | 390 | 1.9% |
| Federal Government Employees | 299 | 1.5% |
| Unpaid Family Workers | 24 | 0.1% |
| Total | 20,093 | 100.0% |
Employment Status by Age in Menomonee Falls
According to the labor force statistics for Menomonee Falls, out of the total population over 16 years of age (30,971), 66.8% or 20,689 individuals are in the labor force, with 2.1% or 434 of them unemployed. The age group with the highest labor force participation rate is 45 to 54 years, with 93.2% or 4,524 individuals in the labor force. Within the labor force, the 16 to 19 years age range has the highest percentage of unemployed individuals, with 11.2% or 138 of them being unemployed.
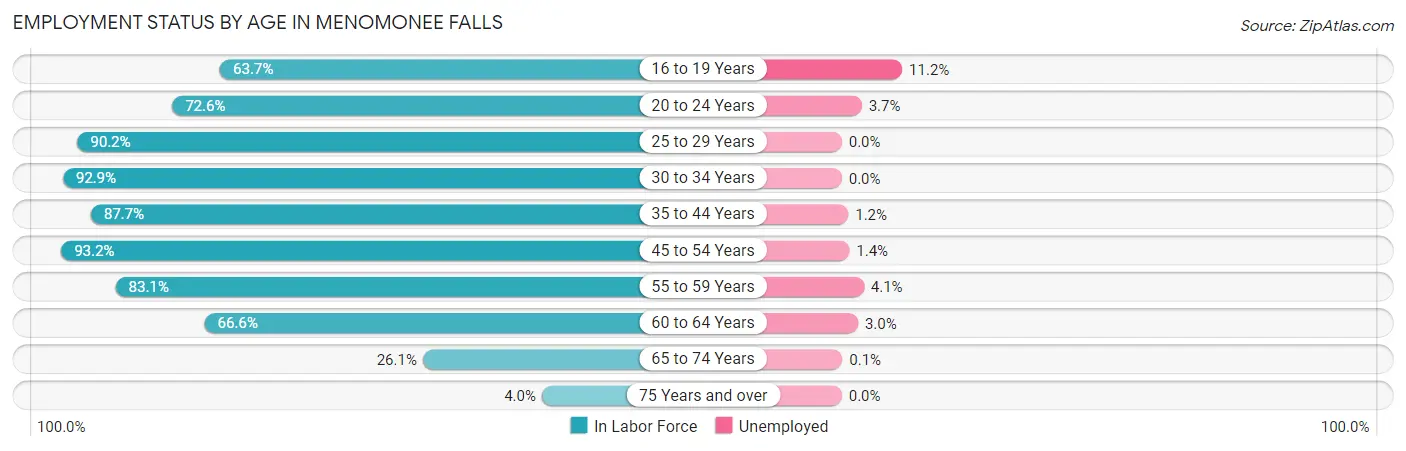
| Age Bracket | In Labor Force | Unemployed |
| 16 to 19 Years | 1,235 (63.7%) | 138 (11.2%) |
| 20 to 24 Years | 1,117 (72.6%) | 41 (3.7%) |
| 25 to 29 Years | 1,645 (90.2%) | 0 (0.0%) |
| 30 to 34 Years | 2,482 (92.9%) | 0 (0.0%) |
| 35 to 44 Years | 4,544 (87.7%) | 55 (1.2%) |
| 45 to 54 Years | 4,524 (93.2%) | 63 (1.4%) |
| 55 to 59 Years | 2,127 (83.1%) | 87 (4.1%) |
| 60 to 64 Years | 1,841 (66.6%) | 55 (3.0%) |
| 65 to 74 Years | 1,026 (26.1%) | 1 (0.1%) |
| 75 Years and over | 148 (4.0%) | 0 (0.0%) |
| Total | 20,689 (66.8%) | 434 (2.1%) |
Employment Status by Educational Attainment in Menomonee Falls
According to labor force statistics for Menomonee Falls, 86.4% of individuals (17,154) out of the total population between 25 and 64 years of age (19,854) are in the labor force, with 1.5% or 257 of them being unemployed. The group with the highest labor force participation rate are those with the educational attainment of bachelor's degree or higher, with 90.1% or 9,742 individuals in the labor force. Within the labor force, individuals with high school diploma education have the highest percentage of unemployment, with 2.3% or 69 of them being unemployed.
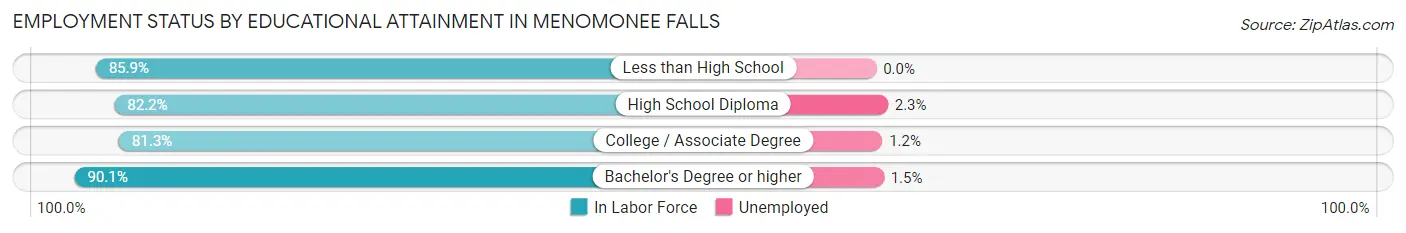
| Educational Attainment | In Labor Force | Unemployed |
| Less than High School | 603 (85.9%) | 0 (0.0%) |
| High School Diploma | 2,979 (82.2%) | 83 (2.3%) |
| College / Associate Degree | 3,834 (81.3%) | 57 (1.2%) |
| Bachelor's Degree or higher | 9,742 (90.1%) | 162 (1.5%) |
| Total | 17,154 (86.4%) | 298 (1.5%) |
Employment Occupations by Sex in Menomonee Falls
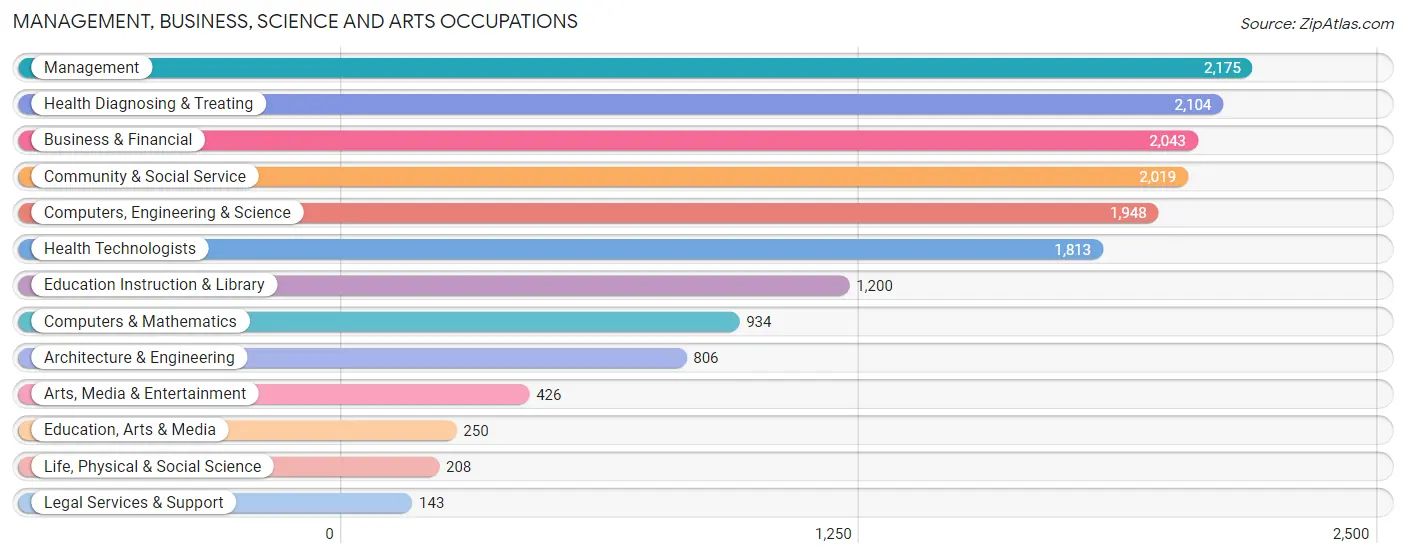
Management, Business, Science and Arts Occupations
The most common Management, Business, Science and Arts occupations in Menomonee Falls are Management (2,175 | 10.7%), Health Diagnosing & Treating (2,104 | 10.4%), Business & Financial (2,043 | 10.1%), Community & Social Service (2,019 | 10.0%), and Computers, Engineering & Science (1,948 | 9.6%).
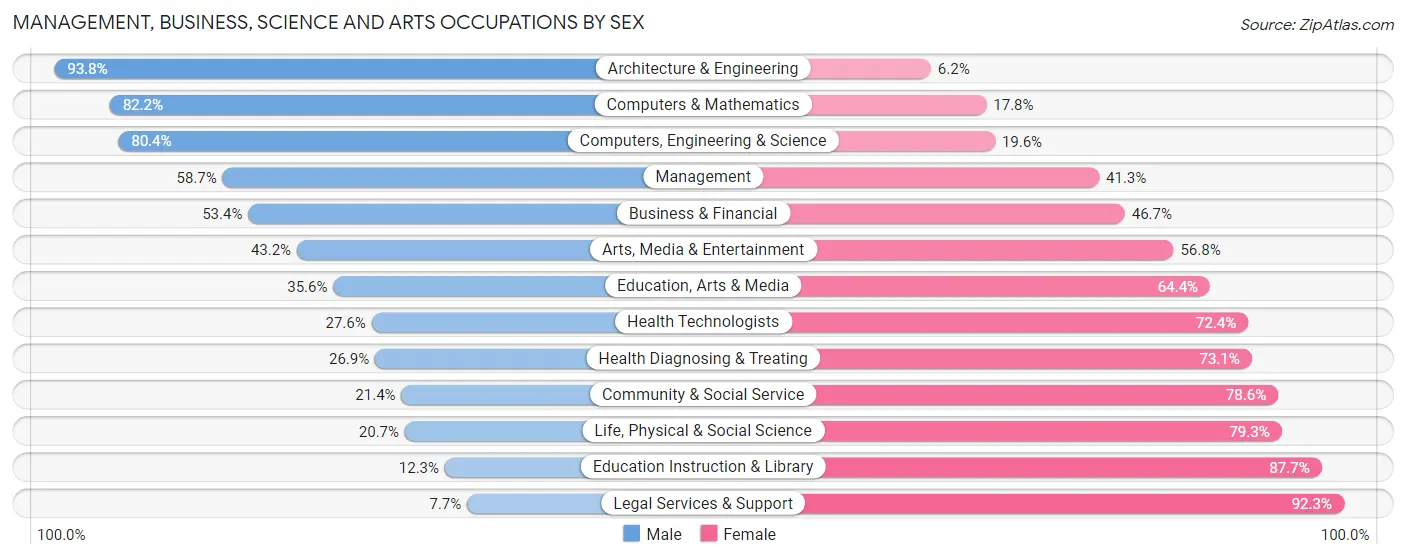
Management, Business, Science and Arts Occupations by Sex
Within the Management, Business, Science and Arts occupations in Menomonee Falls, the most male-oriented occupations are Architecture & Engineering (93.8%), Computers & Mathematics (82.2%), and Computers, Engineering & Science (80.4%), while the most female-oriented occupations are Legal Services & Support (92.3%), Education Instruction & Library (87.7%), and Life, Physical & Social Science (79.3%).
| Occupation | Male | Female |
| Management | 1,277 (58.7%) | 898 (41.3%) |
| Business & Financial | 1,090 (53.3%) | 953 (46.7%) |
| Computers, Engineering & Science | 1,567 (80.4%) | 381 (19.6%) |
| Computers & Mathematics | 768 (82.2%) | 166 (17.8%) |
| Architecture & Engineering | 756 (93.8%) | 50 (6.2%) |
| Life, Physical & Social Science | 43 (20.7%) | 165 (79.3%) |
| Community & Social Service | 432 (21.4%) | 1,587 (78.6%) |
| Education, Arts & Media | 89 (35.6%) | 161 (64.4%) |
| Legal Services & Support | 11 (7.7%) | 132 (92.3%) |
| Education Instruction & Library | 148 (12.3%) | 1,052 (87.7%) |
| Arts, Media & Entertainment | 184 (43.2%) | 242 (56.8%) |
| Health Diagnosing & Treating | 566 (26.9%) | 1,538 (73.1%) |
| Health Technologists | 501 (27.6%) | 1,312 (72.4%) |
| Total (Category) | 4,932 (47.9%) | 5,357 (52.1%) |
| Total (Overall) | 10,511 (51.9%) | 9,728 (48.1%) |
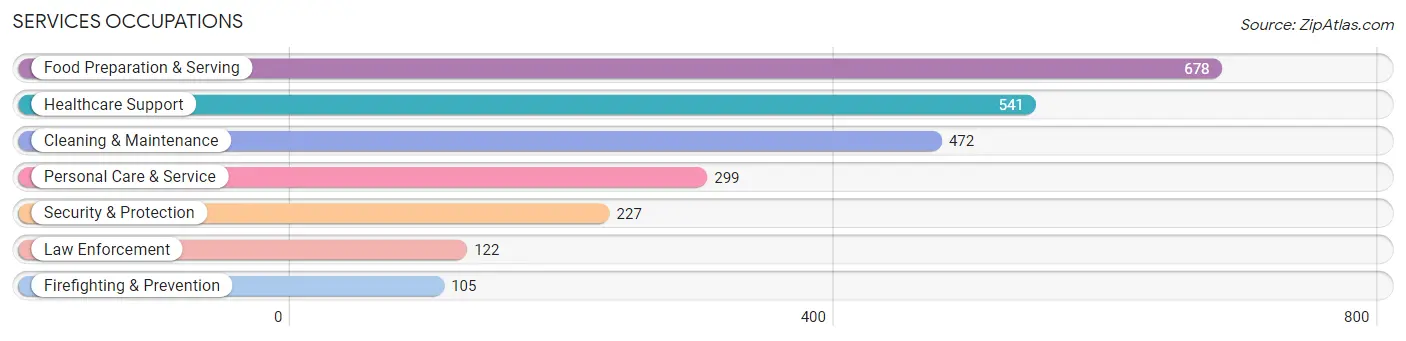
Services Occupations
The most common Services occupations in Menomonee Falls are Food Preparation & Serving (678 | 3.4%), Healthcare Support (541 | 2.7%), Cleaning & Maintenance (472 | 2.3%), Personal Care & Service (299 | 1.5%), and Security & Protection (227 | 1.1%).
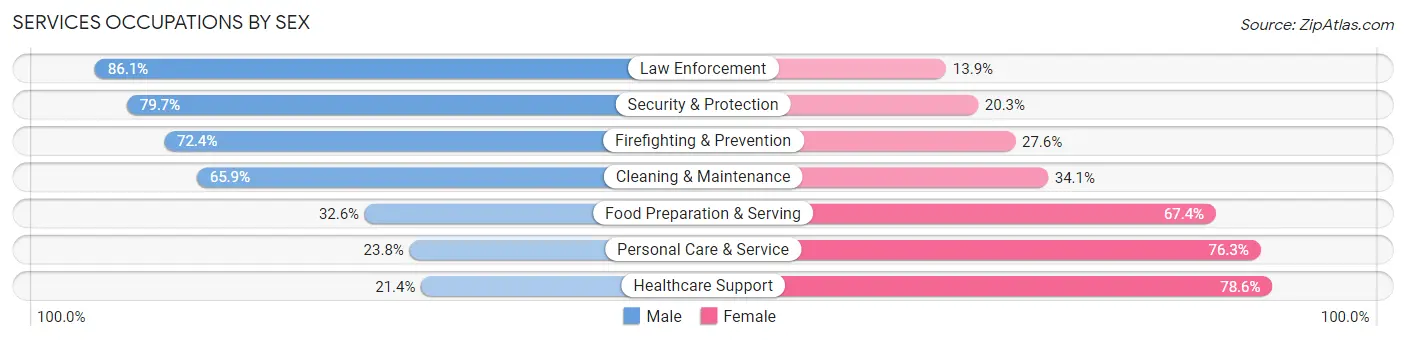
Services Occupations by Sex
Within the Services occupations in Menomonee Falls, the most male-oriented occupations are Law Enforcement (86.1%), Security & Protection (79.7%), and Firefighting & Prevention (72.4%), while the most female-oriented occupations are Healthcare Support (78.6%), Personal Care & Service (76.2%), and Food Preparation & Serving (67.4%).
| Occupation | Male | Female |
| Healthcare Support | 116 (21.4%) | 425 (78.6%) |
| Security & Protection | 181 (79.7%) | 46 (20.3%) |
| Firefighting & Prevention | 76 (72.4%) | 29 (27.6%) |
| Law Enforcement | 105 (86.1%) | 17 (13.9%) |
| Food Preparation & Serving | 221 (32.6%) | 457 (67.4%) |
| Cleaning & Maintenance | 311 (65.9%) | 161 (34.1%) |
| Personal Care & Service | 71 (23.7%) | 228 (76.2%) |
| Total (Category) | 900 (40.6%) | 1,317 (59.4%) |
| Total (Overall) | 10,511 (51.9%) | 9,728 (48.1%) |
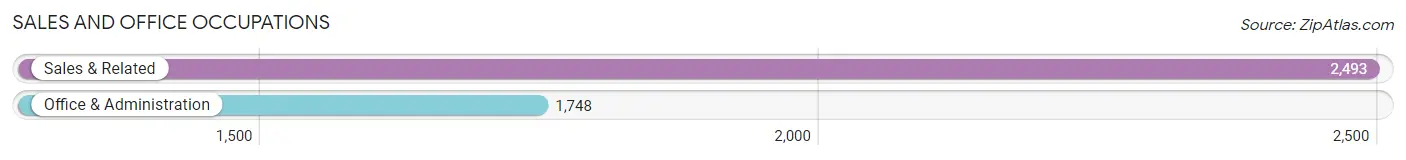
Sales and Office Occupations
The most common Sales and Office occupations in Menomonee Falls are Sales & Related (2,493 | 12.3%), and Office & Administration (1,748 | 8.6%).
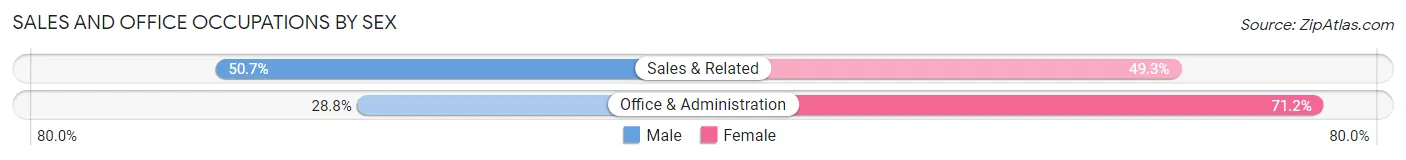
Sales and Office Occupations by Sex
| Occupation | Male | Female |
| Sales & Related | 1,263 (50.7%) | 1,230 (49.3%) |
| Office & Administration | 503 (28.8%) | 1,245 (71.2%) |
| Total (Category) | 1,766 (41.6%) | 2,475 (58.4%) |
| Total (Overall) | 10,511 (51.9%) | 9,728 (48.1%) |
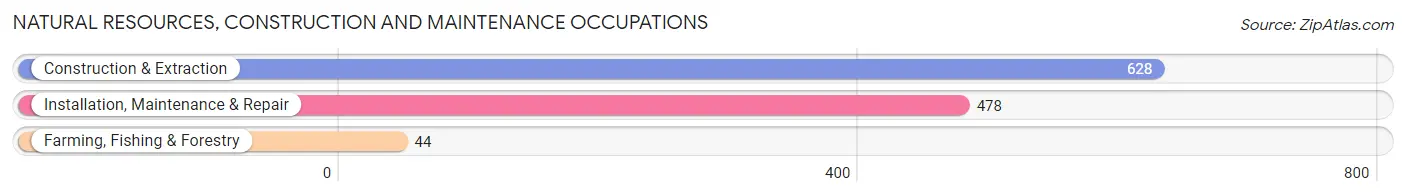
Natural Resources, Construction and Maintenance Occupations
The most common Natural Resources, Construction and Maintenance occupations in Menomonee Falls are Construction & Extraction (628 | 3.1%), Installation, Maintenance & Repair (478 | 2.4%), and Farming, Fishing & Forestry (44 | 0.2%).
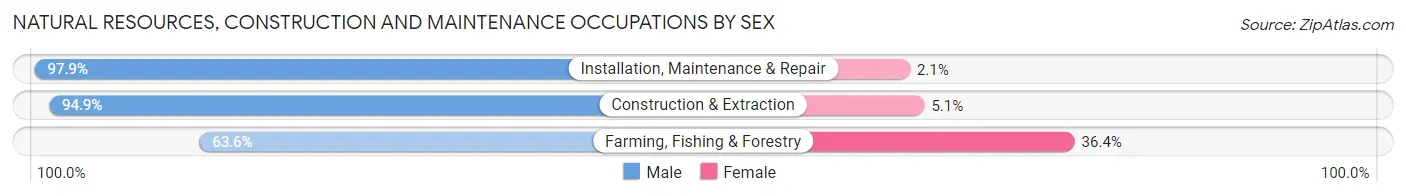
Natural Resources, Construction and Maintenance Occupations by Sex
| Occupation | Male | Female |
| Farming, Fishing & Forestry | 28 (63.6%) | 16 (36.4%) |
| Construction & Extraction | 596 (94.9%) | 32 (5.1%) |
| Installation, Maintenance & Repair | 468 (97.9%) | 10 (2.1%) |
| Total (Category) | 1,092 (95.0%) | 58 (5.0%) |
| Total (Overall) | 10,511 (51.9%) | 9,728 (48.1%) |
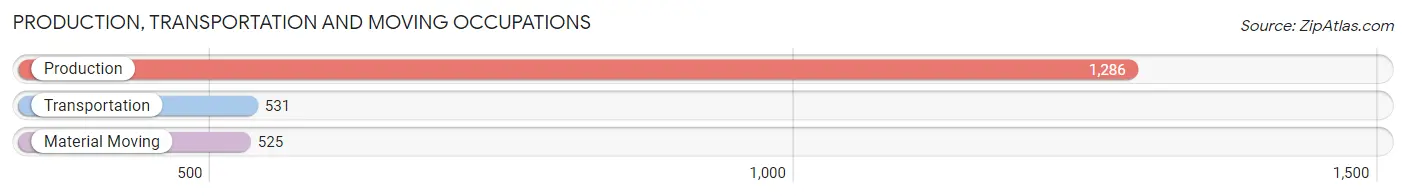
Production, Transportation and Moving Occupations
The most common Production, Transportation and Moving occupations in Menomonee Falls are Production (1,286 | 6.4%), Transportation (531 | 2.6%), and Material Moving (525 | 2.6%).
Production, Transportation and Moving Occupations by Sex
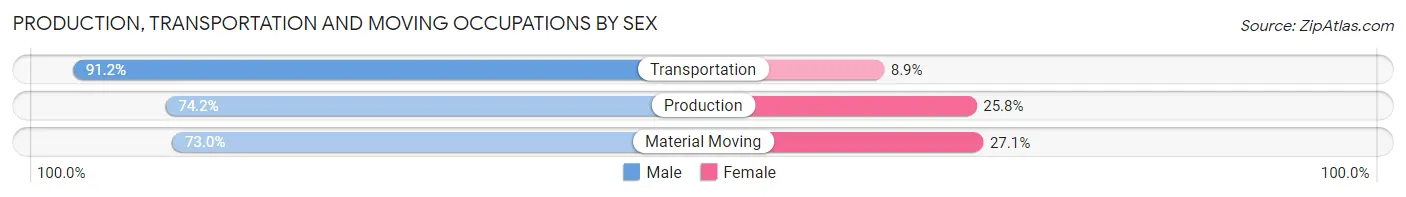
| Occupation | Male | Female |
| Production | 954 (74.2%) | 332 (25.8%) |
| Transportation | 484 (91.1%) | 47 (8.8%) |
| Material Moving | 383 (73.0%) | 142 (27.1%) |
| Total (Category) | 1,821 (77.7%) | 521 (22.3%) |
| Total (Overall) | 10,511 (51.9%) | 9,728 (48.1%) |
Employment Industries by Sex in Menomonee Falls
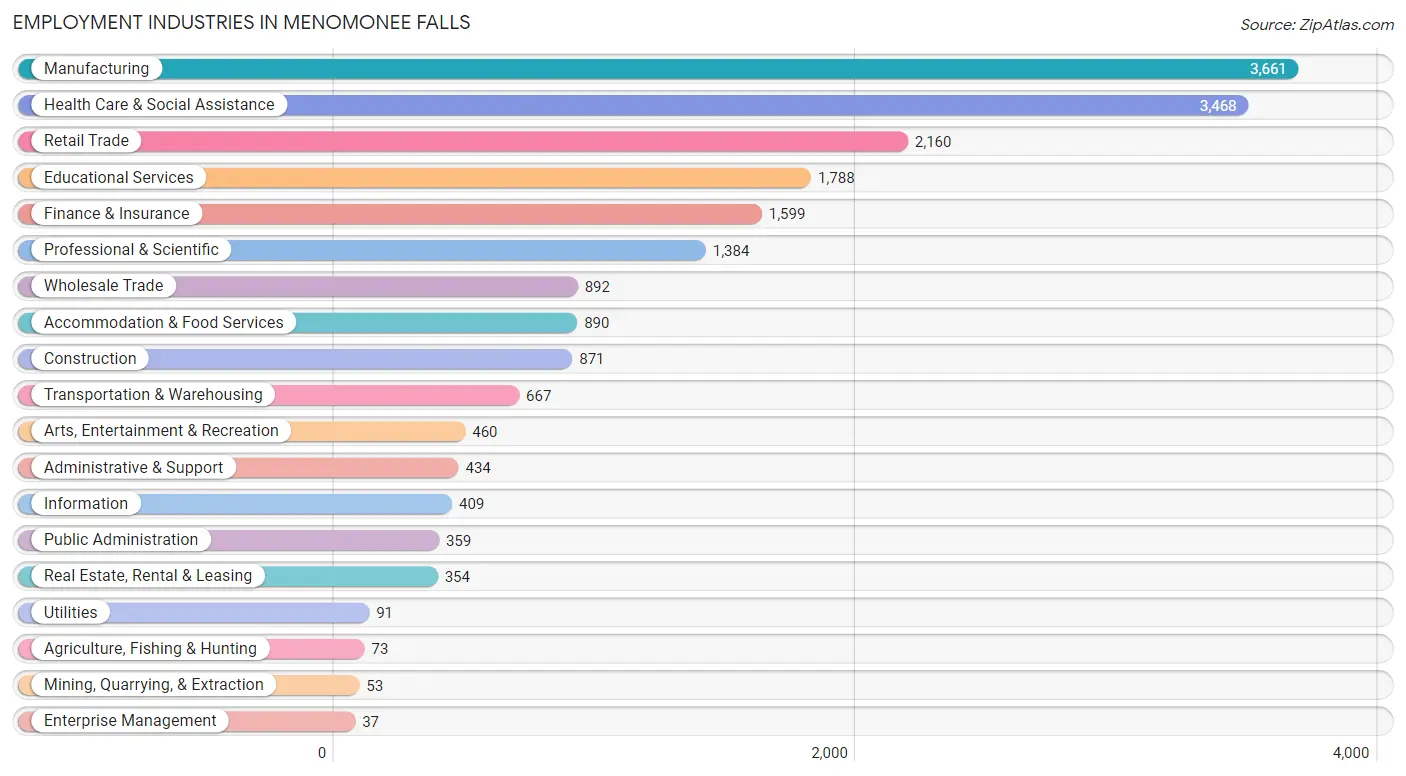
Employment Industries in Menomonee Falls
The major employment industries in Menomonee Falls include Manufacturing (3,661 | 18.1%), Health Care & Social Assistance (3,468 | 17.1%), Retail Trade (2,160 | 10.7%), Educational Services (1,788 | 8.8%), and Finance & Insurance (1,599 | 7.9%).
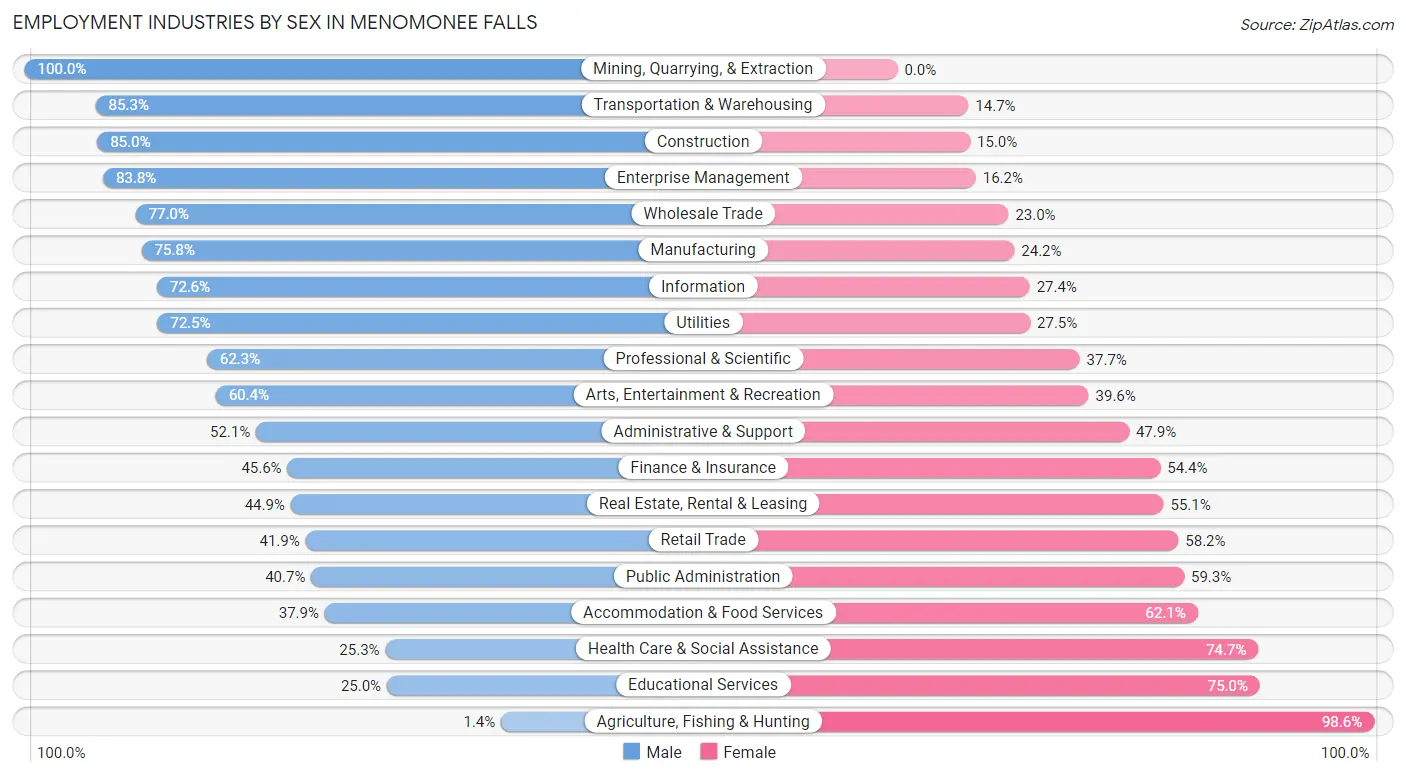
Employment Industries by Sex in Menomonee Falls
The Menomonee Falls industries that see more men than women are Mining, Quarrying, & Extraction (100.0%), Transportation & Warehousing (85.3%), and Construction (85.0%), whereas the industries that tend to have a higher number of women are Agriculture, Fishing & Hunting (98.6%), Educational Services (75.0%), and Health Care & Social Assistance (74.7%).
| Industry | Male | Female |
| Agriculture, Fishing & Hunting | 1 (1.4%) | 72 (98.6%) |
| Mining, Quarrying, & Extraction | 53 (100.0%) | 0 (0.0%) |
| Construction | 740 (85.0%) | 131 (15.0%) |
| Manufacturing | 2,775 (75.8%) | 886 (24.2%) |
| Wholesale Trade | 687 (77.0%) | 205 (23.0%) |
| Retail Trade | 904 (41.8%) | 1,256 (58.2%) |
| Transportation & Warehousing | 569 (85.3%) | 98 (14.7%) |
| Utilities | 66 (72.5%) | 25 (27.5%) |
| Information | 297 (72.6%) | 112 (27.4%) |
| Finance & Insurance | 729 (45.6%) | 870 (54.4%) |
| Real Estate, Rental & Leasing | 159 (44.9%) | 195 (55.1%) |
| Professional & Scientific | 862 (62.3%) | 522 (37.7%) |
| Enterprise Management | 31 (83.8%) | 6 (16.2%) |
| Administrative & Support | 226 (52.1%) | 208 (47.9%) |
| Educational Services | 447 (25.0%) | 1,341 (75.0%) |
| Health Care & Social Assistance | 878 (25.3%) | 2,590 (74.7%) |
| Arts, Entertainment & Recreation | 278 (60.4%) | 182 (39.6%) |
| Accommodation & Food Services | 337 (37.9%) | 553 (62.1%) |
| Public Administration | 146 (40.7%) | 213 (59.3%) |
| Total | 10,511 (51.9%) | 9,728 (48.1%) |
Education in Menomonee Falls
School Enrollment in Menomonee Falls
The most common levels of schooling among the 8,672 students in Menomonee Falls are high school (2,119 | 24.4%), middle school (2,014 | 23.2%), and elementary school (2,002 | 23.1%).
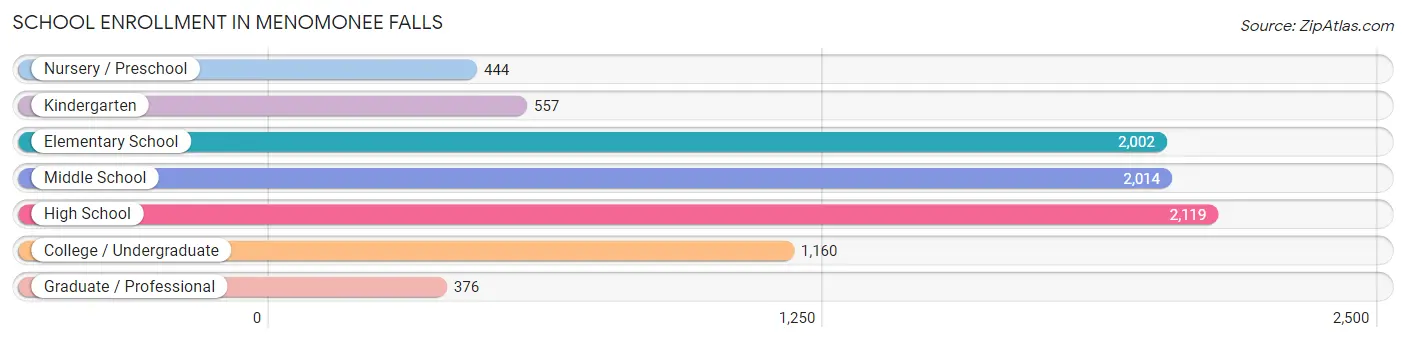
| School Level | # Students | % Students |
| Nursery / Preschool | 444 | 5.1% |
| Kindergarten | 557 | 6.4% |
| Elementary School | 2,002 | 23.1% |
| Middle School | 2,014 | 23.2% |
| High School | 2,119 | 24.4% |
| College / Undergraduate | 1,160 | 13.4% |
| Graduate / Professional | 376 | 4.3% |
| Total | 8,672 | 100.0% |
School Enrollment by Age by Funding Source in Menomonee Falls
Out of a total of 8,672 students who are enrolled in schools in Menomonee Falls, 1,917 (22.1%) attend a private institution, while the remaining 6,755 (77.9%) are enrolled in public schools. The age group of 35 years and over has the highest likelihood of being enrolled in private schools, with 131 (50.6% in the age bracket) enrolled. Conversely, the age group of 15 to 17 year olds has the lowest likelihood of being enrolled in a private school, with 1,492 (89.2% in the age bracket) attending a public institution.
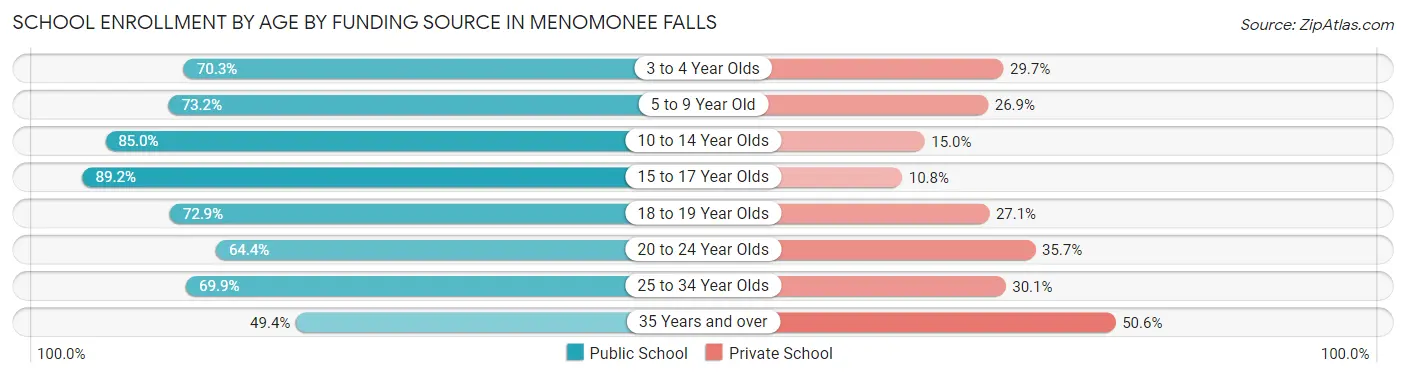
| Age Bracket | Public School | Private School |
| 3 to 4 Year Olds | 244 (70.3%) | 103 (29.7%) |
| 5 to 9 Year Old | 1,798 (73.2%) | 660 (26.9%) |
| 10 to 14 Year Olds | 2,070 (85.0%) | 366 (15.0%) |
| 15 to 17 Year Olds | 1,492 (89.2%) | 181 (10.8%) |
| 18 to 19 Year Olds | 345 (72.9%) | 128 (27.1%) |
| 20 to 24 Year Olds | 408 (64.3%) | 226 (35.6%) |
| 25 to 34 Year Olds | 274 (69.9%) | 118 (30.1%) |
| 35 Years and over | 128 (49.4%) | 131 (50.6%) |
| Total | 6,755 (77.9%) | 1,917 (22.1%) |
Educational Attainment by Field of Study in Menomonee Falls
Business (3,725 | 26.4%), science & technology (1,836 | 13.0%), education (1,781 | 12.6%), engineering (1,073 | 7.6%), and bio, nature & agricultural (873 | 6.2%) are the most common fields of study among 14,098 individuals in Menomonee Falls who have obtained a bachelor's degree or higher.
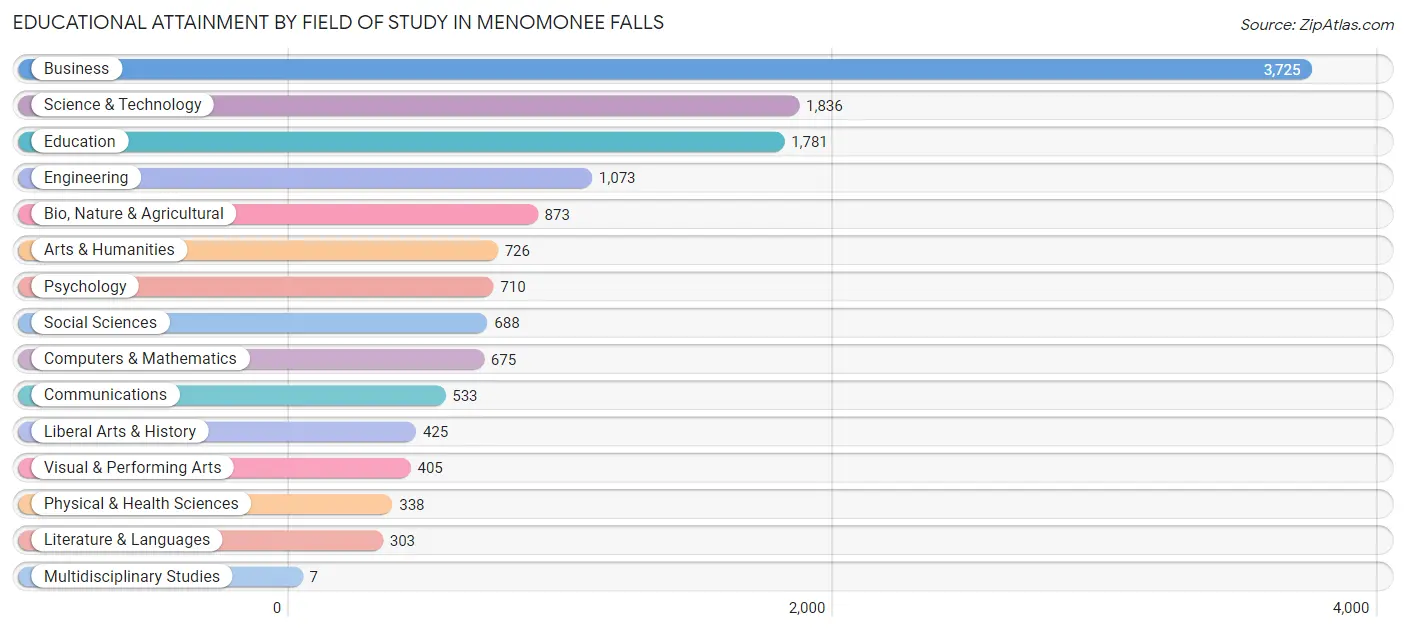
| Field of Study | # Graduates | % Graduates |
| Computers & Mathematics | 675 | 4.8% |
| Bio, Nature & Agricultural | 873 | 6.2% |
| Physical & Health Sciences | 338 | 2.4% |
| Psychology | 710 | 5.0% |
| Social Sciences | 688 | 4.9% |
| Engineering | 1,073 | 7.6% |
| Multidisciplinary Studies | 7 | 0.1% |
| Science & Technology | 1,836 | 13.0% |
| Business | 3,725 | 26.4% |
| Education | 1,781 | 12.6% |
| Literature & Languages | 303 | 2.1% |
| Liberal Arts & History | 425 | 3.0% |
| Visual & Performing Arts | 405 | 2.9% |
| Communications | 533 | 3.8% |
| Arts & Humanities | 726 | 5.1% |
| Total | 14,098 | 100.0% |
Transportation & Commute in Menomonee Falls
Vehicle Availability by Sex in Menomonee Falls
The most prevalent vehicle ownership categories in Menomonee Falls are males with 2 vehicles (5,614, accounting for 53.7%) and females with 2 vehicles (5,038, making up 58.3%).
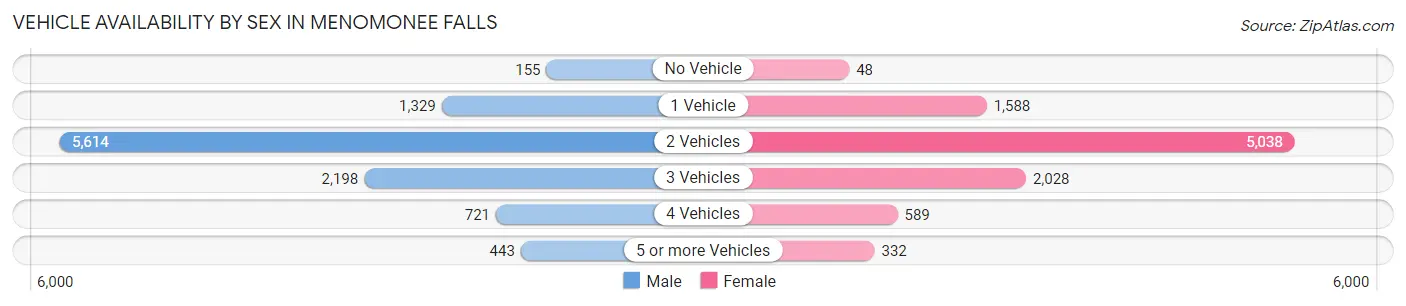
| Vehicles Available | Male | Female |
| No Vehicle | 155 (1.5%) | 48 (0.5%) |
| 1 Vehicle | 1,329 (12.7%) | 1,588 (16.5%) |
| 2 Vehicles | 5,614 (53.7%) | 5,038 (52.3%) |
| 3 Vehicles | 2,198 (21.0%) | 2,028 (21.1%) |
| 4 Vehicles | 721 (6.9%) | 589 (6.1%) |
| 5 or more Vehicles | 443 (4.2%) | 332 (3.5%) |
| Total | 10,460 (100.0%) | 9,623 (100.0%) |
Commute Time in Menomonee Falls
The most frequently occuring commute durations in Menomonee Falls are 20 to 24 minutes (3,174 commuters, 18.4%), 15 to 19 minutes (3,014 commuters, 17.4%), and 10 to 14 minutes (2,787 commuters, 16.1%).
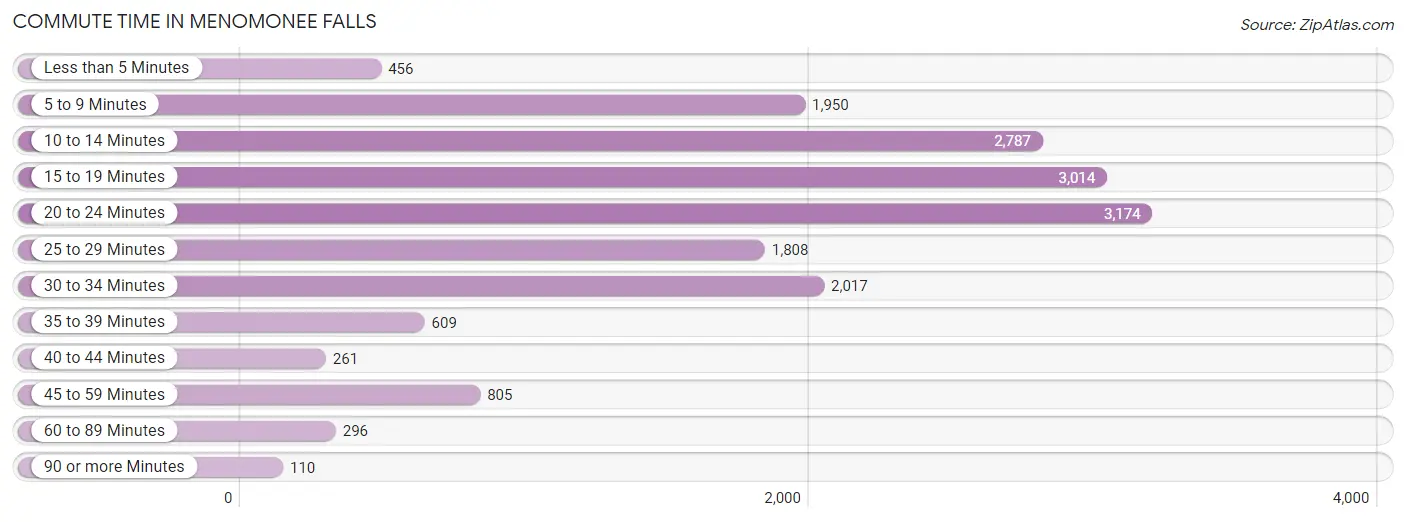
| Commute Time | # Commuters | % Commuters |
| Less than 5 Minutes | 456 | 2.6% |
| 5 to 9 Minutes | 1,950 | 11.3% |
| 10 to 14 Minutes | 2,787 | 16.1% |
| 15 to 19 Minutes | 3,014 | 17.4% |
| 20 to 24 Minutes | 3,174 | 18.4% |
| 25 to 29 Minutes | 1,808 | 10.5% |
| 30 to 34 Minutes | 2,017 | 11.7% |
| 35 to 39 Minutes | 609 | 3.5% |
| 40 to 44 Minutes | 261 | 1.5% |
| 45 to 59 Minutes | 805 | 4.7% |
| 60 to 89 Minutes | 296 | 1.7% |
| 90 or more Minutes | 110 | 0.6% |
Commute Time by Sex in Menomonee Falls
The most common commute times in Menomonee Falls are 20 to 24 minutes (1,930 commuters, 21.0%) for males and 15 to 19 minutes (1,368 commuters, 16.9%) for females.
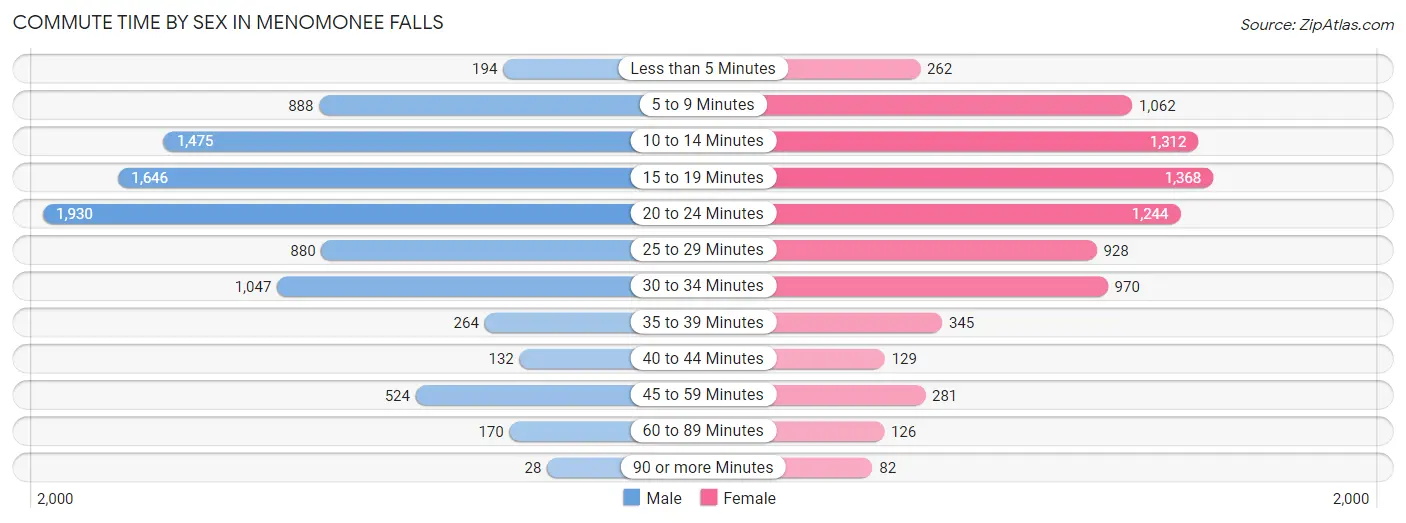
| Commute Time | Male | Female |
| Less than 5 Minutes | 194 (2.1%) | 262 (3.2%) |
| 5 to 9 Minutes | 888 (9.7%) | 1,062 (13.1%) |
| 10 to 14 Minutes | 1,475 (16.1%) | 1,312 (16.2%) |
| 15 to 19 Minutes | 1,646 (17.9%) | 1,368 (16.9%) |
| 20 to 24 Minutes | 1,930 (21.0%) | 1,244 (15.3%) |
| 25 to 29 Minutes | 880 (9.6%) | 928 (11.4%) |
| 30 to 34 Minutes | 1,047 (11.4%) | 970 (12.0%) |
| 35 to 39 Minutes | 264 (2.9%) | 345 (4.3%) |
| 40 to 44 Minutes | 132 (1.4%) | 129 (1.6%) |
| 45 to 59 Minutes | 524 (5.7%) | 281 (3.5%) |
| 60 to 89 Minutes | 170 (1.8%) | 126 (1.5%) |
| 90 or more Minutes | 28 (0.3%) | 82 (1.0%) |
Time of Departure to Work by Sex in Menomonee Falls
The most frequent times of departure to work in Menomonee Falls are 7:00 AM to 7:29 AM (1,671, 18.2%) for males and 7:00 AM to 7:29 AM (1,676, 20.7%) for females.
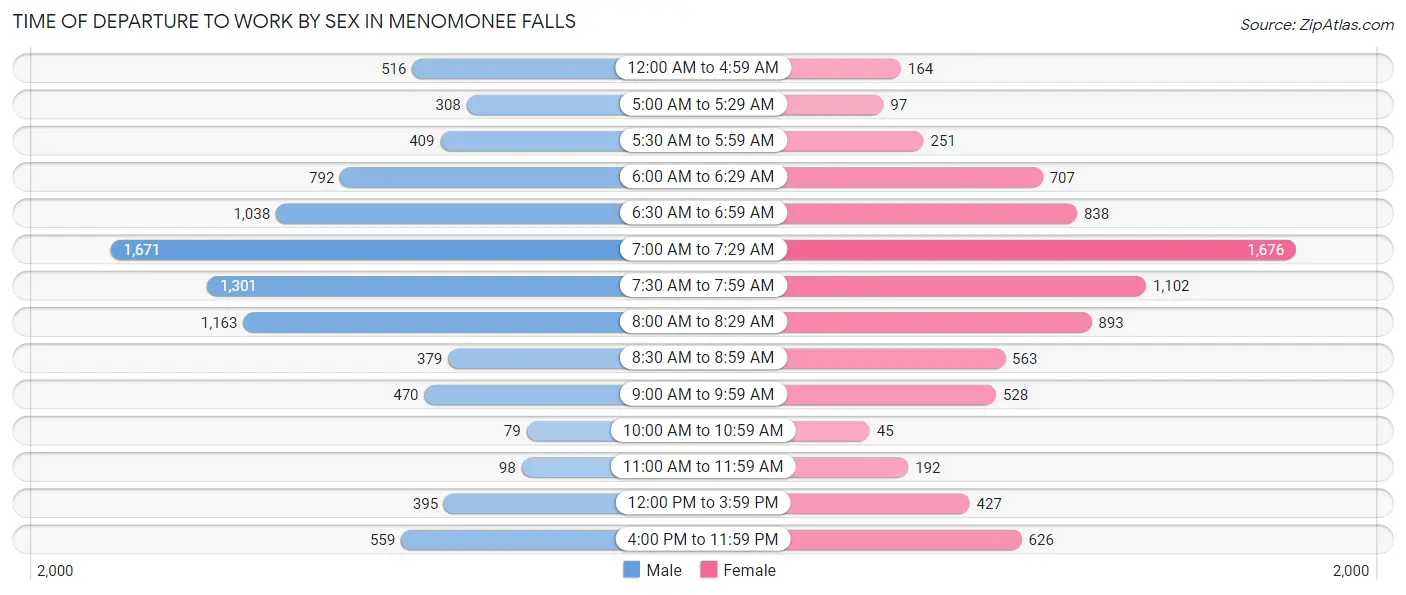
| Time of Departure | Male | Female |
| 12:00 AM to 4:59 AM | 516 (5.6%) | 164 (2.0%) |
| 5:00 AM to 5:29 AM | 308 (3.4%) | 97 (1.2%) |
| 5:30 AM to 5:59 AM | 409 (4.5%) | 251 (3.1%) |
| 6:00 AM to 6:29 AM | 792 (8.6%) | 707 (8.7%) |
| 6:30 AM to 6:59 AM | 1,038 (11.3%) | 838 (10.3%) |
| 7:00 AM to 7:29 AM | 1,671 (18.2%) | 1,676 (20.7%) |
| 7:30 AM to 7:59 AM | 1,301 (14.2%) | 1,102 (13.6%) |
| 8:00 AM to 8:29 AM | 1,163 (12.7%) | 893 (11.0%) |
| 8:30 AM to 8:59 AM | 379 (4.1%) | 563 (6.9%) |
| 9:00 AM to 9:59 AM | 470 (5.1%) | 528 (6.5%) |
| 10:00 AM to 10:59 AM | 79 (0.9%) | 45 (0.5%) |
| 11:00 AM to 11:59 AM | 98 (1.1%) | 192 (2.4%) |
| 12:00 PM to 3:59 PM | 395 (4.3%) | 427 (5.3%) |
| 4:00 PM to 11:59 PM | 559 (6.1%) | 626 (7.7%) |
| Total | 9,178 (100.0%) | 8,109 (100.0%) |
Housing Occupancy in Menomonee Falls
Occupancy by Ownership in Menomonee Falls
Of the total 15,948 dwellings in Menomonee Falls, owner-occupied units account for 11,944 (74.9%), while renter-occupied units make up 4,004 (25.1%).
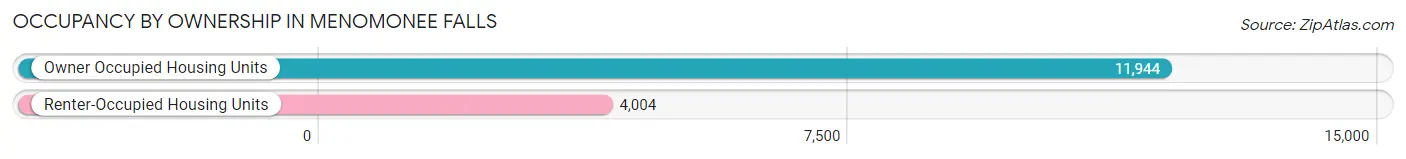
| Occupancy | # Housing Units | % Housing Units |
| Owner Occupied Housing Units | 11,944 | 74.9% |
| Renter-Occupied Housing Units | 4,004 | 25.1% |
| Total Occupied Housing Units | 15,948 | 100.0% |
Occupancy by Household Size in Menomonee Falls
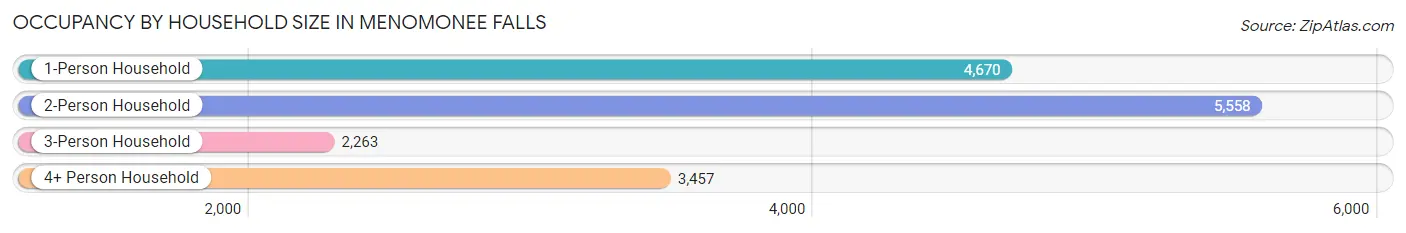
| Household Size | # Housing Units | % Housing Units |
| 1-Person Household | 4,670 | 29.3% |
| 2-Person Household | 5,558 | 34.8% |
| 3-Person Household | 2,263 | 14.2% |
| 4+ Person Household | 3,457 | 21.7% |
| Total Housing Units | 15,948 | 100.0% |
Occupancy by Ownership by Household Size in Menomonee Falls
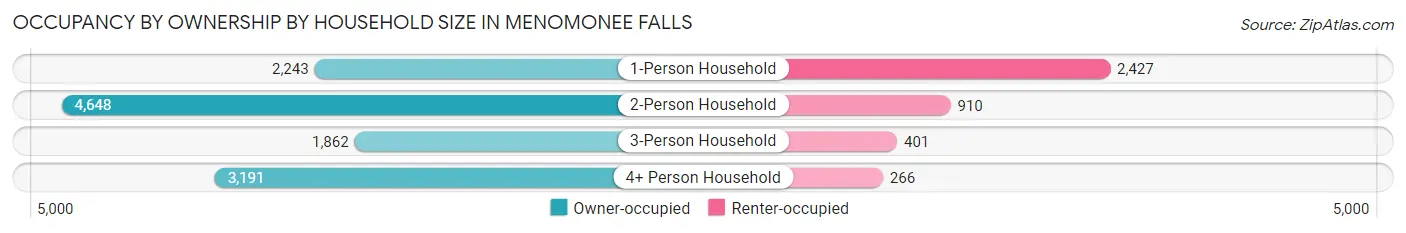
| Household Size | Owner-occupied | Renter-occupied |
| 1-Person Household | 2,243 (48.0%) | 2,427 (52.0%) |
| 2-Person Household | 4,648 (83.6%) | 910 (16.4%) |
| 3-Person Household | 1,862 (82.3%) | 401 (17.7%) |
| 4+ Person Household | 3,191 (92.3%) | 266 (7.7%) |
| Total Housing Units | 11,944 (74.9%) | 4,004 (25.1%) |
Occupancy by Educational Attainment in Menomonee Falls
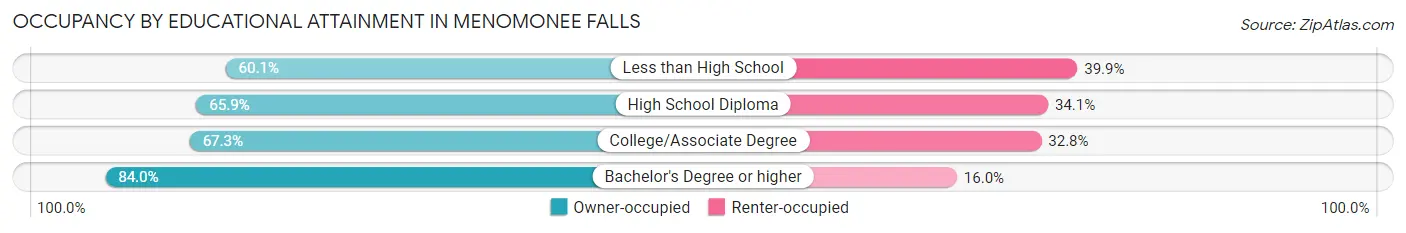
| Household Size | Owner-occupied | Renter-occupied |
| Less than High School | 282 (60.1%) | 187 (39.9%) |
| High School Diploma | 2,427 (65.9%) | 1,254 (34.1%) |
| College/Associate Degree | 2,706 (67.2%) | 1,318 (32.8%) |
| Bachelor's Degree or higher | 6,529 (84.0%) | 1,245 (16.0%) |
Occupancy by Age of Householder in Menomonee Falls
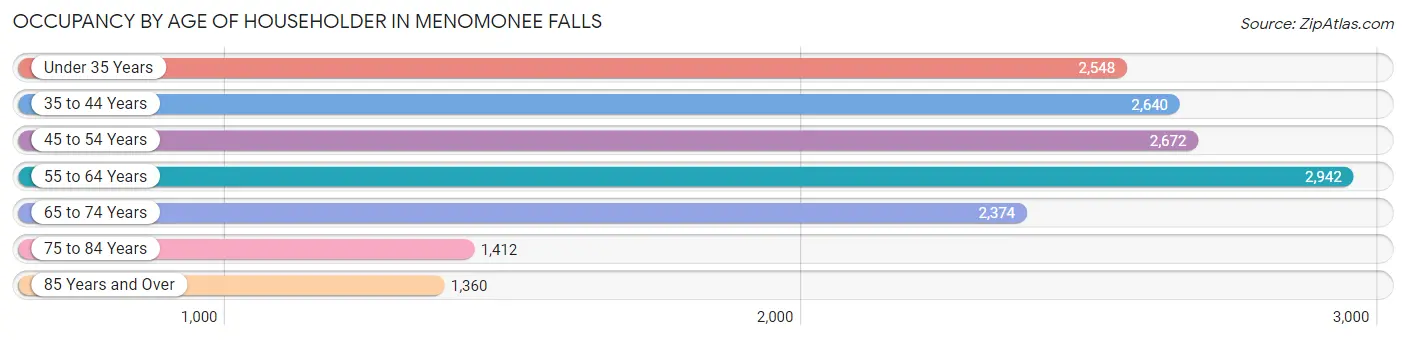
| Age Bracket | # Households | % Households |
| Under 35 Years | 2,548 | 16.0% |
| 35 to 44 Years | 2,640 | 16.6% |
| 45 to 54 Years | 2,672 | 16.8% |
| 55 to 64 Years | 2,942 | 18.4% |
| 65 to 74 Years | 2,374 | 14.9% |
| 75 to 84 Years | 1,412 | 8.8% |
| 85 Years and Over | 1,360 | 8.5% |
| Total | 15,948 | 100.0% |
Housing Finances in Menomonee Falls
Median Income by Occupancy in Menomonee Falls
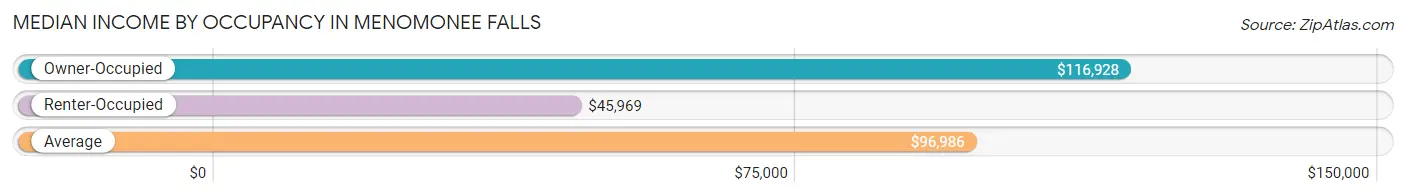
| Occupancy Type | # Households | Median Income |
| Owner-Occupied | 11,944 (74.9%) | $116,928 |
| Renter-Occupied | 4,004 (25.1%) | $45,969 |
| Average | 15,948 (100.0%) | $96,986 |
Occupancy by Householder Income Bracket in Menomonee Falls
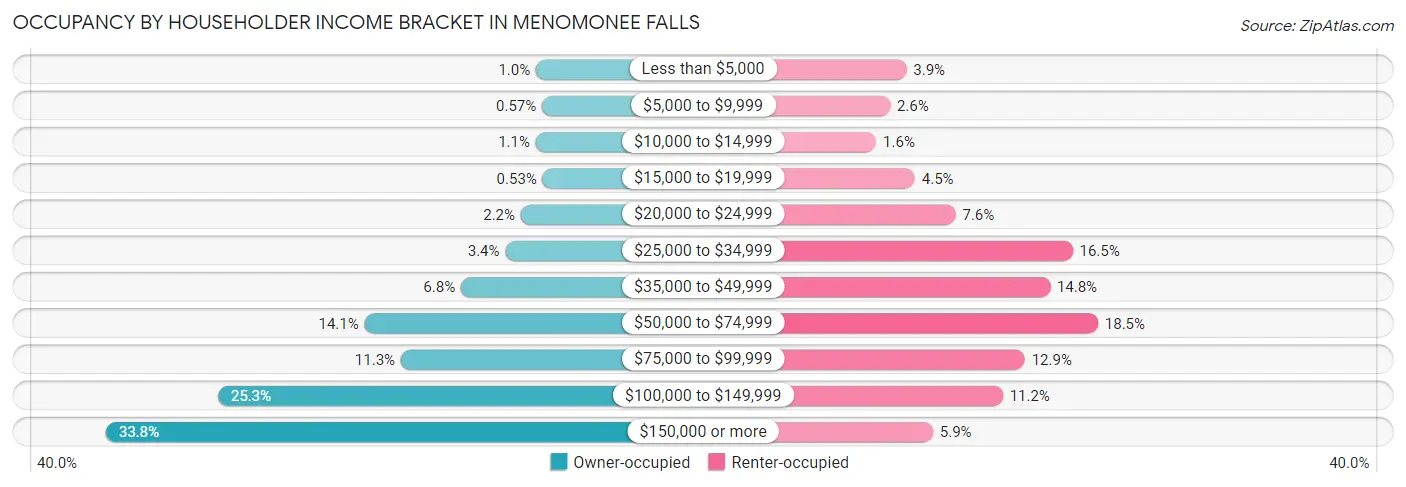
| Income Bracket | Owner-occupied | Renter-occupied |
| Less than $5,000 | 123 (1.0%) | 155 (3.9%) |
| $5,000 to $9,999 | 68 (0.6%) | 105 (2.6%) |
| $10,000 to $14,999 | 126 (1.1%) | 63 (1.6%) |
| $15,000 to $19,999 | 63 (0.5%) | 181 (4.5%) |
| $20,000 to $24,999 | 262 (2.2%) | 305 (7.6%) |
| $25,000 to $34,999 | 402 (3.4%) | 662 (16.5%) |
| $35,000 to $49,999 | 806 (6.8%) | 593 (14.8%) |
| $50,000 to $74,999 | 1,684 (14.1%) | 739 (18.5%) |
| $75,000 to $99,999 | 1,353 (11.3%) | 516 (12.9%) |
| $100,000 to $149,999 | 3,019 (25.3%) | 449 (11.2%) |
| $150,000 or more | 4,038 (33.8%) | 236 (5.9%) |
| Total | 11,944 (100.0%) | 4,004 (100.0%) |
Monthly Housing Cost Tiers in Menomonee Falls
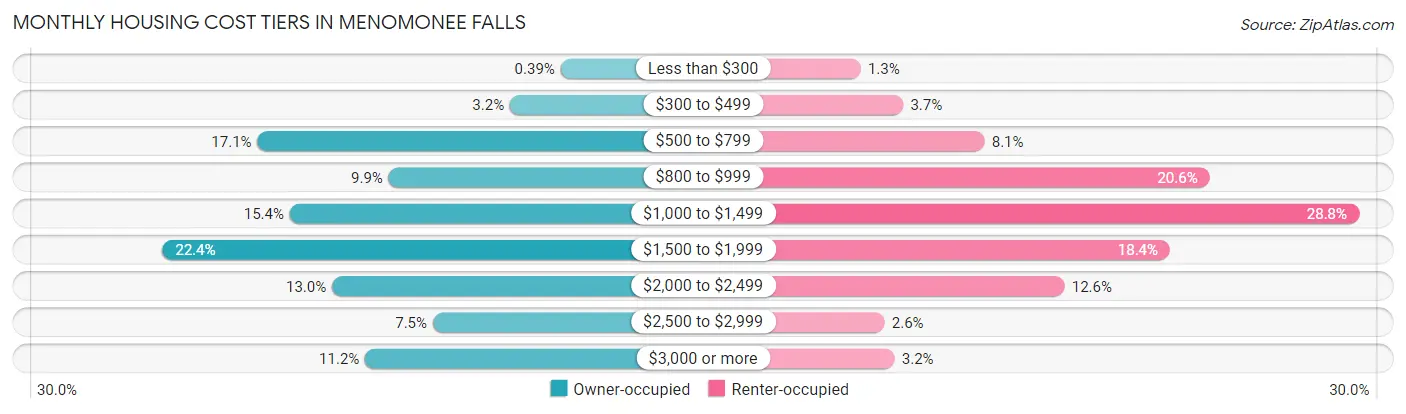
| Monthly Cost | Owner-occupied | Renter-occupied |
| Less than $300 | 46 (0.4%) | 52 (1.3%) |
| $300 to $499 | 381 (3.2%) | 146 (3.6%) |
| $500 to $799 | 2,047 (17.1%) | 326 (8.1%) |
| $800 to $999 | 1,181 (9.9%) | 823 (20.5%) |
| $1,000 to $1,499 | 1,833 (15.3%) | 1,153 (28.8%) |
| $1,500 to $1,999 | 2,674 (22.4%) | 735 (18.4%) |
| $2,000 to $2,499 | 1,555 (13.0%) | 503 (12.6%) |
| $2,500 to $2,999 | 890 (7.4%) | 105 (2.6%) |
| $3,000 or more | 1,337 (11.2%) | 127 (3.2%) |
| Total | 11,944 (100.0%) | 4,004 (100.0%) |
Physical Housing Characteristics in Menomonee Falls
Housing Structures in Menomonee Falls
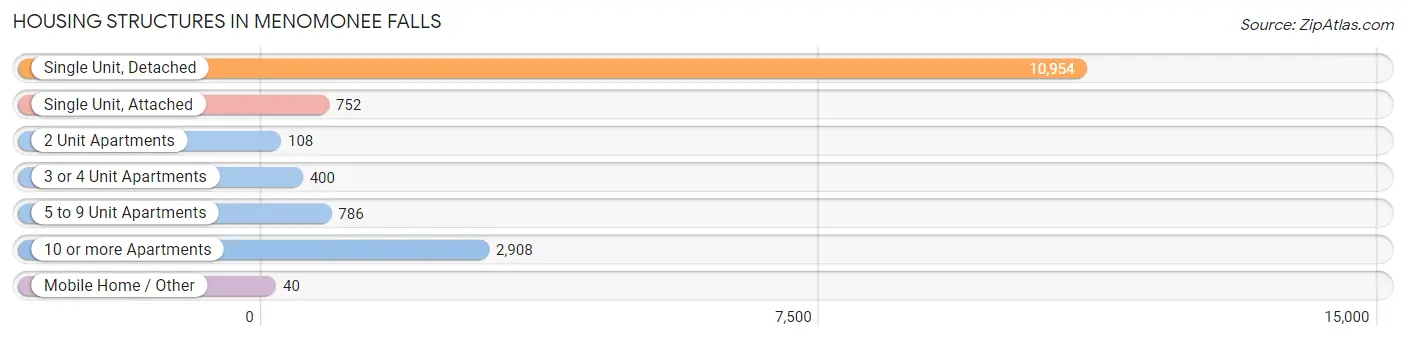
| Structure Type | # Housing Units | % Housing Units |
| Single Unit, Detached | 10,954 | 68.7% |
| Single Unit, Attached | 752 | 4.7% |
| 2 Unit Apartments | 108 | 0.7% |
| 3 or 4 Unit Apartments | 400 | 2.5% |
| 5 to 9 Unit Apartments | 786 | 4.9% |
| 10 or more Apartments | 2,908 | 18.2% |
| Mobile Home / Other | 40 | 0.3% |
| Total | 15,948 | 100.0% |
Housing Structures by Occupancy in Menomonee Falls
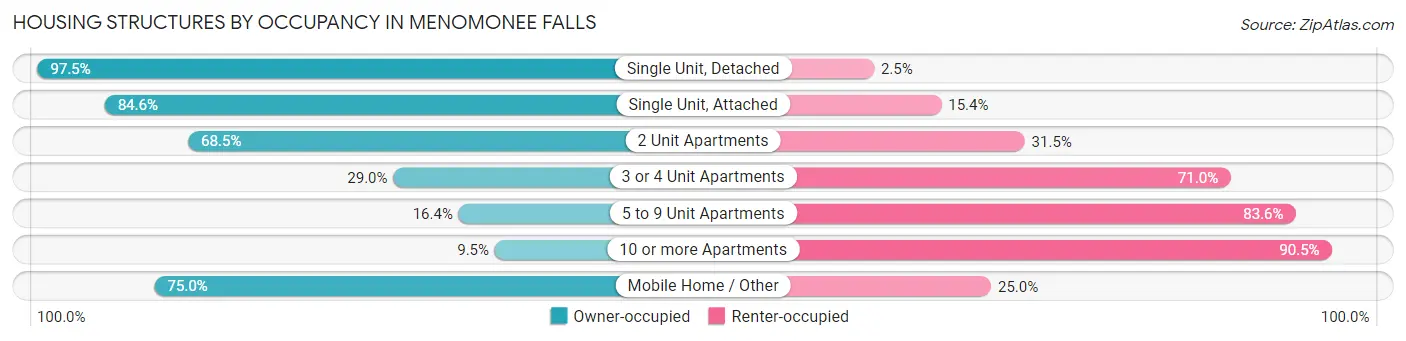
| Structure Type | Owner-occupied | Renter-occupied |
| Single Unit, Detached | 10,684 (97.5%) | 270 (2.5%) |
| Single Unit, Attached | 636 (84.6%) | 116 (15.4%) |
| 2 Unit Apartments | 74 (68.5%) | 34 (31.5%) |
| 3 or 4 Unit Apartments | 116 (29.0%) | 284 (71.0%) |
| 5 to 9 Unit Apartments | 129 (16.4%) | 657 (83.6%) |
| 10 or more Apartments | 275 (9.5%) | 2,633 (90.5%) |
| Mobile Home / Other | 30 (75.0%) | 10 (25.0%) |
| Total | 11,944 (74.9%) | 4,004 (25.1%) |
Housing Structures by Number of Rooms in Menomonee Falls
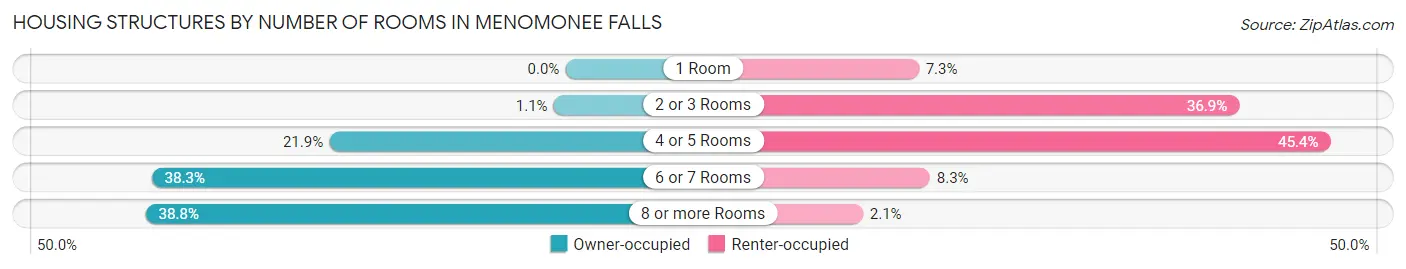
| Number of Rooms | Owner-occupied | Renter-occupied |
| 1 Room | 0 (0.0%) | 292 (7.3%) |
| 2 or 3 Rooms | 130 (1.1%) | 1,478 (36.9%) |
| 4 or 5 Rooms | 2,610 (21.8%) | 1,816 (45.4%) |
| 6 or 7 Rooms | 4,568 (38.3%) | 333 (8.3%) |
| 8 or more Rooms | 4,636 (38.8%) | 85 (2.1%) |
| Total | 11,944 (100.0%) | 4,004 (100.0%) |
Housing Structure by Heating Type in Menomonee Falls
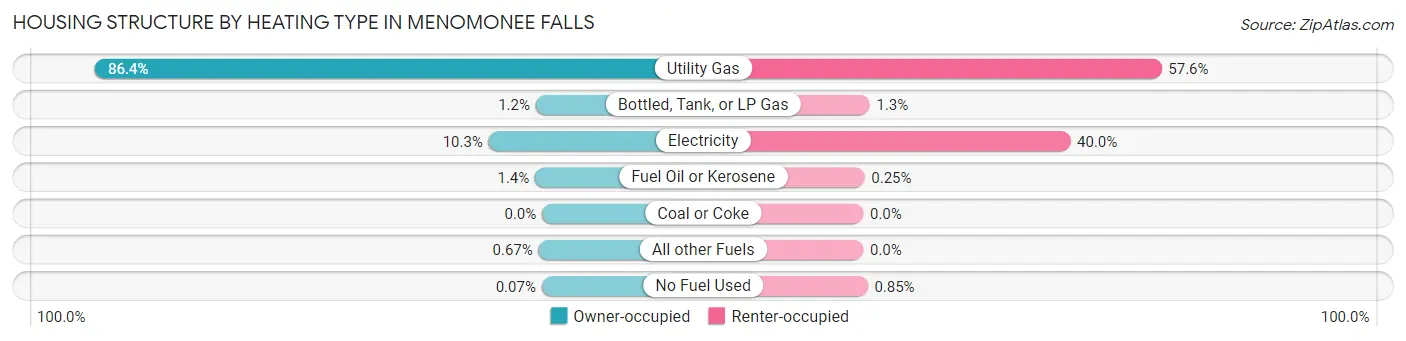
| Heating Type | Owner-occupied | Renter-occupied |
| Utility Gas | 10,316 (86.4%) | 2,308 (57.6%) |
| Bottled, Tank, or LP Gas | 146 (1.2%) | 50 (1.3%) |
| Electricity | 1,233 (10.3%) | 1,602 (40.0%) |
| Fuel Oil or Kerosene | 161 (1.3%) | 10 (0.3%) |
| Coal or Coke | 0 (0.0%) | 0 (0.0%) |
| All other Fuels | 80 (0.7%) | 0 (0.0%) |
| No Fuel Used | 8 (0.1%) | 34 (0.9%) |
| Total | 11,944 (100.0%) | 4,004 (100.0%) |
Household Vehicle Usage in Menomonee Falls
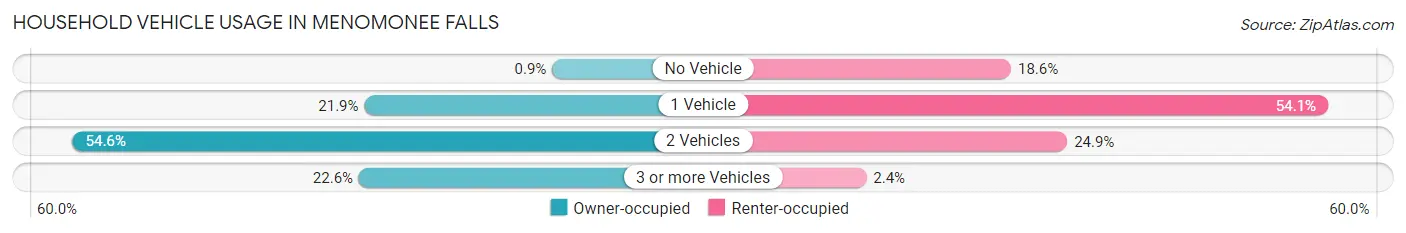
| Vehicles per Household | Owner-occupied | Renter-occupied |
| No Vehicle | 107 (0.9%) | 745 (18.6%) |
| 1 Vehicle | 2,620 (21.9%) | 2,166 (54.1%) |
| 2 Vehicles | 6,524 (54.6%) | 997 (24.9%) |
| 3 or more Vehicles | 2,693 (22.6%) | 96 (2.4%) |
| Total | 11,944 (100.0%) | 4,004 (100.0%) |
Real Estate & Mortgages in Menomonee Falls
Real Estate and Mortgage Overview in Menomonee Falls
| Characteristic | Without Mortgage | With Mortgage |
| Housing Units | 3,946 | 7,998 |
| Median Property Value | $294,400 | $324,500 |
| Median Household Income | $80,046 | $3,110 |
| Monthly Housing Costs | $739 | $1,320 |
| Real Estate Taxes | $4,095 | $23 |
Property Value by Mortgage Status in Menomonee Falls
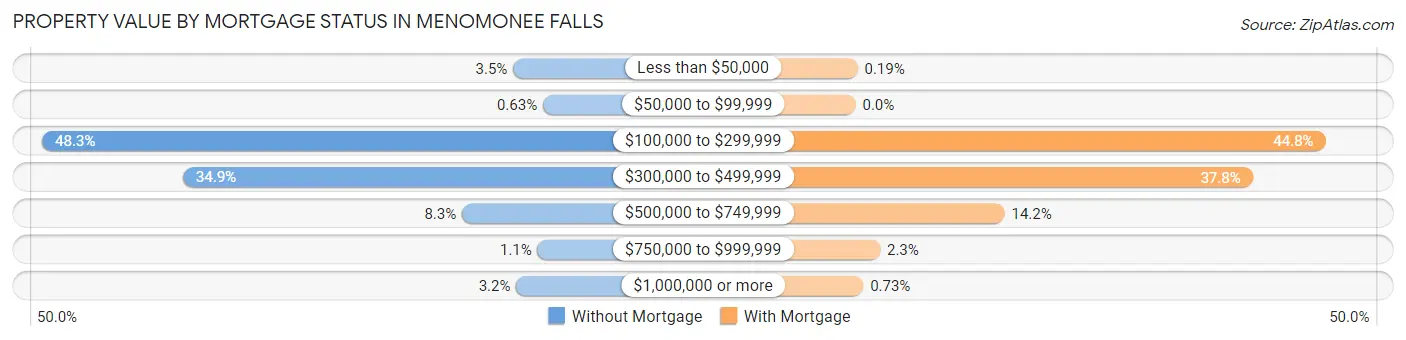
| Property Value | Without Mortgage | With Mortgage |
| Less than $50,000 | 137 (3.5%) | 15 (0.2%) |
| $50,000 to $99,999 | 25 (0.6%) | 0 (0.0%) |
| $100,000 to $299,999 | 1,907 (48.3%) | 3,579 (44.8%) |
| $300,000 to $499,999 | 1,378 (34.9%) | 3,025 (37.8%) |
| $500,000 to $749,999 | 329 (8.3%) | 1,135 (14.2%) |
| $750,000 to $999,999 | 45 (1.1%) | 186 (2.3%) |
| $1,000,000 or more | 125 (3.2%) | 58 (0.7%) |
| Total | 3,946 (100.0%) | 7,998 (100.0%) |
Household Income by Mortgage Status in Menomonee Falls
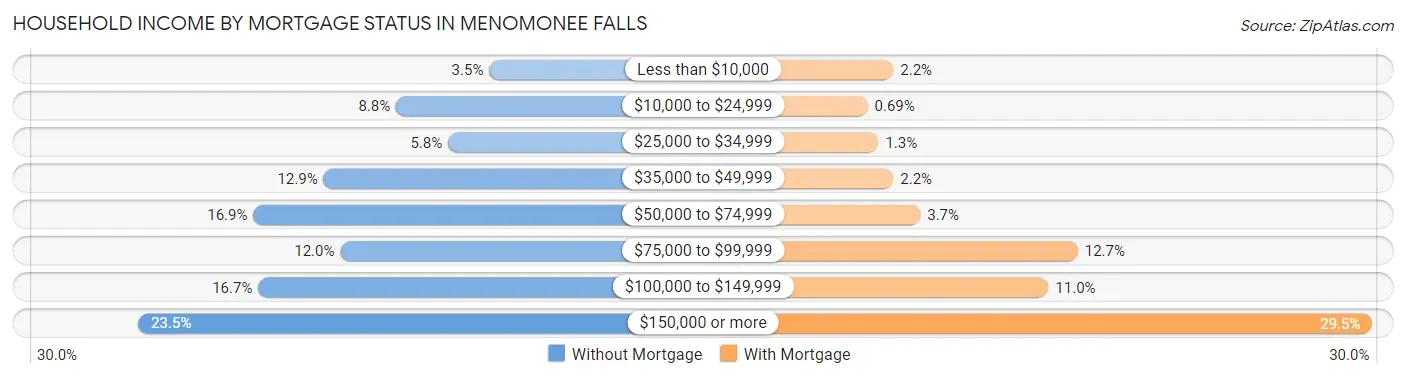
| Household Income | Without Mortgage | With Mortgage |
| Less than $10,000 | 136 (3.5%) | 173 (2.2%) |
| $10,000 to $24,999 | 346 (8.8%) | 55 (0.7%) |
| $25,000 to $34,999 | 229 (5.8%) | 105 (1.3%) |
| $35,000 to $49,999 | 510 (12.9%) | 173 (2.2%) |
| $50,000 to $74,999 | 668 (16.9%) | 296 (3.7%) |
| $75,000 to $99,999 | 472 (12.0%) | 1,016 (12.7%) |
| $100,000 to $149,999 | 657 (16.7%) | 881 (11.0%) |
| $150,000 or more | 928 (23.5%) | 2,362 (29.5%) |
| Total | 3,946 (100.0%) | 7,998 (100.0%) |
Property Value to Household Income Ratio in Menomonee Falls
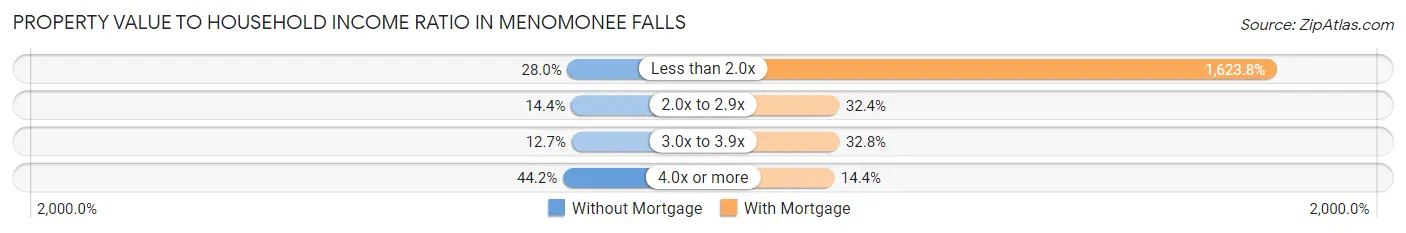
| Value-to-Income Ratio | Without Mortgage | With Mortgage |
| Less than 2.0x | 1,103 (28.0%) | 129,868 (1,623.8%) |
| 2.0x to 2.9x | 569 (14.4%) | 2,588 (32.4%) |
| 3.0x to 3.9x | 501 (12.7%) | 2,619 (32.8%) |
| 4.0x or more | 1,745 (44.2%) | 1,150 (14.4%) |
| Total | 3,946 (100.0%) | 7,998 (100.0%) |
Real Estate Taxes by Mortgage Status in Menomonee Falls
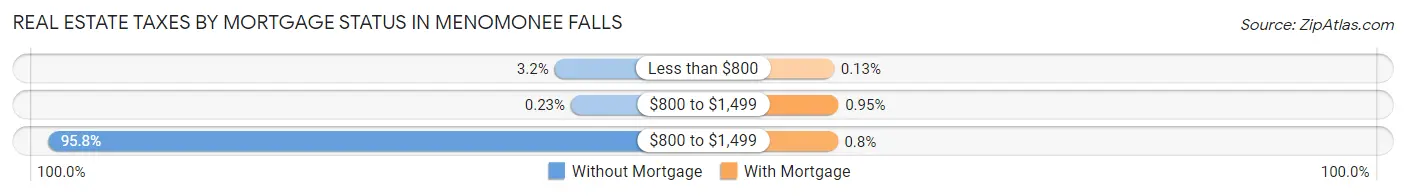
| Property Taxes | Without Mortgage | With Mortgage |
| Less than $800 | 127 (3.2%) | 10 (0.1%) |
| $800 to $1,499 | 9 (0.2%) | 76 (0.9%) |
| $800 to $1,499 | 3,779 (95.8%) | 64 (0.8%) |
| Total | 3,946 (100.0%) | 7,998 (100.0%) |
Health & Disability in Menomonee Falls
Health Insurance Coverage by Age in Menomonee Falls
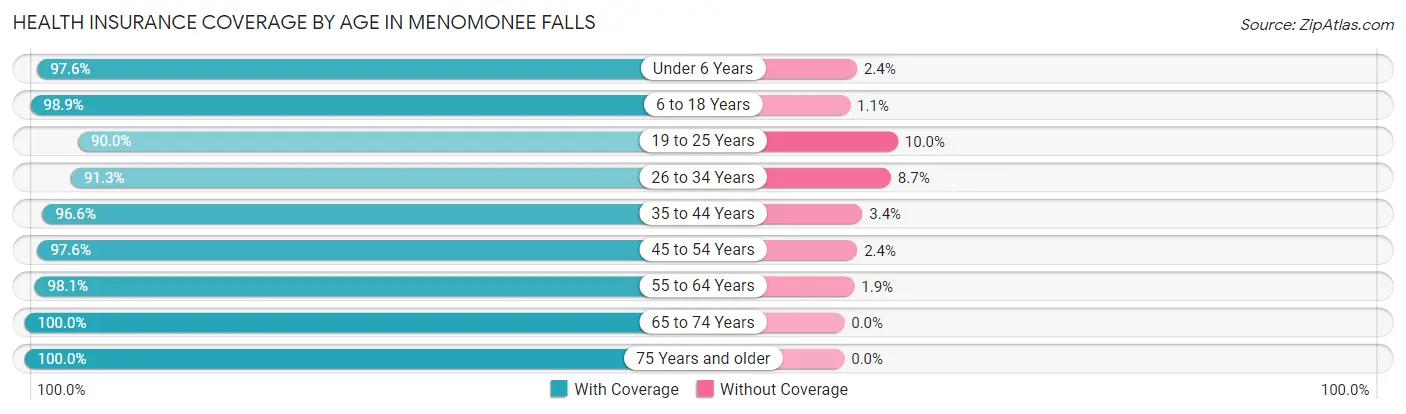
| Age Bracket | With Coverage | Without Coverage |
| Under 6 Years | 2,477 (97.6%) | 60 (2.4%) |
| 6 to 18 Years | 6,598 (98.9%) | 73 (1.1%) |
| 19 to 25 Years | 1,884 (90.0%) | 209 (10.0%) |
| 26 to 34 Years | 3,930 (91.3%) | 374 (8.7%) |
| 35 to 44 Years | 5,007 (96.6%) | 174 (3.4%) |
| 45 to 54 Years | 4,737 (97.6%) | 117 (2.4%) |
| 55 to 64 Years | 5,223 (98.1%) | 100 (1.9%) |
| 65 to 74 Years | 3,927 (100.0%) | 0 (0.0%) |
| 75 Years and older | 3,554 (100.0%) | 0 (0.0%) |
| Total | 37,337 (97.1%) | 1,107 (2.9%) |
Health Insurance Coverage by Citizenship Status in Menomonee Falls
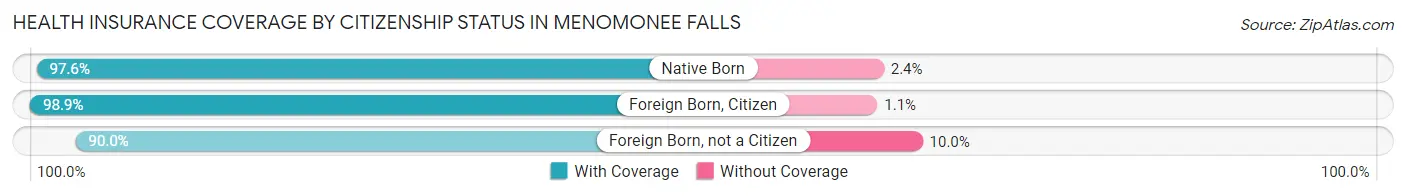
| Citizenship Status | With Coverage | Without Coverage |
| Native Born | 2,477 (97.6%) | 60 (2.4%) |
| Foreign Born, Citizen | 6,598 (98.9%) | 73 (1.1%) |
| Foreign Born, not a Citizen | 1,884 (90.0%) | 209 (10.0%) |
Health Insurance Coverage by Household Income in Menomonee Falls
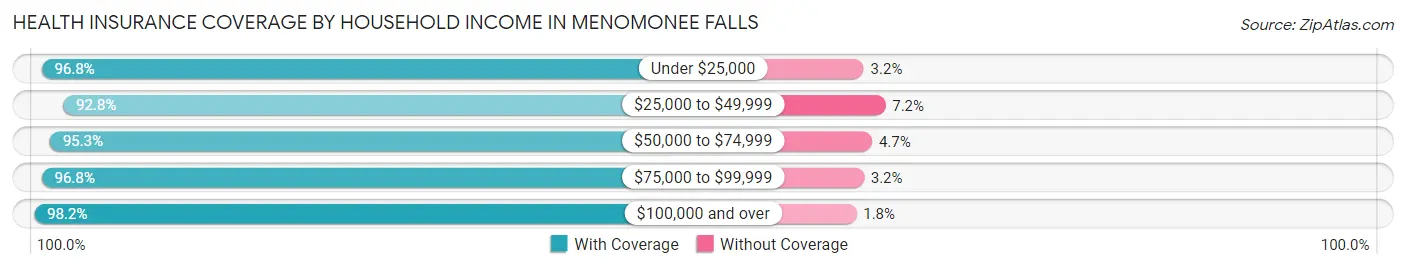
| Household Income | With Coverage | Without Coverage |
| Under $25,000 | 1,867 (96.8%) | 61 (3.2%) |
| $25,000 to $49,999 | 3,578 (92.8%) | 278 (7.2%) |
| $50,000 to $74,999 | 4,222 (95.3%) | 209 (4.7%) |
| $75,000 to $99,999 | 3,842 (96.8%) | 126 (3.2%) |
| $100,000 and over | 23,813 (98.2%) | 431 (1.8%) |
Public vs Private Health Insurance Coverage by Age in Menomonee Falls
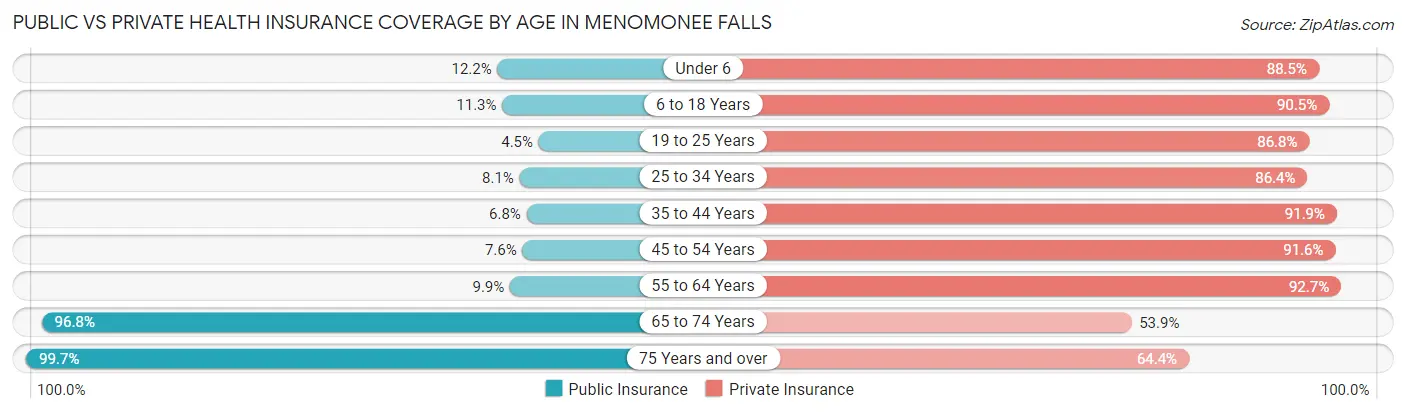
| Age Bracket | Public Insurance | Private Insurance |
| Under 6 | 310 (12.2%) | 2,246 (88.5%) |
| 6 to 18 Years | 755 (11.3%) | 6,034 (90.4%) |
| 19 to 25 Years | 95 (4.5%) | 1,816 (86.8%) |
| 25 to 34 Years | 349 (8.1%) | 3,719 (86.4%) |
| 35 to 44 Years | 353 (6.8%) | 4,761 (91.9%) |
| 45 to 54 Years | 368 (7.6%) | 4,446 (91.6%) |
| 55 to 64 Years | 526 (9.9%) | 4,932 (92.6%) |
| 65 to 74 Years | 3,803 (96.8%) | 2,117 (53.9%) |
| 75 Years and over | 3,544 (99.7%) | 2,290 (64.4%) |
| Total | 10,103 (26.3%) | 32,361 (84.2%) |
Disability Status by Sex by Age in Menomonee Falls
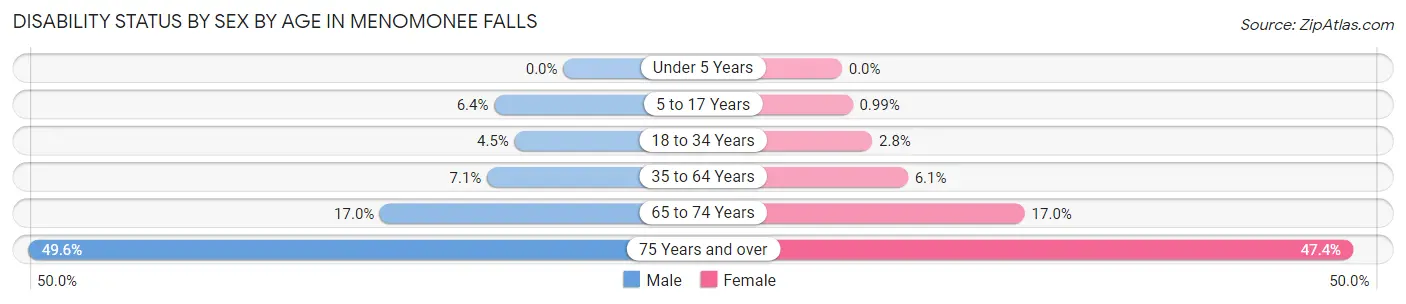
| Age Bracket | Male | Female |
| Under 5 Years | 0 (0.0%) | 0 (0.0%) |
| 5 to 17 Years | 211 (6.4%) | 35 (1.0%) |
| 18 to 34 Years | 150 (4.5%) | 97 (2.8%) |
| 35 to 64 Years | 536 (7.1%) | 476 (6.1%) |
| 65 to 74 Years | 326 (17.0%) | 341 (17.0%) |
| 75 Years and over | 674 (49.6%) | 1,041 (47.4%) |
Disability Class by Sex by Age in Menomonee Falls
Disability Class: Hearing Difficulty
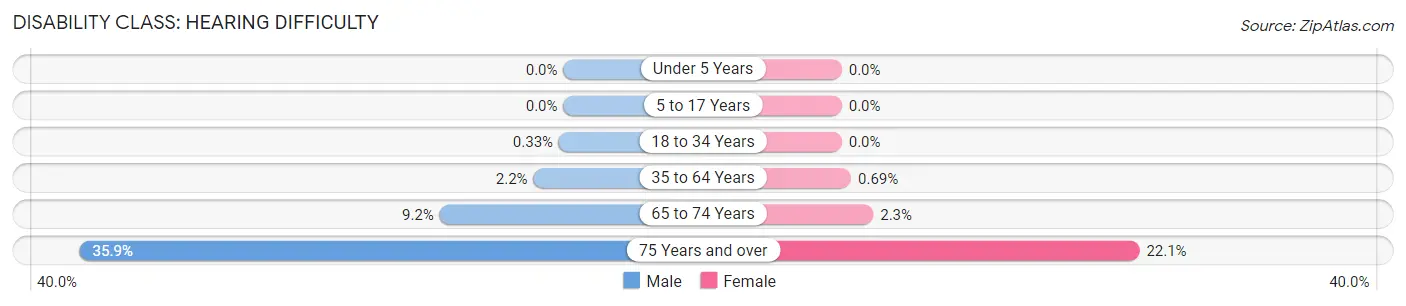
| Age Bracket | Male | Female |
| Under 5 Years | 0 (0.0%) | 0 (0.0%) |
| 5 to 17 Years | 0 (0.0%) | 0 (0.0%) |
| 18 to 34 Years | 11 (0.3%) | 0 (0.0%) |
| 35 to 64 Years | 168 (2.2%) | 54 (0.7%) |
| 65 to 74 Years | 176 (9.2%) | 47 (2.3%) |
| 75 Years and over | 488 (35.9%) | 485 (22.1%) |
Disability Class: Vision Difficulty
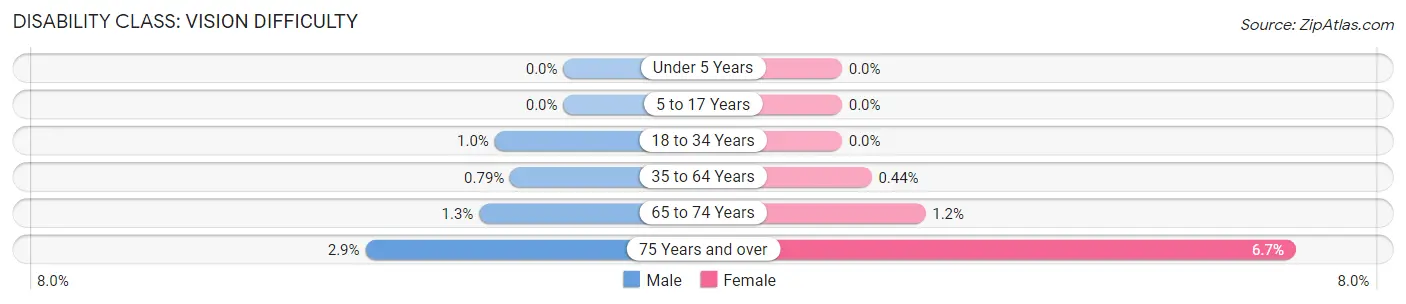
| Age Bracket | Male | Female |
| Under 5 Years | 0 (0.0%) | 0 (0.0%) |
| 5 to 17 Years | 0 (0.0%) | 0 (0.0%) |
| 18 to 34 Years | 34 (1.0%) | 0 (0.0%) |
| 35 to 64 Years | 60 (0.8%) | 34 (0.4%) |
| 65 to 74 Years | 24 (1.3%) | 25 (1.2%) |
| 75 Years and over | 40 (2.9%) | 148 (6.7%) |
Disability Class: Cognitive Difficulty
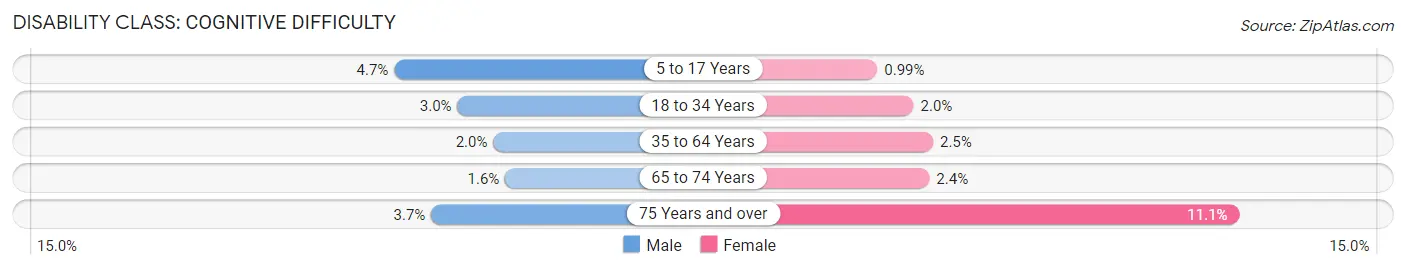
| Age Bracket | Male | Female |
| 5 to 17 Years | 155 (4.7%) | 35 (1.0%) |
| 18 to 34 Years | 98 (2.9%) | 69 (2.0%) |
| 35 to 64 Years | 148 (1.9%) | 198 (2.5%) |
| 65 to 74 Years | 31 (1.6%) | 49 (2.4%) |
| 75 Years and over | 50 (3.7%) | 243 (11.1%) |
Disability Class: Ambulatory Difficulty
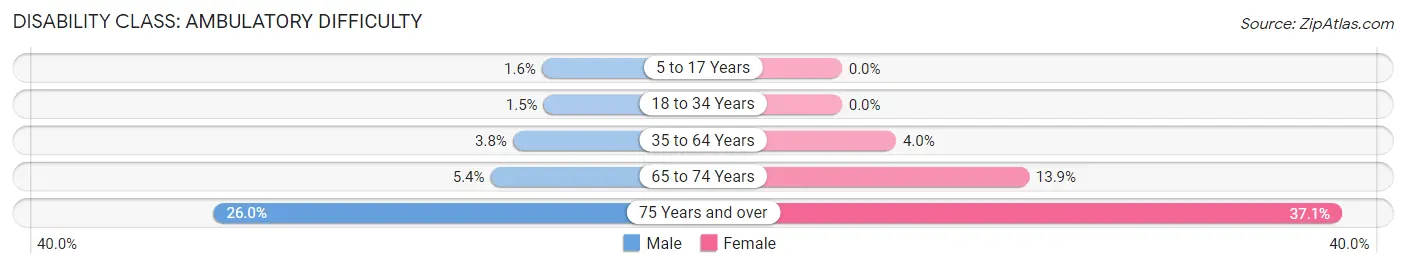
| Age Bracket | Male | Female |
| 5 to 17 Years | 53 (1.6%) | 0 (0.0%) |
| 18 to 34 Years | 49 (1.5%) | 0 (0.0%) |
| 35 to 64 Years | 285 (3.8%) | 313 (4.0%) |
| 65 to 74 Years | 104 (5.4%) | 279 (13.9%) |
| 75 Years and over | 353 (26.0%) | 815 (37.1%) |
Disability Class: Self-Care Difficulty
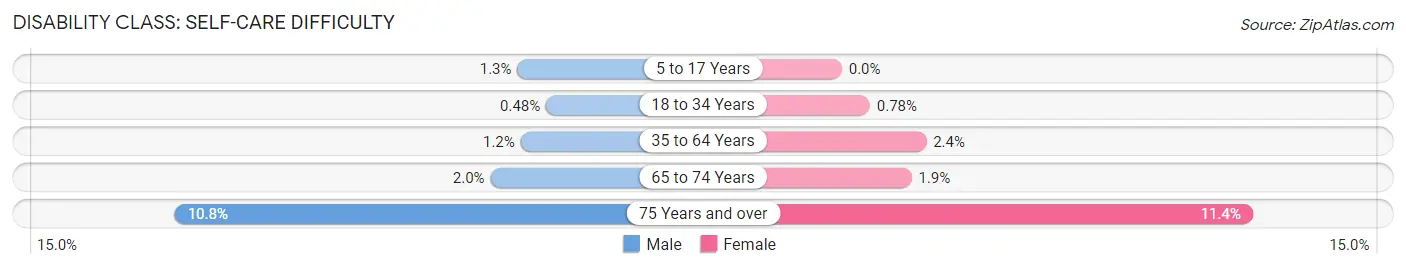
| Age Bracket | Male | Female |
| 5 to 17 Years | 42 (1.3%) | 0 (0.0%) |
| 18 to 34 Years | 16 (0.5%) | 27 (0.8%) |
| 35 to 64 Years | 90 (1.2%) | 183 (2.4%) |
| 65 to 74 Years | 39 (2.0%) | 39 (1.9%) |
| 75 Years and over | 147 (10.8%) | 251 (11.4%) |
Technology Access in Menomonee Falls
Computing Device Access in Menomonee Falls
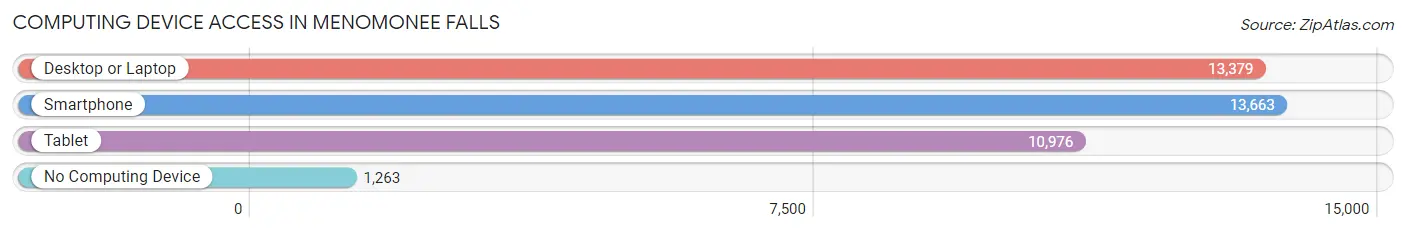
| Device Type | # Households | % Households |
| Desktop or Laptop | 13,379 | 83.9% |
| Smartphone | 13,663 | 85.7% |
| Tablet | 10,976 | 68.8% |
| No Computing Device | 1,263 | 7.9% |
| Total | 15,948 | 100.0% |
Internet Access in Menomonee Falls
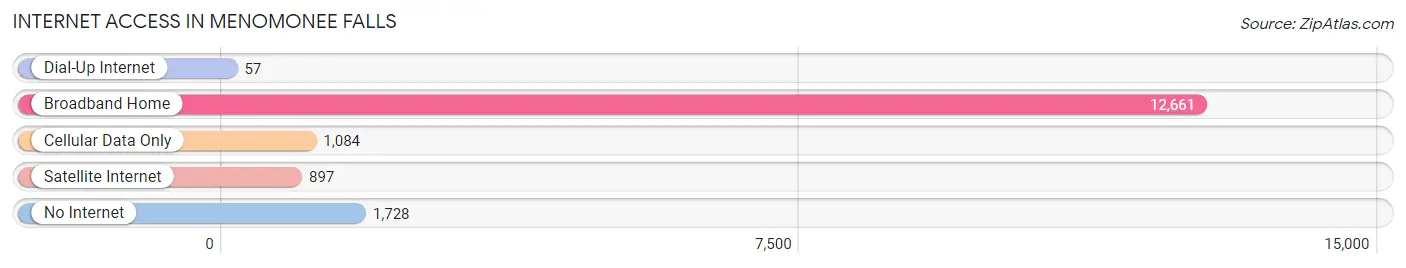
| Internet Type | # Households | % Households |
| Dial-Up Internet | 57 | 0.4% |
| Broadband Home | 12,661 | 79.4% |
| Cellular Data Only | 1,084 | 6.8% |
| Satellite Internet | 897 | 5.6% |
| No Internet | 1,728 | 10.8% |
| Total | 15,948 | 100.0% |
Menomonee Falls Summary
Menomonee Falls, Wisconsin is a village located in Waukesha County, Wisconsin, United States. The population was 33,527 at the 2010 census, making it the largest village in Wisconsin. It is part of the Milwaukee metropolitan area.
History
The area that is now Menomonee Falls was originally inhabited by the Potawatomi Native American tribe. The first white settlers arrived in the area in the early 1800s. The village was officially founded in 1837 and was named after the Menomonee River, which runs through the village.
In the late 1800s, the village began to grow and develop. The first industry in the area was a sawmill, which was built in 1845. This was followed by a grist mill, a woolen mill, and a paper mill. These industries helped to spur the growth of the village and by the early 1900s, Menomonee Falls had become a thriving industrial center.
In the 1950s, the village began to transition from an industrial center to a more suburban community. This was due to the growth of the Milwaukee metropolitan area and the development of the Interstate Highway System. The village has continued to grow and develop since then and is now a thriving suburban community.
Geography
Menomonee Falls is located in Waukesha County, Wisconsin. It is situated on the Menomonee River, which runs through the village. The village is bordered by the cities of Milwaukee and Wauwatosa to the north, Brookfield to the east, and Germantown to the south.
The village has a total area of 11.2 square miles, of which 10.9 square miles is land and 0.3 square miles is water. The village is located at an elevation of 830 feet above sea level.
Economy
Menomonee Falls is a thriving suburban community with a strong economy. The village is home to a variety of businesses, including manufacturing, retail, and service industries. The largest employers in the village are Kohl’s Department Stores, Quad/Graphics, and Briggs & Stratton.
The village also has a strong tourism industry. The village is home to a variety of attractions, including the Menomonee Falls Historical Society, the Menomonee Falls Public Library, and the Menomonee Falls Village Hall.
Demographics
As of the 2010 census, the population of Menomonee Falls was 33,527. The racial makeup of the village was 90.2% White, 2.7% African American, 0.3% Native American, 3.7% Asian, 0.1% Pacific Islander, 1.3% from other races, and 2.1% from two or more races. Hispanic or Latino of any race were 4.2% of the population.
The median household income in the village was $67,945 and the median family income was $77,945. The per capita income for the village was $30,945. About 4.2% of families and 5.7% of the population were below the poverty line, including 6.7% of those under age 18 and 4.2% of those age 65 or over.
Common Questions
What is Per Capita Income in Menomonee Falls?
Per Capita income in Menomonee Falls is $55,576.
What is the Median Family Income in Menomonee Falls?
Median Family Income in Menomonee Falls is $127,522.
What is the Median Household income in Menomonee Falls?
Median Household Income in Menomonee Falls is $96,986.
What is Income or Wage Gap in Menomonee Falls?
Income or Wage Gap in Menomonee Falls is 37.0%.
Women in Menomonee Falls earn 63.0 cents for every dollar earned by a man.
What is Family Income Deficit in Menomonee Falls?
Family Income Deficit in Menomonee Falls is $9,769.
Families that are below poverty line in Menomonee Falls earn $9,769 less on average than the poverty threshold level.
What is Inequality or Gini Index in Menomonee Falls?
Inequality or Gini Index in Menomonee Falls is 0.48.
What is the Total Population of Menomonee Falls?
Total Population of Menomonee Falls is 38,610.
What is the Total Male Population of Menomonee Falls?
Total Male Population of Menomonee Falls is 18,379.
What is the Total Female Population of Menomonee Falls?
Total Female Population of Menomonee Falls is 20,231.
What is the Ratio of Males per 100 Females in Menomonee Falls?
There are 90.85 Males per 100 Females in Menomonee Falls.
What is the Ratio of Females per 100 Males in Menomonee Falls?
There are 110.08 Females per 100 Males in Menomonee Falls.
What is the Median Population Age in Menomonee Falls?
Median Population Age in Menomonee Falls is 41.9 Years.
What is the Average Family Size in Menomonee Falls
Average Family Size in Menomonee Falls is 3.0 People.
What is the Average Household Size in Menomonee Falls
Average Household Size in Menomonee Falls is 2.4 People.
How Large is the Labor Force in Menomonee Falls?
There are 20,689 People in the Labor Forcein in Menomonee Falls.
What is the Percentage of People in the Labor Force in Menomonee Falls?
66.8% of People are in the Labor Force in Menomonee Falls.
What is the Unemployment Rate in Menomonee Falls?
Unemployment Rate in Menomonee Falls is 2.1%.