Area Code 715 Map & Demographics
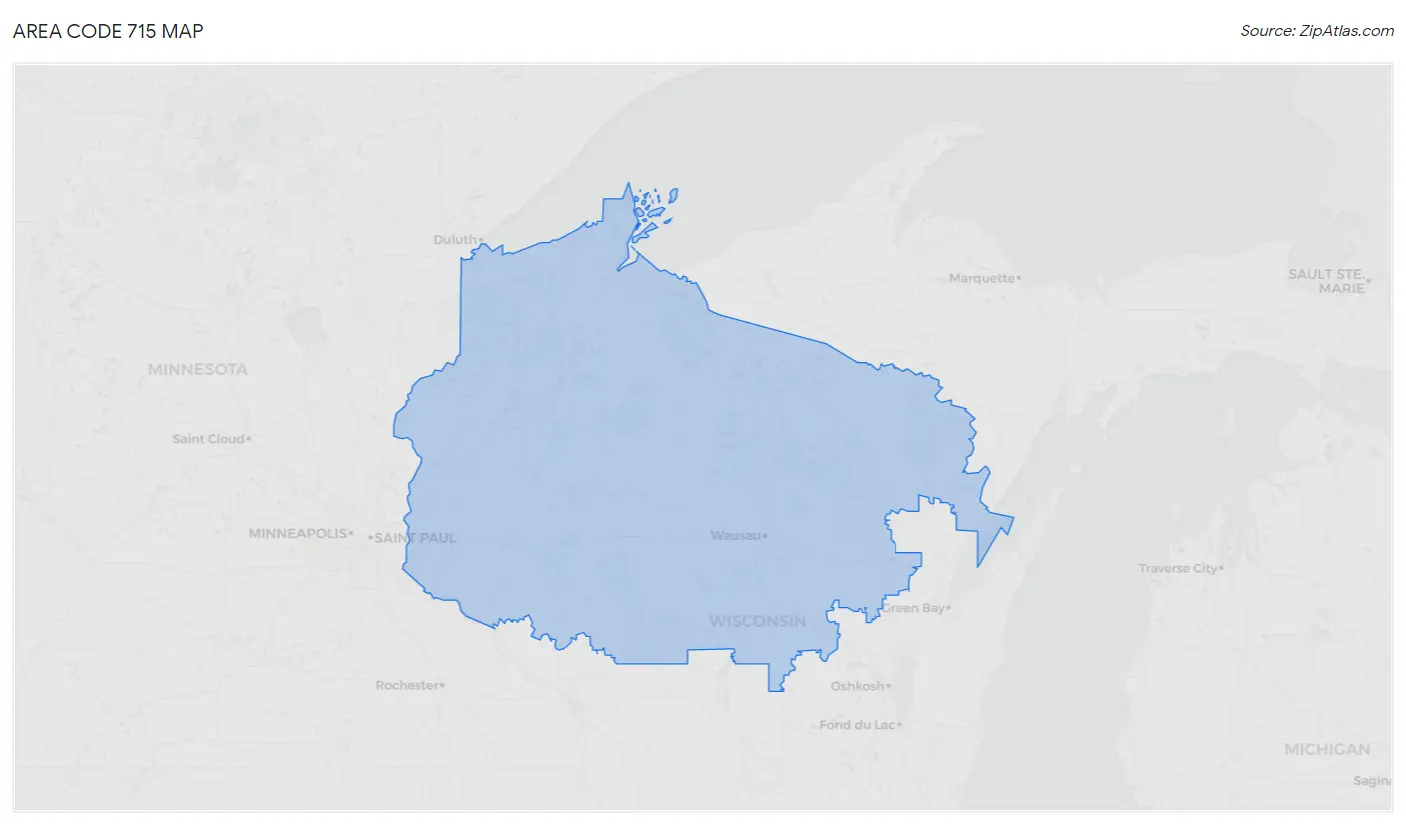
Area Code 715 Map
Area Code 715 Overview
$35,546
PER CAPITA INCOME
$81,328
AVG FAMILY INCOME
$67,003
AVG HOUSEHOLD INCOME
30.1%
WAGE / INCOME GAP [ % ]
69.9¢/ $1
WAGE / INCOME GAP [ $ ]
$10,198
FAMILY INCOME DEFICIT
115.19
INEQUALITY / GINI INDEX
1,299,296
TOTAL POPULATION
658,307
MALE POPULATION
640,989
FEMALE POPULATION
102.70
MALES / 100 FEMALES
97.37
FEMALES / 100 MALES
46.9
MEDIAN AGE
2.9
AVG FAMILY SIZE
2.4
AVG HOUSEHOLD SIZE
634,436
LABOR FORCE [ PEOPLE ]
59.8%
PERCENT IN LABOR FORCE
3.8%
UNEMPLOYMENT RATE
Income in Area Code 715
Income Overview in Area Code 715
Per Capita Income in Area Code 715 is $35,546, while median incomes of families and households are $81,328 and $67,003 respectively.
| Characteristic | Number | Measure |
| Per Capita Income | 1,299,296 | $35,546 |
| Median Family Income | 336,646 | $81,328 |
| Mean Family Income | 336,646 | $27,459,376 |
| Median Household Income | 538,053 | $67,003 |
| Mean Household Income | 538,053 | $23,555,278 |
| Income Deficit | 336,646 | $10,198 |
| Wage / Income Gap (%) | 1,299,296 | 30.14% |
| Wage / Income Gap ($) | 1,299,296 | 69.86¢ per $1 |
| Gini / Inequality Index | 1,299,296 | 115.19 |
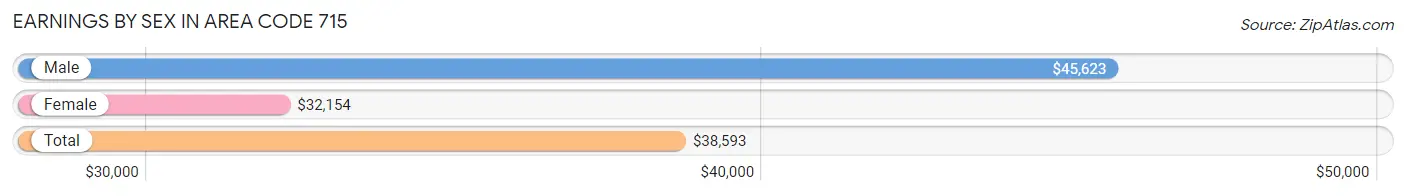
Earnings by Sex in Area Code 715
Average Earnings in Area Code 715 are $38,593, $45,623 for men and $32,154 for women, a difference of 29.5%.
| Sex | Number | Average Earnings |
| Male | 380,372 (52.9%) | $45,623 |
| Female | 338,236 (47.1%) | $32,154 |
| Total | 718,608 (100.0%) | $38,593 |
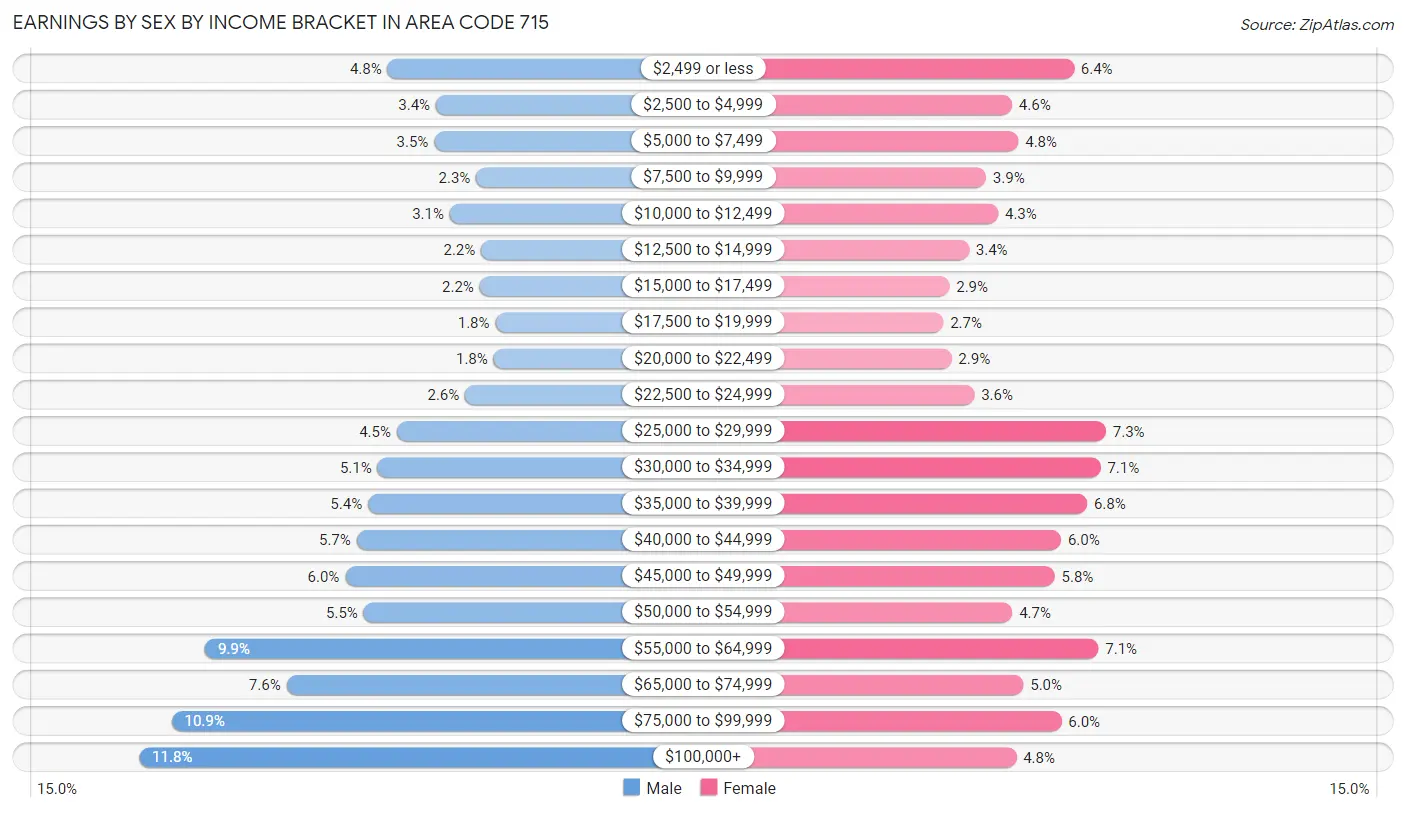
Earnings by Sex by Income Bracket in Area Code 715
The most common earnings brackets in Area Code 715 are $100,000+ for men (44,817 | 11.8%) and $25,000 to $29,999 for women (24,610 | 7.3%).
| Income | Male | Female |
| $2,499 or less | 18,276 (4.8%) | 21,565 (6.4%) |
| $2,500 to $4,999 | 13,077 (3.4%) | 15,684 (4.6%) |
| $5,000 to $7,499 | 13,276 (3.5%) | 16,294 (4.8%) |
| $7,500 to $9,999 | 8,768 (2.3%) | 13,214 (3.9%) |
| $10,000 to $12,499 | 11,592 (3.0%) | 14,372 (4.3%) |
| $12,500 to $14,999 | 8,248 (2.2%) | 11,590 (3.4%) |
| $15,000 to $17,499 | 8,395 (2.2%) | 9,747 (2.9%) |
| $17,500 to $19,999 | 6,736 (1.8%) | 9,156 (2.7%) |
| $20,000 to $22,499 | 6,921 (1.8%) | 9,941 (2.9%) |
| $22,500 to $24,999 | 9,982 (2.6%) | 12,109 (3.6%) |
| $25,000 to $29,999 | 17,257 (4.5%) | 24,610 (7.3%) |
| $30,000 to $34,999 | 19,337 (5.1%) | 24,109 (7.1%) |
| $35,000 to $39,999 | 20,345 (5.3%) | 22,816 (6.8%) |
| $40,000 to $44,999 | 21,581 (5.7%) | 20,376 (6.0%) |
| $45,000 to $49,999 | 22,774 (6.0%) | 19,740 (5.8%) |
| $50,000 to $54,999 | 20,798 (5.5%) | 15,735 (4.6%) |
| $55,000 to $64,999 | 37,780 (9.9%) | 23,900 (7.1%) |
| $65,000 to $74,999 | 29,064 (7.6%) | 16,778 (5.0%) |
| $75,000 to $99,999 | 41,348 (10.9%) | 20,390 (6.0%) |
| $100,000+ | 44,817 (11.8%) | 16,110 (4.8%) |
| Total | 380,372 (100.0%) | 338,236 (100.0%) |
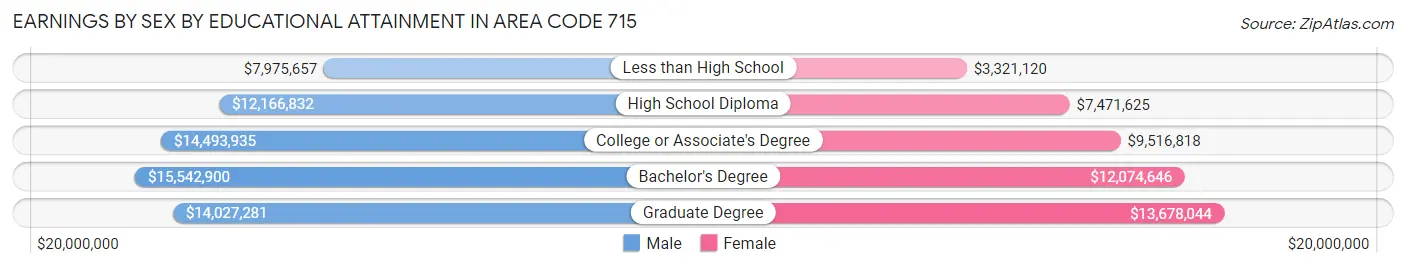
Earnings by Sex by Educational Attainment in Area Code 715
Average earnings in Area Code 715 are $14,132,197 for men and $9,981,003 for women, a difference of 29.4%. Men with an educational attainment of bachelor's degree enjoy the highest average annual earnings of $15,542,900, while those with less than high school education earn the least with $7,975,657. Women with an educational attainment of graduate degree earn the most with the average annual earnings of $13,678,044, while those with less than high school education have the smallest earnings of $3,321,120.
| Educational Attainment | Male Income | Female Income |
| Less than High School | $7,975,657 | $3,321,120 |
| High School Diploma | $12,166,832 | $7,471,625 |
| College or Associate's Degree | $14,493,935 | $9,516,818 |
| Bachelor's Degree | $15,542,900 | $12,074,646 |
| Graduate Degree | $14,027,281 | $13,678,044 |
| Total | $14,132,197 | $9,981,003 |
Family Income in Area Code 715
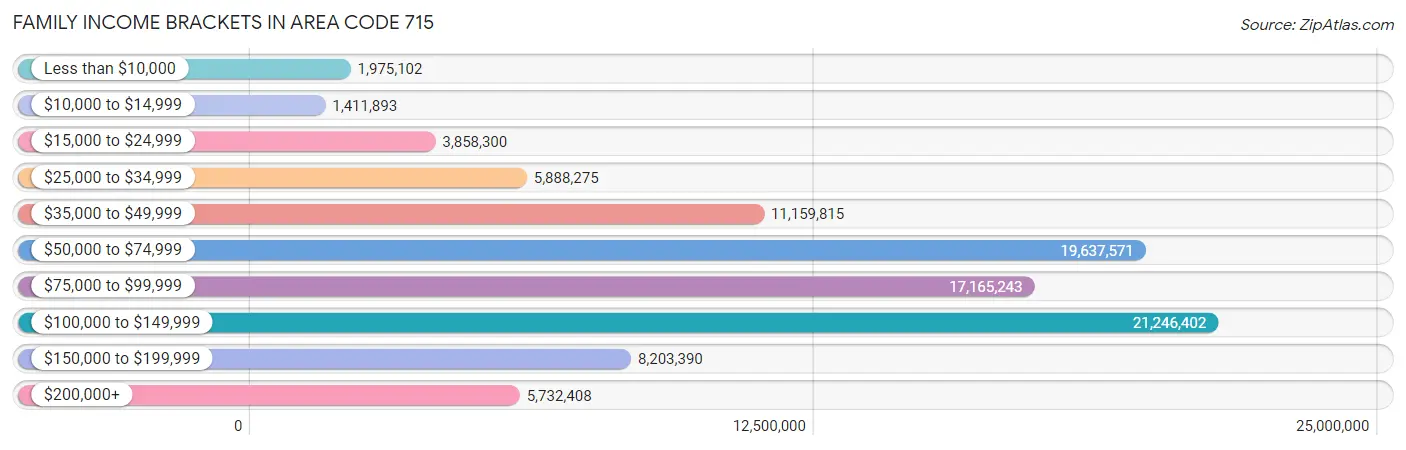
Family Income Brackets in Area Code 715
According to the Area Code 715 family income data, there are 21,246,402 families falling into the $100,000 to $149,999 income range, which is the most common income bracket and makes up 6,311.2% of all families. Conversely, the $10,000 to $14,999 income bracket is the least frequent group with only 1,411,893 families (419.4%) belonging to this category.
| Income Bracket | # Families | % Families |
| Less than $10,000 | 1,975,102 | 586.7% |
| $10,000 to $14,999 | 1,411,893 | 419.4% |
| $15,000 to $24,999 | 3,858,300 | 1,146.1% |
| $25,000 to $34,999 | 5,888,275 | 1,749.1% |
| $35,000 to $49,999 | 11,159,815 | 3,315.0% |
| $50,000 to $74,999 | 19,637,571 | 5,833.3% |
| $75,000 to $99,999 | 17,165,243 | 5,098.9% |
| $100,000 to $149,999 | 21,246,402 | 6,311.2% |
| $150,000 to $199,999 | 8,203,390 | 2,436.8% |
| $200,000+ | 5,732,408 | 1,702.8% |
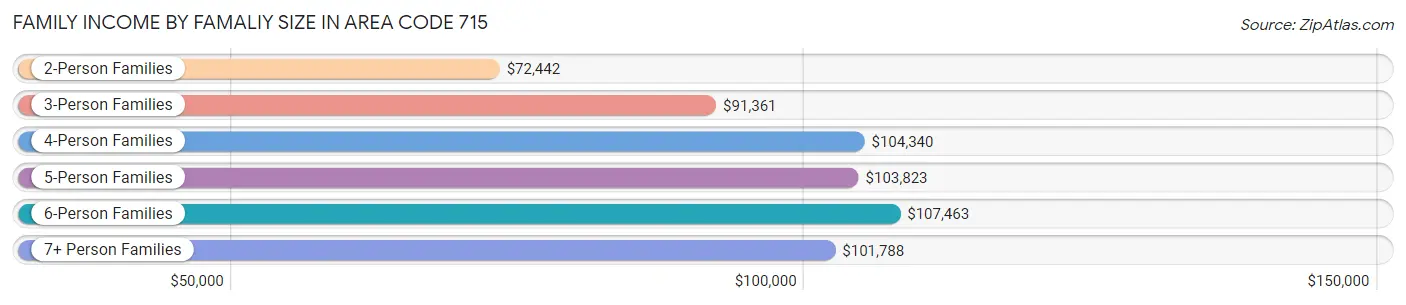
Family Income by Famaliy Size in Area Code 715
6-person families (8,427 | 2.5%) account for the highest median family income in Area Code 715 with $107,463 per family, while 2-person families (190,753 | 56.7%) have the highest median income of $36,221 per family member.
| Income Bracket | # Families | Median Income |
| 2-Person Families | 190,753 (56.7%) | $72,442 |
| 3-Person Families | 61,335 (18.2%) | $91,361 |
| 4-Person Families | 49,629 (14.7%) | $104,340 |
| 5-Person Families | 21,516 (6.4%) | $103,823 |
| 6-Person Families | 8,427 (2.5%) | $107,463 |
| 7+ Person Families | 4,986 (1.5%) | $101,788 |
| Total | 336,646 (100.0%) | $81,328 |
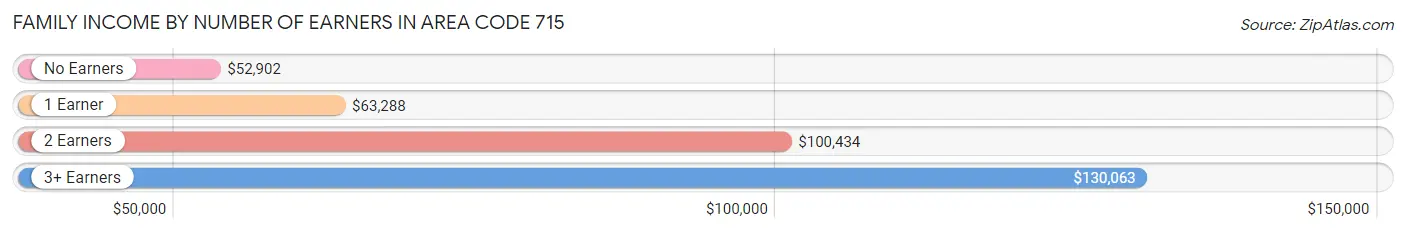
Family Income by Number of Earners in Area Code 715
The median family income in Area Code 715 is $81,328, with families comprising 3+ earners (36,014) having the highest median family income of $130,063, while families with no earners (62,106) have the lowest median family income of $52,902, accounting for 10.7% and 18.4% of families, respectively.
| Number of Earners | # Families | Median Income |
| No Earners | 62,106 (18.4%) | $52,902 |
| 1 Earner | 92,452 (27.5%) | $63,288 |
| 2 Earners | 146,074 (43.4%) | $100,434 |
| 3+ Earners | 36,014 (10.7%) | $130,063 |
| Total | 336,646 (100.0%) | $81,328 |
Household Income in Area Code 715
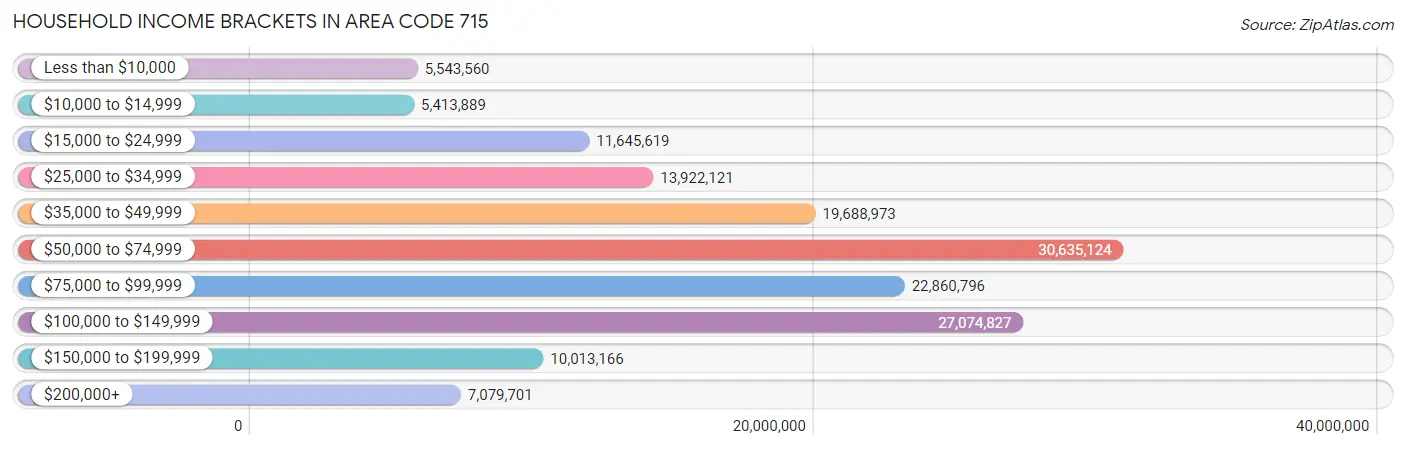
Household Income Brackets in Area Code 715
With 30,635,124 households falling in the category, the $50,000 to $74,999 income range is the most frequent in Area Code 715, accounting for 5,693.7% of all households. In contrast, only 5,413,889 households (1,006.2%) fall into the $10,000 to $14,999 income bracket, making it the least populous group.
| Income Bracket | # Households | % Households |
| Less than $10,000 | 5,543,560 | 1,030.3% |
| $10,000 to $14,999 | 5,413,889 | 1,006.2% |
| $15,000 to $24,999 | 11,645,619 | 2,164.4% |
| $25,000 to $34,999 | 13,922,121 | 2,587.5% |
| $35,000 to $49,999 | 19,688,973 | 3,659.3% |
| $50,000 to $74,999 | 30,635,124 | 5,693.7% |
| $75,000 to $99,999 | 22,860,796 | 4,248.8% |
| $100,000 to $149,999 | 27,074,827 | 5,032.0% |
| $150,000 to $199,999 | 10,013,166 | 1,861.0% |
| $200,000+ | 7,079,701 | 1,315.8% |
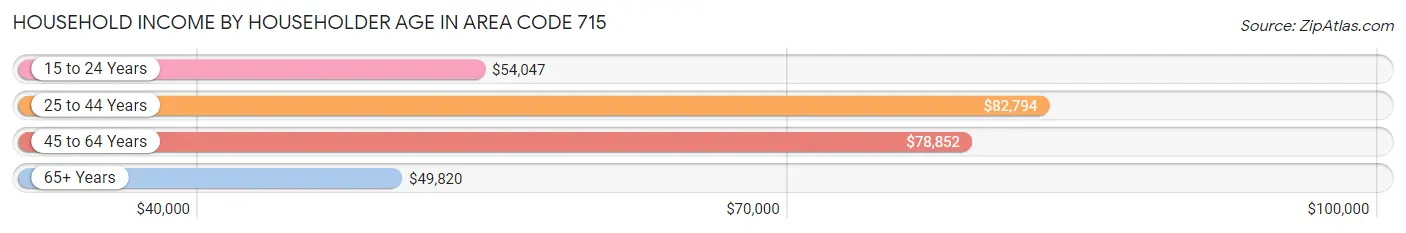
Household Income by Householder Age in Area Code 715
The median household income in Area Code 715 is $67,003, with the highest median household income of $82,794 found in the 25 to 44 years age bracket for the primary householder. A total of 148,310 households (27.6%) fall into this category. Meanwhile, the 65+ years age bracket for the primary householder has the lowest median household income of $49,820, with 164,210 households (30.5%) in this group.
| Income Bracket | # Households | Median Income |
| 15 to 24 Years | 23,818 (4.4%) | $54,047 |
| 25 to 44 Years | 148,310 (27.6%) | $82,794 |
| 45 to 64 Years | 201,715 (37.5%) | $78,852 |
| 65+ Years | 164,210 (30.5%) | $49,820 |
| Total | 538,053 (100.0%) | $67,003 |
Poverty in Area Code 715
Income Below Poverty by Sex and Age in Area Code 715
With 9.4% poverty level for males and 11.9% for females among the residents of Area Code 715, 18 to 24 year old males and 18 to 24 year old females are the most vulnerable to poverty, with 9,489 males (17.2%) and 13,268 females (25.4%) in their respective age groups living below the poverty level.
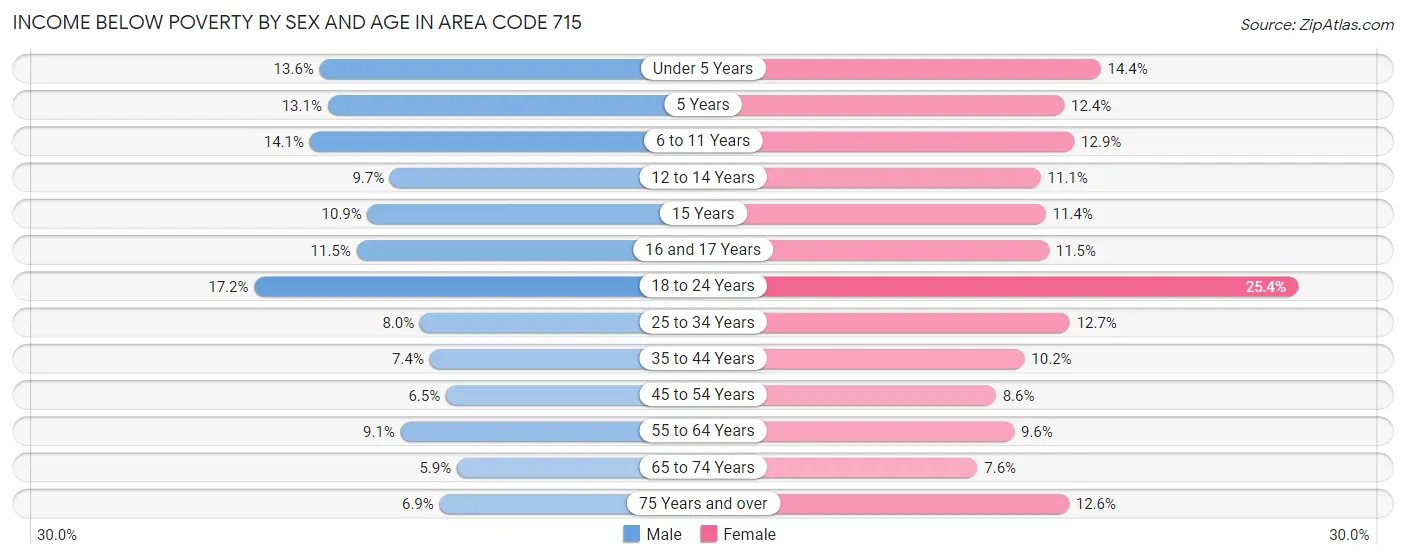
| Age Bracket | Male | Female |
| Under 5 Years | 4,661 (13.6%) | 4,694 (14.4%) |
| 5 Years | 947 (13.1%) | 879 (12.4%) |
| 6 to 11 Years | 6,492 (14.1%) | 5,606 (12.9%) |
| 12 to 14 Years | 2,345 (9.7%) | 2,448 (11.1%) |
| 15 Years | 888 (10.9%) | 931 (11.4%) |
| 16 and 17 Years | 1,958 (11.5%) | 1,784 (11.5%) |
| 18 to 24 Years | 9,489 (17.2%) | 13,268 (25.4%) |
| 25 to 34 Years | 5,833 (8.0%) | 8,753 (12.7%) |
| 35 to 44 Years | 5,653 (7.4%) | 7,436 (10.2%) |
| 45 to 54 Years | 5,275 (6.5%) | 6,484 (8.6%) |
| 55 to 64 Years | 8,933 (9.1%) | 9,272 (9.6%) |
| 65 to 74 Years | 4,520 (5.9%) | 5,664 (7.5%) |
| 75 Years and over | 3,057 (6.9%) | 7,042 (12.6%) |
| Total | 60,051 (9.4%) | 74,261 (11.9%) |
Income Above Poverty by Sex and Age in Area Code 715
According to the poverty statistics in Area Code 715, males aged 65 to 74 years and females aged 65 to 74 years are the age groups that are most secure financially, with 94.1% of males and 92.4% of females in these age groups living above the poverty line.
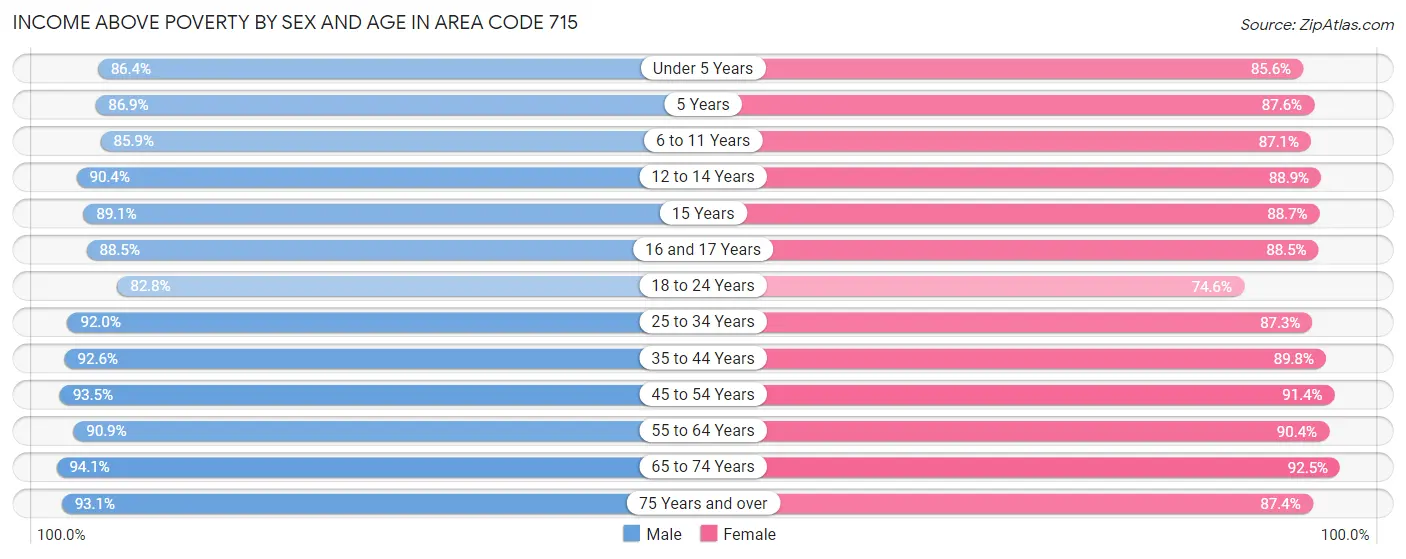
| Age Bracket | Male | Female |
| Under 5 Years | 29,684 (86.4%) | 27,882 (85.6%) |
| 5 Years | 6,273 (86.9%) | 6,219 (87.6%) |
| 6 to 11 Years | 39,497 (85.9%) | 37,712 (87.1%) |
| 12 to 14 Years | 21,958 (90.3%) | 19,663 (88.9%) |
| 15 Years | 7,258 (89.1%) | 7,273 (88.6%) |
| 16 and 17 Years | 15,058 (88.5%) | 13,684 (88.5%) |
| 18 to 24 Years | 45,648 (82.8%) | 38,979 (74.6%) |
| 25 to 34 Years | 67,269 (92.0%) | 60,232 (87.3%) |
| 35 to 44 Years | 70,289 (92.6%) | 65,712 (89.8%) |
| 45 to 54 Years | 75,505 (93.5%) | 69,186 (91.4%) |
| 55 to 64 Years | 89,660 (90.9%) | 87,377 (90.4%) |
| 65 to 74 Years | 71,800 (94.1%) | 69,344 (92.4%) |
| 75 Years and over | 41,282 (93.1%) | 48,685 (87.4%) |
| Total | 581,181 (90.6%) | 551,948 (88.1%) |
Income Below Poverty Among Married-Couple Families in Area Code 715
The poverty statistics for married-couple families in Area Code 715 show that 3.5% or 9,503 of the total 269,052 families live below the poverty line. Families with 5 or more children have the highest poverty rate of 15.9%, comprising of 485 families. On the other hand, families with 1 or 2 children have the lowest poverty rate of 2.9%, which includes 1,917 families.
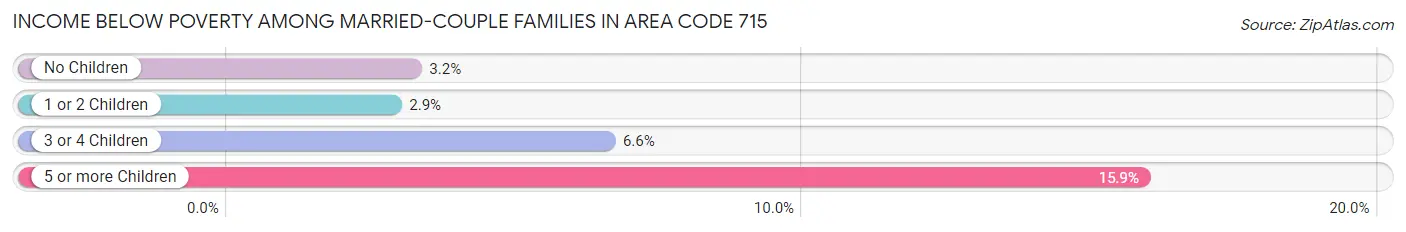
| Children | Above Poverty | Below Poverty |
| No Children | 172,256 (96.8%) | 5,717 (3.2%) |
| 1 or 2 Children | 65,067 (97.1%) | 1,917 (2.9%) |
| 3 or 4 Children | 19,658 (93.4%) | 1,384 (6.6%) |
| 5 or more Children | 2,568 (84.1%) | 485 (15.9%) |
| Total | 259,549 (96.5%) | 9,503 (3.5%) |
Income Below Poverty Among Single-Parent Households in Area Code 715
According to the poverty data in Area Code 715, 10.8% or 2,633 single-father households and 23.0% or 9,970 single-mother households are living below the poverty line. Among single-father households, those with 5 or more children have the highest poverty rate, with 75 households (29.4%) experiencing poverty. Likewise, among single-mother households, those with 5 or more children have the highest poverty rate, with 174 households (45.4%) falling below the poverty line.
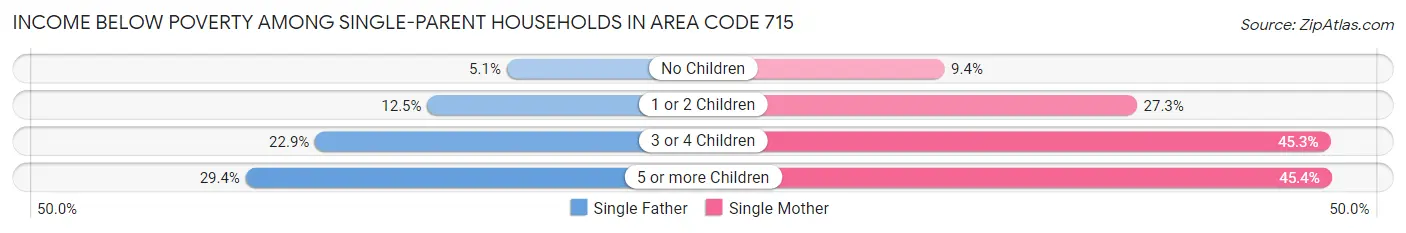
| Children | Single Father | Single Mother |
| No Children | 460 (5.1%) | 1,418 (9.4%) |
| 1 or 2 Children | 1,614 (12.5%) | 6,352 (27.3%) |
| 3 or 4 Children | 484 (22.9%) | 2,026 (45.3%) |
| 5 or more Children | 75 (29.4%) | 174 (45.4%) |
| Total | 2,633 (10.8%) | 9,970 (23.0%) |
Income Below Poverty Among Married-Couple vs Single-Parent Households in Area Code 715
The poverty data for Area Code 715 shows that 9,503 of the married-couple family households (3.5%) and 12,603 of the single-parent households (18.6%) are living below the poverty level. Within the married-couple family households, those with 5 or more children have the highest poverty rate, with 485 households (15.9%) falling below the poverty line. Among the single-parent households, those with 5 or more children have the highest poverty rate, with 249 household (39.0%) living below poverty.
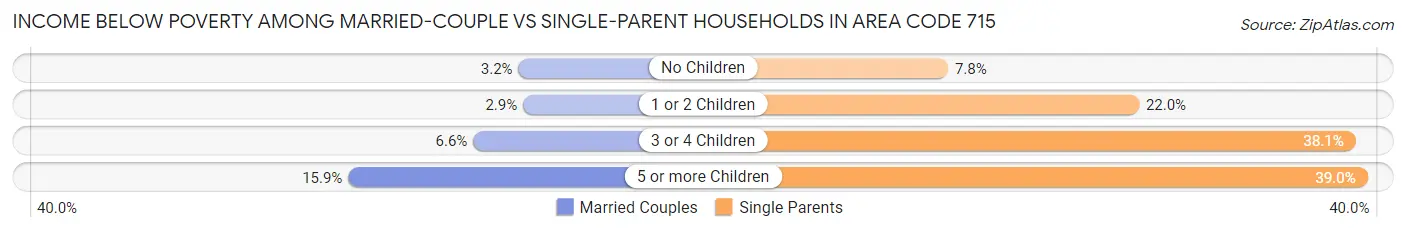
| Children | Married-Couple Families | Single-Parent Households |
| No Children | 5,717 (3.2%) | 1,878 (7.8%) |
| 1 or 2 Children | 1,917 (2.9%) | 7,966 (22.0%) |
| 3 or 4 Children | 1,384 (6.6%) | 2,510 (38.1%) |
| 5 or more Children | 485 (15.9%) | 249 (39.0%) |
| Total | 9,503 (3.5%) | 12,603 (18.6%) |
Race in Area Code 715
The most populous races in Area Code 715 are White / Caucasian (1,171,044 | 90.1%), Two or more Races (50,565 | 3.9%), and Hispanic or Latino (48,852 | 3.8%).
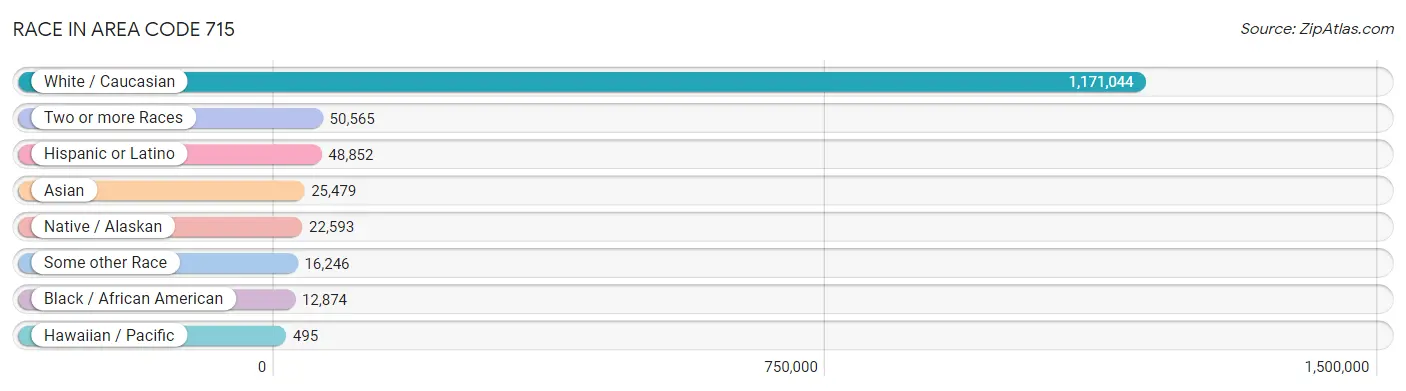
| Race | # Population | % Population |
| Asian | 25,479 | 2.0% |
| Black / African American | 12,874 | 1.0% |
| Hawaiian / Pacific | 495 | 0.0% |
| Hispanic or Latino | 48,852 | 3.8% |
| Native / Alaskan | 22,593 | 1.7% |
| White / Caucasian | 1,171,044 | 90.1% |
| Two or more Races | 50,565 | 3.9% |
| Some other Race | 16,246 | 1.3% |
| Total | 1,299,296 | 100.0% |
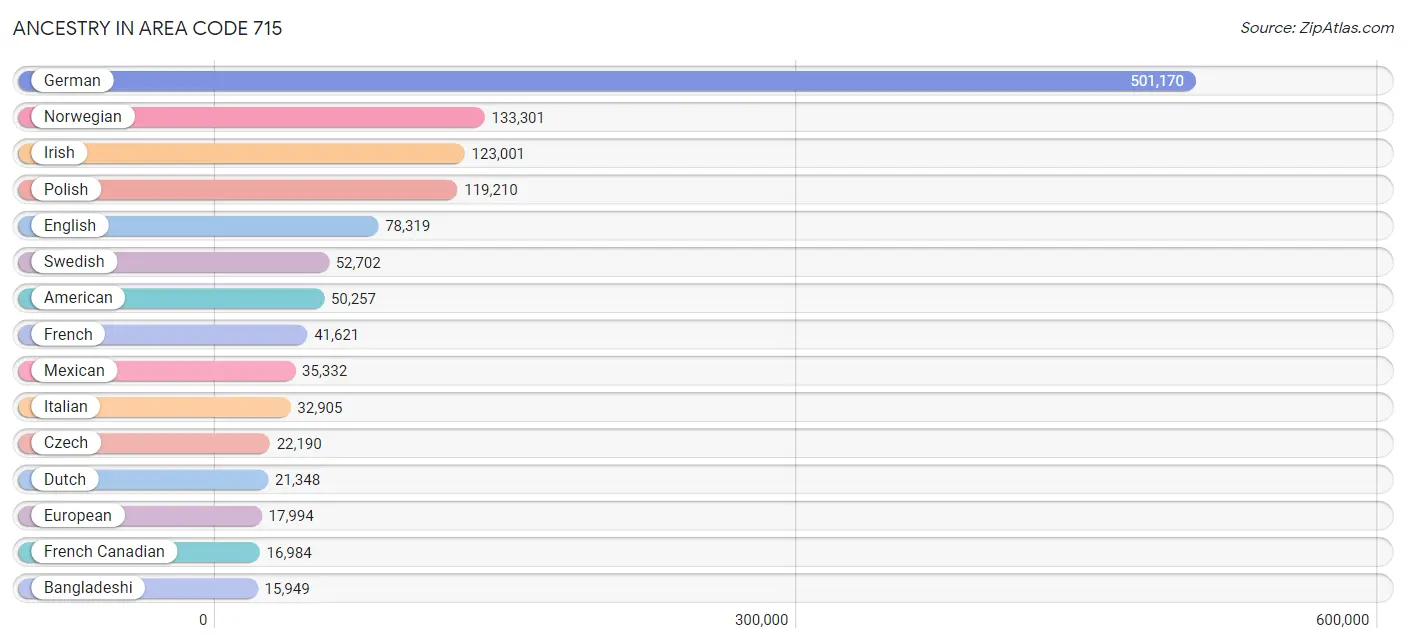
Ancestry in Area Code 715
The most populous ancestries reported in Area Code 715 are German (501,170 | 38.6%), Norwegian (133,301 | 10.3%), Irish (123,001 | 9.5%), Polish (119,210 | 9.2%), and English (78,319 | 6.0%), together accounting for 73.5% of all Area Code 715 residents.
| Ancestry | # Population | % Population |
| Afghan | 4 | 0.0% |
| African | 983 | 0.1% |
| Alaska Native | 59 | 0.0% |
| Alaskan Athabascan | 29 | 0.0% |
| Albanian | 53 | 0.0% |
| Aleut | 16 | 0.0% |
| Alsatian | 25 | 0.0% |
| American | 50,257 | 3.9% |
| Apache | 280 | 0.0% |
| Arab | 1,618 | 0.1% |
| Arapaho | 14 | 0.0% |
| Argentinean | 97 | 0.0% |
| Armenian | 316 | 0.0% |
| Assyrian / Chaldean / Syriac | 20 | 0.0% |
| Australian | 207 | 0.0% |
| Austrian | 6,132 | 0.5% |
| Bahamian | 16 | 0.0% |
| Bangladeshi | 15,949 | 1.2% |
| Barbadian | 3 | 0.0% |
| Basque | 10 | 0.0% |
| Belgian | 8,606 | 0.7% |
| Belizean | 18 | 0.0% |
| Bermudan | 3 | 0.0% |
| Bhutanese | 1,985 | 0.2% |
| Blackfeet | 415 | 0.0% |
| Bolivian | 19 | 0.0% |
| Brazilian | 200 | 0.0% |
| British | 3,498 | 0.3% |
| British West Indian | 5 | 0.0% |
| Bulgarian | 197 | 0.0% |
| Burmese | 2,155 | 0.2% |
| Cajun | 15 | 0.0% |
| Cambodian | 19 | 0.0% |
| Canadian | 1,197 | 0.1% |
| Carpatho Rusyn | 7 | 0.0% |
| Celtic | 234 | 0.0% |
| Central American | 2,732 | 0.2% |
| Central American Indian | 282 | 0.0% |
| Cherokee | 1,347 | 0.1% |
| Cheyenne | 73 | 0.0% |
| Chickasaw | 4 | 0.0% |
| Chilean | 92 | 0.0% |
| Chinese | 7 | 0.0% |
| Chippewa | 14,180 | 1.1% |
| Choctaw | 135 | 0.0% |
| Colombian | 471 | 0.0% |
| Comanche | 41 | 0.0% |
| Costa Rican | 242 | 0.0% |
| Cree | 32 | 0.0% |
| Creek | 117 | 0.0% |
| Croatian | 2,864 | 0.2% |
| Crow | 6 | 0.0% |
| Cuban | 1,103 | 0.1% |
| Czech | 22,190 | 1.7% |
| Czechoslovakian | 2,582 | 0.2% |
| Danish | 11,501 | 0.9% |
| Delaware | 18 | 0.0% |
| Dominican | 210 | 0.0% |
| Dutch | 21,348 | 1.6% |
| Dutch West Indian | 88 | 0.0% |
| Eastern European | 2,089 | 0.2% |
| Ecuadorian | 97 | 0.0% |
| Egyptian | 144 | 0.0% |
| English | 78,319 | 6.0% |
| Estonian | 67 | 0.0% |
| Ethiopian | 138 | 0.0% |
| European | 17,994 | 1.4% |
| Fijian | 55 | 0.0% |
| Filipino | 245 | 0.0% |
| Finnish | 15,100 | 1.2% |
| French | 41,621 | 3.2% |
| French American Indian | 441 | 0.0% |
| French Canadian | 16,984 | 1.3% |
| German | 501,170 | 38.6% |
| German Russian | 42 | 0.0% |
| Ghanaian | 31 | 0.0% |
| Greek | 2,755 | 0.2% |
| Guamanian / Chamorro | 101 | 0.0% |
| Guatemalan | 485 | 0.0% |
| Haitian | 116 | 0.0% |
| Honduran | 709 | 0.1% |
| Hopi | 1 | 0.0% |
| Hungarian | 3,546 | 0.3% |
| Icelander | 340 | 0.0% |
| Indian (Asian) | 2,647 | 0.2% |
| Indonesian | 47 | 0.0% |
| Inupiat | 111 | 0.0% |
| Iranian | 155 | 0.0% |
| Iraqi | 8 | 0.0% |
| Irish | 123,001 | 9.5% |
| Iroquois | 2,095 | 0.2% |
| Israeli | 34 | 0.0% |
| Italian | 32,905 | 2.5% |
| Jamaican | 464 | 0.0% |
| Japanese | 331 | 0.0% |
| Jordanian | 8 | 0.0% |
| Kenyan | 111 | 0.0% |
| Kiowa | 20 | 0.0% |
| Korean | 4,334 | 0.3% |
| Laotian | 131 | 0.0% |
| Latvian | 467 | 0.0% |
| Lebanese | 776 | 0.1% |
| Liberian | 63 | 0.0% |
| Lithuanian | 2,594 | 0.2% |
| Lumbee | 17 | 0.0% |
| Luxembourger | 759 | 0.1% |
| Macedonian | 49 | 0.0% |
| Malaysian | 777 | 0.1% |
| Maltese | 89 | 0.0% |
| Menominee | 6,389 | 0.5% |
| Mexican | 35,332 | 2.7% |
| Mexican American Indian | 489 | 0.0% |
| Mongolian | 245 | 0.0% |
| Moroccan | 47 | 0.0% |
| Native Hawaiian | 452 | 0.0% |
| Navajo | 260 | 0.0% |
| New Zealander | 15 | 0.0% |
| Nicaraguan | 809 | 0.1% |
| Nigerian | 480 | 0.0% |
| Northern European | 2,227 | 0.2% |
| Norwegian | 133,301 | 10.3% |
| Okinawan | 5 | 0.0% |
| Osage | 2 | 0.0% |
| Ottawa | 151 | 0.0% |
| Paiute | 39 | 0.0% |
| Pakistani | 338 | 0.0% |
| Palestinian | 126 | 0.0% |
| Panamanian | 131 | 0.0% |
| Paraguayan | 19 | 0.0% |
| Pennsylvania German | 1,778 | 0.1% |
| Peruvian | 275 | 0.0% |
| Pima | 76 | 0.0% |
| Polish | 119,210 | 9.2% |
| Portuguese | 783 | 0.1% |
| Potawatomi | 1,071 | 0.1% |
| Pueblo | 9 | 0.0% |
| Puerto Rican | 4,852 | 0.4% |
| Puget Sound Salish | 5 | 0.0% |
| Romanian | 456 | 0.0% |
| Russian | 5,390 | 0.4% |
| Salvadoran | 356 | 0.0% |
| Samoan | 129 | 0.0% |
| Scandinavian | 11,811 | 0.9% |
| Scotch-Irish | 4,788 | 0.4% |
| Scottish | 12,336 | 0.9% |
| Seminole | 6 | 0.0% |
| Serbian | 629 | 0.1% |
| Shoshone | 11 | 0.0% |
| Sioux | 623 | 0.1% |
| Slavic | 901 | 0.1% |
| Slovak | 2,319 | 0.2% |
| Slovene | 1,461 | 0.1% |
| Somali | 1,266 | 0.1% |
| South African | 50 | 0.0% |
| South American | 1,319 | 0.1% |
| South American Indian | 27 | 0.0% |
| Spaniard | 614 | 0.1% |
| Spanish | 925 | 0.1% |
| Spanish American | 36 | 0.0% |
| Spanish American Indian | 1 | 0.0% |
| Sri Lankan | 1,324 | 0.1% |
| Subsaharan African | 3,274 | 0.3% |
| Sudanese | 74 | 0.0% |
| Swedish | 52,702 | 4.1% |
| Swiss | 9,744 | 0.7% |
| Syrian | 111 | 0.0% |
| Thai | 2,945 | 0.2% |
| Tlingit-Haida | 21 | 0.0% |
| Tohono O'Odham | 64 | 0.0% |
| Tongan | 19 | 0.0% |
| Trinidadian and Tobagonian | 6 | 0.0% |
| Turkish | 104 | 0.0% |
| U.S. Virgin Islander | 30 | 0.0% |
| Ugandan | 6 | 0.0% |
| Ukrainian | 2,136 | 0.2% |
| Uruguayan | 50 | 0.0% |
| Ute | 27 | 0.0% |
| Venezuelan | 197 | 0.0% |
| Vietnamese | 33 | 0.0% |
| Welsh | 4,520 | 0.4% |
| West Indian | 58 | 0.0% |
| Yaqui | 9 | 0.0% |
| Yugoslavian | 615 | 0.1% |
| Yup'ik | 8 | 0.0% | View All 184 Rows |
Immigrants in Area Code 715
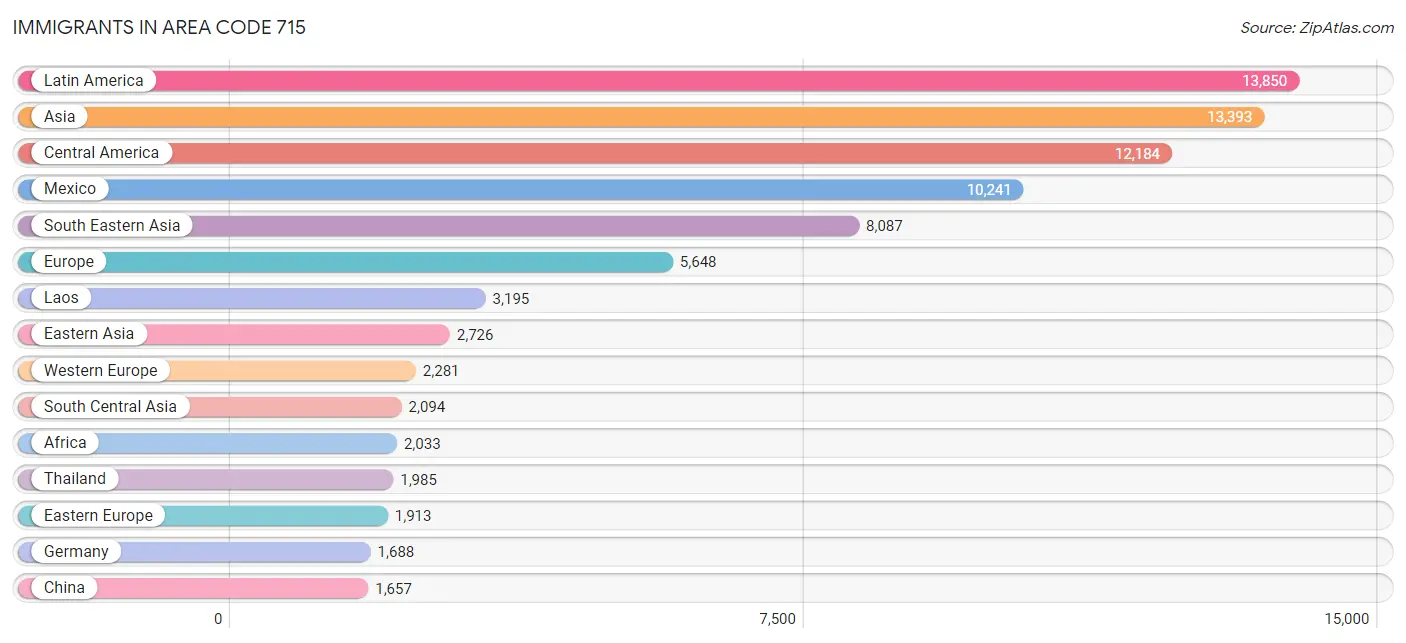
The most numerous immigrant groups reported in Area Code 715 came from Latin America (13,850 | 1.1%), Asia (13,393 | 1.0%), Central America (12,184 | 0.9%), Mexico (10,241 | 0.8%), and South Eastern Asia (8,087 | 0.6%), together accounting for 4.4% of all Area Code 715 residents.
| Immigration Origin | # Population | % Population |
| Afghanistan | 48 | 0.0% |
| Africa | 2,033 | 0.2% |
| Albania | 11 | 0.0% |
| Argentina | 38 | 0.0% |
| Armenia | 4 | 0.0% |
| Asia | 13,393 | 1.0% |
| Australia | 67 | 0.0% |
| Austria | 66 | 0.0% |
| Azores | 1 | 0.0% |
| Bahamas | 17 | 0.0% |
| Bangladesh | 344 | 0.0% |
| Barbados | 2 | 0.0% |
| Belarus | 26 | 0.0% |
| Belgium | 24 | 0.0% |
| Bolivia | 7 | 0.0% |
| Bosnia and Herzegovina | 154 | 0.0% |
| Brazil | 239 | 0.0% |
| Bulgaria | 36 | 0.0% |
| Cambodia | 90 | 0.0% |
| Canada | 1,282 | 0.1% |
| Caribbean | 499 | 0.0% |
| Central America | 12,184 | 0.9% |
| Chile | 60 | 0.0% |
| China | 1,657 | 0.1% |
| Colombia | 285 | 0.0% |
| Congo | 54 | 0.0% |
| Costa Rica | 209 | 0.0% |
| Croatia | 20 | 0.0% |
| Cuba | 206 | 0.0% |
| Czechoslovakia | 82 | 0.0% |
| Denmark | 42 | 0.0% |
| Dominican Republic | 84 | 0.0% |
| Eastern Africa | 1,262 | 0.1% |
| Eastern Asia | 2,726 | 0.2% |
| Eastern Europe | 1,913 | 0.2% |
| Ecuador | 47 | 0.0% |
| Egypt | 26 | 0.0% |
| El Salvador | 294 | 0.0% |
| England | 365 | 0.0% |
| Ethiopia | 416 | 0.0% |
| Europe | 5,648 | 0.4% |
| France | 146 | 0.0% |
| Germany | 1,688 | 0.1% |
| Ghana | 20 | 0.0% |
| Greece | 59 | 0.0% |
| Grenada | 1 | 0.0% |
| Guatemala | 288 | 0.0% |
| Haiti | 45 | 0.0% |
| Honduras | 354 | 0.0% |
| Hong Kong | 72 | 0.0% |
| Hungary | 96 | 0.0% |
| India | 1,437 | 0.1% |
| Indonesia | 40 | 0.0% |
| Iran | 42 | 0.0% |
| Iraq | 47 | 0.0% |
| Ireland | 54 | 0.0% |
| Israel | 10 | 0.0% |
| Italy | 153 | 0.0% |
| Jamaica | 126 | 0.0% |
| Japan | 300 | 0.0% |
| Jordan | 28 | 0.0% |
| Kazakhstan | 36 | 0.0% |
| Kenya | 102 | 0.0% |
| Korea | 764 | 0.1% |
| Kuwait | 25 | 0.0% |
| Laos | 3,195 | 0.3% |
| Latin America | 13,850 | 1.1% |
| Latvia | 121 | 0.0% |
| Liberia | 68 | 0.0% |
| Lithuania | 80 | 0.0% |
| Malaysia | 263 | 0.0% |
| Mexico | 10,241 | 0.8% |
| Micronesia | 70 | 0.0% |
| Middle Africa | 56 | 0.0% |
| Moldova | 16 | 0.0% |
| Morocco | 29 | 0.0% |
| Nepal | 48 | 0.0% |
| Netherlands | 226 | 0.0% |
| Nicaragua | 726 | 0.1% |
| Nigeria | 279 | 0.0% |
| North Macedonia | 17 | 0.0% |
| Northern Africa | 195 | 0.0% |
| Northern Europe | 1,148 | 0.1% |
| Norway | 52 | 0.0% |
| Oceania | 232 | 0.0% |
| Pakistan | 137 | 0.0% |
| Panama | 72 | 0.0% |
| Peru | 207 | 0.0% |
| Philippines | 1,615 | 0.1% |
| Poland | 443 | 0.0% |
| Portugal | 21 | 0.0% |
| Romania | 111 | 0.0% |
| Russia | 422 | 0.0% |
| Saudi Arabia | 279 | 0.0% |
| Scotland | 130 | 0.0% |
| Serbia | 32 | 0.0% |
| Singapore | 48 | 0.0% |
| Somalia | 680 | 0.1% |
| South Africa | 109 | 0.0% |
| South America | 1,167 | 0.1% |
| South Central Asia | 2,094 | 0.2% |
| South Eastern Asia | 8,087 | 0.6% |
| Southern Europe | 287 | 0.0% |
| Spain | 54 | 0.0% |
| Sudan | 89 | 0.0% |
| Sweden | 162 | 0.0% |
| Switzerland | 128 | 0.0% |
| Syria | 8 | 0.0% |
| Taiwan | 129 | 0.0% |
| Thailand | 1,985 | 0.2% |
| Trinidad and Tobago | 9 | 0.0% |
| Turkey | 38 | 0.0% |
| Uganda | 3 | 0.0% |
| Ukraine | 152 | 0.0% |
| Venezuela | 248 | 0.0% |
| Vietnam | 836 | 0.1% |
| Western Africa | 389 | 0.0% |
| Western Asia | 472 | 0.0% |
| Western Europe | 2,281 | 0.2% |
| Zaire | 2 | 0.0% |
| Zimbabwe | 6 | 0.0% | View All 121 Rows |
Sex and Age in Area Code 715
Sex and Age in Area Code 715
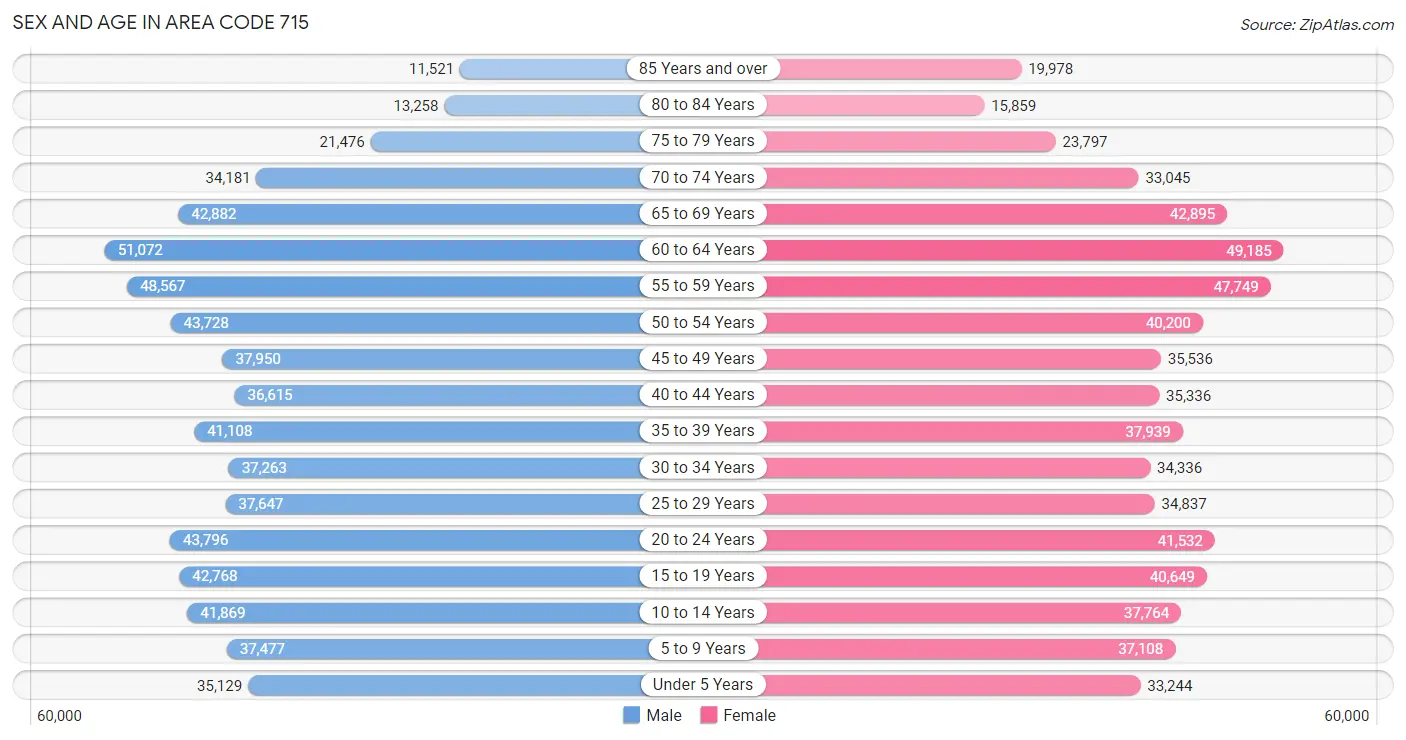
The most populous age groups in Area Code 715 are 60 to 64 Years (51,072 | 7.8%) for men and 60 to 64 Years (49,185 | 7.7%) for women.
| Age Bracket | Male | Female |
| Under 5 Years | 35,129 (5.3%) | 33,244 (5.2%) |
| 5 to 9 Years | 37,477 (5.7%) | 37,108 (5.8%) |
| 10 to 14 Years | 41,869 (6.4%) | 37,764 (5.9%) |
| 15 to 19 Years | 42,768 (6.5%) | 40,649 (6.3%) |
| 20 to 24 Years | 43,796 (6.7%) | 41,532 (6.5%) |
| 25 to 29 Years | 37,647 (5.7%) | 34,837 (5.4%) |
| 30 to 34 Years | 37,263 (5.7%) | 34,336 (5.4%) |
| 35 to 39 Years | 41,108 (6.2%) | 37,939 (5.9%) |
| 40 to 44 Years | 36,615 (5.6%) | 35,336 (5.5%) |
| 45 to 49 Years | 37,950 (5.8%) | 35,536 (5.5%) |
| 50 to 54 Years | 43,728 (6.6%) | 40,200 (6.3%) |
| 55 to 59 Years | 48,567 (7.4%) | 47,749 (7.4%) |
| 60 to 64 Years | 51,072 (7.8%) | 49,185 (7.7%) |
| 65 to 69 Years | 42,882 (6.5%) | 42,895 (6.7%) |
| 70 to 74 Years | 34,181 (5.2%) | 33,045 (5.2%) |
| 75 to 79 Years | 21,476 (3.3%) | 23,797 (3.7%) |
| 80 to 84 Years | 13,258 (2.0%) | 15,859 (2.5%) |
| 85 Years and over | 11,521 (1.8%) | 19,978 (3.1%) |
| Total | 658,307 (100.0%) | 640,989 (100.0%) |
Families and Households in Area Code 715
Median Family Size in Area Code 715
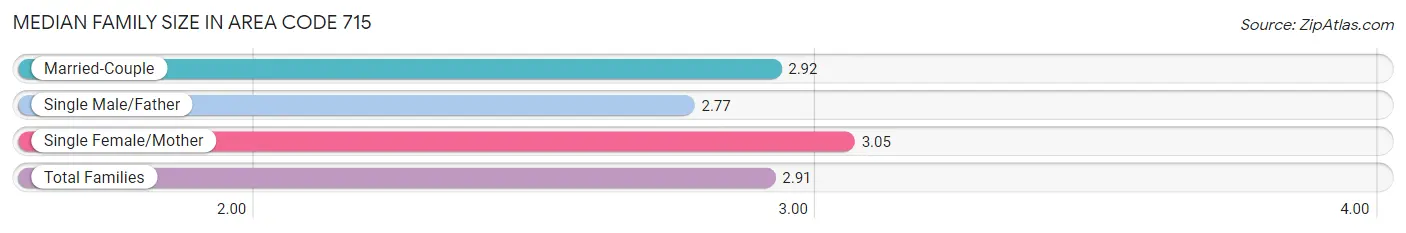
The median family size in Area Code 715 is 2.91 persons per family, with single female/mother families (43,286 | 12.9%) accounting for the largest median family size of 3.05093 persons per family. On the other hand, single male/father families (24,308 | 7.2%) represent the smallest median family size with 2.77 persons per family.
| Family Type | # Families | Family Size |
| Married-Couple | 269,052 (79.9%) | 2.92 |
| Single Male/Father | 24,308 (7.2%) | 2.77 |
| Single Female/Mother | 43,286 (12.9%) | 3.05 |
| Total Families | 336,646 (100.0%) | 2.91 |
Median Household Size in Area Code 715
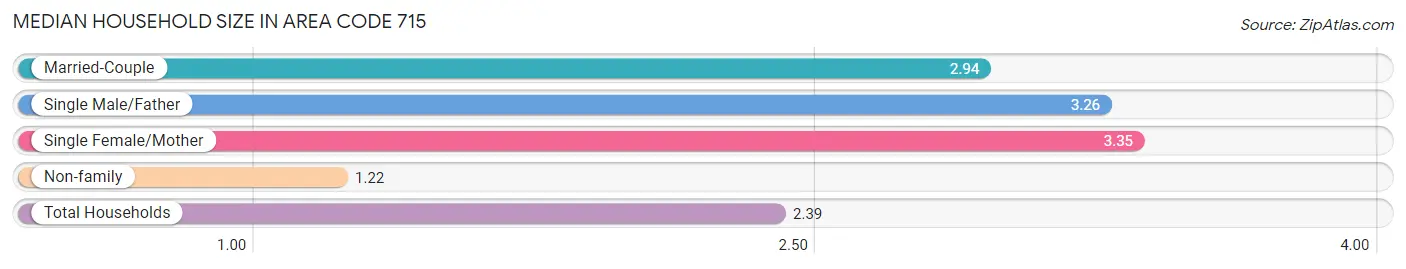
The median household size in Area Code 715 is 2.39 persons per household, with single female/mother households (43,286 | 8.0%) accounting for the largest median household size of 3.35258 persons per household. non-family households (201,407 | 37.4%) represent the smallest median household size with 1.22 persons per household.
| Household Type | # Households | Household Size |
| Married-Couple | 269,052 (50.0%) | 2.94 |
| Single Male/Father | 24,308 (4.5%) | 3.26 |
| Single Female/Mother | 43,286 (8.0%) | 3.35 |
| Non-family | 201,407 (37.4%) | 1.22 |
| Total Households | 538,053 (100.0%) | 2.39 |
Household Size by Marriage Status in Area Code 715
Out of a total of 538,053 households in Area Code 715, 336,646 (62.6%) are family households, while 201,407 (37.4%) are nonfamily households. The most numerous type of family households are 2-person households, comprising 179,942, and the most common type of nonfamily households are 1-person households, comprising 161,558.
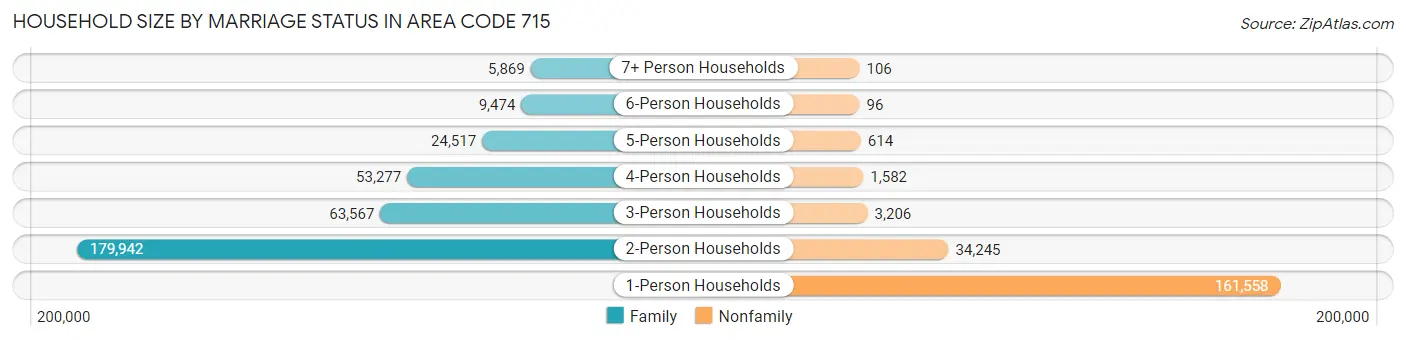
| Household Size | Family Households | Nonfamily Households |
| 1-Person Households | - | 161,558 (30.0%) |
| 2-Person Households | 179,942 (33.4%) | 34,245 (6.4%) |
| 3-Person Households | 63,567 (11.8%) | 3,206 (0.6%) |
| 4-Person Households | 53,277 (9.9%) | 1,582 (0.3%) |
| 5-Person Households | 24,517 (4.6%) | 614 (0.1%) |
| 6-Person Households | 9,474 (1.8%) | 96 (0.0%) |
| 7+ Person Households | 5,869 (1.1%) | 106 (0.0%) |
| Total | 336,646 (62.6%) | 201,407 (37.4%) |
Female Fertility in Area Code 715
Fertility by Age in Area Code 715
Average fertility rate in Area Code 715 is 63.5 births per 1,000 women. Women in the age bracket of 20 to 34 years have the highest fertility rate with 142.8 births per 1,000 women. Women in the age bracket of 20 to 34 years acount for 75.9% of all women with births.
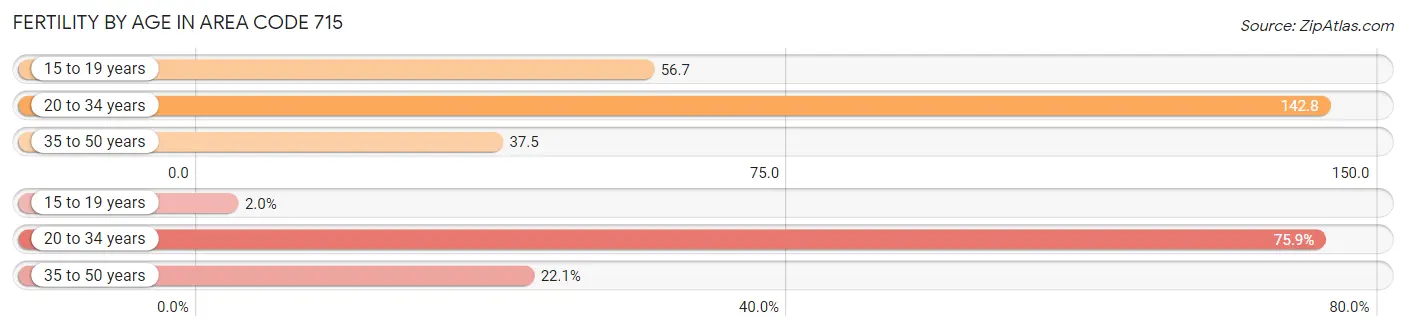
| Age Bracket | Women with Births | Births / 1,000 Women |
| 15 to 19 years | 293 (2.0%) | 56.7 |
| 20 to 34 years | 10,979 (75.9%) | 142.8 |
| 35 to 50 years | 3,197 (22.1%) | 37.5 |
| Total | 14,469 (100.0%) | 63.5 |
Fertility by Age by Marriage Status in Area Code 715
60.5% of women with births (14,469) in Area Code 715 are married. The highest percentage of unmarried women with births falls into 15 to 19 years age bracket with 94.2% of them unmarried at the time of birth, while the lowest percentage of unmarried women with births belong to 20 to 34 years age bracket with 41.9% of them unmarried.
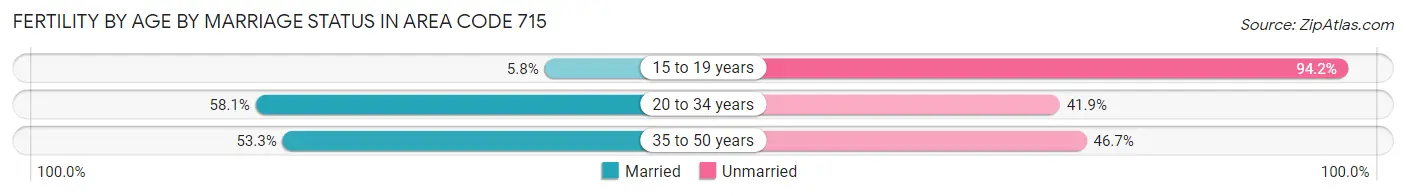
| Age Bracket | Married | Unmarried |
| 15 to 19 years | 17 (5.8%) | 276 (94.2%) |
| 20 to 34 years | 6,382 (58.1%) | 4,597 (41.9%) |
| 35 to 50 years | 1,703 (53.3%) | 1,494 (46.7%) |
| Total | 8,750 (60.5%) | 5,719 (39.5%) |
Fertility by Education in Area Code 715
Average fertility rate in Area Code 715 is 63.5 births per 1,000 women. Women with the education attainment of graduate degree have the highest fertility rate of 148.8 births per 1,000 women, while women with the education attainment of college or associate's degree have the lowest fertility at 77.6 births per 1,000 women. Women with the education attainment of college or associate's degree represent 39.0% of all women with births.
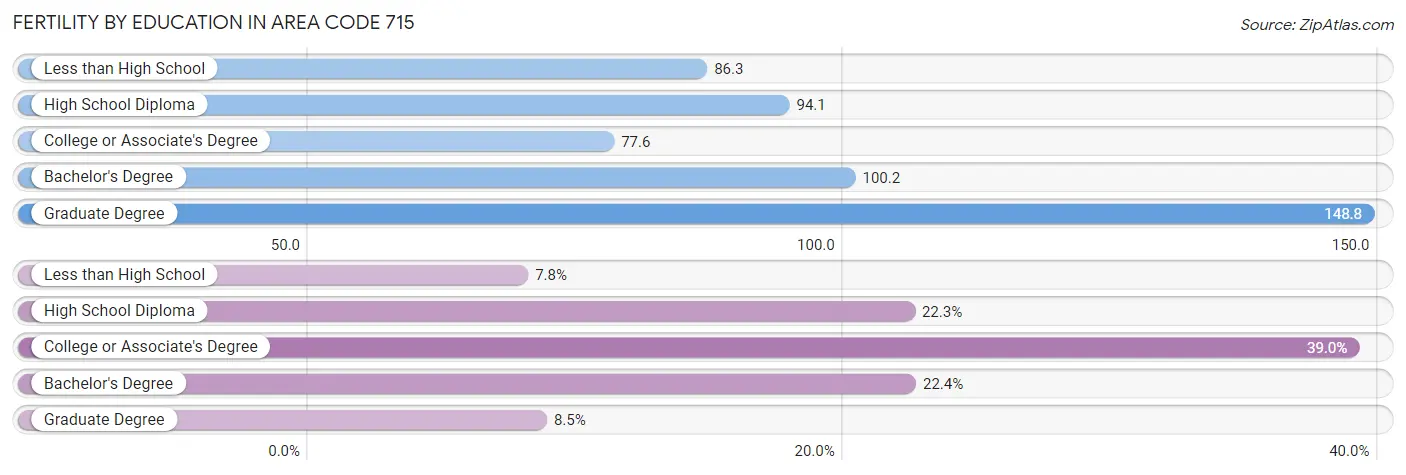
| Educational Attainment | Women with Births | Births / 1,000 Women |
| Less than High School | 1,133 (7.8%) | 86.3 |
| High School Diploma | 3,230 (22.3%) | 94.1 |
| College or Associate's Degree | 5,637 (39.0%) | 77.6 |
| Bachelor's Degree | 3,235 (22.4%) | 100.2 |
| Graduate Degree | 1,234 (8.5%) | 148.8 |
| Total | 14,469 (100.0%) | 63.5 |
Fertility by Education by Marriage Status in Area Code 715
39.5% of women with births in Area Code 715 are unmarried. Women with the educational attainment of college or associate's degree are most likely to be married with 50.1% of them married at childbirth, while women with the educational attainment of less than high school are least likely to be married with 75.0% of them unmarried at childbirth.
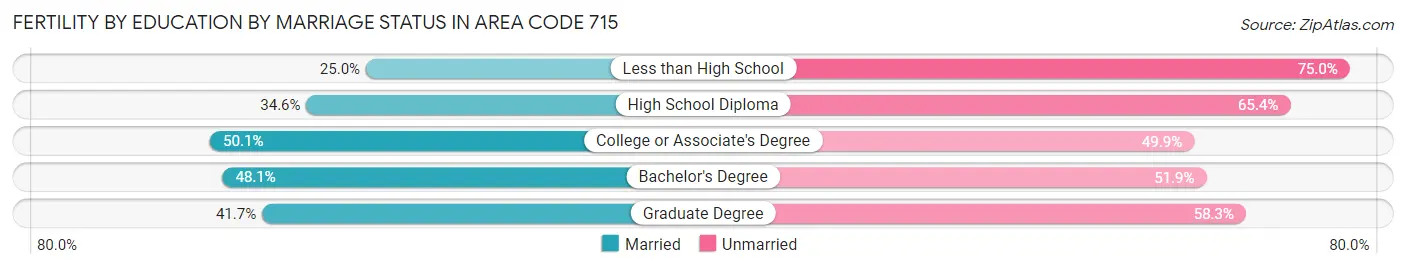
| Educational Attainment | Married | Unmarried |
| Less than High School | 283 (25.0%) | 850 (75.0%) |
| High School Diploma | 1,117 (34.6%) | 2,113 (65.4%) |
| College or Associate's Degree | 2,823 (50.1%) | 2,814 (49.9%) |
| Bachelor's Degree | 1,556 (48.1%) | 1,679 (51.9%) |
| Graduate Degree | 515 (41.7%) | 719 (58.3%) |
| Total | 8,750 (60.5%) | 5,719 (39.5%) |
Employment Characteristics in Area Code 715
Employment by Class of Employer in Area Code 715
Among the 635,223 employed individuals in Area Code 715, private company employees (433,239 | 68.2%), not-for-profit organizations (54,303 | 8.6%), and local government employees (49,542 | 7.8%) make up the most common classes of employment.
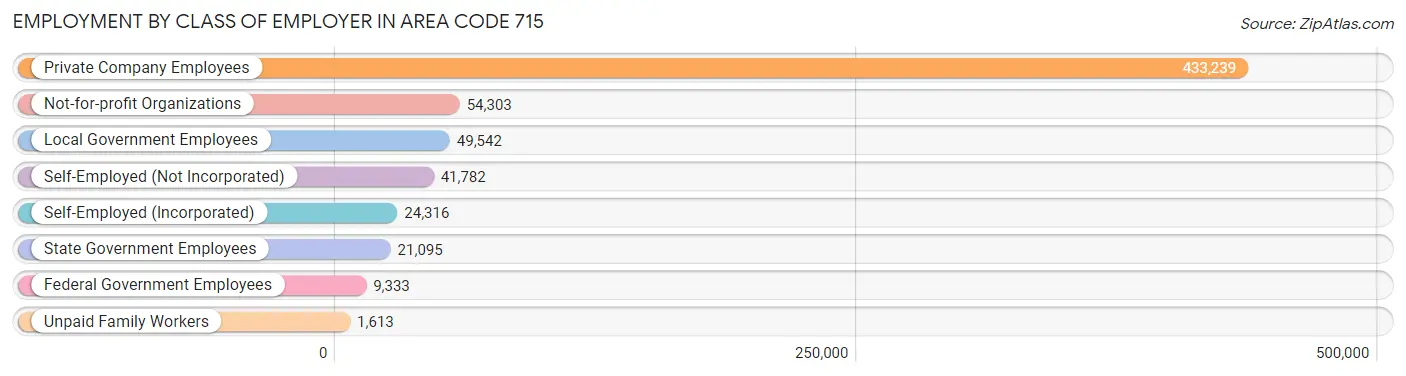
| Employer Class | # Employees | % Employees |
| Private Company Employees | 433,239 | 68.2% |
| Self-Employed (Incorporated) | 24,316 | 3.8% |
| Self-Employed (Not Incorporated) | 41,782 | 6.6% |
| Not-for-profit Organizations | 54,303 | 8.6% |
| Local Government Employees | 49,542 | 7.8% |
| State Government Employees | 21,095 | 3.3% |
| Federal Government Employees | 9,333 | 1.5% |
| Unpaid Family Workers | 1,613 | 0.3% |
| Total | 635,223 | 100.0% |
Employment Status by Age in Area Code 715
According to the labor force statistics for Area Code 715, out of the total population over 16 years of age (1,060,329), 59.8% or 634,395 individuals are in the labor force, with 3.8% or 24,297 of them unemployed. The age group with the highest labor force participation rate is 35 to 44 years, with 86.4% or 130,432 individuals in the labor force. Within the labor force, the 16 to 19 years age range has the highest percentage of unemployed individuals, with 2,285.5% or 833,682 of them being unemployed.
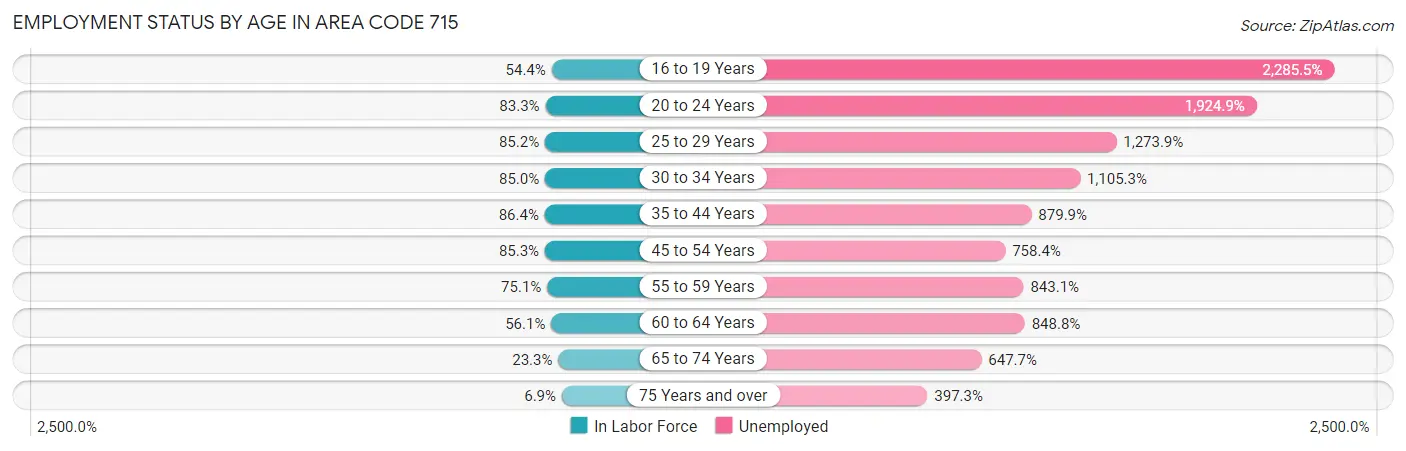
| Age Bracket | In Labor Force | Unemployed |
| 16 to 19 Years | 36,475 (54.4%) | 833,682 (2,285.5%) |
| 20 to 24 Years | 71,113 (83.3%) | 1,368,835 (1,924.9%) |
| 25 to 29 Years | 61,730 (85.2%) | 786,340 (1,273.9%) |
| 30 to 34 Years | 60,876 (85.0%) | 672,829 (1,105.3%) |
| 35 to 44 Years | 130,434 (86.4%) | 1,147,671 (879.9%) |
| 45 to 54 Years | 134,331 (85.3%) | 1,018,812 (758.4%) |
| 55 to 59 Years | 72,363 (75.1%) | 610,084 (843.1%) |
| 60 to 64 Years | 56,267 (56.1%) | 477,569 (848.8%) |
| 65 to 74 Years | 35,678 (23.3%) | 231,099 (647.7%) |
| 75 Years and over | 7,258 (6.9%) | 28,816 (397.3%) |
| Total | 634,436 (59.8%) | 24,288 (3.8%) |
Employment Status by Educational Attainment in Area Code 715
According to labor force statistics for Area Code 715, 78.1% of individuals (506,727) out of the total population between 25 and 64 years of age (649,068) are in the labor force, with 918.2% or 4,652,767 of them being unemployed. The group with the highest labor force participation rate are those with the educational attainment of bachelor's degree or higher, with 83.8% or 144,738 individuals in the labor force. Within the labor force, individuals with less than high school education have the highest percentage of unemployment, with 2,002.7% or 547,458 of them being unemployed.
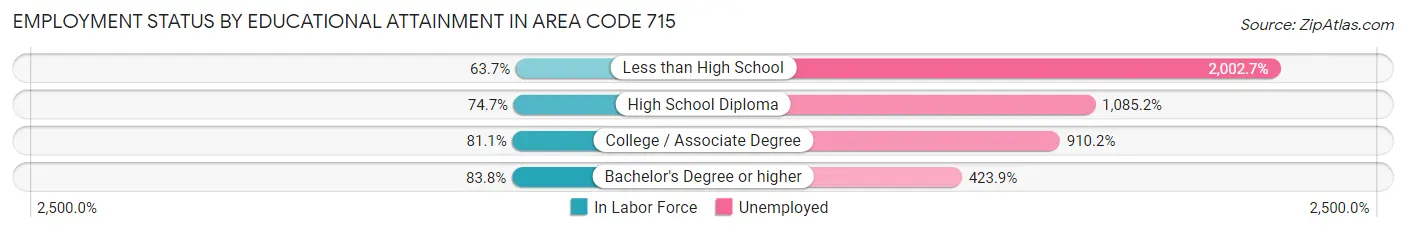
| Educational Attainment | In Labor Force | Unemployed |
| Less than High School | 27,338 (63.7%) | 858,898 (2,002.7%) |
| High School Diploma | 149,679 (74.7%) | 2,175,490 (1,085.2%) |
| College / Associate Degree | 188,911 (81.1%) | 2,121,267 (910.2%) |
| Bachelor's Degree or higher | 144,730 (83.8%) | 731,893 (423.9%) |
| Total | 506,718 (78.1%) | 5,959,742 (918.2%) |
Employment Occupations by Sex in Area Code 715
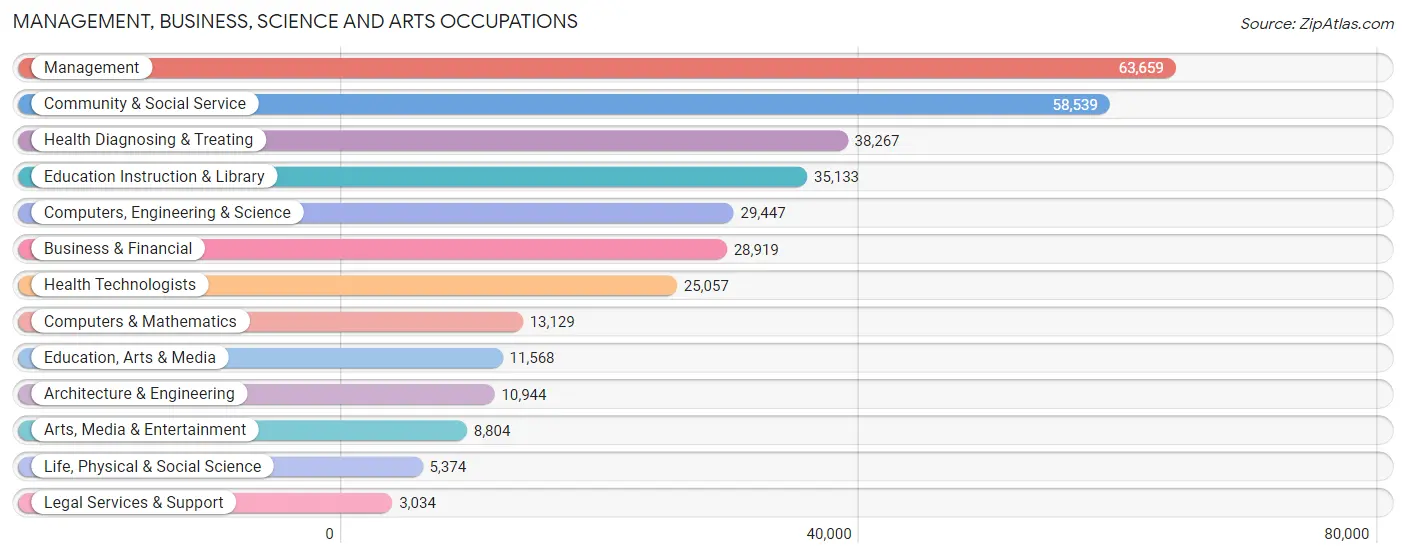
Management, Business, Science and Arts Occupations
The most common Management, Business, Science and Arts occupations in Area Code 715 are Management (63,659 | 9.8%), Community & Social Service (58,539 | 9.0%), Health Diagnosing & Treating (38,267 | 5.9%), Education Instruction & Library (35,133 | 5.4%), and Computers, Engineering & Science (29,447 | 4.5%).
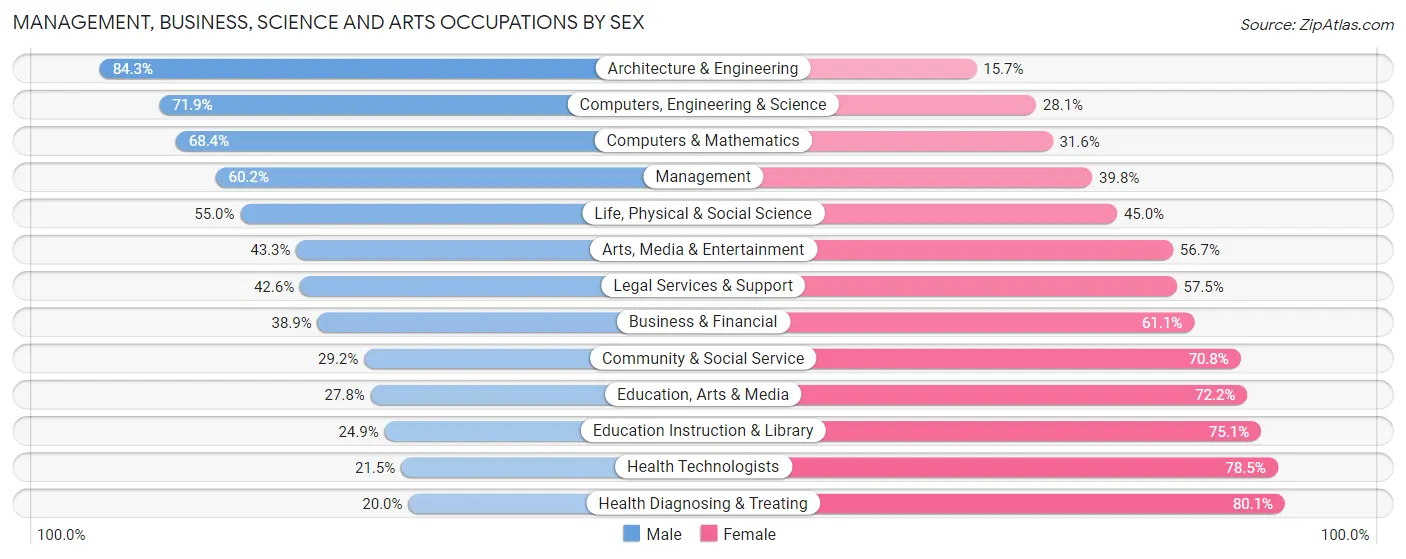
Management, Business, Science and Arts Occupations by Sex
Within the Management, Business, Science and Arts occupations in Area Code 715, the most male-oriented occupations are Architecture & Engineering (84.3%), Computers, Engineering & Science (71.9%), and Computers & Mathematics (68.4%), while the most female-oriented occupations are Health Diagnosing & Treating (80.0%), Health Technologists (78.5%), and Education Instruction & Library (75.1%).
| Occupation | Male | Female |
| Management | 38,298 (60.2%) | 25,361 (39.8%) |
| Business & Financial | 11,246 (38.9%) | 17,673 (61.1%) |
| Computers, Engineering & Science | 21,170 (71.9%) | 8,277 (28.1%) |
| Computers & Mathematics | 8,986 (68.4%) | 4,143 (31.6%) |
| Architecture & Engineering | 9,229 (84.3%) | 1,715 (15.7%) |
| Life, Physical & Social Science | 2,955 (55.0%) | 2,419 (45.0%) |
| Community & Social Service | 17,080 (29.2%) | 41,459 (70.8%) |
| Education, Arts & Media | 3,217 (27.8%) | 8,351 (72.2%) |
| Legal Services & Support | 1,291 (42.5%) | 1,743 (57.5%) |
| Education Instruction & Library | 8,757 (24.9%) | 26,376 (75.1%) |
| Arts, Media & Entertainment | 3,815 (43.3%) | 4,989 (56.7%) |
| Health Diagnosing & Treating | 7,633 (20.0%) | 30,634 (80.0%) |
| Health Technologists | 5,379 (21.5%) | 19,678 (78.5%) |
| Total (Category) | 95,427 (43.6%) | 123,404 (56.4%) |
| Total (Overall) | 341,461 (52.7%) | 306,192 (47.3%) |
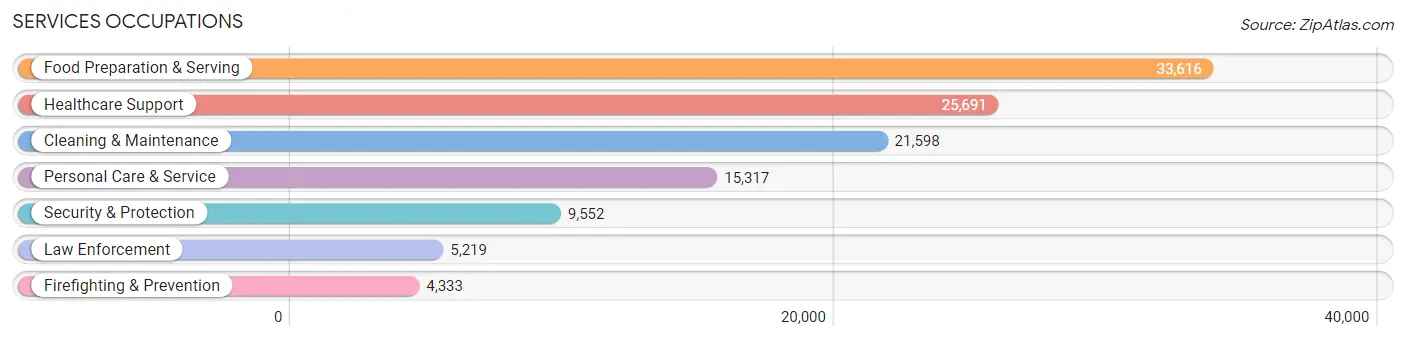
Services Occupations
The most common Services occupations in Area Code 715 are Food Preparation & Serving (33,616 | 5.2%), Healthcare Support (25,691 | 4.0%), Cleaning & Maintenance (21,598 | 3.3%), Personal Care & Service (15,317 | 2.4%), and Security & Protection (9,552 | 1.5%).
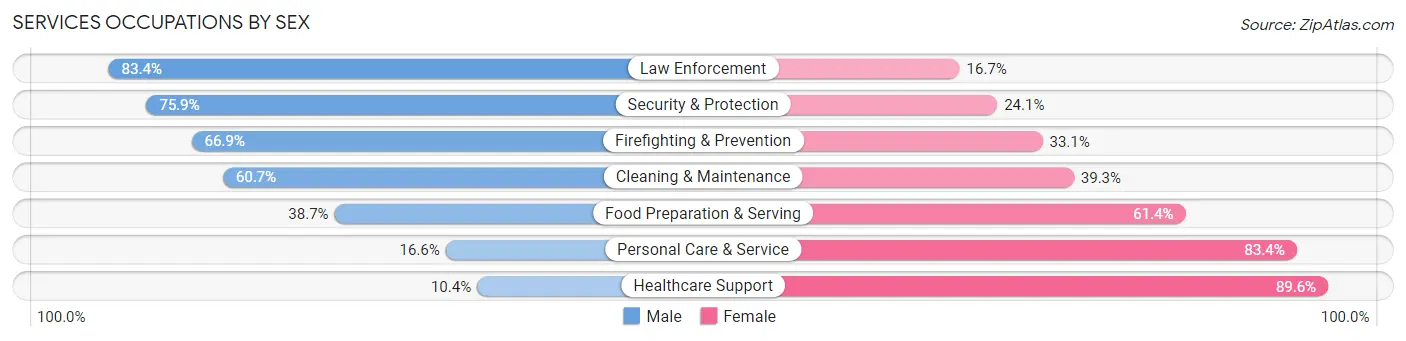
Services Occupations by Sex
Within the Services occupations in Area Code 715, the most male-oriented occupations are Law Enforcement (83.4%), Security & Protection (75.9%), and Firefighting & Prevention (66.9%), while the most female-oriented occupations are Healthcare Support (89.6%), Personal Care & Service (83.4%), and Food Preparation & Serving (61.4%).
| Occupation | Male | Female |
| Healthcare Support | 2,676 (10.4%) | 23,015 (89.6%) |
| Security & Protection | 7,250 (75.9%) | 2,302 (24.1%) |
| Firefighting & Prevention | 2,900 (66.9%) | 1,433 (33.1%) |
| Law Enforcement | 4,350 (83.4%) | 869 (16.7%) |
| Food Preparation & Serving | 12,993 (38.7%) | 20,623 (61.4%) |
| Cleaning & Maintenance | 13,117 (60.7%) | 8,481 (39.3%) |
| Personal Care & Service | 2,547 (16.6%) | 12,770 (83.4%) |
| Total (Category) | 38,583 (36.5%) | 67,191 (63.5%) |
| Total (Overall) | 341,461 (52.7%) | 306,192 (47.3%) |
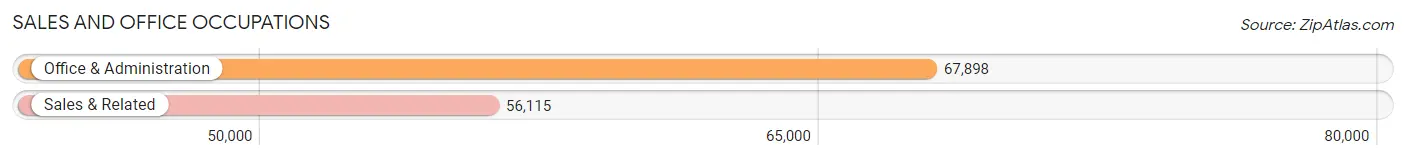
Sales and Office Occupations
The most common Sales and Office occupations in Area Code 715 are Office & Administration (67,898 | 10.5%), and Sales & Related (56,115 | 8.7%).
Sales and Office Occupations by Sex
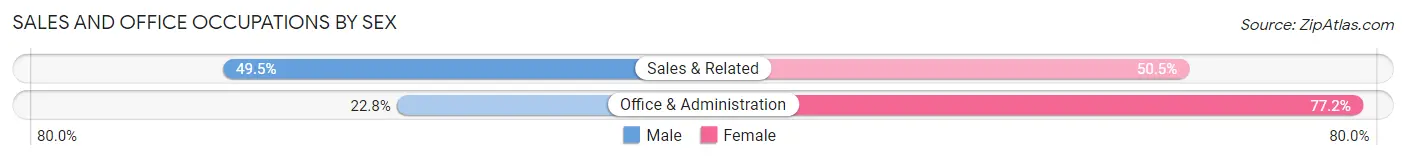
| Occupation | Male | Female |
| Sales & Related | 27,753 (49.5%) | 28,362 (50.5%) |
| Office & Administration | 15,465 (22.8%) | 52,433 (77.2%) |
| Total (Category) | 43,218 (34.8%) | 80,795 (65.1%) |
| Total (Overall) | 341,461 (52.7%) | 306,192 (47.3%) |
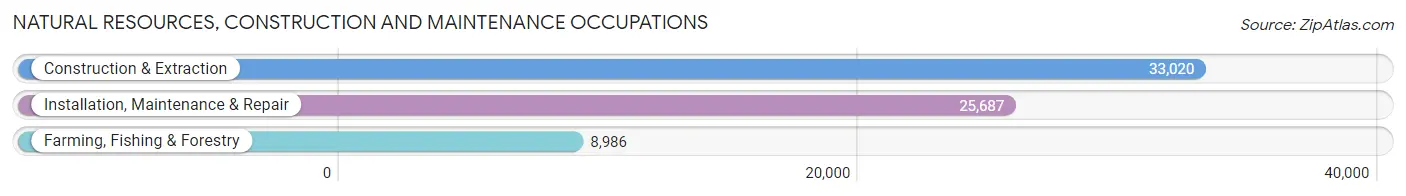
Natural Resources, Construction and Maintenance Occupations
The most common Natural Resources, Construction and Maintenance occupations in Area Code 715 are Construction & Extraction (33,020 | 5.1%), Installation, Maintenance & Repair (25,687 | 4.0%), and Farming, Fishing & Forestry (8,986 | 1.4%).
Natural Resources, Construction and Maintenance Occupations by Sex
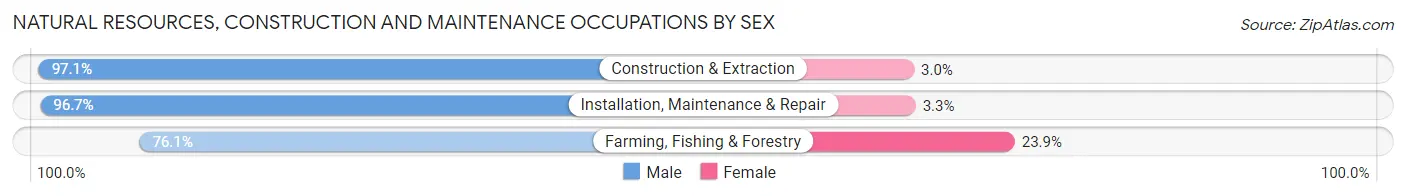
| Occupation | Male | Female |
| Farming, Fishing & Forestry | 6,837 (76.1%) | 2,149 (23.9%) |
| Construction & Extraction | 32,047 (97.1%) | 973 (2.9%) |
| Installation, Maintenance & Repair | 24,841 (96.7%) | 846 (3.3%) |
| Total (Category) | 63,725 (94.1%) | 3,968 (5.9%) |
| Total (Overall) | 341,461 (52.7%) | 306,192 (47.3%) |
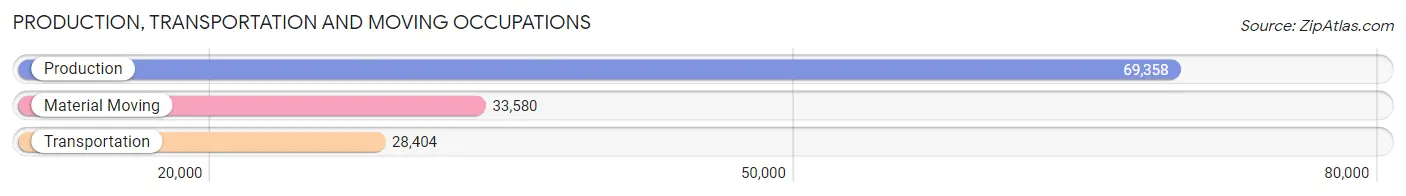
Production, Transportation and Moving Occupations
The most common Production, Transportation and Moving occupations in Area Code 715 are Production (69,358 | 10.7%), Material Moving (33,580 | 5.2%), and Transportation (28,404 | 4.4%).
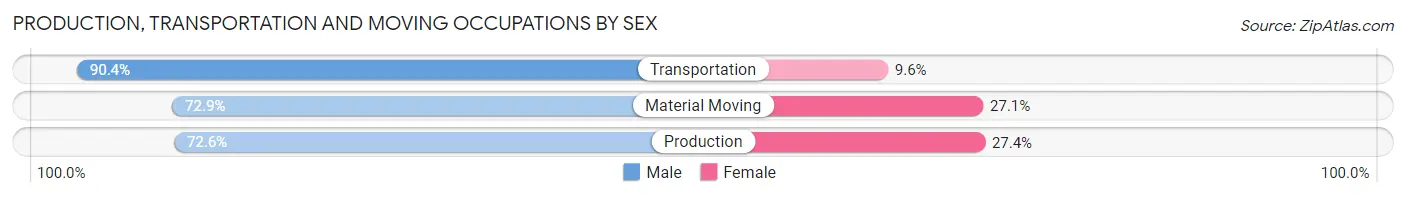
Production, Transportation and Moving Occupations by Sex
| Occupation | Male | Female |
| Production | 50,345 (72.6%) | 19,013 (27.4%) |
| Transportation | 25,677 (90.4%) | 2,727 (9.6%) |
| Material Moving | 24,486 (72.9%) | 9,094 (27.1%) |
| Total (Category) | 100,508 (76.5%) | 30,834 (23.5%) |
| Total (Overall) | 341,461 (52.7%) | 306,192 (47.3%) |
Employment Industries by Sex in Area Code 715
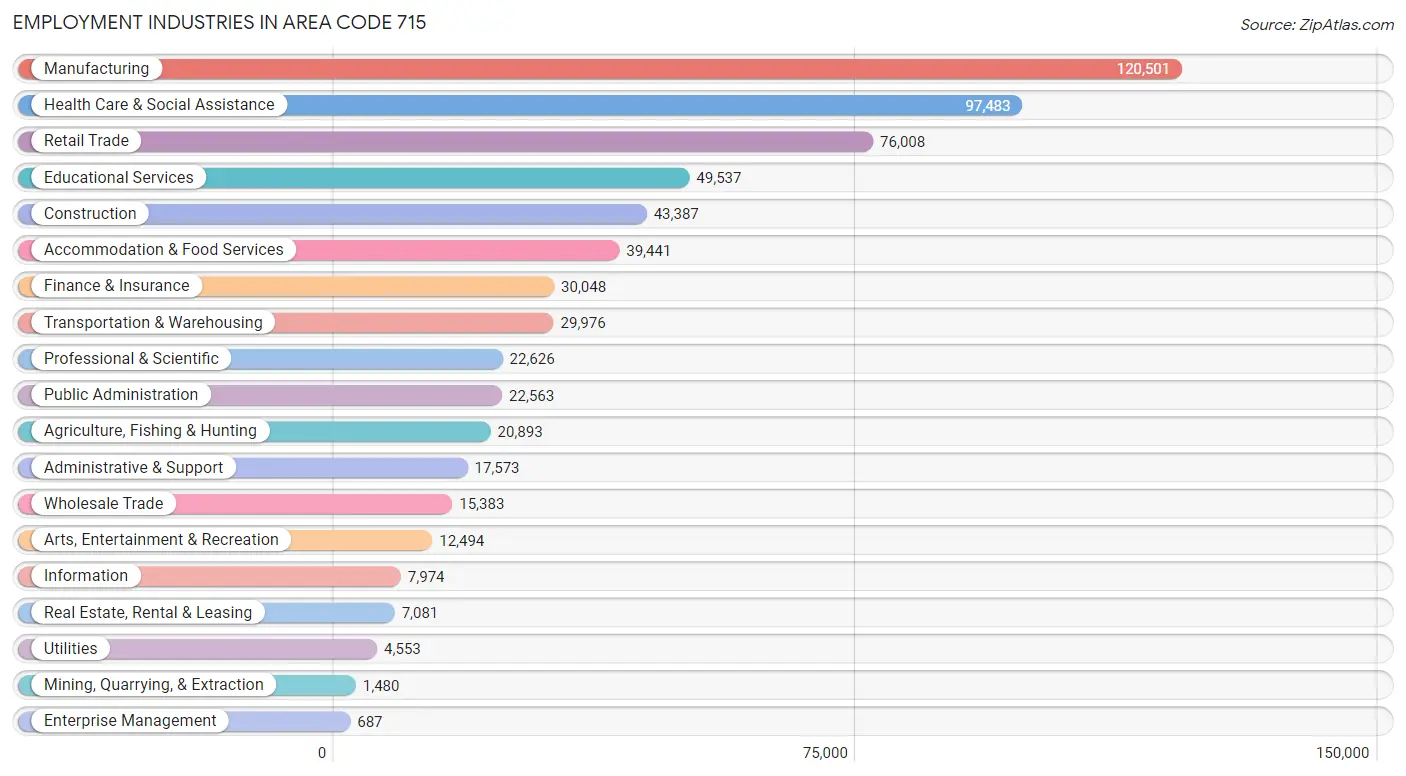
Employment Industries in Area Code 715
The major employment industries in Area Code 715 include Manufacturing (120,501 | 18.6%), Health Care & Social Assistance (97,483 | 15.0%), Retail Trade (76,008 | 11.7%), Educational Services (49,537 | 7.6%), and Construction (43,387 | 6.7%).
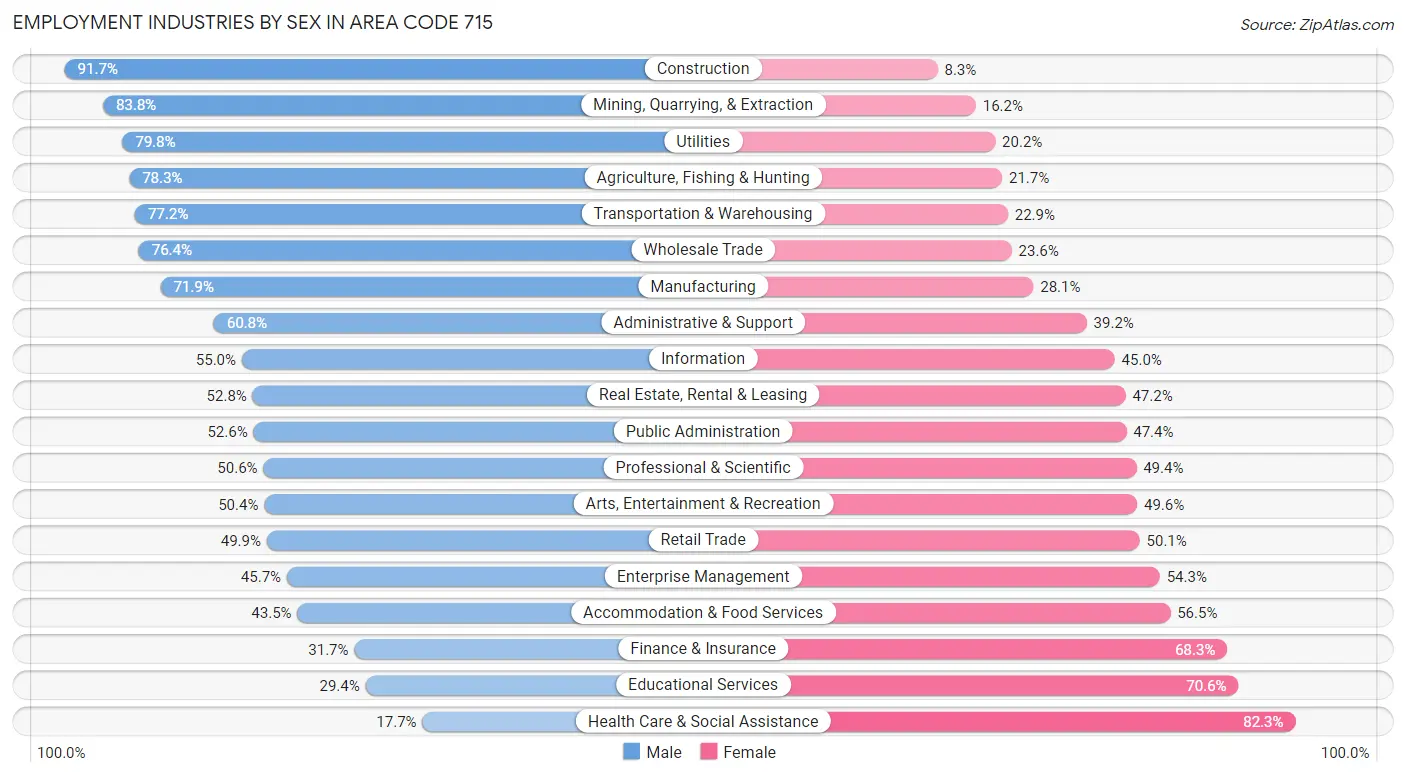
Employment Industries by Sex in Area Code 715
The Area Code 715 industries that see more men than women are Construction (91.7%), Mining, Quarrying, & Extraction (83.8%), and Utilities (79.8%), whereas the industries that tend to have a higher number of women are Health Care & Social Assistance (82.3%), Educational Services (70.6%), and Finance & Insurance (68.3%).
| Industry | Male | Female |
| Agriculture, Fishing & Hunting | 16,367 (78.3%) | 4,526 (21.7%) |
| Mining, Quarrying, & Extraction | 1,240 (83.8%) | 240 (16.2%) |
| Construction | 39,785 (91.7%) | 3,602 (8.3%) |
| Manufacturing | 86,609 (71.9%) | 33,892 (28.1%) |
| Wholesale Trade | 11,746 (76.4%) | 3,637 (23.6%) |
| Retail Trade | 37,903 (49.9%) | 38,105 (50.1%) |
| Transportation & Warehousing | 23,125 (77.1%) | 6,851 (22.9%) |
| Utilities | 3,632 (79.8%) | 921 (20.2%) |
| Information | 4,388 (55.0%) | 3,586 (45.0%) |
| Finance & Insurance | 9,537 (31.7%) | 20,511 (68.3%) |
| Real Estate, Rental & Leasing | 3,738 (52.8%) | 3,343 (47.2%) |
| Professional & Scientific | 11,441 (50.6%) | 11,185 (49.4%) |
| Enterprise Management | 314 (45.7%) | 373 (54.3%) |
| Administrative & Support | 10,689 (60.8%) | 6,884 (39.2%) |
| Educational Services | 14,579 (29.4%) | 34,958 (70.6%) |
| Health Care & Social Assistance | 17,215 (17.7%) | 80,268 (82.3%) |
| Arts, Entertainment & Recreation | 6,297 (50.4%) | 6,197 (49.6%) |
| Accommodation & Food Services | 17,169 (43.5%) | 22,272 (56.5%) |
| Public Administration | 11,873 (52.6%) | 10,690 (47.4%) |
| Total | 341,461 (52.7%) | 306,192 (47.3%) |
Education in Area Code 715
School Enrollment in Area Code 715
The most common levels of schooling among the 283,594 students in Area Code 715 are high school (63,602 | 22.4%), middle school (62,486 | 22.0%), and college / undergraduate (59,228 | 20.9%).
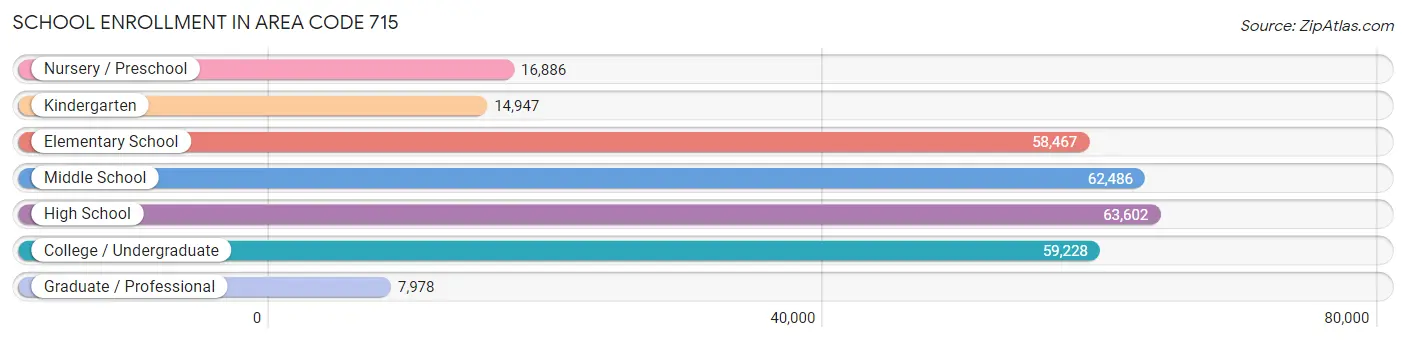
| School Level | # Students | % Students |
| Nursery / Preschool | 16,886 | 5.9% |
| Kindergarten | 14,947 | 5.3% |
| Elementary School | 58,467 | 20.6% |
| Middle School | 62,486 | 22.0% |
| High School | 63,602 | 22.4% |
| College / Undergraduate | 59,228 | 20.9% |
| Graduate / Professional | 7,978 | 2.8% |
| Total | 283,594 | 100.0% |
School Enrollment by Age by Funding Source in Area Code 715
Out of a total of 283,594 students who are enrolled in schools in Area Code 715, 34,381 (12.1%) attend a private institution, while the remaining 249,213 (87.9%) are enrolled in public schools. The age group of 3 to 4 year olds has the highest likelihood of being enrolled in private schools, with 2,583 (23.7% in the age bracket) enrolled. Conversely, the age group of 18 to 19 year olds has the lowest likelihood of being enrolled in a private school, with 22,900 (92.9% in the age bracket) attending a public institution.
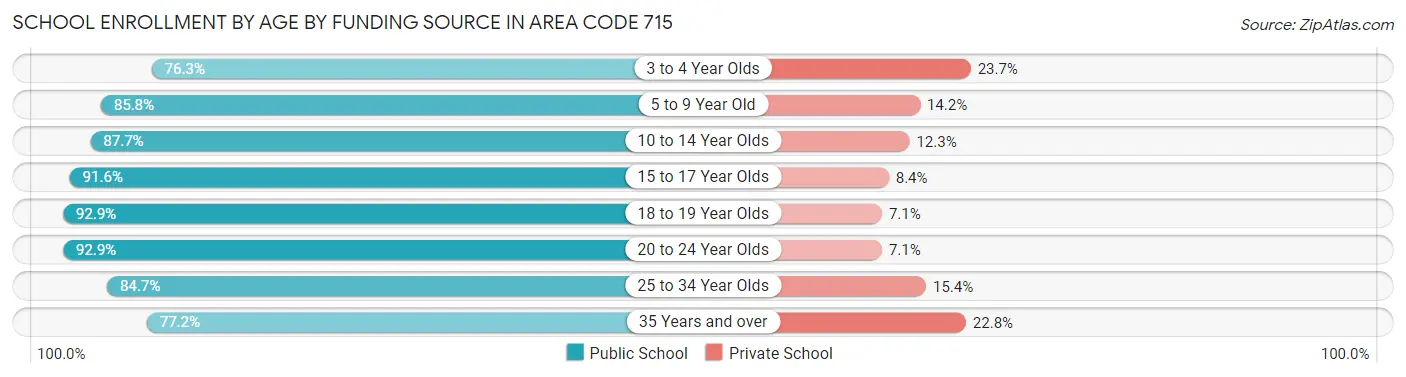
| Age Bracket | Public School | Private School |
| 3 to 4 Year Olds | 8,332 (76.3%) | 2,583 (23.7%) |
| 5 to 9 Year Old | 60,847 (85.8%) | 10,075 (14.2%) |
| 10 to 14 Year Olds | 67,895 (87.7%) | 9,484 (12.3%) |
| 15 to 17 Year Olds | 42,787 (91.6%) | 3,926 (8.4%) |
| 18 to 19 Year Olds | 22,900 (92.9%) | 1,760 (7.1%) |
| 20 to 24 Year Olds | 27,673 (92.9%) | 2,129 (7.1%) |
| 25 to 34 Year Olds | 9,828 (84.7%) | 1,782 (15.3%) |
| 35 Years and over | 8,953 (77.2%) | 2,640 (22.8%) |
| Total | 249,214 (87.9%) | 34,381 (12.1%) |
Educational Attainment by Field of Study in Area Code 715
Business (46,803 | 18.4%), education (45,734 | 18.0%), science & technology (30,983 | 12.2%), bio, nature & agricultural (23,712 | 9.3%), and arts & humanities (17,697 | 7.0%) are the most common fields of study among 254,407 individuals in Area Code 715 who have obtained a bachelor's degree or higher.
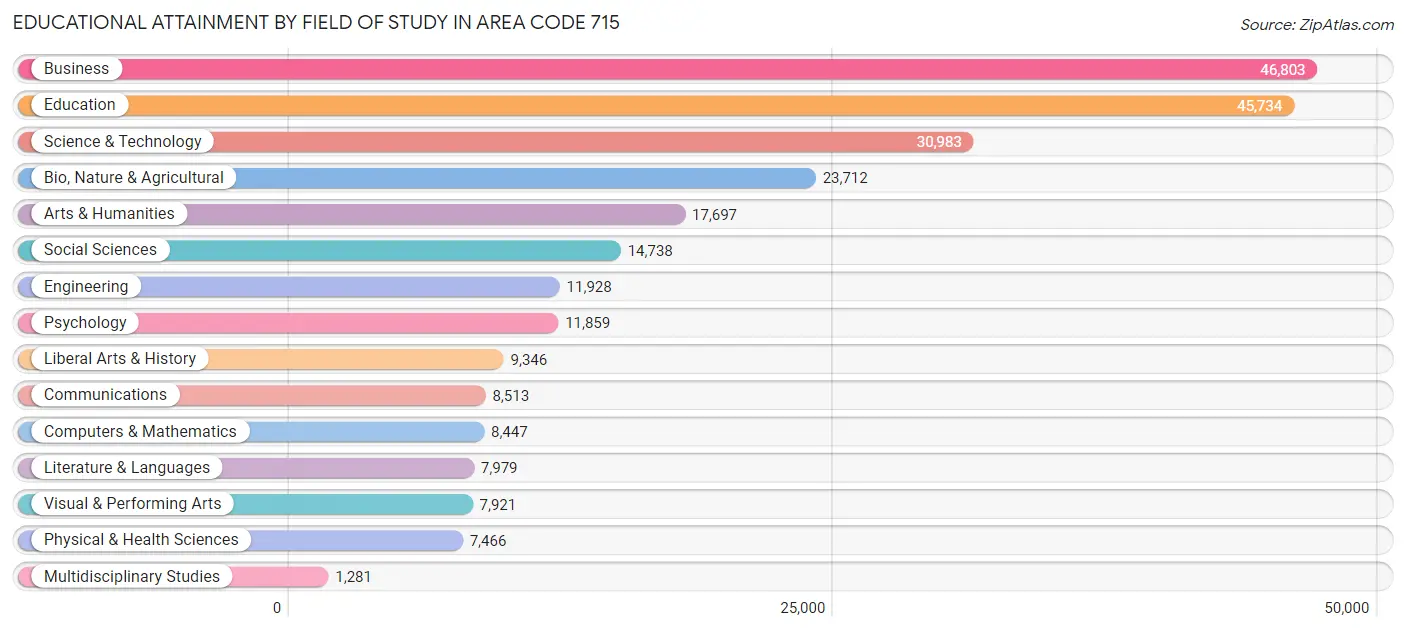
| Field of Study | # Graduates | % Graduates |
| Computers & Mathematics | 8,447 | 3.3% |
| Bio, Nature & Agricultural | 23,712 | 9.3% |
| Physical & Health Sciences | 7,466 | 2.9% |
| Psychology | 11,859 | 4.7% |
| Social Sciences | 14,738 | 5.8% |
| Engineering | 11,928 | 4.7% |
| Multidisciplinary Studies | 1,281 | 0.5% |
| Science & Technology | 30,983 | 12.2% |
| Business | 46,803 | 18.4% |
| Education | 45,734 | 18.0% |
| Literature & Languages | 7,979 | 3.1% |
| Liberal Arts & History | 9,346 | 3.7% |
| Visual & Performing Arts | 7,921 | 3.1% |
| Communications | 8,513 | 3.4% |
| Arts & Humanities | 17,697 | 7.0% |
| Total | 254,407 | 100.0% |
Transportation & Commute in Area Code 715
Vehicle Availability by Sex in Area Code 715
The most prevalent vehicle ownership categories in Area Code 715 are males with 2 vehicles (142,081, accounting for 42.7%) and females with 2 vehicles (123,024, making up 48.0%).
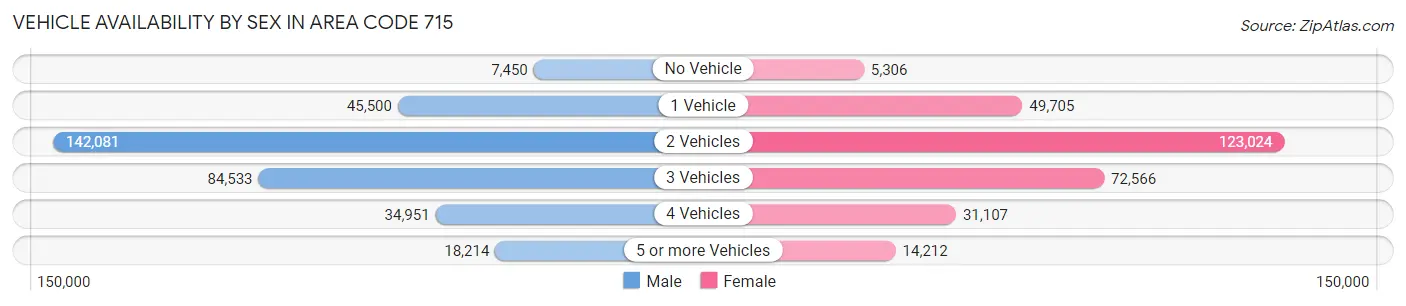
| Vehicles Available | Male | Female |
| No Vehicle | 7,450 (2.2%) | 5,306 (1.8%) |
| 1 Vehicle | 45,500 (13.7%) | 49,705 (16.8%) |
| 2 Vehicles | 142,081 (42.7%) | 123,024 (41.6%) |
| 3 Vehicles | 84,533 (25.4%) | 72,566 (24.5%) |
| 4 Vehicles | 34,951 (10.5%) | 31,107 (10.5%) |
| 5 or more Vehicles | 18,214 (5.5%) | 14,212 (4.8%) |
| Total | 332,729 (100.0%) | 295,920 (100.0%) |
Commute Time in Area Code 715
The most frequently occuring commute durations in Area Code 715 are 10 to 14 minutes (101,782 commuters, 17.6%), 5 to 9 minutes (95,864 commuters, 16.6%), and 15 to 19 minutes (93,870 commuters, 16.3%).
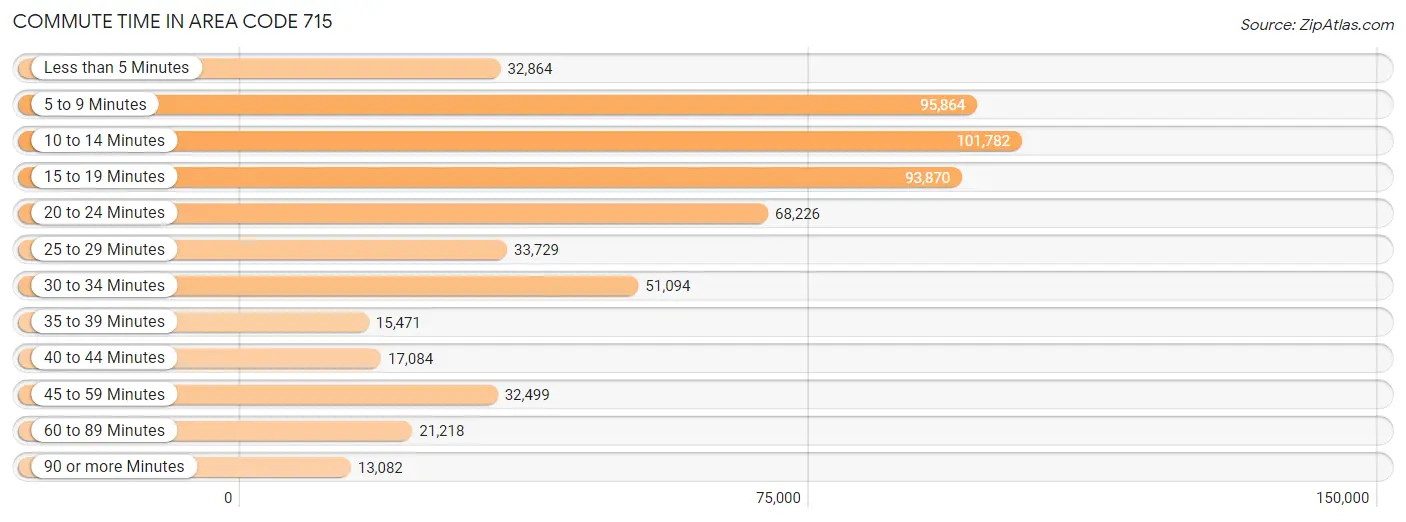
| Commute Time | # Commuters | % Commuters |
| Less than 5 Minutes | 32,864 | 5.7% |
| 5 to 9 Minutes | 95,864 | 16.6% |
| 10 to 14 Minutes | 101,782 | 17.6% |
| 15 to 19 Minutes | 93,870 | 16.3% |
| 20 to 24 Minutes | 68,226 | 11.8% |
| 25 to 29 Minutes | 33,729 | 5.9% |
| 30 to 34 Minutes | 51,094 | 8.9% |
| 35 to 39 Minutes | 15,471 | 2.7% |
| 40 to 44 Minutes | 17,084 | 3.0% |
| 45 to 59 Minutes | 32,499 | 5.6% |
| 60 to 89 Minutes | 21,218 | 3.7% |
| 90 or more Minutes | 13,082 | 2.3% |
Commute Time by Sex in Area Code 715
The most common commute times in Area Code 715 are 10 to 14 minutes (52,114 commuters, 16.9%) for males and 10 to 14 minutes (49,668 commuters, 18.6%) for females.
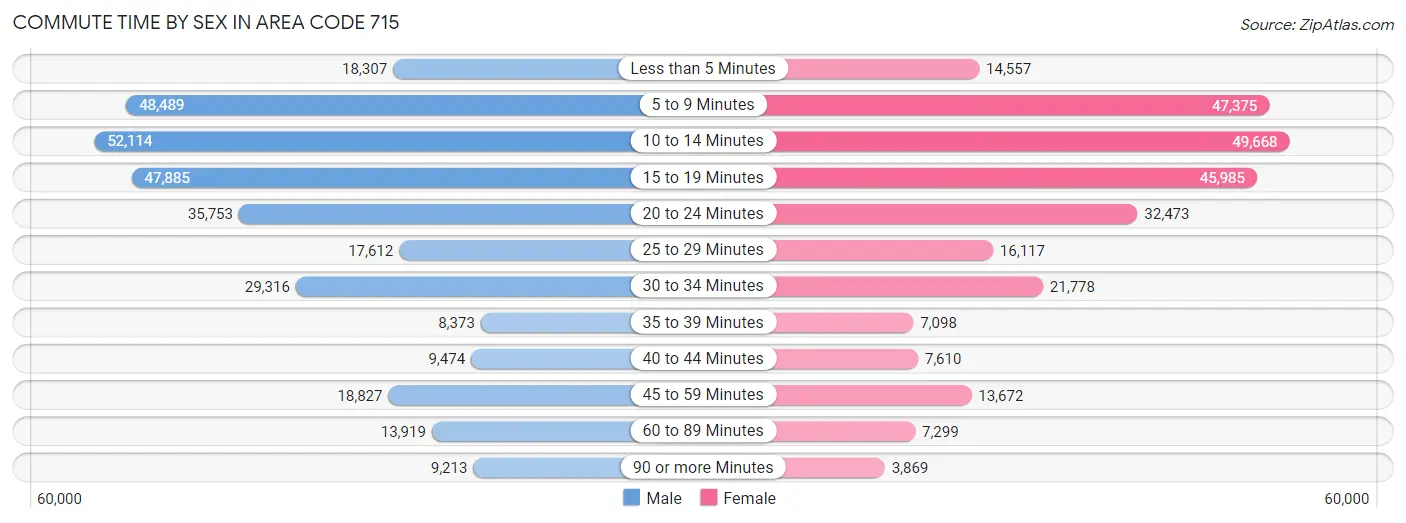
| Commute Time | Male | Female |
| Less than 5 Minutes | 18,307 (5.9%) | 14,557 (5.4%) |
| 5 to 9 Minutes | 48,489 (15.7%) | 47,375 (17.7%) |
| 10 to 14 Minutes | 52,114 (16.9%) | 49,668 (18.6%) |
| 15 to 19 Minutes | 47,885 (15.5%) | 45,985 (17.2%) |
| 20 to 24 Minutes | 35,753 (11.6%) | 32,473 (12.1%) |
| 25 to 29 Minutes | 17,612 (5.7%) | 16,117 (6.0%) |
| 30 to 34 Minutes | 29,316 (9.5%) | 21,778 (8.1%) |
| 35 to 39 Minutes | 8,373 (2.7%) | 7,098 (2.6%) |
| 40 to 44 Minutes | 9,474 (3.1%) | 7,610 (2.8%) |
| 45 to 59 Minutes | 18,827 (6.1%) | 13,672 (5.1%) |
| 60 to 89 Minutes | 13,919 (4.5%) | 7,299 (2.7%) |
| 90 or more Minutes | 9,213 (3.0%) | 3,869 (1.5%) |
Time of Departure to Work by Sex in Area Code 715
The most frequent times of departure to work in Area Code 715 are 7:00 AM to 7:29 AM (37,839, 12.2%) for males and 7:00 AM to 7:29 AM (42,216, 15.8%) for females.
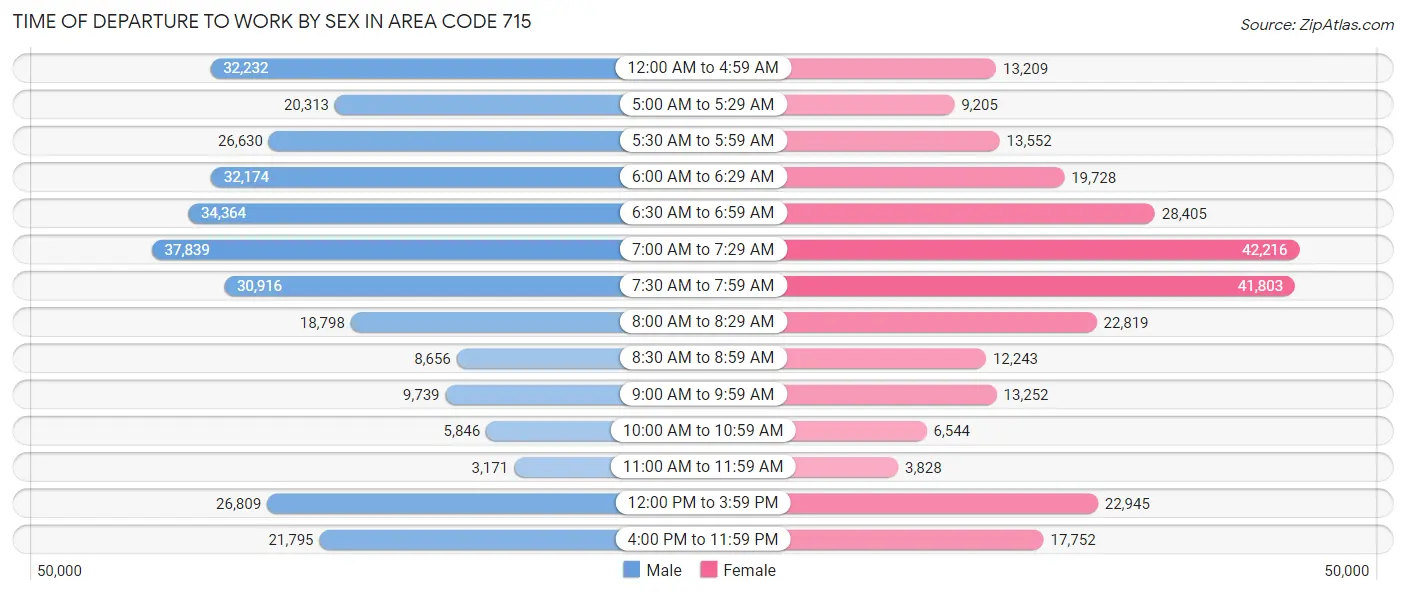
| Time of Departure | Male | Female |
| 12:00 AM to 4:59 AM | 32,232 (10.4%) | 13,209 (4.9%) |
| 5:00 AM to 5:29 AM | 20,313 (6.6%) | 9,205 (3.4%) |
| 5:30 AM to 5:59 AM | 26,630 (8.6%) | 13,552 (5.1%) |
| 6:00 AM to 6:29 AM | 32,174 (10.4%) | 19,728 (7.4%) |
| 6:30 AM to 6:59 AM | 34,364 (11.1%) | 28,405 (10.6%) |
| 7:00 AM to 7:29 AM | 37,839 (12.2%) | 42,216 (15.8%) |
| 7:30 AM to 7:59 AM | 30,916 (10.0%) | 41,803 (15.6%) |
| 8:00 AM to 8:29 AM | 18,798 (6.1%) | 22,819 (8.5%) |
| 8:30 AM to 8:59 AM | 8,656 (2.8%) | 12,243 (4.6%) |
| 9:00 AM to 9:59 AM | 9,739 (3.2%) | 13,252 (5.0%) |
| 10:00 AM to 10:59 AM | 5,846 (1.9%) | 6,544 (2.5%) |
| 11:00 AM to 11:59 AM | 3,171 (1.0%) | 3,828 (1.4%) |
| 12:00 PM to 3:59 PM | 26,809 (8.7%) | 22,945 (8.6%) |
| 4:00 PM to 11:59 PM | 21,795 (7.0%) | 17,752 (6.6%) |
| Total | 309,282 (100.0%) | 267,501 (100.0%) |
Housing Occupancy in Area Code 715
Occupancy by Ownership in Area Code 715
Of the total 538,053 dwellings in Area Code 715, owner-occupied units account for 395,875 (73.6%), while renter-occupied units make up 142,178 (26.4%).
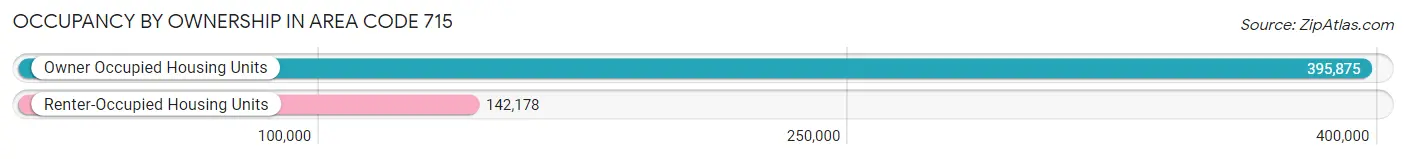
| Occupancy | # Housing Units | % Housing Units |
| Owner Occupied Housing Units | 395,875 | 73.6% |
| Renter-Occupied Housing Units | 142,178 | 26.4% |
| Total Occupied Housing Units | 538,053 | 100.0% |
Occupancy by Household Size in Area Code 715
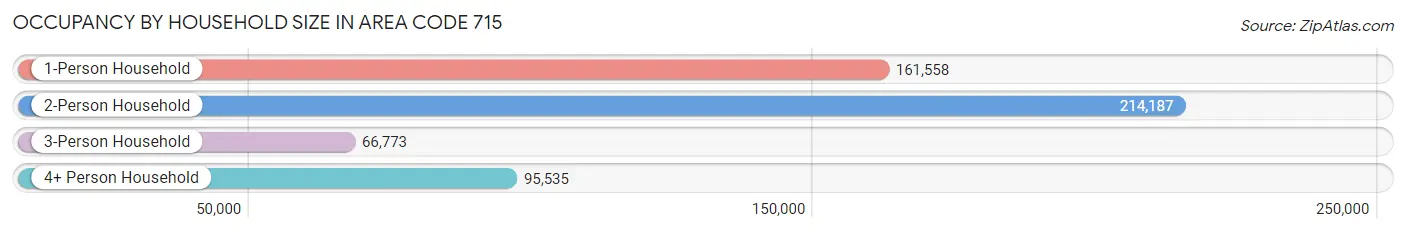
| Household Size | # Housing Units | % Housing Units |
| 1-Person Household | 161,558 | 30.0% |
| 2-Person Household | 214,187 | 39.8% |
| 3-Person Household | 66,773 | 12.4% |
| 4+ Person Household | 95,535 | 17.8% |
| Total Housing Units | 538,053 | 100.0% |
Occupancy by Ownership by Household Size in Area Code 715
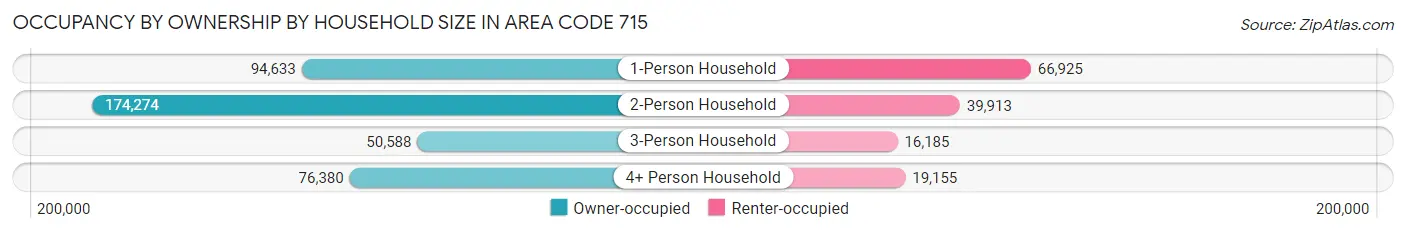
| Household Size | Owner-occupied | Renter-occupied |
| 1-Person Household | 94,633 (58.6%) | 66,925 (41.4%) |
| 2-Person Household | 174,274 (81.4%) | 39,913 (18.6%) |
| 3-Person Household | 50,588 (75.8%) | 16,185 (24.2%) |
| 4+ Person Household | 76,380 (79.9%) | 19,155 (20.1%) |
| Total Housing Units | 395,875 (73.6%) | 142,178 (26.4%) |
Occupancy by Educational Attainment in Area Code 715
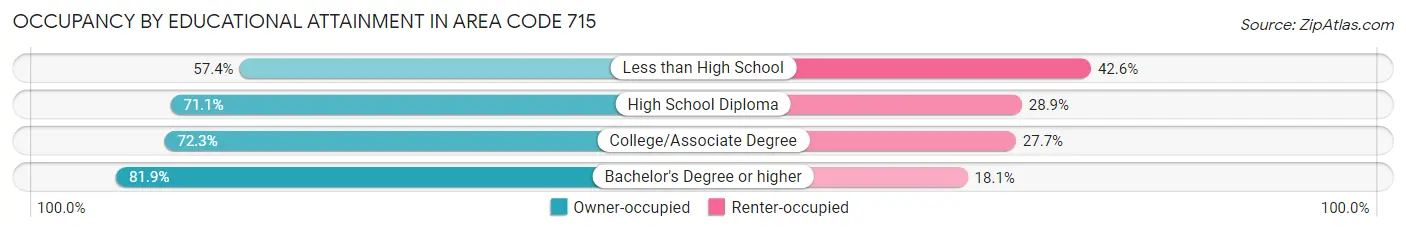
| Household Size | Owner-occupied | Renter-occupied |
| Less than High School | 19,083 (57.4%) | 14,157 (42.6%) |
| High School Diploma | 121,138 (71.1%) | 49,204 (28.9%) |
| College/Associate Degree | 137,212 (72.3%) | 52,564 (27.7%) |
| Bachelor's Degree or higher | 118,442 (81.9%) | 26,253 (18.1%) |
Occupancy by Age of Householder in Area Code 715
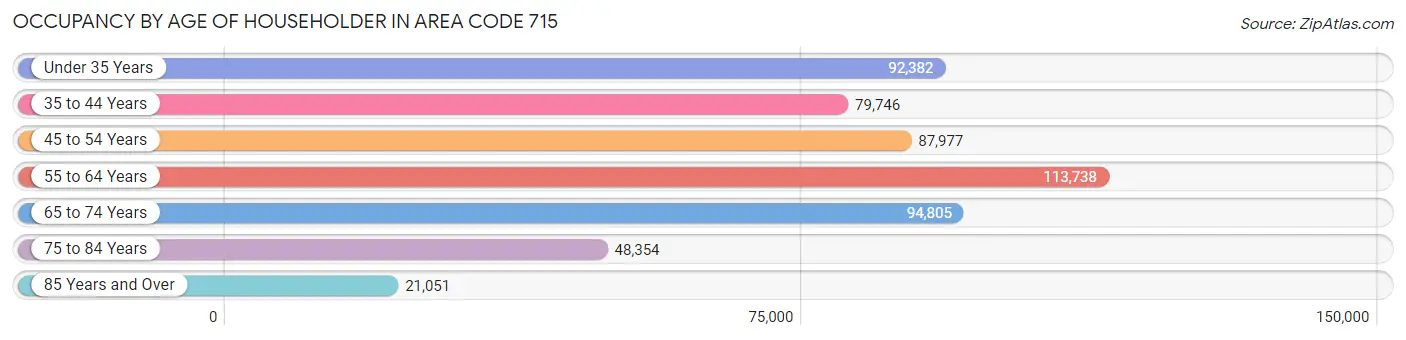
| Age Bracket | # Households | % Households |
| Under 35 Years | 92,382 | 17.2% |
| 35 to 44 Years | 79,746 | 14.8% |
| 45 to 54 Years | 87,977 | 16.4% |
| 55 to 64 Years | 113,738 | 21.1% |
| 65 to 74 Years | 94,805 | 17.6% |
| 75 to 84 Years | 48,354 | 9.0% |
| 85 Years and Over | 21,051 | 3.9% |
| Total | 538,053 | 100.0% |
Housing Finances in Area Code 715
Median Income by Occupancy in Area Code 715
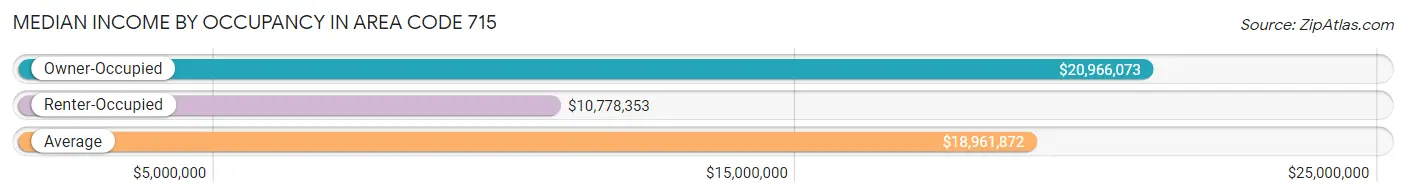
| Occupancy Type | # Households | Median Income |
| Owner-Occupied | 395,875 (73.6%) | $20,966,073 |
| Renter-Occupied | 142,178 (26.4%) | $10,778,353 |
| Average | 538,053 (100.0%) | $18,961,872 |
Occupancy by Householder Income Bracket in Area Code 715
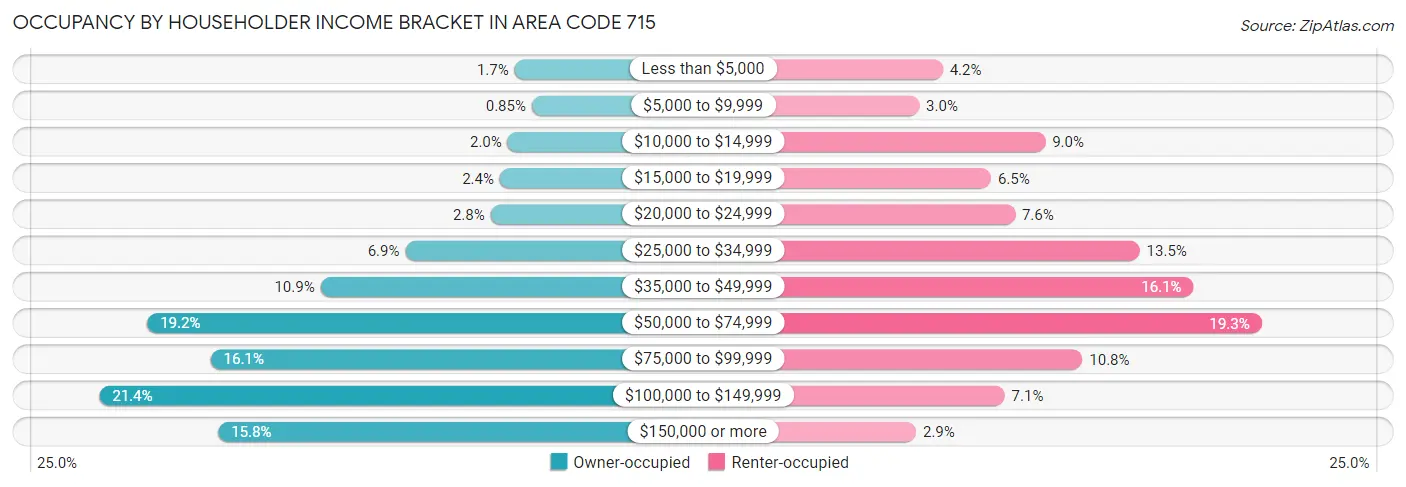
| Income Bracket | Owner-occupied | Renter-occupied |
| Less than $5,000 | 6,610 (1.7%) | 5,907 (4.2%) |
| $5,000 to $9,999 | 3,384 (0.9%) | 4,313 (3.0%) |
| $10,000 to $14,999 | 7,910 (2.0%) | 12,840 (9.0%) |
| $15,000 to $19,999 | 9,384 (2.4%) | 9,168 (6.5%) |
| $20,000 to $24,999 | 11,115 (2.8%) | 10,794 (7.6%) |
| $25,000 to $34,999 | 27,181 (6.9%) | 19,242 (13.5%) |
| $35,000 to $49,999 | 43,198 (10.9%) | 22,875 (16.1%) |
| $50,000 to $74,999 | 75,856 (19.2%) | 27,484 (19.3%) |
| $75,000 to $99,999 | 63,878 (16.1%) | 15,356 (10.8%) |
| $100,000 to $149,999 | 84,885 (21.4%) | 10,100 (7.1%) |
| $150,000 or more | 62,474 (15.8%) | 4,099 (2.9%) |
| Total | 395,875 (100.0%) | 142,178 (100.0%) |
Monthly Housing Cost Tiers in Area Code 715
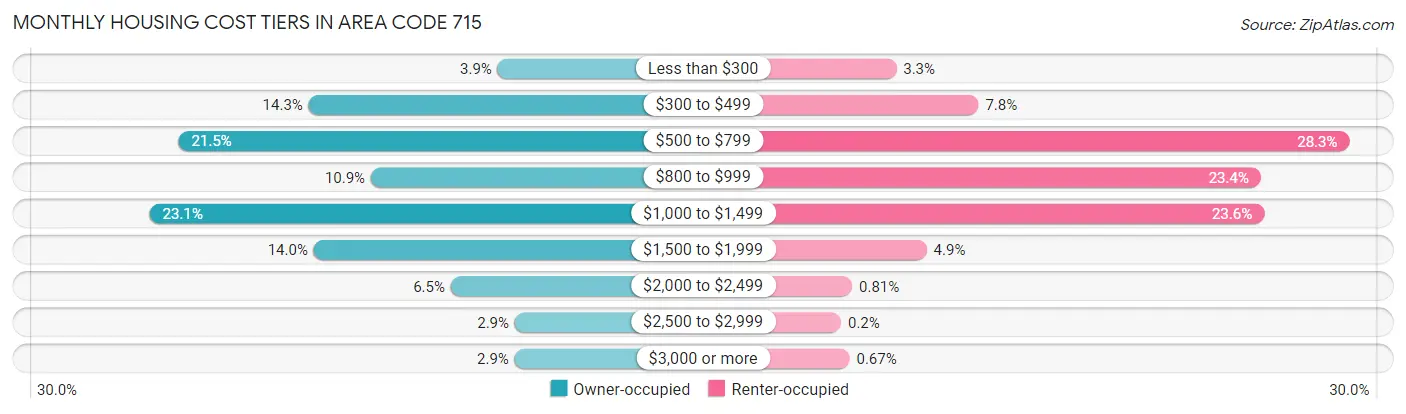
| Monthly Cost | Owner-occupied | Renter-occupied |
| Less than $300 | 15,324 (3.9%) | 4,618 (3.3%) |
| $300 to $499 | 56,648 (14.3%) | 11,070 (7.8%) |
| $500 to $799 | 85,125 (21.5%) | 40,193 (28.3%) |
| $800 to $999 | 43,033 (10.9%) | 33,237 (23.4%) |
| $1,000 to $1,499 | 91,446 (23.1%) | 33,495 (23.6%) |
| $1,500 to $1,999 | 55,558 (14.0%) | 7,004 (4.9%) |
| $2,000 to $2,499 | 25,584 (6.5%) | 1,151 (0.8%) |
| $2,500 to $2,999 | 11,575 (2.9%) | 289 (0.2%) |
| $3,000 or more | 11,582 (2.9%) | 954 (0.7%) |
| Total | 395,875 (100.0%) | 142,178 (100.0%) |
Physical Housing Characteristics in Area Code 715
Housing Structures in Area Code 715
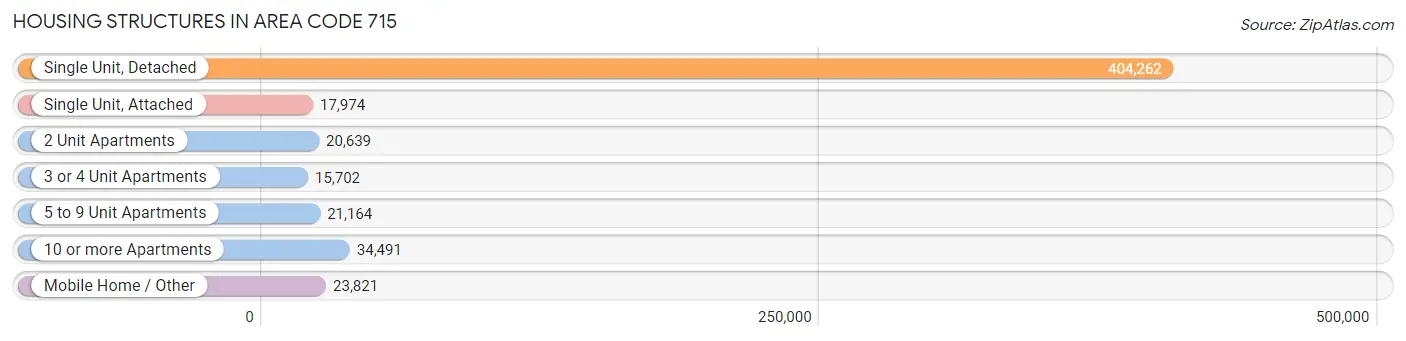
| Structure Type | # Housing Units | % Housing Units |
| Single Unit, Detached | 404,262 | 75.1% |
| Single Unit, Attached | 17,974 | 3.3% |
| 2 Unit Apartments | 20,639 | 3.8% |
| 3 or 4 Unit Apartments | 15,702 | 2.9% |
| 5 to 9 Unit Apartments | 21,164 | 3.9% |
| 10 or more Apartments | 34,491 | 6.4% |
| Mobile Home / Other | 23,821 | 4.4% |
| Total | 538,053 | 100.0% |
Housing Structures by Occupancy in Area Code 715
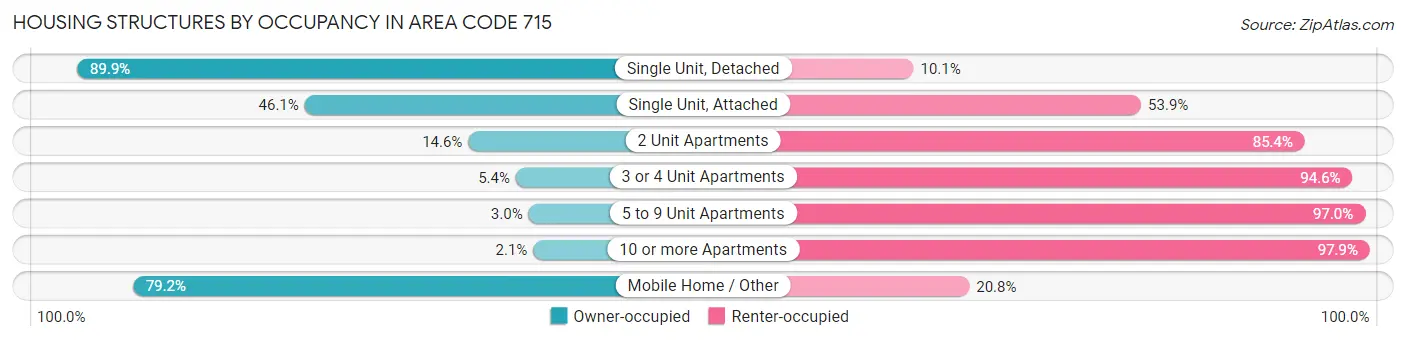
| Structure Type | Owner-occupied | Renter-occupied |
| Single Unit, Detached | 363,516 (89.9%) | 40,746 (10.1%) |
| Single Unit, Attached | 8,285 (46.1%) | 9,689 (53.9%) |
| 2 Unit Apartments | 3,011 (14.6%) | 17,628 (85.4%) |
| 3 or 4 Unit Apartments | 851 (5.4%) | 14,851 (94.6%) |
| 5 to 9 Unit Apartments | 631 (3.0%) | 20,533 (97.0%) |
| 10 or more Apartments | 719 (2.1%) | 33,772 (97.9%) |
| Mobile Home / Other | 18,862 (79.2%) | 4,959 (20.8%) |
| Total | 395,875 (73.6%) | 142,178 (26.4%) |
Housing Structures by Number of Rooms in Area Code 715
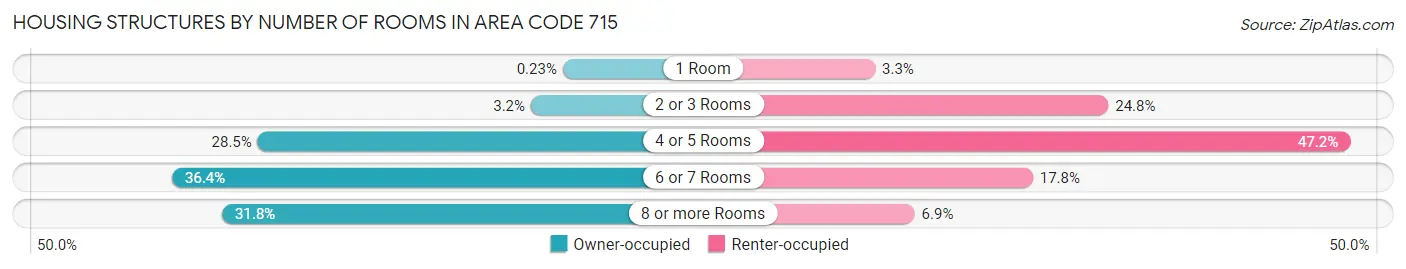
| Number of Rooms | Owner-occupied | Renter-occupied |
| 1 Room | 905 (0.2%) | 4,627 (3.3%) |
| 2 or 3 Rooms | 12,597 (3.2%) | 35,286 (24.8%) |
| 4 or 5 Rooms | 112,629 (28.4%) | 67,074 (47.2%) |
| 6 or 7 Rooms | 144,039 (36.4%) | 25,364 (17.8%) |
| 8 or more Rooms | 125,705 (31.8%) | 9,827 (6.9%) |
| Total | 395,875 (100.0%) | 142,178 (100.0%) |
Housing Structure by Heating Type in Area Code 715
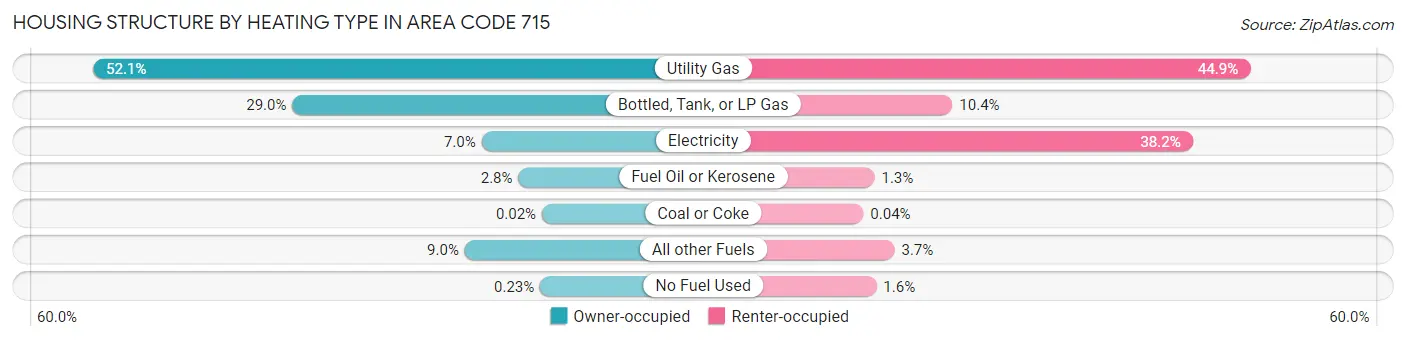
| Heating Type | Owner-occupied | Renter-occupied |
| Utility Gas | 206,058 (52.0%) | 63,800 (44.9%) |
| Bottled, Tank, or LP Gas | 114,654 (29.0%) | 14,732 (10.4%) |
| Electricity | 27,784 (7.0%) | 54,293 (38.2%) |
| Fuel Oil or Kerosene | 10,875 (2.8%) | 1,892 (1.3%) |
| Coal or Coke | 75 (0.0%) | 63 (0.0%) |
| All other Fuels | 35,509 (9.0%) | 5,194 (3.6%) |
| No Fuel Used | 920 (0.2%) | 2,204 (1.5%) |
| Total | 395,875 (100.0%) | 142,178 (100.0%) |
Household Vehicle Usage in Area Code 715
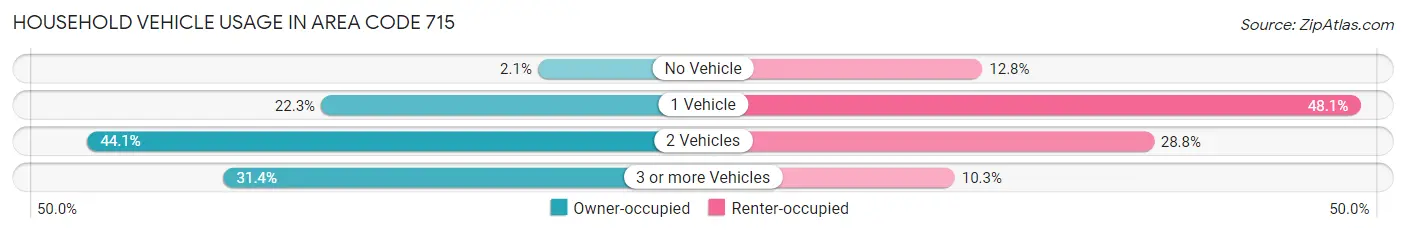
| Vehicles per Household | Owner-occupied | Renter-occupied |
| No Vehicle | 8,316 (2.1%) | 18,244 (12.8%) |
| 1 Vehicle | 88,457 (22.3%) | 68,359 (48.1%) |
| 2 Vehicles | 174,706 (44.1%) | 40,986 (28.8%) |
| 3 or more Vehicles | 124,396 (31.4%) | 14,589 (10.3%) |
| Total | 395,875 (100.0%) | 142,178 (100.0%) |
Real Estate & Mortgages in Area Code 715
Real Estate and Mortgage Overview in Area Code 715
| Characteristic | Without Mortgage | With Mortgage |
| Housing Units | 165,003 | 230,872 |
| Median Property Value | $50,260,800 | $56,640,800 |
| Median Household Income | $16,681,626 | $44,395 |
| Monthly Housing Costs | $148,872 | $11,312 |
| Real Estate Taxes | $687,558 | $2,581 |
Property Value by Mortgage Status in Area Code 715
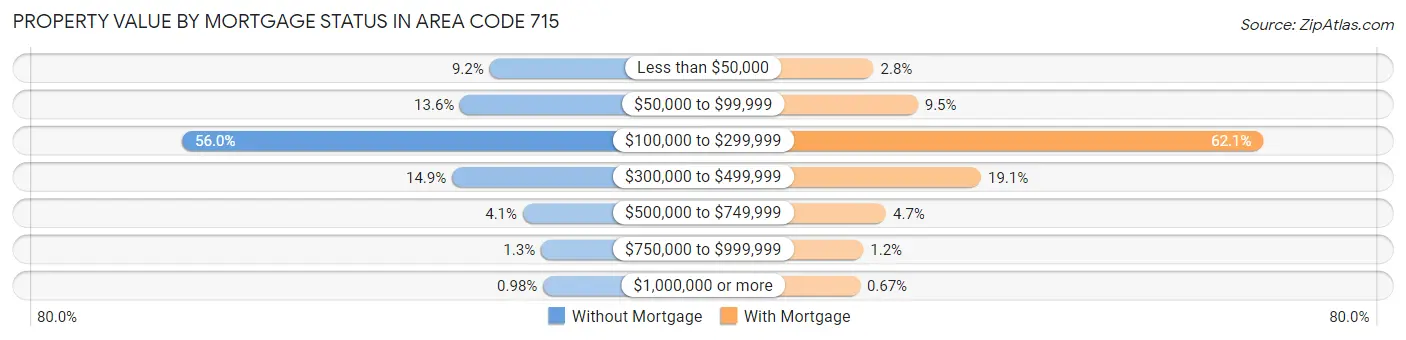
| Property Value | Without Mortgage | With Mortgage |
| Less than $50,000 | 15,095 (9.1%) | 6,346 (2.8%) |
| $50,000 to $99,999 | 22,491 (13.6%) | 21,887 (9.5%) |
| $100,000 to $299,999 | 92,386 (56.0%) | 143,443 (62.1%) |
| $300,000 to $499,999 | 24,533 (14.9%) | 44,168 (19.1%) |
| $500,000 to $749,999 | 6,722 (4.1%) | 10,743 (4.6%) |
| $750,000 to $999,999 | 2,154 (1.3%) | 2,736 (1.2%) |
| $1,000,000 or more | 1,622 (1.0%) | 1,549 (0.7%) |
| Total | 165,003 (100.0%) | 230,872 (100.0%) |
Household Income by Mortgage Status in Area Code 715
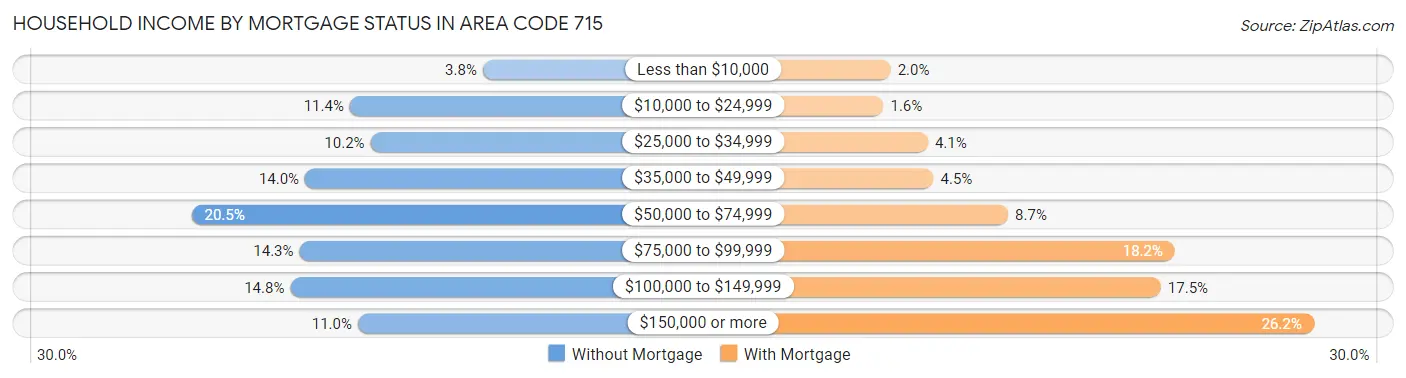
| Household Income | Without Mortgage | With Mortgage |
| Less than $10,000 | 6,304 (3.8%) | 4,640 (2.0%) |
| $10,000 to $24,999 | 18,849 (11.4%) | 3,690 (1.6%) |
| $25,000 to $34,999 | 16,895 (10.2%) | 9,560 (4.1%) |
| $35,000 to $49,999 | 23,071 (14.0%) | 10,286 (4.5%) |
| $50,000 to $74,999 | 33,756 (20.5%) | 20,127 (8.7%) |
| $75,000 to $99,999 | 23,601 (14.3%) | 42,100 (18.2%) |
| $100,000 to $149,999 | 24,448 (14.8%) | 40,277 (17.4%) |
| $150,000 or more | 18,079 (11.0%) | 60,437 (26.2%) |
| Total | 165,003 (100.0%) | 230,872 (100.0%) |
Property Value to Household Income Ratio in Area Code 715
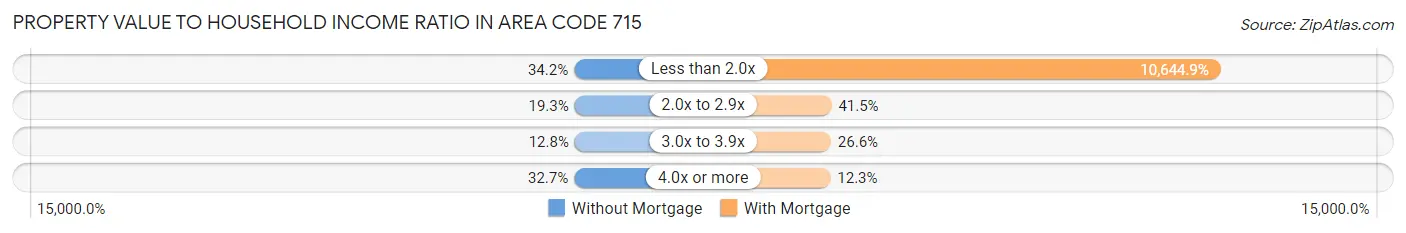
| Value-to-Income Ratio | Without Mortgage | With Mortgage |
| Less than 2.0x | 56,368 (34.2%) | 24,576,041 (10,644.9%) |
| 2.0x to 2.9x | 31,906 (19.3%) | 95,748 (41.5%) |
| 3.0x to 3.9x | 21,126 (12.8%) | 61,455 (26.6%) |
| 4.0x or more | 53,924 (32.7%) | 28,485 (12.3%) |
| Total | 165,003 (100.0%) | 230,872 (100.0%) |
Real Estate Taxes by Mortgage Status in Area Code 715
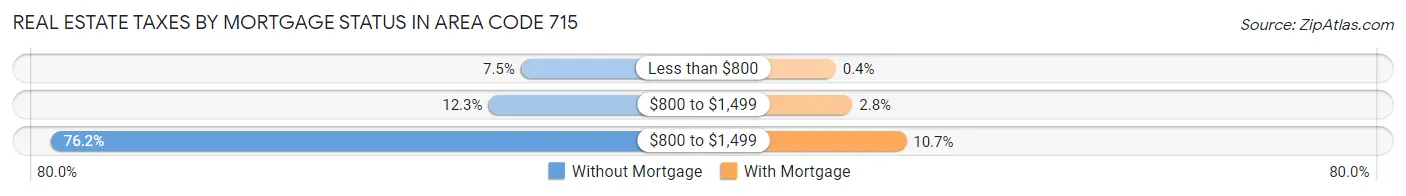
| Property Taxes | Without Mortgage | With Mortgage |
| Less than $800 | 12,413 (7.5%) | 916 (0.4%) |
| $800 to $1,499 | 20,209 (12.2%) | 6,521 (2.8%) |
| $800 to $1,499 | 125,665 (76.2%) | 24,693 (10.7%) |
| Total | 165,003 (100.0%) | 230,872 (100.0%) |
Health & Disability in Area Code 715
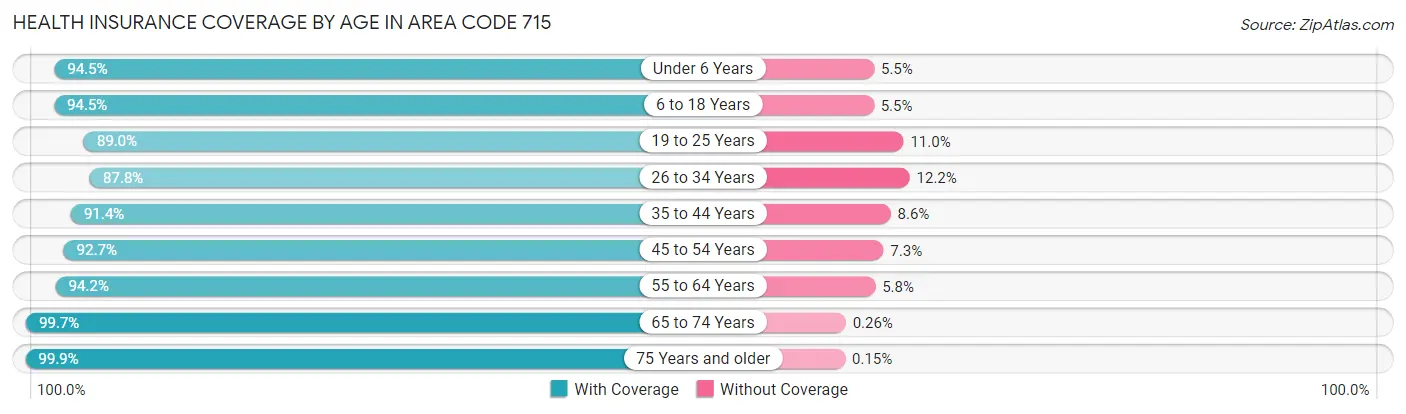
Health Insurance Coverage by Age in Area Code 715
| Age Bracket | With Coverage | Without Coverage |
| Under 6 Years | 78,520 (94.5%) | 4,607 (5.5%) |
| 6 to 18 Years | 195,229 (94.5%) | 11,315 (5.5%) |
| 19 to 25 Years | 100,958 (89.0%) | 12,534 (11.0%) |
| 26 to 34 Years | 113,426 (87.8%) | 15,726 (12.2%) |
| 35 to 44 Years | 136,096 (91.4%) | 12,866 (8.6%) |
| 45 to 54 Years | 144,966 (92.7%) | 11,402 (7.3%) |
| 55 to 64 Years | 183,943 (94.2%) | 11,271 (5.8%) |
| 65 to 74 Years | 150,938 (99.7%) | 390 (0.3%) |
| 75 Years and older | 99,915 (99.9%) | 151 (0.2%) |
| Total | 1,203,991 (93.8%) | 80,262 (6.2%) |
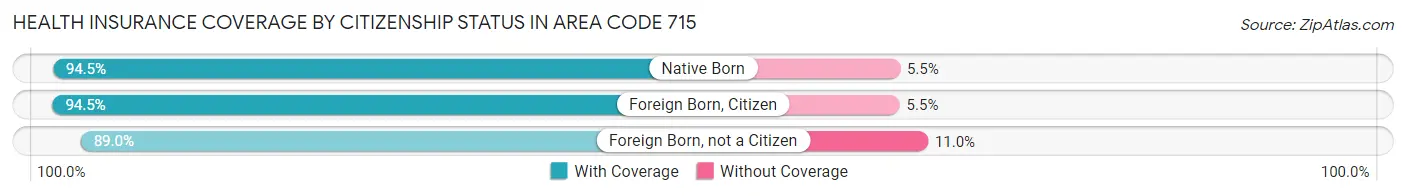
Health Insurance Coverage by Citizenship Status in Area Code 715
| Citizenship Status | With Coverage | Without Coverage |
| Native Born | 78,520 (94.5%) | 4,607 (5.5%) |
| Foreign Born, Citizen | 195,229 (94.5%) | 11,315 (5.5%) |
| Foreign Born, not a Citizen | 100,958 (89.0%) | 12,534 (11.0%) |
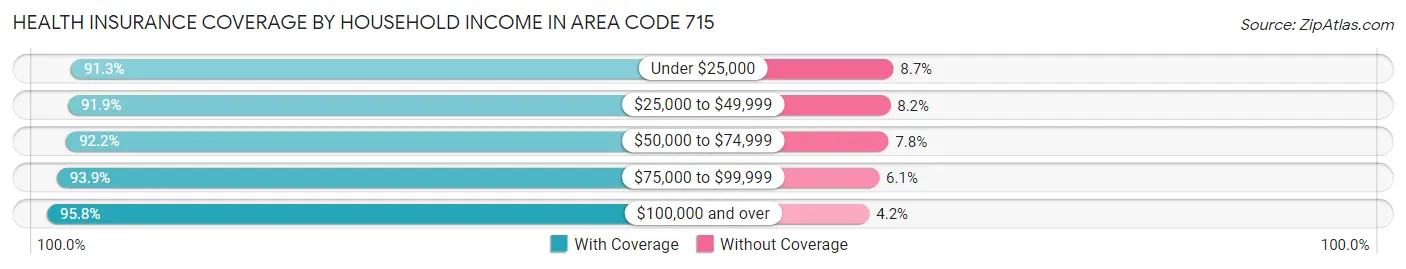
Health Insurance Coverage by Household Income in Area Code 715
| Household Income | With Coverage | Without Coverage |
| Under $25,000 | 114,578 (91.3%) | 10,941 (8.7%) |
| $25,000 to $49,999 | 192,094 (91.8%) | 17,043 (8.2%) |
| $50,000 to $74,999 | 211,060 (92.2%) | 17,870 (7.8%) |
| $75,000 to $99,999 | 194,579 (93.9%) | 12,558 (6.1%) |
| $100,000 and over | 475,287 (95.8%) | 21,005 (4.2%) |
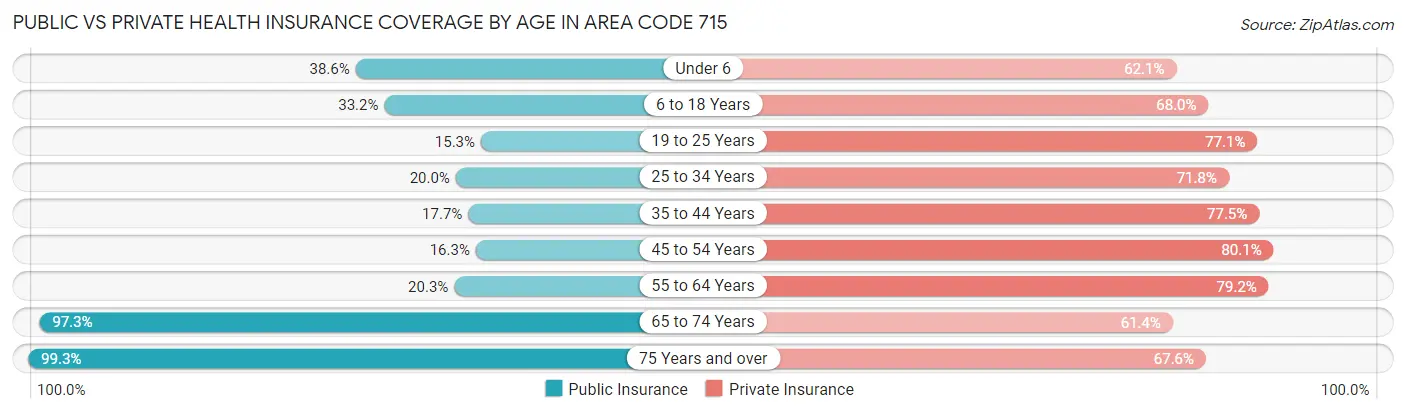
Public vs Private Health Insurance Coverage by Age in Area Code 715
| Age Bracket | Public Insurance | Private Insurance |
| Under 6 | 32,064 (38.6%) | 51,608 (62.1%) |
| 6 to 18 Years | 68,654 (33.2%) | 140,516 (68.0%) |
| 19 to 25 Years | 17,378 (15.3%) | 87,512 (77.1%) |
| 25 to 34 Years | 25,801 (20.0%) | 92,758 (71.8%) |
| 35 to 44 Years | 26,321 (17.7%) | 115,369 (77.4%) |
| 45 to 54 Years | 25,430 (16.3%) | 125,278 (80.1%) |
| 55 to 64 Years | 39,577 (20.3%) | 154,644 (79.2%) |
| 65 to 74 Years | 147,197 (97.3%) | 92,961 (61.4%) |
| 75 Years and over | 99,399 (99.3%) | 67,616 (67.6%) |
| Total | 481,821 (37.5%) | 928,262 (72.3%) |
Disability Status by Sex by Age in Area Code 715
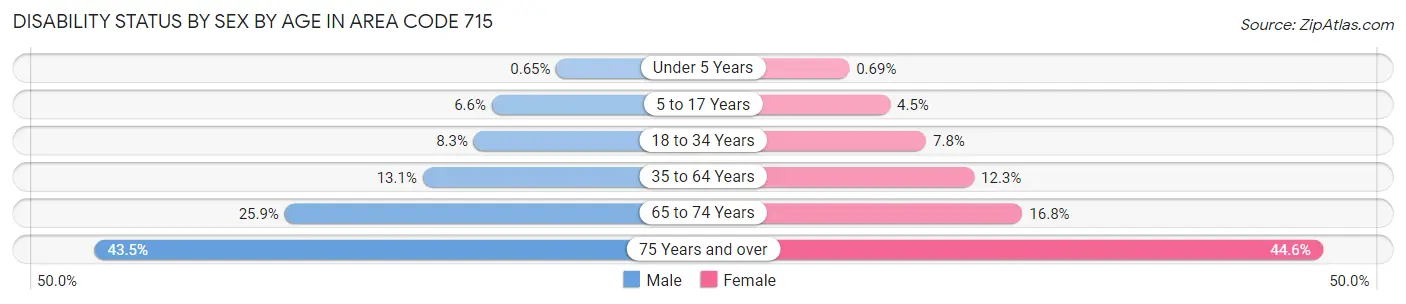
| Age Bracket | Male | Female |
| Under 5 Years | 230 (0.6%) | 229 (0.7%) |
| 5 to 17 Years | 6,935 (6.6%) | 4,415 (4.5%) |
| 18 to 34 Years | 11,107 (8.3%) | 9,959 (7.8%) |
| 35 to 64 Years | 33,299 (13.1%) | 30,137 (12.3%) |
| 65 to 74 Years | 19,734 (25.9%) | 12,572 (16.8%) |
| 75 Years and over | 19,288 (43.5%) | 24,866 (44.6%) |
Disability Class by Sex by Age in Area Code 715
Disability Class: Hearing Difficulty
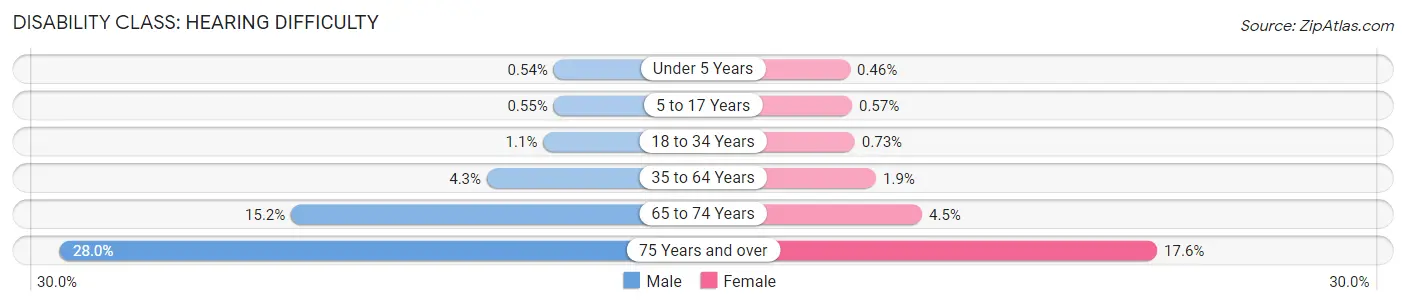
| Age Bracket | Male | Female |
| Under 5 Years | 189 (0.5%) | 152 (0.5%) |
| 5 to 17 Years | 578 (0.5%) | 565 (0.6%) |
| 18 to 34 Years | 1,492 (1.1%) | 935 (0.7%) |
| 35 to 64 Years | 10,874 (4.3%) | 4,685 (1.9%) |
| 65 to 74 Years | 11,573 (15.2%) | 3,356 (4.5%) |
| 75 Years and over | 12,425 (28.0%) | 9,784 (17.6%) |
Disability Class: Vision Difficulty
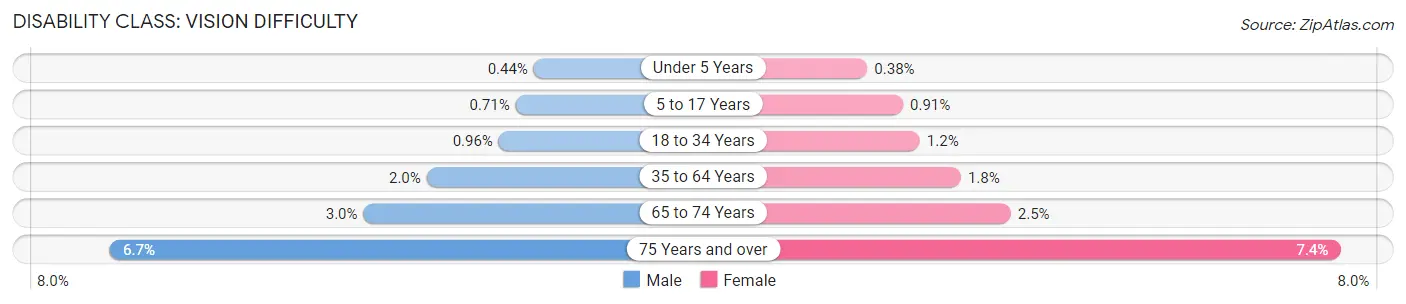
| Age Bracket | Male | Female |
| Under 5 Years | 155 (0.4%) | 127 (0.4%) |
| 5 to 17 Years | 739 (0.7%) | 898 (0.9%) |
| 18 to 34 Years | 1,289 (1.0%) | 1,473 (1.2%) |
| 35 to 64 Years | 5,183 (2.0%) | 4,346 (1.8%) |
| 65 to 74 Years | 2,268 (3.0%) | 1,886 (2.5%) |
| 75 Years and over | 2,984 (6.7%) | 4,126 (7.4%) |
Disability Class: Cognitive Difficulty
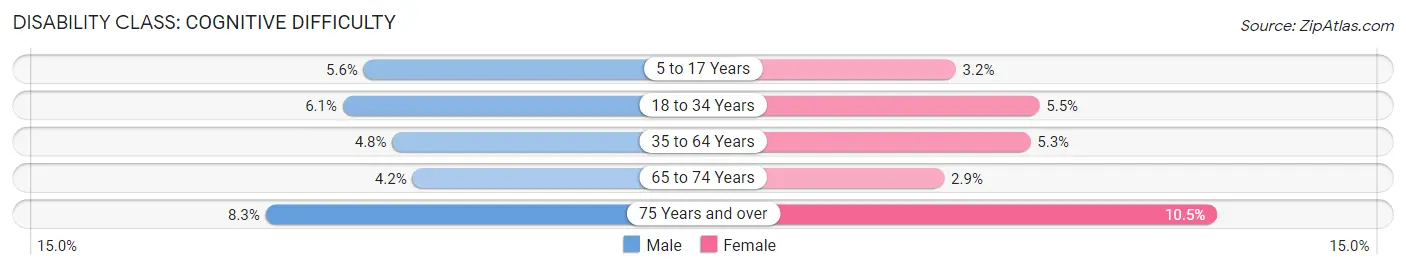
| Age Bracket | Male | Female |
| 5 to 17 Years | 5,812 (5.6%) | 3,125 (3.2%) |
| 18 to 34 Years | 8,200 (6.1%) | 7,005 (5.5%) |
| 35 to 64 Years | 12,145 (4.8%) | 12,895 (5.2%) |
| 65 to 74 Years | 3,204 (4.2%) | 2,140 (2.9%) |
| 75 Years and over | 3,676 (8.3%) | 5,822 (10.4%) |
Disability Class: Ambulatory Difficulty
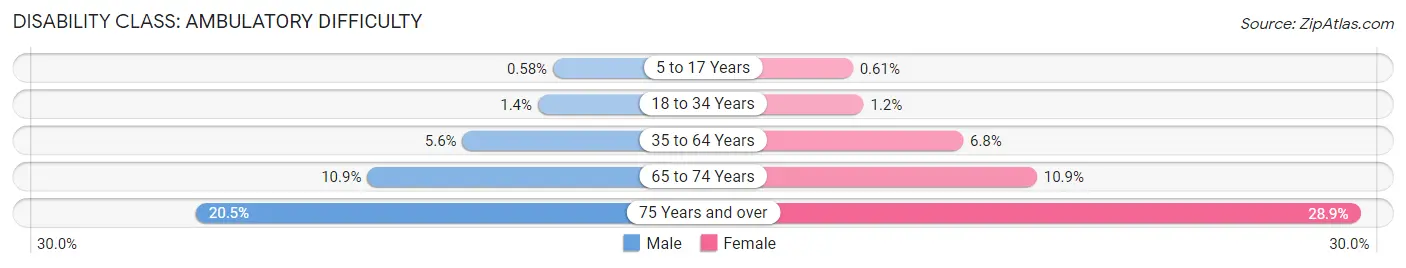
| Age Bracket | Male | Female |
| 5 to 17 Years | 608 (0.6%) | 604 (0.6%) |
| 18 to 34 Years | 1,898 (1.4%) | 1,539 (1.2%) |
| 35 to 64 Years | 14,333 (5.6%) | 16,559 (6.8%) |
| 65 to 74 Years | 8,337 (10.9%) | 8,143 (10.9%) |
| 75 Years and over | 9,073 (20.5%) | 16,089 (28.9%) |
Disability Class: Self-Care Difficulty
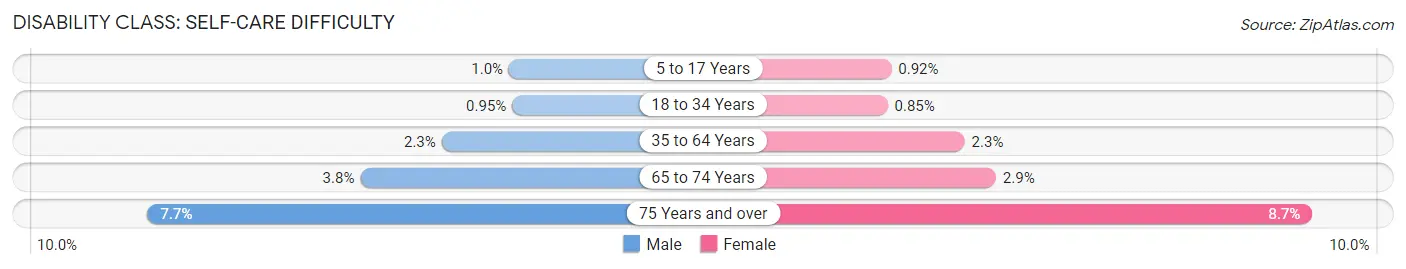
| Age Bracket | Male | Female |
| 5 to 17 Years | 1,054 (1.0%) | 903 (0.9%) |
| 18 to 34 Years | 1,264 (0.9%) | 1,080 (0.9%) |
| 35 to 64 Years | 5,764 (2.3%) | 5,584 (2.3%) |
| 65 to 74 Years | 2,881 (3.8%) | 2,142 (2.9%) |
| 75 Years and over | 3,423 (7.7%) | 4,866 (8.7%) |
Technology Access in Area Code 715
Computing Device Access in Area Code 715
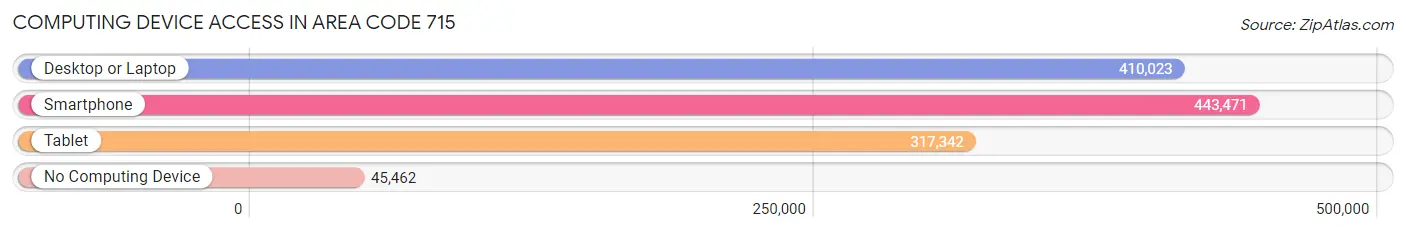
| Device Type | # Households | % Households |
| Desktop or Laptop | 410,023 | 76.2% |
| Smartphone | 443,471 | 82.4% |
| Tablet | 317,342 | 59.0% |
| No Computing Device | 45,462 | 8.5% |
| Total | 538,053 | 100.0% |
Internet Access in Area Code 715
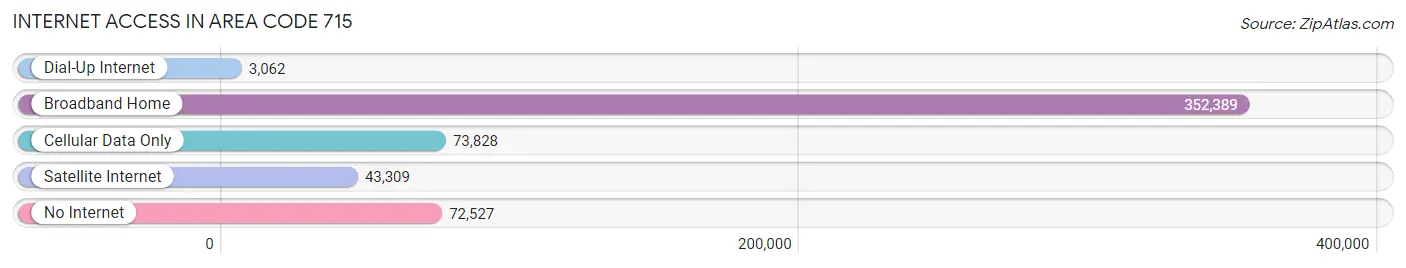
| Internet Type | # Households | % Households |
| Dial-Up Internet | 3,062 | 0.6% |
| Broadband Home | 352,389 | 65.5% |
| Cellular Data Only | 73,828 | 13.7% |
| Satellite Internet | 43,309 | 8.1% |
| No Internet | 72,527 | 13.5% |
| Total | 538,053 | 100.0% |
Area Code 715 Summary
Geography
Area code 715 is located in the north-central region of Wisconsin. It covers the entire state, except for the southeastern corner, which is covered by area code 262. The cities and towns in the 715 area code include Eau Claire, Wausau, Stevens Point, Marshfield, and Wisconsin Rapids.
Social
The 715 area code is home to a diverse population of people from all walks of life. The area is known for its strong sense of community and its friendly people. The area is also home to a variety of cultural events, such as the Eau Claire Jazz Festival and the Wausau Film Festival.
Economics
The 715 area code is home to a strong economy, with a variety of industries and businesses. The area is home to several large companies, such as 3M, Menards, and Wausau Paper. The area also has a thriving tourism industry, with many attractions such as the Wisconsin Dells and the Apostle Islands National Lakeshore.
Demographics
The 715 area code is home to a population of over 1.2 million people. The population is largely white, with a small percentage of African Americans, Hispanics, and Asians. The median household income is around $50,000, and the unemployment rate is around 4%. The area is also home to a variety of educational institutions, including the University of Wisconsin-Eau Claire and the University of Wisconsin-Stevens Point.
Common Questions
What is Per Capita Income in Area Code 715?
Per Capita income in Area Code 715 is $35,546.
What is the Median Family Income in Area Code 715?
Median Family Income in Area Code 715 is $81,328.
What is the Median Household income in Area Code 715?
Median Household Income in Area Code 715 is $67,003.
What is Income or Wage Gap in Area Code 715?
Income or Wage Gap in Area Code 715 is 30.1%.
Women in Area Code 715 earn 69.9 cents for every dollar earned by a man.
What is Family Income Deficit in Area Code 715?
Family Income Deficit in Area Code 715 is $10,198.
Families that are below poverty line in Area Code 715 earn $10,198 less on average than the poverty threshold level.
What is Inequality or Gini Index in Area Code 715?
Inequality or Gini Index in Area Code 715 is 115.19.
What is the Total Population of Area Code 715?
Total Population of Area Code 715 is 1,299,296.
What is the Total Male Population of Area Code 715?
Total Male Population of Area Code 715 is 658,307.
What is the Total Female Population of Area Code 715?
Total Female Population of Area Code 715 is 640,989.
What is the Ratio of Males per 100 Females in Area Code 715?
There are 102.70 Males per 100 Females in Area Code 715.
What is the Ratio of Females per 100 Males in Area Code 715?
There are 97.37 Females per 100 Males in Area Code 715.
What is the Median Population Age in Area Code 715?
Median Population Age in Area Code 715 is 46.9 Years.
What is the Average Family Size in Area Code 715
Average Family Size in Area Code 715 is 2.9 People.
What is the Average Household Size in Area Code 715
Average Household Size in Area Code 715 is 2.4 People.
How Large is the Labor Force in Area Code 715?
There are 634,436 People in the Labor Forcein in Area Code 715.
What is the Percentage of People in the Labor Force in Area Code 715?
59.8% of People are in the Labor Force in Area Code 715.
What is the Unemployment Rate in Area Code 715?
Unemployment Rate in Area Code 715 is 3.8%.