Spring Glen, UT Map & Demographics
Spring Glen Map
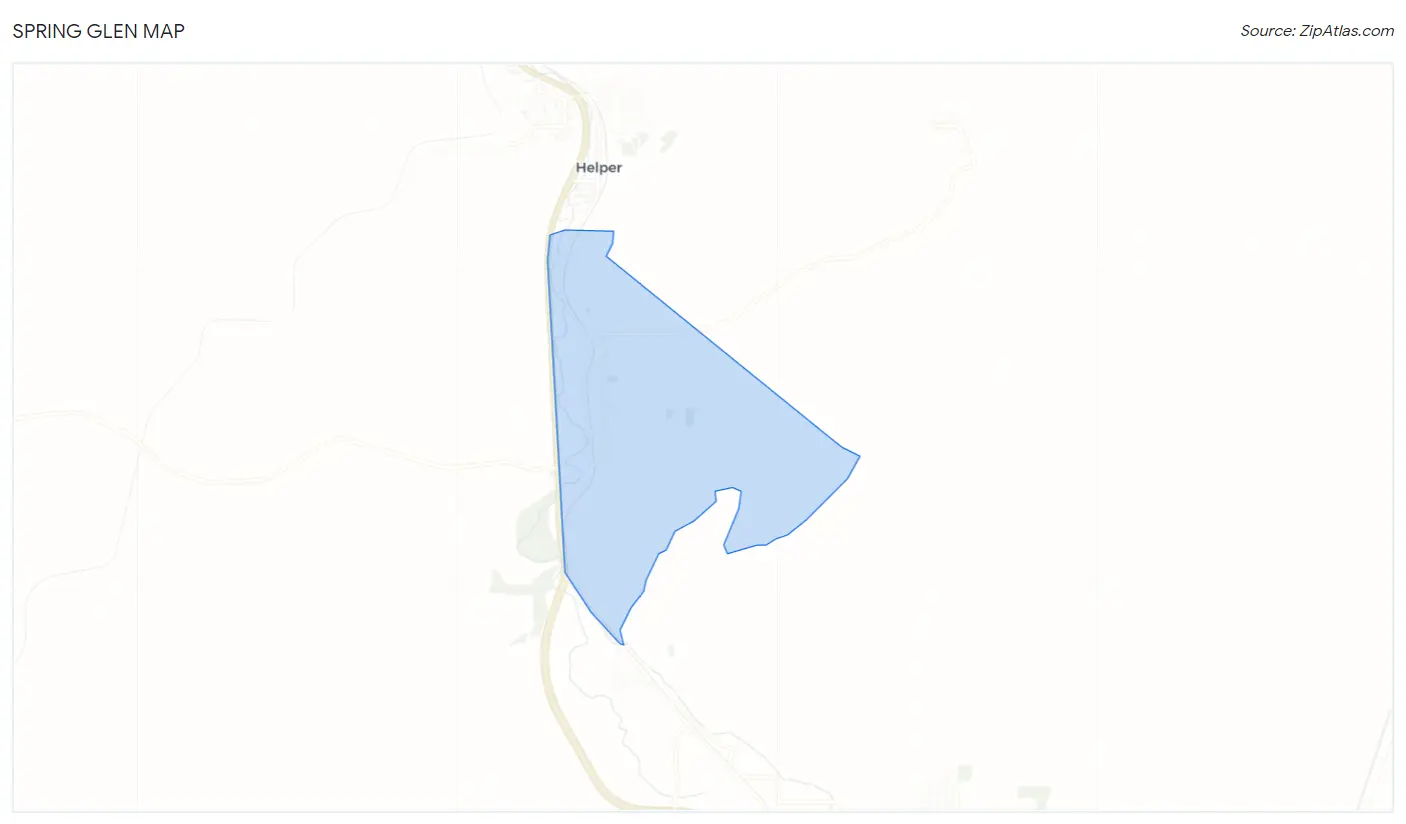
Spring Glen Overview
$27,111
PER CAPITA INCOME
$86,361
AVG FAMILY INCOME
$41,780
AVG HOUSEHOLD INCOME
0.44
INEQUALITY / GINI INDEX
1,070
TOTAL POPULATION
372
MALE POPULATION
698
FEMALE POPULATION
53.30
MALES / 100 FEMALES
187.63
FEMALES / 100 MALES
37.9
MEDIAN AGE
3.1
AVG FAMILY SIZE
2.2
AVG HOUSEHOLD SIZE
494
LABOR FORCE [ PEOPLE ]
63.5%
PERCENT IN LABOR FORCE
Income in Spring Glen
Income Overview in Spring Glen
Per Capita Income in Spring Glen is $27,111, while median incomes of families and households are $86,361 and $41,780 respectively.
| Characteristic | Number | Measure |
| Per Capita Income | 1,070 | $27,111 |
| Median Family Income | 285 | $86,361 |
| Mean Family Income | 285 | $86,583 |
| Median Household Income | 477 | $41,780 |
| Mean Household Income | 477 | $61,910 |
| Income Deficit | 285 | $0 |
| Wage / Income Gap (%) | 1,070 | 0.00% |
| Wage / Income Gap ($) | 1,070 | 100.00¢ per $1 |
| Gini / Inequality Index | 1,070 | 0.44 |
Earnings by Sex in Spring Glen
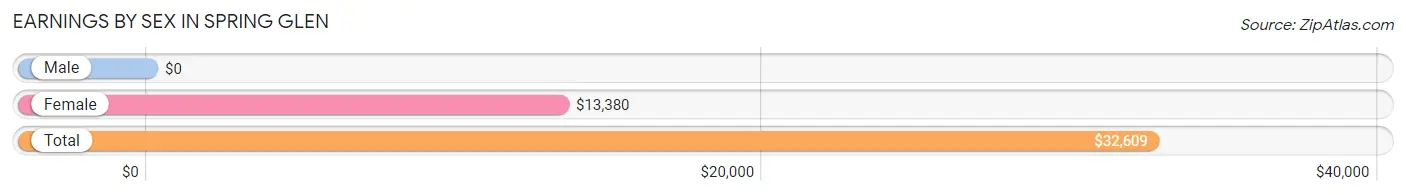
| Sex | Number | Average Earnings |
| Male | 234 (43.5%) | $0 |
| Female | 304 (56.5%) | $13,380 |
| Total | 538 (100.0%) | $32,609 |
Earnings by Sex by Income Bracket in Spring Glen
The most common earnings brackets in Spring Glen are $25,000 to $29,999 for men (67 | 28.6%) and $2,499 or less for women (75 | 24.7%).
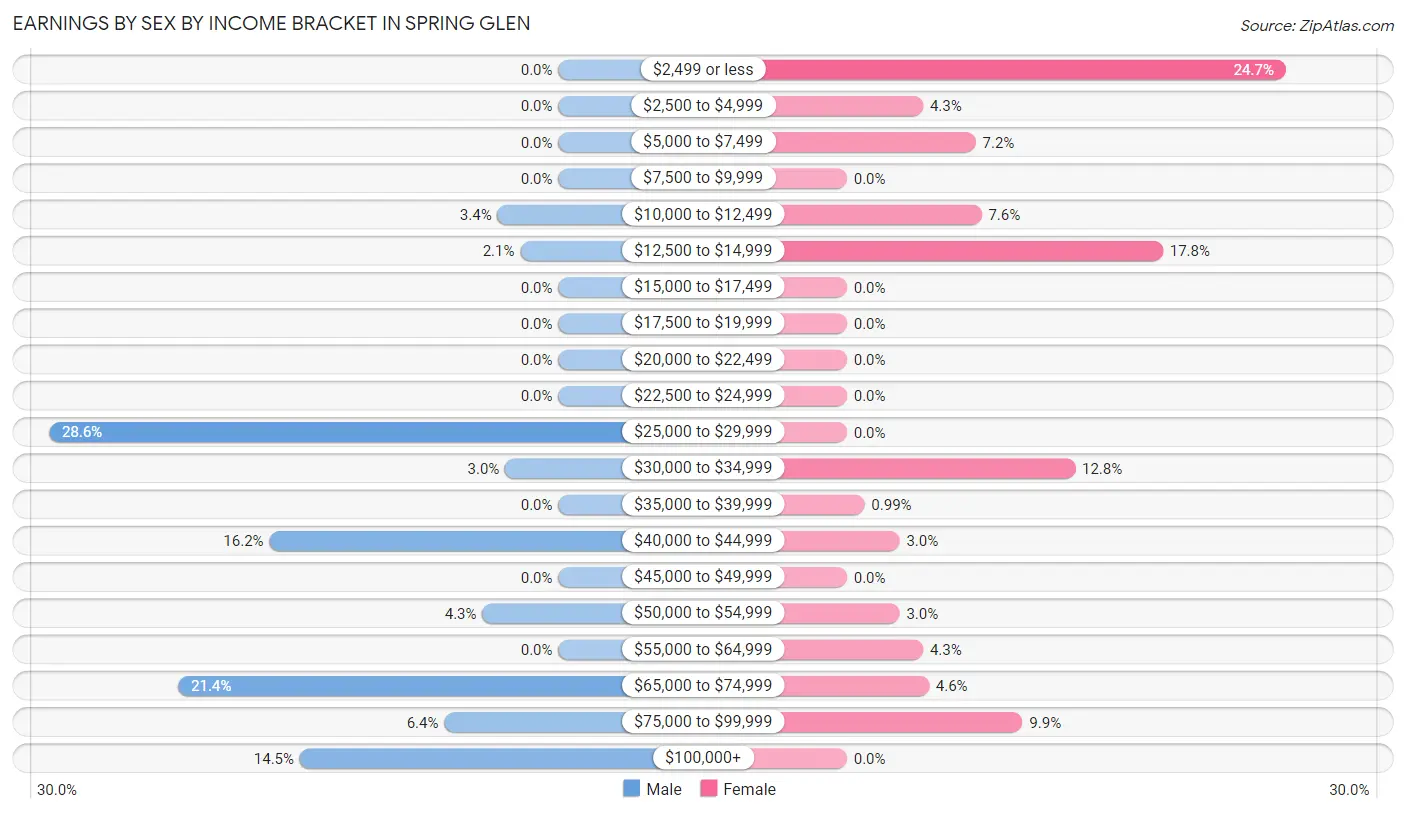
| Income | Male | Female |
| $2,499 or less | 0 (0.0%) | 75 (24.7%) |
| $2,500 to $4,999 | 0 (0.0%) | 13 (4.3%) |
| $5,000 to $7,499 | 0 (0.0%) | 22 (7.2%) |
| $7,500 to $9,999 | 0 (0.0%) | 0 (0.0%) |
| $10,000 to $12,499 | 8 (3.4%) | 23 (7.6%) |
| $12,500 to $14,999 | 5 (2.1%) | 54 (17.8%) |
| $15,000 to $17,499 | 0 (0.0%) | 0 (0.0%) |
| $17,500 to $19,999 | 0 (0.0%) | 0 (0.0%) |
| $20,000 to $22,499 | 0 (0.0%) | 0 (0.0%) |
| $22,500 to $24,999 | 0 (0.0%) | 0 (0.0%) |
| $25,000 to $29,999 | 67 (28.6%) | 0 (0.0%) |
| $30,000 to $34,999 | 7 (3.0%) | 39 (12.8%) |
| $35,000 to $39,999 | 0 (0.0%) | 3 (1.0%) |
| $40,000 to $44,999 | 38 (16.2%) | 9 (3.0%) |
| $45,000 to $49,999 | 0 (0.0%) | 0 (0.0%) |
| $50,000 to $54,999 | 10 (4.3%) | 9 (3.0%) |
| $55,000 to $64,999 | 0 (0.0%) | 13 (4.3%) |
| $65,000 to $74,999 | 50 (21.4%) | 14 (4.6%) |
| $75,000 to $99,999 | 15 (6.4%) | 30 (9.9%) |
| $100,000+ | 34 (14.5%) | 0 (0.0%) |
| Total | 234 (100.0%) | 304 (100.0%) |
Earnings by Sex by Educational Attainment in Spring Glen
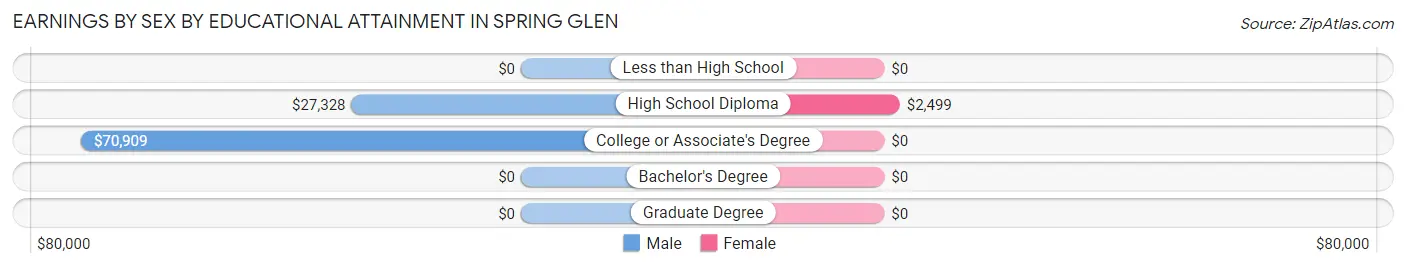
| Educational Attainment | Male Income | Female Income |
| Less than High School | - | - |
| High School Diploma | $27,328 | $2,499 |
| College or Associate's Degree | $70,909 | $0 |
| Bachelor's Degree | - | - |
| Graduate Degree | - | - |
| Total | - | - |
Family Income in Spring Glen
Family Income Brackets in Spring Glen
According to the Spring Glen family income data, there are 101 families falling into the $75,000 to $99,999 income range, which is the most common income bracket and makes up 35.4% of all families.
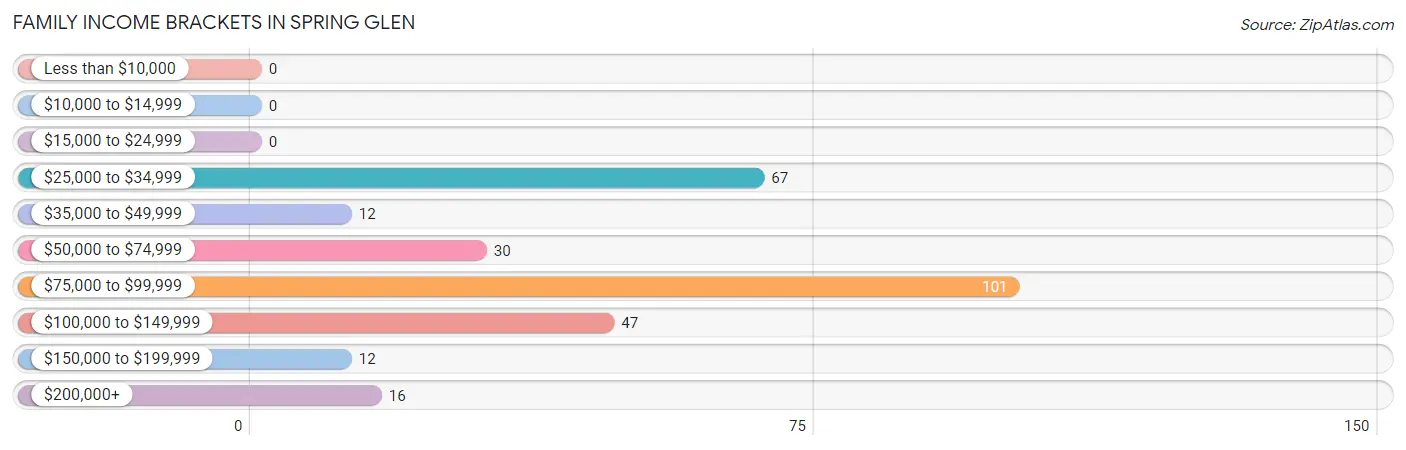
| Income Bracket | # Families | % Families |
| Less than $10,000 | 0 | 0.0% |
| $10,000 to $14,999 | 0 | 0.0% |
| $15,000 to $24,999 | 0 | 0.0% |
| $25,000 to $34,999 | 67 | 23.5% |
| $35,000 to $49,999 | 12 | 4.2% |
| $50,000 to $74,999 | 30 | 10.5% |
| $75,000 to $99,999 | 101 | 35.4% |
| $100,000 to $149,999 | 47 | 16.5% |
| $150,000 to $199,999 | 12 | 4.2% |
| $200,000+ | 16 | 5.6% |
Family Income by Famaliy Size in Spring Glen
2-person families (146 | 51.2%) account for the highest median family income in Spring Glen with $91,029 per family, while 2-person families (146 | 51.2%) have the highest median income of $45,514 per family member.
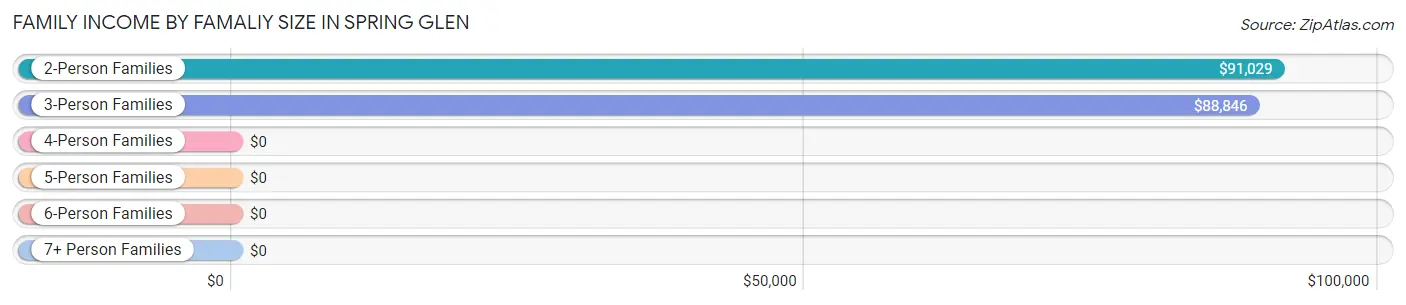
| Income Bracket | # Families | Median Income |
| 2-Person Families | 146 (51.2%) | $91,029 |
| 3-Person Families | 32 (11.2%) | $88,846 |
| 4-Person Families | 6 (2.1%) | $0 |
| 5-Person Families | 101 (35.4%) | $0 |
| 6-Person Families | 0 (0.0%) | $0 |
| 7+ Person Families | 0 (0.0%) | $0 |
| Total | 285 (100.0%) | $86,361 |
Family Income by Number of Earners in Spring Glen
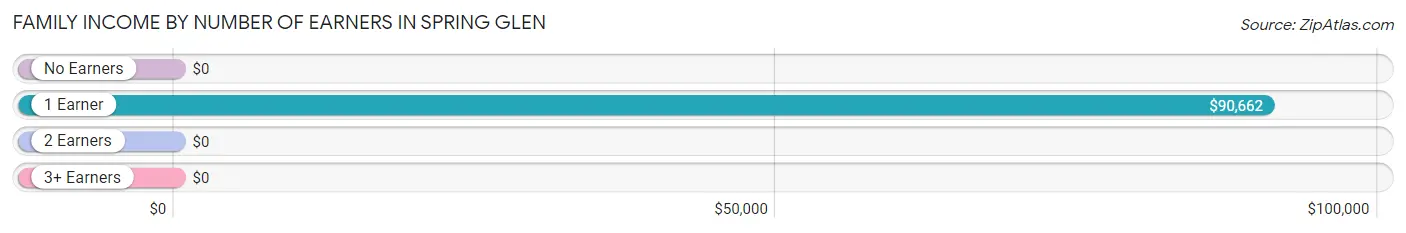
| Number of Earners | # Families | Median Income |
| No Earners | 27 (9.5%) | $0 |
| 1 Earner | 90 (31.6%) | $90,662 |
| 2 Earners | 152 (53.3%) | $0 |
| 3+ Earners | 16 (5.6%) | $0 |
| Total | 285 (100.0%) | $86,361 |
Household Income in Spring Glen
Household Income Brackets in Spring Glen
With 116 households falling in the category, the $25,000 to $34,999 income range is the most frequent in Spring Glen, accounting for 24.3% of all households.
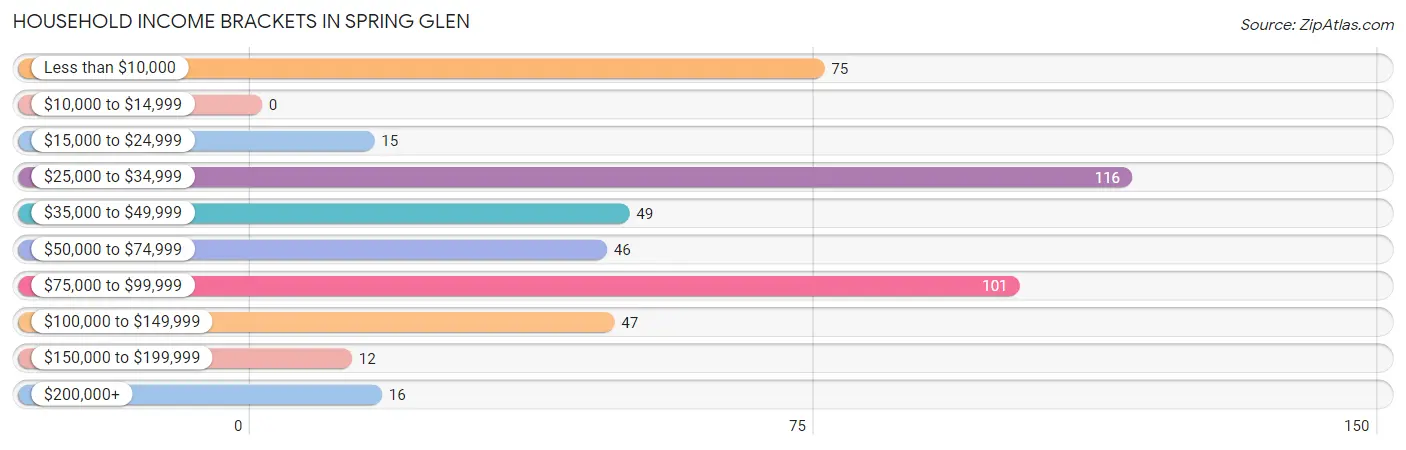
| Income Bracket | # Households | % Households |
| Less than $10,000 | 75 | 15.7% |
| $10,000 to $14,999 | 0 | 0.0% |
| $15,000 to $24,999 | 15 | 3.1% |
| $25,000 to $34,999 | 116 | 24.3% |
| $35,000 to $49,999 | 49 | 10.3% |
| $50,000 to $74,999 | 46 | 9.6% |
| $75,000 to $99,999 | 101 | 21.2% |
| $100,000 to $149,999 | 47 | 9.9% |
| $150,000 to $199,999 | 12 | 2.5% |
| $200,000+ | 16 | 3.4% |
Household Income by Householder Age in Spring Glen
The median household income in Spring Glen is $41,780, with the highest median household income of $70,060 found in the 65+ years age bracket for the primary householder. A total of 109 households (22.9%) fall into this category.
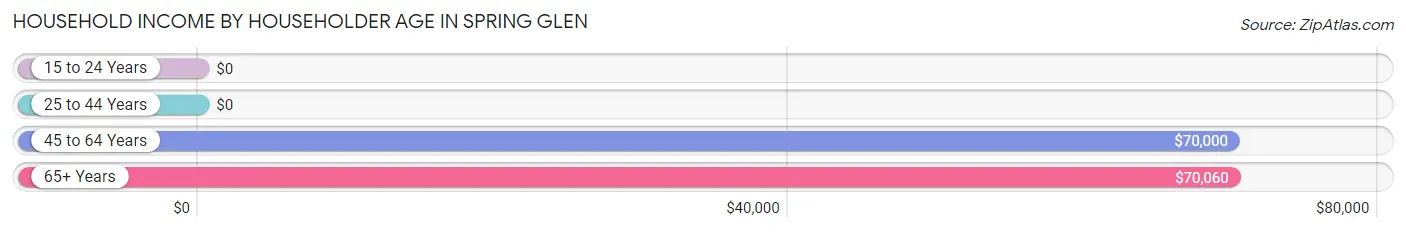
| Income Bracket | # Households | Median Income |
| 15 to 24 Years | 0 (0.0%) | $0 |
| 25 to 44 Years | 182 (38.2%) | $0 |
| 45 to 64 Years | 186 (39.0%) | $70,000 |
| 65+ Years | 109 (22.9%) | $70,060 |
| Total | 477 (100.0%) | $41,780 |
Poverty in Spring Glen
Income Below Poverty by Sex and Age in Spring Glen
With 27.4% poverty level for males and 36.7% for females among the residents of Spring Glen, 25 to 34 year old males and 15 year old females are the most vulnerable to poverty, with 58 males (100.0%) and 51 females (100.0%) in their respective age groups living below the poverty level.
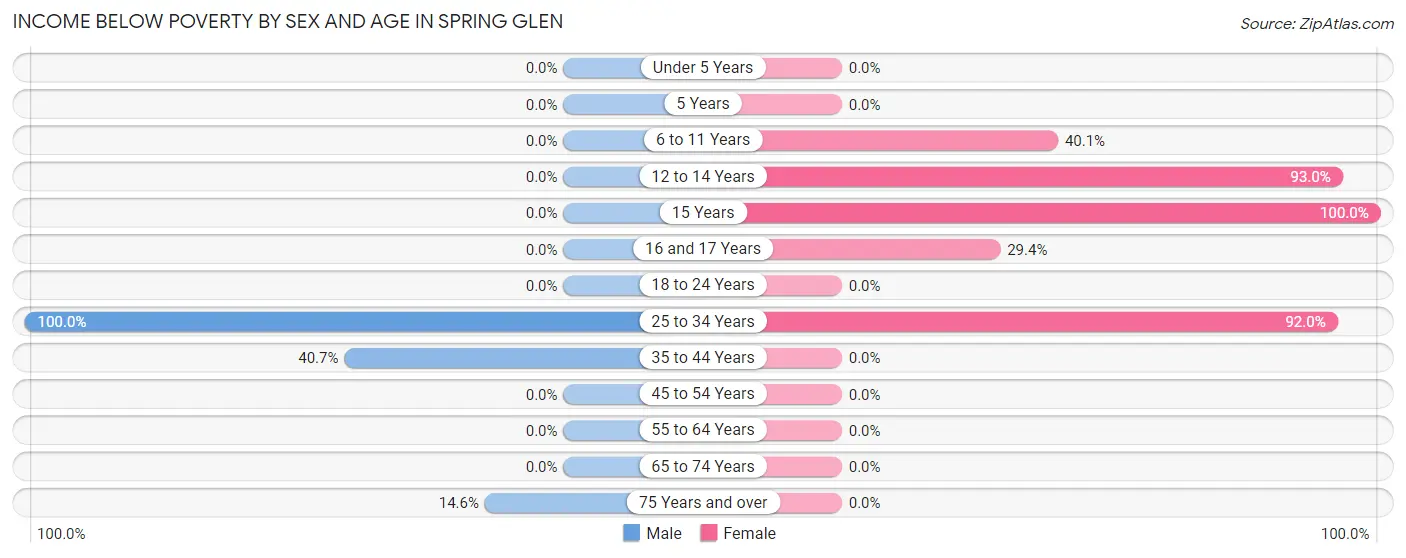
| Age Bracket | Male | Female |
| Under 5 Years | 0 (0.0%) | 0 (0.0%) |
| 5 Years | 0 (0.0%) | 0 (0.0%) |
| 6 to 11 Years | 0 (0.0%) | 65 (40.1%) |
| 12 to 14 Years | 0 (0.0%) | 66 (93.0%) |
| 15 Years | 0 (0.0%) | 51 (100.0%) |
| 16 and 17 Years | 0 (0.0%) | 5 (29.4%) |
| 18 to 24 Years | 0 (0.0%) | 0 (0.0%) |
| 25 to 34 Years | 58 (100.0%) | 69 (92.0%) |
| 35 to 44 Years | 37 (40.7%) | 0 (0.0%) |
| 45 to 54 Years | 0 (0.0%) | 0 (0.0%) |
| 55 to 64 Years | 0 (0.0%) | 0 (0.0%) |
| 65 to 74 Years | 0 (0.0%) | 0 (0.0%) |
| 75 Years and over | 7 (14.6%) | 0 (0.0%) |
| Total | 102 (27.4%) | 256 (36.7%) |
Income Above Poverty by Sex and Age in Spring Glen
According to the poverty statistics in Spring Glen, males aged under 5 years and females aged 18 to 24 years are the age groups that are most secure financially, with 100.0% of males and 100.0% of females in these age groups living above the poverty line.
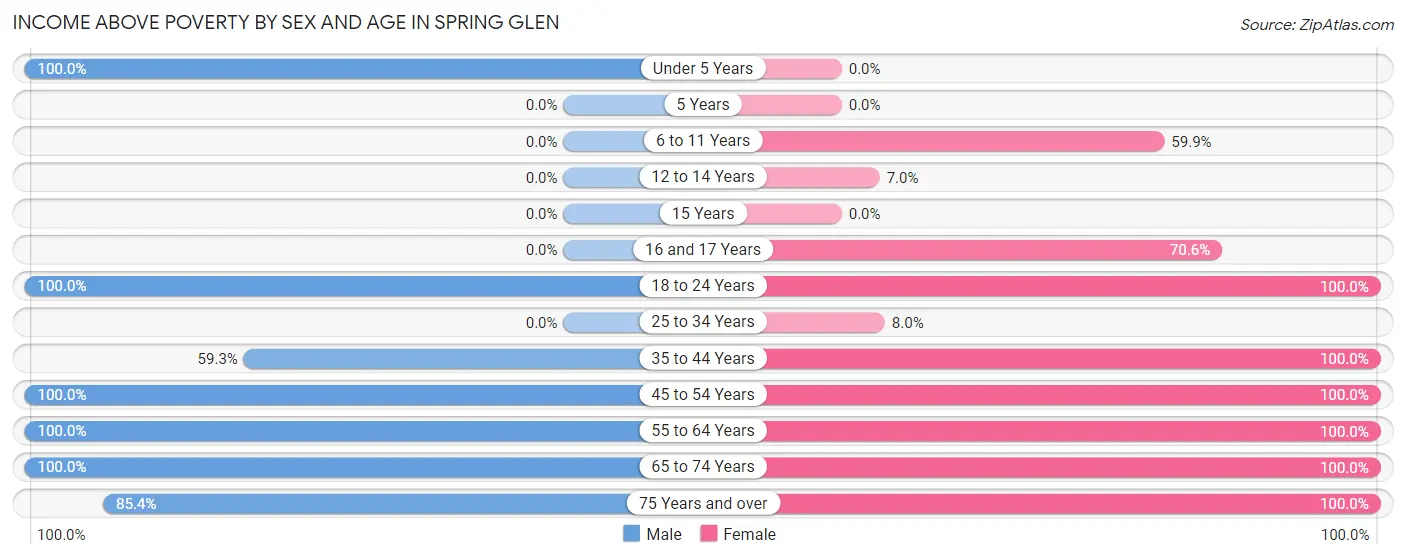
| Age Bracket | Male | Female |
| Under 5 Years | 8 (100.0%) | 0 (0.0%) |
| 5 Years | 0 (0.0%) | 0 (0.0%) |
| 6 to 11 Years | 0 (0.0%) | 97 (59.9%) |
| 12 to 14 Years | 0 (0.0%) | 5 (7.0%) |
| 15 Years | 0 (0.0%) | 0 (0.0%) |
| 16 and 17 Years | 0 (0.0%) | 12 (70.6%) |
| 18 to 24 Years | 13 (100.0%) | 18 (100.0%) |
| 25 to 34 Years | 0 (0.0%) | 6 (8.0%) |
| 35 to 44 Years | 54 (59.3%) | 44 (100.0%) |
| 45 to 54 Years | 54 (100.0%) | 27 (100.0%) |
| 55 to 64 Years | 76 (100.0%) | 148 (100.0%) |
| 65 to 74 Years | 24 (100.0%) | 20 (100.0%) |
| 75 Years and over | 41 (85.4%) | 65 (100.0%) |
| Total | 270 (72.6%) | 442 (63.3%) |
Income Below Poverty Among Married-Couple Families in Spring Glen
The poverty statistics for married-couple families in Spring Glen show that 24.3% or 58 of the total 239 families live below the poverty line. Families with 3 or 4 children have the highest poverty rate of 61.1%, comprising of 58 families. On the other hand, families with no children have the lowest poverty rate of 0.0%, which includes 0 families.
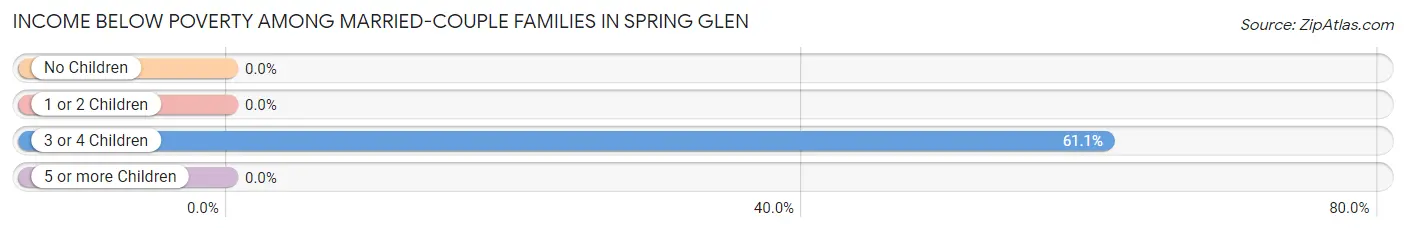
| Children | Above Poverty | Below Poverty |
| No Children | 123 (100.0%) | 0 (0.0%) |
| 1 or 2 Children | 21 (100.0%) | 0 (0.0%) |
| 3 or 4 Children | 37 (39.0%) | 58 (61.1%) |
| 5 or more Children | 0 (0.0%) | 0 (0.0%) |
| Total | 181 (75.7%) | 58 (24.3%) |
Income Below Poverty Among Single-Parent Households in Spring Glen
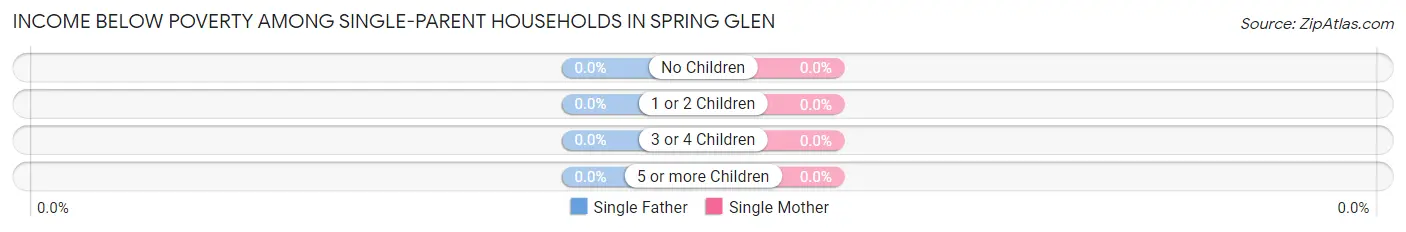
| Children | Single Father | Single Mother |
| No Children | 0 (0.0%) | 0 (0.0%) |
| 1 or 2 Children | 0 (0.0%) | 0 (0.0%) |
| 3 or 4 Children | 0 (0.0%) | 0 (0.0%) |
| 5 or more Children | 0 (0.0%) | 0 (0.0%) |
| Total | 0 (0.0%) | 0 (0.0%) |
Income Below Poverty Among Married-Couple vs Single-Parent Households in Spring Glen
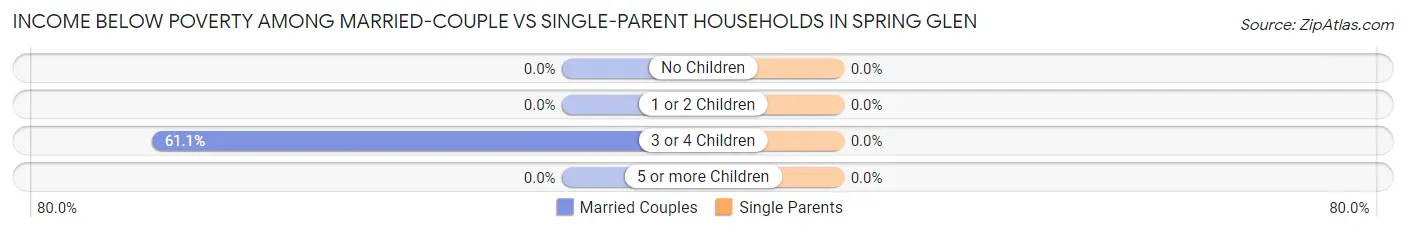
| Children | Married-Couple Families | Single-Parent Households |
| No Children | 0 (0.0%) | 0 (0.0%) |
| 1 or 2 Children | 0 (0.0%) | 0 (0.0%) |
| 3 or 4 Children | 58 (61.1%) | 0 (0.0%) |
| 5 or more Children | 0 (0.0%) | 0 (0.0%) |
| Total | 58 (24.3%) | 0 (0.0%) |
Race in Spring Glen
The most populous races in Spring Glen are White / Caucasian (1,063 | 99.4%), Hispanic or Latino (24 | 2.2%), and Two or more Races (7 | 0.6%).
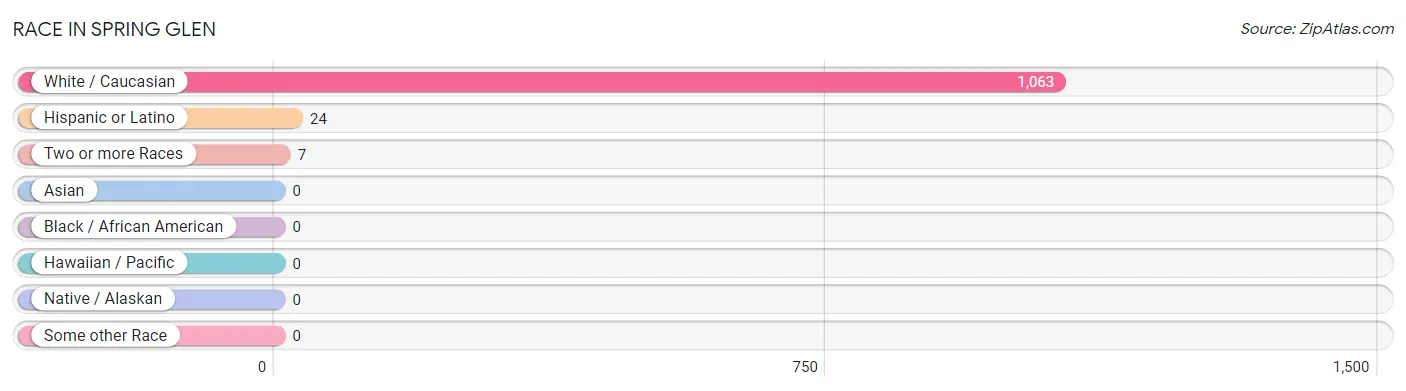
| Race | # Population | % Population |
| Asian | 0 | 0.0% |
| Black / African American | 0 | 0.0% |
| Hawaiian / Pacific | 0 | 0.0% |
| Hispanic or Latino | 24 | 2.2% |
| Native / Alaskan | 0 | 0.0% |
| White / Caucasian | 1,063 | 99.4% |
| Two or more Races | 7 | 0.6% |
| Some other Race | 0 | 0.0% |
| Total | 1,070 | 100.0% |
Ancestry in Spring Glen
The most populous ancestries reported in Spring Glen are English (285 | 26.6%), Scottish (275 | 25.7%), Italian (162 | 15.1%), German (160 | 14.9%), and Danish (92 | 8.6%), together accounting for 91.0% of all Spring Glen residents.
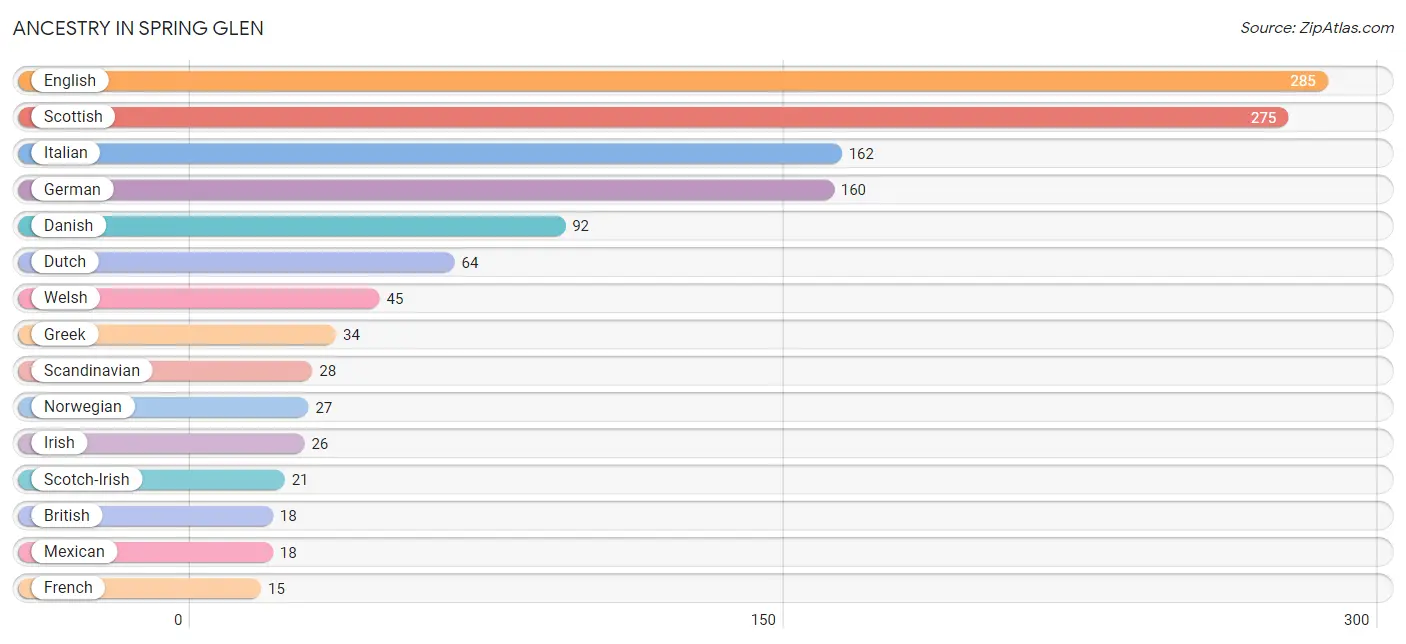
| Ancestry | # Population | % Population |
| British | 18 | 1.7% |
| Danish | 92 | 8.6% |
| Dutch | 64 | 6.0% |
| English | 285 | 26.6% |
| French | 15 | 1.4% |
| German | 160 | 14.9% |
| Greek | 34 | 3.2% |
| Irish | 26 | 2.4% |
| Italian | 162 | 15.1% |
| Mexican | 18 | 1.7% |
| Norwegian | 27 | 2.5% |
| Scandinavian | 28 | 2.6% |
| Scotch-Irish | 21 | 2.0% |
| Scottish | 275 | 25.7% |
| Spaniard | 6 | 0.6% |
| Swiss | 8 | 0.7% |
| Ute | 7 | 0.6% |
| Welsh | 45 | 4.2% | View All 18 Rows |
Immigrants in Spring Glen
The most numerous immigrant groups reported in Spring Glen came from Europe (5 | 0.5%), Italy (5 | 0.5%), and Southern Europe (5 | 0.5%), together accounting for 1.4% of all Spring Glen residents.
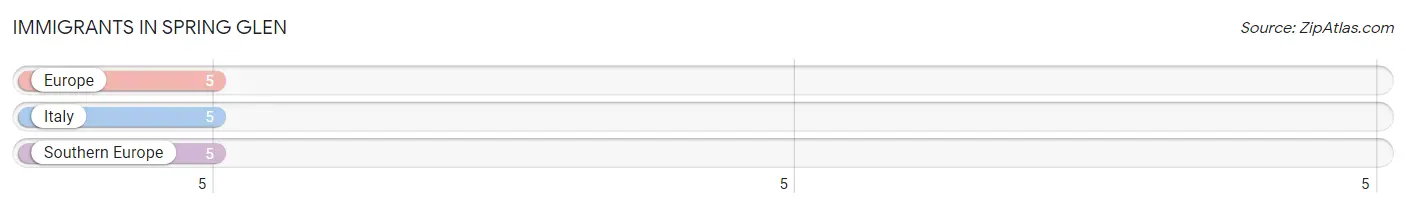
| Immigration Origin | # Population | % Population |
| Europe | 5 | 0.5% |
| Italy | 5 | 0.5% |
| Southern Europe | 5 | 0.5% | View All 3 Rows |
Sex and Age in Spring Glen
Sex and Age in Spring Glen
The most populous age groups in Spring Glen are 60 to 64 Years (64 | 17.2%) for men and 5 to 9 Years (134 | 19.2%) for women.
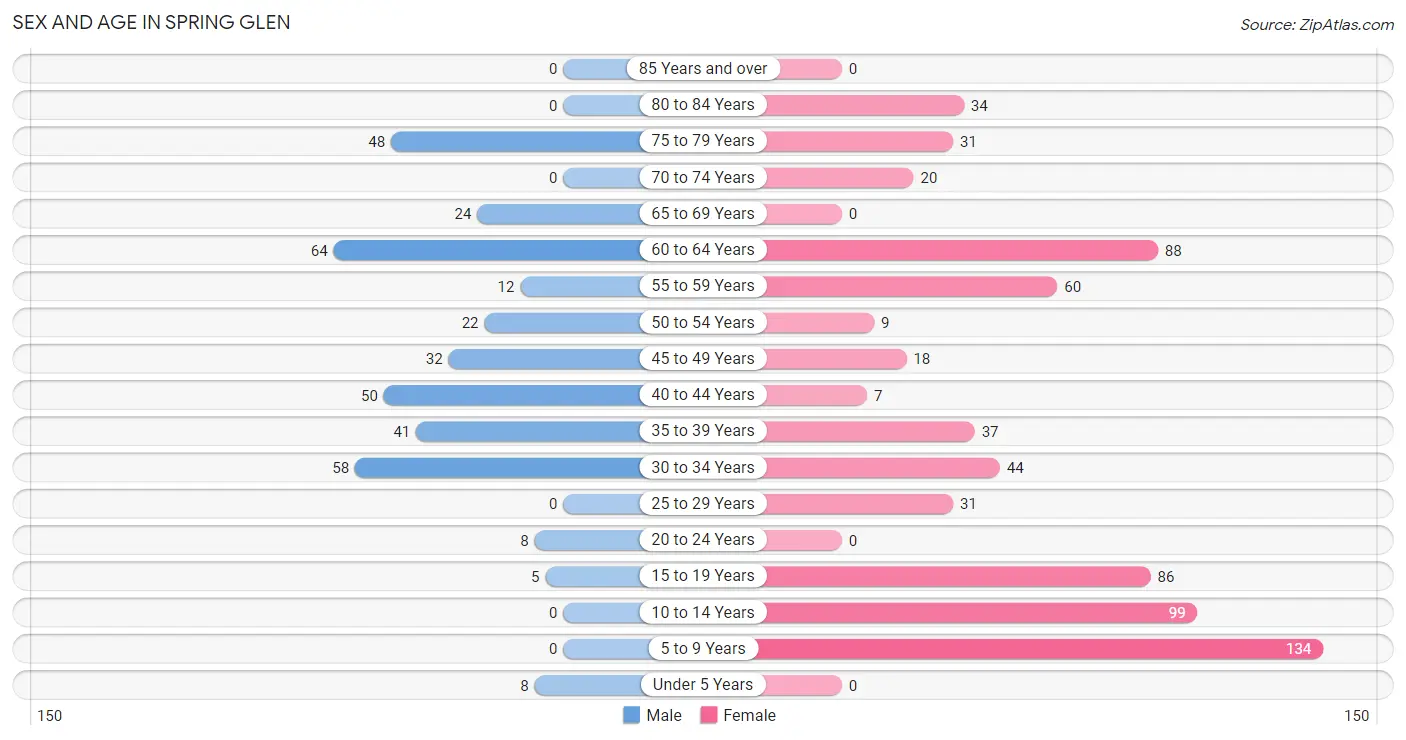
| Age Bracket | Male | Female |
| Under 5 Years | 8 (2.1%) | 0 (0.0%) |
| 5 to 9 Years | 0 (0.0%) | 134 (19.2%) |
| 10 to 14 Years | 0 (0.0%) | 99 (14.2%) |
| 15 to 19 Years | 5 (1.3%) | 86 (12.3%) |
| 20 to 24 Years | 8 (2.1%) | 0 (0.0%) |
| 25 to 29 Years | 0 (0.0%) | 31 (4.4%) |
| 30 to 34 Years | 58 (15.6%) | 44 (6.3%) |
| 35 to 39 Years | 41 (11.0%) | 37 (5.3%) |
| 40 to 44 Years | 50 (13.4%) | 7 (1.0%) |
| 45 to 49 Years | 32 (8.6%) | 18 (2.6%) |
| 50 to 54 Years | 22 (5.9%) | 9 (1.3%) |
| 55 to 59 Years | 12 (3.2%) | 60 (8.6%) |
| 60 to 64 Years | 64 (17.2%) | 88 (12.6%) |
| 65 to 69 Years | 24 (6.5%) | 0 (0.0%) |
| 70 to 74 Years | 0 (0.0%) | 20 (2.9%) |
| 75 to 79 Years | 48 (12.9%) | 31 (4.4%) |
| 80 to 84 Years | 0 (0.0%) | 34 (4.9%) |
| 85 Years and over | 0 (0.0%) | 0 (0.0%) |
| Total | 372 (100.0%) | 698 (100.0%) |
Families and Households in Spring Glen
Median Family Size in Spring Glen
The median family size in Spring Glen is 3.06 persons per family, with married-couple families (239 | 83.9%) accounting for the largest median family size of 3.3 persons per family. On the other hand, single male/father families (12 | 4.2%) represent the smallest median family size with 1.67 persons per family.
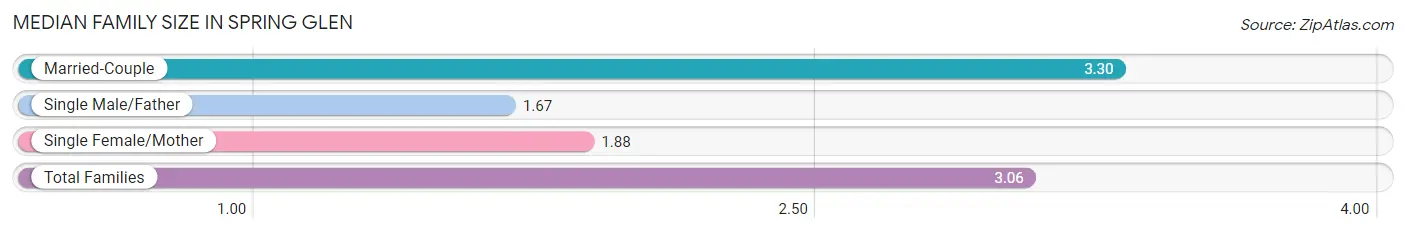
| Family Type | # Families | Family Size |
| Married-Couple | 239 (83.9%) | 3.30 |
| Single Male/Father | 12 (4.2%) | 1.67 |
| Single Female/Mother | 34 (11.9%) | 1.88 |
| Total Families | 285 (100.0%) | 3.06 |
Median Household Size in Spring Glen
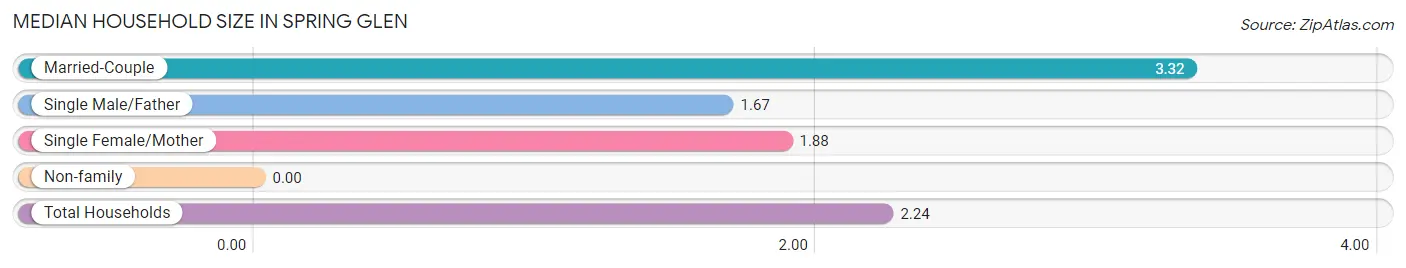
| Household Type | # Households | Household Size |
| Married-Couple | 239 (50.1%) | 3.32 |
| Single Male/Father | 12 (2.5%) | 1.67 |
| Single Female/Mother | 34 (7.1%) | 1.88 |
| Non-family | 192 (40.3%) | - |
| Total Households | 477 (100.0%) | 2.24 |
Household Size by Marriage Status in Spring Glen
Out of a total of 477 households in Spring Glen, 285 (59.8%) are family households, while 192 (40.3%) are nonfamily households. The most numerous type of family households are 2-person households, comprising 146, and the most common type of nonfamily households are 1-person households, comprising 192.
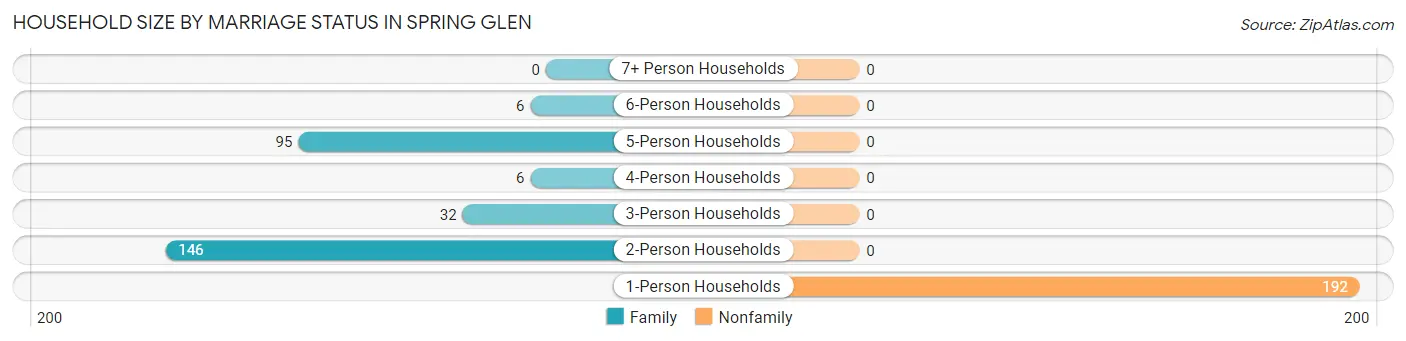
| Household Size | Family Households | Nonfamily Households |
| 1-Person Households | - | 192 (40.3%) |
| 2-Person Households | 146 (30.6%) | 0 (0.0%) |
| 3-Person Households | 32 (6.7%) | 0 (0.0%) |
| 4-Person Households | 6 (1.3%) | 0 (0.0%) |
| 5-Person Households | 95 (19.9%) | 0 (0.0%) |
| 6-Person Households | 6 (1.3%) | 0 (0.0%) |
| 7+ Person Households | 0 (0.0%) | 0 (0.0%) |
| Total | 285 (59.8%) | 192 (40.3%) |
Female Fertility in Spring Glen
Fertility by Age in Spring Glen
| Age Bracket | Women with Births | Births / 1,000 Women |
| 15 to 19 years | 0 (0.0%) | 0.0 |
| 20 to 34 years | 0 (0.0%) | 0.0 |
| 35 to 50 years | 0 (0.0%) | 0.0 |
| Total | 0 (0.0%) | 0.0 |
Fertility by Age by Marriage Status in Spring Glen
| Age Bracket | Married | Unmarried |
| 15 to 19 years | 0 (0.0%) | 0 (0.0%) |
| 20 to 34 years | 0 (0.0%) | 0 (0.0%) |
| 35 to 50 years | 0 (0.0%) | 0 (0.0%) |
| Total | 0 (0.0%) | 0 (0.0%) |
Fertility by Education in Spring Glen
| Educational Attainment | Women with Births | Births / 1,000 Women |
| Less than High School | 0 (0.0%) | 0.0 |
| High School Diploma | 0 (0.0%) | 0.0 |
| College or Associate's Degree | 0 (0.0%) | 0.0 |
| Bachelor's Degree | 0 (0.0%) | 0.0 |
| Graduate Degree | 0 (0.0%) | 0.0 |
| Total | 0 (0.0%) | 0.0 |
Fertility by Education by Marriage Status in Spring Glen
| Educational Attainment | Married | Unmarried |
| Less than High School | 0 (0.0%) | 0 (0.0%) |
| High School Diploma | 0 (0.0%) | 0 (0.0%) |
| College or Associate's Degree | 0 (0.0%) | 0 (0.0%) |
| Bachelor's Degree | 0 (0.0%) | 0 (0.0%) |
| Graduate Degree | 0 (0.0%) | 0 (0.0%) |
| Total | 0 (0.0%) | 0 (0.0%) |
Employment Characteristics in Spring Glen
Employment by Class of Employer in Spring Glen
Among the 478 employed individuals in Spring Glen, private company employees (292 | 61.1%), local government employees (90 | 18.8%), and self-employed (incorporated) (33 | 6.9%) make up the most common classes of employment.
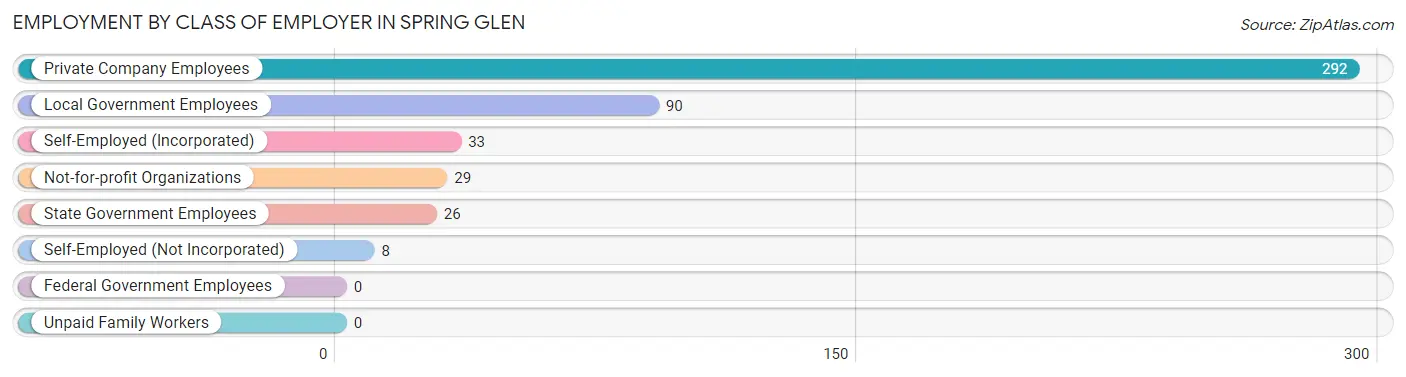
| Employer Class | # Employees | % Employees |
| Private Company Employees | 292 | 61.1% |
| Self-Employed (Incorporated) | 33 | 6.9% |
| Self-Employed (Not Incorporated) | 8 | 1.7% |
| Not-for-profit Organizations | 29 | 6.1% |
| Local Government Employees | 90 | 18.8% |
| State Government Employees | 26 | 5.4% |
| Federal Government Employees | 0 | 0.0% |
| Unpaid Family Workers | 0 | 0.0% |
| Total | 478 | 100.0% |
Employment Status by Age in Spring Glen
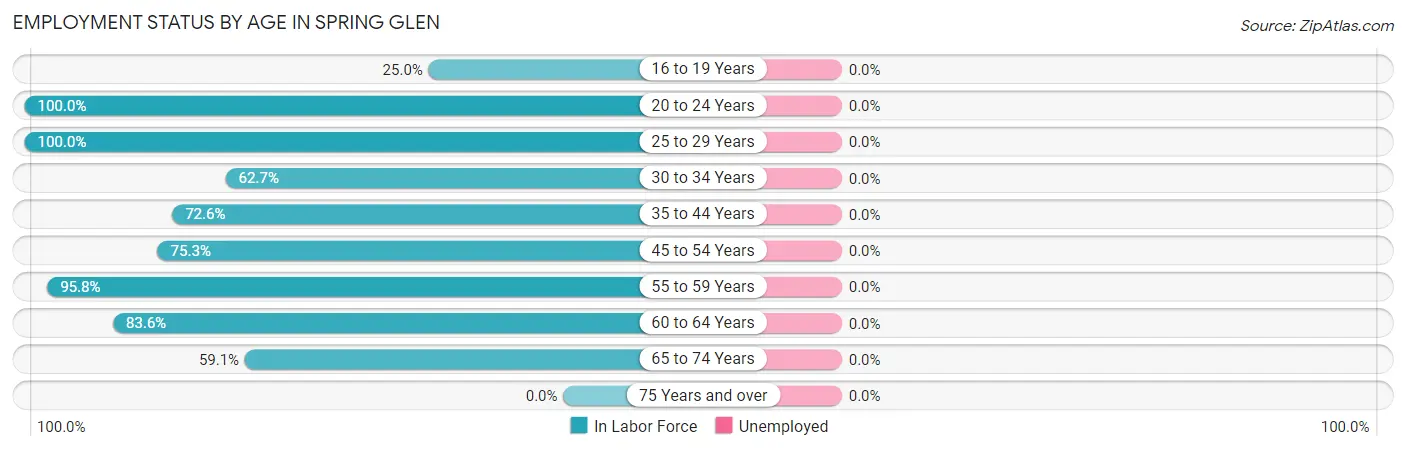
| Age Bracket | In Labor Force | Unemployed |
| 16 to 19 Years | 10 (25.0%) | 0 (0.0%) |
| 20 to 24 Years | 8 (100.0%) | 0 (0.0%) |
| 25 to 29 Years | 31 (100.0%) | 0 (0.0%) |
| 30 to 34 Years | 64 (62.7%) | 0 (0.0%) |
| 35 to 44 Years | 98 (72.6%) | 0 (0.0%) |
| 45 to 54 Years | 61 (75.3%) | 0 (0.0%) |
| 55 to 59 Years | 69 (95.8%) | 0 (0.0%) |
| 60 to 64 Years | 127 (83.6%) | 0 (0.0%) |
| 65 to 74 Years | 26 (59.1%) | 0 (0.0%) |
| 75 Years and over | 0 (0.0%) | 0 (0.0%) |
| Total | 494 (63.5%) | 0 (0.0%) |
Employment Status by Educational Attainment in Spring Glen
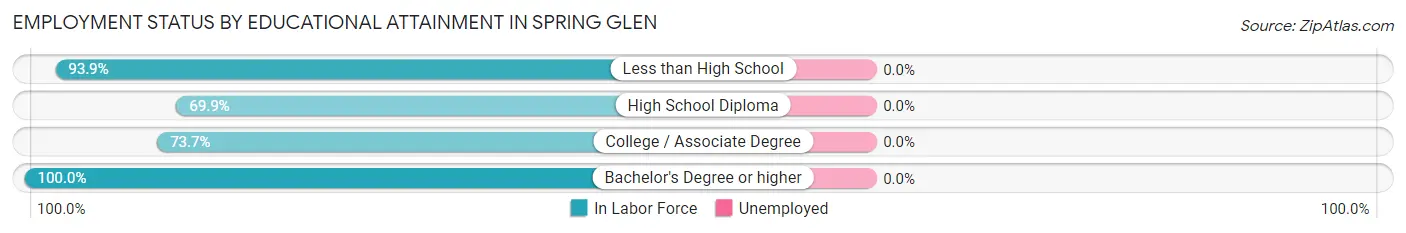
| Educational Attainment | In Labor Force | Unemployed |
| Less than High School | 46 (93.9%) | 0 (0.0%) |
| High School Diploma | 121 (69.9%) | 0 (0.0%) |
| College / Associate Degree | 191 (73.7%) | 0 (0.0%) |
| Bachelor's Degree or higher | 92 (100.0%) | 0 (0.0%) |
| Total | 450 (78.5%) | 0 (0.0%) |
Employment Occupations by Sex in Spring Glen
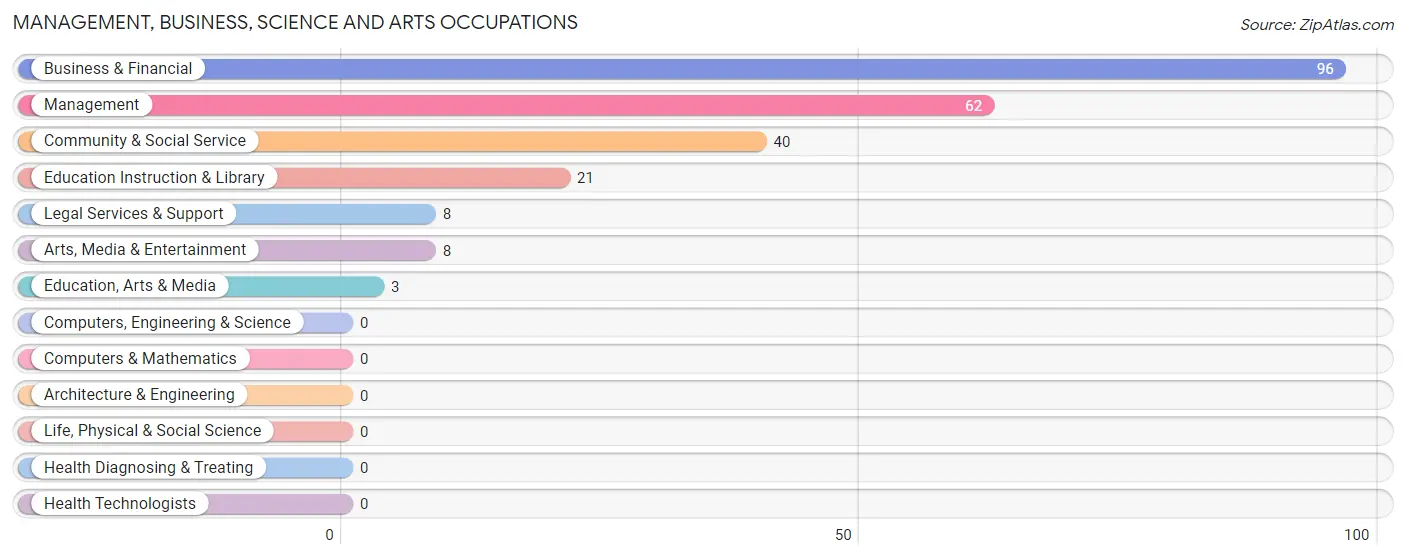
Management, Business, Science and Arts Occupations
The most common Management, Business, Science and Arts occupations in Spring Glen are Business & Financial (96 | 19.4%), Management (62 | 12.6%), Community & Social Service (40 | 8.1%), Education Instruction & Library (21 | 4.3%), and Legal Services & Support (8 | 1.6%).
Management, Business, Science and Arts Occupations by Sex
Within the Management, Business, Science and Arts occupations in Spring Glen, the most male-oriented occupations are Legal Services & Support (100.0%), Community & Social Service (35.0%), and Education Instruction & Library (28.6%), while the most female-oriented occupations are Education, Arts & Media (100.0%), Arts, Media & Entertainment (100.0%), and Management (87.1%).
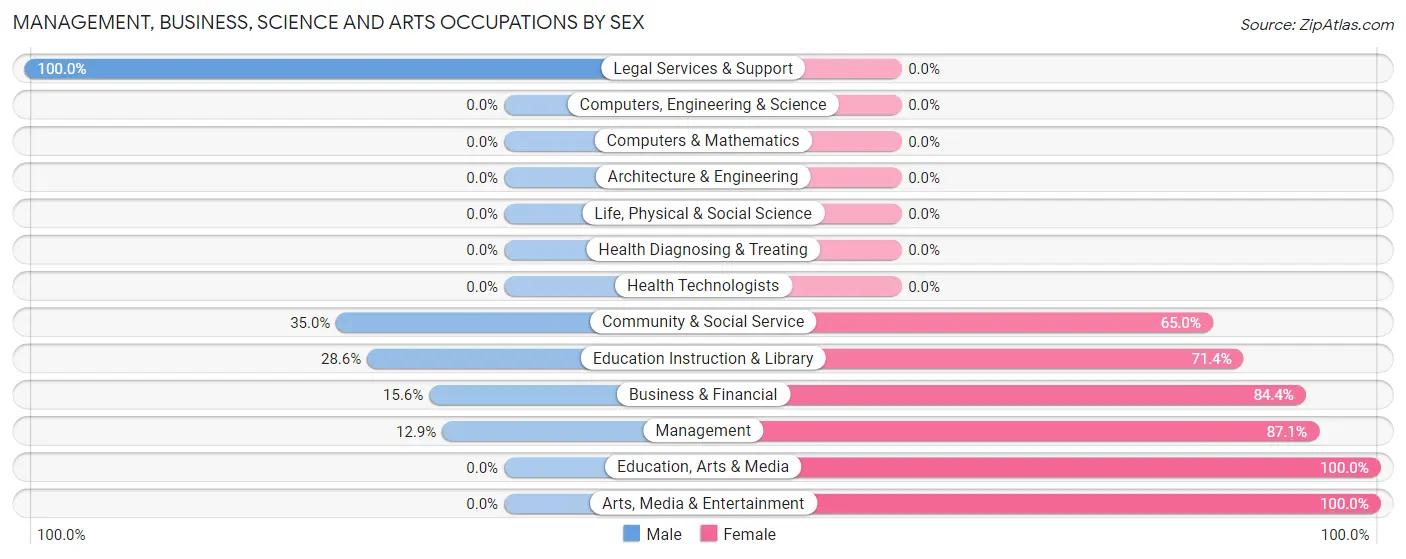
| Occupation | Male | Female |
| Management | 8 (12.9%) | 54 (87.1%) |
| Business & Financial | 15 (15.6%) | 81 (84.4%) |
| Computers, Engineering & Science | 0 (0.0%) | 0 (0.0%) |
| Computers & Mathematics | 0 (0.0%) | 0 (0.0%) |
| Architecture & Engineering | 0 (0.0%) | 0 (0.0%) |
| Life, Physical & Social Science | 0 (0.0%) | 0 (0.0%) |
| Community & Social Service | 14 (35.0%) | 26 (65.0%) |
| Education, Arts & Media | 0 (0.0%) | 3 (100.0%) |
| Legal Services & Support | 8 (100.0%) | 0 (0.0%) |
| Education Instruction & Library | 6 (28.6%) | 15 (71.4%) |
| Arts, Media & Entertainment | 0 (0.0%) | 8 (100.0%) |
| Health Diagnosing & Treating | 0 (0.0%) | 0 (0.0%) |
| Health Technologists | 0 (0.0%) | 0 (0.0%) |
| Total (Category) | 37 (18.7%) | 161 (81.3%) |
| Total (Overall) | 234 (47.4%) | 260 (52.6%) |
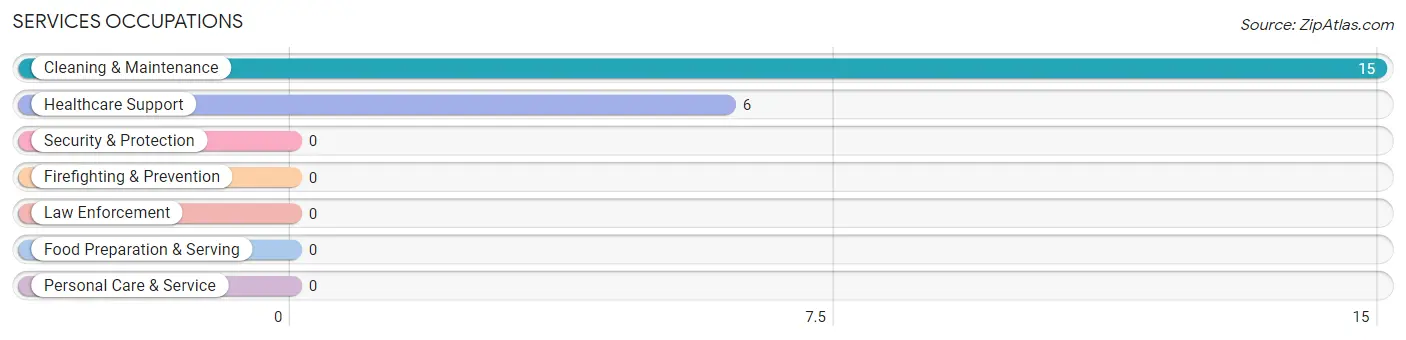
Services Occupations
The most common Services occupations in Spring Glen are Cleaning & Maintenance (15 | 3.0%), and Healthcare Support (6 | 1.2%).
Services Occupations by Sex
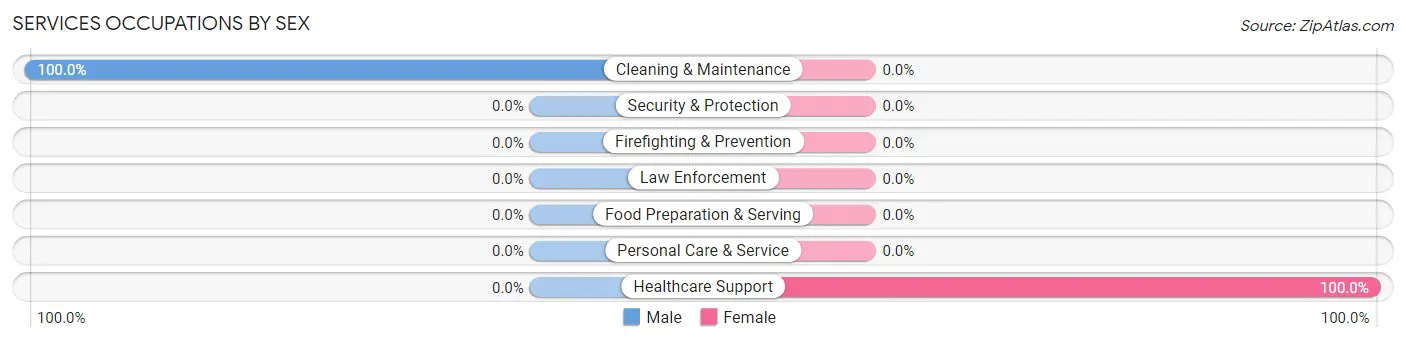
| Occupation | Male | Female |
| Healthcare Support | 0 (0.0%) | 6 (100.0%) |
| Security & Protection | 0 (0.0%) | 0 (0.0%) |
| Firefighting & Prevention | 0 (0.0%) | 0 (0.0%) |
| Law Enforcement | 0 (0.0%) | 0 (0.0%) |
| Food Preparation & Serving | 0 (0.0%) | 0 (0.0%) |
| Cleaning & Maintenance | 15 (100.0%) | 0 (0.0%) |
| Personal Care & Service | 0 (0.0%) | 0 (0.0%) |
| Total (Category) | 15 (71.4%) | 6 (28.6%) |
| Total (Overall) | 234 (47.4%) | 260 (52.6%) |
Sales and Office Occupations
The most common Sales and Office occupations in Spring Glen are Office & Administration (62 | 12.6%), and Sales & Related (31 | 6.3%).
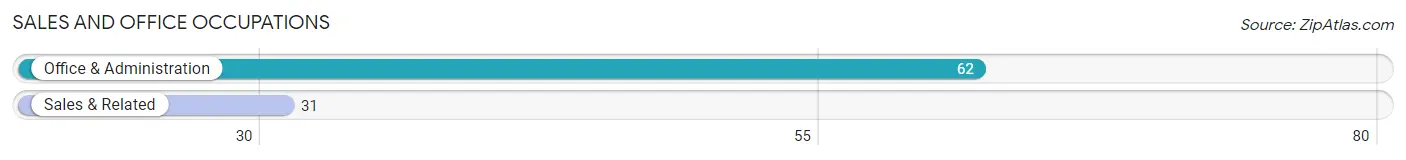
Sales and Office Occupations by Sex
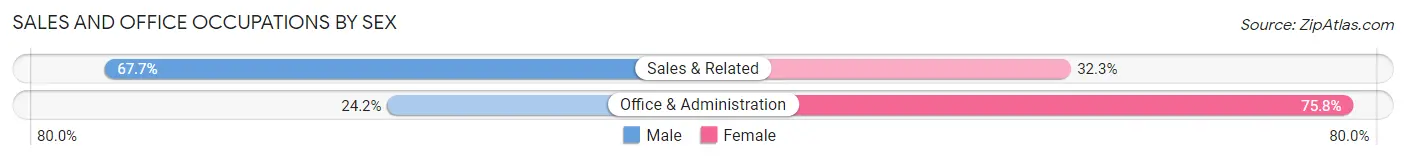
| Occupation | Male | Female |
| Sales & Related | 21 (67.7%) | 10 (32.3%) |
| Office & Administration | 15 (24.2%) | 47 (75.8%) |
| Total (Category) | 36 (38.7%) | 57 (61.3%) |
| Total (Overall) | 234 (47.4%) | 260 (52.6%) |
Natural Resources, Construction and Maintenance Occupations
The most common Natural Resources, Construction and Maintenance occupations in Spring Glen are Construction & Extraction (38 | 7.7%), and Installation, Maintenance & Repair (33 | 6.7%).
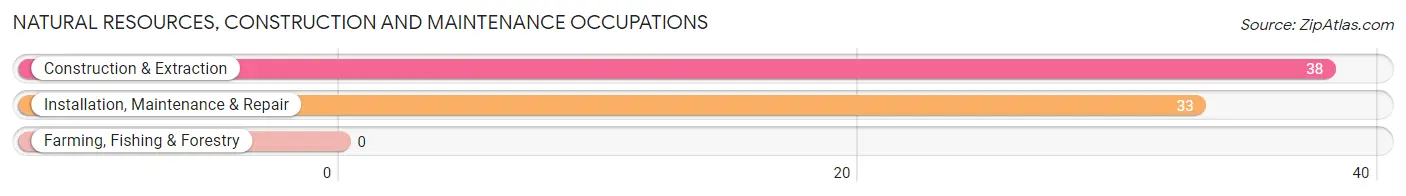
Natural Resources, Construction and Maintenance Occupations by Sex
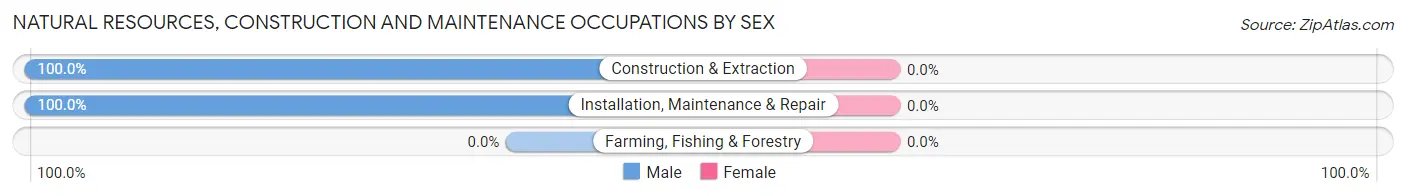
| Occupation | Male | Female |
| Farming, Fishing & Forestry | 0 (0.0%) | 0 (0.0%) |
| Construction & Extraction | 38 (100.0%) | 0 (0.0%) |
| Installation, Maintenance & Repair | 33 (100.0%) | 0 (0.0%) |
| Total (Category) | 71 (100.0%) | 0 (0.0%) |
| Total (Overall) | 234 (47.4%) | 260 (52.6%) |
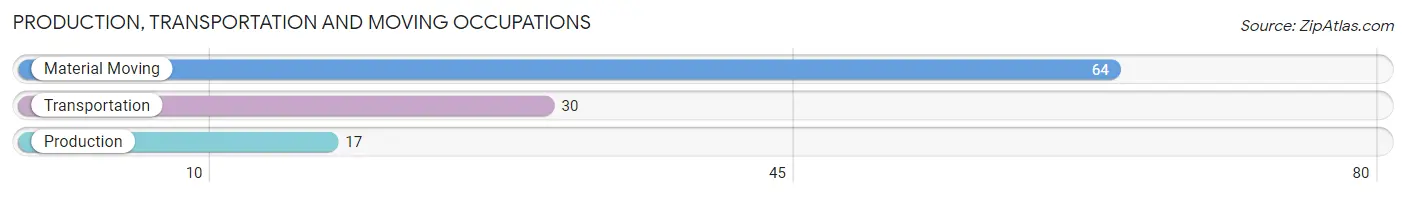
Production, Transportation and Moving Occupations
The most common Production, Transportation and Moving occupations in Spring Glen are Material Moving (64 | 13.0%), Transportation (30 | 6.1%), and Production (17 | 3.4%).
Production, Transportation and Moving Occupations by Sex
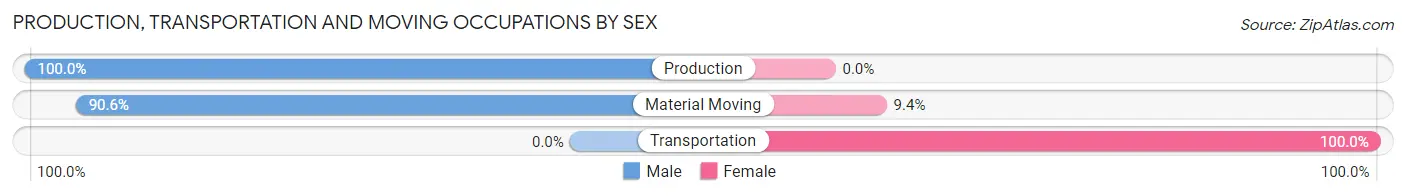
| Occupation | Male | Female |
| Production | 17 (100.0%) | 0 (0.0%) |
| Transportation | 0 (0.0%) | 30 (100.0%) |
| Material Moving | 58 (90.6%) | 6 (9.4%) |
| Total (Category) | 75 (67.6%) | 36 (32.4%) |
| Total (Overall) | 234 (47.4%) | 260 (52.6%) |
Employment Industries by Sex in Spring Glen
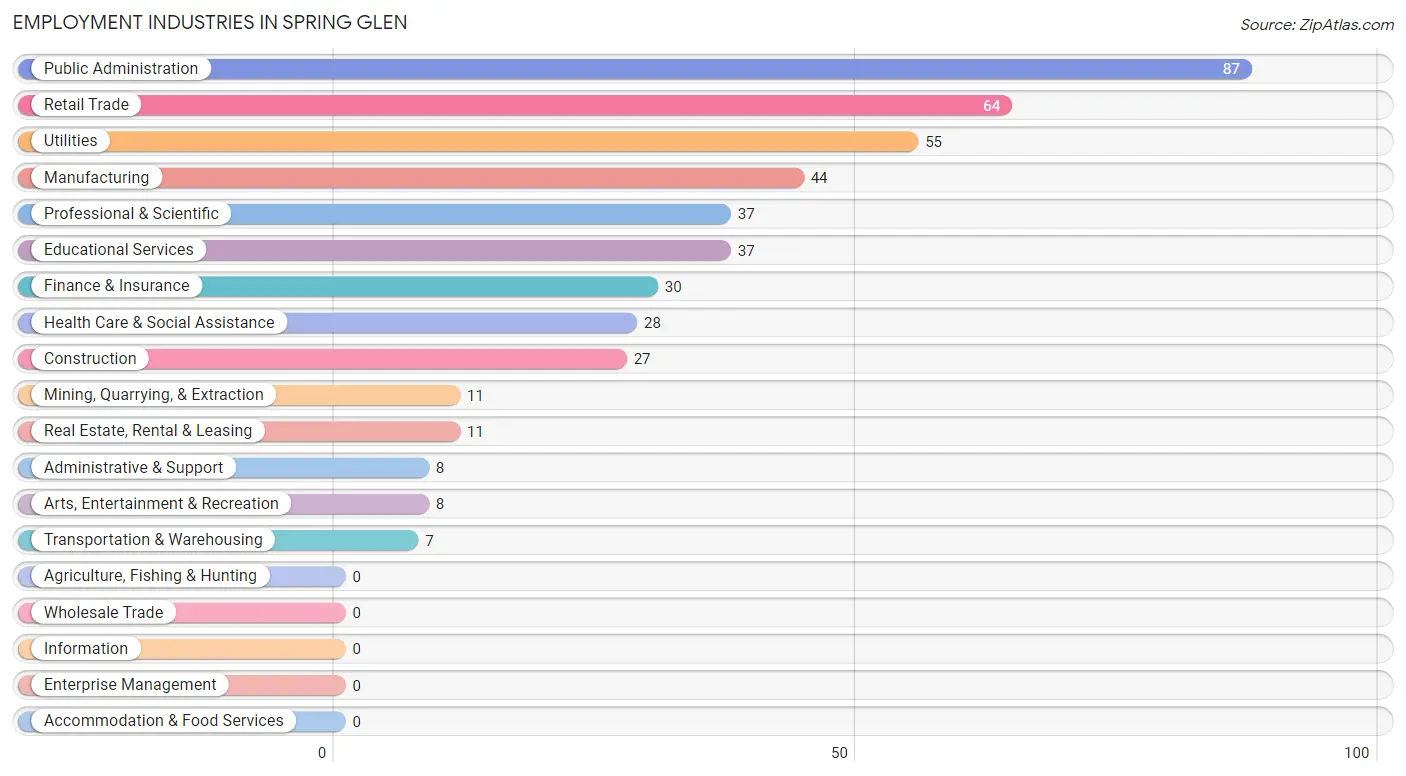
Employment Industries in Spring Glen
The major employment industries in Spring Glen include Public Administration (87 | 17.6%), Retail Trade (64 | 13.0%), Utilities (55 | 11.1%), Manufacturing (44 | 8.9%), and Professional & Scientific (37 | 7.5%).
Employment Industries by Sex in Spring Glen
The Spring Glen industries that see more men than women are Mining, Quarrying, & Extraction (100.0%), Construction (100.0%), and Transportation & Warehousing (100.0%), whereas the industries that tend to have a higher number of women are Professional & Scientific (100.0%), Arts, Entertainment & Recreation (100.0%), and Manufacturing (84.1%).
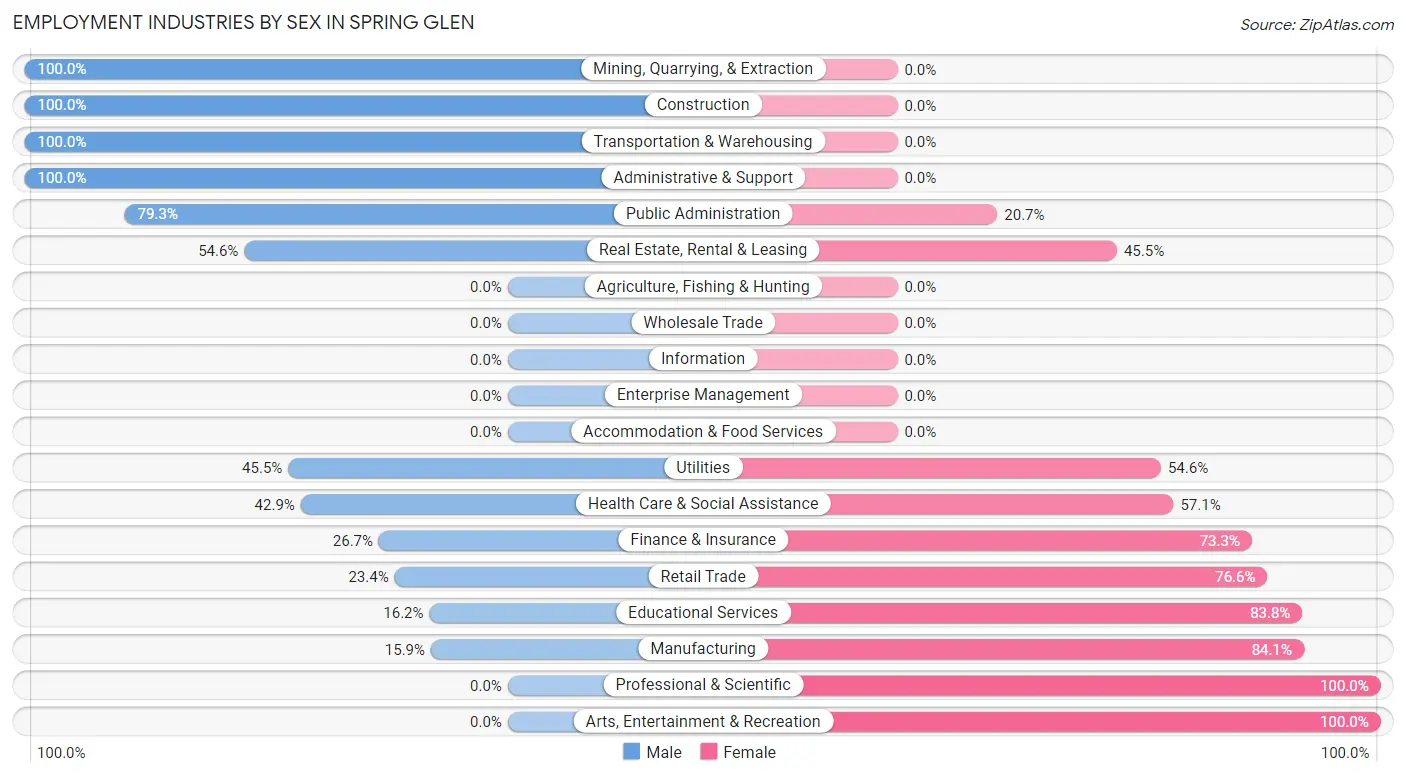
| Industry | Male | Female |
| Agriculture, Fishing & Hunting | 0 (0.0%) | 0 (0.0%) |
| Mining, Quarrying, & Extraction | 11 (100.0%) | 0 (0.0%) |
| Construction | 27 (100.0%) | 0 (0.0%) |
| Manufacturing | 7 (15.9%) | 37 (84.1%) |
| Wholesale Trade | 0 (0.0%) | 0 (0.0%) |
| Retail Trade | 15 (23.4%) | 49 (76.6%) |
| Transportation & Warehousing | 7 (100.0%) | 0 (0.0%) |
| Utilities | 25 (45.5%) | 30 (54.5%) |
| Information | 0 (0.0%) | 0 (0.0%) |
| Finance & Insurance | 8 (26.7%) | 22 (73.3%) |
| Real Estate, Rental & Leasing | 6 (54.5%) | 5 (45.5%) |
| Professional & Scientific | 0 (0.0%) | 37 (100.0%) |
| Enterprise Management | 0 (0.0%) | 0 (0.0%) |
| Administrative & Support | 8 (100.0%) | 0 (0.0%) |
| Educational Services | 6 (16.2%) | 31 (83.8%) |
| Health Care & Social Assistance | 12 (42.9%) | 16 (57.1%) |
| Arts, Entertainment & Recreation | 0 (0.0%) | 8 (100.0%) |
| Accommodation & Food Services | 0 (0.0%) | 0 (0.0%) |
| Public Administration | 69 (79.3%) | 18 (20.7%) |
| Total | 234 (47.4%) | 260 (52.6%) |
Education in Spring Glen
School Enrollment in Spring Glen
The most common levels of schooling among the 345 students in Spring Glen are middle school (99 | 28.7%), high school (86 | 24.9%), and kindergarten (72 | 20.9%).
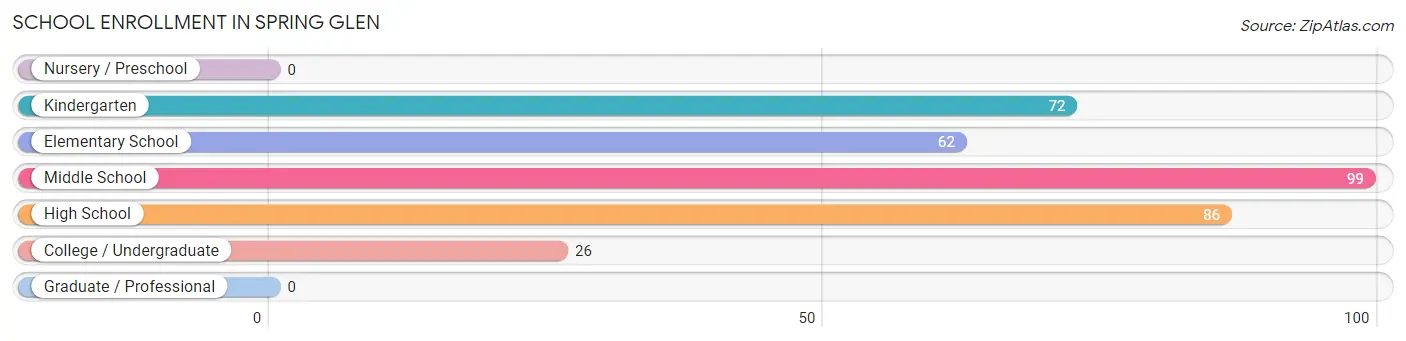
| School Level | # Students | % Students |
| Nursery / Preschool | 0 | 0.0% |
| Kindergarten | 72 | 20.9% |
| Elementary School | 62 | 18.0% |
| Middle School | 99 | 28.7% |
| High School | 86 | 24.9% |
| College / Undergraduate | 26 | 7.5% |
| Graduate / Professional | 0 | 0.0% |
| Total | 345 | 100.0% |
School Enrollment by Age by Funding Source in Spring Glen
Out of a total of 345 students who are enrolled in schools in Spring Glen, 6 (1.7%) attend a private institution, while the remaining 339 (98.3%) are enrolled in public schools. The age group of 35 years and over has the highest likelihood of being enrolled in private schools, with 6 (46.2% in the age bracket) enrolled. Conversely, the age group of 5 to 9 year old has the lowest likelihood of being enrolled in a private school, with 134 (100.0% in the age bracket) attending a public institution.
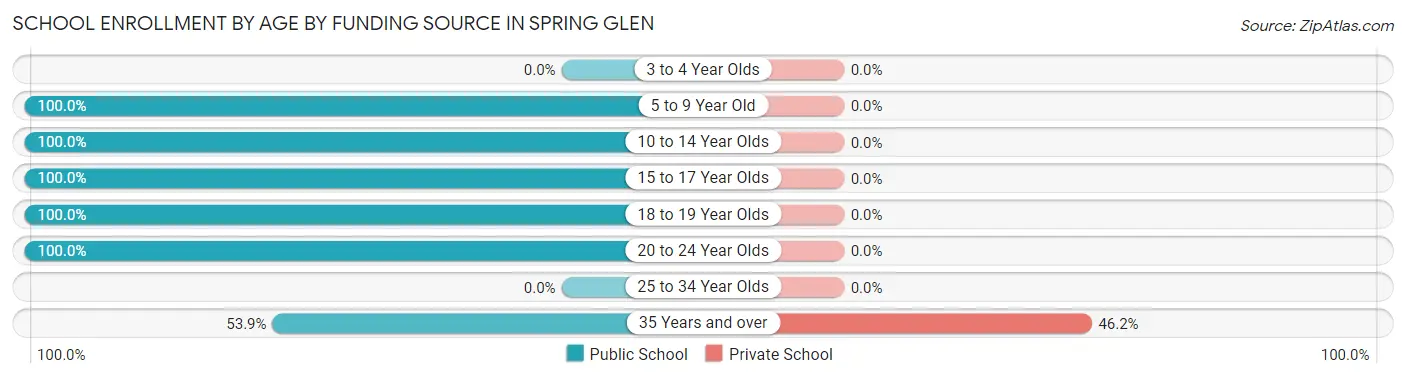
| Age Bracket | Public School | Private School |
| 3 to 4 Year Olds | 0 (0.0%) | 0 (0.0%) |
| 5 to 9 Year Old | 134 (100.0%) | 0 (0.0%) |
| 10 to 14 Year Olds | 99 (100.0%) | 0 (0.0%) |
| 15 to 17 Year Olds | 68 (100.0%) | 0 (0.0%) |
| 18 to 19 Year Olds | 23 (100.0%) | 0 (0.0%) |
| 20 to 24 Year Olds | 8 (100.0%) | 0 (0.0%) |
| 25 to 34 Year Olds | 0 (0.0%) | 0 (0.0%) |
| 35 Years and over | 7 (53.8%) | 6 (46.2%) |
| Total | 339 (98.3%) | 6 (1.7%) |
Educational Attainment by Field of Study in Spring Glen
Arts & humanities (31 | 28.4%), education (21 | 19.3%), literature & languages (14 | 12.8%), visual & performing arts (10 | 9.2%), and physical & health sciences (8 | 7.3%) are the most common fields of study among 109 individuals in Spring Glen who have obtained a bachelor's degree or higher.
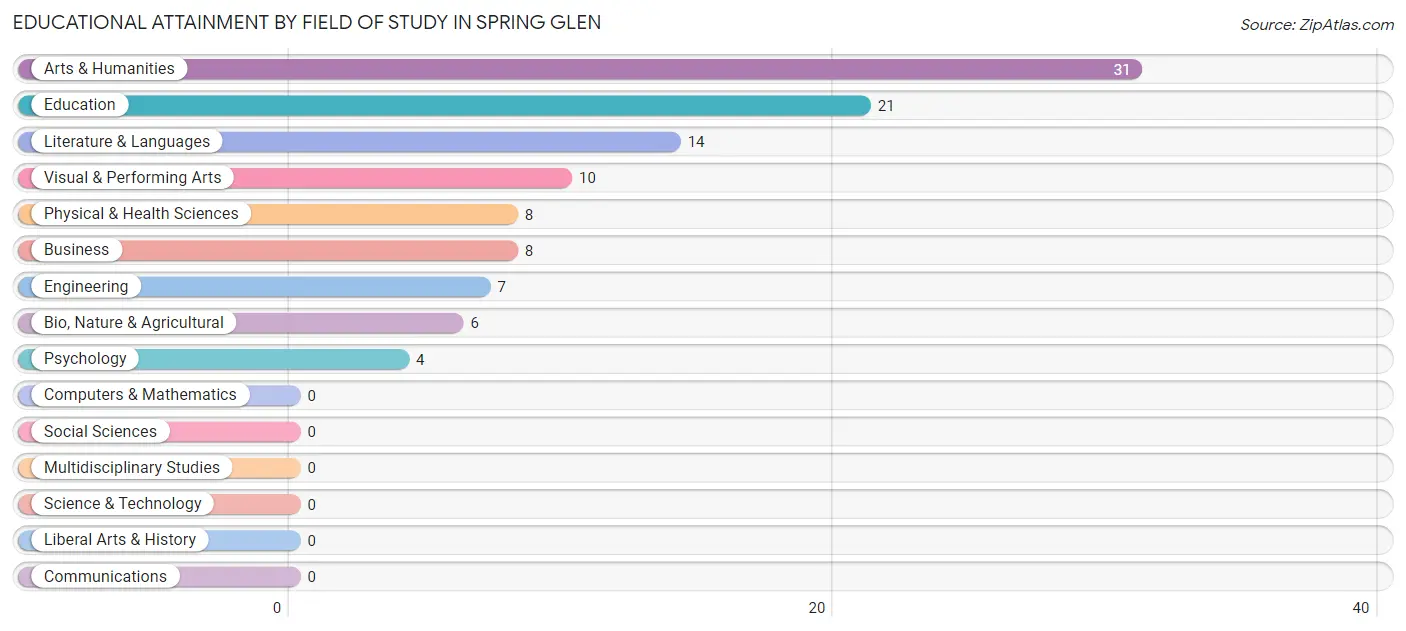
| Field of Study | # Graduates | % Graduates |
| Computers & Mathematics | 0 | 0.0% |
| Bio, Nature & Agricultural | 6 | 5.5% |
| Physical & Health Sciences | 8 | 7.3% |
| Psychology | 4 | 3.7% |
| Social Sciences | 0 | 0.0% |
| Engineering | 7 | 6.4% |
| Multidisciplinary Studies | 0 | 0.0% |
| Science & Technology | 0 | 0.0% |
| Business | 8 | 7.3% |
| Education | 21 | 19.3% |
| Literature & Languages | 14 | 12.8% |
| Liberal Arts & History | 0 | 0.0% |
| Visual & Performing Arts | 10 | 9.2% |
| Communications | 0 | 0.0% |
| Arts & Humanities | 31 | 28.4% |
| Total | 109 | 100.0% |
Transportation & Commute in Spring Glen
Vehicle Availability by Sex in Spring Glen
The most prevalent vehicle ownership categories in Spring Glen are males with 2 vehicles (117, accounting for 50.0%) and females with 2 vehicles (33, making up 47.9%).
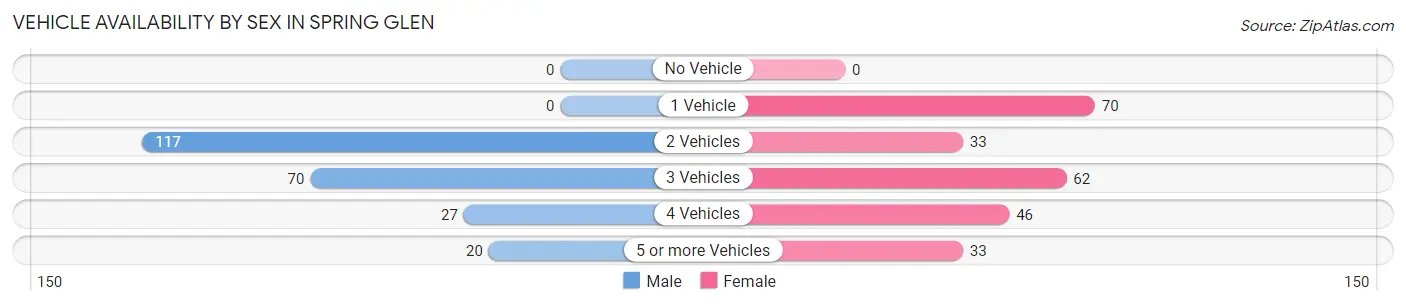
| Vehicles Available | Male | Female |
| No Vehicle | 0 (0.0%) | 0 (0.0%) |
| 1 Vehicle | 0 (0.0%) | 70 (28.7%) |
| 2 Vehicles | 117 (50.0%) | 33 (13.5%) |
| 3 Vehicles | 70 (29.9%) | 62 (25.4%) |
| 4 Vehicles | 27 (11.5%) | 46 (18.9%) |
| 5 or more Vehicles | 20 (8.6%) | 33 (13.5%) |
| Total | 234 (100.0%) | 244 (100.0%) |
Commute Time in Spring Glen
The most frequently occuring commute durations in Spring Glen are 15 to 19 minutes (165 commuters, 37.3%), 10 to 14 minutes (128 commuters, 29.0%), and less than 5 minutes (58 commuters, 13.1%).
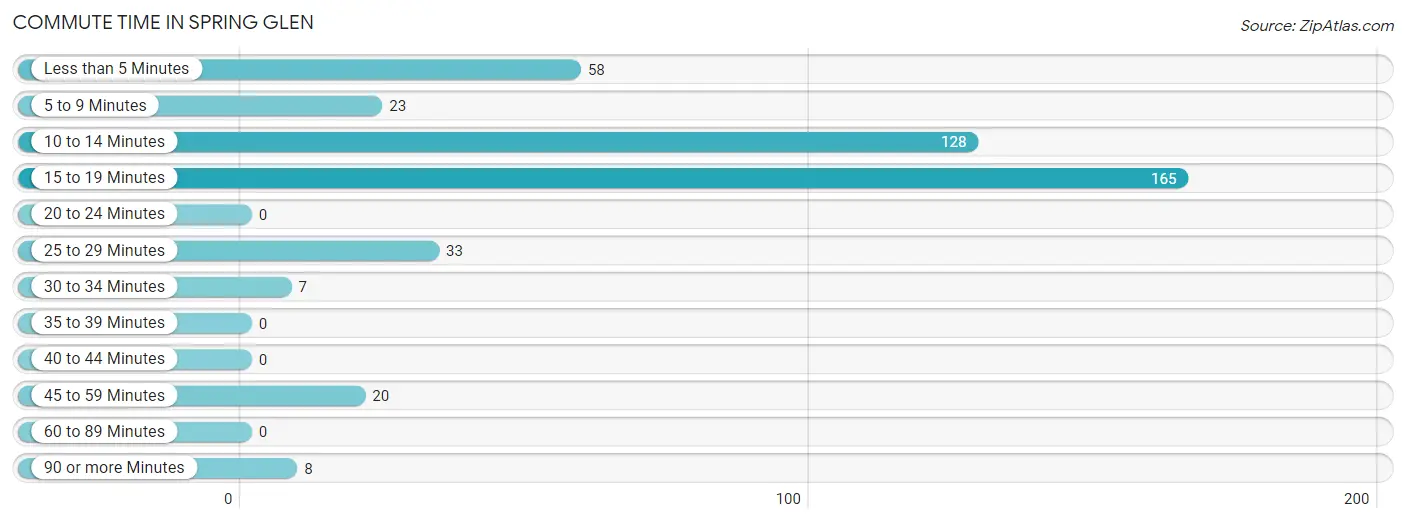
| Commute Time | # Commuters | % Commuters |
| Less than 5 Minutes | 58 | 13.1% |
| 5 to 9 Minutes | 23 | 5.2% |
| 10 to 14 Minutes | 128 | 29.0% |
| 15 to 19 Minutes | 165 | 37.3% |
| 20 to 24 Minutes | 0 | 0.0% |
| 25 to 29 Minutes | 33 | 7.5% |
| 30 to 34 Minutes | 7 | 1.6% |
| 35 to 39 Minutes | 0 | 0.0% |
| 40 to 44 Minutes | 0 | 0.0% |
| 45 to 59 Minutes | 20 | 4.5% |
| 60 to 89 Minutes | 0 | 0.0% |
| 90 or more Minutes | 8 | 1.8% |
Commute Time by Sex in Spring Glen
The most common commute times in Spring Glen are less than 5 minutes (58 commuters, 28.0%) for males and 15 to 19 minutes (124 commuters, 52.8%) for females.
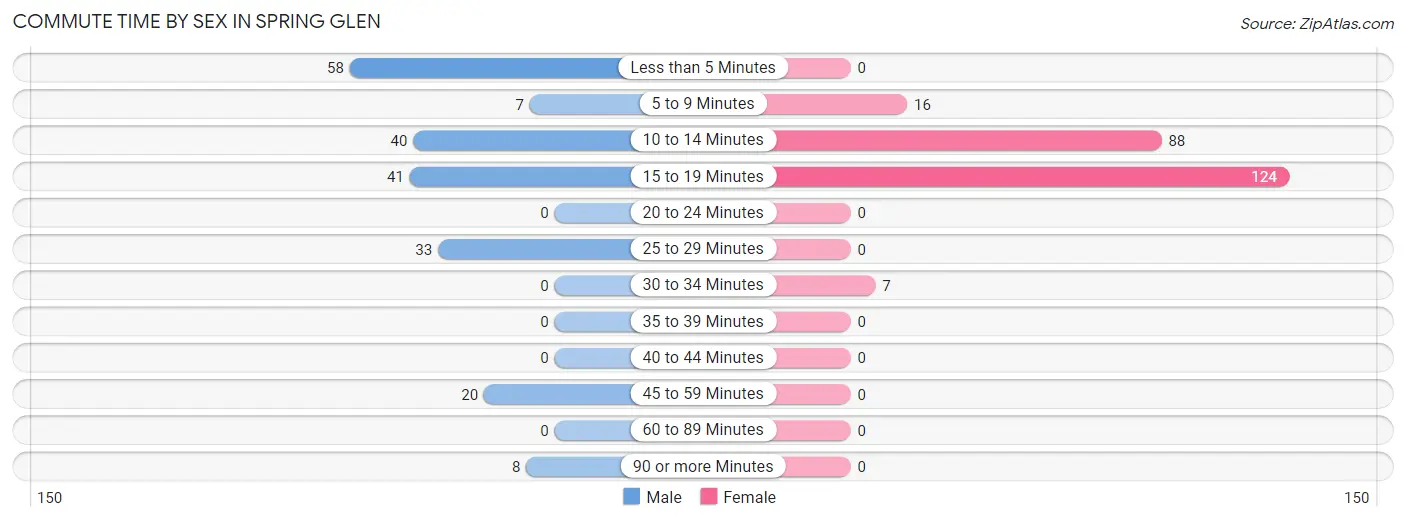
| Commute Time | Male | Female |
| Less than 5 Minutes | 58 (28.0%) | 0 (0.0%) |
| 5 to 9 Minutes | 7 (3.4%) | 16 (6.8%) |
| 10 to 14 Minutes | 40 (19.3%) | 88 (37.4%) |
| 15 to 19 Minutes | 41 (19.8%) | 124 (52.8%) |
| 20 to 24 Minutes | 0 (0.0%) | 0 (0.0%) |
| 25 to 29 Minutes | 33 (15.9%) | 0 (0.0%) |
| 30 to 34 Minutes | 0 (0.0%) | 7 (3.0%) |
| 35 to 39 Minutes | 0 (0.0%) | 0 (0.0%) |
| 40 to 44 Minutes | 0 (0.0%) | 0 (0.0%) |
| 45 to 59 Minutes | 20 (9.7%) | 0 (0.0%) |
| 60 to 89 Minutes | 0 (0.0%) | 0 (0.0%) |
| 90 or more Minutes | 8 (3.9%) | 0 (0.0%) |
Time of Departure to Work by Sex in Spring Glen
The most frequent times of departure to work in Spring Glen are 6:30 AM to 6:59 AM (66, 31.9%) for males and 7:00 AM to 7:29 AM (49, 20.8%) for females.
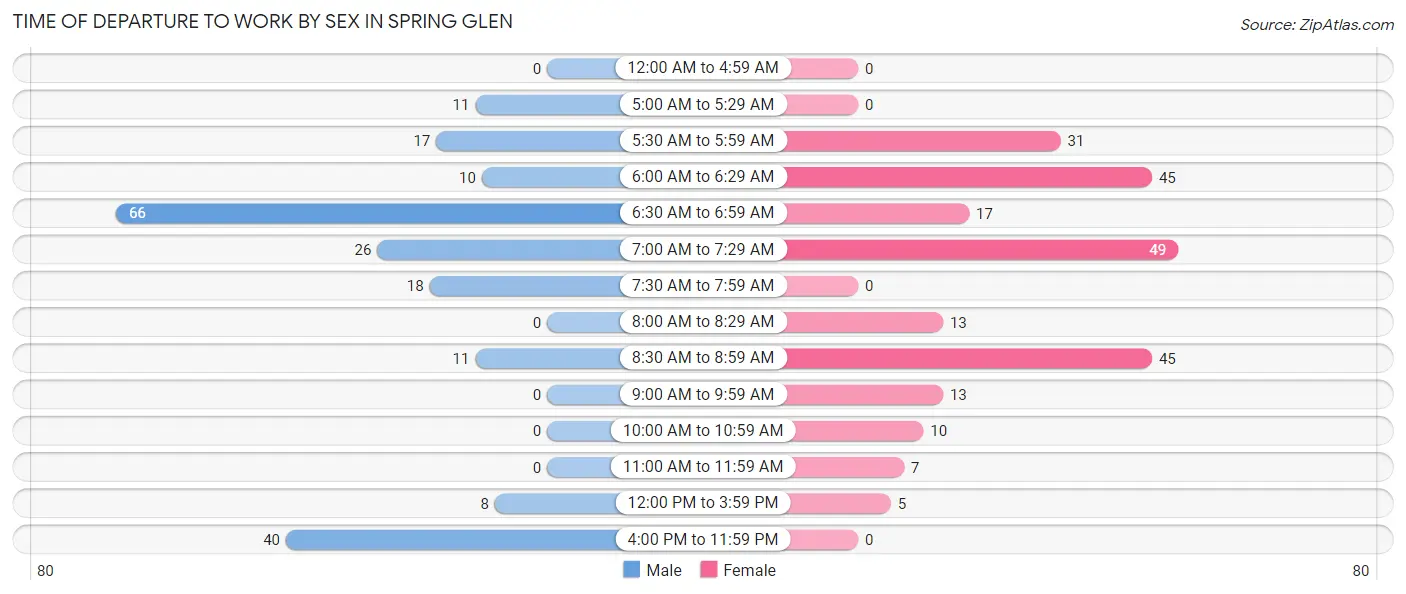
| Time of Departure | Male | Female |
| 12:00 AM to 4:59 AM | 0 (0.0%) | 0 (0.0%) |
| 5:00 AM to 5:29 AM | 11 (5.3%) | 0 (0.0%) |
| 5:30 AM to 5:59 AM | 17 (8.2%) | 31 (13.2%) |
| 6:00 AM to 6:29 AM | 10 (4.8%) | 45 (19.2%) |
| 6:30 AM to 6:59 AM | 66 (31.9%) | 17 (7.2%) |
| 7:00 AM to 7:29 AM | 26 (12.6%) | 49 (20.8%) |
| 7:30 AM to 7:59 AM | 18 (8.7%) | 0 (0.0%) |
| 8:00 AM to 8:29 AM | 0 (0.0%) | 13 (5.5%) |
| 8:30 AM to 8:59 AM | 11 (5.3%) | 45 (19.2%) |
| 9:00 AM to 9:59 AM | 0 (0.0%) | 13 (5.5%) |
| 10:00 AM to 10:59 AM | 0 (0.0%) | 10 (4.3%) |
| 11:00 AM to 11:59 AM | 0 (0.0%) | 7 (3.0%) |
| 12:00 PM to 3:59 PM | 8 (3.9%) | 5 (2.1%) |
| 4:00 PM to 11:59 PM | 40 (19.3%) | 0 (0.0%) |
| Total | 207 (100.0%) | 235 (100.0%) |
Housing Occupancy in Spring Glen
Occupancy by Ownership in Spring Glen
Of the total 477 dwellings in Spring Glen, owner-occupied units account for 275 (57.7%), while renter-occupied units make up 202 (42.3%).
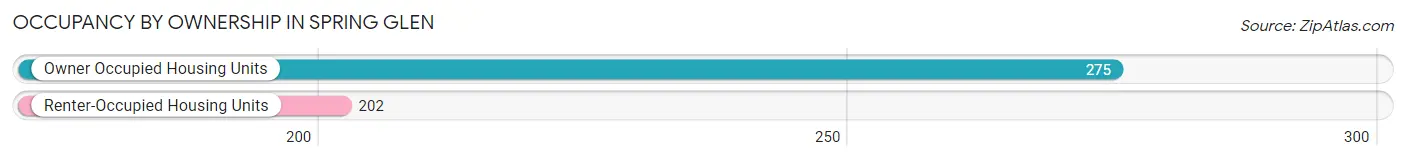
| Occupancy | # Housing Units | % Housing Units |
| Owner Occupied Housing Units | 275 | 57.7% |
| Renter-Occupied Housing Units | 202 | 42.3% |
| Total Occupied Housing Units | 477 | 100.0% |
Occupancy by Household Size in Spring Glen
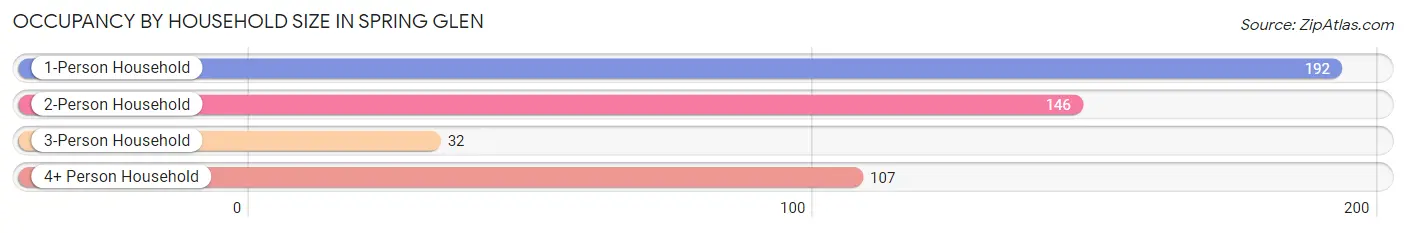
| Household Size | # Housing Units | % Housing Units |
| 1-Person Household | 192 | 40.3% |
| 2-Person Household | 146 | 30.6% |
| 3-Person Household | 32 | 6.7% |
| 4+ Person Household | 107 | 22.4% |
| Total Housing Units | 477 | 100.0% |
Occupancy by Ownership by Household Size in Spring Glen
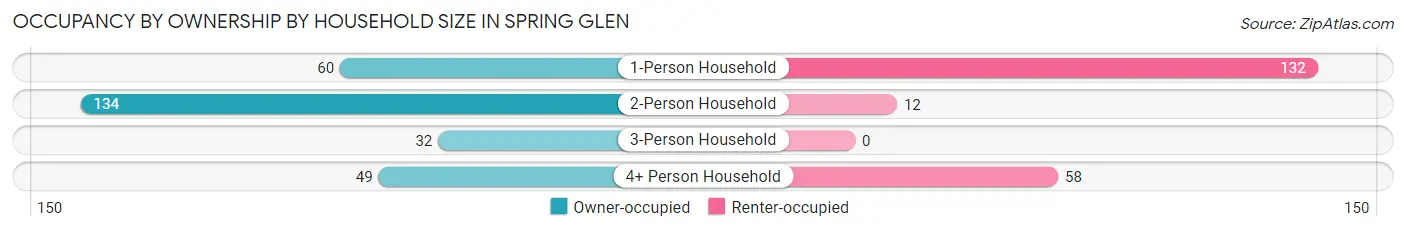
| Household Size | Owner-occupied | Renter-occupied |
| 1-Person Household | 60 (31.2%) | 132 (68.8%) |
| 2-Person Household | 134 (91.8%) | 12 (8.2%) |
| 3-Person Household | 32 (100.0%) | 0 (0.0%) |
| 4+ Person Household | 49 (45.8%) | 58 (54.2%) |
| Total Housing Units | 275 (57.7%) | 202 (42.3%) |
Occupancy by Educational Attainment in Spring Glen
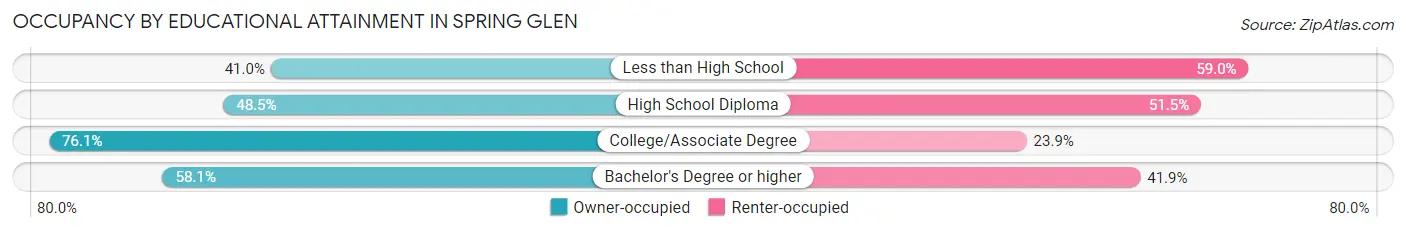
| Household Size | Owner-occupied | Renter-occupied |
| Less than High School | 34 (41.0%) | 49 (59.0%) |
| High School Diploma | 80 (48.5%) | 85 (51.5%) |
| College/Associate Degree | 118 (76.1%) | 37 (23.9%) |
| Bachelor's Degree or higher | 43 (58.1%) | 31 (41.9%) |
Occupancy by Age of Householder in Spring Glen
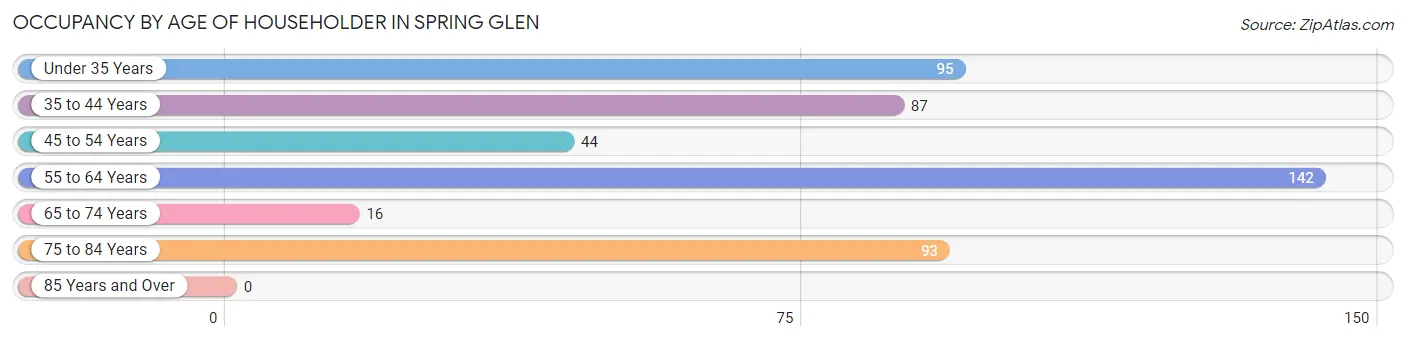
| Age Bracket | # Households | % Households |
| Under 35 Years | 95 | 19.9% |
| 35 to 44 Years | 87 | 18.2% |
| 45 to 54 Years | 44 | 9.2% |
| 55 to 64 Years | 142 | 29.8% |
| 65 to 74 Years | 16 | 3.4% |
| 75 to 84 Years | 93 | 19.5% |
| 85 Years and Over | 0 | 0.0% |
| Total | 477 | 100.0% |
Housing Finances in Spring Glen
Median Income by Occupancy in Spring Glen
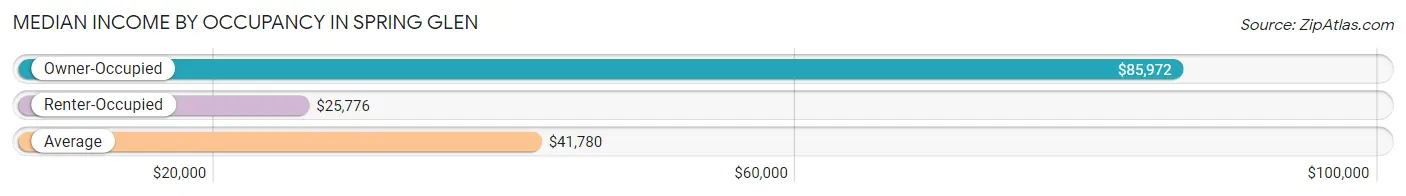
| Occupancy Type | # Households | Median Income |
| Owner-Occupied | 275 (57.7%) | $85,972 |
| Renter-Occupied | 202 (42.3%) | $25,776 |
| Average | 477 (100.0%) | $41,780 |
Occupancy by Householder Income Bracket in Spring Glen
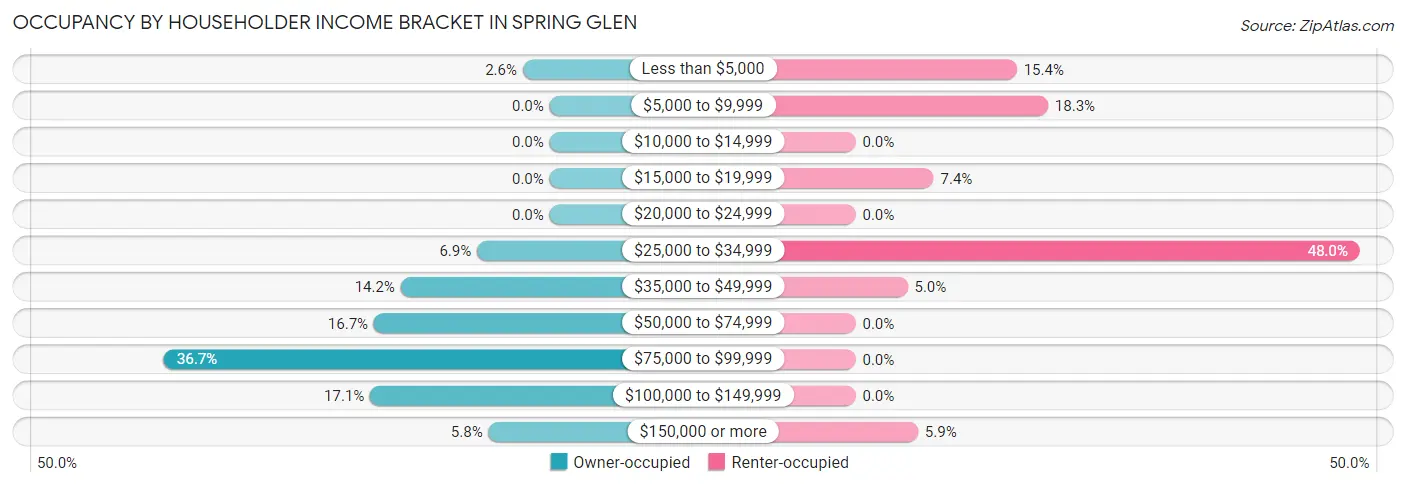
| Income Bracket | Owner-occupied | Renter-occupied |
| Less than $5,000 | 7 (2.5%) | 31 (15.3%) |
| $5,000 to $9,999 | 0 (0.0%) | 37 (18.3%) |
| $10,000 to $14,999 | 0 (0.0%) | 0 (0.0%) |
| $15,000 to $19,999 | 0 (0.0%) | 15 (7.4%) |
| $20,000 to $24,999 | 0 (0.0%) | 0 (0.0%) |
| $25,000 to $34,999 | 19 (6.9%) | 97 (48.0%) |
| $35,000 to $49,999 | 39 (14.2%) | 10 (5.0%) |
| $50,000 to $74,999 | 46 (16.7%) | 0 (0.0%) |
| $75,000 to $99,999 | 101 (36.7%) | 0 (0.0%) |
| $100,000 to $149,999 | 47 (17.1%) | 0 (0.0%) |
| $150,000 or more | 16 (5.8%) | 12 (5.9%) |
| Total | 275 (100.0%) | 202 (100.0%) |
Monthly Housing Cost Tiers in Spring Glen
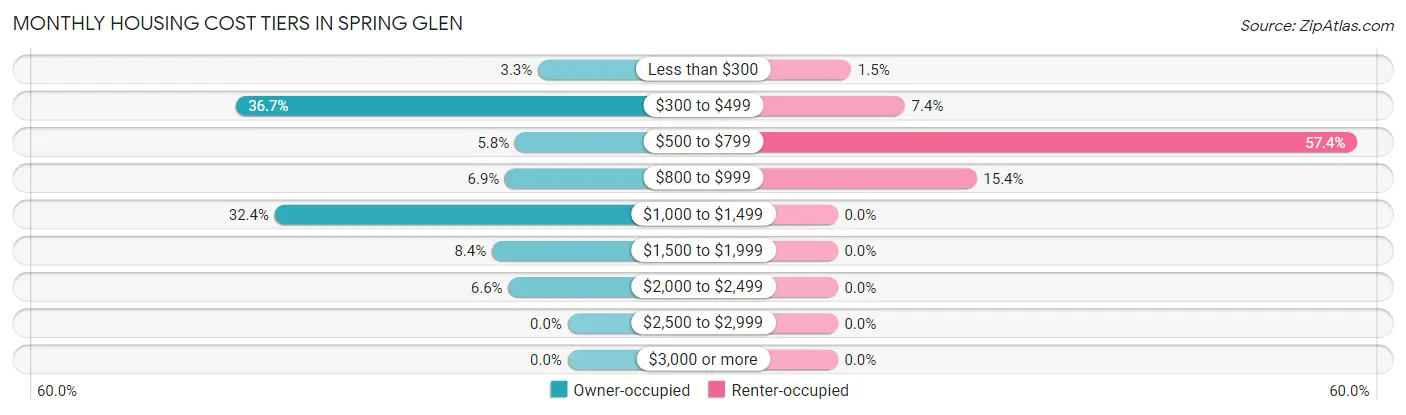
| Monthly Cost | Owner-occupied | Renter-occupied |
| Less than $300 | 9 (3.3%) | 3 (1.5%) |
| $300 to $499 | 101 (36.7%) | 15 (7.4%) |
| $500 to $799 | 16 (5.8%) | 116 (57.4%) |
| $800 to $999 | 19 (6.9%) | 31 (15.3%) |
| $1,000 to $1,499 | 89 (32.4%) | 0 (0.0%) |
| $1,500 to $1,999 | 23 (8.4%) | 0 (0.0%) |
| $2,000 to $2,499 | 18 (6.6%) | 0 (0.0%) |
| $2,500 to $2,999 | 0 (0.0%) | 0 (0.0%) |
| $3,000 or more | 0 (0.0%) | 0 (0.0%) |
| Total | 275 (100.0%) | 202 (100.0%) |
Physical Housing Characteristics in Spring Glen
Housing Structures in Spring Glen
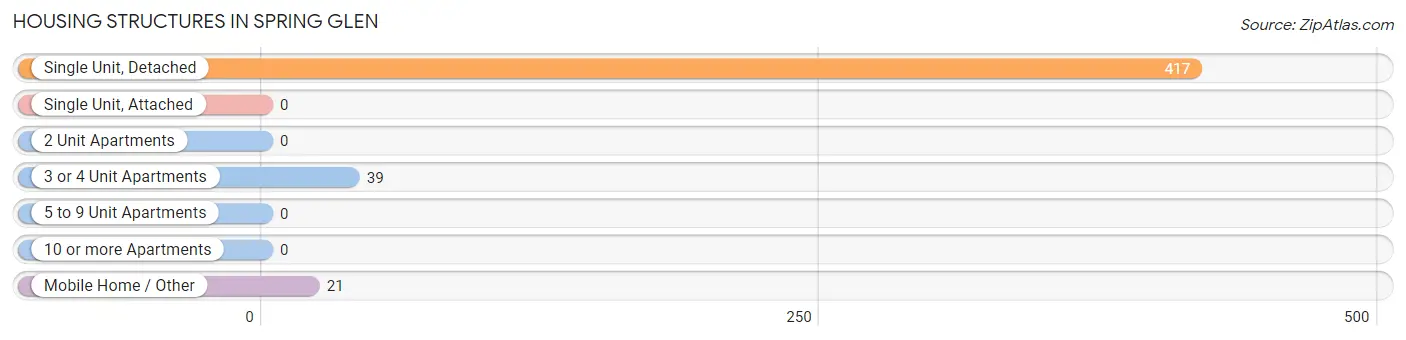
| Structure Type | # Housing Units | % Housing Units |
| Single Unit, Detached | 417 | 87.4% |
| Single Unit, Attached | 0 | 0.0% |
| 2 Unit Apartments | 0 | 0.0% |
| 3 or 4 Unit Apartments | 39 | 8.2% |
| 5 to 9 Unit Apartments | 0 | 0.0% |
| 10 or more Apartments | 0 | 0.0% |
| Mobile Home / Other | 21 | 4.4% |
| Total | 477 | 100.0% |
Housing Structures by Occupancy in Spring Glen
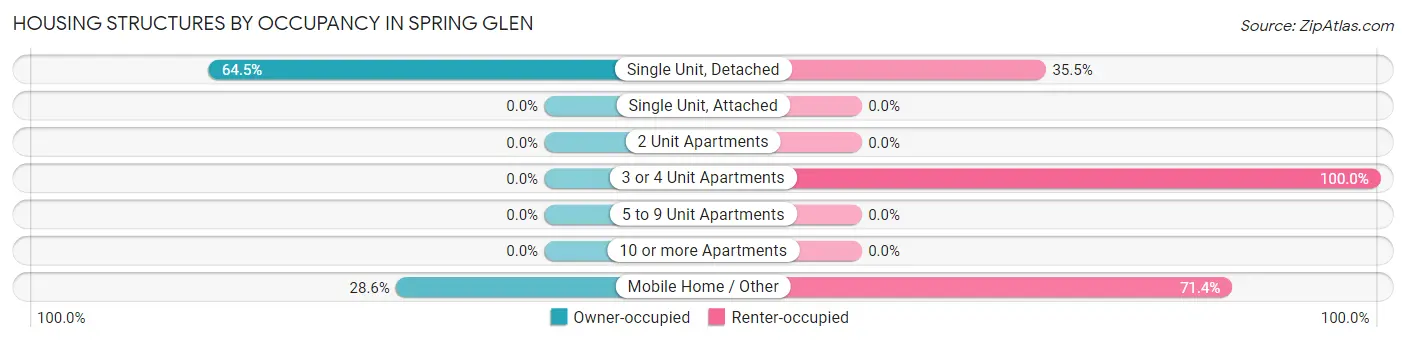
| Structure Type | Owner-occupied | Renter-occupied |
| Single Unit, Detached | 269 (64.5%) | 148 (35.5%) |
| Single Unit, Attached | 0 (0.0%) | 0 (0.0%) |
| 2 Unit Apartments | 0 (0.0%) | 0 (0.0%) |
| 3 or 4 Unit Apartments | 0 (0.0%) | 39 (100.0%) |
| 5 to 9 Unit Apartments | 0 (0.0%) | 0 (0.0%) |
| 10 or more Apartments | 0 (0.0%) | 0 (0.0%) |
| Mobile Home / Other | 6 (28.6%) | 15 (71.4%) |
| Total | 275 (57.7%) | 202 (42.3%) |
Housing Structures by Number of Rooms in Spring Glen
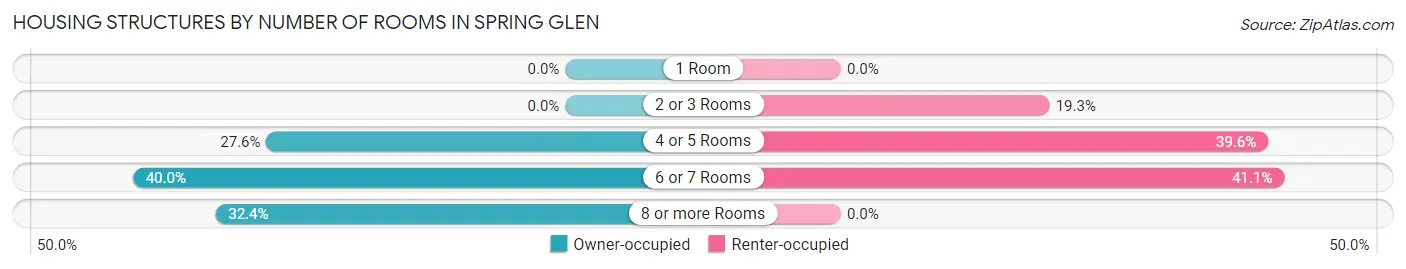
| Number of Rooms | Owner-occupied | Renter-occupied |
| 1 Room | 0 (0.0%) | 0 (0.0%) |
| 2 or 3 Rooms | 0 (0.0%) | 39 (19.3%) |
| 4 or 5 Rooms | 76 (27.6%) | 80 (39.6%) |
| 6 or 7 Rooms | 110 (40.0%) | 83 (41.1%) |
| 8 or more Rooms | 89 (32.4%) | 0 (0.0%) |
| Total | 275 (100.0%) | 202 (100.0%) |
Housing Structure by Heating Type in Spring Glen
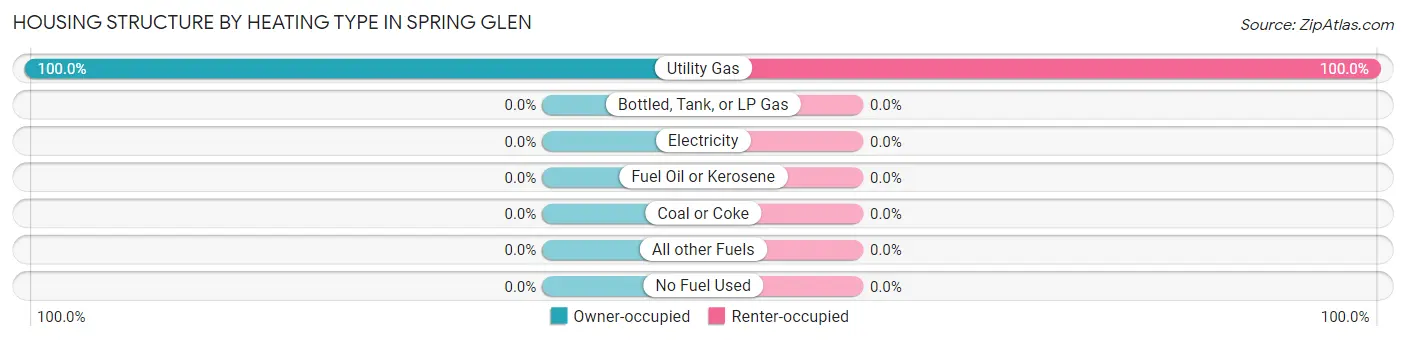
| Heating Type | Owner-occupied | Renter-occupied |
| Utility Gas | 275 (100.0%) | 202 (100.0%) |
| Bottled, Tank, or LP Gas | 0 (0.0%) | 0 (0.0%) |
| Electricity | 0 (0.0%) | 0 (0.0%) |
| Fuel Oil or Kerosene | 0 (0.0%) | 0 (0.0%) |
| Coal or Coke | 0 (0.0%) | 0 (0.0%) |
| All other Fuels | 0 (0.0%) | 0 (0.0%) |
| No Fuel Used | 0 (0.0%) | 0 (0.0%) |
| Total | 275 (100.0%) | 202 (100.0%) |
Household Vehicle Usage in Spring Glen
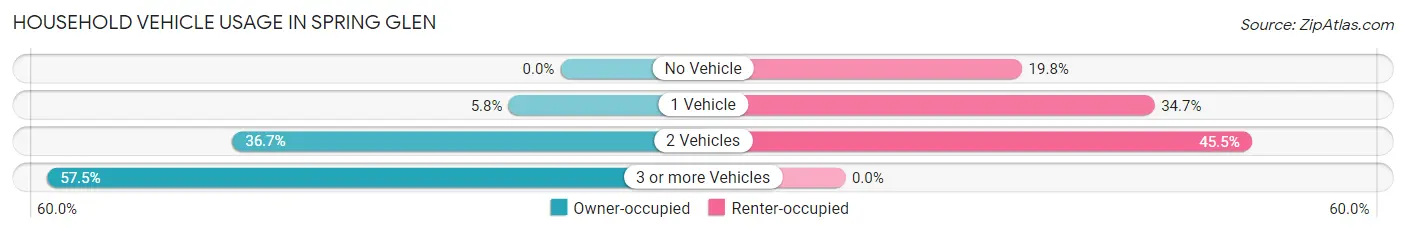
| Vehicles per Household | Owner-occupied | Renter-occupied |
| No Vehicle | 0 (0.0%) | 40 (19.8%) |
| 1 Vehicle | 16 (5.8%) | 70 (34.6%) |
| 2 Vehicles | 101 (36.7%) | 92 (45.5%) |
| 3 or more Vehicles | 158 (57.5%) | 0 (0.0%) |
| Total | 275 (100.0%) | 202 (100.0%) |
Real Estate & Mortgages in Spring Glen
Real Estate and Mortgage Overview in Spring Glen
| Characteristic | Without Mortgage | With Mortgage |
| Housing Units | 132 | 143 |
| Median Property Value | $193,800 | $220,900 |
| Median Household Income | $85,313 | $6 |
| Monthly Housing Costs | $423 | $0 |
| Real Estate Taxes | $1,385 | $0 |
Property Value by Mortgage Status in Spring Glen
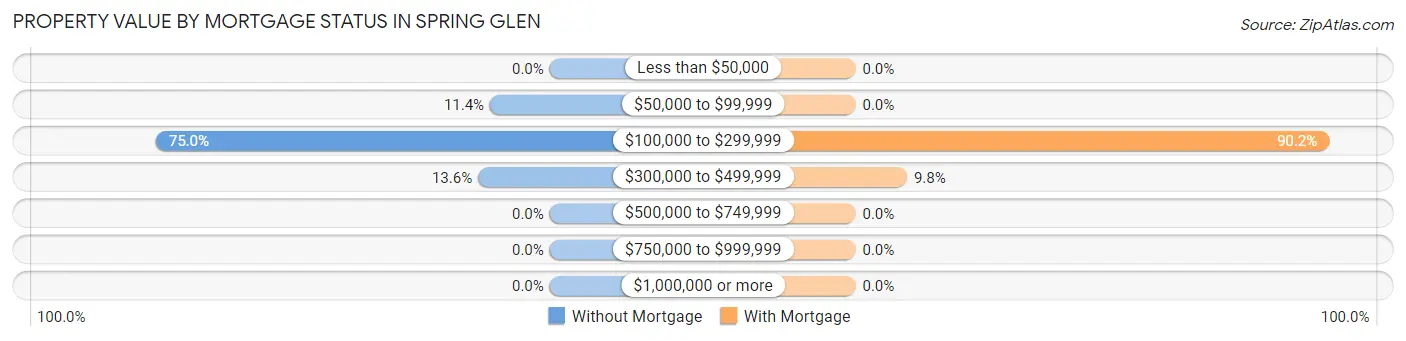
| Property Value | Without Mortgage | With Mortgage |
| Less than $50,000 | 0 (0.0%) | 0 (0.0%) |
| $50,000 to $99,999 | 15 (11.4%) | 0 (0.0%) |
| $100,000 to $299,999 | 99 (75.0%) | 129 (90.2%) |
| $300,000 to $499,999 | 18 (13.6%) | 14 (9.8%) |
| $500,000 to $749,999 | 0 (0.0%) | 0 (0.0%) |
| $750,000 to $999,999 | 0 (0.0%) | 0 (0.0%) |
| $1,000,000 or more | 0 (0.0%) | 0 (0.0%) |
| Total | 132 (100.0%) | 143 (100.0%) |
Household Income by Mortgage Status in Spring Glen
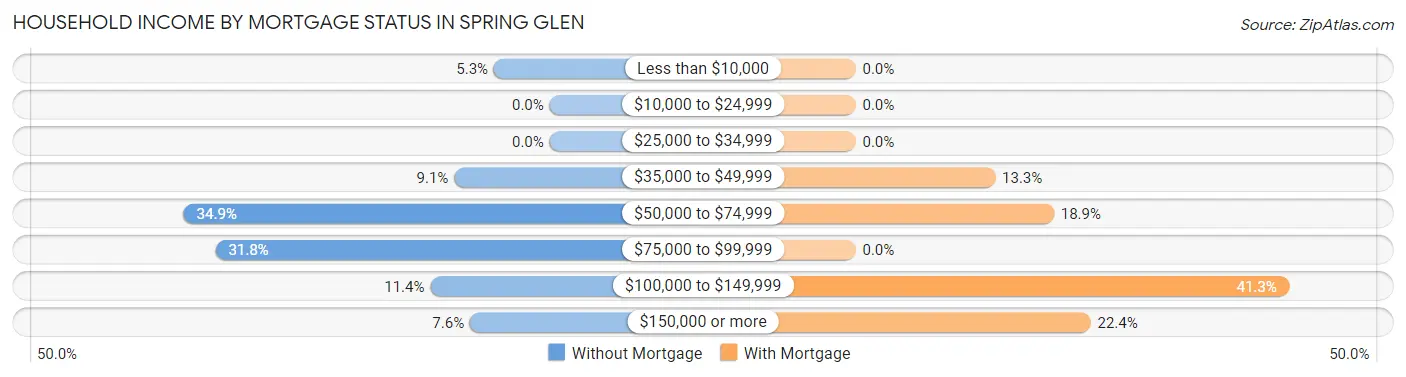
| Household Income | Without Mortgage | With Mortgage |
| Less than $10,000 | 7 (5.3%) | 0 (0.0%) |
| $10,000 to $24,999 | 0 (0.0%) | 0 (0.0%) |
| $25,000 to $34,999 | 0 (0.0%) | 0 (0.0%) |
| $35,000 to $49,999 | 12 (9.1%) | 19 (13.3%) |
| $50,000 to $74,999 | 46 (34.8%) | 27 (18.9%) |
| $75,000 to $99,999 | 42 (31.8%) | 0 (0.0%) |
| $100,000 to $149,999 | 15 (11.4%) | 59 (41.3%) |
| $150,000 or more | 10 (7.6%) | 32 (22.4%) |
| Total | 132 (100.0%) | 143 (100.0%) |
Property Value to Household Income Ratio in Spring Glen
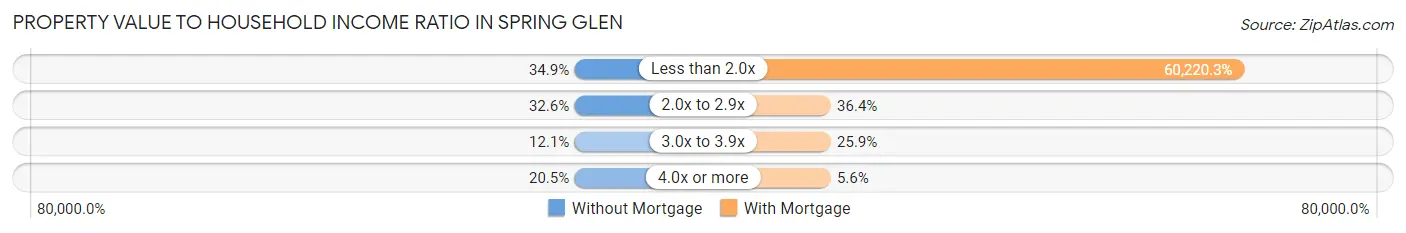
| Value-to-Income Ratio | Without Mortgage | With Mortgage |
| Less than 2.0x | 46 (34.8%) | 86,115 (60,220.3%) |
| 2.0x to 2.9x | 43 (32.6%) | 52 (36.4%) |
| 3.0x to 3.9x | 16 (12.1%) | 37 (25.9%) |
| 4.0x or more | 27 (20.4%) | 8 (5.6%) |
| Total | 132 (100.0%) | 143 (100.0%) |
Real Estate Taxes by Mortgage Status in Spring Glen
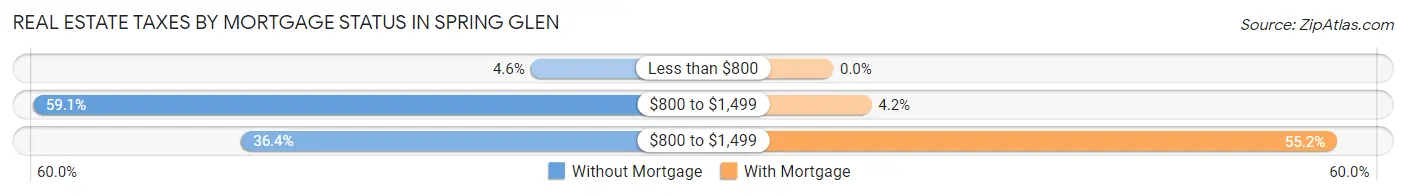
| Property Taxes | Without Mortgage | With Mortgage |
| Less than $800 | 6 (4.5%) | 0 (0.0%) |
| $800 to $1,499 | 78 (59.1%) | 6 (4.2%) |
| $800 to $1,499 | 48 (36.4%) | 79 (55.2%) |
| Total | 132 (100.0%) | 143 (100.0%) |
Health & Disability in Spring Glen
Health Insurance Coverage by Age in Spring Glen
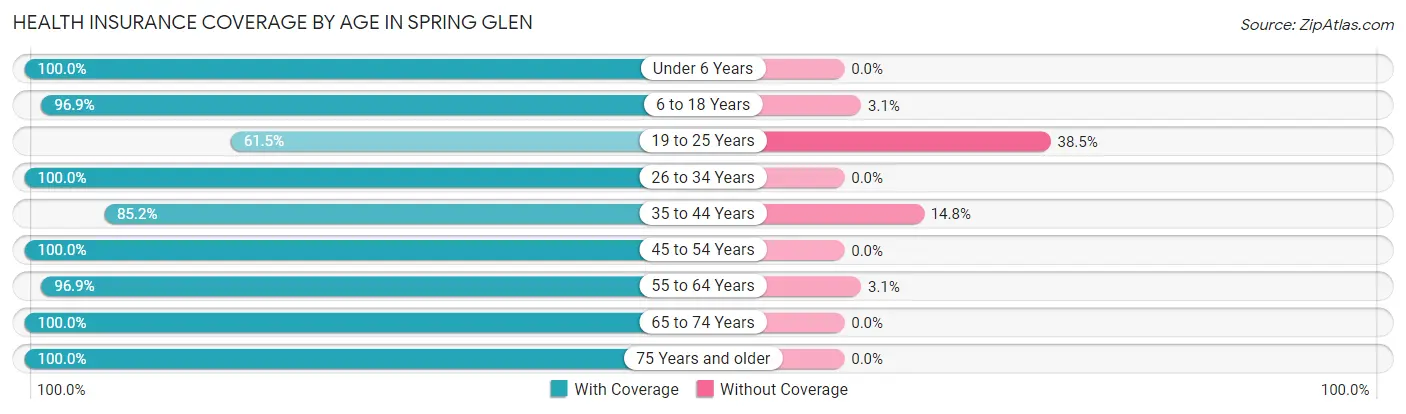
| Age Bracket | With Coverage | Without Coverage |
| Under 6 Years | 8 (100.0%) | 0 (0.0%) |
| 6 to 18 Years | 309 (96.9%) | 10 (3.1%) |
| 19 to 25 Years | 8 (61.5%) | 5 (38.5%) |
| 26 to 34 Years | 133 (100.0%) | 0 (0.0%) |
| 35 to 44 Years | 115 (85.2%) | 20 (14.8%) |
| 45 to 54 Years | 81 (100.0%) | 0 (0.0%) |
| 55 to 64 Years | 217 (96.9%) | 7 (3.1%) |
| 65 to 74 Years | 44 (100.0%) | 0 (0.0%) |
| 75 Years and older | 113 (100.0%) | 0 (0.0%) |
| Total | 1,028 (96.1%) | 42 (3.9%) |
Health Insurance Coverage by Citizenship Status in Spring Glen
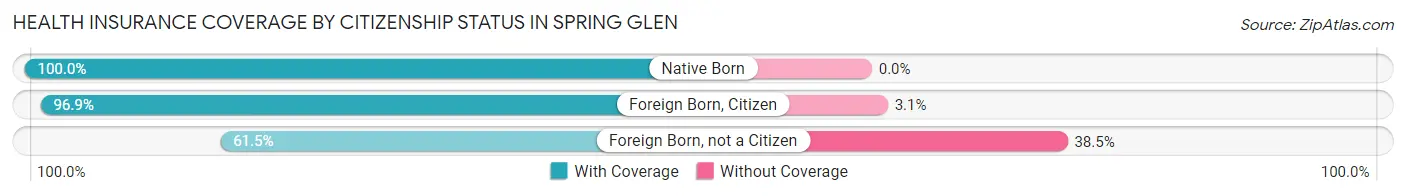
| Citizenship Status | With Coverage | Without Coverage |
| Native Born | 8 (100.0%) | 0 (0.0%) |
| Foreign Born, Citizen | 309 (96.9%) | 10 (3.1%) |
| Foreign Born, not a Citizen | 8 (61.5%) | 5 (38.5%) |
Health Insurance Coverage by Household Income in Spring Glen
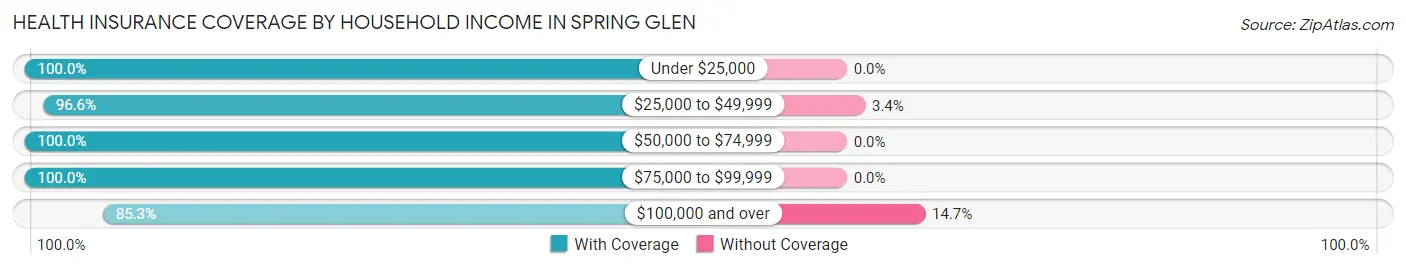
| Household Income | With Coverage | Without Coverage |
| Under $25,000 | 90 (100.0%) | 0 (0.0%) |
| $25,000 to $49,999 | 395 (96.6%) | 14 (3.4%) |
| $50,000 to $74,999 | 80 (100.0%) | 0 (0.0%) |
| $75,000 to $99,999 | 300 (100.0%) | 0 (0.0%) |
| $100,000 and over | 163 (85.3%) | 28 (14.7%) |
Public vs Private Health Insurance Coverage by Age in Spring Glen
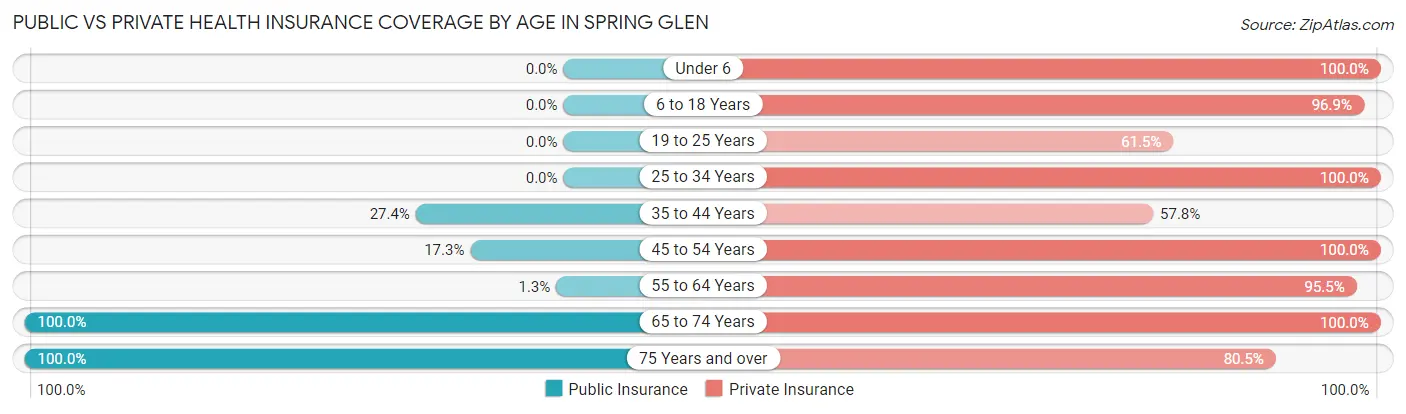
| Age Bracket | Public Insurance | Private Insurance |
| Under 6 | 0 (0.0%) | 8 (100.0%) |
| 6 to 18 Years | 0 (0.0%) | 309 (96.9%) |
| 19 to 25 Years | 0 (0.0%) | 8 (61.5%) |
| 25 to 34 Years | 0 (0.0%) | 133 (100.0%) |
| 35 to 44 Years | 37 (27.4%) | 78 (57.8%) |
| 45 to 54 Years | 14 (17.3%) | 81 (100.0%) |
| 55 to 64 Years | 3 (1.3%) | 214 (95.5%) |
| 65 to 74 Years | 44 (100.0%) | 44 (100.0%) |
| 75 Years and over | 113 (100.0%) | 91 (80.5%) |
| Total | 211 (19.7%) | 966 (90.3%) |
Disability Status by Sex by Age in Spring Glen
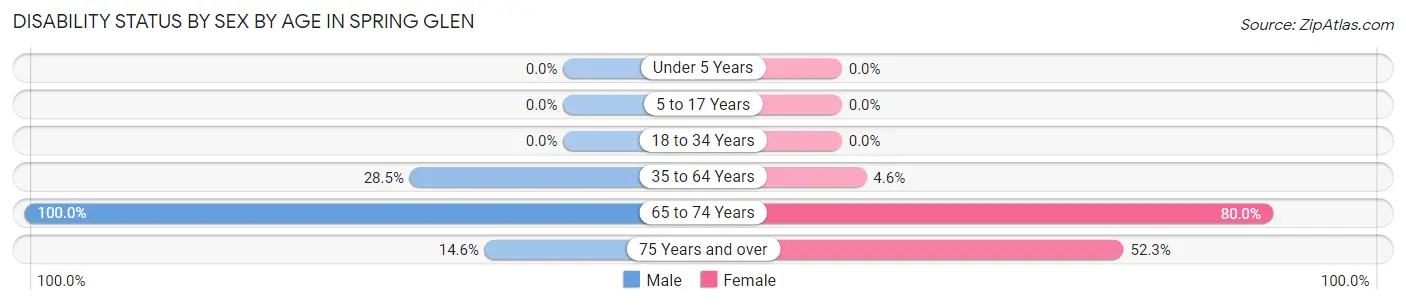
| Age Bracket | Male | Female |
| Under 5 Years | 0 (0.0%) | 0 (0.0%) |
| 5 to 17 Years | 0 (0.0%) | 0 (0.0%) |
| 18 to 34 Years | 0 (0.0%) | 0 (0.0%) |
| 35 to 64 Years | 63 (28.5%) | 10 (4.6%) |
| 65 to 74 Years | 24 (100.0%) | 16 (80.0%) |
| 75 Years and over | 7 (14.6%) | 34 (52.3%) |
Disability Class by Sex by Age in Spring Glen
Disability Class: Hearing Difficulty
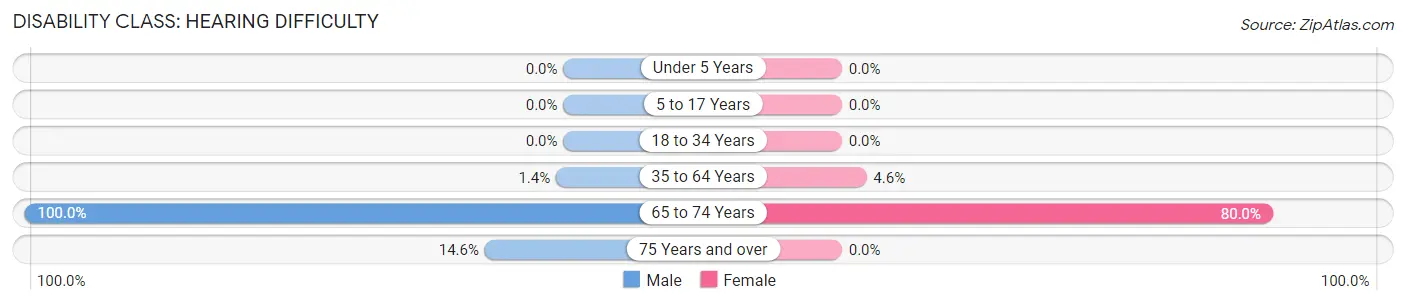
| Age Bracket | Male | Female |
| Under 5 Years | 0 (0.0%) | 0 (0.0%) |
| 5 to 17 Years | 0 (0.0%) | 0 (0.0%) |
| 18 to 34 Years | 0 (0.0%) | 0 (0.0%) |
| 35 to 64 Years | 3 (1.4%) | 10 (4.6%) |
| 65 to 74 Years | 24 (100.0%) | 16 (80.0%) |
| 75 Years and over | 7 (14.6%) | 0 (0.0%) |
Disability Class: Vision Difficulty
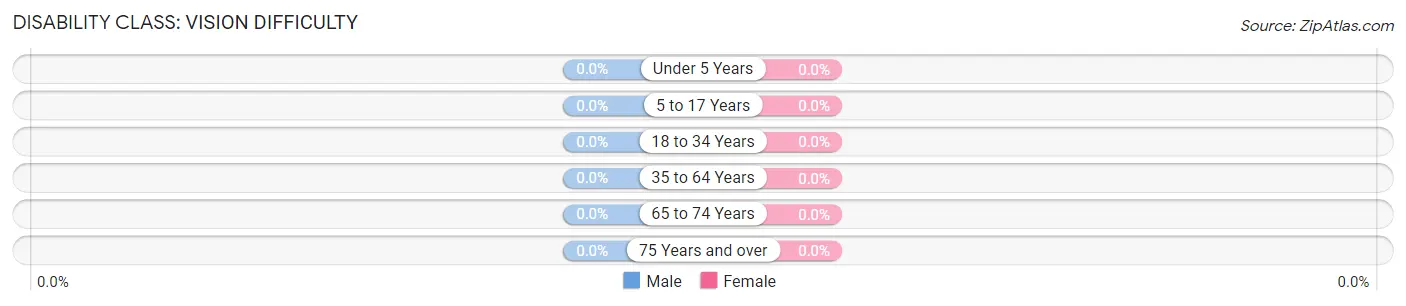
| Age Bracket | Male | Female |
| Under 5 Years | 0 (0.0%) | 0 (0.0%) |
| 5 to 17 Years | 0 (0.0%) | 0 (0.0%) |
| 18 to 34 Years | 0 (0.0%) | 0 (0.0%) |
| 35 to 64 Years | 0 (0.0%) | 0 (0.0%) |
| 65 to 74 Years | 0 (0.0%) | 0 (0.0%) |
| 75 Years and over | 0 (0.0%) | 0 (0.0%) |
Disability Class: Cognitive Difficulty
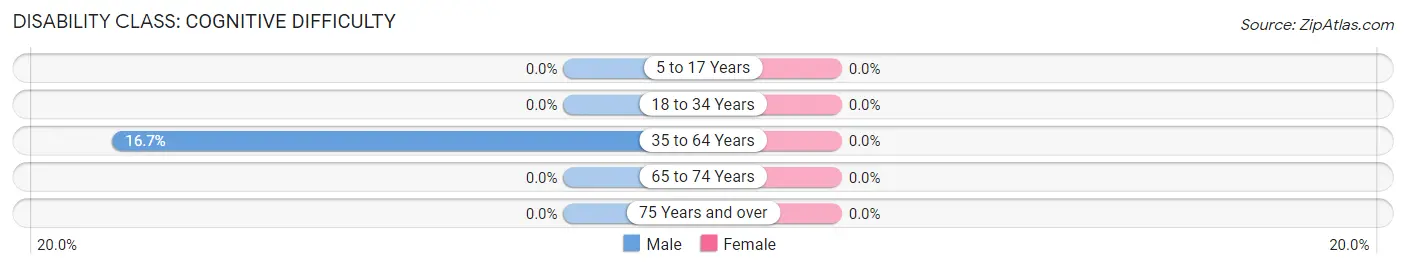
| Age Bracket | Male | Female |
| 5 to 17 Years | 0 (0.0%) | 0 (0.0%) |
| 18 to 34 Years | 0 (0.0%) | 0 (0.0%) |
| 35 to 64 Years | 37 (16.7%) | 0 (0.0%) |
| 65 to 74 Years | 0 (0.0%) | 0 (0.0%) |
| 75 Years and over | 0 (0.0%) | 0 (0.0%) |
Disability Class: Ambulatory Difficulty
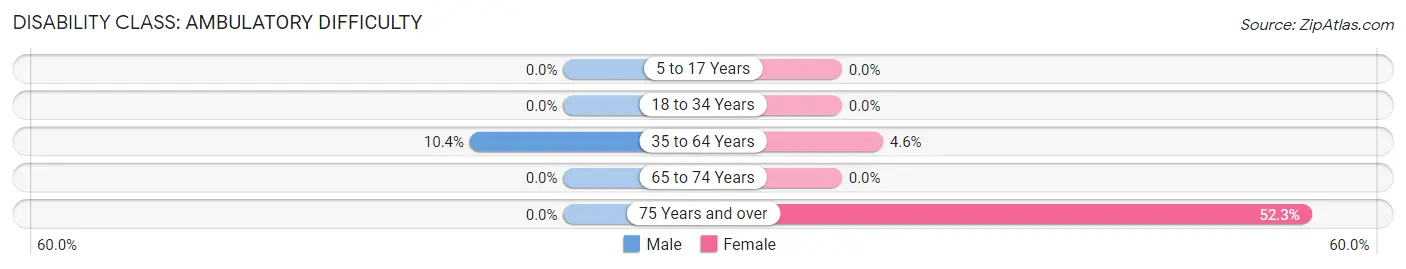
| Age Bracket | Male | Female |
| 5 to 17 Years | 0 (0.0%) | 0 (0.0%) |
| 18 to 34 Years | 0 (0.0%) | 0 (0.0%) |
| 35 to 64 Years | 23 (10.4%) | 10 (4.6%) |
| 65 to 74 Years | 0 (0.0%) | 0 (0.0%) |
| 75 Years and over | 0 (0.0%) | 34 (52.3%) |
Disability Class: Self-Care Difficulty
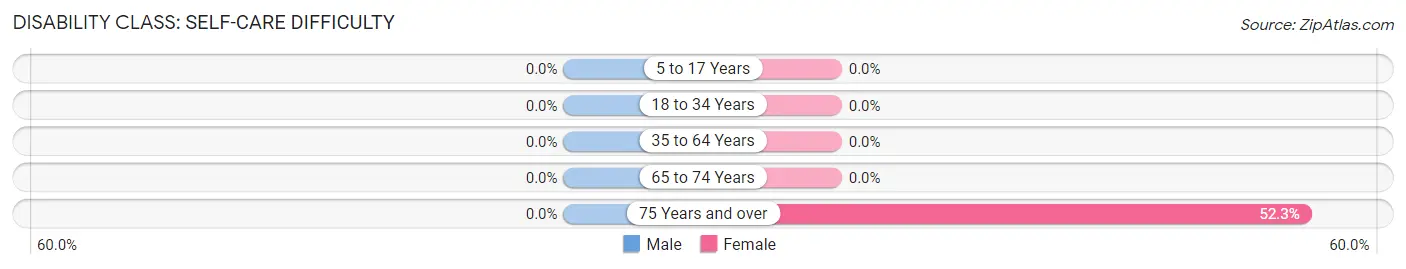
| Age Bracket | Male | Female |
| 5 to 17 Years | 0 (0.0%) | 0 (0.0%) |
| 18 to 34 Years | 0 (0.0%) | 0 (0.0%) |
| 35 to 64 Years | 0 (0.0%) | 0 (0.0%) |
| 65 to 74 Years | 0 (0.0%) | 0 (0.0%) |
| 75 Years and over | 0 (0.0%) | 34 (52.3%) |
Technology Access in Spring Glen
Computing Device Access in Spring Glen
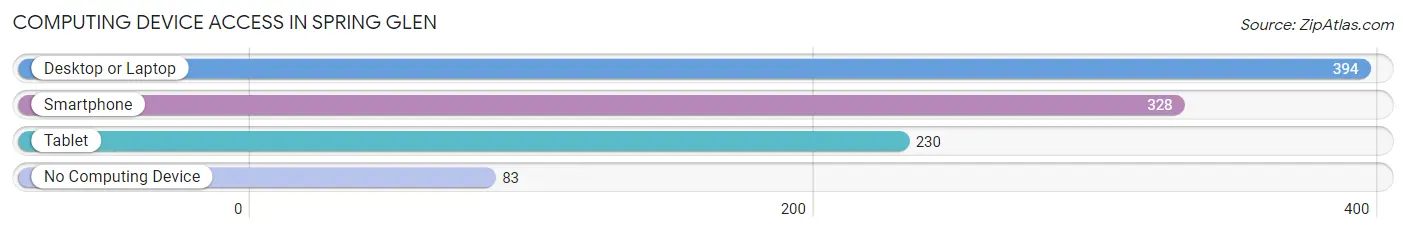
| Device Type | # Households | % Households |
| Desktop or Laptop | 394 | 82.6% |
| Smartphone | 328 | 68.8% |
| Tablet | 230 | 48.2% |
| No Computing Device | 83 | 17.4% |
| Total | 477 | 100.0% |
Internet Access in Spring Glen
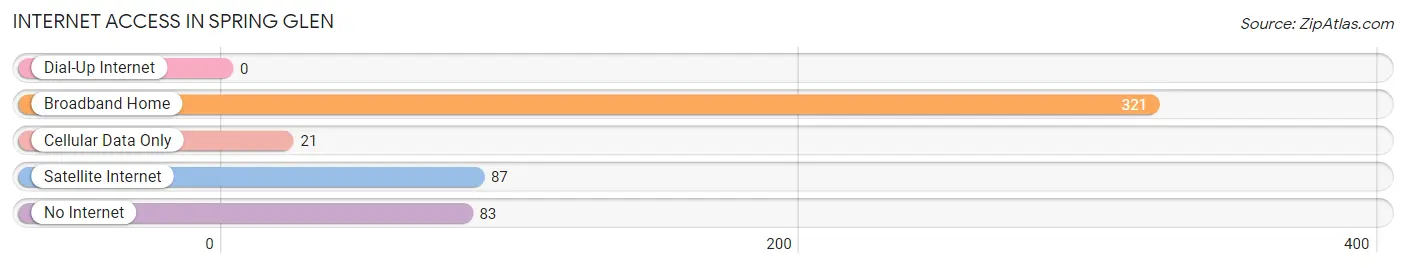
| Internet Type | # Households | % Households |
| Dial-Up Internet | 0 | 0.0% |
| Broadband Home | 321 | 67.3% |
| Cellular Data Only | 21 | 4.4% |
| Satellite Internet | 87 | 18.2% |
| No Internet | 83 | 17.4% |
| Total | 477 | 100.0% |
Spring Glen Summary
History
The small town of Spring Glen, Utah is located in the southeastern corner of the state, just north of the Arizona border. It is part of the San Juan County and is situated in the Four Corners region of the United States. The town was first settled in the late 1800s by Mormon pioneers who were looking for a place to settle and raise their families. The town was originally called Spring Glen because of the abundance of natural springs in the area.
The town was officially incorporated in 1891 and was home to a variety of businesses, including a general store, a blacksmith shop, a hotel, and a post office. The town was also home to a number of churches, including the Church of Jesus Christ of Latter-day Saints, which is still active today.
The town experienced a period of growth in the early 1900s, when the railroad came through the area. This allowed for the transportation of goods and people, and the town began to thrive. The population of Spring Glen grew to over 500 people by the 1930s.
The town experienced a decline in the 1950s and 1960s, as many of the businesses closed and the population decreased. However, the town has experienced a resurgence in recent years, as new businesses have opened and the population has grown.
Geography
Spring Glen is located in the southeastern corner of Utah, just north of the Arizona border. It is part of the San Juan County and is situated in the Four Corners region of the United States. The town is located in a valley surrounded by mountains, and is situated at an elevation of 5,000 feet.
The town is located near the San Juan River, which is a major tributary of the Colorado River. The town is also located near the Navajo Nation, which is the largest Native American reservation in the United States.
The climate in Spring Glen is semi-arid, with hot summers and cold winters. The average annual temperature is around 50 degrees Fahrenheit, and the average annual precipitation is around 10 inches.
Economy
The economy of Spring Glen is largely based on agriculture and tourism. The town is home to a number of farms, which produce a variety of crops, including corn, wheat, and hay. The town is also home to a number of tourist attractions, including the Four Corners Monument, which is the only place in the United States where four states meet.
The town is also home to a number of businesses, including restaurants, hotels, and retail stores. The town is also home to a number of manufacturing companies, which produce a variety of products, including furniture, clothing, and electronics.
Demographics
As of the 2010 census, the population of Spring Glen was 1,845. The population is largely made up of white (90.2%) and Native American (7.2%) residents. The median household income is $37,917, and the median age is 37.
The town is home to a number of churches, including the Church of Jesus Christ of Latter-day Saints, which is still active today. The town is also home to a number of schools, including Spring Glen Elementary School and Spring Glen High School.
Conclusion
Spring Glen, Utah is a small town located in the southeastern corner of the state, just north of the Arizona border. The town was first settled in the late 1800s by Mormon pioneers, and has since experienced a period of growth and decline. The town is now experiencing a resurgence, as new businesses have opened and the population has grown. The economy of Spring Glen is largely based on agriculture and tourism, and the population is largely made up of white and Native American residents. The town is home to a number of churches, schools, and businesses, and is a great place to live and visit.
Common Questions
What is Per Capita Income in Spring Glen?
Per Capita income in Spring Glen is $27,111.
What is the Median Family Income in Spring Glen?
Median Family Income in Spring Glen is $86,361.
What is the Median Household income in Spring Glen?
Median Household Income in Spring Glen is $41,780.
What is Inequality or Gini Index in Spring Glen?
Inequality or Gini Index in Spring Glen is 0.44.
What is the Total Population of Spring Glen?
Total Population of Spring Glen is 1,070.
What is the Total Male Population of Spring Glen?
Total Male Population of Spring Glen is 372.
What is the Total Female Population of Spring Glen?
Total Female Population of Spring Glen is 698.
What is the Ratio of Males per 100 Females in Spring Glen?
There are 53.30 Males per 100 Females in Spring Glen.
What is the Ratio of Females per 100 Males in Spring Glen?
There are 187.63 Females per 100 Males in Spring Glen.
What is the Median Population Age in Spring Glen?
Median Population Age in Spring Glen is 37.9 Years.
What is the Average Family Size in Spring Glen
Average Family Size in Spring Glen is 3.1 People.
What is the Average Household Size in Spring Glen
Average Household Size in Spring Glen is 2.2 People.
How Large is the Labor Force in Spring Glen?
There are 494 People in the Labor Forcein in Spring Glen.
What is the Percentage of People in the Labor Force in Spring Glen?
63.5% of People are in the Labor Force in Spring Glen.