Spanish Valley, UT Map & Demographics
Spanish Valley Map
Spanish Valley Overview
$57,494
PER CAPITA INCOME
$93,000
AVG FAMILY INCOME
$98,063
AVG HOUSEHOLD INCOME
46.7%
WAGE / INCOME GAP [ % ]
53.3¢/ $1
WAGE / INCOME GAP [ $ ]
0.52
INEQUALITY / GINI INDEX
545
TOTAL POPULATION
299
MALE POPULATION
246
FEMALE POPULATION
121.54
MALES / 100 FEMALES
82.27
FEMALES / 100 MALES
48.3
MEDIAN AGE
3.0
AVG FAMILY SIZE
2.7
AVG HOUSEHOLD SIZE
363
LABOR FORCE [ PEOPLE ]
77.2%
PERCENT IN LABOR FORCE
Income in Spanish Valley
Income Overview in Spanish Valley
Per Capita Income in Spanish Valley is $57,494, while median incomes of families and households are $93,000 and $98,063 respectively.
| Characteristic | Number | Measure |
| Per Capita Income | 545 | $57,494 |
| Median Family Income | 158 | $93,000 |
| Mean Family Income | 158 | $80,606 |
| Median Household Income | 200 | $98,063 |
| Mean Household Income | 200 | $150,802 |
| Income Deficit | 158 | $0 |
| Wage / Income Gap (%) | 545 | 46.67% |
| Wage / Income Gap ($) | 545 | 53.33¢ per $1 |
| Gini / Inequality Index | 545 | 0.52 |
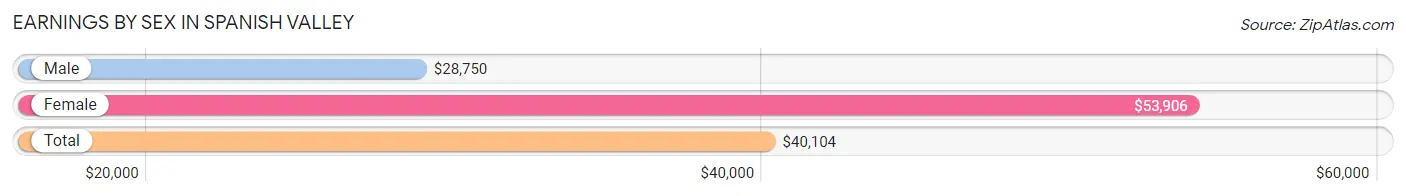
Earnings by Sex in Spanish Valley
Average Earnings in Spanish Valley are $40,104, $28,750 for men and $53,906 for women, a difference of 46.7%.
| Sex | Number | Average Earnings |
| Male | 222 (61.2%) | $28,750 |
| Female | 141 (38.8%) | $53,906 |
| Total | 363 (100.0%) | $40,104 |
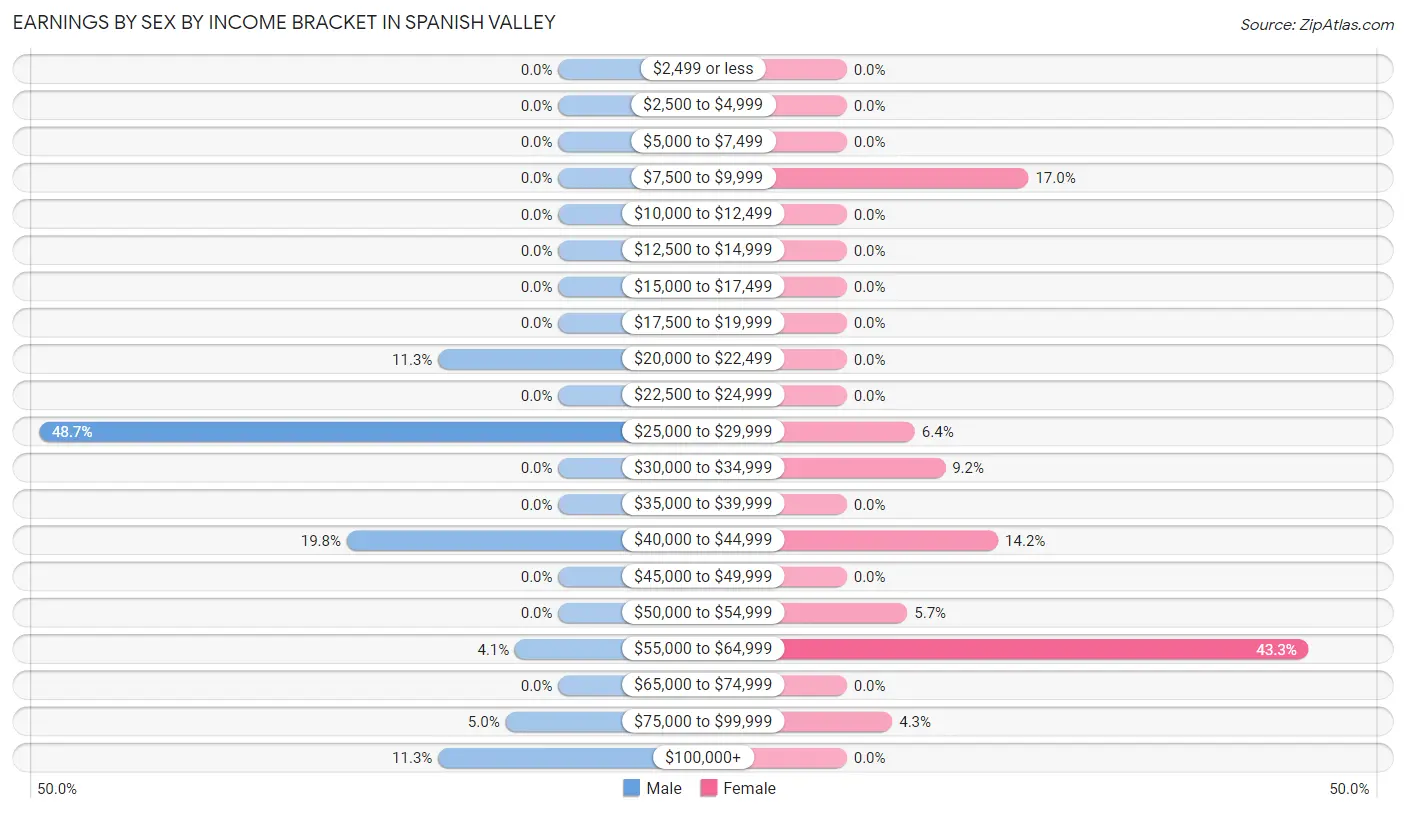
Earnings by Sex by Income Bracket in Spanish Valley
The most common earnings brackets in Spanish Valley are $25,000 to $29,999 for men (108 | 48.6%) and $55,000 to $64,999 for women (61 | 43.3%).
| Income | Male | Female |
| $2,499 or less | 0 (0.0%) | 0 (0.0%) |
| $2,500 to $4,999 | 0 (0.0%) | 0 (0.0%) |
| $5,000 to $7,499 | 0 (0.0%) | 0 (0.0%) |
| $7,500 to $9,999 | 0 (0.0%) | 24 (17.0%) |
| $10,000 to $12,499 | 0 (0.0%) | 0 (0.0%) |
| $12,500 to $14,999 | 0 (0.0%) | 0 (0.0%) |
| $15,000 to $17,499 | 0 (0.0%) | 0 (0.0%) |
| $17,500 to $19,999 | 0 (0.0%) | 0 (0.0%) |
| $20,000 to $22,499 | 25 (11.3%) | 0 (0.0%) |
| $22,500 to $24,999 | 0 (0.0%) | 0 (0.0%) |
| $25,000 to $29,999 | 108 (48.6%) | 9 (6.4%) |
| $30,000 to $34,999 | 0 (0.0%) | 13 (9.2%) |
| $35,000 to $39,999 | 0 (0.0%) | 0 (0.0%) |
| $40,000 to $44,999 | 44 (19.8%) | 20 (14.2%) |
| $45,000 to $49,999 | 0 (0.0%) | 0 (0.0%) |
| $50,000 to $54,999 | 0 (0.0%) | 8 (5.7%) |
| $55,000 to $64,999 | 9 (4.1%) | 61 (43.3%) |
| $65,000 to $74,999 | 0 (0.0%) | 0 (0.0%) |
| $75,000 to $99,999 | 11 (5.0%) | 6 (4.3%) |
| $100,000+ | 25 (11.3%) | 0 (0.0%) |
| Total | 222 (100.0%) | 141 (100.0%) |
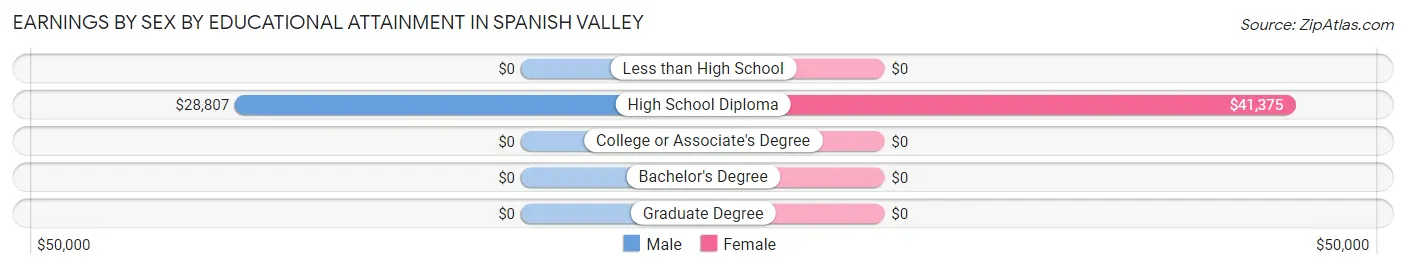
Earnings by Sex by Educational Attainment in Spanish Valley
Average earnings in Spanish Valley are $29,545 for men and $53,906 for women, a difference of 45.2%. Men with an educational attainment of high school diploma enjoy the highest average annual earnings of $28,807, while those with high school diploma education earn the least with $28,807. Women with an educational attainment of high school diploma earn the most with the average annual earnings of $41,375, while those with high school diploma education have the smallest earnings of $41,375.
| Educational Attainment | Male Income | Female Income |
| Less than High School | - | - |
| High School Diploma | $28,807 | $41,375 |
| College or Associate's Degree | - | - |
| Bachelor's Degree | - | - |
| Graduate Degree | - | - |
| Total | $29,545 | $53,906 |
Family Income in Spanish Valley
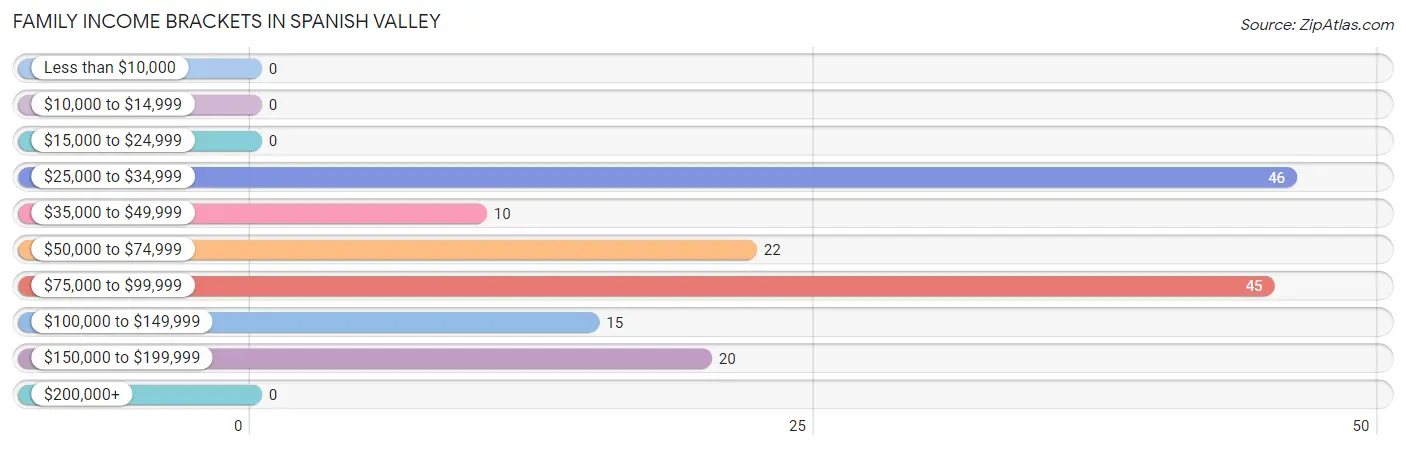
Family Income Brackets in Spanish Valley
According to the Spanish Valley family income data, there are 46 families falling into the $25,000 to $34,999 income range, which is the most common income bracket and makes up 29.1% of all families.
| Income Bracket | # Families | % Families |
| Less than $10,000 | 0 | 0.0% |
| $10,000 to $14,999 | 0 | 0.0% |
| $15,000 to $24,999 | 0 | 0.0% |
| $25,000 to $34,999 | 46 | 29.1% |
| $35,000 to $49,999 | 10 | 6.3% |
| $50,000 to $74,999 | 22 | 13.9% |
| $75,000 to $99,999 | 45 | 28.5% |
| $100,000 to $149,999 | 15 | 9.5% |
| $150,000 to $199,999 | 20 | 12.7% |
| $200,000+ | 0 | 0.0% |
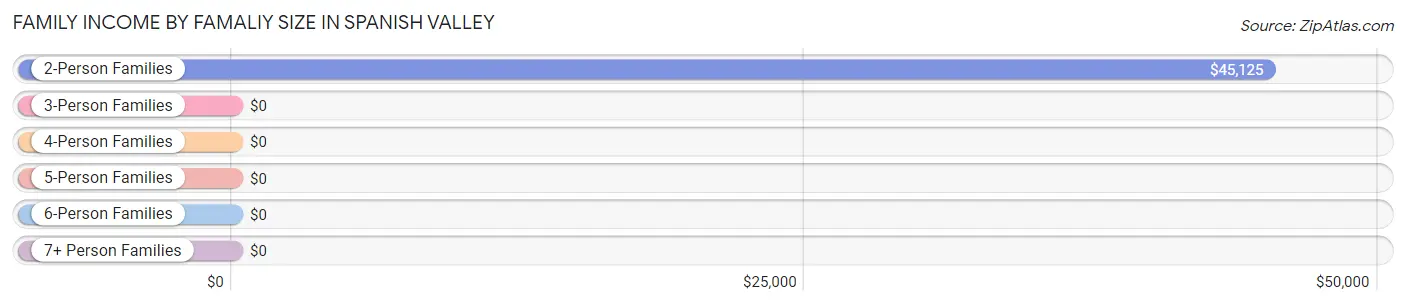
Family Income by Famaliy Size in Spanish Valley
2-person families (93 | 58.9%) account for the highest median family income in Spanish Valley with $45,125 per family, while 2-person families (93 | 58.9%) have the highest median income of $22,562 per family member.
| Income Bracket | # Families | Median Income |
| 2-Person Families | 93 (58.9%) | $45,125 |
| 3-Person Families | 5 (3.2%) | $0 |
| 4-Person Families | 51 (32.3%) | $0 |
| 5-Person Families | 0 (0.0%) | $0 |
| 6-Person Families | 9 (5.7%) | $0 |
| 7+ Person Families | 0 (0.0%) | $0 |
| Total | 158 (100.0%) | $93,000 |
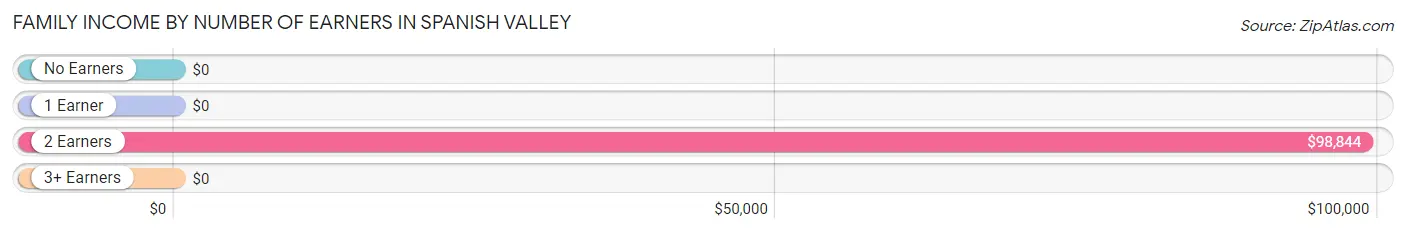
Family Income by Number of Earners in Spanish Valley
| Number of Earners | # Families | Median Income |
| No Earners | 9 (5.7%) | $0 |
| 1 Earner | 51 (32.3%) | $0 |
| 2 Earners | 89 (56.3%) | $98,844 |
| 3+ Earners | 9 (5.7%) | $0 |
| Total | 158 (100.0%) | $93,000 |
Household Income in Spanish Valley
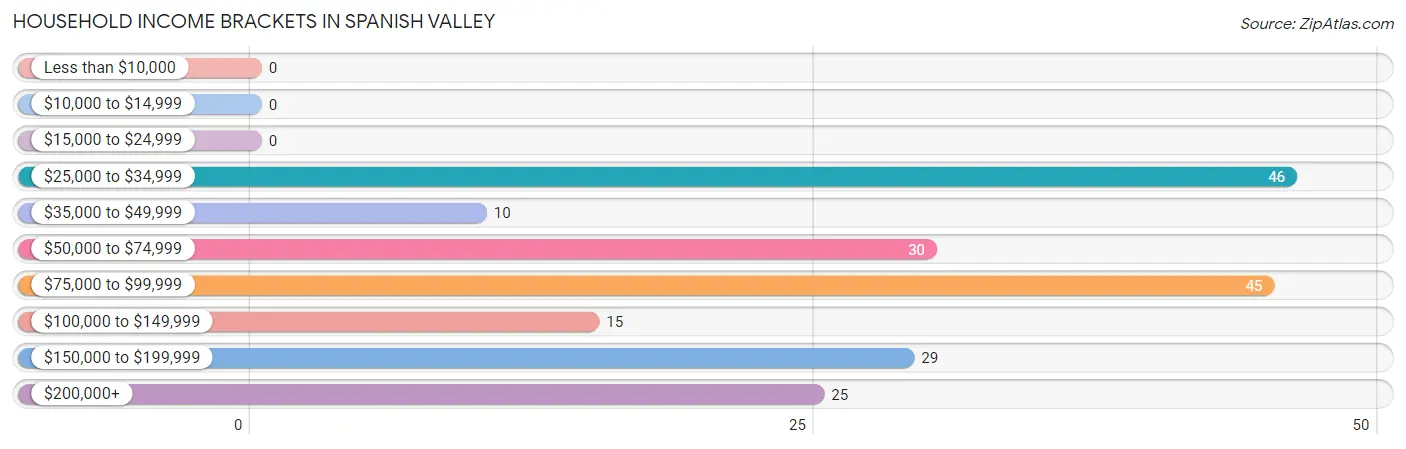
Household Income Brackets in Spanish Valley
With 46 households falling in the category, the $25,000 to $34,999 income range is the most frequent in Spanish Valley, accounting for 23.0% of all households.
| Income Bracket | # Households | % Households |
| Less than $10,000 | 0 | 0.0% |
| $10,000 to $14,999 | 0 | 0.0% |
| $15,000 to $24,999 | 0 | 0.0% |
| $25,000 to $34,999 | 46 | 23.0% |
| $35,000 to $49,999 | 10 | 5.0% |
| $50,000 to $74,999 | 30 | 15.0% |
| $75,000 to $99,999 | 45 | 22.5% |
| $100,000 to $149,999 | 15 | 7.5% |
| $150,000 to $199,999 | 29 | 14.5% |
| $200,000+ | 25 | 12.5% |
Household Income by Householder Age in Spanish Valley
| Income Bracket | # Households | Median Income |
| 15 to 24 Years | 0 (0.0%) | $0 |
| 25 to 44 Years | 34 (17.0%) | $0 |
| 45 to 64 Years | 157 (78.5%) | $0 |
| 65+ Years | 9 (4.5%) | $0 |
| Total | 200 (100.0%) | $98,063 |
Poverty in Spanish Valley
Income Below Poverty by Sex and Age in Spanish Valley
| Age Bracket | Male | Female |
| Under 5 Years | 0 (0.0%) | 0 (0.0%) |
| 5 Years | 0 (0.0%) | 0 (0.0%) |
| 6 to 11 Years | 0 (0.0%) | 0 (0.0%) |
| 12 to 14 Years | 0 (0.0%) | 0 (0.0%) |
| 15 Years | 0 (0.0%) | 0 (0.0%) |
| 16 and 17 Years | 0 (0.0%) | 0 (0.0%) |
| 18 to 24 Years | 0 (0.0%) | 0 (0.0%) |
| 25 to 34 Years | 0 (0.0%) | 0 (0.0%) |
| 35 to 44 Years | 0 (0.0%) | 0 (0.0%) |
| 45 to 54 Years | 0 (0.0%) | 0 (0.0%) |
| 55 to 64 Years | 0 (0.0%) | 0 (0.0%) |
| 65 to 74 Years | 0 (0.0%) | 0 (0.0%) |
| 75 Years and over | 0 (0.0%) | 0 (0.0%) |
| Total | 0 (0.0%) | 0 (0.0%) |
Income Above Poverty by Sex and Age in Spanish Valley
According to the poverty statistics in Spanish Valley, males aged 18 to 24 years and females aged 6 to 11 years are the age groups that are most secure financially, with 100.0% of males and 100.0% of females in these age groups living above the poverty line.
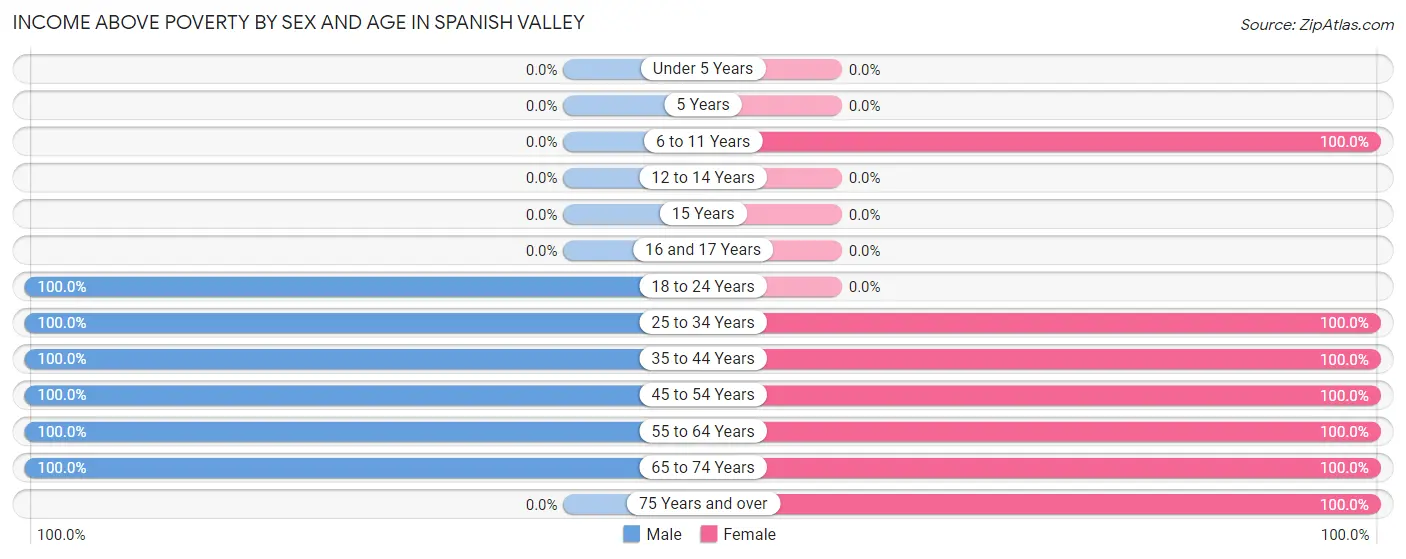
| Age Bracket | Male | Female |
| Under 5 Years | 0 (0.0%) | 0 (0.0%) |
| 5 Years | 0 (0.0%) | 0 (0.0%) |
| 6 to 11 Years | 0 (0.0%) | 75 (100.0%) |
| 12 to 14 Years | 0 (0.0%) | 0 (0.0%) |
| 15 Years | 0 (0.0%) | 0 (0.0%) |
| 16 and 17 Years | 0 (0.0%) | 0 (0.0%) |
| 18 to 24 Years | 28 (100.0%) | 0 (0.0%) |
| 25 to 34 Years | 29 (100.0%) | 20 (100.0%) |
| 35 to 44 Years | 25 (100.0%) | 55 (100.0%) |
| 45 to 54 Years | 163 (100.0%) | 57 (100.0%) |
| 55 to 64 Years | 37 (100.0%) | 9 (100.0%) |
| 65 to 74 Years | 17 (100.0%) | 12 (100.0%) |
| 75 Years and over | 0 (0.0%) | 18 (100.0%) |
| Total | 299 (100.0%) | 246 (100.0%) |
Income Below Poverty Among Married-Couple Families in Spanish Valley
| Children | Above Poverty | Below Poverty |
| No Children | 107 (100.0%) | 0 (0.0%) |
| 1 or 2 Children | 51 (100.0%) | 0 (0.0%) |
| 3 or 4 Children | 0 (0.0%) | 0 (0.0%) |
| 5 or more Children | 0 (0.0%) | 0 (0.0%) |
| Total | 158 (100.0%) | 0 (0.0%) |
Income Below Poverty Among Single-Parent Households in Spanish Valley
| Children | Single Father | Single Mother |
| No Children | 0 (0.0%) | 0 (0.0%) |
| 1 or 2 Children | 0 (0.0%) | 0 (0.0%) |
| 3 or 4 Children | 0 (0.0%) | 0 (0.0%) |
| 5 or more Children | 0 (0.0%) | 0 (0.0%) |
| Total | 0 (0.0%) | 0 (0.0%) |
Income Below Poverty Among Married-Couple vs Single-Parent Households in Spanish Valley
| Children | Married-Couple Families | Single-Parent Households |
| No Children | 0 (0.0%) | 0 (0.0%) |
| 1 or 2 Children | 0 (0.0%) | 0 (0.0%) |
| 3 or 4 Children | 0 (0.0%) | 0 (0.0%) |
| 5 or more Children | 0 (0.0%) | 0 (0.0%) |
| Total | 0 (0.0%) | 0 (0.0%) |
Race in Spanish Valley
The most populous races in Spanish Valley are , and White / Caucasian (545 | 100.0%).
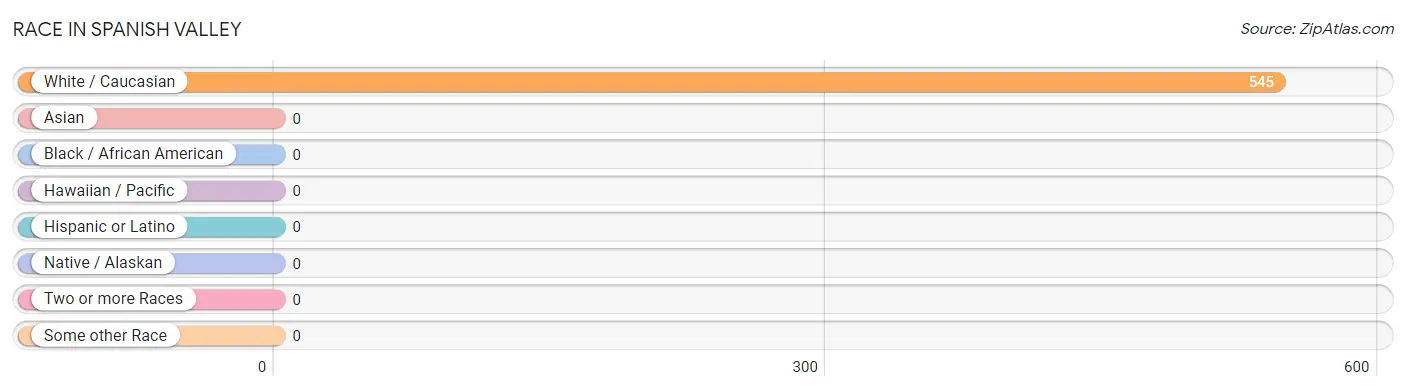
| Race | # Population | % Population |
| Asian | 0 | 0.0% |
| Black / African American | 0 | 0.0% |
| Hawaiian / Pacific | 0 | 0.0% |
| Hispanic or Latino | 0 | 0.0% |
| Native / Alaskan | 0 | 0.0% |
| White / Caucasian | 545 | 100.0% |
| Two or more Races | 0 | 0.0% |
| Some other Race | 0 | 0.0% |
| Total | 545 | 100.0% |
Ancestry in Spanish Valley
The most populous ancestries reported in Spanish Valley are German (155 | 28.4%), Irish (141 | 25.9%), English (98 | 18.0%), Polish (79 | 14.5%), and Welsh (41 | 7.5%), together accounting for 94.3% of all Spanish Valley residents.
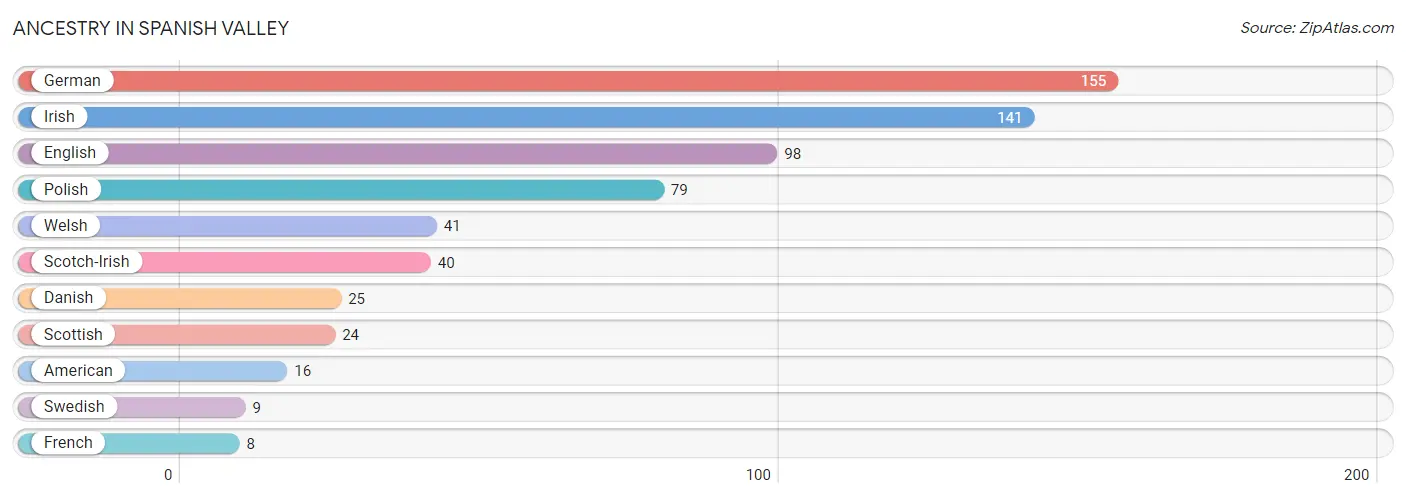
| Ancestry | # Population | % Population |
| American | 16 | 2.9% |
| Danish | 25 | 4.6% |
| English | 98 | 18.0% |
| French | 8 | 1.5% |
| German | 155 | 28.4% |
| Irish | 141 | 25.9% |
| Polish | 79 | 14.5% |
| Scotch-Irish | 40 | 7.3% |
| Scottish | 24 | 4.4% |
| Swedish | 9 | 1.7% |
| Welsh | 41 | 7.5% | View All 11 Rows |
Immigrants in Spanish Valley

| Immigration Origin | # Population | % Population | View All 0 Rows |
Sex and Age in Spanish Valley
Sex and Age in Spanish Valley
The most populous age groups in Spanish Valley are 45 to 49 Years (152 | 50.8%) for men and 40 to 44 Years (55 | 22.4%) for women.
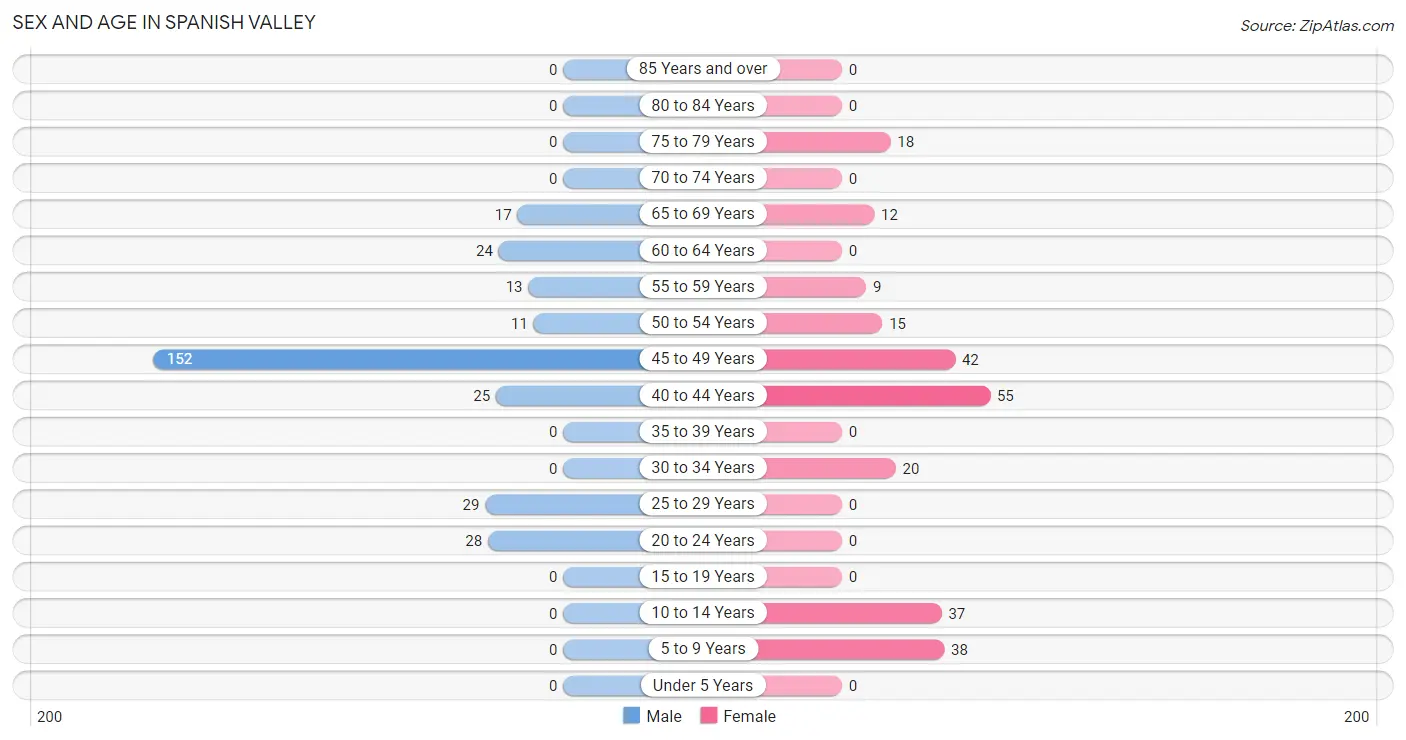
| Age Bracket | Male | Female |
| Under 5 Years | 0 (0.0%) | 0 (0.0%) |
| 5 to 9 Years | 0 (0.0%) | 38 (15.4%) |
| 10 to 14 Years | 0 (0.0%) | 37 (15.0%) |
| 15 to 19 Years | 0 (0.0%) | 0 (0.0%) |
| 20 to 24 Years | 28 (9.4%) | 0 (0.0%) |
| 25 to 29 Years | 29 (9.7%) | 0 (0.0%) |
| 30 to 34 Years | 0 (0.0%) | 20 (8.1%) |
| 35 to 39 Years | 0 (0.0%) | 0 (0.0%) |
| 40 to 44 Years | 25 (8.4%) | 55 (22.4%) |
| 45 to 49 Years | 152 (50.8%) | 42 (17.1%) |
| 50 to 54 Years | 11 (3.7%) | 15 (6.1%) |
| 55 to 59 Years | 13 (4.3%) | 9 (3.7%) |
| 60 to 64 Years | 24 (8.0%) | 0 (0.0%) |
| 65 to 69 Years | 17 (5.7%) | 12 (4.9%) |
| 70 to 74 Years | 0 (0.0%) | 0 (0.0%) |
| 75 to 79 Years | 0 (0.0%) | 18 (7.3%) |
| 80 to 84 Years | 0 (0.0%) | 0 (0.0%) |
| 85 Years and over | 0 (0.0%) | 0 (0.0%) |
| Total | 299 (100.0%) | 246 (100.0%) |
Families and Households in Spanish Valley
Median Family Size in Spanish Valley
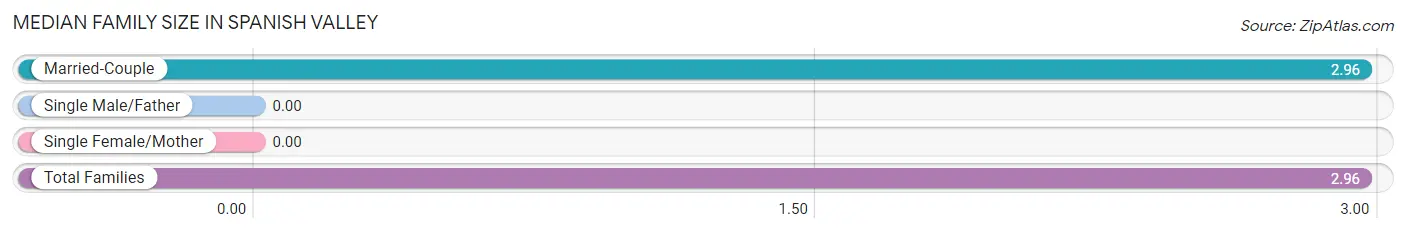
| Family Type | # Families | Family Size |
| Married-Couple | 158 (100.0%) | 2.96 |
| Single Male/Father | 0 (0.0%) | - |
| Single Female/Mother | 0 (0.0%) | - |
| Total Families | 158 (100.0%) | 2.96 |
Median Household Size in Spanish Valley
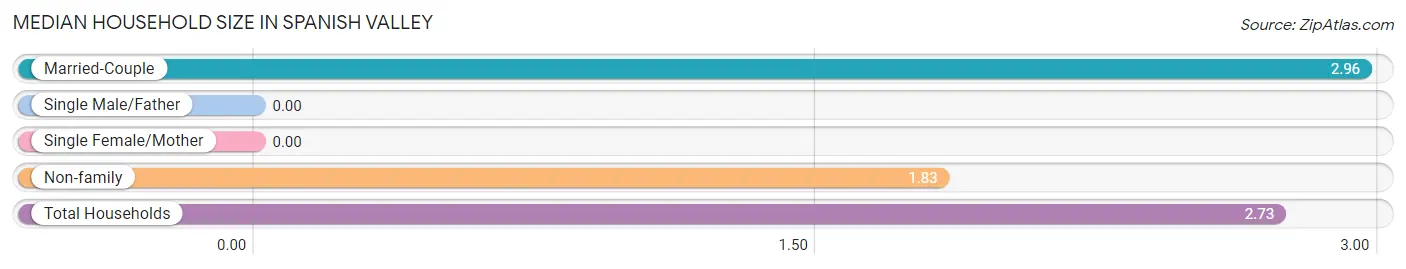
| Household Type | # Households | Household Size |
| Married-Couple | 158 (79.0%) | 2.96 |
| Single Male/Father | 0 (0.0%) | - |
| Single Female/Mother | 0 (0.0%) | - |
| Non-family | 42 (21.0%) | 1.83 |
| Total Households | 200 (100.0%) | 2.73 |
Household Size by Marriage Status in Spanish Valley
Out of a total of 200 households in Spanish Valley, 158 (79.0%) are family households, while 42 (21.0%) are nonfamily households. The most numerous type of family households are 2-person households, comprising 93, and the most common type of nonfamily households are 2-person households, comprising 34.
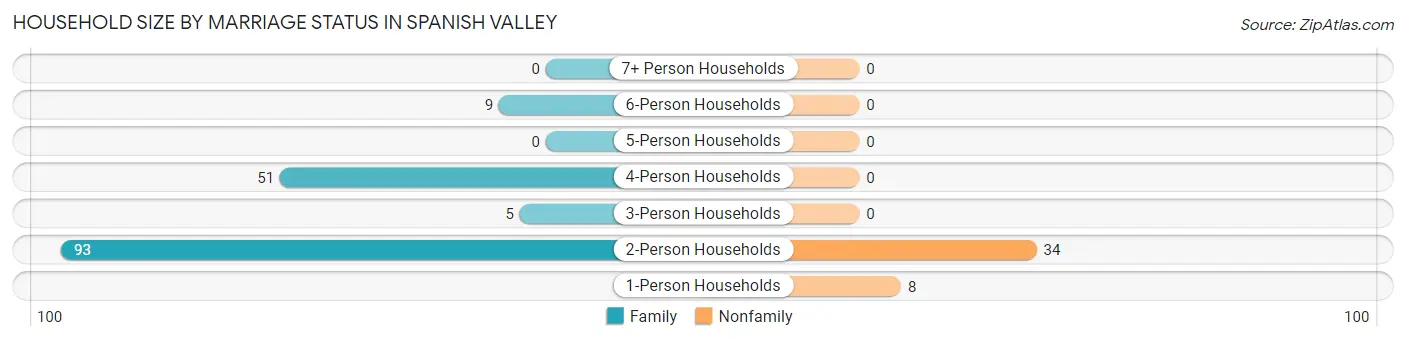
| Household Size | Family Households | Nonfamily Households |
| 1-Person Households | - | 8 (4.0%) |
| 2-Person Households | 93 (46.5%) | 34 (17.0%) |
| 3-Person Households | 5 (2.5%) | 0 (0.0%) |
| 4-Person Households | 51 (25.5%) | 0 (0.0%) |
| 5-Person Households | 0 (0.0%) | 0 (0.0%) |
| 6-Person Households | 9 (4.5%) | 0 (0.0%) |
| 7+ Person Households | 0 (0.0%) | 0 (0.0%) |
| Total | 158 (79.0%) | 42 (21.0%) |
Female Fertility in Spanish Valley
Fertility by Age in Spanish Valley
| Age Bracket | Women with Births | Births / 1,000 Women |
| 15 to 19 years | 0 (0.0%) | 0.0 |
| 20 to 34 years | 0 (0.0%) | 0.0 |
| 35 to 50 years | 0 (0.0%) | 0.0 |
| Total | 0 (0.0%) | 0.0 |
Fertility by Age by Marriage Status in Spanish Valley
| Age Bracket | Married | Unmarried |
| 15 to 19 years | 0 (0.0%) | 0 (0.0%) |
| 20 to 34 years | 0 (0.0%) | 0 (0.0%) |
| 35 to 50 years | 0 (0.0%) | 0 (0.0%) |
| Total | 0 (0.0%) | 0 (0.0%) |
Fertility by Education in Spanish Valley
| Educational Attainment | Women with Births | Births / 1,000 Women |
| Less than High School | 0 (0.0%) | 0.0 |
| High School Diploma | 0 (0.0%) | 0.0 |
| College or Associate's Degree | 0 (0.0%) | 0.0 |
| Bachelor's Degree | 0 (0.0%) | 0.0 |
| Graduate Degree | 0 (0.0%) | 0.0 |
| Total | 0 (0.0%) | 0.0 |
Fertility by Education by Marriage Status in Spanish Valley
| Educational Attainment | Married | Unmarried |
| Less than High School | 0 (0.0%) | 0 (0.0%) |
| High School Diploma | 0 (0.0%) | 0 (0.0%) |
| College or Associate's Degree | 0 (0.0%) | 0 (0.0%) |
| Bachelor's Degree | 0 (0.0%) | 0 (0.0%) |
| Graduate Degree | 0 (0.0%) | 0 (0.0%) |
| Total | 0 (0.0%) | 0 (0.0%) |
Employment Characteristics in Spanish Valley
Employment by Class of Employer in Spanish Valley
Among the 363 employed individuals in Spanish Valley, private company employees (116 | 32.0%), self-employed (not incorporated) (85 | 23.4%), and state government employees (59 | 16.3%) make up the most common classes of employment.
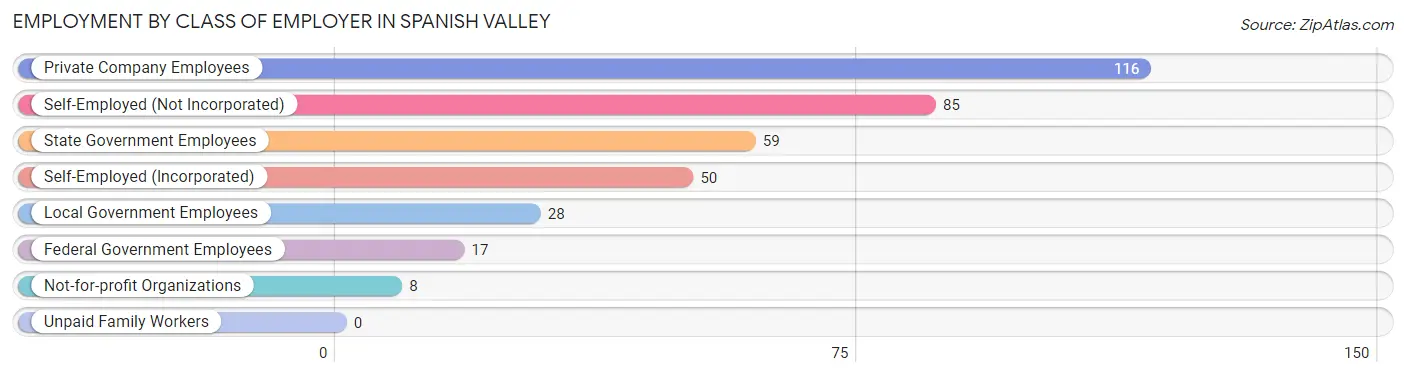
| Employer Class | # Employees | % Employees |
| Private Company Employees | 116 | 32.0% |
| Self-Employed (Incorporated) | 50 | 13.8% |
| Self-Employed (Not Incorporated) | 85 | 23.4% |
| Not-for-profit Organizations | 8 | 2.2% |
| Local Government Employees | 28 | 7.7% |
| State Government Employees | 59 | 16.3% |
| Federal Government Employees | 17 | 4.7% |
| Unpaid Family Workers | 0 | 0.0% |
| Total | 363 | 100.0% |
Employment Status by Age in Spanish Valley
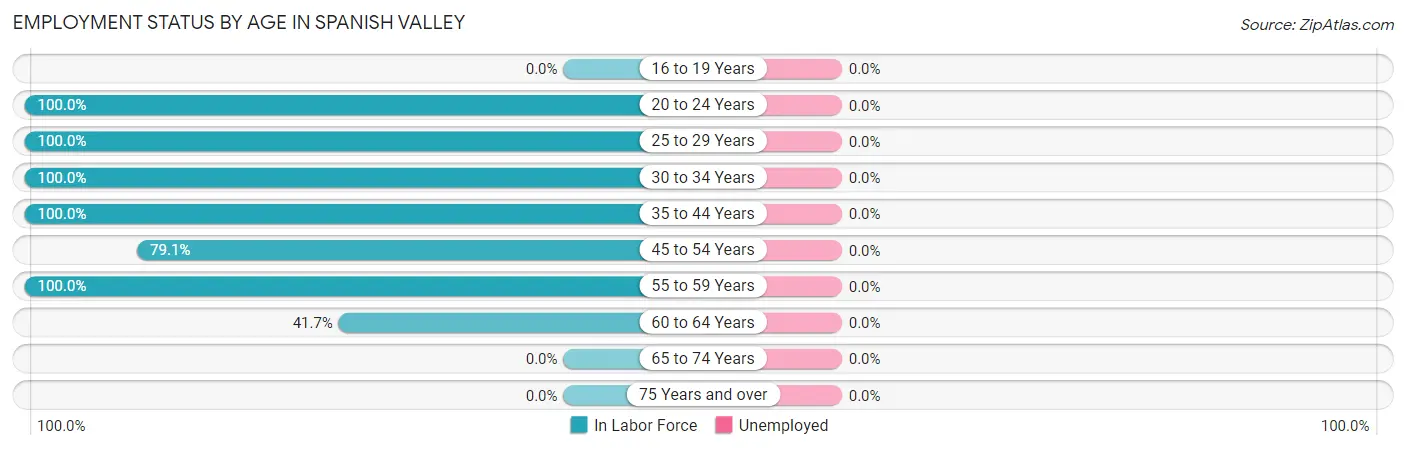
| Age Bracket | In Labor Force | Unemployed |
| 16 to 19 Years | 0 (0.0%) | 0 (0.0%) |
| 20 to 24 Years | 28 (100.0%) | 0 (0.0%) |
| 25 to 29 Years | 29 (100.0%) | 0 (0.0%) |
| 30 to 34 Years | 20 (100.0%) | 0 (0.0%) |
| 35 to 44 Years | 80 (100.0%) | 0 (0.0%) |
| 45 to 54 Years | 174 (79.1%) | 0 (0.0%) |
| 55 to 59 Years | 22 (100.0%) | 0 (0.0%) |
| 60 to 64 Years | 10 (41.7%) | 0 (0.0%) |
| 65 to 74 Years | 0 (0.0%) | 0 (0.0%) |
| 75 Years and over | 0 (0.0%) | 0 (0.0%) |
| Total | 363 (77.2%) | 0 (0.0%) |
Employment Status by Educational Attainment in Spanish Valley
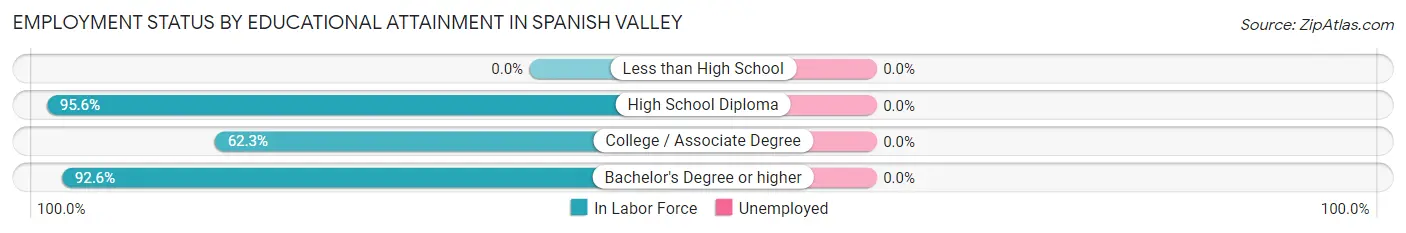
| Educational Attainment | In Labor Force | Unemployed |
| Less than High School | 0 (0.0%) | 0 (0.0%) |
| High School Diploma | 196 (95.6%) | 0 (0.0%) |
| College / Associate Degree | 76 (62.3%) | 0 (0.0%) |
| Bachelor's Degree or higher | 63 (92.6%) | 0 (0.0%) |
| Total | 335 (84.8%) | 0 (0.0%) |
Employment Occupations by Sex in Spanish Valley
Management, Business, Science and Arts Occupations
The most common Management, Business, Science and Arts occupations in Spanish Valley are Management (104 | 28.6%), Community & Social Service (46 | 12.7%), Education Instruction & Library (46 | 12.7%), and Business & Financial (9 | 2.5%).
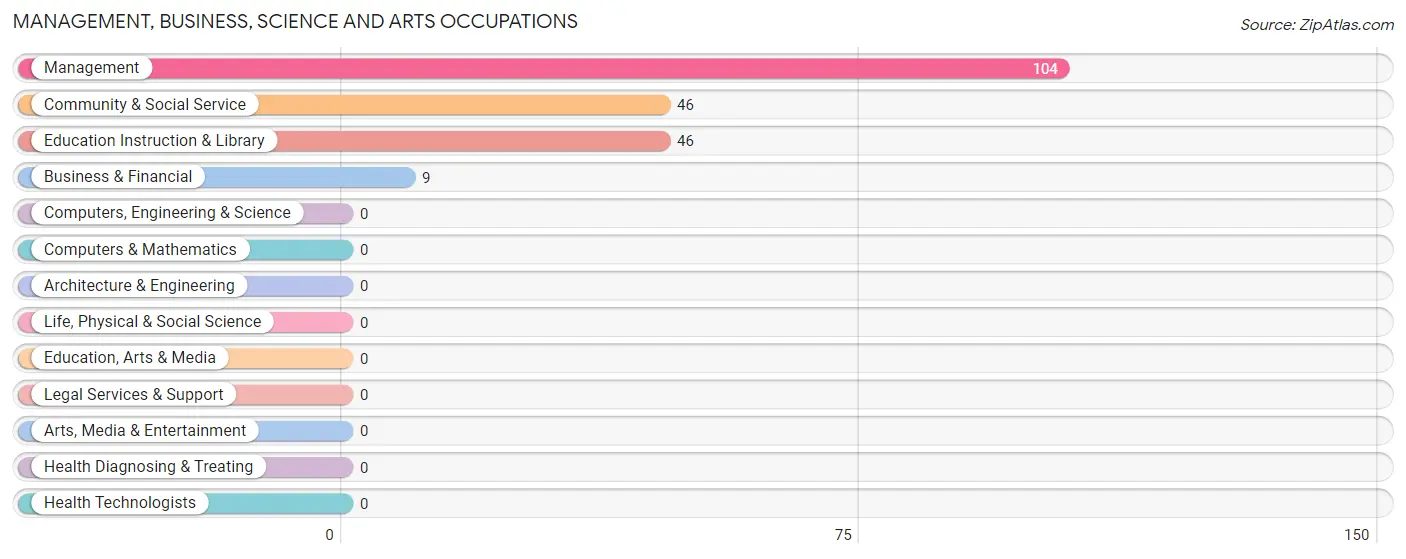
Management, Business, Science and Arts Occupations by Sex
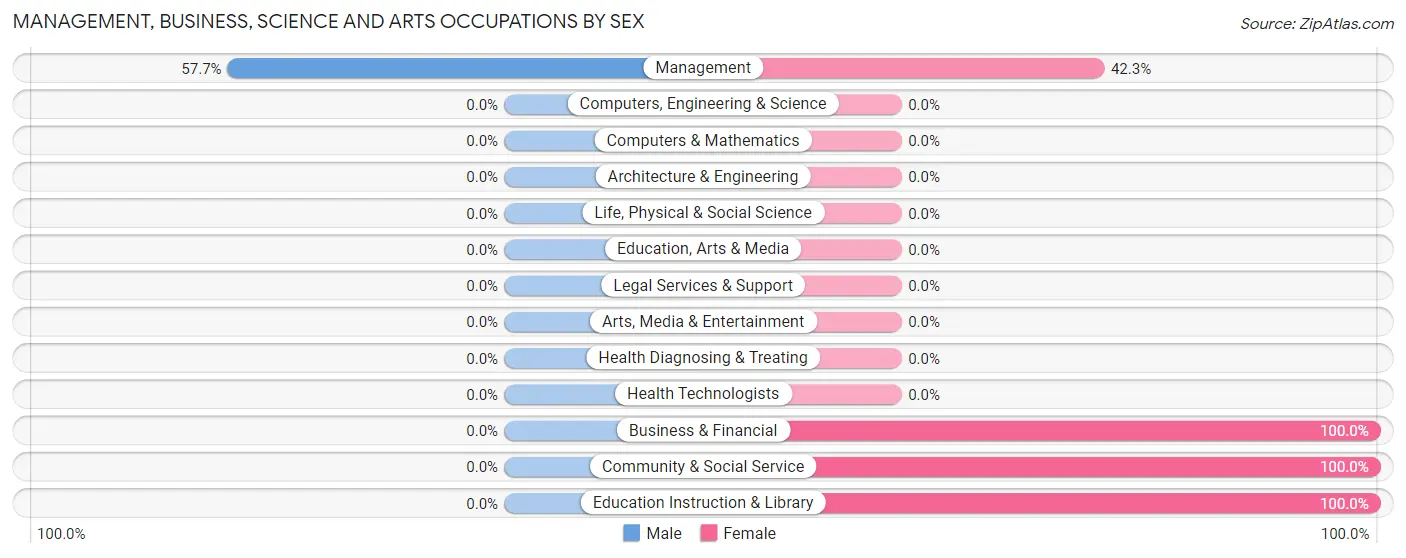
| Occupation | Male | Female |
| Management | 60 (57.7%) | 44 (42.3%) |
| Business & Financial | 0 (0.0%) | 9 (100.0%) |
| Computers, Engineering & Science | 0 (0.0%) | 0 (0.0%) |
| Computers & Mathematics | 0 (0.0%) | 0 (0.0%) |
| Architecture & Engineering | 0 (0.0%) | 0 (0.0%) |
| Life, Physical & Social Science | 0 (0.0%) | 0 (0.0%) |
| Community & Social Service | 0 (0.0%) | 46 (100.0%) |
| Education, Arts & Media | 0 (0.0%) | 0 (0.0%) |
| Legal Services & Support | 0 (0.0%) | 0 (0.0%) |
| Education Instruction & Library | 0 (0.0%) | 46 (100.0%) |
| Arts, Media & Entertainment | 0 (0.0%) | 0 (0.0%) |
| Health Diagnosing & Treating | 0 (0.0%) | 0 (0.0%) |
| Health Technologists | 0 (0.0%) | 0 (0.0%) |
| Total (Category) | 60 (37.7%) | 99 (62.3%) |
| Total (Overall) | 222 (61.2%) | 141 (38.8%) |
Services Occupations
The most common Services occupations in Spanish Valley are , and Cleaning & Maintenance (4 | 1.1%).
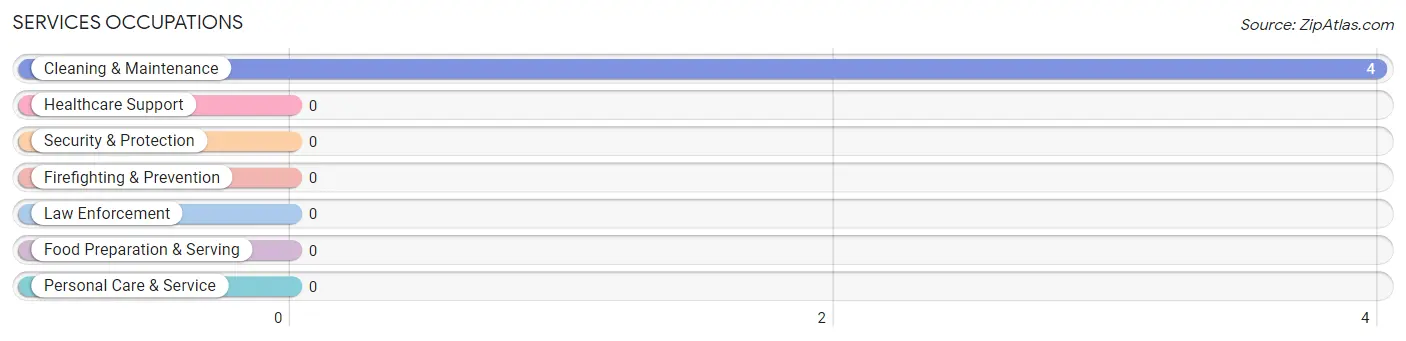
Services Occupations by Sex
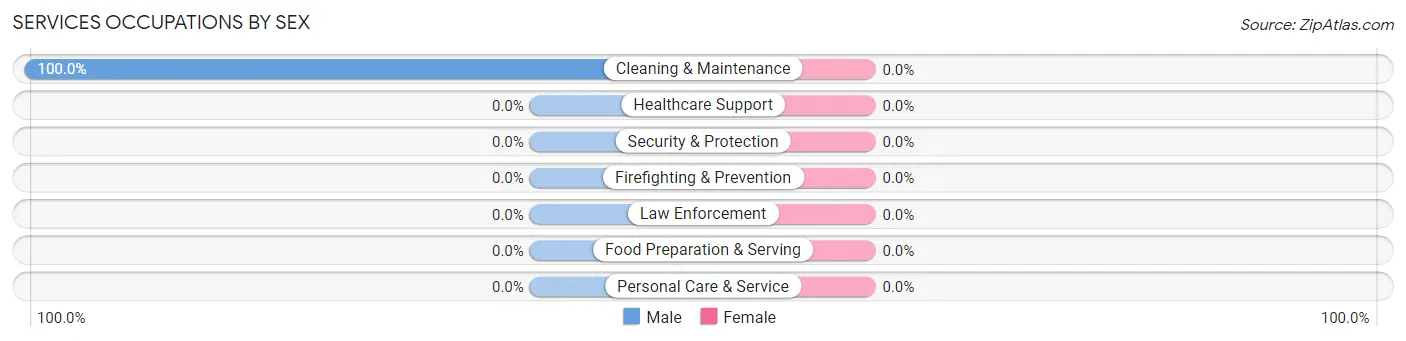
| Occupation | Male | Female |
| Healthcare Support | 0 (0.0%) | 0 (0.0%) |
| Security & Protection | 0 (0.0%) | 0 (0.0%) |
| Firefighting & Prevention | 0 (0.0%) | 0 (0.0%) |
| Law Enforcement | 0 (0.0%) | 0 (0.0%) |
| Food Preparation & Serving | 0 (0.0%) | 0 (0.0%) |
| Cleaning & Maintenance | 4 (100.0%) | 0 (0.0%) |
| Personal Care & Service | 0 (0.0%) | 0 (0.0%) |
| Total (Category) | 4 (100.0%) | 0 (0.0%) |
| Total (Overall) | 222 (61.2%) | 141 (38.8%) |
Sales and Office Occupations
The most common Sales and Office occupations in Spanish Valley are Office & Administration (70 | 19.3%), and Sales & Related (15 | 4.1%).

Sales and Office Occupations by Sex

| Occupation | Male | Female |
| Sales & Related | 15 (100.0%) | 0 (0.0%) |
| Office & Administration | 28 (40.0%) | 42 (60.0%) |
| Total (Category) | 43 (50.6%) | 42 (49.4%) |
| Total (Overall) | 222 (61.2%) | 141 (38.8%) |
Natural Resources, Construction and Maintenance Occupations
The most common Natural Resources, Construction and Maintenance occupations in Spanish Valley are , and Installation, Maintenance & Repair (90 | 24.8%).
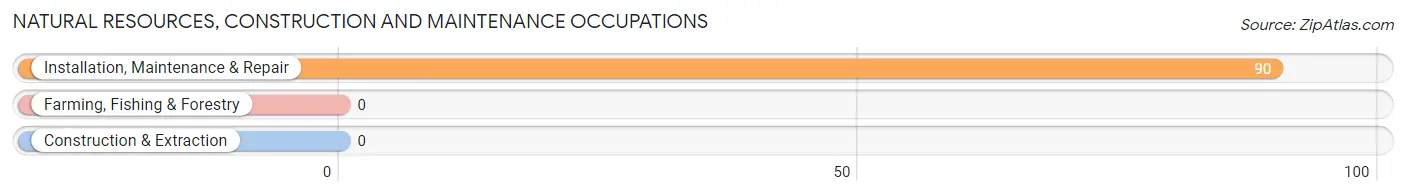
Natural Resources, Construction and Maintenance Occupations by Sex
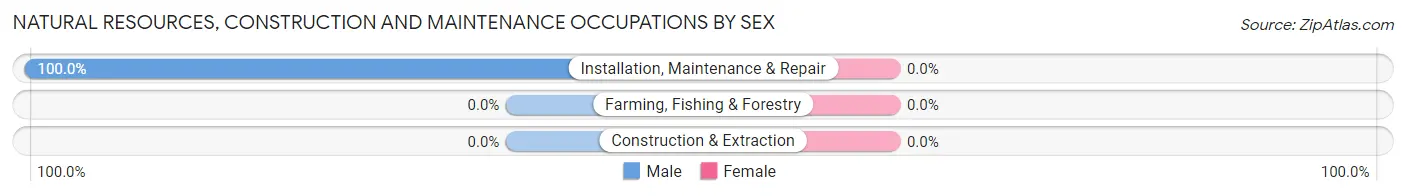
| Occupation | Male | Female |
| Farming, Fishing & Forestry | 0 (0.0%) | 0 (0.0%) |
| Construction & Extraction | 0 (0.0%) | 0 (0.0%) |
| Installation, Maintenance & Repair | 90 (100.0%) | 0 (0.0%) |
| Total (Category) | 90 (100.0%) | 0 (0.0%) |
| Total (Overall) | 222 (61.2%) | 141 (38.8%) |
Production, Transportation and Moving Occupations
The most common Production, Transportation and Moving occupations in Spanish Valley are , and Transportation (25 | 6.9%).
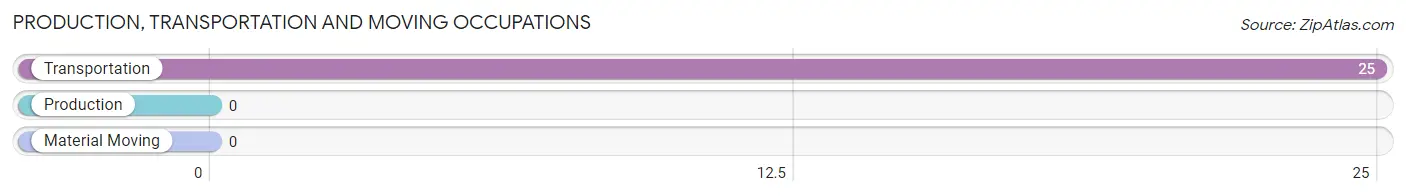
Production, Transportation and Moving Occupations by Sex
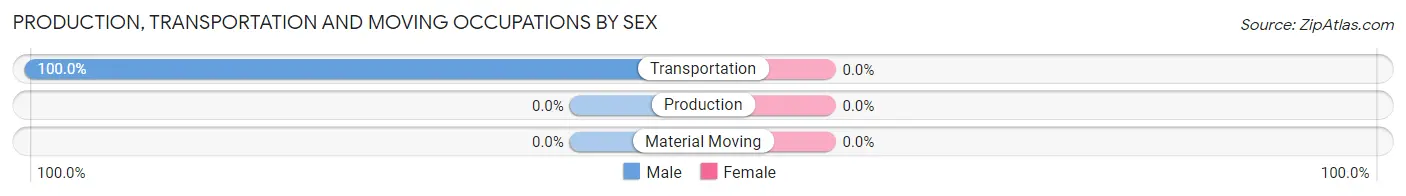
| Occupation | Male | Female |
| Production | 0 (0.0%) | 0 (0.0%) |
| Transportation | 25 (100.0%) | 0 (0.0%) |
| Material Moving | 0 (0.0%) | 0 (0.0%) |
| Total (Category) | 25 (100.0%) | 0 (0.0%) |
| Total (Overall) | 222 (61.2%) | 141 (38.8%) |
Employment Industries by Sex in Spanish Valley
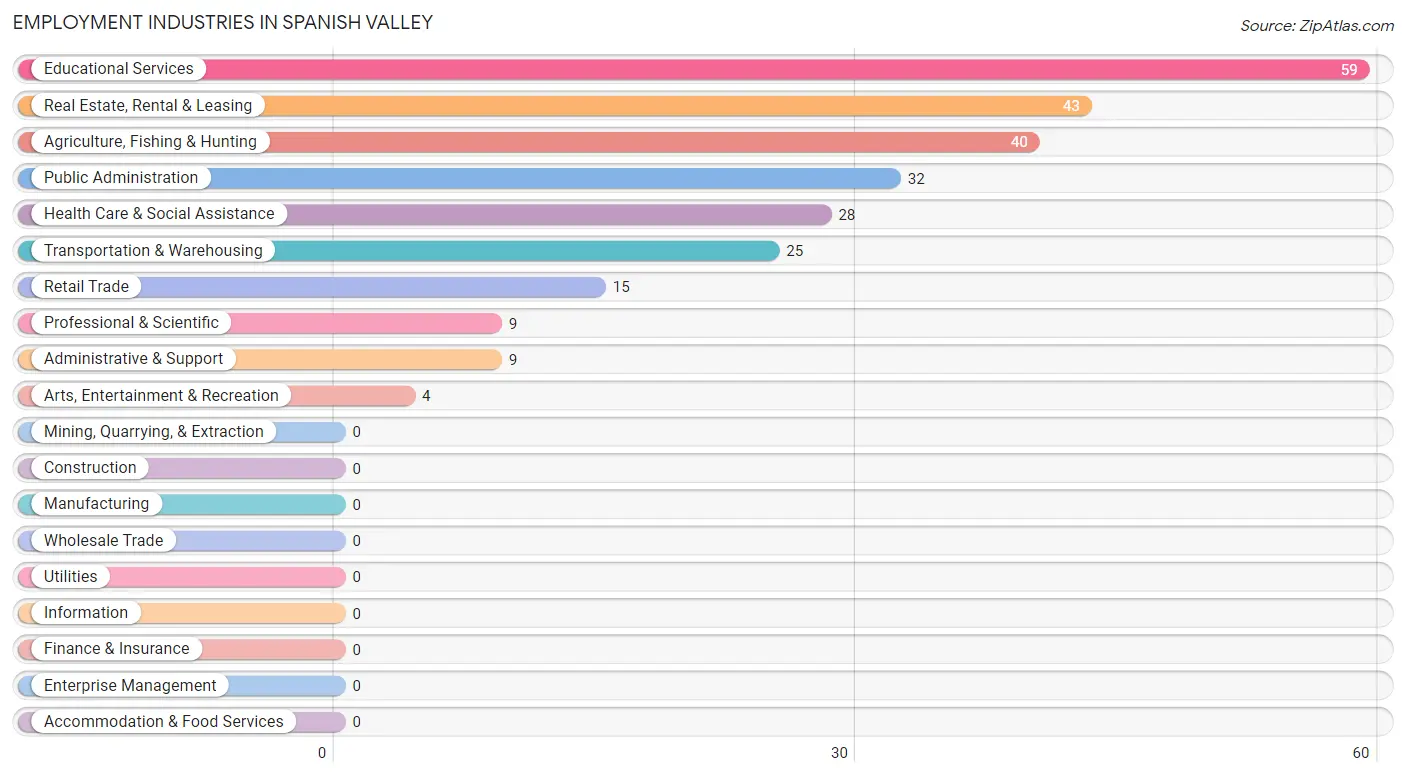
Employment Industries in Spanish Valley
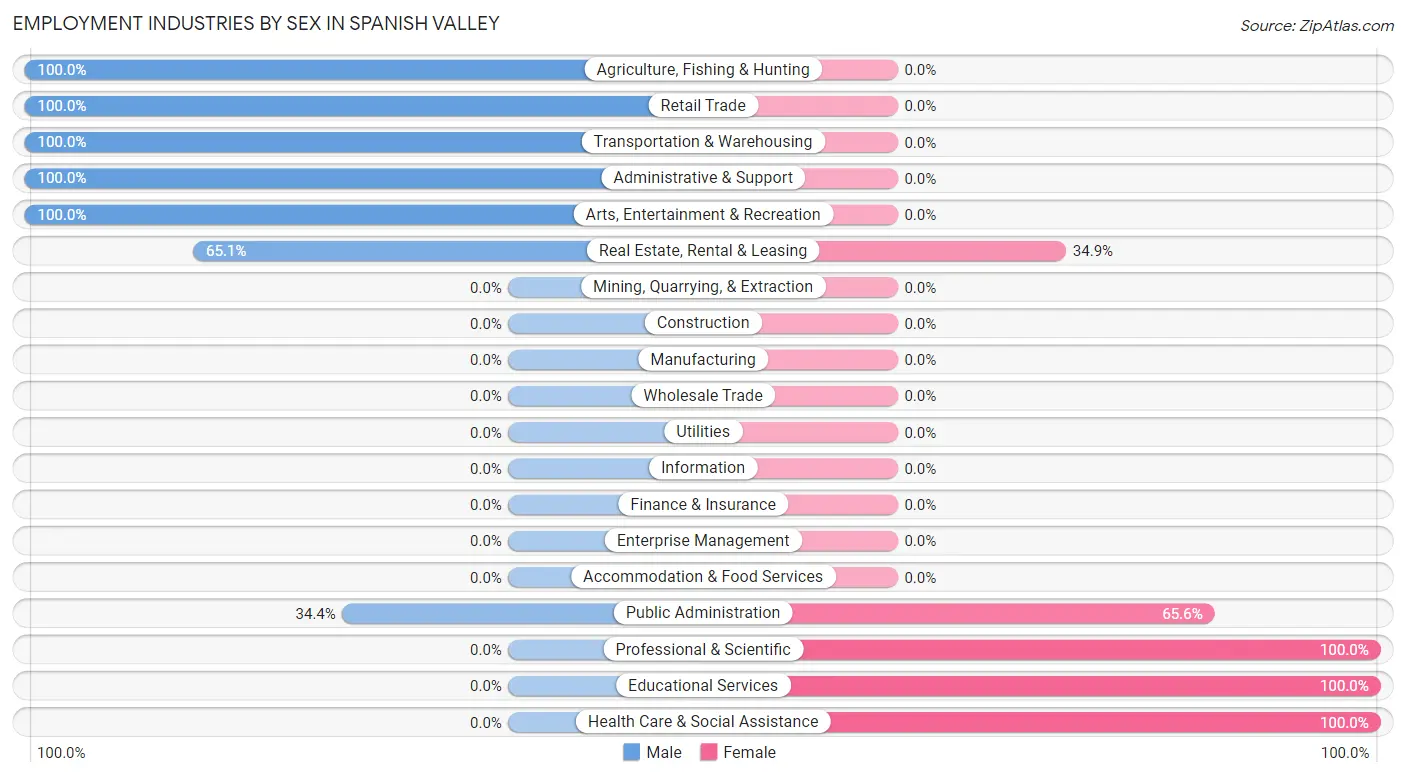
The major employment industries in Spanish Valley include Educational Services (59 | 16.3%), Real Estate, Rental & Leasing (43 | 11.8%), Agriculture, Fishing & Hunting (40 | 11.0%), Public Administration (32 | 8.8%), and Health Care & Social Assistance (28 | 7.7%).
Employment Industries by Sex in Spanish Valley
The Spanish Valley industries that see more men than women are Agriculture, Fishing & Hunting (100.0%), Retail Trade (100.0%), and Transportation & Warehousing (100.0%), whereas the industries that tend to have a higher number of women are Professional & Scientific (100.0%), Educational Services (100.0%), and Health Care & Social Assistance (100.0%).
| Industry | Male | Female |
| Agriculture, Fishing & Hunting | 40 (100.0%) | 0 (0.0%) |
| Mining, Quarrying, & Extraction | 0 (0.0%) | 0 (0.0%) |
| Construction | 0 (0.0%) | 0 (0.0%) |
| Manufacturing | 0 (0.0%) | 0 (0.0%) |
| Wholesale Trade | 0 (0.0%) | 0 (0.0%) |
| Retail Trade | 15 (100.0%) | 0 (0.0%) |
| Transportation & Warehousing | 25 (100.0%) | 0 (0.0%) |
| Utilities | 0 (0.0%) | 0 (0.0%) |
| Information | 0 (0.0%) | 0 (0.0%) |
| Finance & Insurance | 0 (0.0%) | 0 (0.0%) |
| Real Estate, Rental & Leasing | 28 (65.1%) | 15 (34.9%) |
| Professional & Scientific | 0 (0.0%) | 9 (100.0%) |
| Enterprise Management | 0 (0.0%) | 0 (0.0%) |
| Administrative & Support | 9 (100.0%) | 0 (0.0%) |
| Educational Services | 0 (0.0%) | 59 (100.0%) |
| Health Care & Social Assistance | 0 (0.0%) | 28 (100.0%) |
| Arts, Entertainment & Recreation | 4 (100.0%) | 0 (0.0%) |
| Accommodation & Food Services | 0 (0.0%) | 0 (0.0%) |
| Public Administration | 11 (34.4%) | 21 (65.6%) |
| Total | 222 (61.2%) | 141 (38.8%) |
Education in Spanish Valley
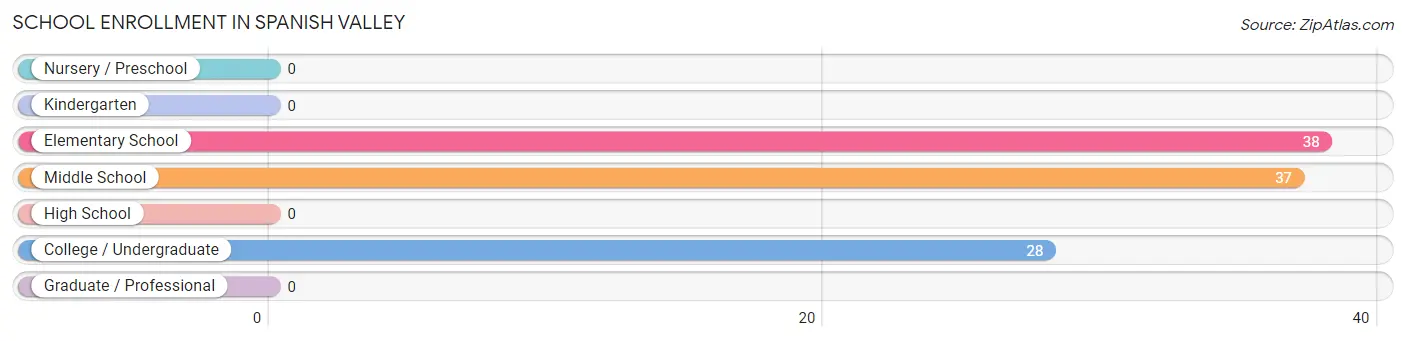
School Enrollment in Spanish Valley
The most common levels of schooling among the 103 students in Spanish Valley are elementary school (38 | 36.9%), middle school (37 | 35.9%), and college / undergraduate (28 | 27.2%).
| School Level | # Students | % Students |
| Nursery / Preschool | 0 | 0.0% |
| Kindergarten | 0 | 0.0% |
| Elementary School | 38 | 36.9% |
| Middle School | 37 | 35.9% |
| High School | 0 | 0.0% |
| College / Undergraduate | 28 | 27.2% |
| Graduate / Professional | 0 | 0.0% |
| Total | 103 | 100.0% |
School Enrollment by Age by Funding Source in Spanish Valley
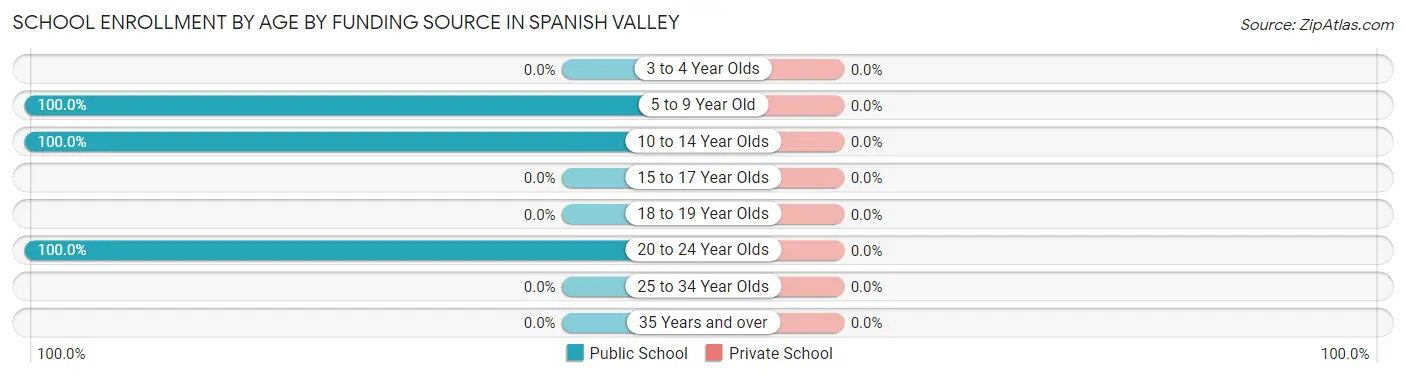
| Age Bracket | Public School | Private School |
| 3 to 4 Year Olds | 0 (0.0%) | 0 (0.0%) |
| 5 to 9 Year Old | 38 (100.0%) | 0 (0.0%) |
| 10 to 14 Year Olds | 37 (100.0%) | 0 (0.0%) |
| 15 to 17 Year Olds | 0 (0.0%) | 0 (0.0%) |
| 18 to 19 Year Olds | 0 (0.0%) | 0 (0.0%) |
| 20 to 24 Year Olds | 28 (100.0%) | 0 (0.0%) |
| 25 to 34 Year Olds | 0 (0.0%) | 0 (0.0%) |
| 35 Years and over | 0 (0.0%) | 0 (0.0%) |
| Total | 103 (100.0%) | 0 (0.0%) |
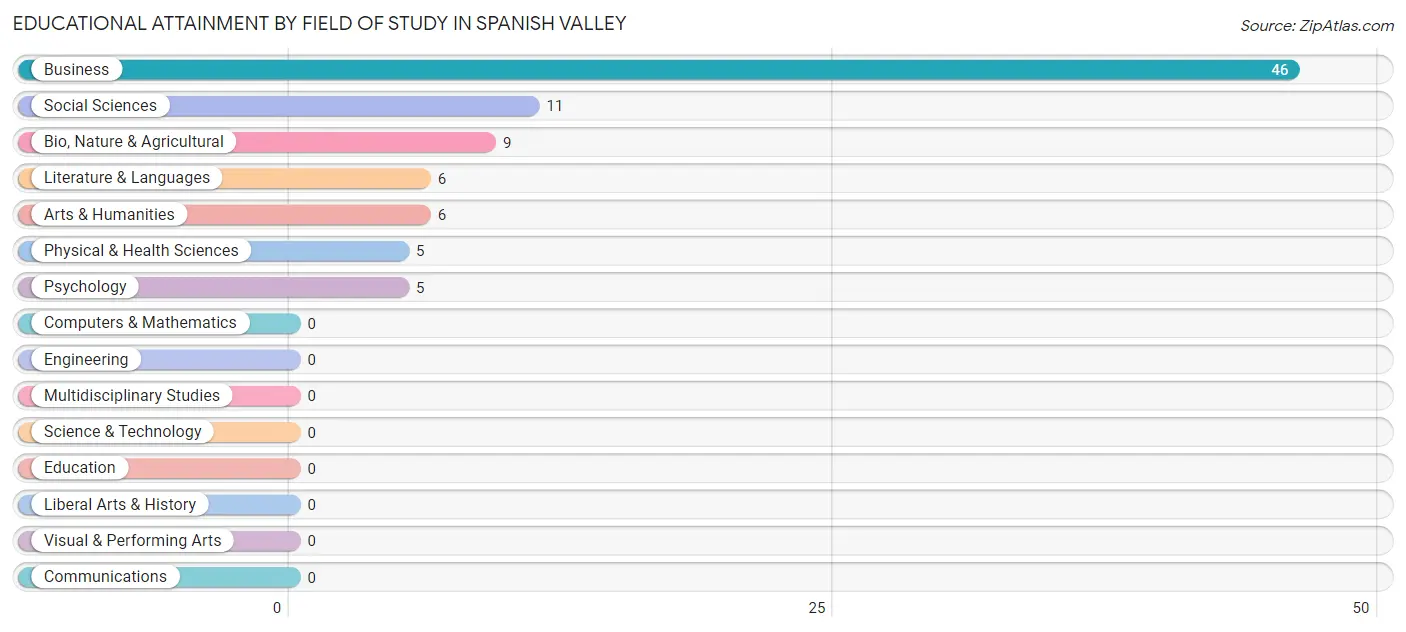
Educational Attainment by Field of Study in Spanish Valley
Business (46 | 52.3%), social sciences (11 | 12.5%), bio, nature & agricultural (9 | 10.2%), literature & languages (6 | 6.8%), and arts & humanities (6 | 6.8%) are the most common fields of study among 88 individuals in Spanish Valley who have obtained a bachelor's degree or higher.
| Field of Study | # Graduates | % Graduates |
| Computers & Mathematics | 0 | 0.0% |
| Bio, Nature & Agricultural | 9 | 10.2% |
| Physical & Health Sciences | 5 | 5.7% |
| Psychology | 5 | 5.7% |
| Social Sciences | 11 | 12.5% |
| Engineering | 0 | 0.0% |
| Multidisciplinary Studies | 0 | 0.0% |
| Science & Technology | 0 | 0.0% |
| Business | 46 | 52.3% |
| Education | 0 | 0.0% |
| Literature & Languages | 6 | 6.8% |
| Liberal Arts & History | 0 | 0.0% |
| Visual & Performing Arts | 0 | 0.0% |
| Communications | 0 | 0.0% |
| Arts & Humanities | 6 | 6.8% |
| Total | 88 | 100.0% |
Transportation & Commute in Spanish Valley
Vehicle Availability by Sex in Spanish Valley
The most prevalent vehicle ownership categories in Spanish Valley are males with 3 vehicles (109, accounting for 49.1%) and females with 3 vehicles (94, making up 77.3%).
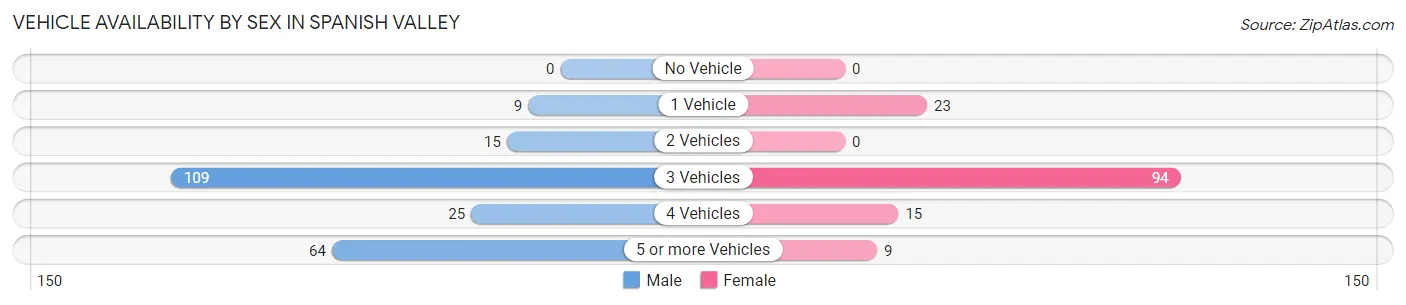
| Vehicles Available | Male | Female |
| No Vehicle | 0 (0.0%) | 0 (0.0%) |
| 1 Vehicle | 9 (4.1%) | 23 (16.3%) |
| 2 Vehicles | 15 (6.8%) | 0 (0.0%) |
| 3 Vehicles | 109 (49.1%) | 94 (66.7%) |
| 4 Vehicles | 25 (11.3%) | 15 (10.6%) |
| 5 or more Vehicles | 64 (28.8%) | 9 (6.4%) |
| Total | 222 (100.0%) | 141 (100.0%) |
Commute Time in Spanish Valley
The most frequently occuring commute durations in Spanish Valley are 15 to 19 minutes (137 commuters, 46.8%), 90 or more minutes (65 commuters, 22.2%), and 5 to 9 minutes (44 commuters, 15.0%).
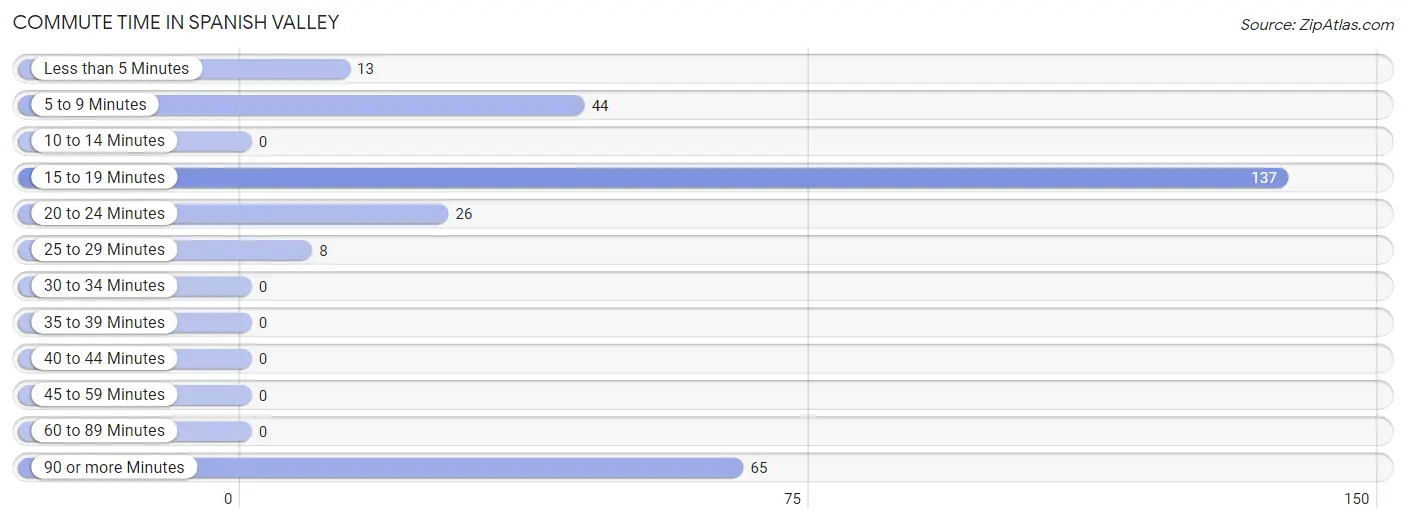
| Commute Time | # Commuters | % Commuters |
| Less than 5 Minutes | 13 | 4.4% |
| 5 to 9 Minutes | 44 | 15.0% |
| 10 to 14 Minutes | 0 | 0.0% |
| 15 to 19 Minutes | 137 | 46.8% |
| 20 to 24 Minutes | 26 | 8.9% |
| 25 to 29 Minutes | 8 | 2.7% |
| 30 to 34 Minutes | 0 | 0.0% |
| 35 to 39 Minutes | 0 | 0.0% |
| 40 to 44 Minutes | 0 | 0.0% |
| 45 to 59 Minutes | 0 | 0.0% |
| 60 to 89 Minutes | 0 | 0.0% |
| 90 or more Minutes | 65 | 22.2% |
Commute Time by Sex in Spanish Valley
The most common commute times in Spanish Valley are 90 or more minutes (65 commuters, 36.9%) for males and 15 to 19 minutes (90 commuters, 76.9%) for females.
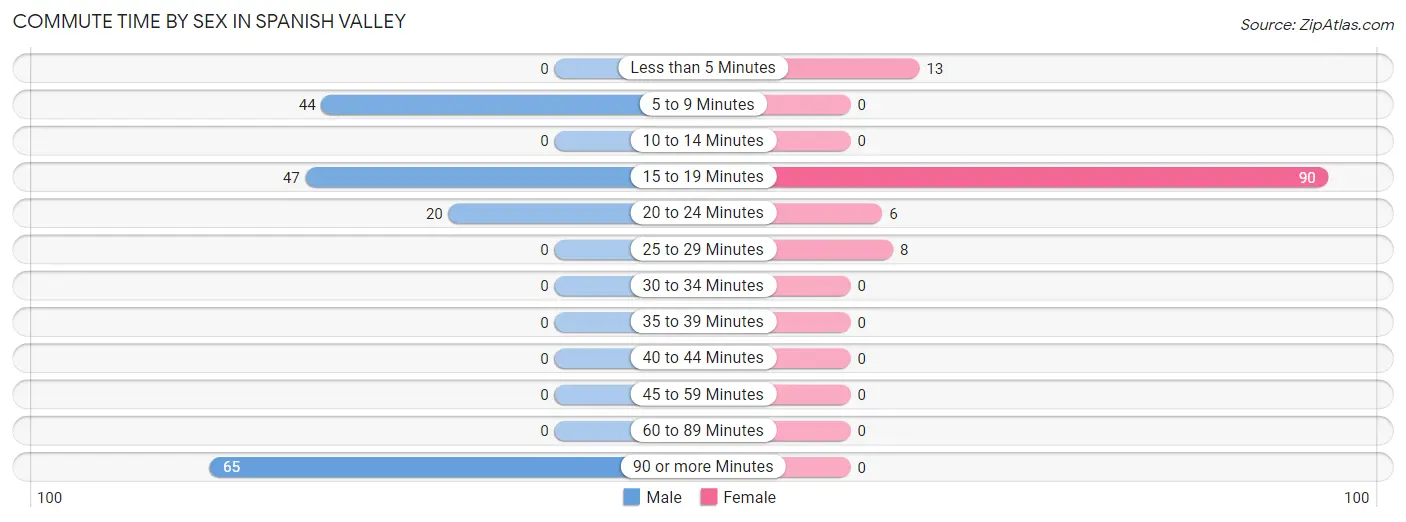
| Commute Time | Male | Female |
| Less than 5 Minutes | 0 (0.0%) | 13 (11.1%) |
| 5 to 9 Minutes | 44 (25.0%) | 0 (0.0%) |
| 10 to 14 Minutes | 0 (0.0%) | 0 (0.0%) |
| 15 to 19 Minutes | 47 (26.7%) | 90 (76.9%) |
| 20 to 24 Minutes | 20 (11.4%) | 6 (5.1%) |
| 25 to 29 Minutes | 0 (0.0%) | 8 (6.8%) |
| 30 to 34 Minutes | 0 (0.0%) | 0 (0.0%) |
| 35 to 39 Minutes | 0 (0.0%) | 0 (0.0%) |
| 40 to 44 Minutes | 0 (0.0%) | 0 (0.0%) |
| 45 to 59 Minutes | 0 (0.0%) | 0 (0.0%) |
| 60 to 89 Minutes | 0 (0.0%) | 0 (0.0%) |
| 90 or more Minutes | 65 (36.9%) | 0 (0.0%) |
Time of Departure to Work by Sex in Spanish Valley
The most frequent times of departure to work in Spanish Valley are 5:30 AM to 5:59 AM (44, 25.0%) for males and 7:30 AM to 7:59 AM (89, 76.1%) for females.
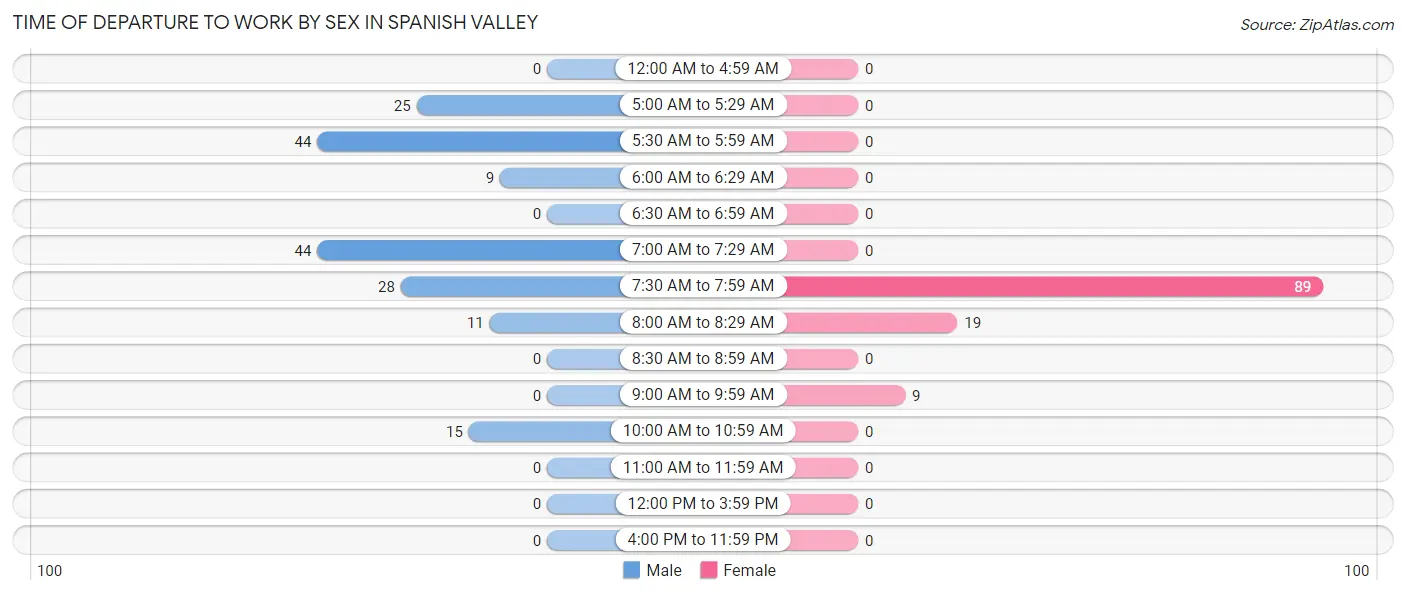
| Time of Departure | Male | Female |
| 12:00 AM to 4:59 AM | 0 (0.0%) | 0 (0.0%) |
| 5:00 AM to 5:29 AM | 25 (14.2%) | 0 (0.0%) |
| 5:30 AM to 5:59 AM | 44 (25.0%) | 0 (0.0%) |
| 6:00 AM to 6:29 AM | 9 (5.1%) | 0 (0.0%) |
| 6:30 AM to 6:59 AM | 0 (0.0%) | 0 (0.0%) |
| 7:00 AM to 7:29 AM | 44 (25.0%) | 0 (0.0%) |
| 7:30 AM to 7:59 AM | 28 (15.9%) | 89 (76.1%) |
| 8:00 AM to 8:29 AM | 11 (6.2%) | 19 (16.2%) |
| 8:30 AM to 8:59 AM | 0 (0.0%) | 0 (0.0%) |
| 9:00 AM to 9:59 AM | 0 (0.0%) | 9 (7.7%) |
| 10:00 AM to 10:59 AM | 15 (8.5%) | 0 (0.0%) |
| 11:00 AM to 11:59 AM | 0 (0.0%) | 0 (0.0%) |
| 12:00 PM to 3:59 PM | 0 (0.0%) | 0 (0.0%) |
| 4:00 PM to 11:59 PM | 0 (0.0%) | 0 (0.0%) |
| Total | 176 (100.0%) | 117 (100.0%) |
Housing Occupancy in Spanish Valley
Occupancy by Ownership in Spanish Valley
Of the total 200 dwellings in Spanish Valley, owner-occupied units account for 192 (96.0%), while renter-occupied units make up 8 (4.0%).
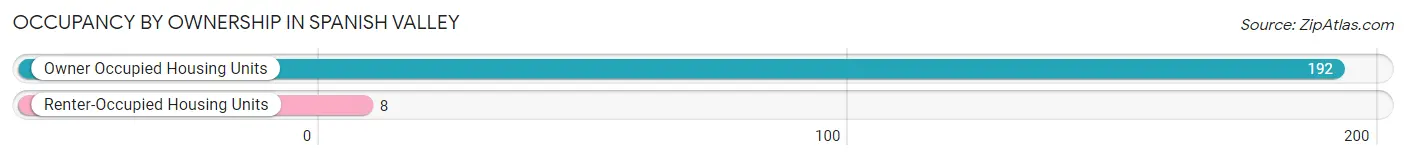
| Occupancy | # Housing Units | % Housing Units |
| Owner Occupied Housing Units | 192 | 96.0% |
| Renter-Occupied Housing Units | 8 | 4.0% |
| Total Occupied Housing Units | 200 | 100.0% |
Occupancy by Household Size in Spanish Valley
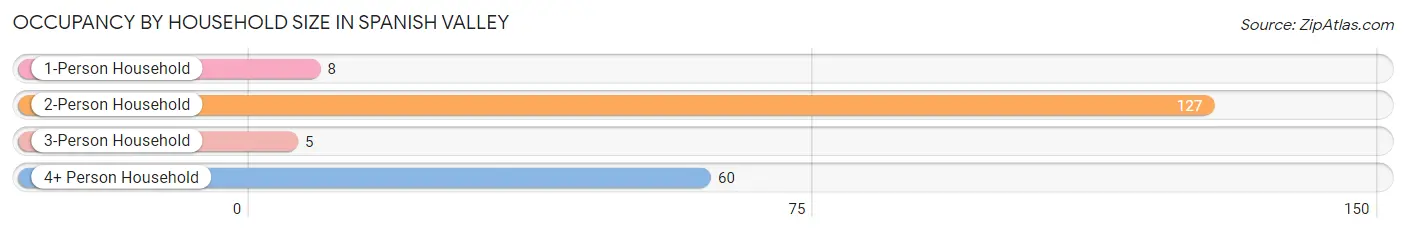
| Household Size | # Housing Units | % Housing Units |
| 1-Person Household | 8 | 4.0% |
| 2-Person Household | 127 | 63.5% |
| 3-Person Household | 5 | 2.5% |
| 4+ Person Household | 60 | 30.0% |
| Total Housing Units | 200 | 100.0% |
Occupancy by Ownership by Household Size in Spanish Valley
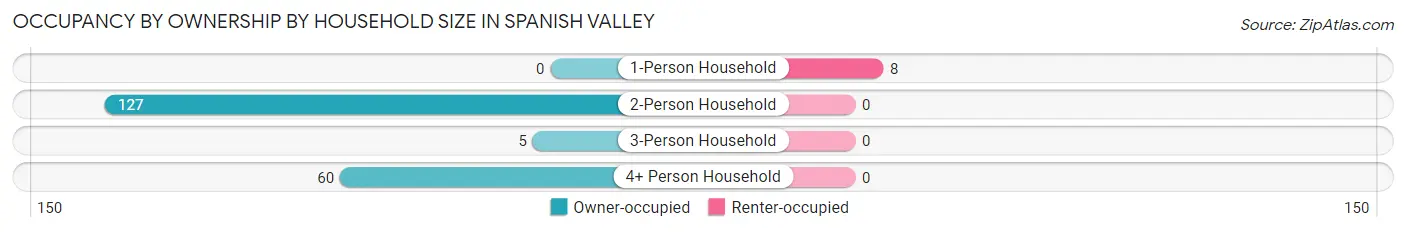
| Household Size | Owner-occupied | Renter-occupied |
| 1-Person Household | 0 (0.0%) | 8 (100.0%) |
| 2-Person Household | 127 (100.0%) | 0 (0.0%) |
| 3-Person Household | 5 (100.0%) | 0 (0.0%) |
| 4+ Person Household | 60 (100.0%) | 0 (0.0%) |
| Total Housing Units | 192 (96.0%) | 8 (4.0%) |
Occupancy by Educational Attainment in Spanish Valley
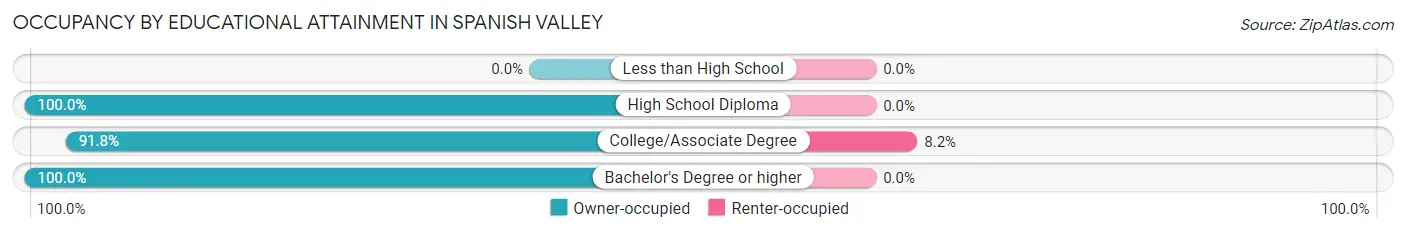
| Household Size | Owner-occupied | Renter-occupied |
| Less than High School | 0 (0.0%) | 0 (0.0%) |
| High School Diploma | 77 (100.0%) | 0 (0.0%) |
| College/Associate Degree | 90 (91.8%) | 8 (8.2%) |
| Bachelor's Degree or higher | 25 (100.0%) | 0 (0.0%) |
Occupancy by Age of Householder in Spanish Valley
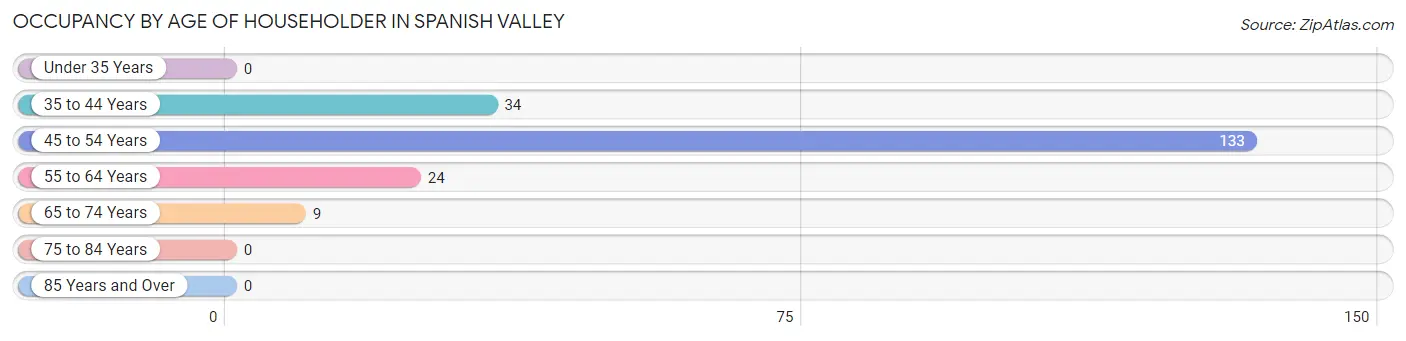
| Age Bracket | # Households | % Households |
| Under 35 Years | 0 | 0.0% |
| 35 to 44 Years | 34 | 17.0% |
| 45 to 54 Years | 133 | 66.5% |
| 55 to 64 Years | 24 | 12.0% |
| 65 to 74 Years | 9 | 4.5% |
| 75 to 84 Years | 0 | 0.0% |
| 85 Years and Over | 0 | 0.0% |
| Total | 200 | 100.0% |
Housing Finances in Spanish Valley
Median Income by Occupancy in Spanish Valley
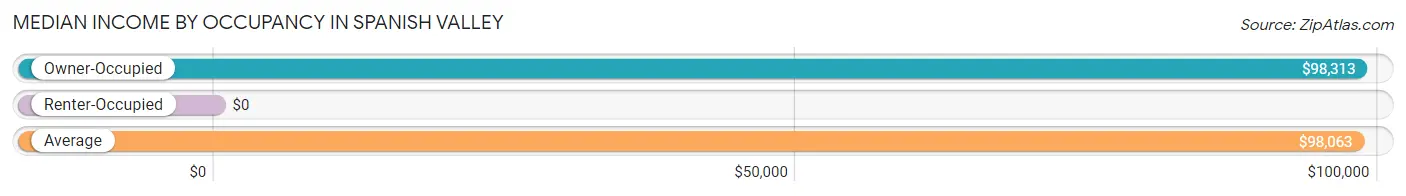
| Occupancy Type | # Households | Median Income |
| Owner-Occupied | 192 (96.0%) | $98,313 |
| Renter-Occupied | 8 (4.0%) | $0 |
| Average | 200 (100.0%) | $98,063 |
Occupancy by Householder Income Bracket in Spanish Valley
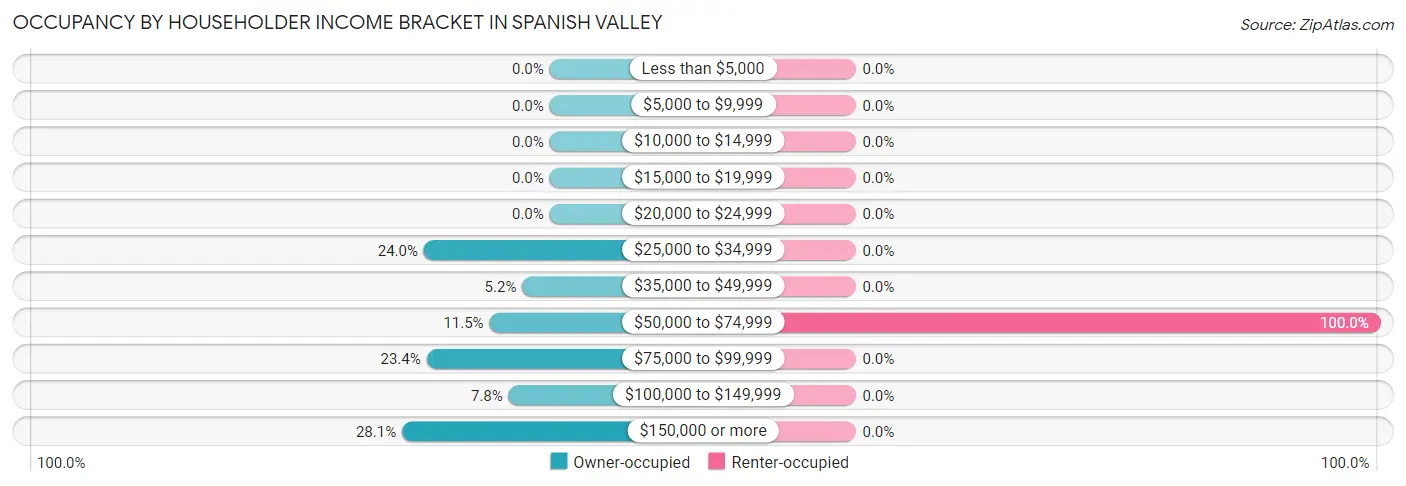
| Income Bracket | Owner-occupied | Renter-occupied |
| Less than $5,000 | 0 (0.0%) | 0 (0.0%) |
| $5,000 to $9,999 | 0 (0.0%) | 0 (0.0%) |
| $10,000 to $14,999 | 0 (0.0%) | 0 (0.0%) |
| $15,000 to $19,999 | 0 (0.0%) | 0 (0.0%) |
| $20,000 to $24,999 | 0 (0.0%) | 0 (0.0%) |
| $25,000 to $34,999 | 46 (24.0%) | 0 (0.0%) |
| $35,000 to $49,999 | 10 (5.2%) | 0 (0.0%) |
| $50,000 to $74,999 | 22 (11.5%) | 8 (100.0%) |
| $75,000 to $99,999 | 45 (23.4%) | 0 (0.0%) |
| $100,000 to $149,999 | 15 (7.8%) | 0 (0.0%) |
| $150,000 or more | 54 (28.1%) | 0 (0.0%) |
| Total | 192 (100.0%) | 8 (100.0%) |
Monthly Housing Cost Tiers in Spanish Valley
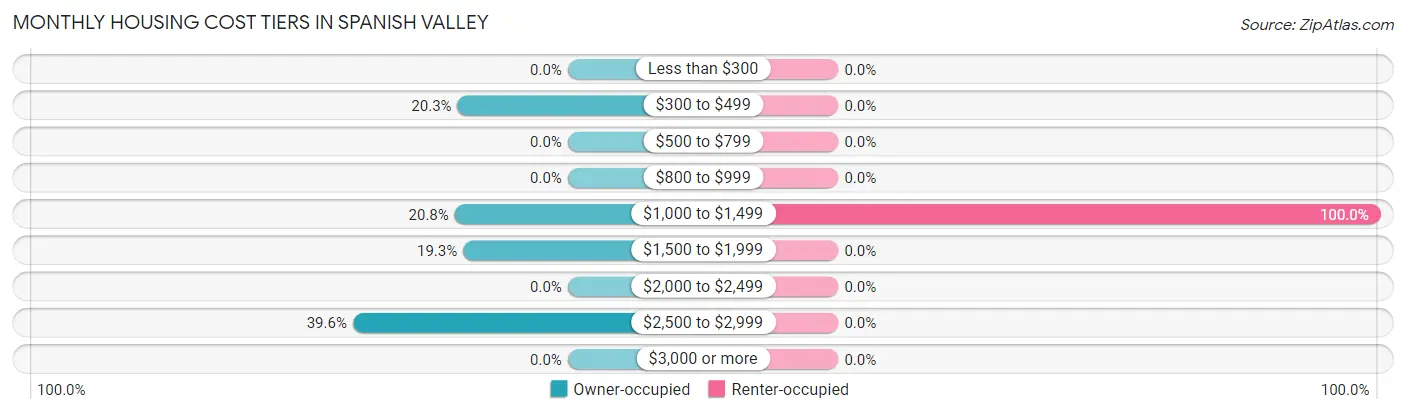
| Monthly Cost | Owner-occupied | Renter-occupied |
| Less than $300 | 0 (0.0%) | 0 (0.0%) |
| $300 to $499 | 39 (20.3%) | 0 (0.0%) |
| $500 to $799 | 0 (0.0%) | 0 (0.0%) |
| $800 to $999 | 0 (0.0%) | 0 (0.0%) |
| $1,000 to $1,499 | 40 (20.8%) | 8 (100.0%) |
| $1,500 to $1,999 | 37 (19.3%) | 0 (0.0%) |
| $2,000 to $2,499 | 0 (0.0%) | 0 (0.0%) |
| $2,500 to $2,999 | 76 (39.6%) | 0 (0.0%) |
| $3,000 or more | 0 (0.0%) | 0 (0.0%) |
| Total | 192 (100.0%) | 8 (100.0%) |
Physical Housing Characteristics in Spanish Valley
Housing Structures in Spanish Valley
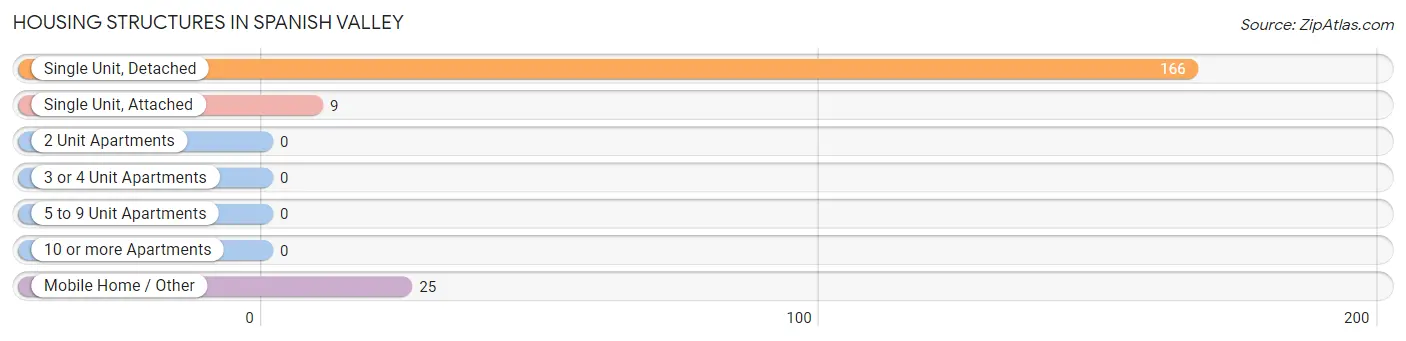
| Structure Type | # Housing Units | % Housing Units |
| Single Unit, Detached | 166 | 83.0% |
| Single Unit, Attached | 9 | 4.5% |
| 2 Unit Apartments | 0 | 0.0% |
| 3 or 4 Unit Apartments | 0 | 0.0% |
| 5 to 9 Unit Apartments | 0 | 0.0% |
| 10 or more Apartments | 0 | 0.0% |
| Mobile Home / Other | 25 | 12.5% |
| Total | 200 | 100.0% |
Housing Structures by Occupancy in Spanish Valley
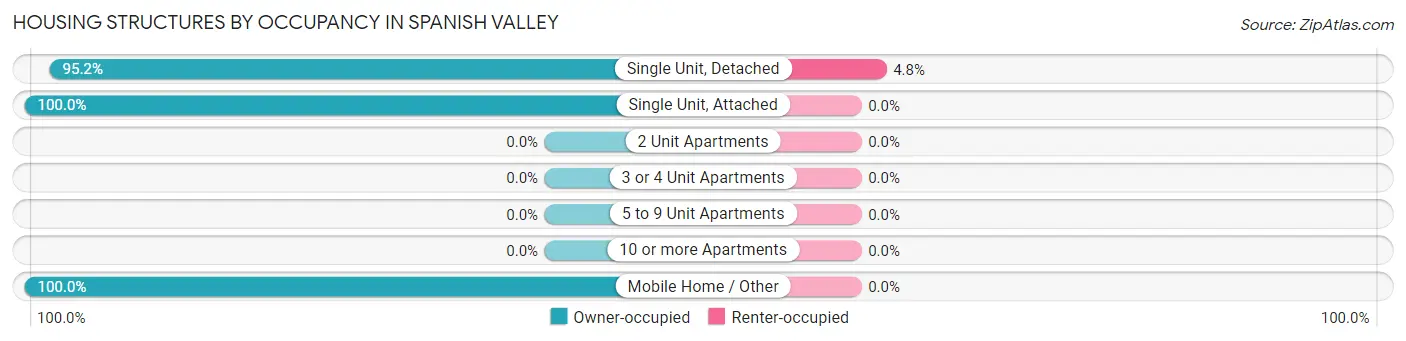
| Structure Type | Owner-occupied | Renter-occupied |
| Single Unit, Detached | 158 (95.2%) | 8 (4.8%) |
| Single Unit, Attached | 9 (100.0%) | 0 (0.0%) |
| 2 Unit Apartments | 0 (0.0%) | 0 (0.0%) |
| 3 or 4 Unit Apartments | 0 (0.0%) | 0 (0.0%) |
| 5 to 9 Unit Apartments | 0 (0.0%) | 0 (0.0%) |
| 10 or more Apartments | 0 (0.0%) | 0 (0.0%) |
| Mobile Home / Other | 25 (100.0%) | 0 (0.0%) |
| Total | 192 (96.0%) | 8 (4.0%) |
Housing Structures by Number of Rooms in Spanish Valley
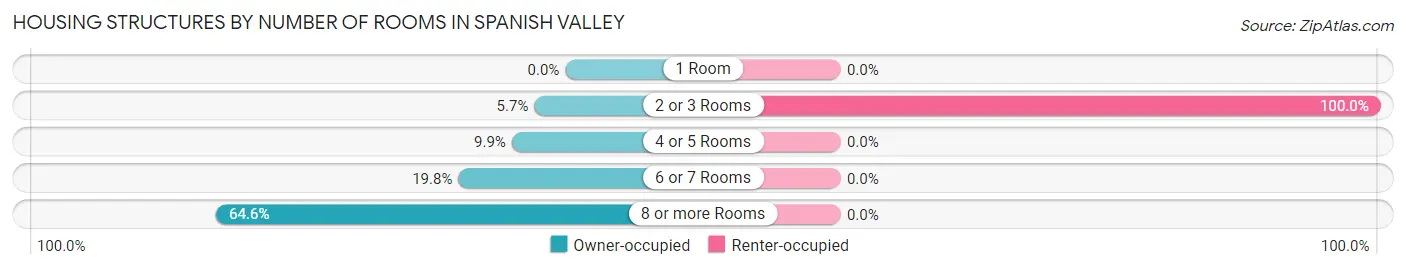
| Number of Rooms | Owner-occupied | Renter-occupied |
| 1 Room | 0 (0.0%) | 0 (0.0%) |
| 2 or 3 Rooms | 11 (5.7%) | 8 (100.0%) |
| 4 or 5 Rooms | 19 (9.9%) | 0 (0.0%) |
| 6 or 7 Rooms | 38 (19.8%) | 0 (0.0%) |
| 8 or more Rooms | 124 (64.6%) | 0 (0.0%) |
| Total | 192 (100.0%) | 8 (100.0%) |
Housing Structure by Heating Type in Spanish Valley
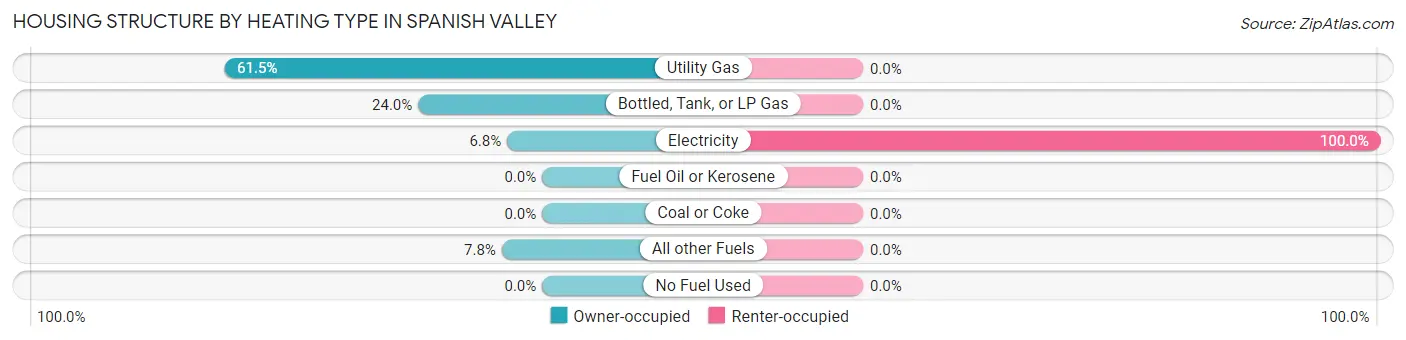
| Heating Type | Owner-occupied | Renter-occupied |
| Utility Gas | 118 (61.5%) | 0 (0.0%) |
| Bottled, Tank, or LP Gas | 46 (24.0%) | 0 (0.0%) |
| Electricity | 13 (6.8%) | 8 (100.0%) |
| Fuel Oil or Kerosene | 0 (0.0%) | 0 (0.0%) |
| Coal or Coke | 0 (0.0%) | 0 (0.0%) |
| All other Fuels | 15 (7.8%) | 0 (0.0%) |
| No Fuel Used | 0 (0.0%) | 0 (0.0%) |
| Total | 192 (100.0%) | 8 (100.0%) |
Household Vehicle Usage in Spanish Valley
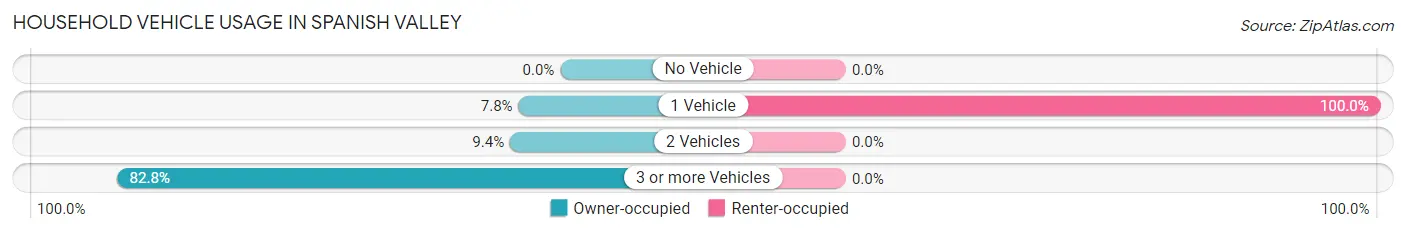
| Vehicles per Household | Owner-occupied | Renter-occupied |
| No Vehicle | 0 (0.0%) | 0 (0.0%) |
| 1 Vehicle | 15 (7.8%) | 8 (100.0%) |
| 2 Vehicles | 18 (9.4%) | 0 (0.0%) |
| 3 or more Vehicles | 159 (82.8%) | 0 (0.0%) |
| Total | 192 (100.0%) | 8 (100.0%) |
Real Estate & Mortgages in Spanish Valley
Real Estate and Mortgage Overview in Spanish Valley
| Characteristic | Without Mortgage | With Mortgage |
| Housing Units | 20 | 172 |
| Median Property Value | - | - |
| Median Household Income | - | - |
| Monthly Housing Costs | - | - |
| Real Estate Taxes | - | - |
Property Value by Mortgage Status in Spanish Valley
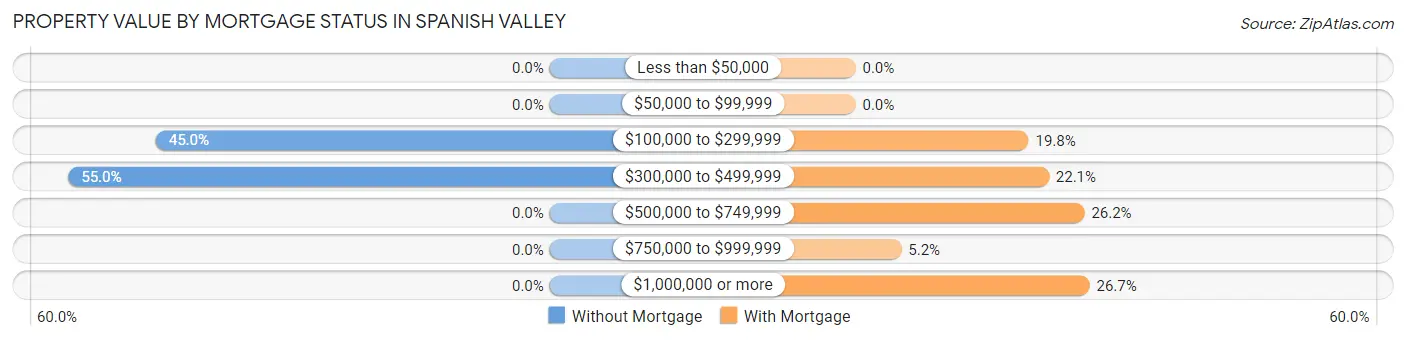
| Property Value | Without Mortgage | With Mortgage |
| Less than $50,000 | 0 (0.0%) | 0 (0.0%) |
| $50,000 to $99,999 | 0 (0.0%) | 0 (0.0%) |
| $100,000 to $299,999 | 9 (45.0%) | 34 (19.8%) |
| $300,000 to $499,999 | 11 (55.0%) | 38 (22.1%) |
| $500,000 to $749,999 | 0 (0.0%) | 45 (26.2%) |
| $750,000 to $999,999 | 0 (0.0%) | 9 (5.2%) |
| $1,000,000 or more | 0 (0.0%) | 46 (26.7%) |
| Total | 20 (100.0%) | 172 (100.0%) |
Household Income by Mortgage Status in Spanish Valley
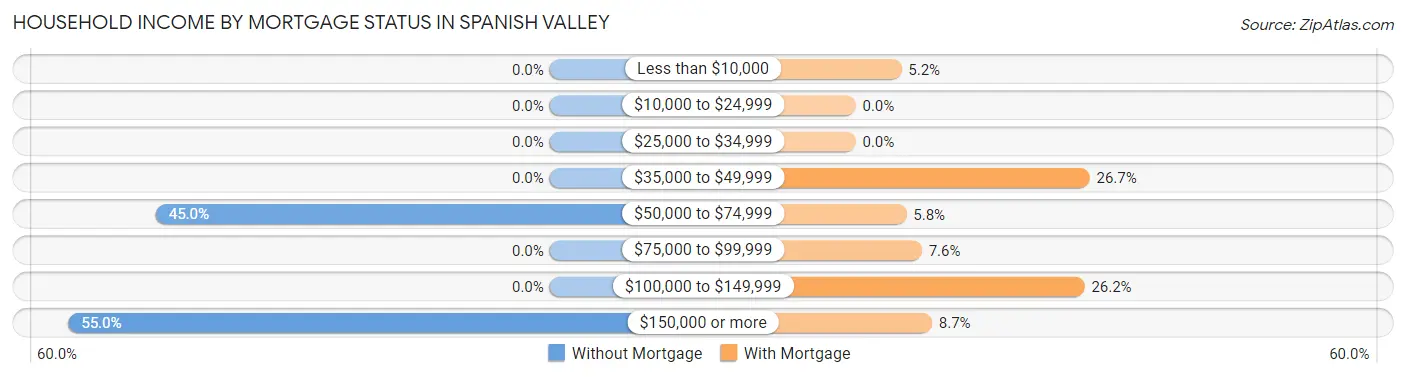
| Household Income | Without Mortgage | With Mortgage |
| Less than $10,000 | 0 (0.0%) | 9 (5.2%) |
| $10,000 to $24,999 | 0 (0.0%) | 0 (0.0%) |
| $25,000 to $34,999 | 0 (0.0%) | 0 (0.0%) |
| $35,000 to $49,999 | 0 (0.0%) | 46 (26.7%) |
| $50,000 to $74,999 | 9 (45.0%) | 10 (5.8%) |
| $75,000 to $99,999 | 0 (0.0%) | 13 (7.6%) |
| $100,000 to $149,999 | 0 (0.0%) | 45 (26.2%) |
| $150,000 or more | 11 (55.0%) | 15 (8.7%) |
| Total | 20 (100.0%) | 172 (100.0%) |
Property Value to Household Income Ratio in Spanish Valley
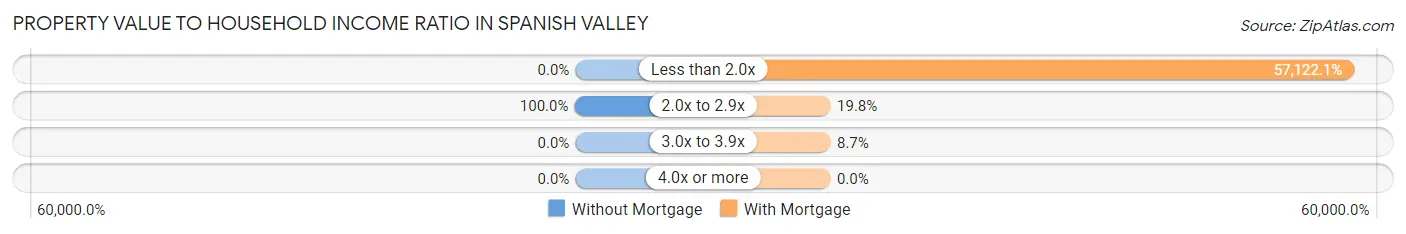
| Value-to-Income Ratio | Without Mortgage | With Mortgage |
| Less than 2.0x | 0 (0.0%) | 98,250 (57,122.1%) |
| 2.0x to 2.9x | 20 (100.0%) | 34 (19.8%) |
| 3.0x to 3.9x | 0 (0.0%) | 15 (8.7%) |
| 4.0x or more | 0 (0.0%) | 0 (0.0%) |
| Total | 20 (100.0%) | 172 (100.0%) |
Real Estate Taxes by Mortgage Status in Spanish Valley
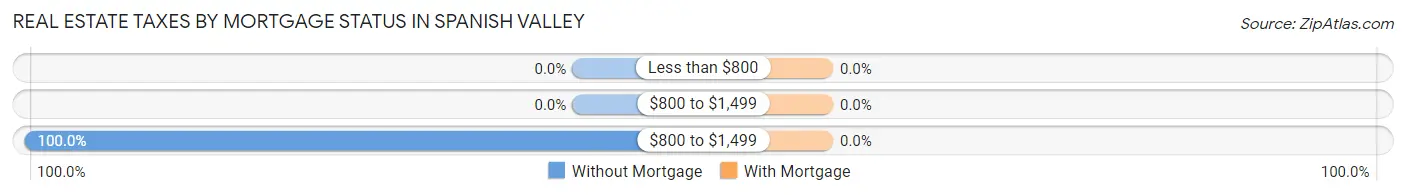
| Property Taxes | Without Mortgage | With Mortgage |
| Less than $800 | 0 (0.0%) | 0 (0.0%) |
| $800 to $1,499 | 0 (0.0%) | 0 (0.0%) |
| $800 to $1,499 | 20 (100.0%) | 0 (0.0%) |
| Total | 20 (100.0%) | 172 (100.0%) |
Health & Disability in Spanish Valley
Health Insurance Coverage by Age in Spanish Valley
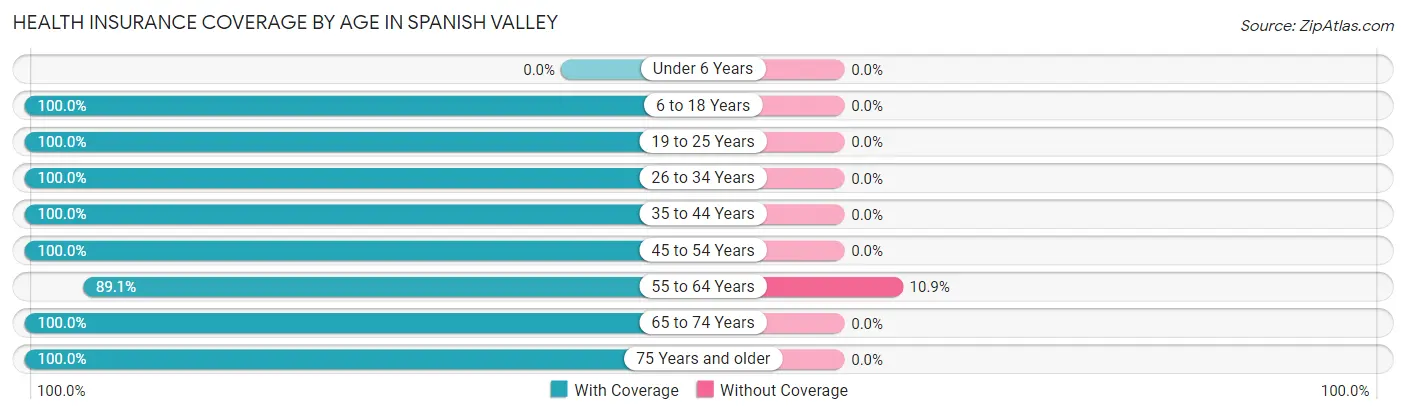
| Age Bracket | With Coverage | Without Coverage |
| Under 6 Years | 0 (0.0%) | 0 (0.0%) |
| 6 to 18 Years | 75 (100.0%) | 0 (0.0%) |
| 19 to 25 Years | 57 (100.0%) | 0 (0.0%) |
| 26 to 34 Years | 20 (100.0%) | 0 (0.0%) |
| 35 to 44 Years | 80 (100.0%) | 0 (0.0%) |
| 45 to 54 Years | 220 (100.0%) | 0 (0.0%) |
| 55 to 64 Years | 41 (89.1%) | 5 (10.9%) |
| 65 to 74 Years | 29 (100.0%) | 0 (0.0%) |
| 75 Years and older | 18 (100.0%) | 0 (0.0%) |
| Total | 540 (99.1%) | 5 (0.9%) |
Health Insurance Coverage by Citizenship Status in Spanish Valley
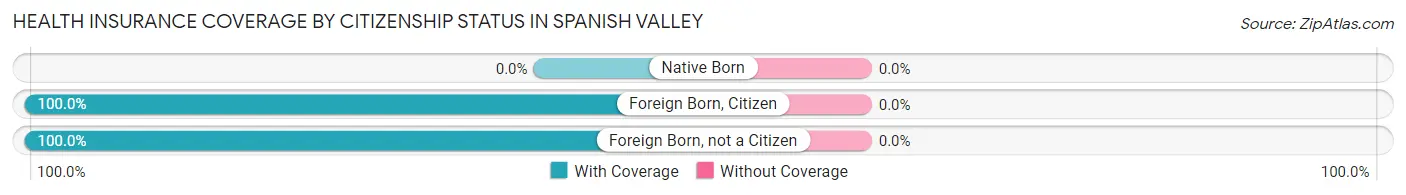
| Citizenship Status | With Coverage | Without Coverage |
| Native Born | 0 (0.0%) | 0 (0.0%) |
| Foreign Born, Citizen | 75 (100.0%) | 0 (0.0%) |
| Foreign Born, not a Citizen | 57 (100.0%) | 0 (0.0%) |
Health Insurance Coverage by Household Income in Spanish Valley
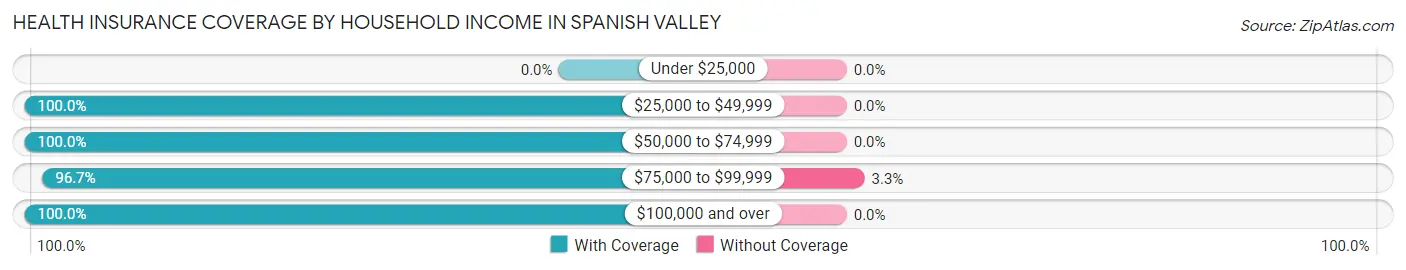
| Household Income | With Coverage | Without Coverage |
| Under $25,000 | 0 (0.0%) | 0 (0.0%) |
| $25,000 to $49,999 | 80 (100.0%) | 0 (0.0%) |
| $50,000 to $74,999 | 81 (100.0%) | 0 (0.0%) |
| $75,000 to $99,999 | 145 (96.7%) | 5 (3.3%) |
| $100,000 and over | 234 (100.0%) | 0 (0.0%) |
Public vs Private Health Insurance Coverage by Age in Spanish Valley
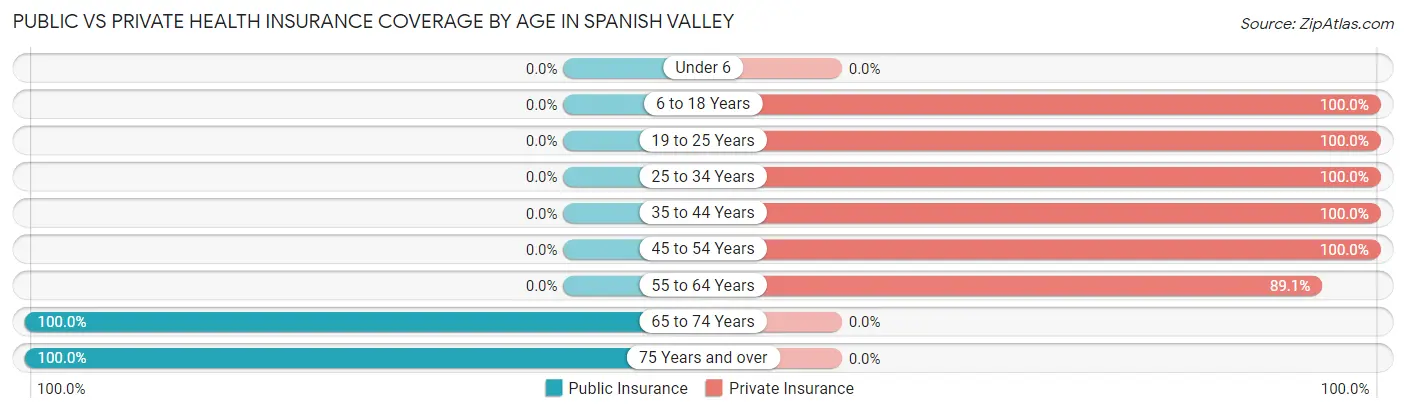
| Age Bracket | Public Insurance | Private Insurance |
| Under 6 | 0 (0.0%) | 0 (0.0%) |
| 6 to 18 Years | 0 (0.0%) | 75 (100.0%) |
| 19 to 25 Years | 0 (0.0%) | 57 (100.0%) |
| 25 to 34 Years | 0 (0.0%) | 20 (100.0%) |
| 35 to 44 Years | 0 (0.0%) | 80 (100.0%) |
| 45 to 54 Years | 0 (0.0%) | 220 (100.0%) |
| 55 to 64 Years | 0 (0.0%) | 41 (89.1%) |
| 65 to 74 Years | 29 (100.0%) | 0 (0.0%) |
| 75 Years and over | 18 (100.0%) | 0 (0.0%) |
| Total | 47 (8.6%) | 493 (90.5%) |
Disability Status by Sex by Age in Spanish Valley
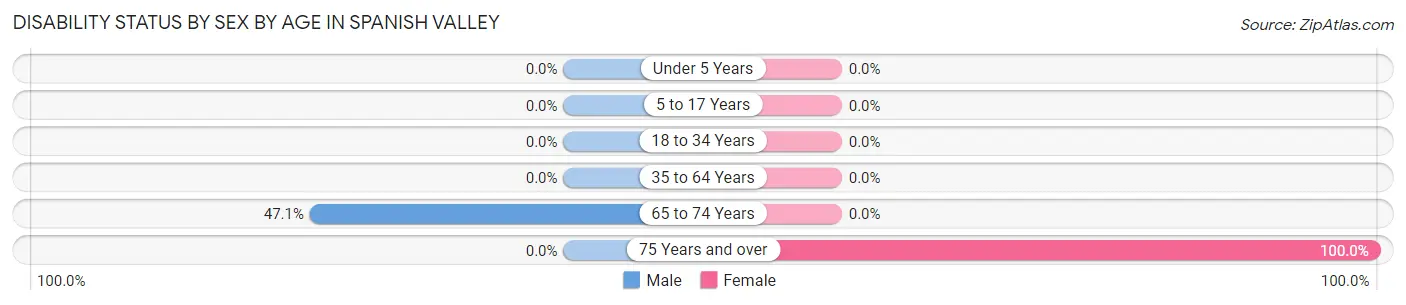
| Age Bracket | Male | Female |
| Under 5 Years | 0 (0.0%) | 0 (0.0%) |
| 5 to 17 Years | 0 (0.0%) | 0 (0.0%) |
| 18 to 34 Years | 0 (0.0%) | 0 (0.0%) |
| 35 to 64 Years | 0 (0.0%) | 0 (0.0%) |
| 65 to 74 Years | 8 (47.1%) | 0 (0.0%) |
| 75 Years and over | 0 (0.0%) | 18 (100.0%) |
Disability Class by Sex by Age in Spanish Valley
Disability Class: Hearing Difficulty
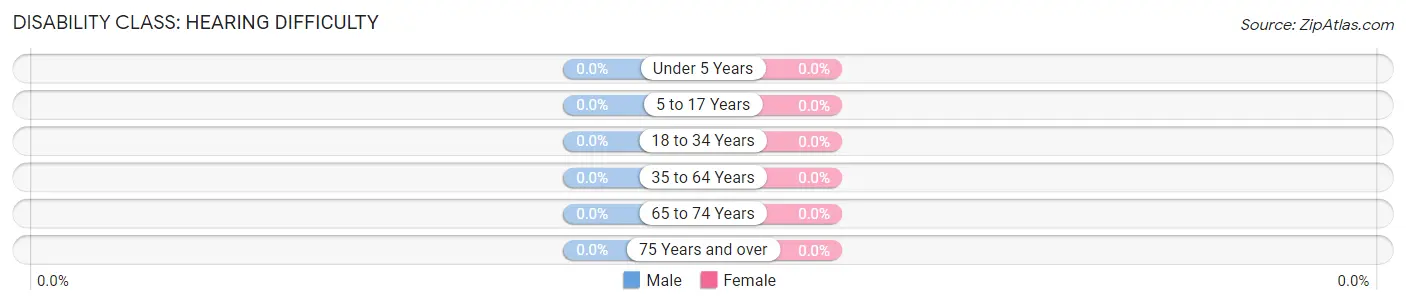
| Age Bracket | Male | Female |
| Under 5 Years | 0 (0.0%) | 0 (0.0%) |
| 5 to 17 Years | 0 (0.0%) | 0 (0.0%) |
| 18 to 34 Years | 0 (0.0%) | 0 (0.0%) |
| 35 to 64 Years | 0 (0.0%) | 0 (0.0%) |
| 65 to 74 Years | 0 (0.0%) | 0 (0.0%) |
| 75 Years and over | 0 (0.0%) | 0 (0.0%) |
Disability Class: Vision Difficulty
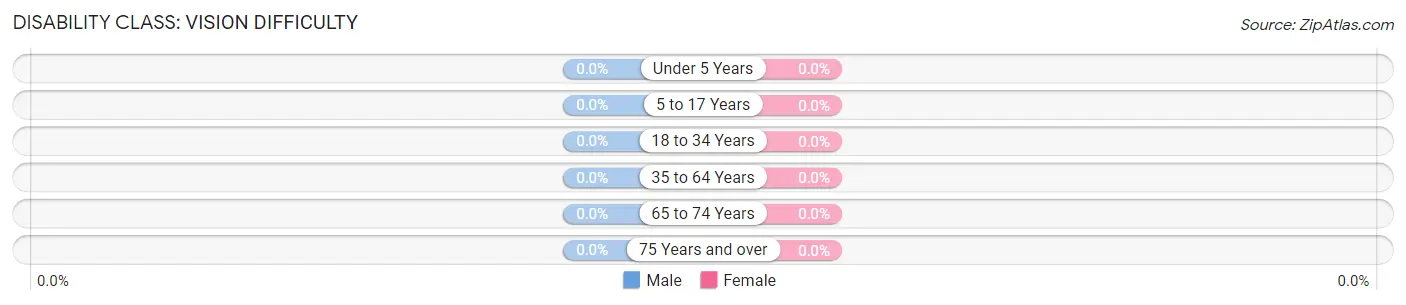
| Age Bracket | Male | Female |
| Under 5 Years | 0 (0.0%) | 0 (0.0%) |
| 5 to 17 Years | 0 (0.0%) | 0 (0.0%) |
| 18 to 34 Years | 0 (0.0%) | 0 (0.0%) |
| 35 to 64 Years | 0 (0.0%) | 0 (0.0%) |
| 65 to 74 Years | 0 (0.0%) | 0 (0.0%) |
| 75 Years and over | 0 (0.0%) | 0 (0.0%) |
Disability Class: Cognitive Difficulty
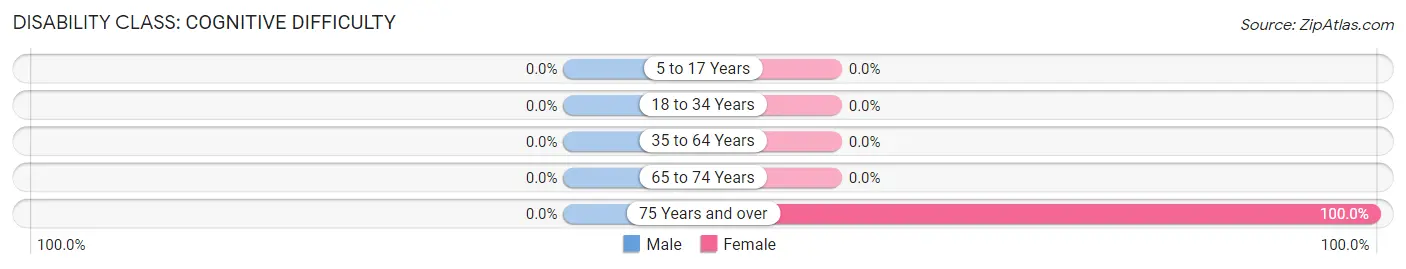
| Age Bracket | Male | Female |
| 5 to 17 Years | 0 (0.0%) | 0 (0.0%) |
| 18 to 34 Years | 0 (0.0%) | 0 (0.0%) |
| 35 to 64 Years | 0 (0.0%) | 0 (0.0%) |
| 65 to 74 Years | 0 (0.0%) | 0 (0.0%) |
| 75 Years and over | 0 (0.0%) | 18 (100.0%) |
Disability Class: Ambulatory Difficulty
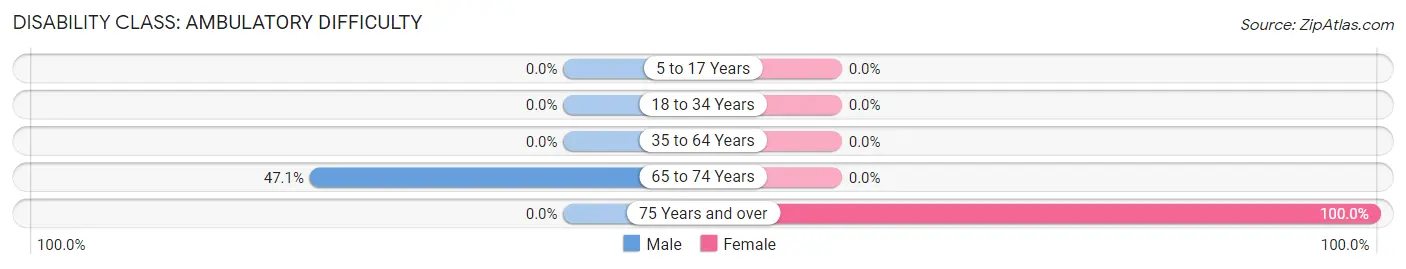
| Age Bracket | Male | Female |
| 5 to 17 Years | 0 (0.0%) | 0 (0.0%) |
| 18 to 34 Years | 0 (0.0%) | 0 (0.0%) |
| 35 to 64 Years | 0 (0.0%) | 0 (0.0%) |
| 65 to 74 Years | 8 (47.1%) | 0 (0.0%) |
| 75 Years and over | 0 (0.0%) | 18 (100.0%) |
Disability Class: Self-Care Difficulty
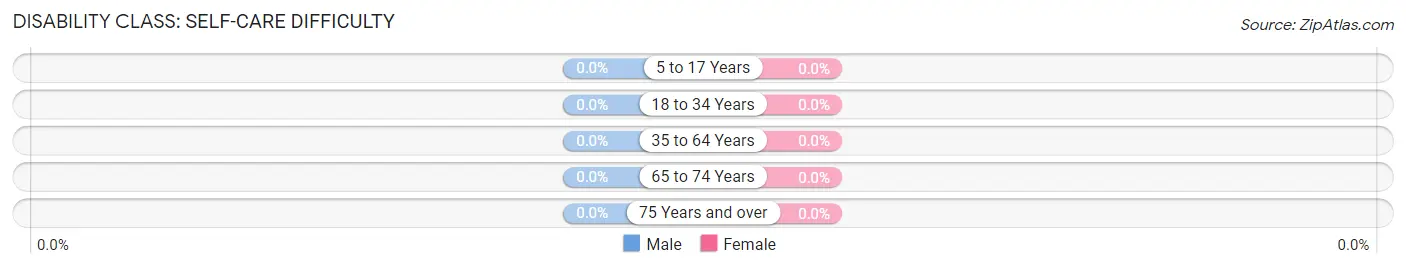
| Age Bracket | Male | Female |
| 5 to 17 Years | 0 (0.0%) | 0 (0.0%) |
| 18 to 34 Years | 0 (0.0%) | 0 (0.0%) |
| 35 to 64 Years | 0 (0.0%) | 0 (0.0%) |
| 65 to 74 Years | 0 (0.0%) | 0 (0.0%) |
| 75 Years and over | 0 (0.0%) | 0 (0.0%) |
Technology Access in Spanish Valley
Computing Device Access in Spanish Valley
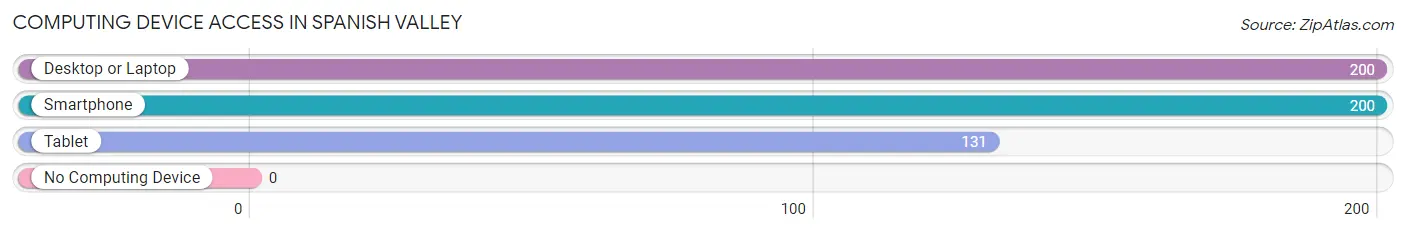
| Device Type | # Households | % Households |
| Desktop or Laptop | 200 | 100.0% |
| Smartphone | 200 | 100.0% |
| Tablet | 131 | 65.5% |
| No Computing Device | 0 | 0.0% |
| Total | 200 | 100.0% |
Internet Access in Spanish Valley
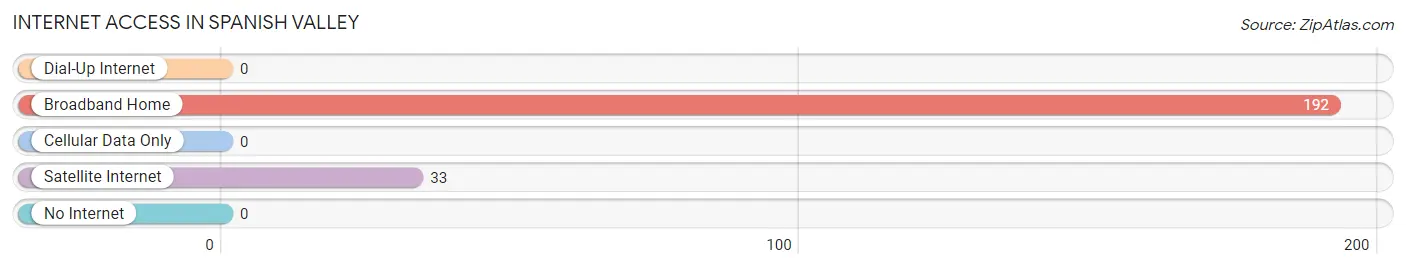
| Internet Type | # Households | % Households |
| Dial-Up Internet | 0 | 0.0% |
| Broadband Home | 192 | 96.0% |
| Cellular Data Only | 0 | 0.0% |
| Satellite Internet | 33 | 16.5% |
| No Internet | 0 | 0.0% |
| Total | 200 | 100.0% |
Spanish Valley Summary
History
Spanish Valley is a small unincorporated community located in San Juan County, Utah. It is situated in the southeastern corner of the state, near the Arizona border. The area was first settled by Mormon pioneers in the late 1800s, and the town was officially established in 1891. The town was named after the Spanish Valley, a nearby canyon that was named by the early settlers due to its resemblance to the Spanish countryside.
The town was originally a farming community, and the main crops grown were wheat, corn, and hay. The town also had a few small businesses, including a general store, a blacksmith shop, and a post office. In the early 1900s, the town began to grow as more people moved to the area. The population peaked in the 1950s, when the town had a population of around 500 people.
Geography
Spanish Valley is located in the southeastern corner of Utah, near the Arizona border. It is situated in the San Juan County, and is surrounded by the Abajo Mountains to the east and the La Sal Mountains to the west. The town is located at an elevation of 5,400 feet, and the climate is semi-arid. The area receives an average of 8 inches of precipitation per year, and the average temperature is around 70 degrees Fahrenheit.
The town is located near several natural attractions, including the Valley of the Gods, Monument Valley, and the Goosenecks State Park. The area is also home to several Native American tribes, including the Navajo, Hopi, and Ute.
Economy
The economy of Spanish Valley is largely based on agriculture and tourism. The town is home to several farms, which produce a variety of crops, including wheat, corn, hay, and alfalfa. The town also has several small businesses, including a general store, a post office, and a few restaurants.
The town is also a popular tourist destination, due to its proximity to several natural attractions. The area is home to several Native American tribes, and visitors can explore the area’s history and culture. The town also hosts several festivals and events throughout the year, including the San Juan County Fair and the Spanish Valley Days celebration.
Demographics
As of the 2010 census, the population of Spanish Valley was 1,072. The population is largely made up of Native Americans, with the Navajo making up the largest group. The town also has a small Hispanic population, as well as a few white and African American residents. The median household income in the town is $30,000, and the median age is 33. The town has a high rate of poverty, with nearly 30% of the population living below the poverty line.
Common Questions
What is Per Capita Income in Spanish Valley?
Per Capita income in Spanish Valley is $57,494.
What is the Median Family Income in Spanish Valley?
Median Family Income in Spanish Valley is $93,000.
What is the Median Household income in Spanish Valley?
Median Household Income in Spanish Valley is $98,063.
What is Income or Wage Gap in Spanish Valley?
Income or Wage Gap in Spanish Valley is 46.7%.
Women in Spanish Valley earn 53.3 cents for every dollar earned by a man.
What is Inequality or Gini Index in Spanish Valley?
Inequality or Gini Index in Spanish Valley is 0.52.
What is the Total Population of Spanish Valley?
Total Population of Spanish Valley is 545.
What is the Total Male Population of Spanish Valley?
Total Male Population of Spanish Valley is 299.
What is the Total Female Population of Spanish Valley?
Total Female Population of Spanish Valley is 246.
What is the Ratio of Males per 100 Females in Spanish Valley?
There are 121.54 Males per 100 Females in Spanish Valley.
What is the Ratio of Females per 100 Males in Spanish Valley?
There are 82.27 Females per 100 Males in Spanish Valley.
What is the Median Population Age in Spanish Valley?
Median Population Age in Spanish Valley is 48.3 Years.
What is the Average Family Size in Spanish Valley
Average Family Size in Spanish Valley is 3.0 People.
What is the Average Household Size in Spanish Valley
Average Household Size in Spanish Valley is 2.7 People.
How Large is the Labor Force in Spanish Valley?
There are 363 People in the Labor Forcein in Spanish Valley.
What is the Percentage of People in the Labor Force in Spanish Valley?
77.2% of People are in the Labor Force in Spanish Valley.