Rosenberg, TX Map & Demographics
Rosenberg Map
Rosenberg Overview
$26,854
PER CAPITA INCOME
$75,698
AVG FAMILY INCOME
$66,046
AVG HOUSEHOLD INCOME
34.1%
WAGE / INCOME GAP [ % ]
65.9¢/ $1
WAGE / INCOME GAP [ $ ]
$14,126
FAMILY INCOME DEFICIT
0.39
INEQUALITY / GINI INDEX
38,722
TOTAL POPULATION
18,750
MALE POPULATION
19,972
FEMALE POPULATION
93.88
MALES / 100 FEMALES
106.52
FEMALES / 100 MALES
31.2
MEDIAN AGE
3.4
AVG FAMILY SIZE
2.7
AVG HOUSEHOLD SIZE
19,483
LABOR FORCE [ PEOPLE ]
65.1%
PERCENT IN LABOR FORCE
3.4%
UNEMPLOYMENT RATE
Rosenberg Zip Codes
Income in Rosenberg
Income Overview in Rosenberg
Per Capita Income in Rosenberg is $26,854, while median incomes of families and households are $75,698 and $66,046 respectively.
| Characteristic | Number | Measure |
| Per Capita Income | 38,722 | $26,854 |
| Median Family Income | 9,507 | $75,698 |
| Mean Family Income | 9,507 | $78,318 |
| Median Household Income | 14,344 | $66,046 |
| Mean Household Income | 14,344 | $71,124 |
| Income Deficit | 9,507 | $14,126 |
| Wage / Income Gap (%) | 38,722 | 34.11% |
| Wage / Income Gap ($) | 38,722 | 65.89¢ per $1 |
| Gini / Inequality Index | 38,722 | 0.39 |
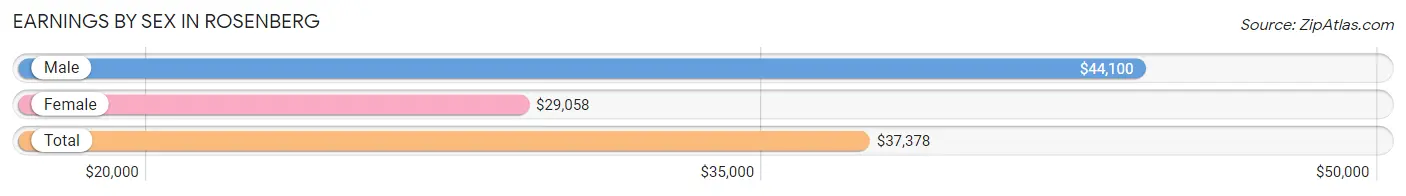
Earnings by Sex in Rosenberg
Average Earnings in Rosenberg are $37,378, $44,100 for men and $29,058 for women, a difference of 34.1%.
| Sex | Number | Average Earnings |
| Male | 11,747 (59.4%) | $44,100 |
| Female | 8,032 (40.6%) | $29,058 |
| Total | 19,779 (100.0%) | $37,378 |
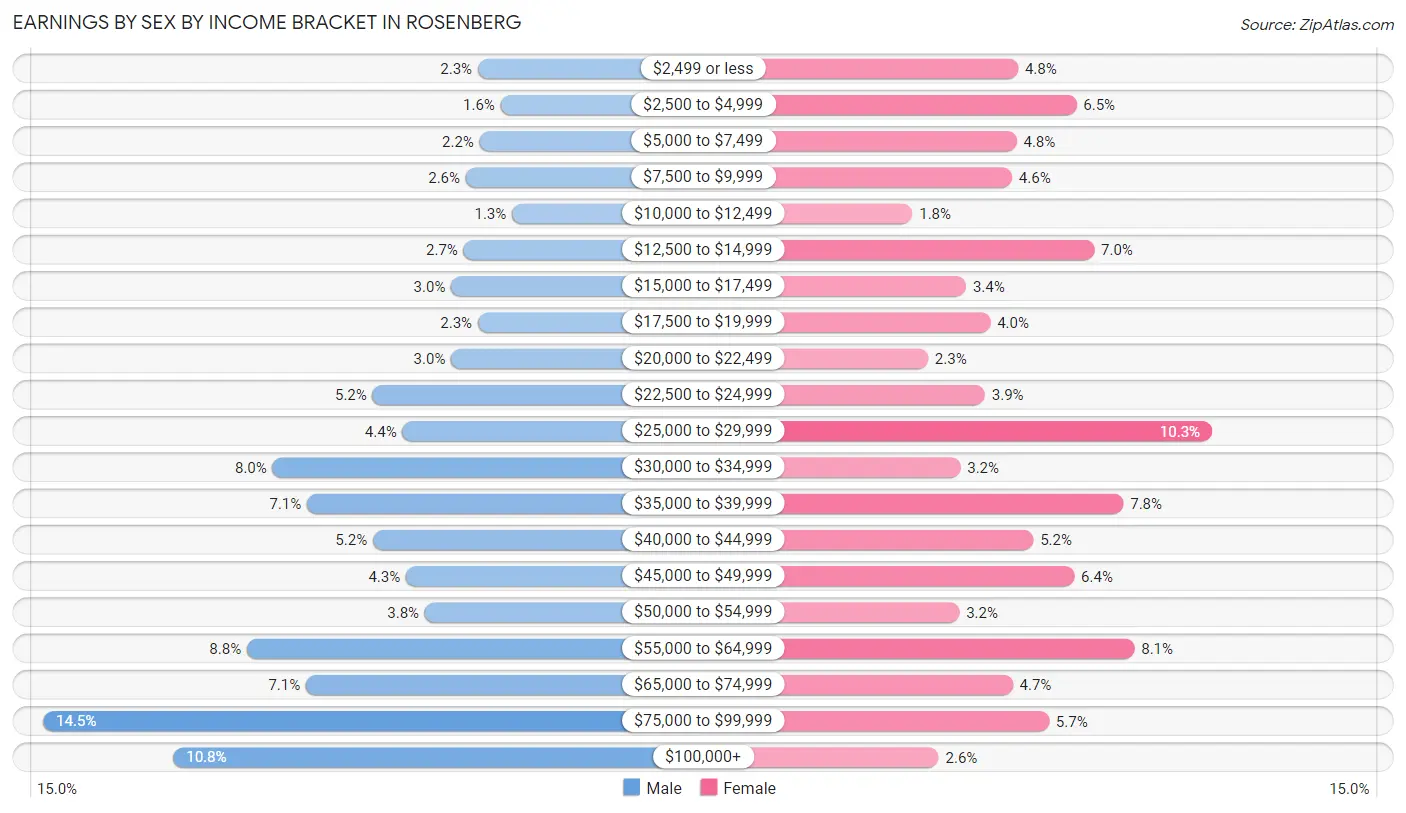
Earnings by Sex by Income Bracket in Rosenberg
The most common earnings brackets in Rosenberg are $75,000 to $99,999 for men (1,701 | 14.5%) and $25,000 to $29,999 for women (824 | 10.3%).
| Income | Male | Female |
| $2,499 or less | 265 (2.3%) | 386 (4.8%) |
| $2,500 to $4,999 | 190 (1.6%) | 518 (6.5%) |
| $5,000 to $7,499 | 260 (2.2%) | 383 (4.8%) |
| $7,500 to $9,999 | 305 (2.6%) | 373 (4.6%) |
| $10,000 to $12,499 | 153 (1.3%) | 148 (1.8%) |
| $12,500 to $14,999 | 313 (2.7%) | 558 (7.0%) |
| $15,000 to $17,499 | 353 (3.0%) | 269 (3.4%) |
| $17,500 to $19,999 | 266 (2.3%) | 324 (4.0%) |
| $20,000 to $22,499 | 353 (3.0%) | 183 (2.3%) |
| $22,500 to $24,999 | 613 (5.2%) | 312 (3.9%) |
| $25,000 to $29,999 | 515 (4.4%) | 824 (10.3%) |
| $30,000 to $34,999 | 943 (8.0%) | 256 (3.2%) |
| $35,000 to $39,999 | 829 (7.1%) | 624 (7.8%) |
| $40,000 to $44,999 | 612 (5.2%) | 421 (5.2%) |
| $45,000 to $49,999 | 503 (4.3%) | 513 (6.4%) |
| $50,000 to $54,999 | 441 (3.7%) | 254 (3.2%) |
| $55,000 to $64,999 | 1,028 (8.7%) | 649 (8.1%) |
| $65,000 to $74,999 | 833 (7.1%) | 374 (4.7%) |
| $75,000 to $99,999 | 1,701 (14.5%) | 456 (5.7%) |
| $100,000+ | 1,271 (10.8%) | 207 (2.6%) |
| Total | 11,747 (100.0%) | 8,032 (100.0%) |
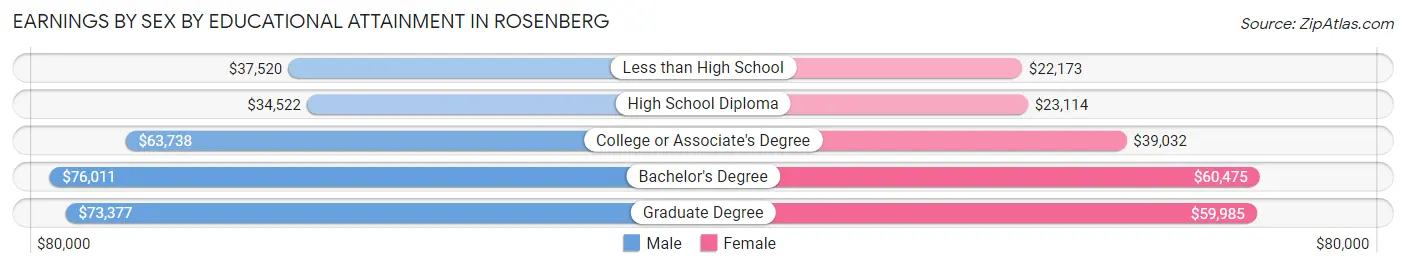
Earnings by Sex by Educational Attainment in Rosenberg
Average earnings in Rosenberg are $49,226 for men and $36,469 for women, a difference of 25.9%. Men with an educational attainment of bachelor's degree enjoy the highest average annual earnings of $76,011, while those with high school diploma education earn the least with $34,522. Women with an educational attainment of bachelor's degree earn the most with the average annual earnings of $60,475, while those with less than high school education have the smallest earnings of $22,173.
| Educational Attainment | Male Income | Female Income |
| Less than High School | $37,520 | $22,173 |
| High School Diploma | $34,522 | $23,114 |
| College or Associate's Degree | $63,738 | $39,032 |
| Bachelor's Degree | $76,011 | $60,475 |
| Graduate Degree | $73,377 | $59,985 |
| Total | $49,226 | $36,469 |
Family Income in Rosenberg
Family Income Brackets in Rosenberg
According to the Rosenberg family income data, there are 2,595 families falling into the $75,000 to $99,999 income range, which is the most common income bracket and makes up 27.3% of all families. Conversely, the $10,000 to $14,999 income bracket is the least frequent group with only 257 families (2.7%) belonging to this category.
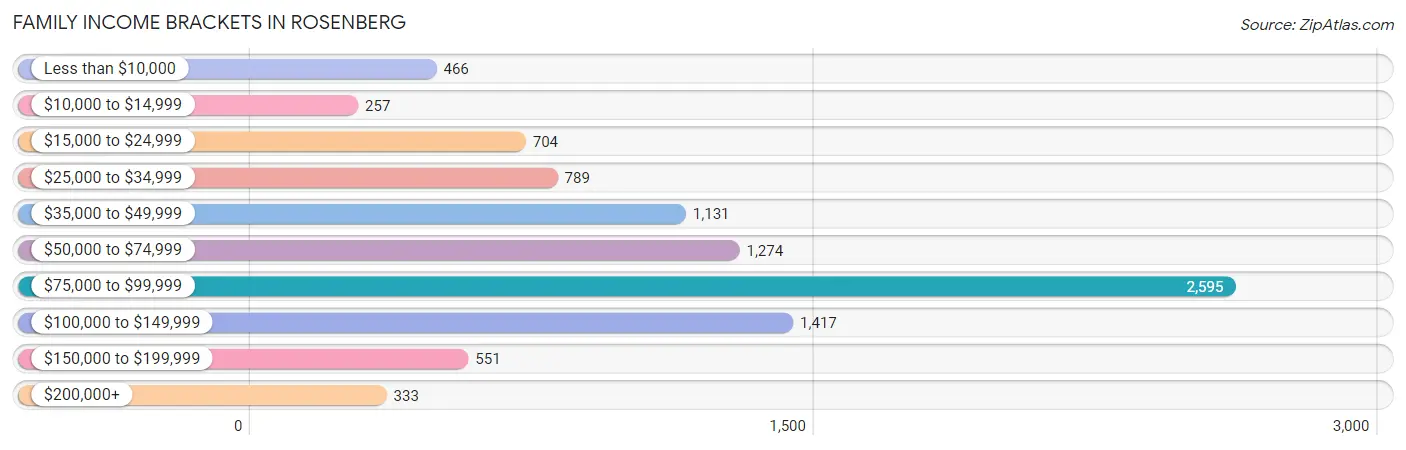
| Income Bracket | # Families | % Families |
| Less than $10,000 | 466 | 4.9% |
| $10,000 to $14,999 | 257 | 2.7% |
| $15,000 to $24,999 | 704 | 7.4% |
| $25,000 to $34,999 | 789 | 8.3% |
| $35,000 to $49,999 | 1,131 | 11.9% |
| $50,000 to $74,999 | 1,274 | 13.4% |
| $75,000 to $99,999 | 2,595 | 27.3% |
| $100,000 to $149,999 | 1,417 | 14.9% |
| $150,000 to $199,999 | 551 | 5.8% |
| $200,000+ | 333 | 3.5% |
Family Income by Famaliy Size in Rosenberg
7+ person families (323 | 3.4%) account for the highest median family income in Rosenberg with $124,510 per family, while 2-person families (3,576 | 37.6%) have the highest median income of $27,640 per family member.
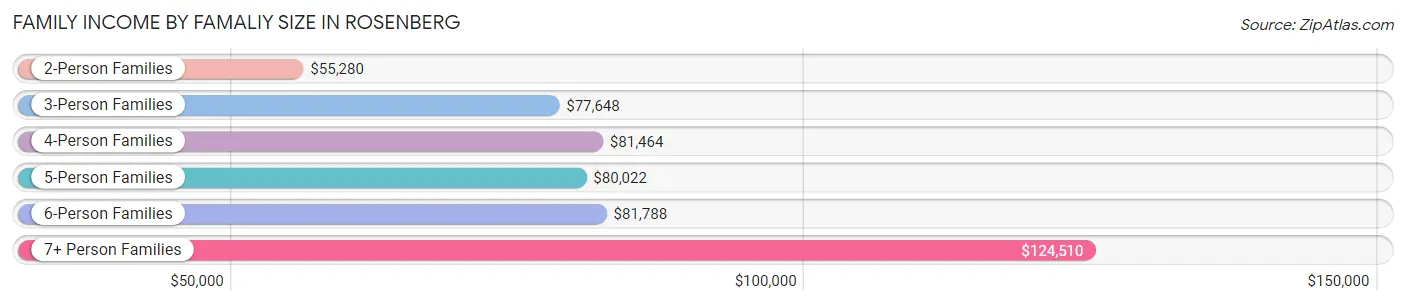
| Income Bracket | # Families | Median Income |
| 2-Person Families | 3,576 (37.6%) | $55,280 |
| 3-Person Families | 2,368 (24.9%) | $77,648 |
| 4-Person Families | 1,646 (17.3%) | $81,464 |
| 5-Person Families | 1,279 (13.5%) | $80,022 |
| 6-Person Families | 315 (3.3%) | $81,788 |
| 7+ Person Families | 323 (3.4%) | $124,510 |
| Total | 9,507 (100.0%) | $75,698 |
Family Income by Number of Earners in Rosenberg
The median family income in Rosenberg is $75,698, with families comprising 3+ earners (877) having the highest median family income of $130,104, while families with no earners (1,238) have the lowest median family income of $22,244, accounting for 9.2% and 13.0% of families, respectively.
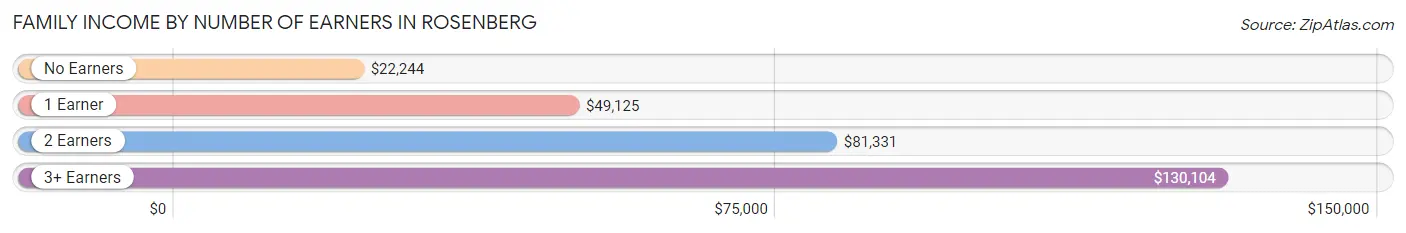
| Number of Earners | # Families | Median Income |
| No Earners | 1,238 (13.0%) | $22,244 |
| 1 Earner | 3,857 (40.6%) | $49,125 |
| 2 Earners | 3,535 (37.2%) | $81,331 |
| 3+ Earners | 877 (9.2%) | $130,104 |
| Total | 9,507 (100.0%) | $75,698 |
Household Income in Rosenberg
Household Income Brackets in Rosenberg
With 3,356 households falling in the category, the $75,000 to $99,999 income range is the most frequent in Rosenberg, accounting for 23.4% of all households. In contrast, only 359 households (2.5%) fall into the $200,000+ income bracket, making it the least populous group.
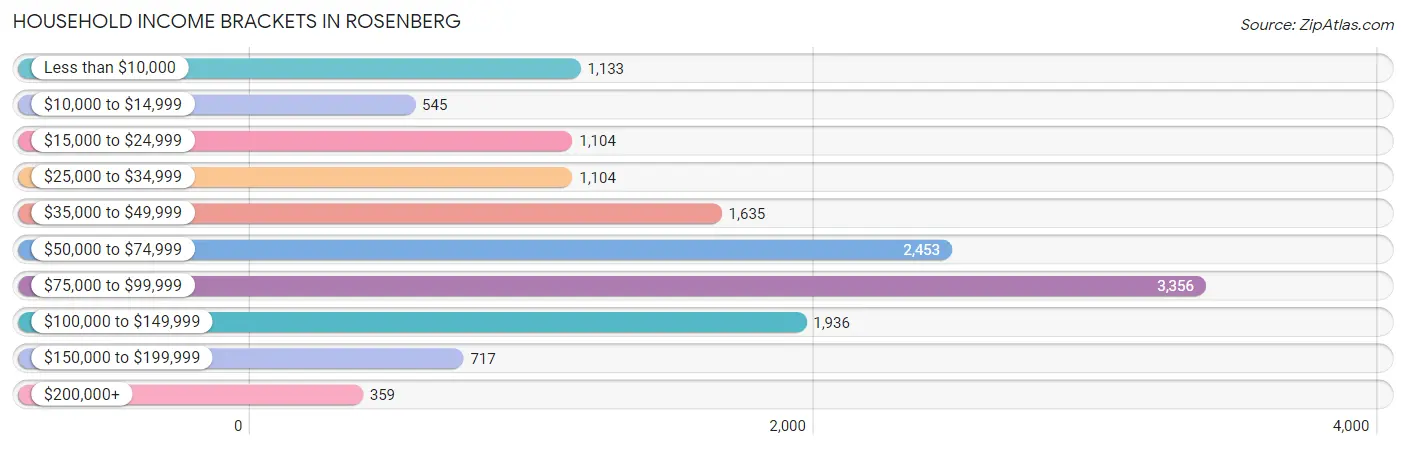
| Income Bracket | # Households | % Households |
| Less than $10,000 | 1,133 | 7.9% |
| $10,000 to $14,999 | 545 | 3.8% |
| $15,000 to $24,999 | 1,104 | 7.7% |
| $25,000 to $34,999 | 1,104 | 7.7% |
| $35,000 to $49,999 | 1,635 | 11.4% |
| $50,000 to $74,999 | 2,453 | 17.1% |
| $75,000 to $99,999 | 3,356 | 23.4% |
| $100,000 to $149,999 | 1,936 | 13.5% |
| $150,000 to $199,999 | 717 | 5.0% |
| $200,000+ | 359 | 2.5% |
Household Income by Householder Age in Rosenberg
The median household income in Rosenberg is $66,046, with the highest median household income of $75,992 found in the 25 to 44 years age bracket for the primary householder. A total of 6,395 households (44.6%) fall into this category. Meanwhile, the 65+ years age bracket for the primary householder has the lowest median household income of $43,518, with 2,501 households (17.4%) in this group.
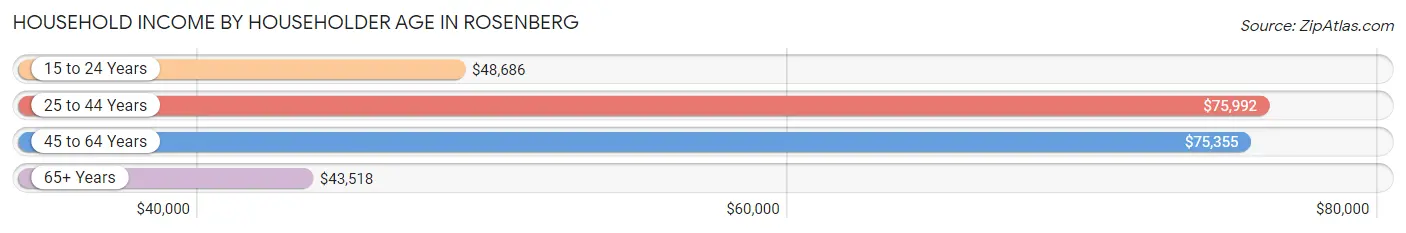
| Income Bracket | # Households | Median Income |
| 15 to 24 Years | 1,264 (8.8%) | $48,686 |
| 25 to 44 Years | 6,395 (44.6%) | $75,992 |
| 45 to 64 Years | 4,184 (29.2%) | $75,355 |
| 65+ Years | 2,501 (17.4%) | $43,518 |
| Total | 14,344 (100.0%) | $66,046 |
Poverty in Rosenberg
Income Below Poverty by Sex and Age in Rosenberg
With 12.7% poverty level for males and 18.5% for females among the residents of Rosenberg, 16 and 17 year old males and 15 year old females are the most vulnerable to poverty, with 204 males (58.6%) and 65 females (64.4%) in their respective age groups living below the poverty level.
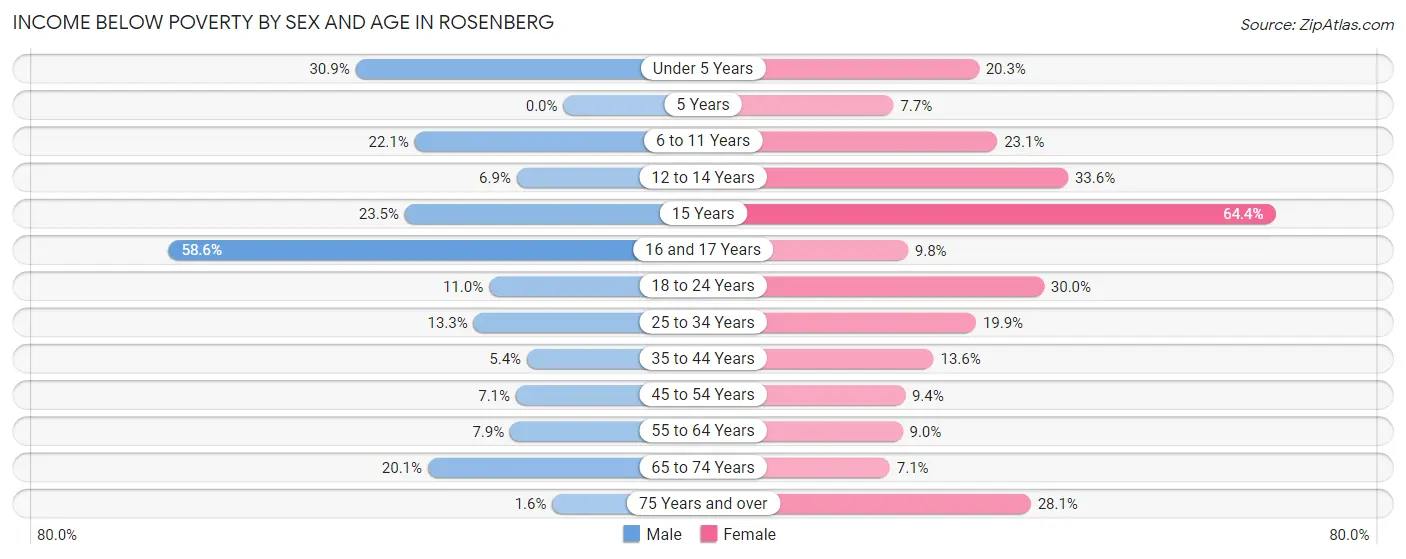
| Age Bracket | Male | Female |
| Under 5 Years | 447 (30.9%) | 386 (20.3%) |
| 5 Years | 0 (0.0%) | 50 (7.7%) |
| 6 to 11 Years | 206 (22.1%) | 446 (23.1%) |
| 12 to 14 Years | 44 (6.9%) | 175 (33.6%) |
| 15 Years | 84 (23.5%) | 65 (64.4%) |
| 16 and 17 Years | 204 (58.6%) | 47 (9.8%) |
| 18 to 24 Years | 295 (11.0%) | 805 (30.0%) |
| 25 to 34 Years | 413 (13.3%) | 606 (19.9%) |
| 35 to 44 Years | 164 (5.4%) | 325 (13.6%) |
| 45 to 54 Years | 136 (7.0%) | 163 (9.4%) |
| 55 to 64 Years | 162 (7.9%) | 150 (9.0%) |
| 65 to 74 Years | 206 (20.1%) | 110 (7.1%) |
| 75 Years and over | 15 (1.6%) | 333 (28.1%) |
| Total | 2,376 (12.7%) | 3,661 (18.5%) |
Income Above Poverty by Sex and Age in Rosenberg
According to the poverty statistics in Rosenberg, males aged 5 years and females aged 65 to 74 years are the age groups that are most secure financially, with 100.0% of males and 92.9% of females in these age groups living above the poverty line.
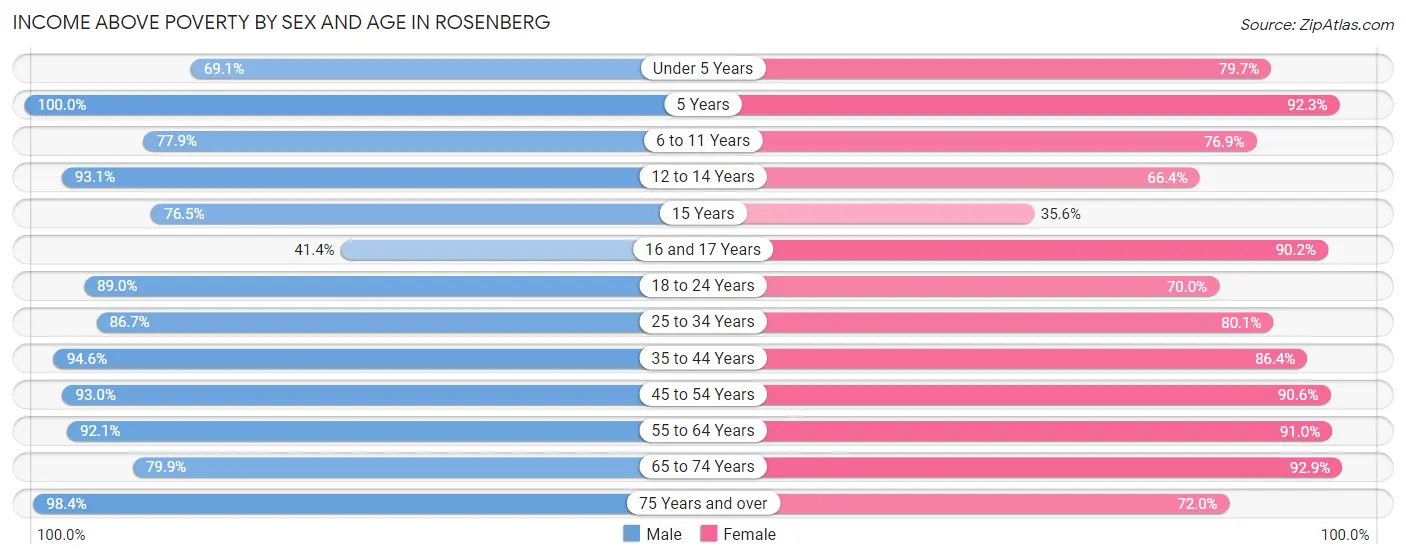
| Age Bracket | Male | Female |
| Under 5 Years | 1,001 (69.1%) | 1,513 (79.7%) |
| 5 Years | 213 (100.0%) | 603 (92.3%) |
| 6 to 11 Years | 726 (77.9%) | 1,486 (76.9%) |
| 12 to 14 Years | 592 (93.1%) | 346 (66.4%) |
| 15 Years | 273 (76.5%) | 36 (35.6%) |
| 16 and 17 Years | 144 (41.4%) | 432 (90.2%) |
| 18 to 24 Years | 2,376 (89.0%) | 1,878 (70.0%) |
| 25 to 34 Years | 2,684 (86.7%) | 2,436 (80.1%) |
| 35 to 44 Years | 2,866 (94.6%) | 2,061 (86.4%) |
| 45 to 54 Years | 1,792 (92.9%) | 1,575 (90.6%) |
| 55 to 64 Years | 1,887 (92.1%) | 1,513 (91.0%) |
| 65 to 74 Years | 818 (79.9%) | 1,433 (92.9%) |
| 75 Years and over | 898 (98.4%) | 854 (72.0%) |
| Total | 16,270 (87.3%) | 16,166 (81.5%) |
Income Below Poverty Among Married-Couple Families in Rosenberg
The poverty statistics for married-couple families in Rosenberg show that 4.9% or 311 of the total 6,348 families live below the poverty line. Families with 1 or 2 children have the highest poverty rate of 8.0%, comprising of 227 families. On the other hand, families with 5 or more children have the lowest poverty rate of 0.0%, which includes 0 families.
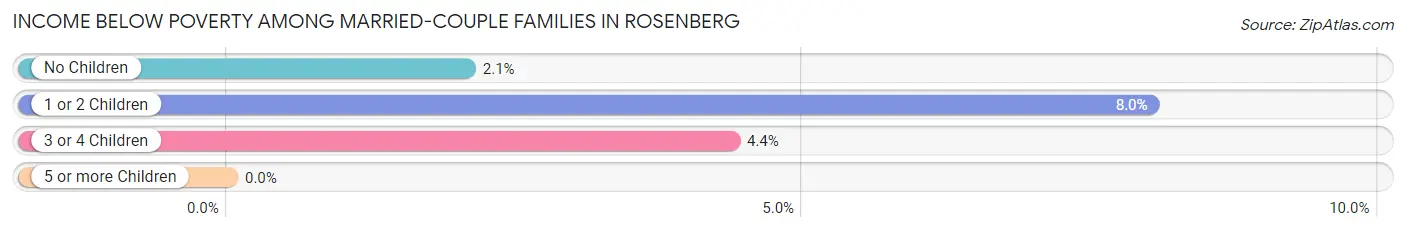
| Children | Above Poverty | Below Poverty |
| No Children | 2,928 (97.9%) | 62 (2.1%) |
| 1 or 2 Children | 2,602 (92.0%) | 227 (8.0%) |
| 3 or 4 Children | 481 (95.6%) | 22 (4.4%) |
| 5 or more Children | 26 (100.0%) | 0 (0.0%) |
| Total | 6,037 (95.1%) | 311 (4.9%) |
Income Below Poverty Among Single-Parent Households in Rosenberg
According to the poverty data in Rosenberg, 6.7% or 63 single-father households and 33.8% or 748 single-mother households are living below the poverty line. Among single-father households, those with 1 or 2 children have the highest poverty rate, with 27 households (8.3%) experiencing poverty. Likewise, among single-mother households, those with 5 or more children have the highest poverty rate, with 81 households (100.0%) falling below the poverty line.
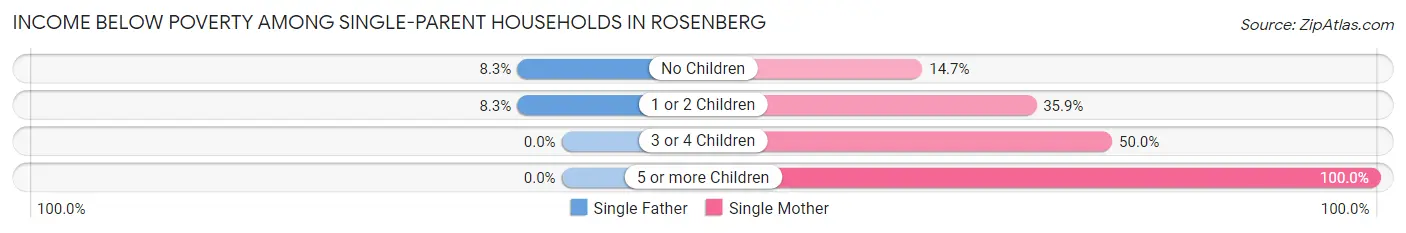
| Children | Single Father | Single Mother |
| No Children | 36 (8.3%) | 97 (14.6%) |
| 1 or 2 Children | 27 (8.3%) | 421 (35.9%) |
| 3 or 4 Children | 0 (0.0%) | 149 (50.0%) |
| 5 or more Children | 0 (0.0%) | 81 (100.0%) |
| Total | 63 (6.7%) | 748 (33.8%) |
Income Below Poverty Among Married-Couple vs Single-Parent Households in Rosenberg
The poverty data for Rosenberg shows that 311 of the married-couple family households (4.9%) and 811 of the single-parent households (25.7%) are living below the poverty level. Within the married-couple family households, those with 1 or 2 children have the highest poverty rate, with 227 households (8.0%) falling below the poverty line. Among the single-parent households, those with 5 or more children have the highest poverty rate, with 81 household (100.0%) living below poverty.
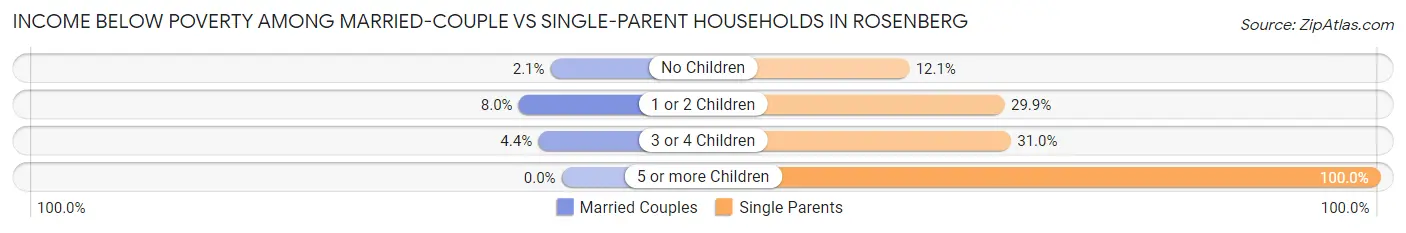
| Children | Married-Couple Families | Single-Parent Households |
| No Children | 62 (2.1%) | 133 (12.1%) |
| 1 or 2 Children | 227 (8.0%) | 448 (29.9%) |
| 3 or 4 Children | 22 (4.4%) | 149 (31.0%) |
| 5 or more Children | 0 (0.0%) | 81 (100.0%) |
| Total | 311 (4.9%) | 811 (25.7%) |
Race in Rosenberg
The most populous races in Rosenberg are Hispanic or Latino (22,370 | 57.8%), White / Caucasian (17,314 | 44.7%), and Some other Race (6,208 | 16.0%).
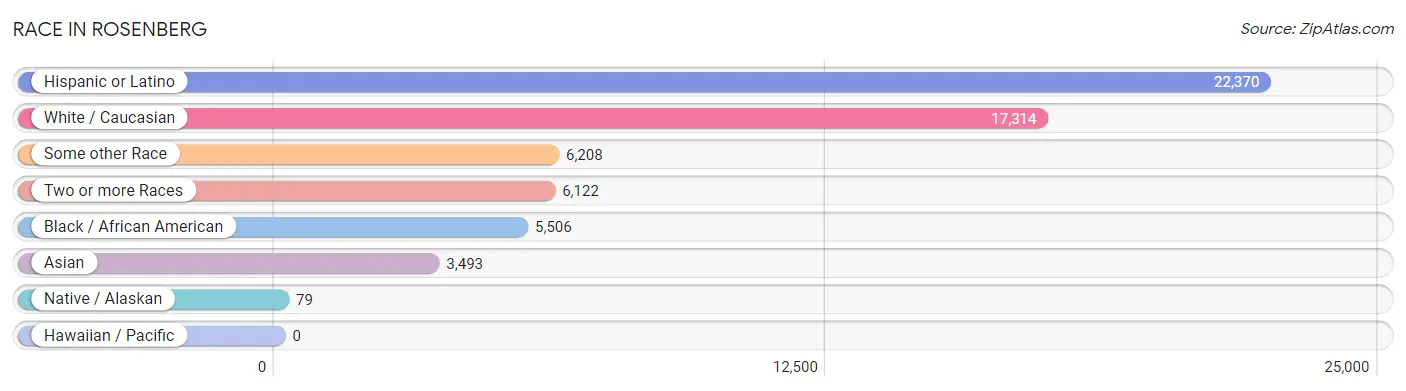
| Race | # Population | % Population |
| Asian | 3,493 | 9.0% |
| Black / African American | 5,506 | 14.2% |
| Hawaiian / Pacific | 0 | 0.0% |
| Hispanic or Latino | 22,370 | 57.8% |
| Native / Alaskan | 79 | 0.2% |
| White / Caucasian | 17,314 | 44.7% |
| Two or more Races | 6,122 | 15.8% |
| Some other Race | 6,208 | 16.0% |
| Total | 38,722 | 100.0% |
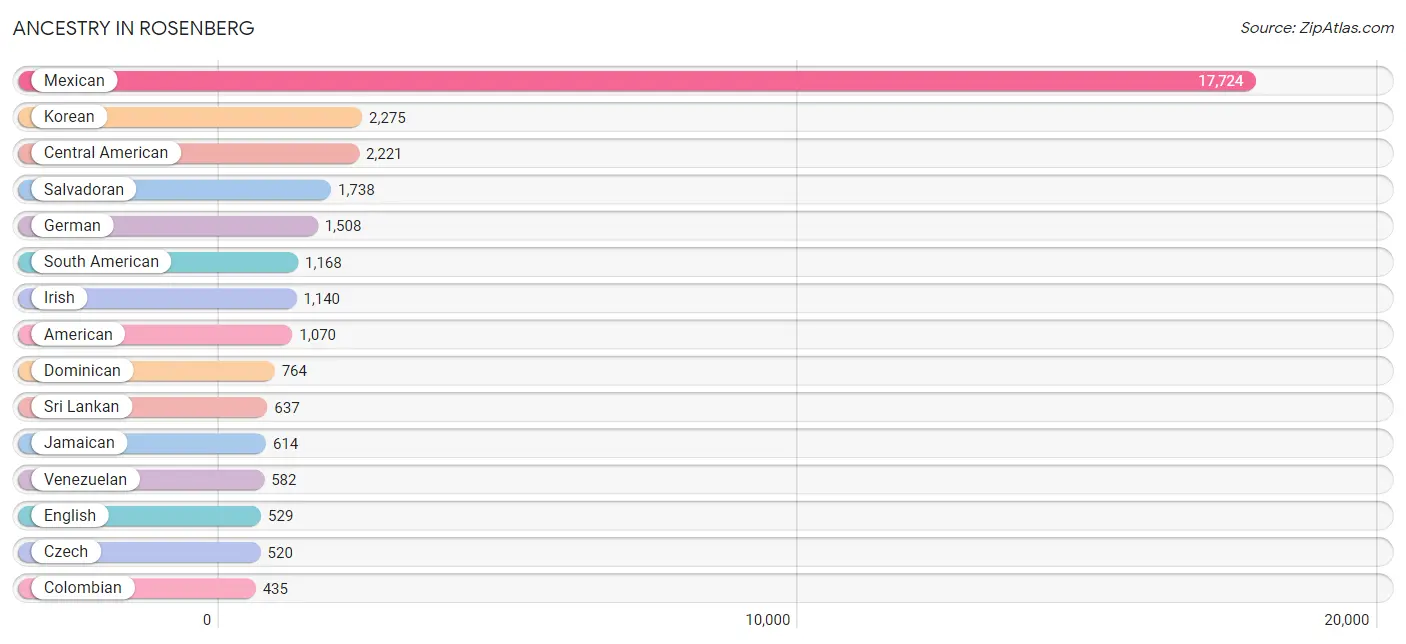
Ancestry in Rosenberg
The most populous ancestries reported in Rosenberg are Mexican (17,724 | 45.8%), Korean (2,275 | 5.9%), Central American (2,221 | 5.7%), Salvadoran (1,738 | 4.5%), and German (1,508 | 3.9%), together accounting for 65.8% of all Rosenberg residents.
| Ancestry | # Population | % Population |
| African | 35 | 0.1% |
| American | 1,070 | 2.8% |
| Apache | 42 | 0.1% |
| Arab | 171 | 0.4% |
| Austrian | 14 | 0.0% |
| Belizean | 79 | 0.2% |
| Bhutanese | 110 | 0.3% |
| Blackfeet | 25 | 0.1% |
| Bolivian | 17 | 0.0% |
| Brazilian | 10 | 0.0% |
| British | 100 | 0.3% |
| Burmese | 26 | 0.1% |
| Central American | 2,221 | 5.7% |
| Central American Indian | 28 | 0.1% |
| Cherokee | 34 | 0.1% |
| Colombian | 435 | 1.1% |
| Cuban | 22 | 0.1% |
| Czech | 520 | 1.3% |
| Czechoslovakian | 61 | 0.2% |
| Danish | 12 | 0.0% |
| Dominican | 764 | 2.0% |
| Eastern European | 16 | 0.0% |
| Ecuadorian | 134 | 0.4% |
| English | 529 | 1.4% |
| European | 94 | 0.2% |
| French | 143 | 0.4% |
| German | 1,508 | 3.9% |
| Greek | 13 | 0.0% |
| Guatemalan | 108 | 0.3% |
| Haitian | 27 | 0.1% |
| Honduran | 219 | 0.6% |
| Indian (Asian) | 98 | 0.3% |
| Irish | 1,140 | 2.9% |
| Italian | 239 | 0.6% |
| Jamaican | 614 | 1.6% |
| Japanese | 36 | 0.1% |
| Jordanian | 13 | 0.0% |
| Korean | 2,275 | 5.9% |
| Lebanese | 17 | 0.0% |
| Mexican | 17,724 | 45.8% |
| Mexican American Indian | 180 | 0.5% |
| Mongolian | 45 | 0.1% |
| Nicaraguan | 155 | 0.4% |
| Nigerian | 199 | 0.5% |
| Northern European | 22 | 0.1% |
| Norwegian | 43 | 0.1% |
| Palestinian | 128 | 0.3% |
| Panamanian | 1 | 0.0% |
| Pennsylvania German | 9 | 0.0% |
| Polish | 199 | 0.5% |
| Puerto Rican | 132 | 0.3% |
| Salvadoran | 1,738 | 4.5% |
| Samoan | 12 | 0.0% |
| Scotch-Irish | 75 | 0.2% |
| Scottish | 97 | 0.3% |
| South American | 1,168 | 3.0% |
| Spaniard | 13 | 0.0% |
| Spanish | 11 | 0.0% |
| Sri Lankan | 637 | 1.7% |
| Subsaharan African | 234 | 0.6% |
| Swedish | 26 | 0.1% |
| Swiss | 30 | 0.1% |
| Thai | 226 | 0.6% |
| Ukrainian | 113 | 0.3% |
| Venezuelan | 582 | 1.5% |
| Welsh | 100 | 0.3% | View All 66 Rows |
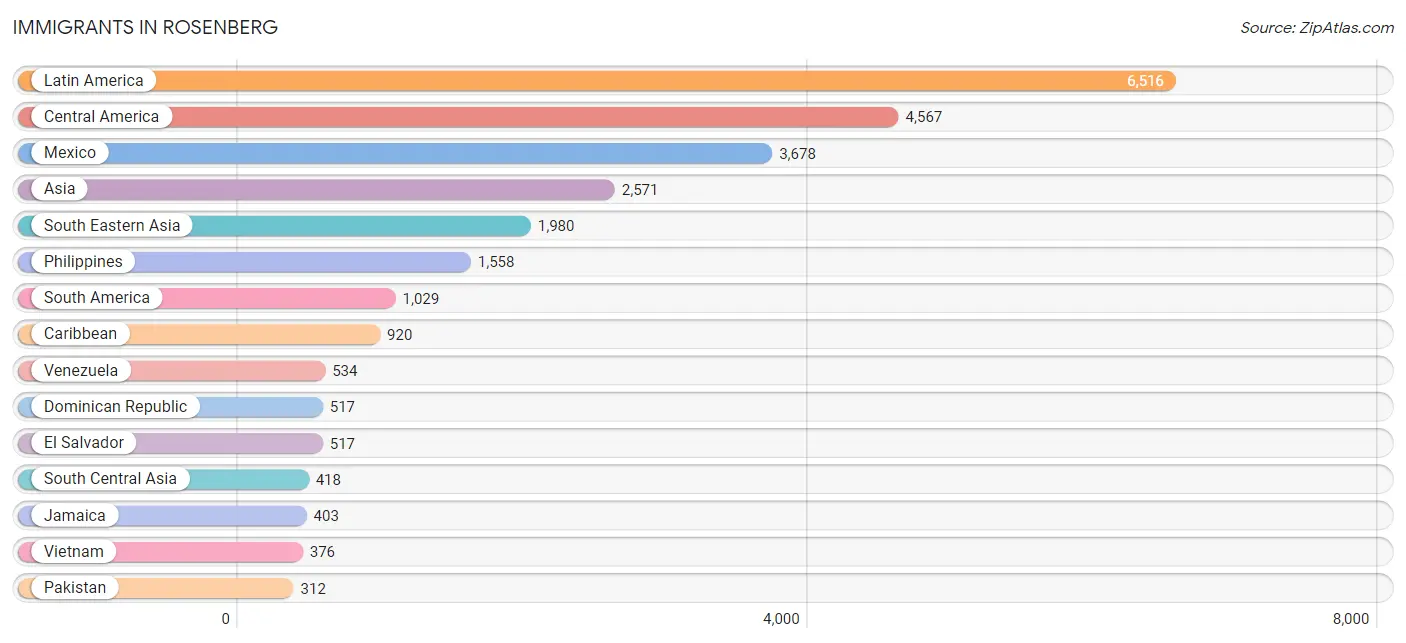
Immigrants in Rosenberg
The most numerous immigrant groups reported in Rosenberg came from Latin America (6,516 | 16.8%), Central America (4,567 | 11.8%), Mexico (3,678 | 9.5%), Asia (2,571 | 6.6%), and South Eastern Asia (1,980 | 5.1%), together accounting for 49.9% of all Rosenberg residents.
| Immigration Origin | # Population | % Population |
| Afghanistan | 26 | 0.1% |
| Africa | 188 | 0.5% |
| Asia | 2,571 | 6.6% |
| Belize | 79 | 0.2% |
| Bolivia | 43 | 0.1% |
| Brazil | 10 | 0.0% |
| Cambodia | 19 | 0.1% |
| Canada | 51 | 0.1% |
| Caribbean | 920 | 2.4% |
| Central America | 4,567 | 11.8% |
| China | 73 | 0.2% |
| Colombia | 308 | 0.8% |
| Dominican Republic | 517 | 1.3% |
| Eastern Asia | 73 | 0.2% |
| Eastern Europe | 41 | 0.1% |
| Ecuador | 134 | 0.4% |
| El Salvador | 517 | 1.3% |
| Europe | 73 | 0.2% |
| Germany | 32 | 0.1% |
| Guatemala | 57 | 0.2% |
| Honduras | 169 | 0.4% |
| India | 80 | 0.2% |
| Jamaica | 403 | 1.0% |
| Jordan | 46 | 0.1% |
| Latin America | 6,516 | 16.8% |
| Malaysia | 27 | 0.1% |
| Mexico | 3,678 | 9.5% |
| Nicaragua | 66 | 0.2% |
| Nigeria | 188 | 0.5% |
| Pakistan | 312 | 0.8% |
| Panama | 1 | 0.0% |
| Philippines | 1,558 | 4.0% |
| South America | 1,029 | 2.7% |
| South Central Asia | 418 | 1.1% |
| South Eastern Asia | 1,980 | 5.1% |
| Ukraine | 41 | 0.1% |
| Venezuela | 534 | 1.4% |
| Vietnam | 376 | 1.0% |
| Western Africa | 188 | 0.5% |
| Western Asia | 87 | 0.2% |
| Western Europe | 32 | 0.1% | View All 41 Rows |
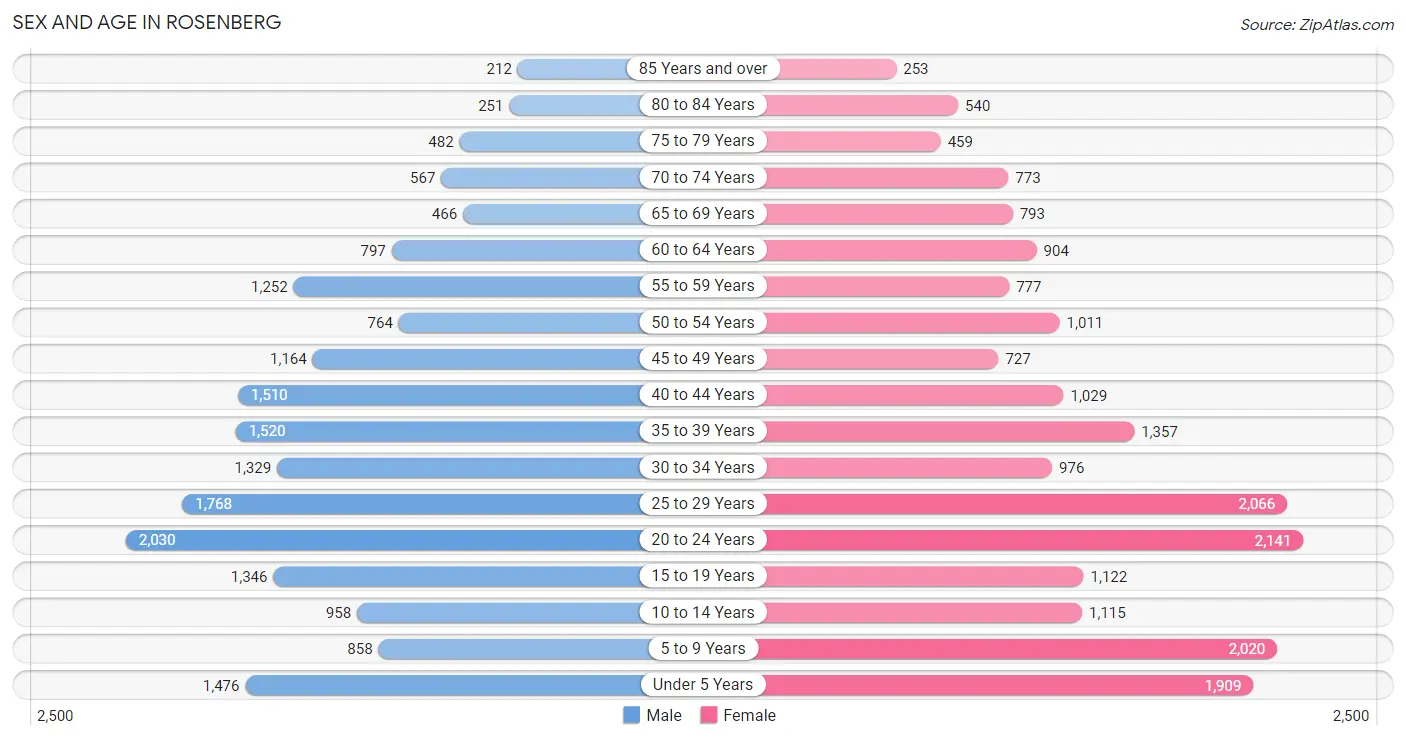
Sex and Age in Rosenberg
Sex and Age in Rosenberg
The most populous age groups in Rosenberg are 20 to 24 Years (2,030 | 10.8%) for men and 20 to 24 Years (2,141 | 10.7%) for women.
| Age Bracket | Male | Female |
| Under 5 Years | 1,476 (7.9%) | 1,909 (9.6%) |
| 5 to 9 Years | 858 (4.6%) | 2,020 (10.1%) |
| 10 to 14 Years | 958 (5.1%) | 1,115 (5.6%) |
| 15 to 19 Years | 1,346 (7.2%) | 1,122 (5.6%) |
| 20 to 24 Years | 2,030 (10.8%) | 2,141 (10.7%) |
| 25 to 29 Years | 1,768 (9.4%) | 2,066 (10.3%) |
| 30 to 34 Years | 1,329 (7.1%) | 976 (4.9%) |
| 35 to 39 Years | 1,520 (8.1%) | 1,357 (6.8%) |
| 40 to 44 Years | 1,510 (8.1%) | 1,029 (5.1%) |
| 45 to 49 Years | 1,164 (6.2%) | 727 (3.6%) |
| 50 to 54 Years | 764 (4.1%) | 1,011 (5.1%) |
| 55 to 59 Years | 1,252 (6.7%) | 777 (3.9%) |
| 60 to 64 Years | 797 (4.3%) | 904 (4.5%) |
| 65 to 69 Years | 466 (2.5%) | 793 (4.0%) |
| 70 to 74 Years | 567 (3.0%) | 773 (3.9%) |
| 75 to 79 Years | 482 (2.6%) | 459 (2.3%) |
| 80 to 84 Years | 251 (1.3%) | 540 (2.7%) |
| 85 Years and over | 212 (1.1%) | 253 (1.3%) |
| Total | 18,750 (100.0%) | 19,972 (100.0%) |
Families and Households in Rosenberg
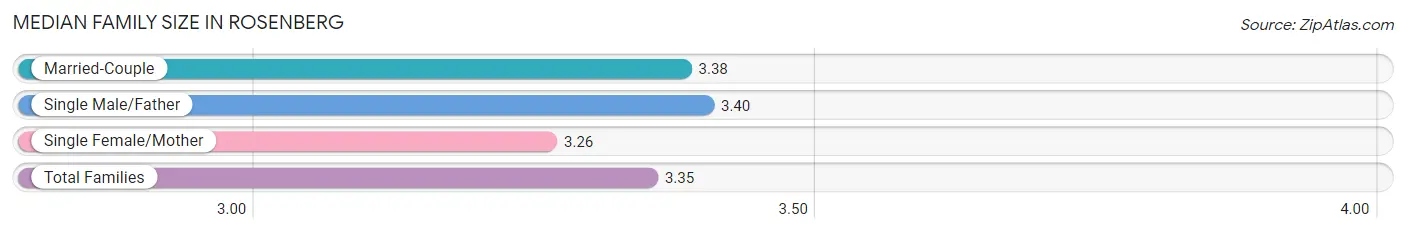
Median Family Size in Rosenberg
The median family size in Rosenberg is 3.35 persons per family, with single male/father families (944 | 9.9%) accounting for the largest median family size of 3.4 persons per family. On the other hand, single female/mother families (2,215 | 23.3%) represent the smallest median family size with 3.26 persons per family.
| Family Type | # Families | Family Size |
| Married-Couple | 6,348 (66.8%) | 3.38 |
| Single Male/Father | 944 (9.9%) | 3.40 |
| Single Female/Mother | 2,215 (23.3%) | 3.26 |
| Total Families | 9,507 (100.0%) | 3.35 |
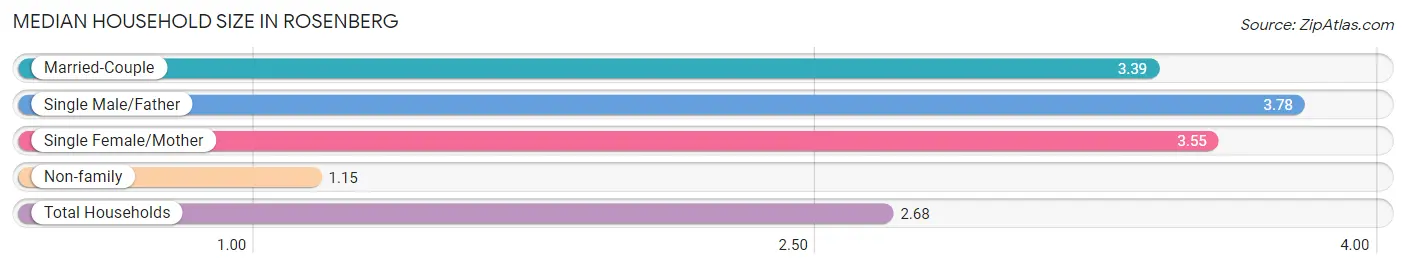
Median Household Size in Rosenberg
The median household size in Rosenberg is 2.68 persons per household, with single male/father households (944 | 6.6%) accounting for the largest median household size of 3.78 persons per household. non-family households (4,837 | 33.7%) represent the smallest median household size with 1.15 persons per household.
| Household Type | # Households | Household Size |
| Married-Couple | 6,348 (44.3%) | 3.39 |
| Single Male/Father | 944 (6.6%) | 3.78 |
| Single Female/Mother | 2,215 (15.4%) | 3.55 |
| Non-family | 4,837 (33.7%) | 1.15 |
| Total Households | 14,344 (100.0%) | 2.68 |
Household Size by Marriage Status in Rosenberg
Out of a total of 14,344 households in Rosenberg, 9,507 (66.3%) are family households, while 4,837 (33.7%) are nonfamily households. The most numerous type of family households are 2-person households, comprising 3,100, and the most common type of nonfamily households are 1-person households, comprising 4,236.
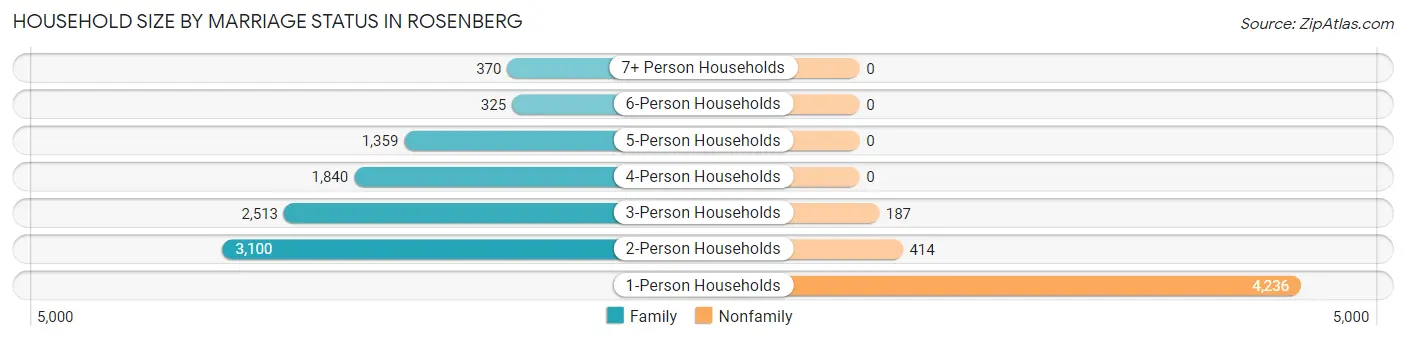
| Household Size | Family Households | Nonfamily Households |
| 1-Person Households | - | 4,236 (29.5%) |
| 2-Person Households | 3,100 (21.6%) | 414 (2.9%) |
| 3-Person Households | 2,513 (17.5%) | 187 (1.3%) |
| 4-Person Households | 1,840 (12.8%) | 0 (0.0%) |
| 5-Person Households | 1,359 (9.5%) | 0 (0.0%) |
| 6-Person Households | 325 (2.3%) | 0 (0.0%) |
| 7+ Person Households | 370 (2.6%) | 0 (0.0%) |
| Total | 9,507 (66.3%) | 4,837 (33.7%) |
Female Fertility in Rosenberg
Fertility by Age in Rosenberg
Average fertility rate in Rosenberg is 90.0 births per 1,000 women. Women in the age bracket of 35 to 50 years have the highest fertility rate with 136.0 births per 1,000 women. Women in the age bracket of 35 to 50 years acount for 52.1% of all women with births.
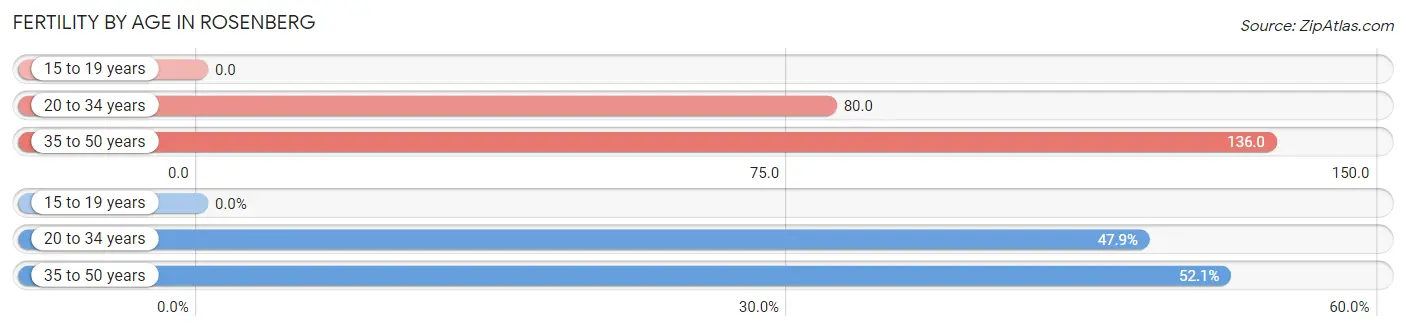
| Age Bracket | Women with Births | Births / 1,000 Women |
| 15 to 19 years | 0 (0.0%) | 0.0 |
| 20 to 34 years | 417 (47.9%) | 80.0 |
| 35 to 50 years | 453 (52.1%) | 136.0 |
| Total | 870 (100.0%) | 90.0 |
Fertility by Age by Marriage Status in Rosenberg
86.0% of women with births (870) in Rosenberg are married. The highest percentage of unmarried women with births falls into 20 to 34 years age bracket with 29.3% of them unmarried at the time of birth, while the lowest percentage of unmarried women with births belong to 35 to 50 years age bracket with 0.0% of them unmarried.
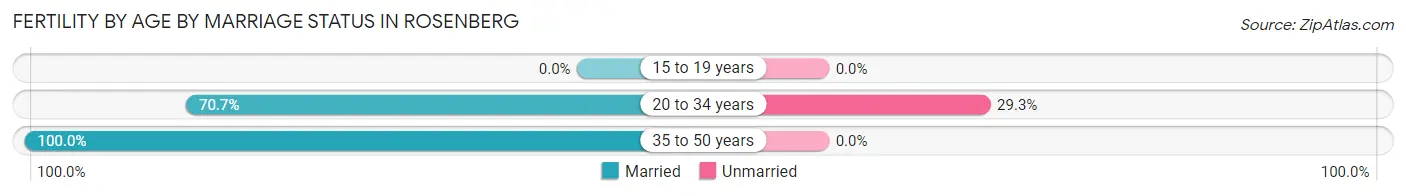
| Age Bracket | Married | Unmarried |
| 15 to 19 years | 0 (0.0%) | 0 (0.0%) |
| 20 to 34 years | 295 (70.7%) | 122 (29.3%) |
| 35 to 50 years | 453 (100.0%) | 0 (0.0%) |
| Total | 748 (86.0%) | 122 (14.0%) |
Fertility by Education in Rosenberg
Average fertility rate in Rosenberg is 90.0 births per 1,000 women. Women with the education attainment of bachelor's degree have the highest fertility rate of 208.0 births per 1,000 women, while women with the education attainment of college or associate's degree have the lowest fertility at 19.0 births per 1,000 women. Women with the education attainment of bachelor's degree represent 45.2% of all women with births.
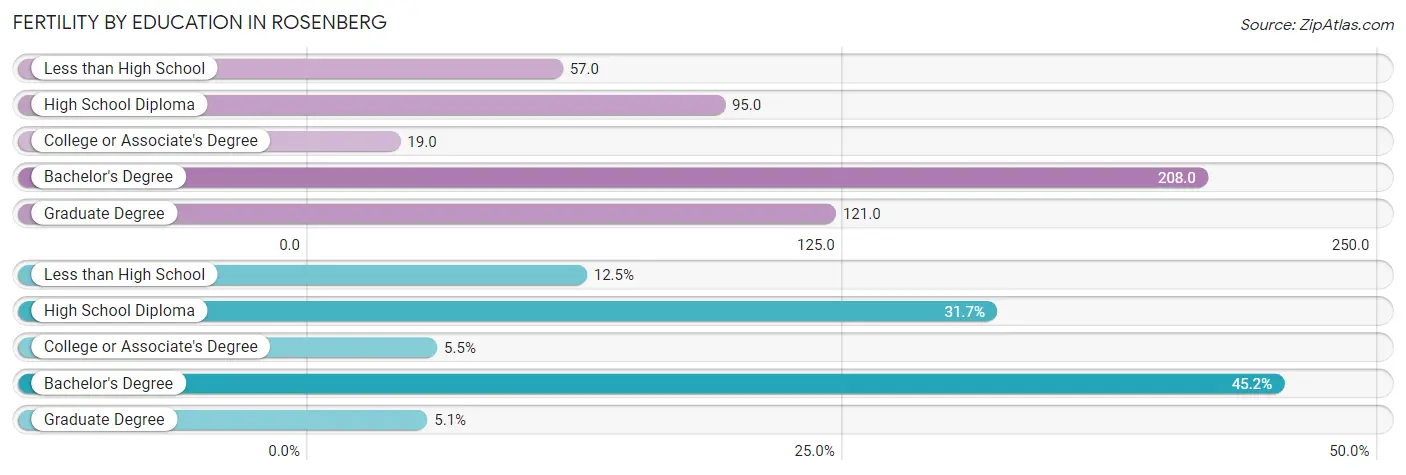
| Educational Attainment | Women with Births | Births / 1,000 Women |
| Less than High School | 109 (12.5%) | 57.0 |
| High School Diploma | 276 (31.7%) | 95.0 |
| College or Associate's Degree | 48 (5.5%) | 19.0 |
| Bachelor's Degree | 393 (45.2%) | 208.0 |
| Graduate Degree | 44 (5.1%) | 121.0 |
| Total | 870 (100.0%) | 90.0 |
Fertility by Education by Marriage Status in Rosenberg
14.0% of women with births in Rosenberg are unmarried. Women with the educational attainment of less than high school are most likely to be married with 100.0% of them married at childbirth, while women with the educational attainment of high school diploma are least likely to be married with 44.2% of them unmarried at childbirth.
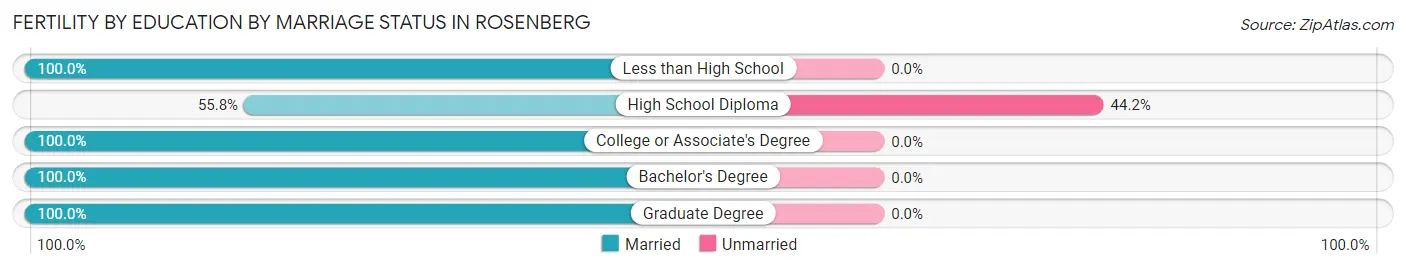
| Educational Attainment | Married | Unmarried |
| Less than High School | 109 (100.0%) | 0 (0.0%) |
| High School Diploma | 154 (55.8%) | 122 (44.2%) |
| College or Associate's Degree | 48 (100.0%) | 0 (0.0%) |
| Bachelor's Degree | 393 (100.0%) | 0 (0.0%) |
| Graduate Degree | 44 (100.0%) | 0 (0.0%) |
| Total | 748 (86.0%) | 122 (14.0%) |
Employment Characteristics in Rosenberg
Employment by Class of Employer in Rosenberg
Among the 18,427 employed individuals in Rosenberg, private company employees (13,247 | 71.9%), not-for-profit organizations (1,415 | 7.7%), and local government employees (1,401 | 7.6%) make up the most common classes of employment.
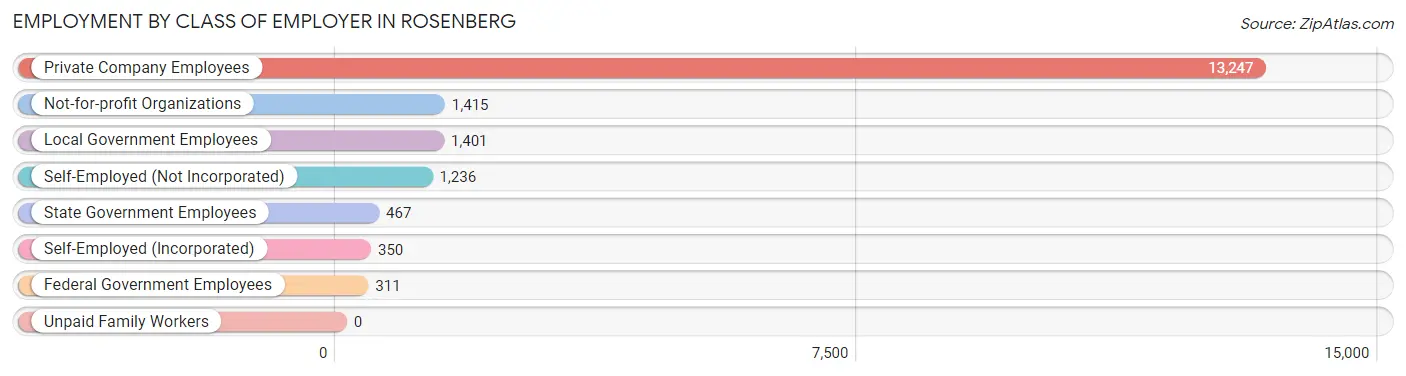
| Employer Class | # Employees | % Employees |
| Private Company Employees | 13,247 | 71.9% |
| Self-Employed (Incorporated) | 350 | 1.9% |
| Self-Employed (Not Incorporated) | 1,236 | 6.7% |
| Not-for-profit Organizations | 1,415 | 7.7% |
| Local Government Employees | 1,401 | 7.6% |
| State Government Employees | 467 | 2.5% |
| Federal Government Employees | 311 | 1.7% |
| Unpaid Family Workers | 0 | 0.0% |
| Total | 18,427 | 100.0% |
Employment Status by Age in Rosenberg
According to the labor force statistics for Rosenberg, out of the total population over 16 years of age (29,928), 65.1% or 19,483 individuals are in the labor force, with 3.4% or 662 of them unemployed. The age group with the highest labor force participation rate is 25 to 29 years, with 83.2% or 3,190 individuals in the labor force. Within the labor force, the 20 to 24 years age range has the highest percentage of unemployed individuals, with 6.1% or 211 of them being unemployed.
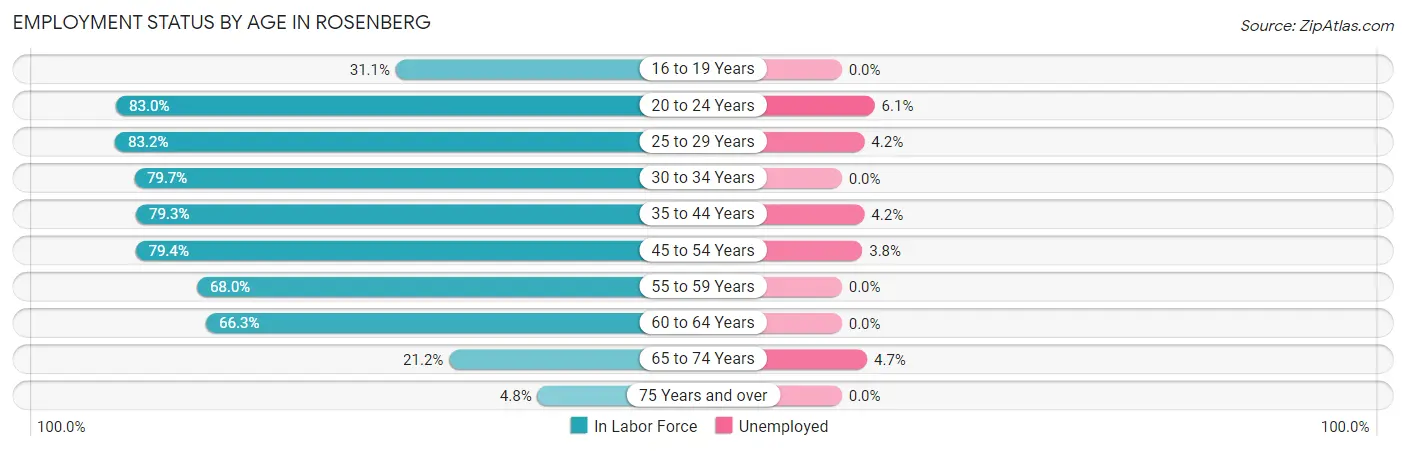
| Age Bracket | In Labor Force | Unemployed |
| 16 to 19 Years | 625 (31.1%) | 0 (0.0%) |
| 20 to 24 Years | 3,462 (83.0%) | 211 (6.1%) |
| 25 to 29 Years | 3,190 (83.2%) | 134 (4.2%) |
| 30 to 34 Years | 1,837 (79.7%) | 0 (0.0%) |
| 35 to 44 Years | 4,295 (79.3%) | 180 (4.2%) |
| 45 to 54 Years | 2,911 (79.4%) | 111 (3.8%) |
| 55 to 59 Years | 1,380 (68.0%) | 0 (0.0%) |
| 60 to 64 Years | 1,128 (66.3%) | 0 (0.0%) |
| 65 to 74 Years | 551 (21.2%) | 26 (4.7%) |
| 75 Years and over | 105 (4.8%) | 0 (0.0%) |
| Total | 19,483 (65.1%) | 662 (3.4%) |
Employment Status by Educational Attainment in Rosenberg
According to labor force statistics for Rosenberg, 77.8% of individuals (14,744) out of the total population between 25 and 64 years of age (18,951) are in the labor force, with 2.9% or 428 of them being unemployed. The group with the highest labor force participation rate are those with the educational attainment of college / associate degree, with 83.9% or 4,459 individuals in the labor force. Within the labor force, individuals with less than high school education have the highest percentage of unemployment, with 4.5% or 86 of them being unemployed.
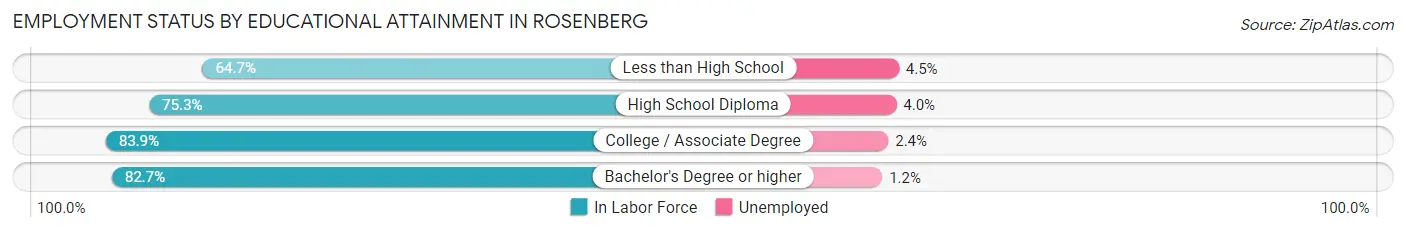
| Educational Attainment | In Labor Force | Unemployed |
| Less than High School | 1,901 (64.7%) | 132 (4.5%) |
| High School Diploma | 4,680 (75.3%) | 249 (4.0%) |
| College / Associate Degree | 4,459 (83.9%) | 128 (2.4%) |
| Bachelor's Degree or higher | 3,707 (82.7%) | 54 (1.2%) |
| Total | 14,744 (77.8%) | 550 (2.9%) |
Employment Occupations by Sex in Rosenberg
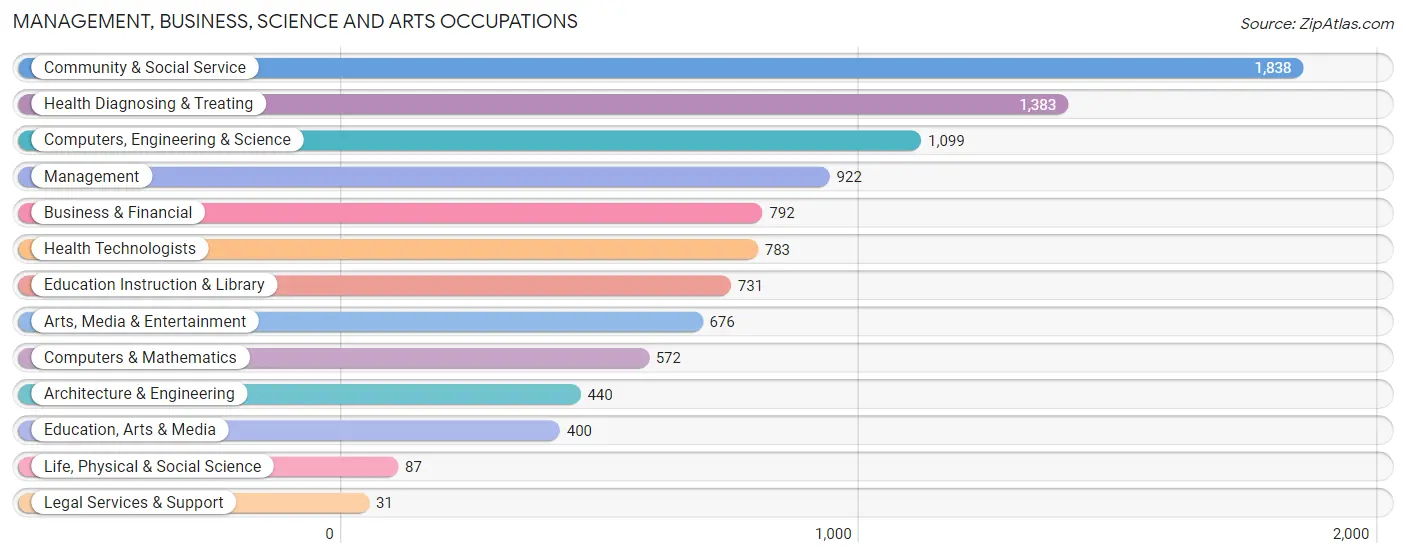
Management, Business, Science and Arts Occupations
The most common Management, Business, Science and Arts occupations in Rosenberg are Community & Social Service (1,838 | 9.8%), Health Diagnosing & Treating (1,383 | 7.3%), Computers, Engineering & Science (1,099 | 5.8%), Management (922 | 4.9%), and Business & Financial (792 | 4.2%).
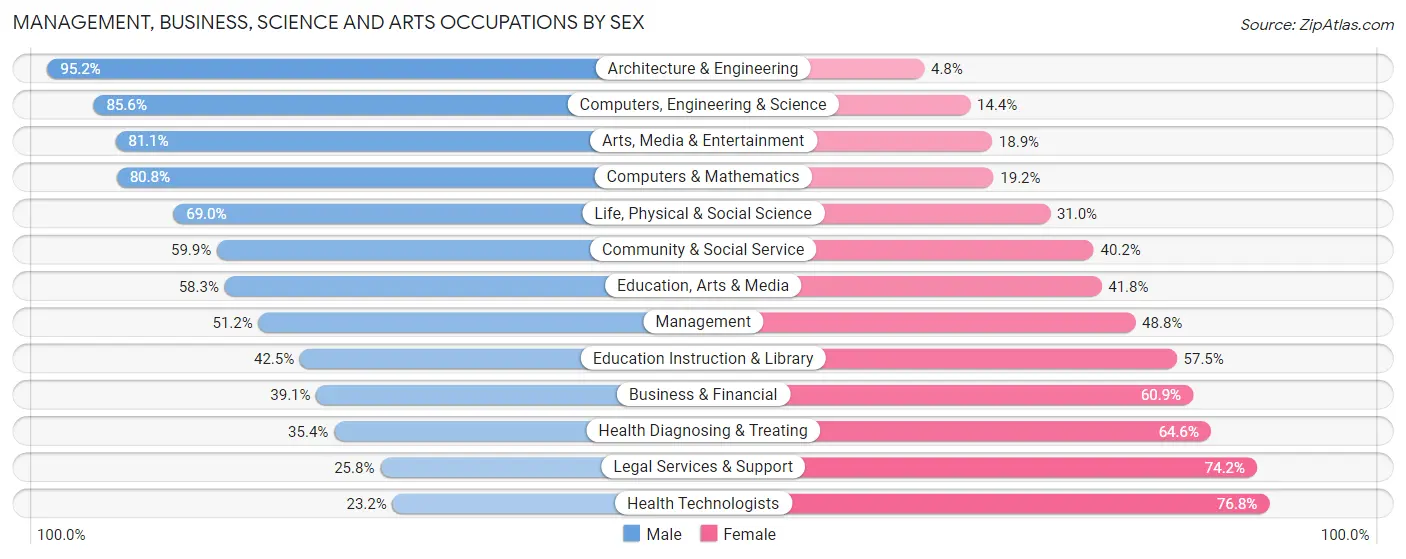
Management, Business, Science and Arts Occupations by Sex
Within the Management, Business, Science and Arts occupations in Rosenberg, the most male-oriented occupations are Architecture & Engineering (95.2%), Computers, Engineering & Science (85.6%), and Arts, Media & Entertainment (81.1%), while the most female-oriented occupations are Health Technologists (76.8%), Legal Services & Support (74.2%), and Health Diagnosing & Treating (64.6%).
| Occupation | Male | Female |
| Management | 472 (51.2%) | 450 (48.8%) |
| Business & Financial | 310 (39.1%) | 482 (60.9%) |
| Computers, Engineering & Science | 941 (85.6%) | 158 (14.4%) |
| Computers & Mathematics | 462 (80.8%) | 110 (19.2%) |
| Architecture & Engineering | 419 (95.2%) | 21 (4.8%) |
| Life, Physical & Social Science | 60 (69.0%) | 27 (31.0%) |
| Community & Social Service | 1,100 (59.9%) | 738 (40.2%) |
| Education, Arts & Media | 233 (58.3%) | 167 (41.7%) |
| Legal Services & Support | 8 (25.8%) | 23 (74.2%) |
| Education Instruction & Library | 311 (42.5%) | 420 (57.5%) |
| Arts, Media & Entertainment | 548 (81.1%) | 128 (18.9%) |
| Health Diagnosing & Treating | 490 (35.4%) | 893 (64.6%) |
| Health Technologists | 182 (23.2%) | 601 (76.8%) |
| Total (Category) | 3,313 (54.9%) | 2,721 (45.1%) |
| Total (Overall) | 11,218 (59.6%) | 7,607 (40.4%) |
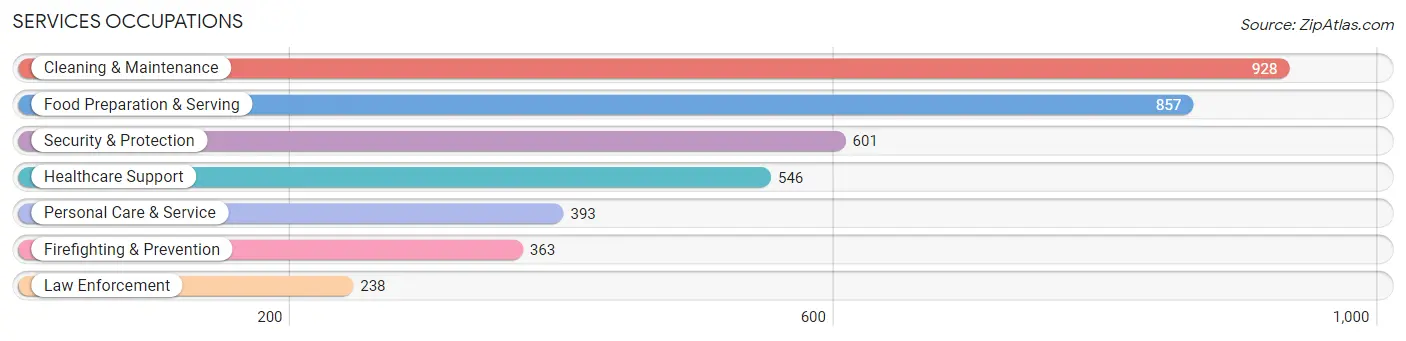
Services Occupations
The most common Services occupations in Rosenberg are Cleaning & Maintenance (928 | 4.9%), Food Preparation & Serving (857 | 4.5%), Security & Protection (601 | 3.2%), Healthcare Support (546 | 2.9%), and Personal Care & Service (393 | 2.1%).
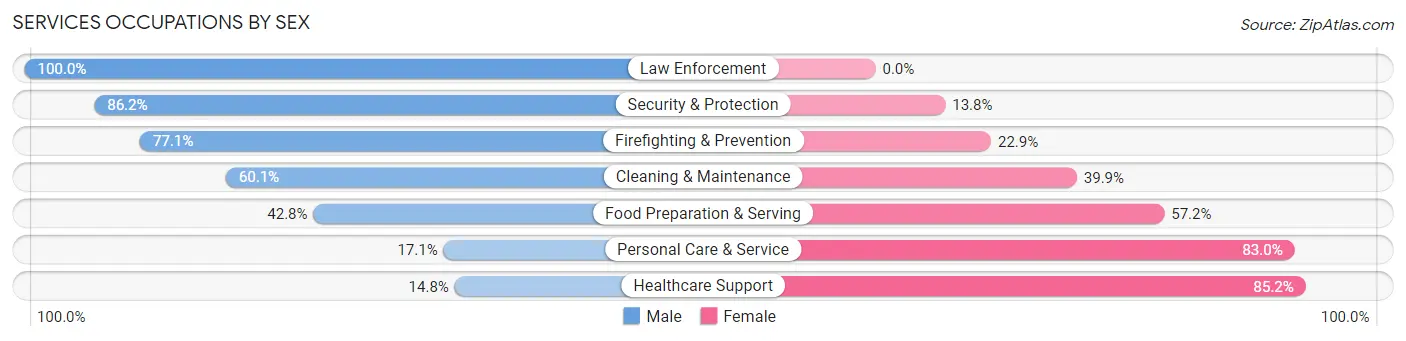
Services Occupations by Sex
Within the Services occupations in Rosenberg, the most male-oriented occupations are Law Enforcement (100.0%), Security & Protection (86.2%), and Firefighting & Prevention (77.1%), while the most female-oriented occupations are Healthcare Support (85.2%), Personal Care & Service (83.0%), and Food Preparation & Serving (57.2%).
| Occupation | Male | Female |
| Healthcare Support | 81 (14.8%) | 465 (85.2%) |
| Security & Protection | 518 (86.2%) | 83 (13.8%) |
| Firefighting & Prevention | 280 (77.1%) | 83 (22.9%) |
| Law Enforcement | 238 (100.0%) | 0 (0.0%) |
| Food Preparation & Serving | 367 (42.8%) | 490 (57.2%) |
| Cleaning & Maintenance | 558 (60.1%) | 370 (39.9%) |
| Personal Care & Service | 67 (17.1%) | 326 (83.0%) |
| Total (Category) | 1,591 (47.8%) | 1,734 (52.1%) |
| Total (Overall) | 11,218 (59.6%) | 7,607 (40.4%) |
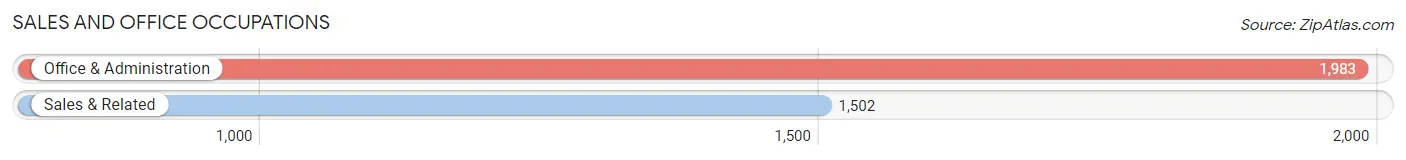
Sales and Office Occupations
The most common Sales and Office occupations in Rosenberg are Office & Administration (1,983 | 10.5%), and Sales & Related (1,502 | 8.0%).
Sales and Office Occupations by Sex
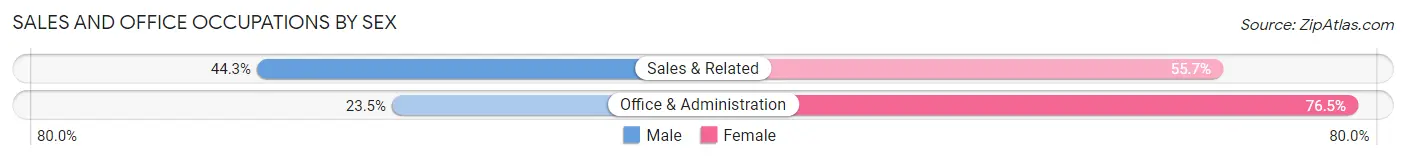
| Occupation | Male | Female |
| Sales & Related | 665 (44.3%) | 837 (55.7%) |
| Office & Administration | 466 (23.5%) | 1,517 (76.5%) |
| Total (Category) | 1,131 (32.5%) | 2,354 (67.5%) |
| Total (Overall) | 11,218 (59.6%) | 7,607 (40.4%) |
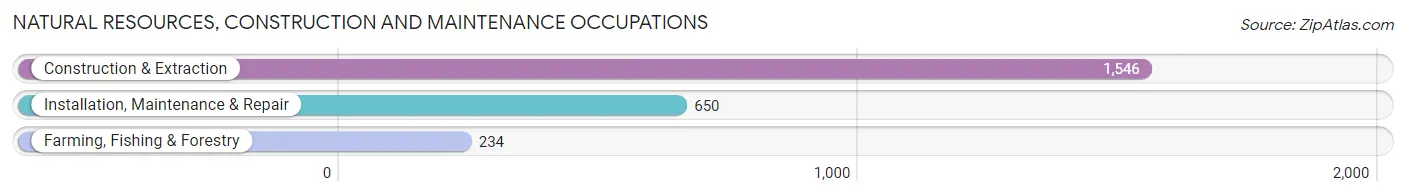
Natural Resources, Construction and Maintenance Occupations
The most common Natural Resources, Construction and Maintenance occupations in Rosenberg are Construction & Extraction (1,546 | 8.2%), Installation, Maintenance & Repair (650 | 3.5%), and Farming, Fishing & Forestry (234 | 1.2%).
Natural Resources, Construction and Maintenance Occupations by Sex
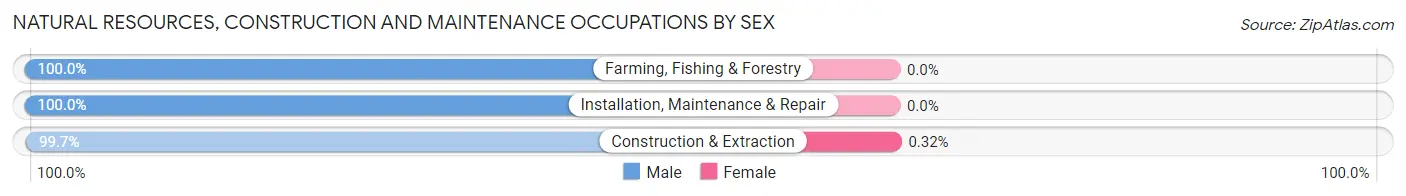
| Occupation | Male | Female |
| Farming, Fishing & Forestry | 234 (100.0%) | 0 (0.0%) |
| Construction & Extraction | 1,541 (99.7%) | 5 (0.3%) |
| Installation, Maintenance & Repair | 650 (100.0%) | 0 (0.0%) |
| Total (Category) | 2,425 (99.8%) | 5 (0.2%) |
| Total (Overall) | 11,218 (59.6%) | 7,607 (40.4%) |
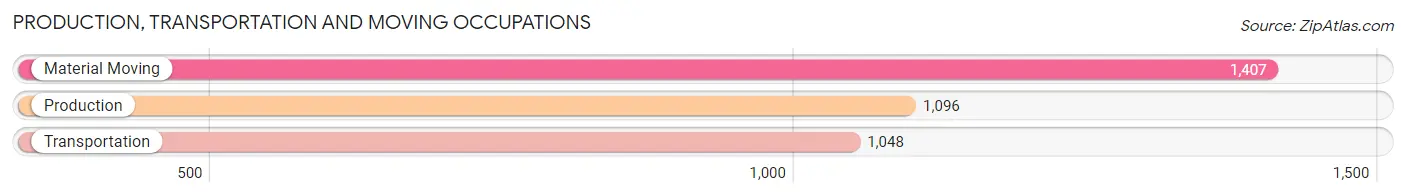
Production, Transportation and Moving Occupations
The most common Production, Transportation and Moving occupations in Rosenberg are Material Moving (1,407 | 7.5%), Production (1,096 | 5.8%), and Transportation (1,048 | 5.6%).
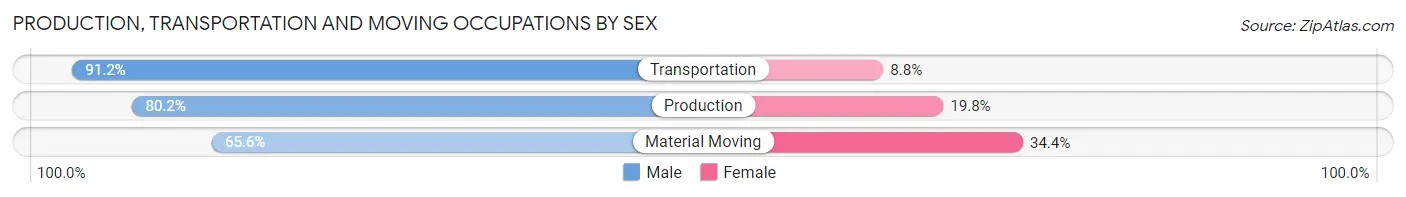
Production, Transportation and Moving Occupations by Sex
| Occupation | Male | Female |
| Production | 879 (80.2%) | 217 (19.8%) |
| Transportation | 956 (91.2%) | 92 (8.8%) |
| Material Moving | 923 (65.6%) | 484 (34.4%) |
| Total (Category) | 2,758 (77.7%) | 793 (22.3%) |
| Total (Overall) | 11,218 (59.6%) | 7,607 (40.4%) |
Employment Industries by Sex in Rosenberg
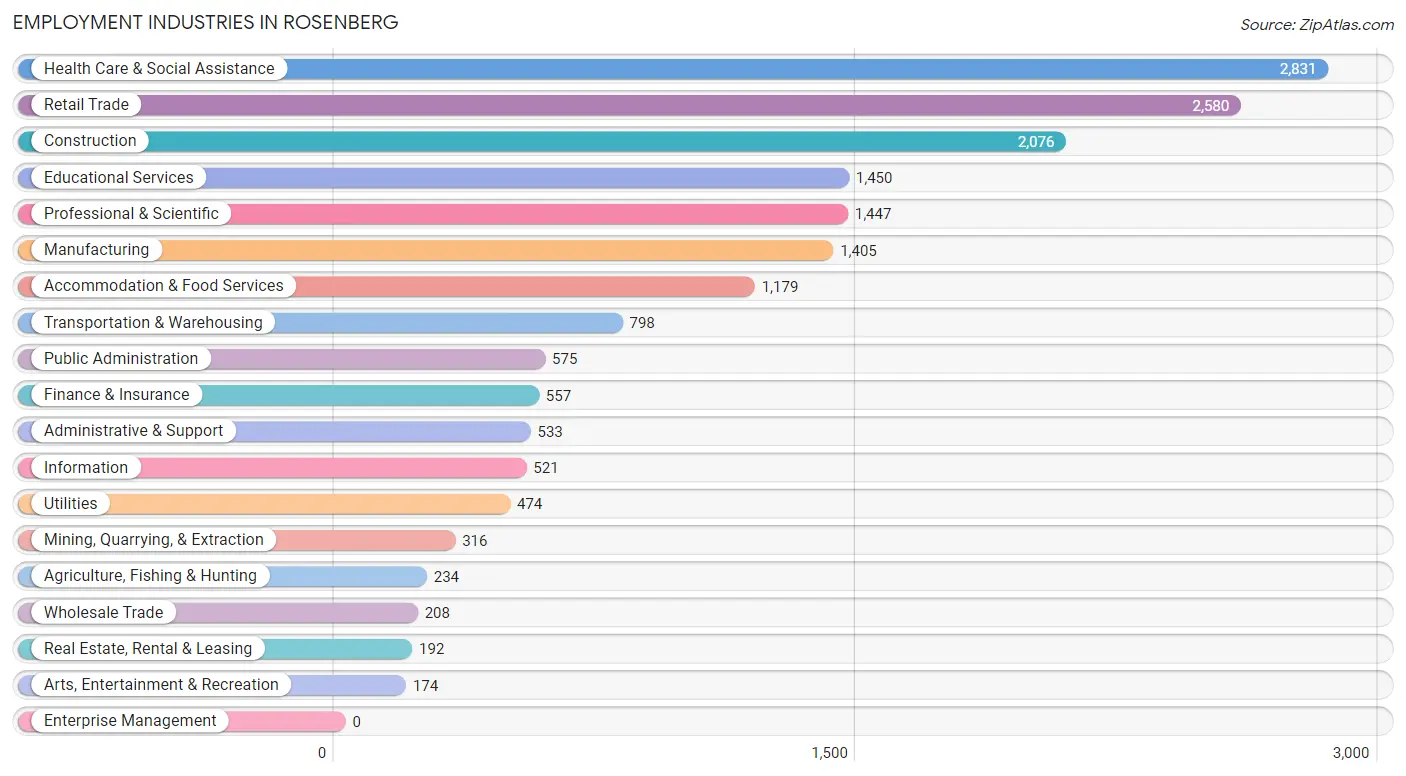
Employment Industries in Rosenberg
The major employment industries in Rosenberg include Health Care & Social Assistance (2,831 | 15.0%), Retail Trade (2,580 | 13.7%), Construction (2,076 | 11.0%), Educational Services (1,450 | 7.7%), and Professional & Scientific (1,447 | 7.7%).
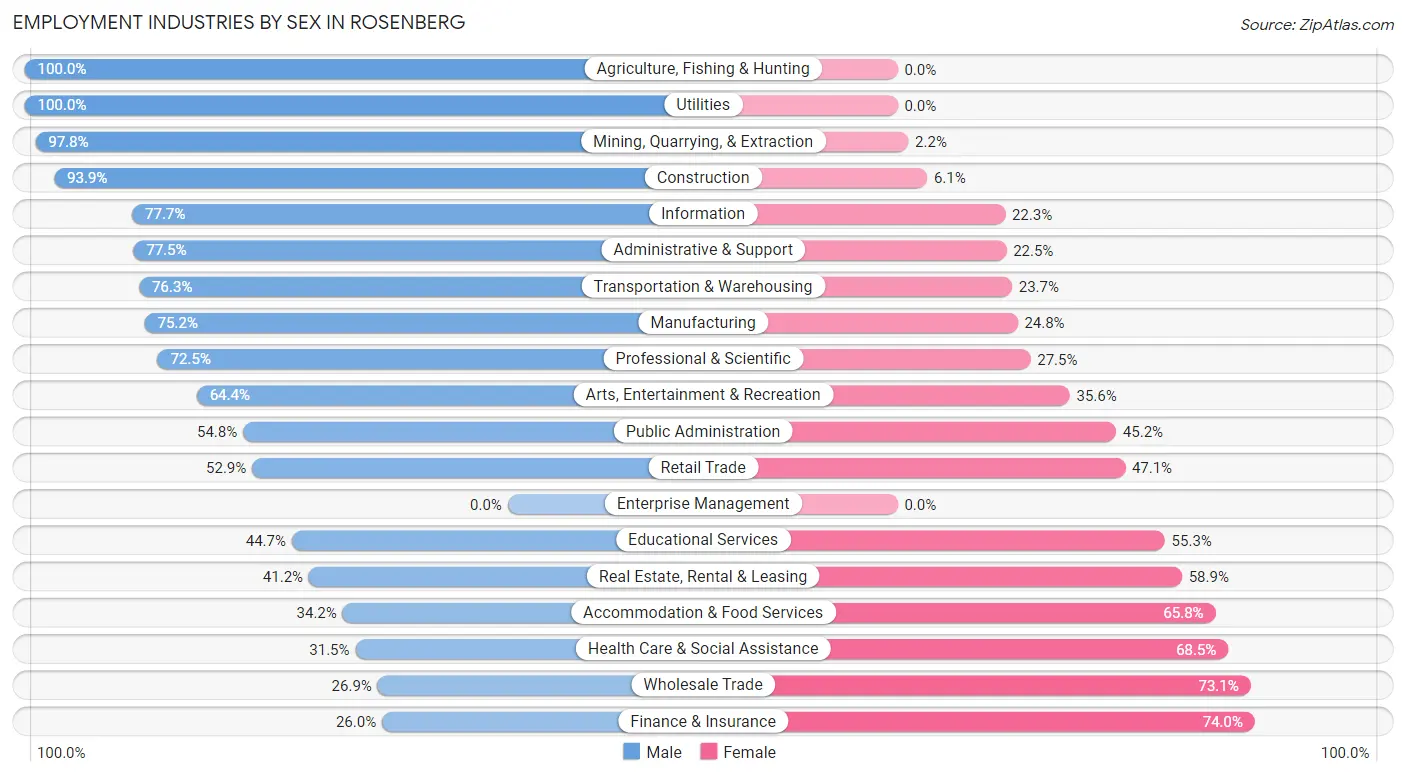
Employment Industries by Sex in Rosenberg
The Rosenberg industries that see more men than women are Agriculture, Fishing & Hunting (100.0%), Utilities (100.0%), and Mining, Quarrying, & Extraction (97.8%), whereas the industries that tend to have a higher number of women are Finance & Insurance (74.0%), Wholesale Trade (73.1%), and Health Care & Social Assistance (68.5%).
| Industry | Male | Female |
| Agriculture, Fishing & Hunting | 234 (100.0%) | 0 (0.0%) |
| Mining, Quarrying, & Extraction | 309 (97.8%) | 7 (2.2%) |
| Construction | 1,949 (93.9%) | 127 (6.1%) |
| Manufacturing | 1,056 (75.2%) | 349 (24.8%) |
| Wholesale Trade | 56 (26.9%) | 152 (73.1%) |
| Retail Trade | 1,365 (52.9%) | 1,215 (47.1%) |
| Transportation & Warehousing | 609 (76.3%) | 189 (23.7%) |
| Utilities | 474 (100.0%) | 0 (0.0%) |
| Information | 405 (77.7%) | 116 (22.3%) |
| Finance & Insurance | 145 (26.0%) | 412 (74.0%) |
| Real Estate, Rental & Leasing | 79 (41.1%) | 113 (58.9%) |
| Professional & Scientific | 1,049 (72.5%) | 398 (27.5%) |
| Enterprise Management | 0 (0.0%) | 0 (0.0%) |
| Administrative & Support | 413 (77.5%) | 120 (22.5%) |
| Educational Services | 648 (44.7%) | 802 (55.3%) |
| Health Care & Social Assistance | 893 (31.5%) | 1,938 (68.5%) |
| Arts, Entertainment & Recreation | 112 (64.4%) | 62 (35.6%) |
| Accommodation & Food Services | 403 (34.2%) | 776 (65.8%) |
| Public Administration | 315 (54.8%) | 260 (45.2%) |
| Total | 11,218 (59.6%) | 7,607 (40.4%) |
Education in Rosenberg
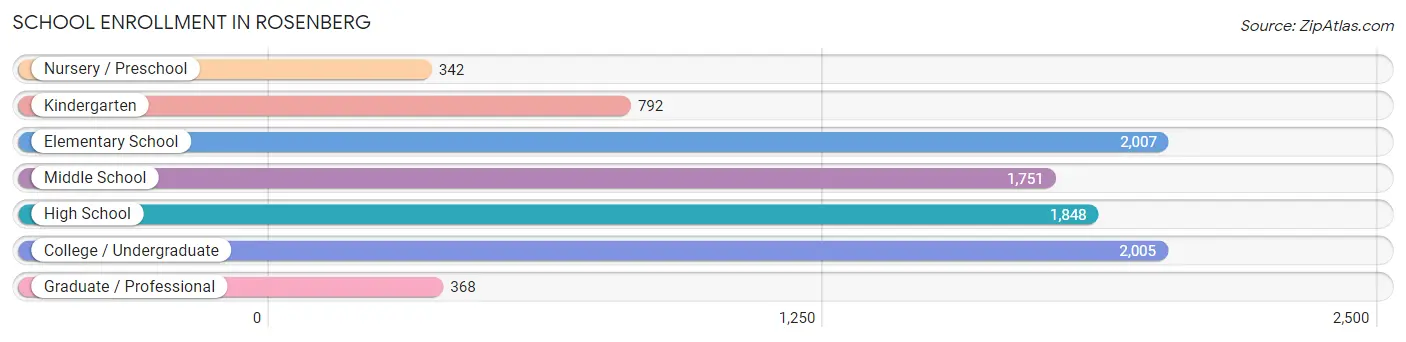
School Enrollment in Rosenberg
The most common levels of schooling among the 9,113 students in Rosenberg are elementary school (2,007 | 22.0%), college / undergraduate (2,005 | 22.0%), and high school (1,848 | 20.3%).
| School Level | # Students | % Students |
| Nursery / Preschool | 342 | 3.7% |
| Kindergarten | 792 | 8.7% |
| Elementary School | 2,007 | 22.0% |
| Middle School | 1,751 | 19.2% |
| High School | 1,848 | 20.3% |
| College / Undergraduate | 2,005 | 22.0% |
| Graduate / Professional | 368 | 4.0% |
| Total | 9,113 | 100.0% |
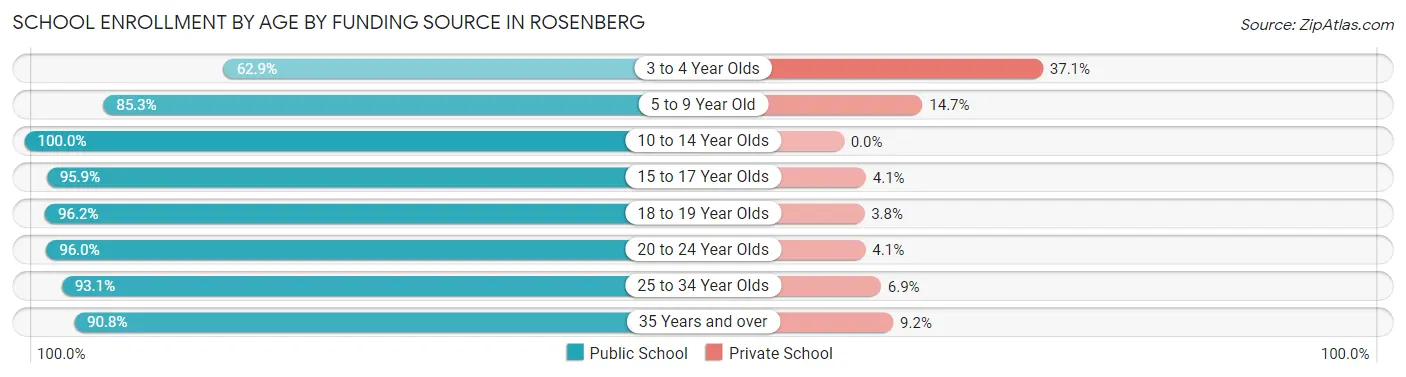
School Enrollment by Age by Funding Source in Rosenberg
Out of a total of 9,113 students who are enrolled in schools in Rosenberg, 693 (7.6%) attend a private institution, while the remaining 8,420 (92.4%) are enrolled in public schools. The age group of 3 to 4 year olds has the highest likelihood of being enrolled in private schools, with 82 (37.1% in the age bracket) enrolled. Conversely, the age group of 10 to 14 year olds has the lowest likelihood of being enrolled in a private school, with 2,064 (100.0% in the age bracket) attending a public institution.
| Age Bracket | Public School | Private School |
| 3 to 4 Year Olds | 139 (62.9%) | 82 (37.1%) |
| 5 to 9 Year Old | 2,300 (85.3%) | 395 (14.7%) |
| 10 to 14 Year Olds | 2,064 (100.0%) | 0 (0.0%) |
| 15 to 17 Year Olds | 1,185 (95.9%) | 51 (4.1%) |
| 18 to 19 Year Olds | 804 (96.2%) | 32 (3.8%) |
| 20 to 24 Year Olds | 830 (96.0%) | 35 (4.1%) |
| 25 to 34 Year Olds | 417 (93.1%) | 31 (6.9%) |
| 35 Years and over | 679 (90.8%) | 69 (9.2%) |
| Total | 8,420 (92.4%) | 693 (7.6%) |
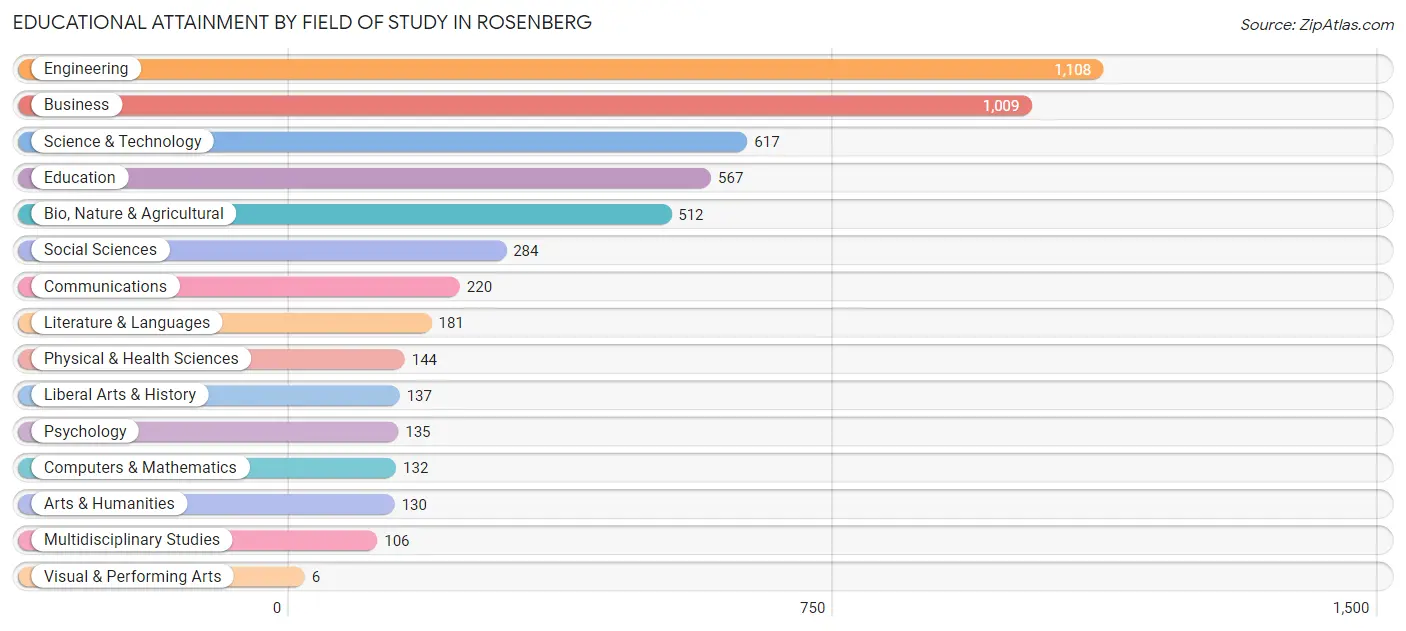
Educational Attainment by Field of Study in Rosenberg
Engineering (1,108 | 20.9%), business (1,009 | 19.1%), science & technology (617 | 11.7%), education (567 | 10.7%), and bio, nature & agricultural (512 | 9.7%) are the most common fields of study among 5,288 individuals in Rosenberg who have obtained a bachelor's degree or higher.
| Field of Study | # Graduates | % Graduates |
| Computers & Mathematics | 132 | 2.5% |
| Bio, Nature & Agricultural | 512 | 9.7% |
| Physical & Health Sciences | 144 | 2.7% |
| Psychology | 135 | 2.5% |
| Social Sciences | 284 | 5.4% |
| Engineering | 1,108 | 20.9% |
| Multidisciplinary Studies | 106 | 2.0% |
| Science & Technology | 617 | 11.7% |
| Business | 1,009 | 19.1% |
| Education | 567 | 10.7% |
| Literature & Languages | 181 | 3.4% |
| Liberal Arts & History | 137 | 2.6% |
| Visual & Performing Arts | 6 | 0.1% |
| Communications | 220 | 4.2% |
| Arts & Humanities | 130 | 2.5% |
| Total | 5,288 | 100.0% |
Transportation & Commute in Rosenberg
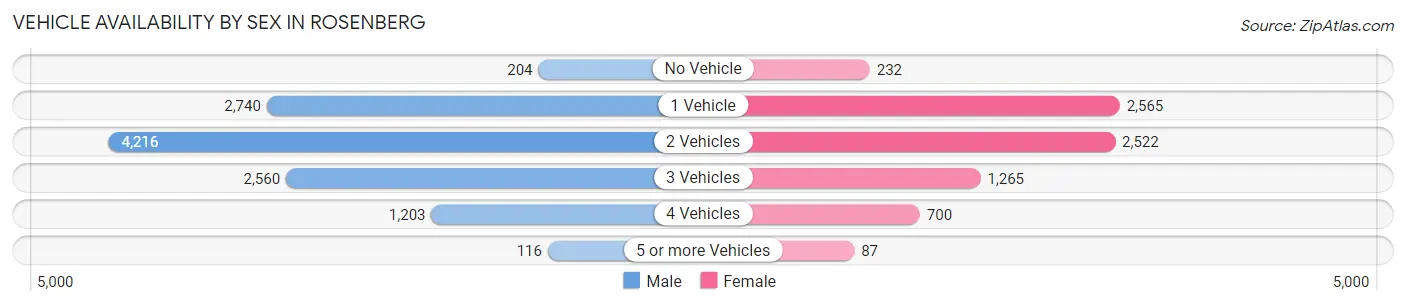
Vehicle Availability by Sex in Rosenberg
The most prevalent vehicle ownership categories in Rosenberg are males with 2 vehicles (4,216, accounting for 38.2%) and females with 2 vehicles (2,522, making up 57.2%).
| Vehicles Available | Male | Female |
| No Vehicle | 204 (1.8%) | 232 (3.2%) |
| 1 Vehicle | 2,740 (24.8%) | 2,565 (34.8%) |
| 2 Vehicles | 4,216 (38.2%) | 2,522 (34.2%) |
| 3 Vehicles | 2,560 (23.2%) | 1,265 (17.2%) |
| 4 Vehicles | 1,203 (10.9%) | 700 (9.5%) |
| 5 or more Vehicles | 116 (1.1%) | 87 (1.2%) |
| Total | 11,039 (100.0%) | 7,371 (100.0%) |
Commute Time in Rosenberg
The most frequently occuring commute durations in Rosenberg are 45 to 59 minutes (2,696 commuters, 15.8%), 30 to 34 minutes (2,563 commuters, 15.0%), and 15 to 19 minutes (2,206 commuters, 12.9%).
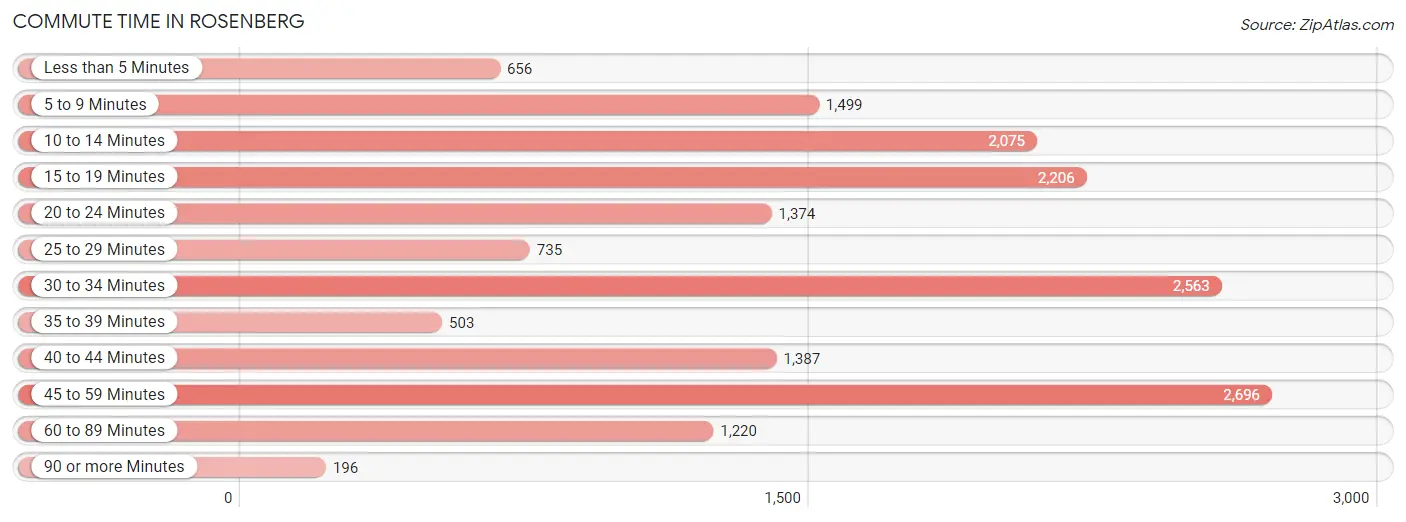
| Commute Time | # Commuters | % Commuters |
| Less than 5 Minutes | 656 | 3.8% |
| 5 to 9 Minutes | 1,499 | 8.8% |
| 10 to 14 Minutes | 2,075 | 12.1% |
| 15 to 19 Minutes | 2,206 | 12.9% |
| 20 to 24 Minutes | 1,374 | 8.0% |
| 25 to 29 Minutes | 735 | 4.3% |
| 30 to 34 Minutes | 2,563 | 15.0% |
| 35 to 39 Minutes | 503 | 2.9% |
| 40 to 44 Minutes | 1,387 | 8.1% |
| 45 to 59 Minutes | 2,696 | 15.8% |
| 60 to 89 Minutes | 1,220 | 7.1% |
| 90 or more Minutes | 196 | 1.1% |
Commute Time by Sex in Rosenberg
The most common commute times in Rosenberg are 45 to 59 minutes (1,649 commuters, 16.4%) for males and 15 to 19 minutes (1,412 commuters, 20.1%) for females.
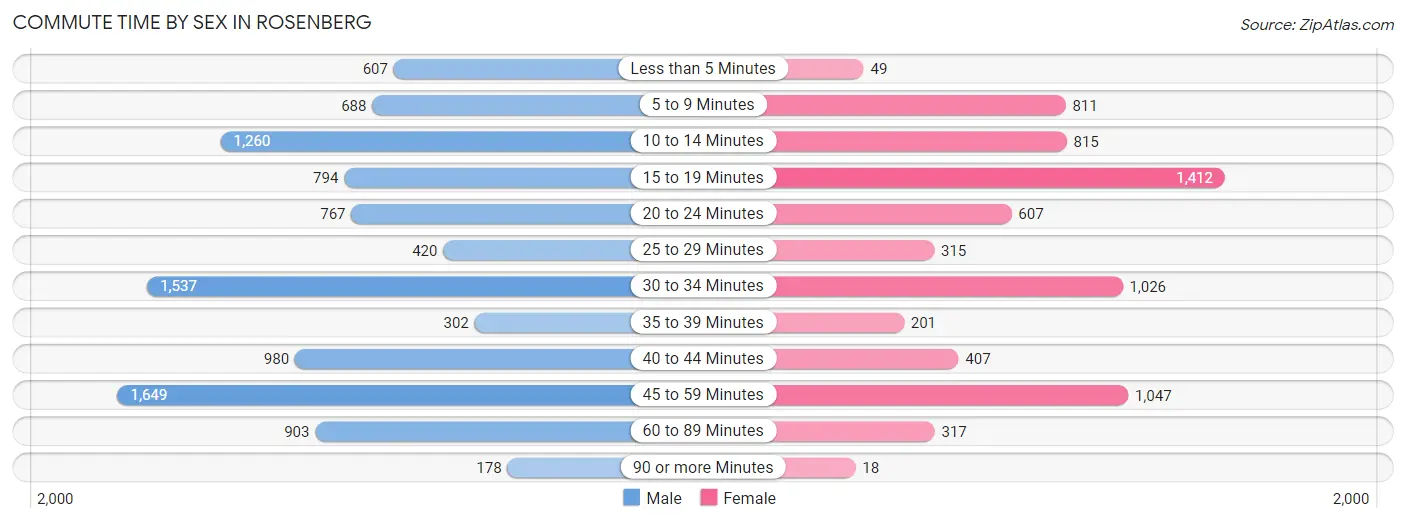
| Commute Time | Male | Female |
| Less than 5 Minutes | 607 (6.0%) | 49 (0.7%) |
| 5 to 9 Minutes | 688 (6.8%) | 811 (11.5%) |
| 10 to 14 Minutes | 1,260 (12.5%) | 815 (11.6%) |
| 15 to 19 Minutes | 794 (7.9%) | 1,412 (20.1%) |
| 20 to 24 Minutes | 767 (7.6%) | 607 (8.6%) |
| 25 to 29 Minutes | 420 (4.2%) | 315 (4.5%) |
| 30 to 34 Minutes | 1,537 (15.2%) | 1,026 (14.6%) |
| 35 to 39 Minutes | 302 (3.0%) | 201 (2.9%) |
| 40 to 44 Minutes | 980 (9.7%) | 407 (5.8%) |
| 45 to 59 Minutes | 1,649 (16.4%) | 1,047 (14.9%) |
| 60 to 89 Minutes | 903 (8.9%) | 317 (4.5%) |
| 90 or more Minutes | 178 (1.8%) | 18 (0.3%) |
Time of Departure to Work by Sex in Rosenberg
The most frequent times of departure to work in Rosenberg are 7:00 AM to 7:29 AM (1,544, 15.3%) for males and 7:30 AM to 7:59 AM (1,173, 16.7%) for females.
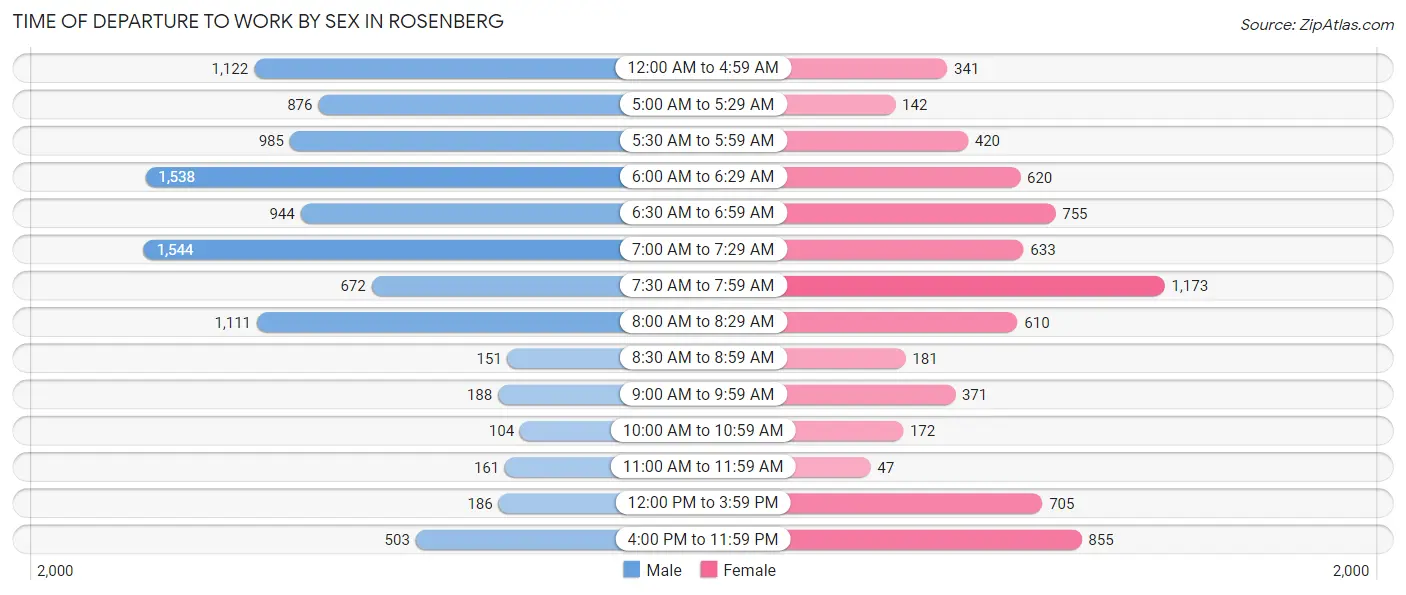
| Time of Departure | Male | Female |
| 12:00 AM to 4:59 AM | 1,122 (11.1%) | 341 (4.9%) |
| 5:00 AM to 5:29 AM | 876 (8.7%) | 142 (2.0%) |
| 5:30 AM to 5:59 AM | 985 (9.8%) | 420 (6.0%) |
| 6:00 AM to 6:29 AM | 1,538 (15.2%) | 620 (8.8%) |
| 6:30 AM to 6:59 AM | 944 (9.4%) | 755 (10.7%) |
| 7:00 AM to 7:29 AM | 1,544 (15.3%) | 633 (9.0%) |
| 7:30 AM to 7:59 AM | 672 (6.7%) | 1,173 (16.7%) |
| 8:00 AM to 8:29 AM | 1,111 (11.0%) | 610 (8.7%) |
| 8:30 AM to 8:59 AM | 151 (1.5%) | 181 (2.6%) |
| 9:00 AM to 9:59 AM | 188 (1.9%) | 371 (5.3%) |
| 10:00 AM to 10:59 AM | 104 (1.0%) | 172 (2.5%) |
| 11:00 AM to 11:59 AM | 161 (1.6%) | 47 (0.7%) |
| 12:00 PM to 3:59 PM | 186 (1.8%) | 705 (10.0%) |
| 4:00 PM to 11:59 PM | 503 (5.0%) | 855 (12.2%) |
| Total | 10,085 (100.0%) | 7,025 (100.0%) |
Housing Occupancy in Rosenberg
Occupancy by Ownership in Rosenberg
Of the total 14,344 dwellings in Rosenberg, owner-occupied units account for 7,706 (53.7%), while renter-occupied units make up 6,638 (46.3%).
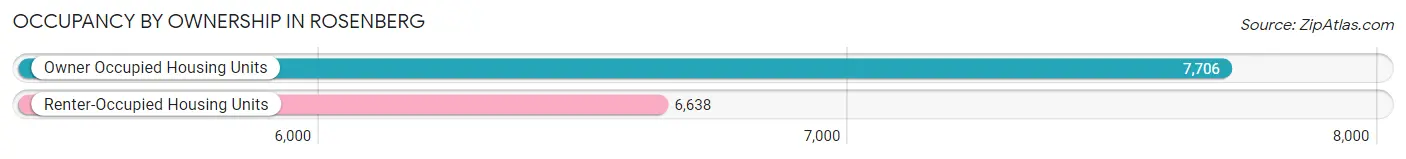
| Occupancy | # Housing Units | % Housing Units |
| Owner Occupied Housing Units | 7,706 | 53.7% |
| Renter-Occupied Housing Units | 6,638 | 46.3% |
| Total Occupied Housing Units | 14,344 | 100.0% |
Occupancy by Household Size in Rosenberg
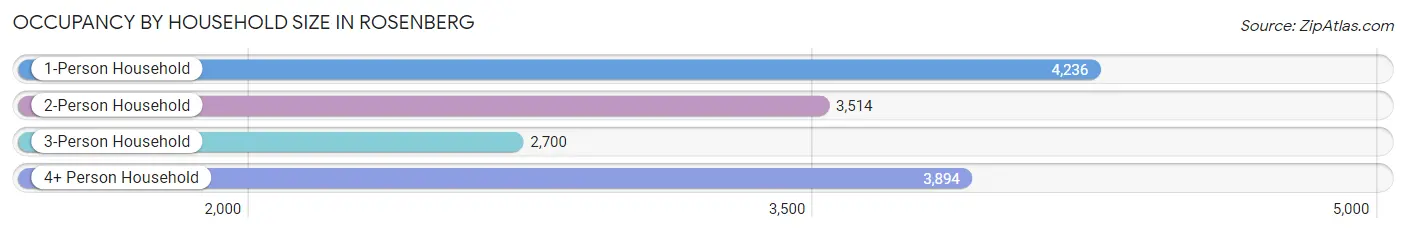
| Household Size | # Housing Units | % Housing Units |
| 1-Person Household | 4,236 | 29.5% |
| 2-Person Household | 3,514 | 24.5% |
| 3-Person Household | 2,700 | 18.8% |
| 4+ Person Household | 3,894 | 27.2% |
| Total Housing Units | 14,344 | 100.0% |
Occupancy by Ownership by Household Size in Rosenberg
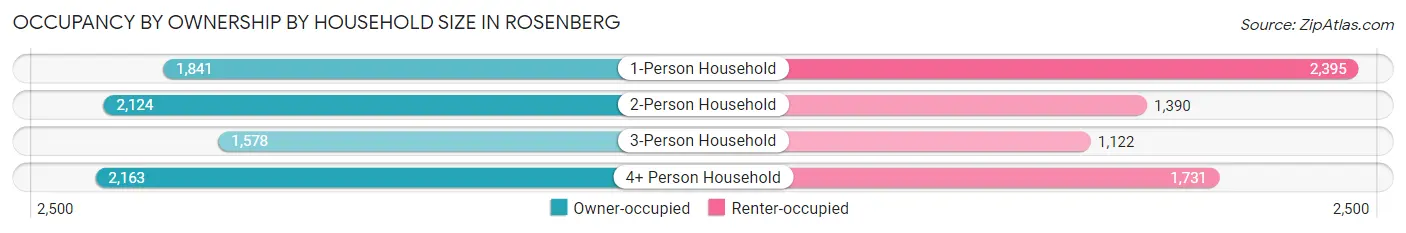
| Household Size | Owner-occupied | Renter-occupied |
| 1-Person Household | 1,841 (43.5%) | 2,395 (56.5%) |
| 2-Person Household | 2,124 (60.4%) | 1,390 (39.6%) |
| 3-Person Household | 1,578 (58.4%) | 1,122 (41.6%) |
| 4+ Person Household | 2,163 (55.5%) | 1,731 (44.5%) |
| Total Housing Units | 7,706 (53.7%) | 6,638 (46.3%) |
Occupancy by Educational Attainment in Rosenberg
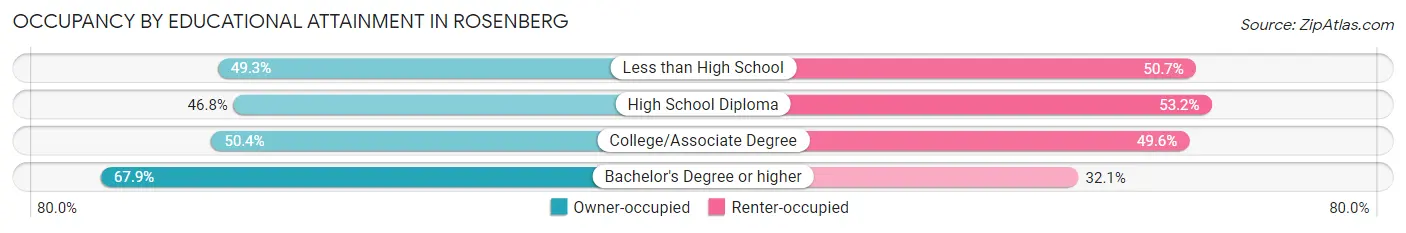
| Household Size | Owner-occupied | Renter-occupied |
| Less than High School | 1,126 (49.3%) | 1,156 (50.7%) |
| High School Diploma | 1,749 (46.8%) | 1,985 (53.2%) |
| College/Associate Degree | 2,366 (50.4%) | 2,331 (49.6%) |
| Bachelor's Degree or higher | 2,465 (67.9%) | 1,166 (32.1%) |
Occupancy by Age of Householder in Rosenberg
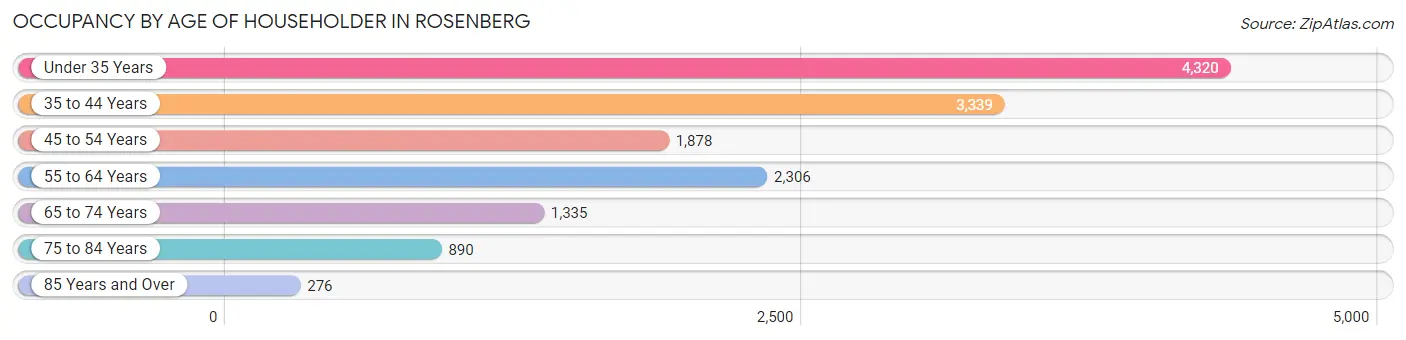
| Age Bracket | # Households | % Households |
| Under 35 Years | 4,320 | 30.1% |
| 35 to 44 Years | 3,339 | 23.3% |
| 45 to 54 Years | 1,878 | 13.1% |
| 55 to 64 Years | 2,306 | 16.1% |
| 65 to 74 Years | 1,335 | 9.3% |
| 75 to 84 Years | 890 | 6.2% |
| 85 Years and Over | 276 | 1.9% |
| Total | 14,344 | 100.0% |
Housing Finances in Rosenberg
Median Income by Occupancy in Rosenberg
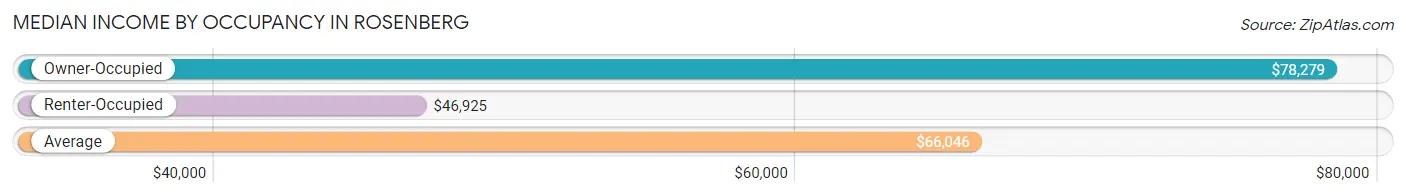
| Occupancy Type | # Households | Median Income |
| Owner-Occupied | 7,706 (53.7%) | $78,279 |
| Renter-Occupied | 6,638 (46.3%) | $46,925 |
| Average | 14,344 (100.0%) | $66,046 |
Occupancy by Householder Income Bracket in Rosenberg
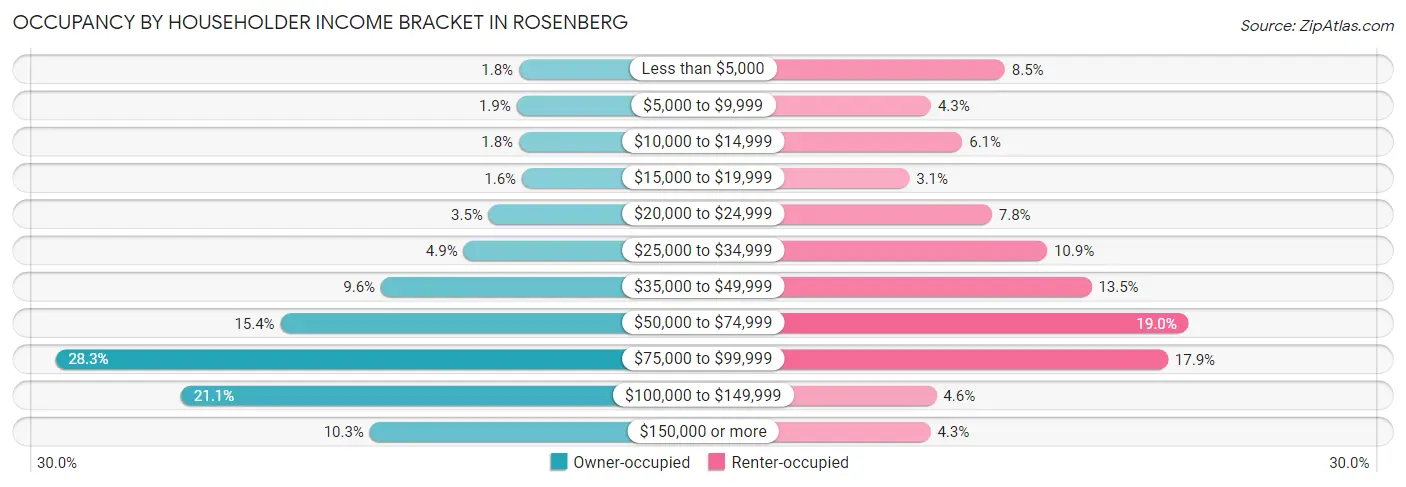
| Income Bracket | Owner-occupied | Renter-occupied |
| Less than $5,000 | 135 (1.8%) | 566 (8.5%) |
| $5,000 to $9,999 | 146 (1.9%) | 286 (4.3%) |
| $10,000 to $14,999 | 135 (1.8%) | 405 (6.1%) |
| $15,000 to $19,999 | 122 (1.6%) | 204 (3.1%) |
| $20,000 to $24,999 | 268 (3.5%) | 517 (7.8%) |
| $25,000 to $34,999 | 379 (4.9%) | 726 (10.9%) |
| $35,000 to $49,999 | 743 (9.6%) | 895 (13.5%) |
| $50,000 to $74,999 | 1,185 (15.4%) | 1,263 (19.0%) |
| $75,000 to $99,999 | 2,177 (28.2%) | 1,185 (17.8%) |
| $100,000 to $149,999 | 1,624 (21.1%) | 307 (4.6%) |
| $150,000 or more | 792 (10.3%) | 284 (4.3%) |
| Total | 7,706 (100.0%) | 6,638 (100.0%) |
Monthly Housing Cost Tiers in Rosenberg
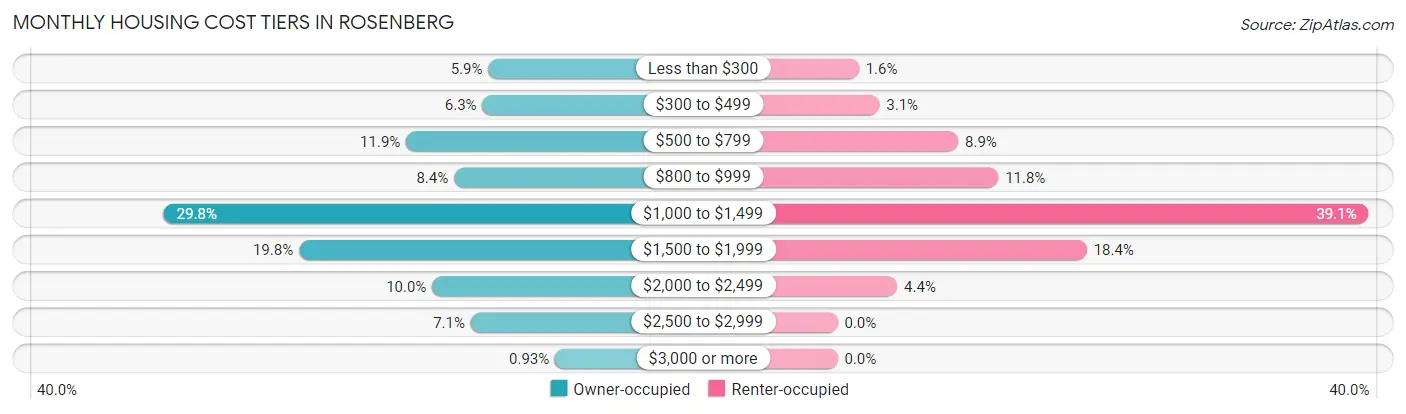
| Monthly Cost | Owner-occupied | Renter-occupied |
| Less than $300 | 451 (5.9%) | 104 (1.6%) |
| $300 to $499 | 484 (6.3%) | 205 (3.1%) |
| $500 to $799 | 917 (11.9%) | 590 (8.9%) |
| $800 to $999 | 645 (8.4%) | 786 (11.8%) |
| $1,000 to $1,499 | 2,293 (29.8%) | 2,596 (39.1%) |
| $1,500 to $1,999 | 1,525 (19.8%) | 1,219 (18.4%) |
| $2,000 to $2,499 | 769 (10.0%) | 292 (4.4%) |
| $2,500 to $2,999 | 550 (7.1%) | 0 (0.0%) |
| $3,000 or more | 72 (0.9%) | 0 (0.0%) |
| Total | 7,706 (100.0%) | 6,638 (100.0%) |
Physical Housing Characteristics in Rosenberg
Housing Structures in Rosenberg
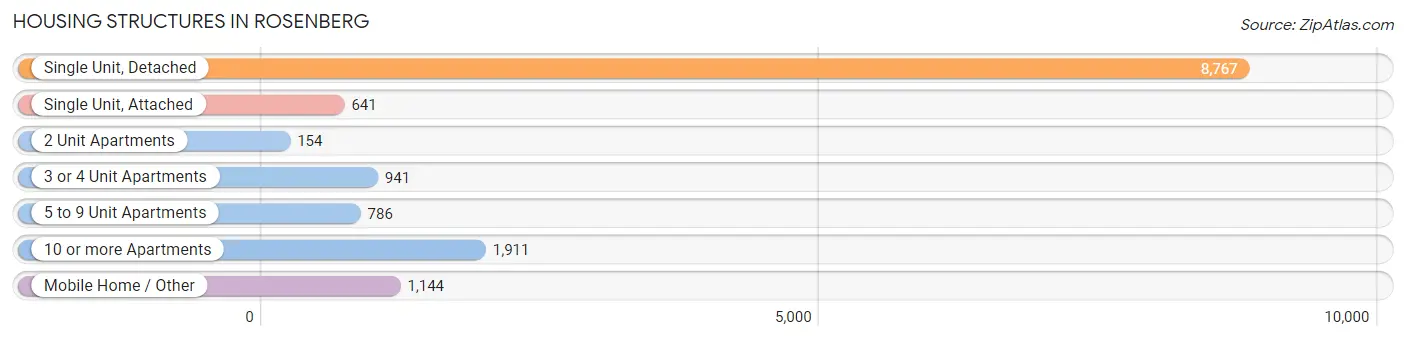
| Structure Type | # Housing Units | % Housing Units |
| Single Unit, Detached | 8,767 | 61.1% |
| Single Unit, Attached | 641 | 4.5% |
| 2 Unit Apartments | 154 | 1.1% |
| 3 or 4 Unit Apartments | 941 | 6.6% |
| 5 to 9 Unit Apartments | 786 | 5.5% |
| 10 or more Apartments | 1,911 | 13.3% |
| Mobile Home / Other | 1,144 | 8.0% |
| Total | 14,344 | 100.0% |
Housing Structures by Occupancy in Rosenberg
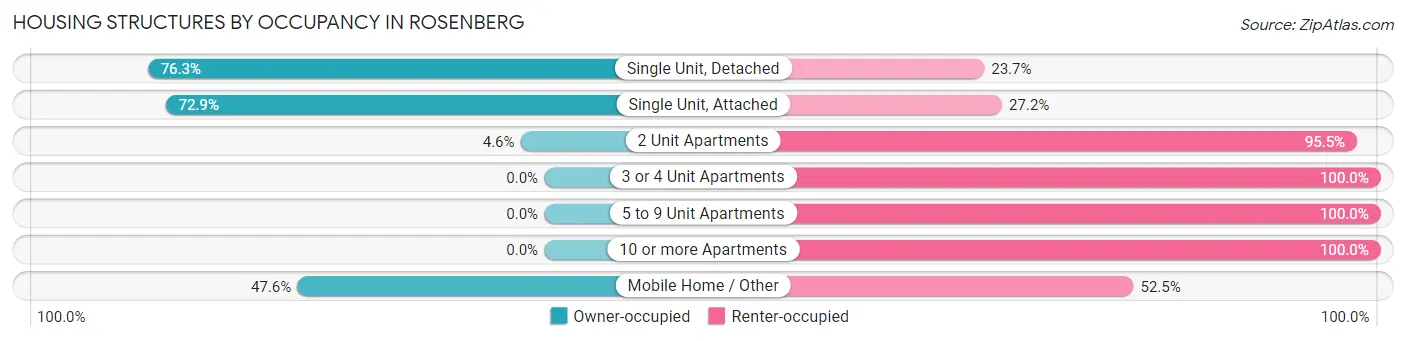
| Structure Type | Owner-occupied | Renter-occupied |
| Single Unit, Detached | 6,688 (76.3%) | 2,079 (23.7%) |
| Single Unit, Attached | 467 (72.9%) | 174 (27.2%) |
| 2 Unit Apartments | 7 (4.5%) | 147 (95.5%) |
| 3 or 4 Unit Apartments | 0 (0.0%) | 941 (100.0%) |
| 5 to 9 Unit Apartments | 0 (0.0%) | 786 (100.0%) |
| 10 or more Apartments | 0 (0.0%) | 1,911 (100.0%) |
| Mobile Home / Other | 544 (47.5%) | 600 (52.4%) |
| Total | 7,706 (53.7%) | 6,638 (46.3%) |
Housing Structures by Number of Rooms in Rosenberg
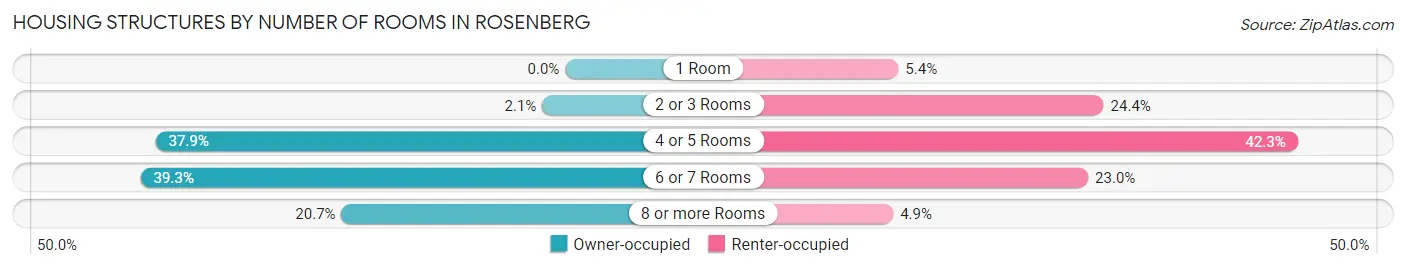
| Number of Rooms | Owner-occupied | Renter-occupied |
| 1 Room | 0 (0.0%) | 359 (5.4%) |
| 2 or 3 Rooms | 164 (2.1%) | 1,619 (24.4%) |
| 4 or 5 Rooms | 2,920 (37.9%) | 2,809 (42.3%) |
| 6 or 7 Rooms | 3,027 (39.3%) | 1,524 (23.0%) |
| 8 or more Rooms | 1,595 (20.7%) | 327 (4.9%) |
| Total | 7,706 (100.0%) | 6,638 (100.0%) |
Housing Structure by Heating Type in Rosenberg
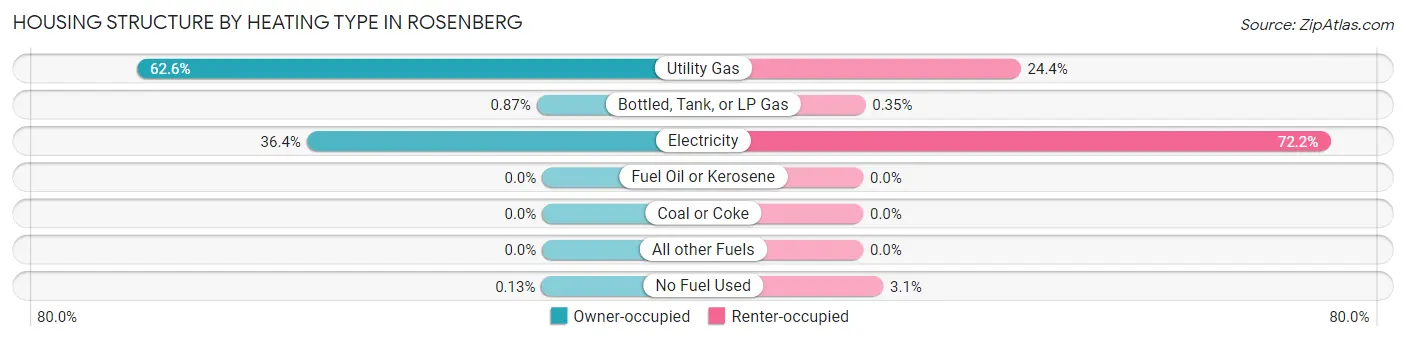
| Heating Type | Owner-occupied | Renter-occupied |
| Utility Gas | 4,824 (62.6%) | 1,617 (24.4%) |
| Bottled, Tank, or LP Gas | 67 (0.9%) | 23 (0.4%) |
| Electricity | 2,805 (36.4%) | 4,792 (72.2%) |
| Fuel Oil or Kerosene | 0 (0.0%) | 0 (0.0%) |
| Coal or Coke | 0 (0.0%) | 0 (0.0%) |
| All other Fuels | 0 (0.0%) | 0 (0.0%) |
| No Fuel Used | 10 (0.1%) | 206 (3.1%) |
| Total | 7,706 (100.0%) | 6,638 (100.0%) |
Household Vehicle Usage in Rosenberg
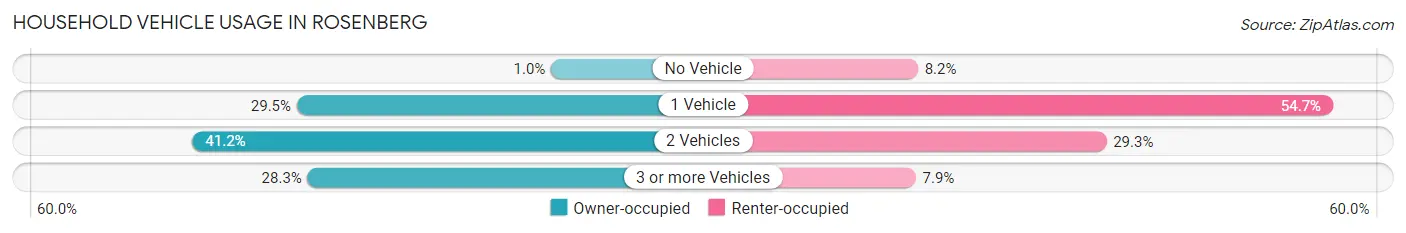
| Vehicles per Household | Owner-occupied | Renter-occupied |
| No Vehicle | 78 (1.0%) | 541 (8.2%) |
| 1 Vehicle | 2,273 (29.5%) | 3,628 (54.7%) |
| 2 Vehicles | 3,175 (41.2%) | 1,943 (29.3%) |
| 3 or more Vehicles | 2,180 (28.3%) | 526 (7.9%) |
| Total | 7,706 (100.0%) | 6,638 (100.0%) |
Real Estate & Mortgages in Rosenberg
Real Estate and Mortgage Overview in Rosenberg
| Characteristic | Without Mortgage | With Mortgage |
| Housing Units | 2,827 | 4,879 |
| Median Property Value | $184,200 | $214,000 |
| Median Household Income | $75,221 | $627 |
| Monthly Housing Costs | $693 | $72 |
| Real Estate Taxes | $1,638 | $190 |
Property Value by Mortgage Status in Rosenberg
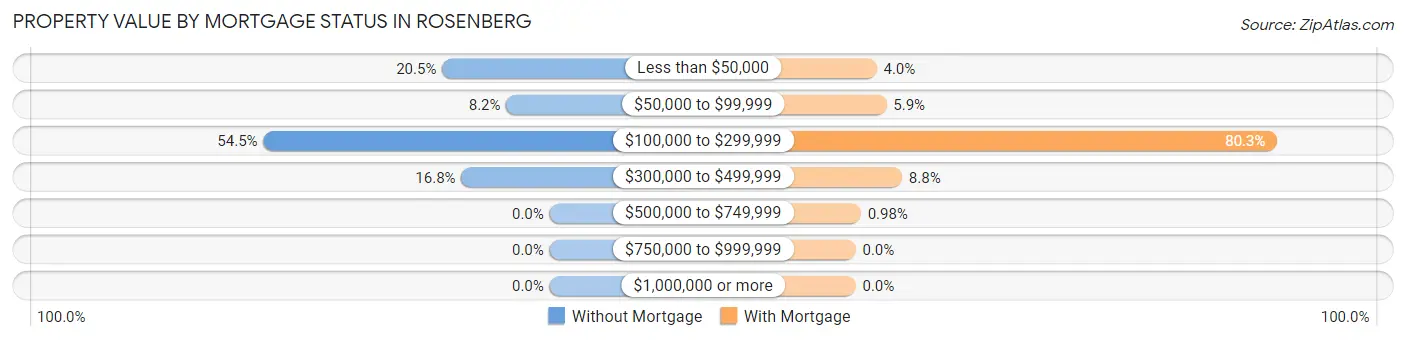
| Property Value | Without Mortgage | With Mortgage |
| Less than $50,000 | 578 (20.4%) | 195 (4.0%) |
| $50,000 to $99,999 | 233 (8.2%) | 286 (5.9%) |
| $100,000 to $299,999 | 1,541 (54.5%) | 3,919 (80.3%) |
| $300,000 to $499,999 | 475 (16.8%) | 431 (8.8%) |
| $500,000 to $749,999 | 0 (0.0%) | 48 (1.0%) |
| $750,000 to $999,999 | 0 (0.0%) | 0 (0.0%) |
| $1,000,000 or more | 0 (0.0%) | 0 (0.0%) |
| Total | 2,827 (100.0%) | 4,879 (100.0%) |
Household Income by Mortgage Status in Rosenberg
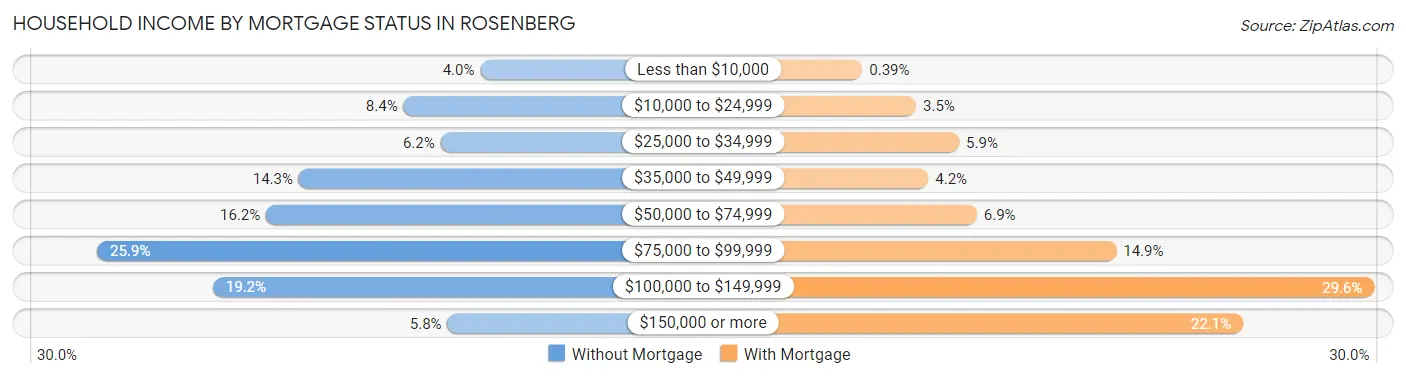
| Household Income | Without Mortgage | With Mortgage |
| Less than $10,000 | 112 (4.0%) | 19 (0.4%) |
| $10,000 to $24,999 | 236 (8.4%) | 169 (3.5%) |
| $25,000 to $34,999 | 176 (6.2%) | 289 (5.9%) |
| $35,000 to $49,999 | 405 (14.3%) | 203 (4.2%) |
| $50,000 to $74,999 | 458 (16.2%) | 338 (6.9%) |
| $75,000 to $99,999 | 731 (25.9%) | 727 (14.9%) |
| $100,000 to $149,999 | 544 (19.2%) | 1,446 (29.6%) |
| $150,000 or more | 165 (5.8%) | 1,080 (22.1%) |
| Total | 2,827 (100.0%) | 4,879 (100.0%) |
Property Value to Household Income Ratio in Rosenberg
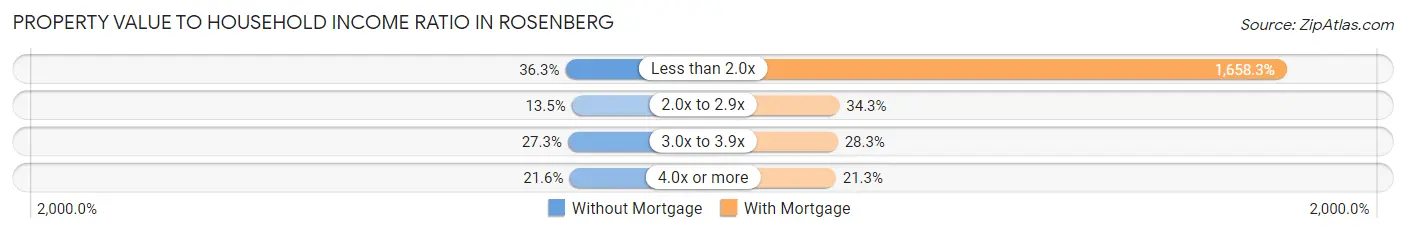
| Value-to-Income Ratio | Without Mortgage | With Mortgage |
| Less than 2.0x | 1,027 (36.3%) | 80,908 (1,658.3%) |
| 2.0x to 2.9x | 381 (13.5%) | 1,672 (34.3%) |
| 3.0x to 3.9x | 771 (27.3%) | 1,379 (28.3%) |
| 4.0x or more | 611 (21.6%) | 1,037 (21.2%) |
| Total | 2,827 (100.0%) | 4,879 (100.0%) |
Real Estate Taxes by Mortgage Status in Rosenberg
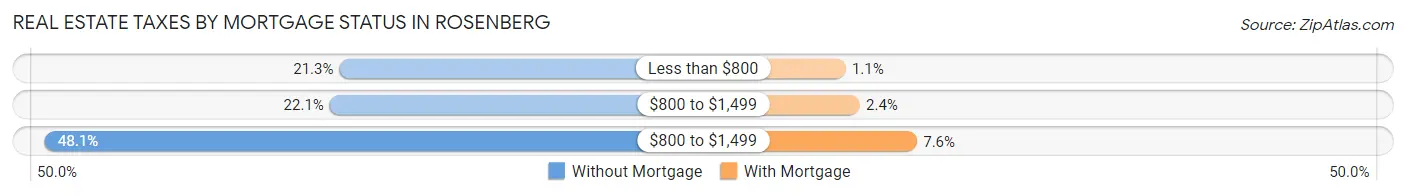
| Property Taxes | Without Mortgage | With Mortgage |
| Less than $800 | 601 (21.3%) | 53 (1.1%) |
| $800 to $1,499 | 626 (22.1%) | 116 (2.4%) |
| $800 to $1,499 | 1,361 (48.1%) | 371 (7.6%) |
| Total | 2,827 (100.0%) | 4,879 (100.0%) |
Health & Disability in Rosenberg
Health Insurance Coverage by Age in Rosenberg
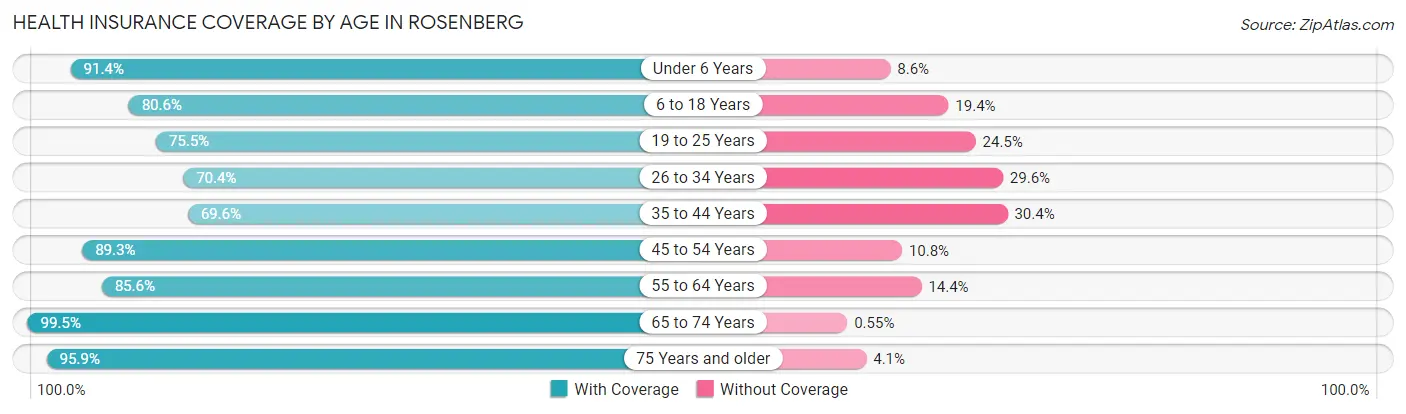
| Age Bracket | With Coverage | Without Coverage |
| Under 6 Years | 3,886 (91.4%) | 365 (8.6%) |
| 6 to 18 Years | 4,872 (80.6%) | 1,174 (19.4%) |
| 19 to 25 Years | 4,155 (75.5%) | 1,348 (24.5%) |
| 26 to 34 Years | 3,742 (70.4%) | 1,572 (29.6%) |
| 35 to 44 Years | 3,768 (69.6%) | 1,648 (30.4%) |
| 45 to 54 Years | 3,272 (89.2%) | 394 (10.7%) |
| 55 to 64 Years | 3,178 (85.6%) | 534 (14.4%) |
| 65 to 74 Years | 2,553 (99.5%) | 14 (0.5%) |
| 75 Years and older | 2,014 (95.9%) | 86 (4.1%) |
| Total | 31,440 (81.5%) | 7,135 (18.5%) |
Health Insurance Coverage by Citizenship Status in Rosenberg
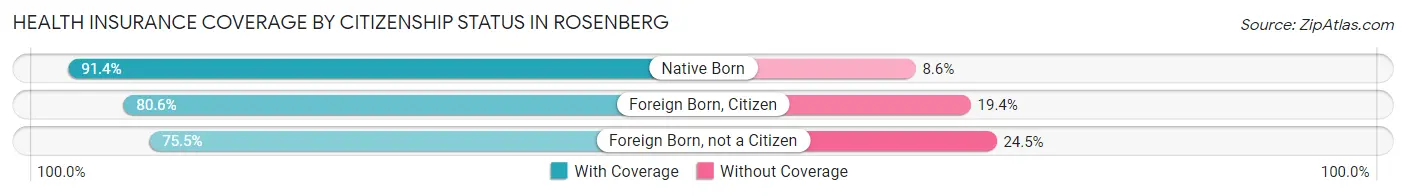
| Citizenship Status | With Coverage | Without Coverage |
| Native Born | 3,886 (91.4%) | 365 (8.6%) |
| Foreign Born, Citizen | 4,872 (80.6%) | 1,174 (19.4%) |
| Foreign Born, not a Citizen | 4,155 (75.5%) | 1,348 (24.5%) |
Health Insurance Coverage by Household Income in Rosenberg
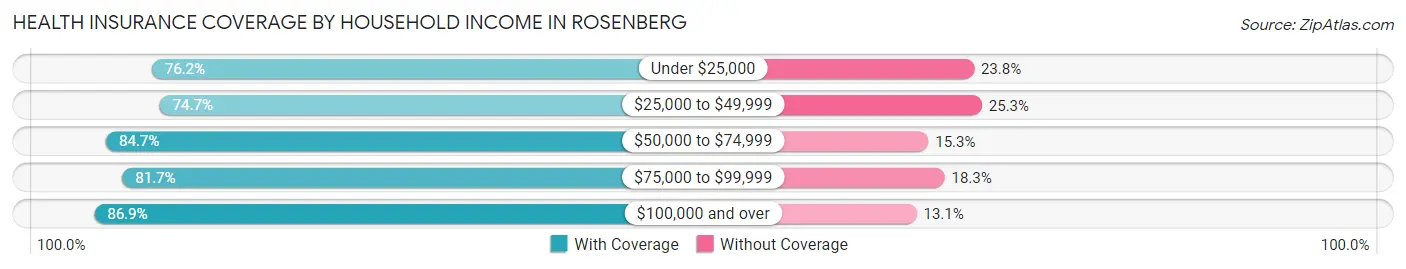
| Household Income | With Coverage | Without Coverage |
| Under $25,000 | 4,441 (76.2%) | 1,389 (23.8%) |
| $25,000 to $49,999 | 5,141 (74.7%) | 1,742 (25.3%) |
| $50,000 to $74,999 | 4,878 (84.7%) | 879 (15.3%) |
| $75,000 to $99,999 | 7,665 (81.7%) | 1,719 (18.3%) |
| $100,000 and over | 9,260 (86.9%) | 1,392 (13.1%) |
Public vs Private Health Insurance Coverage by Age in Rosenberg
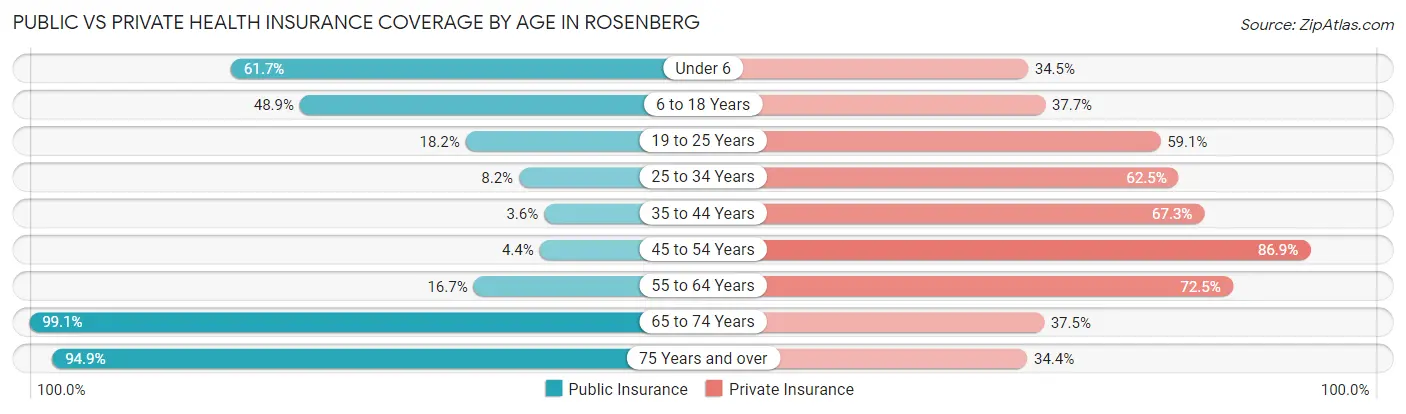
| Age Bracket | Public Insurance | Private Insurance |
| Under 6 | 2,623 (61.7%) | 1,468 (34.5%) |
| 6 to 18 Years | 2,958 (48.9%) | 2,280 (37.7%) |
| 19 to 25 Years | 999 (18.1%) | 3,252 (59.1%) |
| 25 to 34 Years | 438 (8.2%) | 3,322 (62.5%) |
| 35 to 44 Years | 194 (3.6%) | 3,642 (67.2%) |
| 45 to 54 Years | 162 (4.4%) | 3,186 (86.9%) |
| 55 to 64 Years | 619 (16.7%) | 2,692 (72.5%) |
| 65 to 74 Years | 2,545 (99.1%) | 962 (37.5%) |
| 75 Years and over | 1,992 (94.9%) | 722 (34.4%) |
| Total | 12,530 (32.5%) | 21,526 (55.8%) |
Disability Status by Sex by Age in Rosenberg
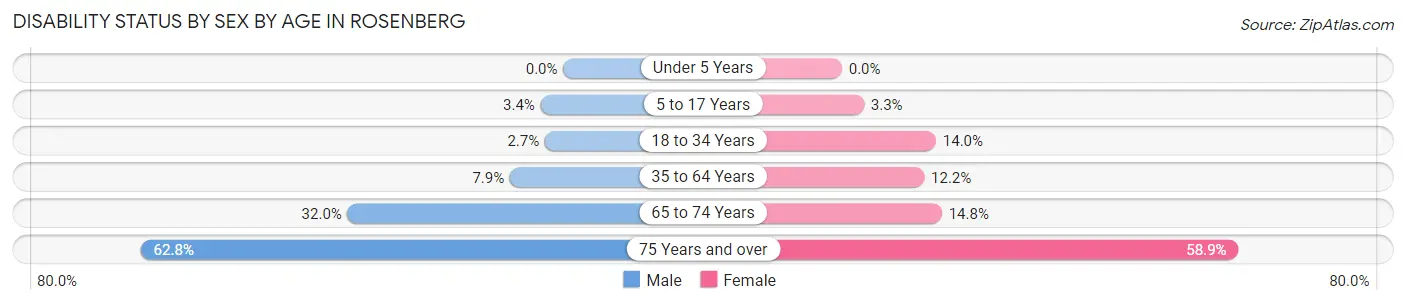
| Age Bracket | Male | Female |
| Under 5 Years | 0 (0.0%) | 0 (0.0%) |
| 5 to 17 Years | 85 (3.4%) | 122 (3.3%) |
| 18 to 34 Years | 157 (2.7%) | 800 (14.0%) |
| 35 to 64 Years | 555 (7.9%) | 707 (12.2%) |
| 65 to 74 Years | 328 (32.0%) | 229 (14.8%) |
| 75 Years and over | 573 (62.8%) | 699 (58.9%) |
Disability Class by Sex by Age in Rosenberg
Disability Class: Hearing Difficulty
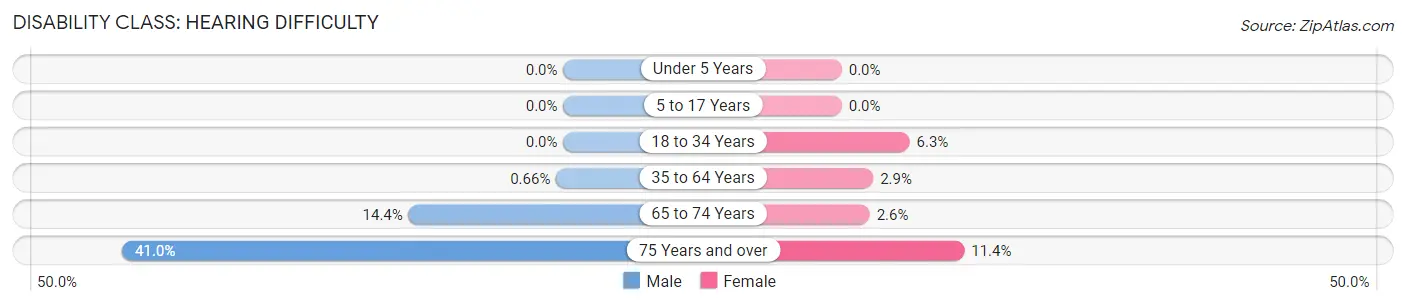
| Age Bracket | Male | Female |
| Under 5 Years | 0 (0.0%) | 0 (0.0%) |
| 5 to 17 Years | 0 (0.0%) | 0 (0.0%) |
| 18 to 34 Years | 0 (0.0%) | 360 (6.3%) |
| 35 to 64 Years | 46 (0.7%) | 169 (2.9%) |
| 65 to 74 Years | 147 (14.4%) | 40 (2.6%) |
| 75 Years and over | 374 (41.0%) | 135 (11.4%) |
Disability Class: Vision Difficulty
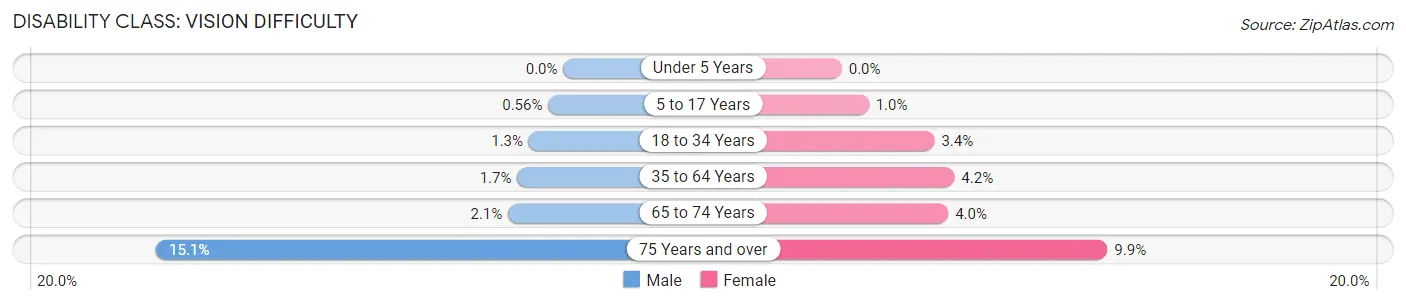
| Age Bracket | Male | Female |
| Under 5 Years | 0 (0.0%) | 0 (0.0%) |
| 5 to 17 Years | 14 (0.6%) | 37 (1.0%) |
| 18 to 34 Years | 74 (1.3%) | 197 (3.4%) |
| 35 to 64 Years | 120 (1.7%) | 242 (4.2%) |
| 65 to 74 Years | 21 (2.1%) | 61 (4.0%) |
| 75 Years and over | 138 (15.1%) | 117 (9.9%) |
Disability Class: Cognitive Difficulty
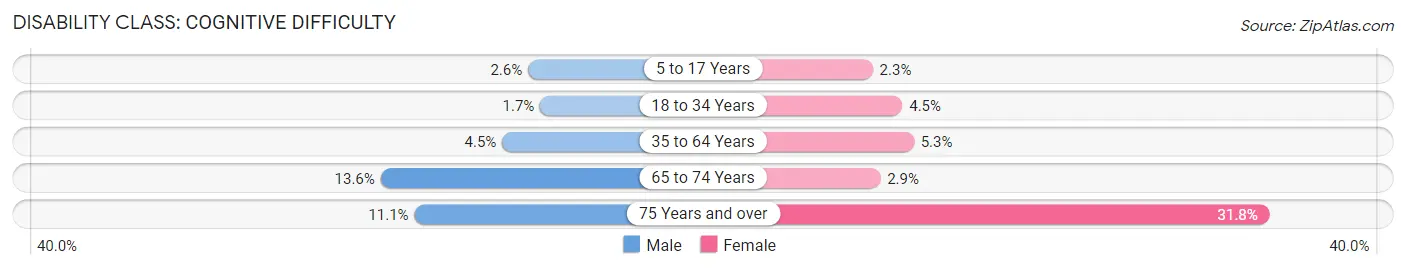
| Age Bracket | Male | Female |
| 5 to 17 Years | 66 (2.6%) | 85 (2.3%) |
| 18 to 34 Years | 99 (1.7%) | 257 (4.5%) |
| 35 to 64 Years | 318 (4.5%) | 309 (5.3%) |
| 65 to 74 Years | 139 (13.6%) | 44 (2.9%) |
| 75 Years and over | 101 (11.1%) | 377 (31.8%) |
Disability Class: Ambulatory Difficulty
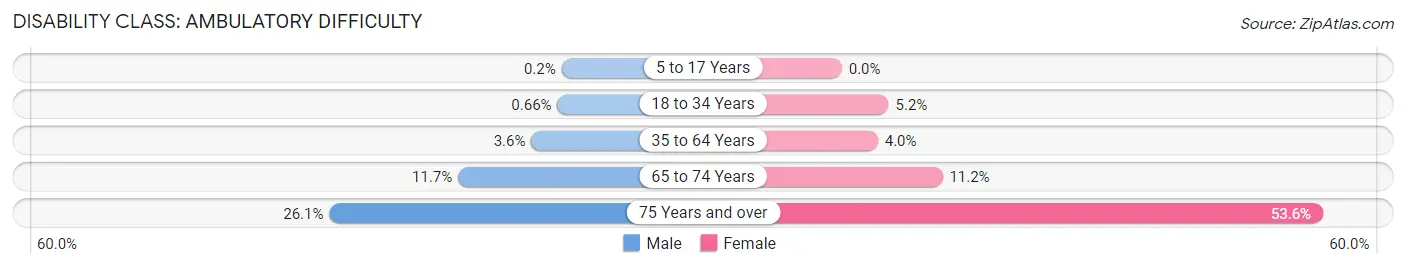
| Age Bracket | Male | Female |
| 5 to 17 Years | 5 (0.2%) | 0 (0.0%) |
| 18 to 34 Years | 38 (0.7%) | 298 (5.2%) |
| 35 to 64 Years | 250 (3.6%) | 232 (4.0%) |
| 65 to 74 Years | 120 (11.7%) | 173 (11.2%) |
| 75 Years and over | 238 (26.1%) | 636 (53.6%) |
Disability Class: Self-Care Difficulty
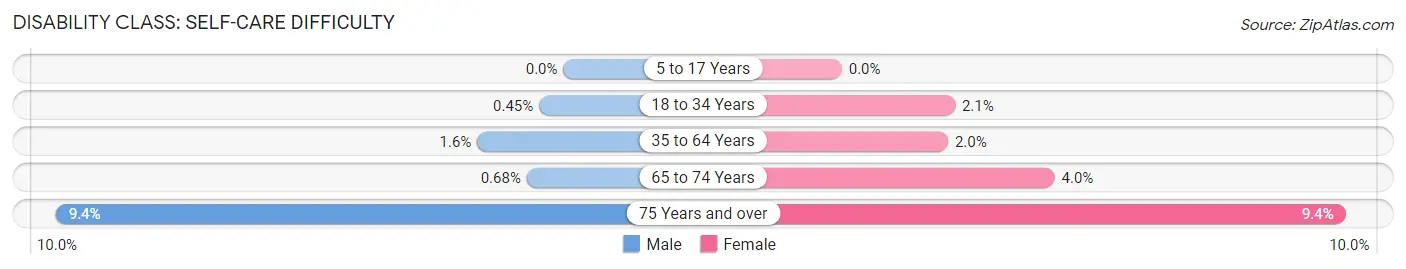
| Age Bracket | Male | Female |
| 5 to 17 Years | 0 (0.0%) | 0 (0.0%) |
| 18 to 34 Years | 26 (0.4%) | 120 (2.1%) |
| 35 to 64 Years | 112 (1.6%) | 114 (2.0%) |
| 65 to 74 Years | 7 (0.7%) | 61 (4.0%) |
| 75 Years and over | 86 (9.4%) | 111 (9.3%) |
Technology Access in Rosenberg
Computing Device Access in Rosenberg
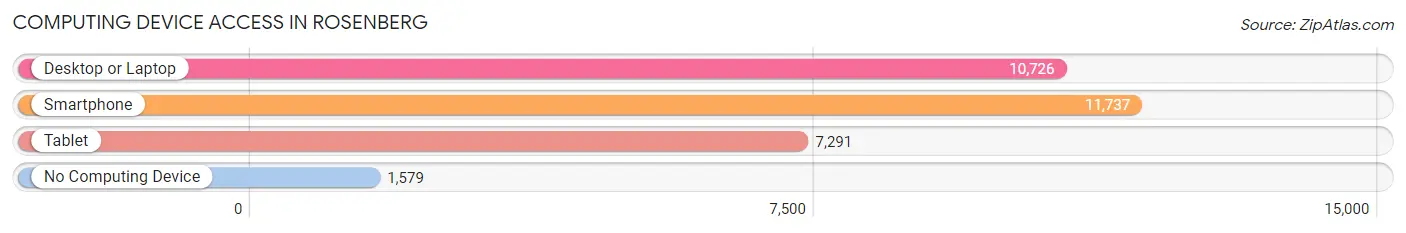
| Device Type | # Households | % Households |
| Desktop or Laptop | 10,726 | 74.8% |
| Smartphone | 11,737 | 81.8% |
| Tablet | 7,291 | 50.8% |
| No Computing Device | 1,579 | 11.0% |
| Total | 14,344 | 100.0% |
Internet Access in Rosenberg
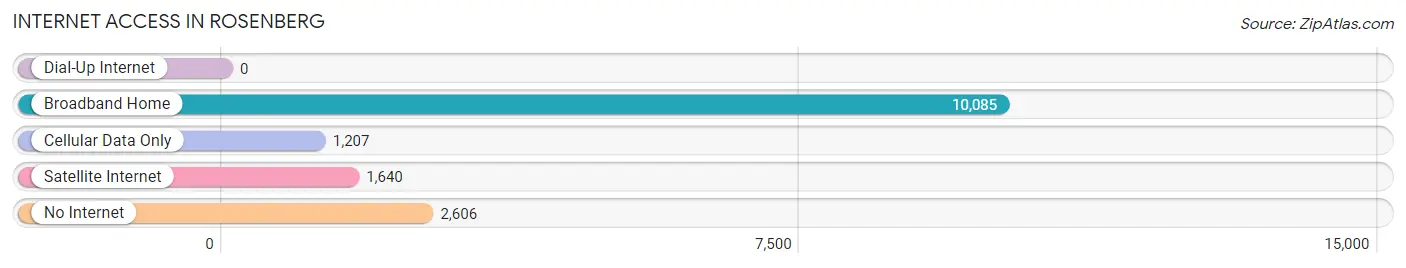
| Internet Type | # Households | % Households |
| Dial-Up Internet | 0 | 0.0% |
| Broadband Home | 10,085 | 70.3% |
| Cellular Data Only | 1,207 | 8.4% |
| Satellite Internet | 1,640 | 11.4% |
| No Internet | 2,606 | 18.2% |
| Total | 14,344 | 100.0% |
Rosenberg Summary
Rosenberg, Texas is a city located in Fort Bend County, Texas, United States. The city is located about 25 miles southwest of Houston and is part of the Greater Houston metropolitan area. As of the 2010 census, the city had a population of 30,618.
History
Rosenberg was founded in 1883 by Henry Rosenberg, a German immigrant who had come to the United States in 1848. He purchased land in the area and established a cotton gin and a general store. The town was named after him and was incorporated in 1891.
In the early 1900s, Rosenberg was a thriving agricultural center, with cotton, corn, and sugar cane being the main crops. The town also had a number of businesses, including a bank, a hotel, and a newspaper.
In the 1920s, the town began to experience a period of growth and development. The Rosenberg Railroad Depot was built in 1923, and the Rosenberg State Bank was established in 1925. The town also had a number of churches, schools, and other businesses.
In the 1950s, Rosenberg began to experience a period of decline. The railroad depot closed in 1954, and the Rosenberg State Bank closed in 1959. The town also experienced a population decline, as many people moved away to larger cities.
In the 1970s, Rosenberg began to experience a period of revitalization. The city was designated as a Main Street City in 1975, and the Rosenberg Historic District was established in 1978. The city also began to attract new businesses and industries, and the population began to grow again.
Geography
Rosenberg is located in southeastern Texas, about 25 miles southwest of Houston. The city is situated on the Brazos River, and is surrounded by prairie land. The climate is humid subtropical, with hot summers and mild winters.
Economy
Rosenberg’s economy is largely based on manufacturing and retail. The city is home to several manufacturing plants, including a steel mill, a plastics plant, and a paper mill. The city also has a number of retail stores, including a Walmart Supercenter, a Home Depot, and a Lowe’s.
The city is also home to a number of healthcare facilities, including a hospital, a nursing home, and a number of medical offices. The city also has a number of educational institutions, including a community college and a number of public and private schools.
Demographics
As of the 2010 census, the population of Rosenberg was 30,618. The racial makeup of the city was 63.3% White, 22.2% Hispanic or Latino, 11.2% African American, and 3.3% Asian.
The median household income in Rosenberg was $50,945, and the median family income was $60,945. The per capita income was $22,945. The poverty rate was 16.3%.
Rosenberg is a diverse city, with a variety of cultures and backgrounds. The city is home to a number of churches, including Baptist, Catholic, Methodist, and Presbyterian. The city also has a number of parks and recreational facilities, including a golf course, a swimming pool, and a skate park.
Common Questions
What is Per Capita Income in Rosenberg?
Per Capita income in Rosenberg is $26,854.
What is the Median Family Income in Rosenberg?
Median Family Income in Rosenberg is $75,698.
What is the Median Household income in Rosenberg?
Median Household Income in Rosenberg is $66,046.
What is Income or Wage Gap in Rosenberg?
Income or Wage Gap in Rosenberg is 34.1%.
Women in Rosenberg earn 65.9 cents for every dollar earned by a man.
What is Family Income Deficit in Rosenberg?
Family Income Deficit in Rosenberg is $14,126.
Families that are below poverty line in Rosenberg earn $14,126 less on average than the poverty threshold level.
What is Inequality or Gini Index in Rosenberg?
Inequality or Gini Index in Rosenberg is 0.39.
What is the Total Population of Rosenberg?
Total Population of Rosenberg is 38,722.
What is the Total Male Population of Rosenberg?
Total Male Population of Rosenberg is 18,750.
What is the Total Female Population of Rosenberg?
Total Female Population of Rosenberg is 19,972.
What is the Ratio of Males per 100 Females in Rosenberg?
There are 93.88 Males per 100 Females in Rosenberg.
What is the Ratio of Females per 100 Males in Rosenberg?
There are 106.52 Females per 100 Males in Rosenberg.
What is the Median Population Age in Rosenberg?
Median Population Age in Rosenberg is 31.2 Years.
What is the Average Family Size in Rosenberg
Average Family Size in Rosenberg is 3.4 People.
What is the Average Household Size in Rosenberg
Average Household Size in Rosenberg is 2.7 People.
How Large is the Labor Force in Rosenberg?
There are 19,483 People in the Labor Forcein in Rosenberg.
What is the Percentage of People in the Labor Force in Rosenberg?
65.1% of People are in the Labor Force in Rosenberg.
What is the Unemployment Rate in Rosenberg?
Unemployment Rate in Rosenberg is 3.4%.