Grapevine, TX Map & Demographics
Grapevine Map
Grapevine Overview
$57,706
PER CAPITA INCOME
$139,630
AVG FAMILY INCOME
$107,165
AVG HOUSEHOLD INCOME
18.3%
WAGE / INCOME GAP [ % ]
81.7¢/ $1
WAGE / INCOME GAP [ $ ]
0.43
INEQUALITY / GINI INDEX
50,763
TOTAL POPULATION
26,058
MALE POPULATION
24,705
FEMALE POPULATION
105.48
MALES / 100 FEMALES
94.81
FEMALES / 100 MALES
39.8
MEDIAN AGE
3.0
AVG FAMILY SIZE
2.4
AVG HOUSEHOLD SIZE
31,850
LABOR FORCE [ PEOPLE ]
76.9%
PERCENT IN LABOR FORCE
5.0%
UNEMPLOYMENT RATE
Grapevine Zip Codes
Income in Grapevine
Income Overview in Grapevine
Per Capita Income in Grapevine is $57,706, while median incomes of families and households are $139,630 and $107,165 respectively.
| Characteristic | Number | Measure |
| Per Capita Income | 50,763 | $57,706 |
| Median Family Income | 13,188 | $139,630 |
| Mean Family Income | 13,188 | $167,896 |
| Median Household Income | 21,383 | $107,165 |
| Mean Household Income | 21,383 | $136,021 |
| Income Deficit | 13,188 | $0 |
| Wage / Income Gap (%) | 50,763 | 18.32% |
| Wage / Income Gap ($) | 50,763 | 81.68¢ per $1 |
| Gini / Inequality Index | 50,763 | 0.43 |
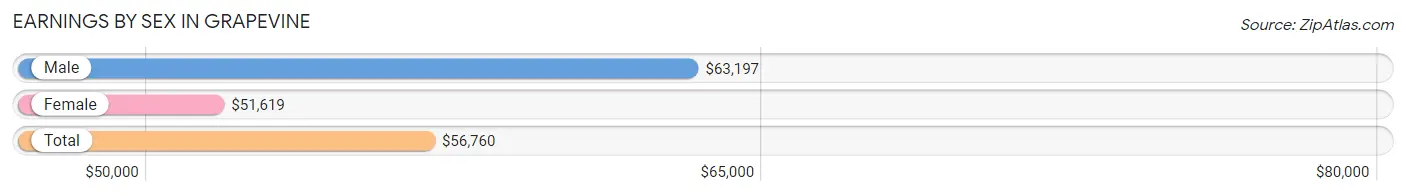
Earnings by Sex in Grapevine
Average Earnings in Grapevine are $56,760, $63,197 for men and $51,619 for women, a difference of 18.3%.
| Sex | Number | Average Earnings |
| Male | 17,731 (54.4%) | $63,197 |
| Female | 14,847 (45.6%) | $51,619 |
| Total | 32,578 (100.0%) | $56,760 |
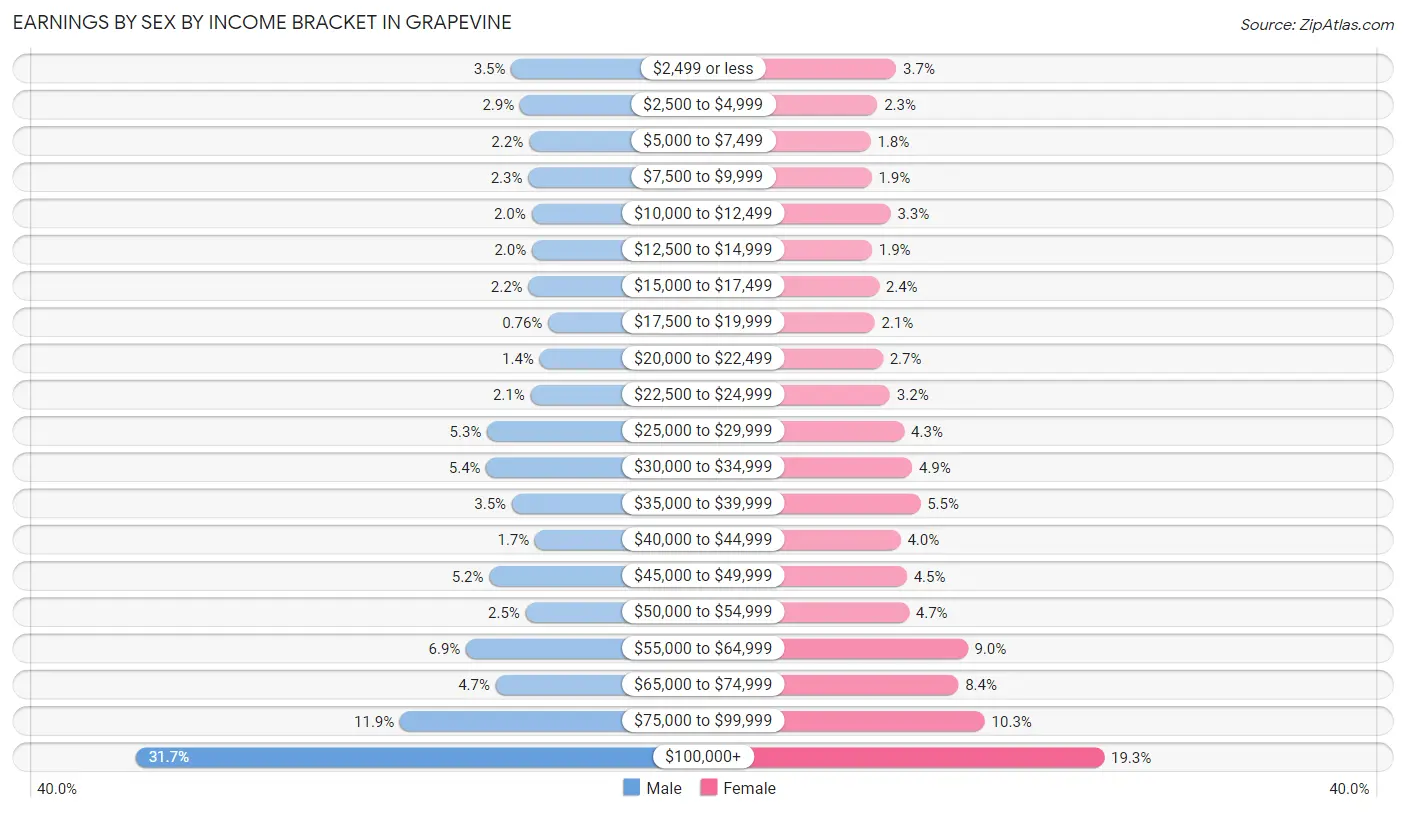
Earnings by Sex by Income Bracket in Grapevine
The most common earnings brackets in Grapevine are $100,000+ for men (5,616 | 31.7%) and $100,000+ for women (2,862 | 19.3%).
| Income | Male | Female |
| $2,499 or less | 624 (3.5%) | 550 (3.7%) |
| $2,500 to $4,999 | 509 (2.9%) | 338 (2.3%) |
| $5,000 to $7,499 | 390 (2.2%) | 264 (1.8%) |
| $7,500 to $9,999 | 399 (2.2%) | 274 (1.8%) |
| $10,000 to $12,499 | 356 (2.0%) | 485 (3.3%) |
| $12,500 to $14,999 | 349 (2.0%) | 279 (1.9%) |
| $15,000 to $17,499 | 398 (2.2%) | 356 (2.4%) |
| $17,500 to $19,999 | 134 (0.8%) | 309 (2.1%) |
| $20,000 to $22,499 | 248 (1.4%) | 399 (2.7%) |
| $22,500 to $24,999 | 369 (2.1%) | 479 (3.2%) |
| $25,000 to $29,999 | 945 (5.3%) | 639 (4.3%) |
| $30,000 to $34,999 | 956 (5.4%) | 726 (4.9%) |
| $35,000 to $39,999 | 617 (3.5%) | 816 (5.5%) |
| $40,000 to $44,999 | 308 (1.7%) | 597 (4.0%) |
| $45,000 to $49,999 | 917 (5.2%) | 667 (4.5%) |
| $50,000 to $54,999 | 435 (2.5%) | 691 (4.6%) |
| $55,000 to $64,999 | 1,226 (6.9%) | 1,342 (9.0%) |
| $65,000 to $74,999 | 832 (4.7%) | 1,240 (8.4%) |
| $75,000 to $99,999 | 2,103 (11.9%) | 1,534 (10.3%) |
| $100,000+ | 5,616 (31.7%) | 2,862 (19.3%) |
| Total | 17,731 (100.0%) | 14,847 (100.0%) |
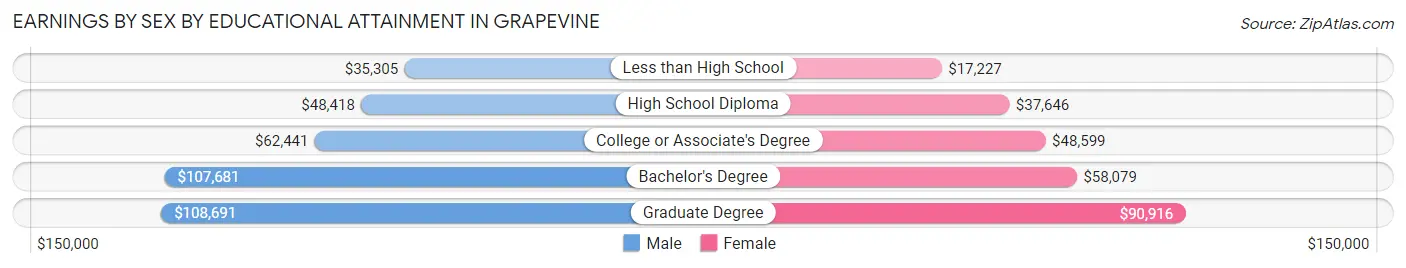
Earnings by Sex by Educational Attainment in Grapevine
Average earnings in Grapevine are $74,727 for men and $55,988 for women, a difference of 25.1%. Men with an educational attainment of graduate degree enjoy the highest average annual earnings of $108,691, while those with less than high school education earn the least with $35,305. Women with an educational attainment of graduate degree earn the most with the average annual earnings of $90,916, while those with less than high school education have the smallest earnings of $17,227.
| Educational Attainment | Male Income | Female Income |
| Less than High School | $35,305 | $17,227 |
| High School Diploma | $48,418 | $37,646 |
| College or Associate's Degree | $62,441 | $48,599 |
| Bachelor's Degree | $107,681 | $58,079 |
| Graduate Degree | $108,691 | $90,916 |
| Total | $74,727 | $55,988 |
Family Income in Grapevine
Family Income Brackets in Grapevine
According to the Grapevine family income data, there are 3,864 families falling into the $200,000+ income range, which is the most common income bracket and makes up 29.3% of all families. Conversely, the $10,000 to $14,999 income bracket is the least frequent group with only 79 families (0.6%) belonging to this category.
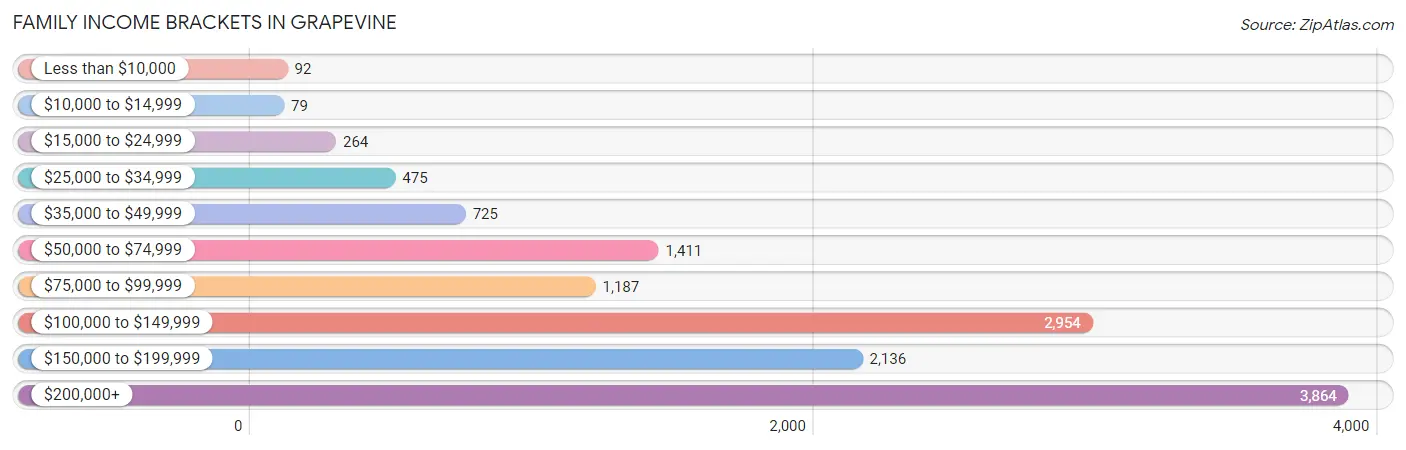
| Income Bracket | # Families | % Families |
| Less than $10,000 | 92 | 0.7% |
| $10,000 to $14,999 | 79 | 0.6% |
| $15,000 to $24,999 | 264 | 2.0% |
| $25,000 to $34,999 | 475 | 3.6% |
| $35,000 to $49,999 | 725 | 5.5% |
| $50,000 to $74,999 | 1,411 | 10.7% |
| $75,000 to $99,999 | 1,187 | 9.0% |
| $100,000 to $149,999 | 2,954 | 22.4% |
| $150,000 to $199,999 | 2,136 | 16.2% |
| $200,000+ | 3,864 | 29.3% |
Family Income by Famaliy Size in Grapevine
7+ person families (56 | 0.4%) account for the highest median family income in Grapevine with $238,182 per family, while 2-person families (6,558 | 49.7%) have the highest median income of $68,440 per family member.
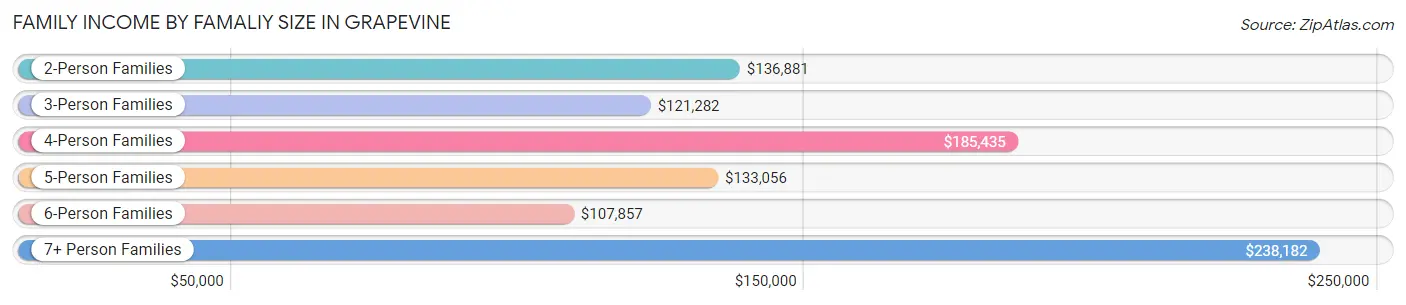
| Income Bracket | # Families | Median Income |
| 2-Person Families | 6,558 (49.7%) | $136,881 |
| 3-Person Families | 3,056 (23.2%) | $121,282 |
| 4-Person Families | 2,292 (17.4%) | $185,435 |
| 5-Person Families | 808 (6.1%) | $133,056 |
| 6-Person Families | 418 (3.2%) | $107,857 |
| 7+ Person Families | 56 (0.4%) | $238,182 |
| Total | 13,188 (100.0%) | $139,630 |
Family Income by Number of Earners in Grapevine
The median family income in Grapevine is $139,630, with families comprising 3+ earners (1,661) having the highest median family income of $202,639, while families with no earners (1,149) have the lowest median family income of $72,813, accounting for 12.6% and 8.7% of families, respectively.
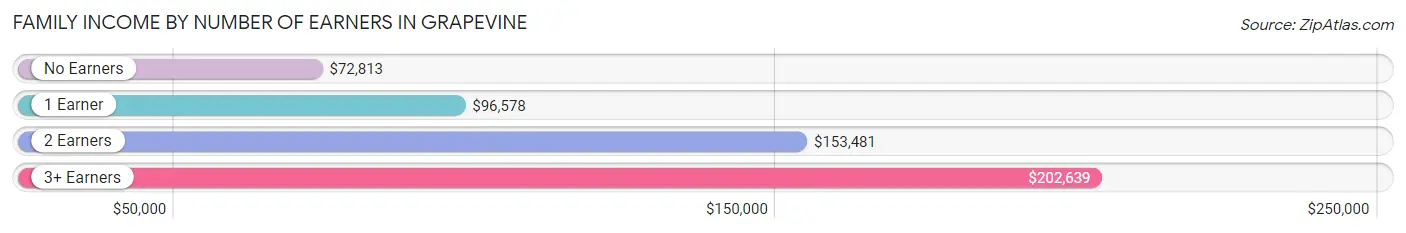
| Number of Earners | # Families | Median Income |
| No Earners | 1,149 (8.7%) | $72,813 |
| 1 Earner | 3,261 (24.7%) | $96,578 |
| 2 Earners | 7,117 (54.0%) | $153,481 |
| 3+ Earners | 1,661 (12.6%) | $202,639 |
| Total | 13,188 (100.0%) | $139,630 |
Household Income in Grapevine
Household Income Brackets in Grapevine
With 4,341 households falling in the category, the $200,000+ income range is the most frequent in Grapevine, accounting for 20.3% of all households. In contrast, only 364 households (1.7%) fall into the $10,000 to $14,999 income bracket, making it the least populous group.
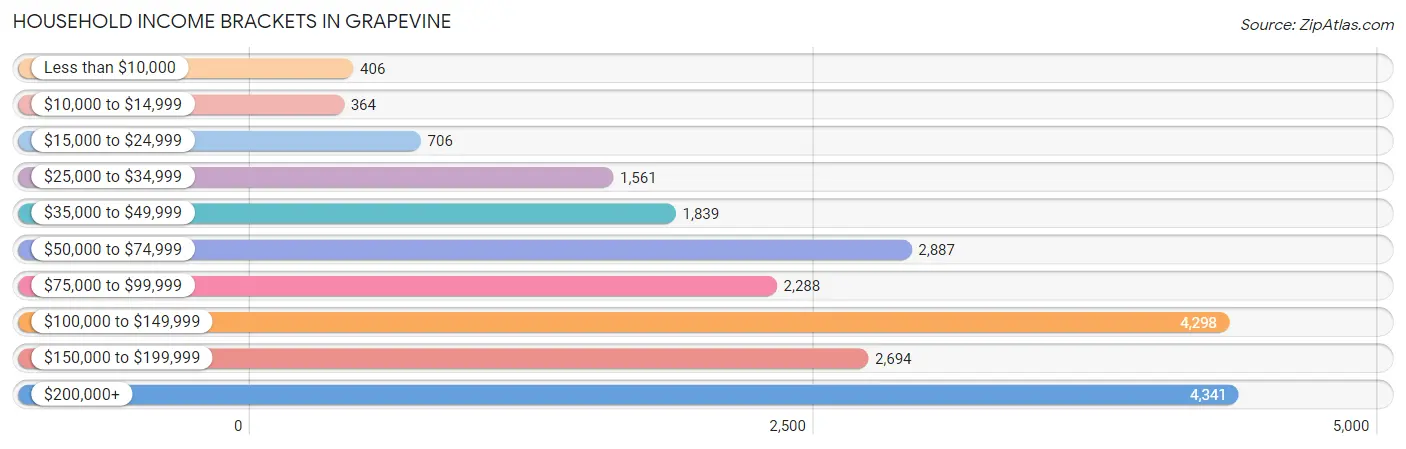
| Income Bracket | # Households | % Households |
| Less than $10,000 | 406 | 1.9% |
| $10,000 to $14,999 | 364 | 1.7% |
| $15,000 to $24,999 | 706 | 3.3% |
| $25,000 to $34,999 | 1,561 | 7.3% |
| $35,000 to $49,999 | 1,839 | 8.6% |
| $50,000 to $74,999 | 2,887 | 13.5% |
| $75,000 to $99,999 | 2,288 | 10.7% |
| $100,000 to $149,999 | 4,298 | 20.1% |
| $150,000 to $199,999 | 2,694 | 12.6% |
| $200,000+ | 4,341 | 20.3% |
Household Income by Householder Age in Grapevine
The median household income in Grapevine is $107,165, with the highest median household income of $129,884 found in the 45 to 64 years age bracket for the primary householder. A total of 9,337 households (43.7%) fall into this category. Meanwhile, the 15 to 24 years age bracket for the primary householder has the lowest median household income of $64,317, with 731 households (3.4%) in this group.
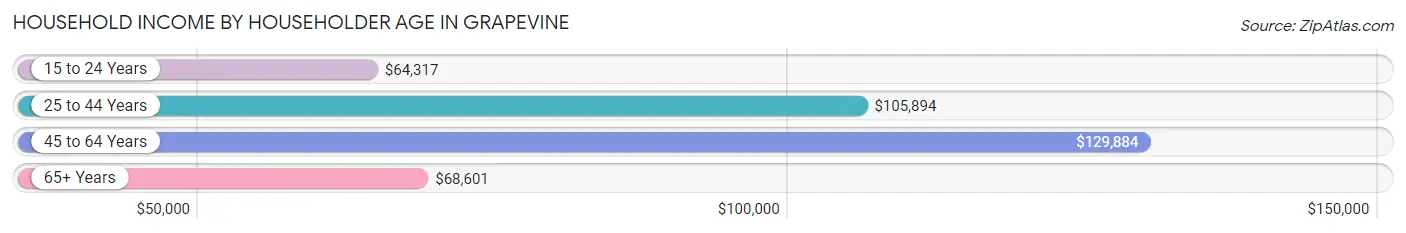
| Income Bracket | # Households | Median Income |
| 15 to 24 Years | 731 (3.4%) | $64,317 |
| 25 to 44 Years | 7,123 (33.3%) | $105,894 |
| 45 to 64 Years | 9,337 (43.7%) | $129,884 |
| 65+ Years | 4,192 (19.6%) | $68,601 |
| Total | 21,383 (100.0%) | $107,165 |
Poverty in Grapevine
Income Below Poverty by Sex and Age in Grapevine
With 5.9% poverty level for males and 5.5% for females among the residents of Grapevine, under 5 year old males and 35 to 44 year old females are the most vulnerable to poverty, with 165 males (12.4%) and 254 females (8.7%) in their respective age groups living below the poverty level.
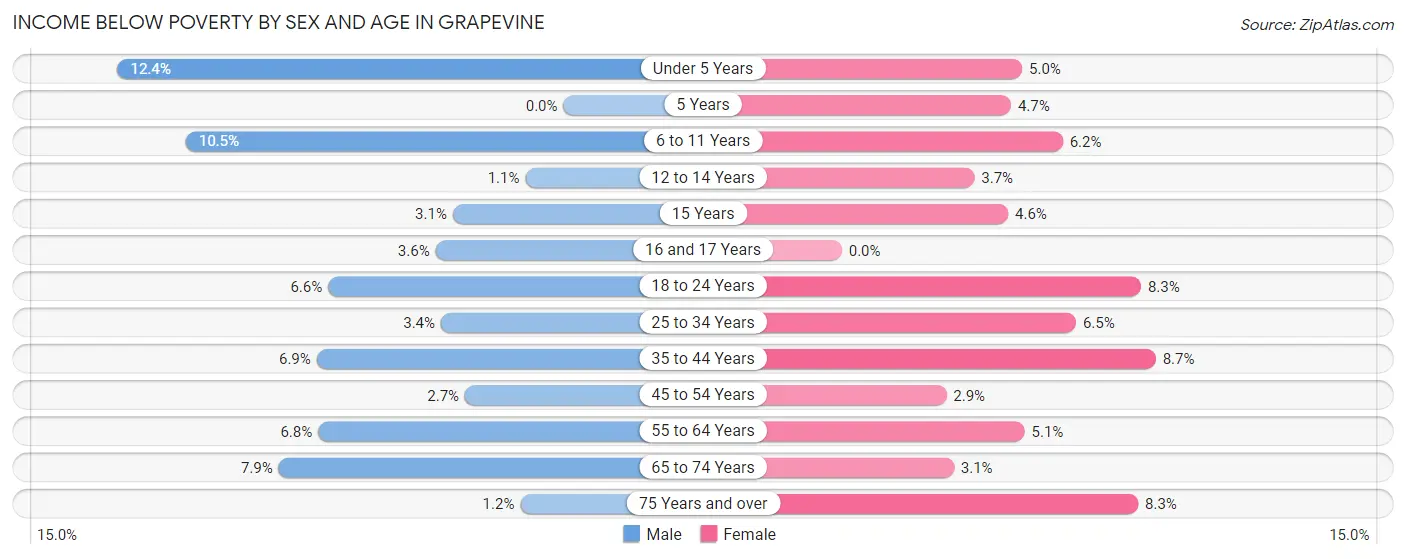
| Age Bracket | Male | Female |
| Under 5 Years | 165 (12.4%) | 66 (5.0%) |
| 5 Years | 0 (0.0%) | 18 (4.7%) |
| 6 to 11 Years | 226 (10.5%) | 103 (6.1%) |
| 12 to 14 Years | 9 (1.1%) | 30 (3.7%) |
| 15 Years | 9 (3.1%) | 10 (4.6%) |
| 16 and 17 Years | 21 (3.6%) | 0 (0.0%) |
| 18 to 24 Years | 166 (6.6%) | 132 (8.3%) |
| 25 to 34 Years | 129 (3.4%) | 243 (6.5%) |
| 35 to 44 Years | 250 (6.9%) | 254 (8.7%) |
| 45 to 54 Years | 95 (2.7%) | 117 (2.9%) |
| 55 to 64 Years | 281 (6.8%) | 196 (5.1%) |
| 65 to 74 Years | 171 (7.9%) | 60 (3.1%) |
| 75 Years and over | 10 (1.2%) | 126 (8.3%) |
| Total | 1,532 (5.9%) | 1,355 (5.5%) |
Income Above Poverty by Sex and Age in Grapevine
According to the poverty statistics in Grapevine, males aged 5 years and females aged 16 and 17 years are the age groups that are most secure financially, with 100.0% of males and 100.0% of females in these age groups living above the poverty line.
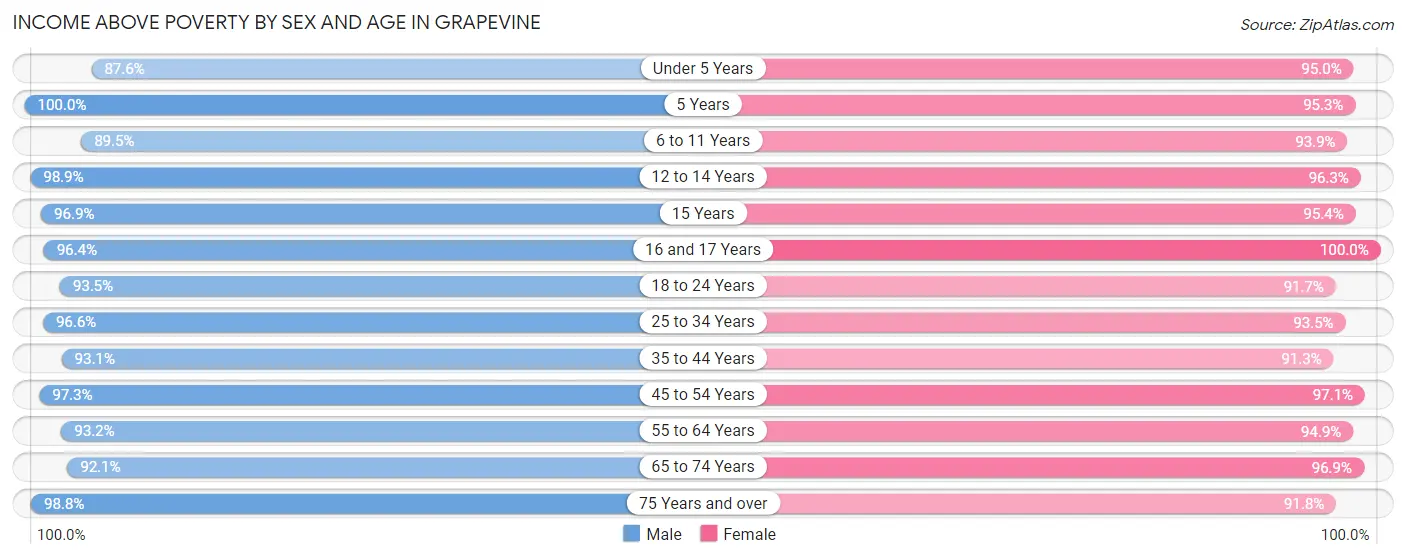
| Age Bracket | Male | Female |
| Under 5 Years | 1,165 (87.6%) | 1,249 (95.0%) |
| 5 Years | 247 (100.0%) | 364 (95.3%) |
| 6 to 11 Years | 1,924 (89.5%) | 1,573 (93.9%) |
| 12 to 14 Years | 837 (98.9%) | 783 (96.3%) |
| 15 Years | 283 (96.9%) | 206 (95.4%) |
| 16 and 17 Years | 569 (96.4%) | 534 (100.0%) |
| 18 to 24 Years | 2,368 (93.4%) | 1,452 (91.7%) |
| 25 to 34 Years | 3,659 (96.6%) | 3,486 (93.5%) |
| 35 to 44 Years | 3,387 (93.1%) | 2,653 (91.3%) |
| 45 to 54 Years | 3,376 (97.3%) | 3,907 (97.1%) |
| 55 to 64 Years | 3,833 (93.2%) | 3,653 (94.9%) |
| 65 to 74 Years | 1,986 (92.1%) | 1,860 (96.9%) |
| 75 Years and over | 824 (98.8%) | 1,401 (91.7%) |
| Total | 24,458 (94.1%) | 23,121 (94.5%) |
Income Below Poverty Among Married-Couple Families in Grapevine
The poverty statistics for married-couple families in Grapevine show that 2.5% or 262 of the total 10,680 families live below the poverty line. Families with 1 or 2 children have the highest poverty rate of 3.7%, comprising of 132 families. On the other hand, families with 5 or more children have the lowest poverty rate of 0.0%, which includes 0 families.
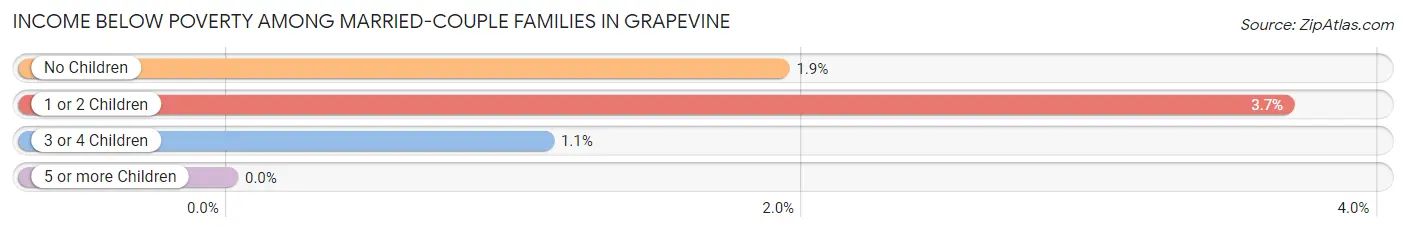
| Children | Above Poverty | Below Poverty |
| No Children | 6,231 (98.1%) | 122 (1.9%) |
| 1 or 2 Children | 3,455 (96.3%) | 132 (3.7%) |
| 3 or 4 Children | 721 (98.9%) | 8 (1.1%) |
| 5 or more Children | 11 (100.0%) | 0 (0.0%) |
| Total | 10,418 (97.6%) | 262 (2.5%) |
Income Below Poverty Among Single-Parent Households in Grapevine
According to the poverty data in Grapevine, 1.8% or 16 single-father households and 11.7% or 188 single-mother households are living below the poverty line. Among single-father households, those with 3 or 4 children have the highest poverty rate, with 16 households (36.4%) experiencing poverty. Likewise, among single-mother households, those with 3 or 4 children have the highest poverty rate, with 27 households (56.2%) falling below the poverty line.
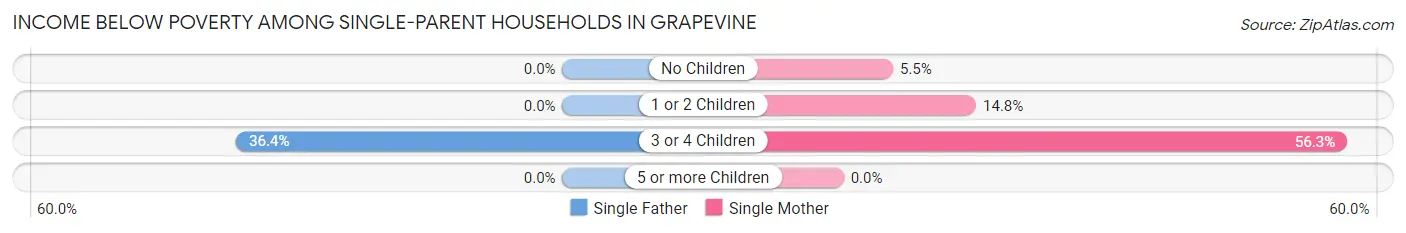
| Children | Single Father | Single Mother |
| No Children | 0 (0.0%) | 41 (5.5%) |
| 1 or 2 Children | 0 (0.0%) | 120 (14.8%) |
| 3 or 4 Children | 16 (36.4%) | 27 (56.2%) |
| 5 or more Children | 0 (0.0%) | 0 (0.0%) |
| Total | 16 (1.8%) | 188 (11.7%) |
Income Below Poverty Among Married-Couple vs Single-Parent Households in Grapevine
The poverty data for Grapevine shows that 262 of the married-couple family households (2.5%) and 204 of the single-parent households (8.1%) are living below the poverty level. Within the married-couple family households, those with 1 or 2 children have the highest poverty rate, with 132 households (3.7%) falling below the poverty line. Among the single-parent households, those with 3 or 4 children have the highest poverty rate, with 43 household (46.7%) living below poverty.
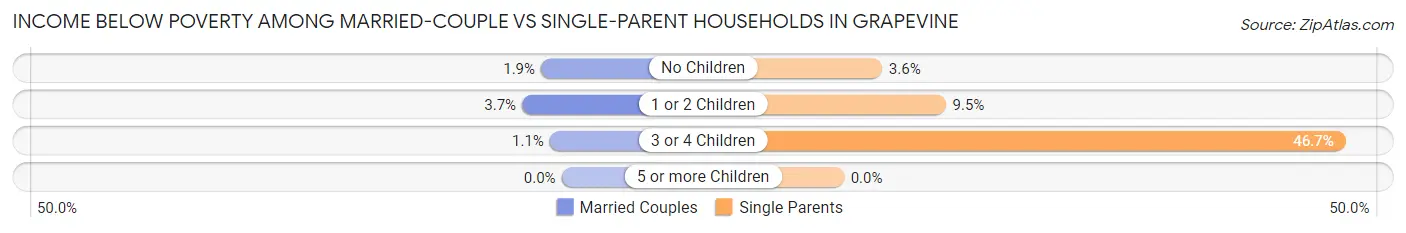
| Children | Married-Couple Families | Single-Parent Households |
| No Children | 122 (1.9%) | 41 (3.6%) |
| 1 or 2 Children | 132 (3.7%) | 120 (9.5%) |
| 3 or 4 Children | 8 (1.1%) | 43 (46.7%) |
| 5 or more Children | 0 (0.0%) | 0 (0.0%) |
| Total | 262 (2.5%) | 204 (8.1%) |
Race in Grapevine
The most populous races in Grapevine are White / Caucasian (36,977 | 72.8%), Hispanic or Latino (9,917 | 19.5%), and Two or more Races (4,812 | 9.5%).
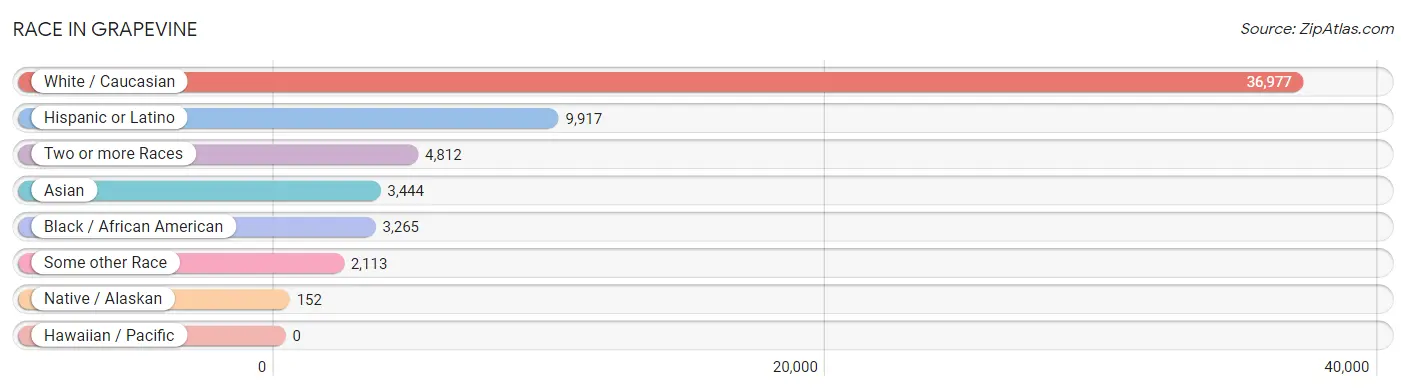
| Race | # Population | % Population |
| Asian | 3,444 | 6.8% |
| Black / African American | 3,265 | 6.4% |
| Hawaiian / Pacific | 0 | 0.0% |
| Hispanic or Latino | 9,917 | 19.5% |
| Native / Alaskan | 152 | 0.3% |
| White / Caucasian | 36,977 | 72.8% |
| Two or more Races | 4,812 | 9.5% |
| Some other Race | 2,113 | 4.2% |
| Total | 50,763 | 100.0% |
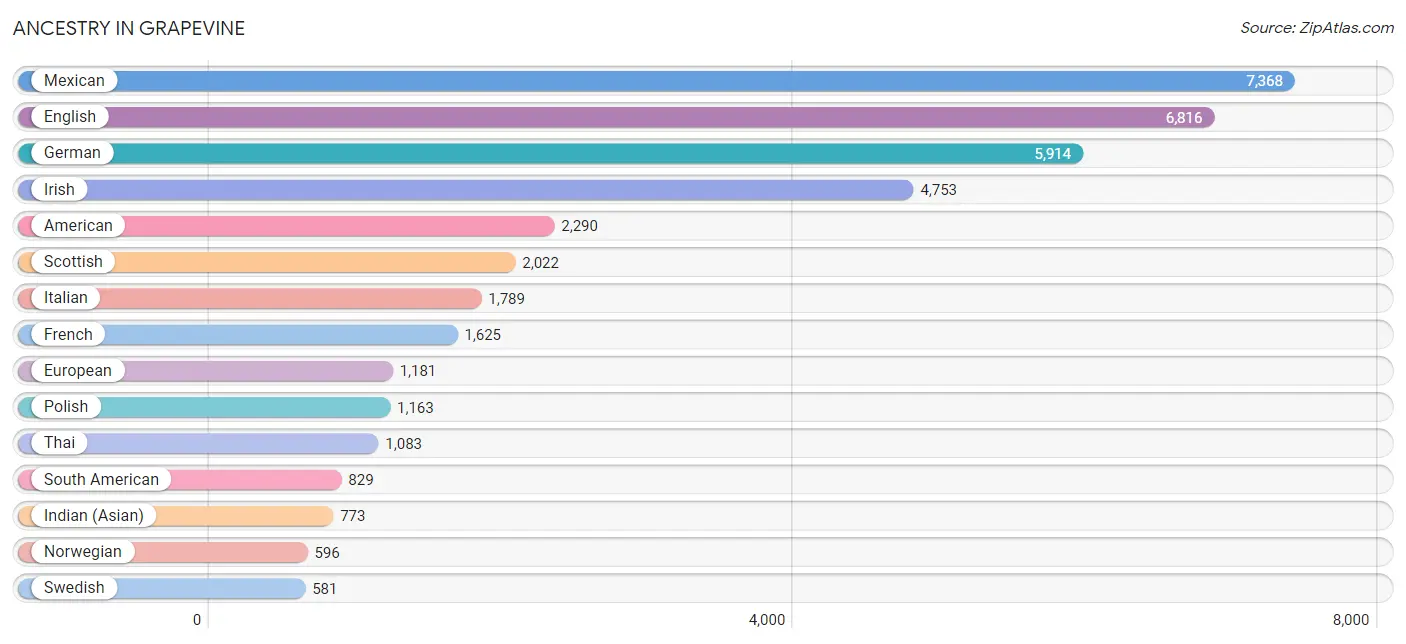
Ancestry in Grapevine
The most populous ancestries reported in Grapevine are Mexican (7,368 | 14.5%), English (6,816 | 13.4%), German (5,914 | 11.7%), Irish (4,753 | 9.4%), and American (2,290 | 4.5%), together accounting for 53.5% of all Grapevine residents.
| Ancestry | # Population | % Population |
| African | 262 | 0.5% |
| American | 2,290 | 4.5% |
| Arab | 302 | 0.6% |
| Armenian | 21 | 0.0% |
| Australian | 22 | 0.0% |
| Austrian | 126 | 0.3% |
| Belgian | 12 | 0.0% |
| Belizean | 18 | 0.0% |
| Bhutanese | 239 | 0.5% |
| Blackfeet | 22 | 0.0% |
| Brazilian | 155 | 0.3% |
| British | 504 | 1.0% |
| Burmese | 563 | 1.1% |
| Cajun | 13 | 0.0% |
| Cambodian | 20 | 0.0% |
| Canadian | 95 | 0.2% |
| Celtic | 67 | 0.1% |
| Central American | 403 | 0.8% |
| Central American Indian | 28 | 0.1% |
| Cherokee | 287 | 0.6% |
| Chilean | 6 | 0.0% |
| Chippewa | 6 | 0.0% |
| Choctaw | 31 | 0.1% |
| Colombian | 382 | 0.7% |
| Costa Rican | 46 | 0.1% |
| Croatian | 9 | 0.0% |
| Cuban | 57 | 0.1% |
| Czech | 157 | 0.3% |
| Czechoslovakian | 22 | 0.0% |
| Danish | 294 | 0.6% |
| Dominican | 173 | 0.3% |
| Dutch | 564 | 1.1% |
| Eastern European | 59 | 0.1% |
| Ecuadorian | 325 | 0.6% |
| Egyptian | 230 | 0.4% |
| English | 6,816 | 13.4% |
| Estonian | 9 | 0.0% |
| European | 1,181 | 2.3% |
| Filipino | 21 | 0.0% |
| Finnish | 332 | 0.6% |
| French | 1,625 | 3.2% |
| French Canadian | 131 | 0.3% |
| German | 5,914 | 11.7% |
| Greek | 95 | 0.2% |
| Guatemalan | 261 | 0.5% |
| Guyanese | 22 | 0.0% |
| Haitian | 49 | 0.1% |
| Honduran | 34 | 0.1% |
| Hungarian | 73 | 0.1% |
| Indian (Asian) | 773 | 1.5% |
| Indonesian | 62 | 0.1% |
| Inupiat | 64 | 0.1% |
| Iranian | 133 | 0.3% |
| Irish | 4,753 | 9.4% |
| Italian | 1,789 | 3.5% |
| Jamaican | 151 | 0.3% |
| Japanese | 29 | 0.1% |
| Korean | 336 | 0.7% |
| Lebanese | 68 | 0.1% |
| Lithuanian | 77 | 0.2% |
| Mexican | 7,368 | 14.5% |
| Native Hawaiian | 54 | 0.1% |
| Nicaraguan | 29 | 0.1% |
| Nigerian | 58 | 0.1% |
| Northern European | 138 | 0.3% |
| Norwegian | 596 | 1.2% |
| Osage | 19 | 0.0% |
| Pakistani | 67 | 0.1% |
| Peruvian | 44 | 0.1% |
| Polish | 1,163 | 2.3% |
| Portuguese | 175 | 0.3% |
| Pueblo | 18 | 0.0% |
| Puerto Rican | 476 | 0.9% |
| Romanian | 104 | 0.2% |
| Russian | 141 | 0.3% |
| Salvadoran | 33 | 0.1% |
| Samoan | 31 | 0.1% |
| Scandinavian | 136 | 0.3% |
| Scotch-Irish | 513 | 1.0% |
| Scottish | 2,022 | 4.0% |
| Slavic | 3 | 0.0% |
| Slovak | 294 | 0.6% |
| Slovene | 16 | 0.0% |
| South African | 24 | 0.1% |
| South American | 829 | 1.6% |
| South American Indian | 20 | 0.0% |
| Spaniard | 215 | 0.4% |
| Spanish | 195 | 0.4% |
| Sri Lankan | 356 | 0.7% |
| Subsaharan African | 507 | 1.0% |
| Swedish | 581 | 1.1% |
| Swiss | 44 | 0.1% |
| Thai | 1,083 | 2.1% |
| Trinidadian and Tobagonian | 24 | 0.1% |
| Ukrainian | 147 | 0.3% |
| Venezuelan | 72 | 0.1% |
| Welsh | 246 | 0.5% |
| West Indian | 8 | 0.0% | View All 98 Rows |
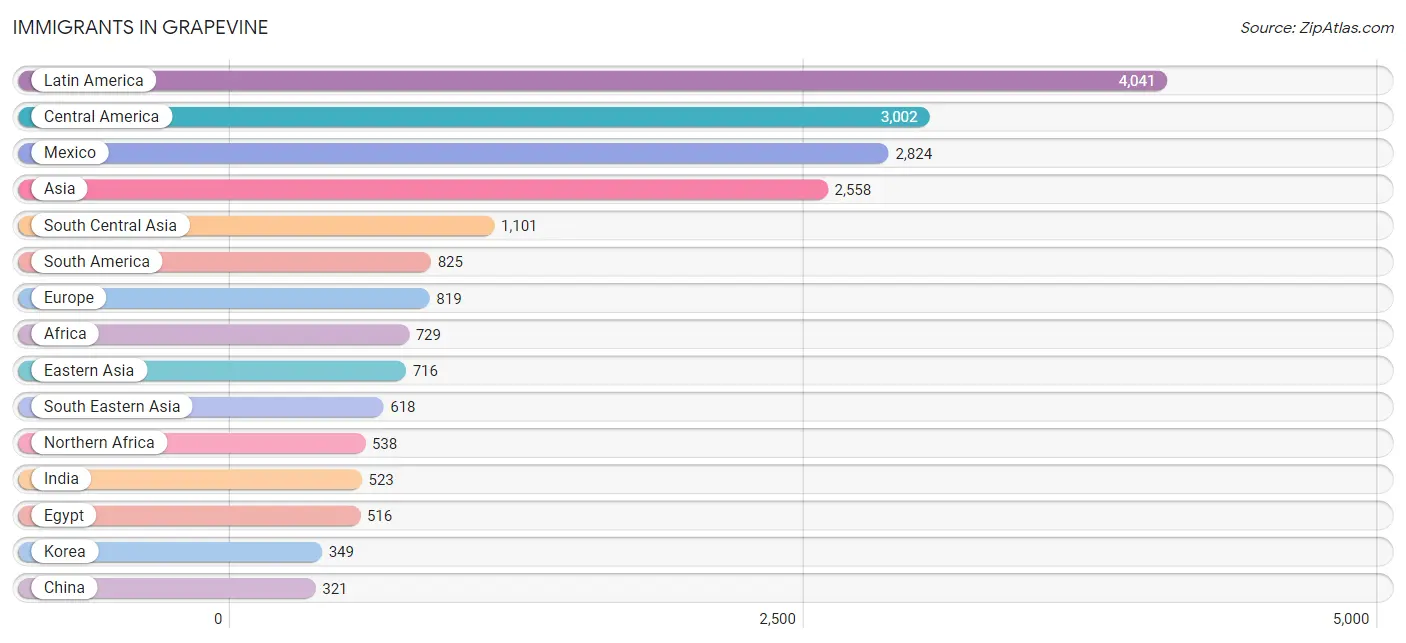
Immigrants in Grapevine
The most numerous immigrant groups reported in Grapevine came from Latin America (4,041 | 8.0%), Central America (3,002 | 5.9%), Mexico (2,824 | 5.6%), Asia (2,558 | 5.0%), and South Central Asia (1,101 | 2.2%), together accounting for 26.6% of all Grapevine residents.
| Immigration Origin | # Population | % Population |
| Afghanistan | 26 | 0.1% |
| Africa | 729 | 1.4% |
| Asia | 2,558 | 5.0% |
| Australia | 70 | 0.1% |
| Austria | 97 | 0.2% |
| Bangladesh | 84 | 0.2% |
| Belize | 18 | 0.0% |
| Brazil | 174 | 0.3% |
| Cambodia | 17 | 0.0% |
| Canada | 54 | 0.1% |
| Caribbean | 214 | 0.4% |
| Central America | 3,002 | 5.9% |
| Chile | 32 | 0.1% |
| China | 321 | 0.6% |
| Colombia | 224 | 0.4% |
| Costa Rica | 9 | 0.0% |
| Cuba | 9 | 0.0% |
| Denmark | 131 | 0.3% |
| Dominican Republic | 86 | 0.2% |
| Eastern Africa | 55 | 0.1% |
| Eastern Asia | 716 | 1.4% |
| Eastern Europe | 163 | 0.3% |
| Ecuador | 264 | 0.5% |
| Egypt | 516 | 1.0% |
| El Salvador | 33 | 0.1% |
| Europe | 819 | 1.6% |
| France | 17 | 0.0% |
| Germany | 74 | 0.2% |
| Guatemala | 84 | 0.2% |
| Guyana | 22 | 0.0% |
| Haiti | 49 | 0.1% |
| Honduras | 34 | 0.1% |
| Hong Kong | 6 | 0.0% |
| Hungary | 10 | 0.0% |
| India | 523 | 1.0% |
| Indonesia | 10 | 0.0% |
| Iran | 76 | 0.2% |
| Israel | 22 | 0.0% |
| Italy | 84 | 0.2% |
| Jamaica | 42 | 0.1% |
| Japan | 46 | 0.1% |
| Kenya | 55 | 0.1% |
| Korea | 349 | 0.7% |
| Latin America | 4,041 | 8.0% |
| Lebanon | 21 | 0.0% |
| Malaysia | 34 | 0.1% |
| Mexico | 2,824 | 5.6% |
| Middle Africa | 116 | 0.2% |
| Nepal | 148 | 0.3% |
| Netherlands | 30 | 0.1% |
| Nigeria | 12 | 0.0% |
| Northern Africa | 538 | 1.1% |
| Northern Europe | 304 | 0.6% |
| Oceania | 70 | 0.1% |
| Pakistan | 238 | 0.5% |
| Peru | 37 | 0.1% |
| Philippines | 180 | 0.4% |
| Poland | 28 | 0.1% |
| Portugal | 12 | 0.0% |
| Romania | 50 | 0.1% |
| Russia | 12 | 0.0% |
| Singapore | 109 | 0.2% |
| South Africa | 8 | 0.0% |
| South America | 825 | 1.6% |
| South Central Asia | 1,101 | 2.2% |
| South Eastern Asia | 618 | 1.2% |
| Southern Europe | 134 | 0.3% |
| Spain | 38 | 0.1% |
| Sri Lanka | 6 | 0.0% |
| Taiwan | 81 | 0.2% |
| Thailand | 44 | 0.1% |
| Trinidad and Tobago | 28 | 0.1% |
| Ukraine | 63 | 0.1% |
| Venezuela | 72 | 0.1% |
| Vietnam | 162 | 0.3% |
| Western Africa | 12 | 0.0% |
| Western Asia | 123 | 0.2% |
| Western Europe | 218 | 0.4% |
| Zaire | 59 | 0.1% | View All 79 Rows |
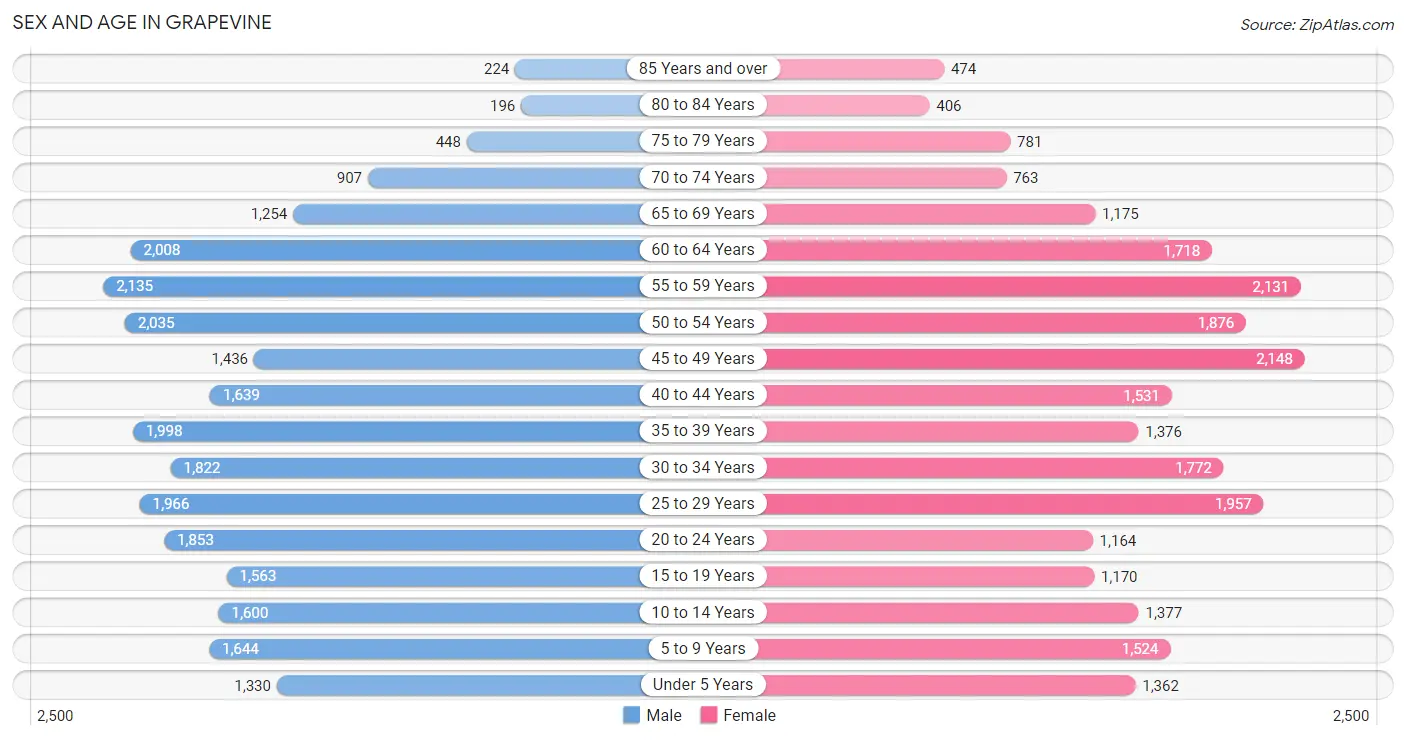
Sex and Age in Grapevine
Sex and Age in Grapevine
The most populous age groups in Grapevine are 55 to 59 Years (2,135 | 8.2%) for men and 45 to 49 Years (2,148 | 8.7%) for women.
| Age Bracket | Male | Female |
| Under 5 Years | 1,330 (5.1%) | 1,362 (5.5%) |
| 5 to 9 Years | 1,644 (6.3%) | 1,524 (6.2%) |
| 10 to 14 Years | 1,600 (6.1%) | 1,377 (5.6%) |
| 15 to 19 Years | 1,563 (6.0%) | 1,170 (4.7%) |
| 20 to 24 Years | 1,853 (7.1%) | 1,164 (4.7%) |
| 25 to 29 Years | 1,966 (7.5%) | 1,957 (7.9%) |
| 30 to 34 Years | 1,822 (7.0%) | 1,772 (7.2%) |
| 35 to 39 Years | 1,998 (7.7%) | 1,376 (5.6%) |
| 40 to 44 Years | 1,639 (6.3%) | 1,531 (6.2%) |
| 45 to 49 Years | 1,436 (5.5%) | 2,148 (8.7%) |
| 50 to 54 Years | 2,035 (7.8%) | 1,876 (7.6%) |
| 55 to 59 Years | 2,135 (8.2%) | 2,131 (8.6%) |
| 60 to 64 Years | 2,008 (7.7%) | 1,718 (7.0%) |
| 65 to 69 Years | 1,254 (4.8%) | 1,175 (4.8%) |
| 70 to 74 Years | 907 (3.5%) | 763 (3.1%) |
| 75 to 79 Years | 448 (1.7%) | 781 (3.2%) |
| 80 to 84 Years | 196 (0.7%) | 406 (1.6%) |
| 85 Years and over | 224 (0.9%) | 474 (1.9%) |
| Total | 26,058 (100.0%) | 24,705 (100.0%) |
Families and Households in Grapevine
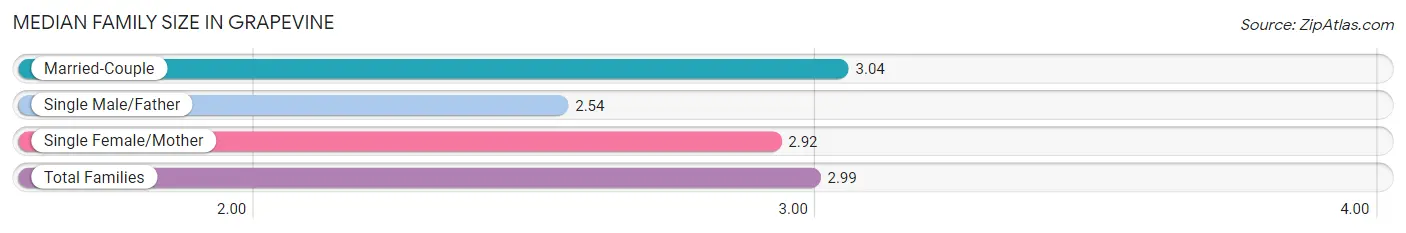
Median Family Size in Grapevine
The median family size in Grapevine is 2.99 persons per family, with married-couple families (10,680 | 81.0%) accounting for the largest median family size of 3.04 persons per family. On the other hand, single male/father families (906 | 6.9%) represent the smallest median family size with 2.54 persons per family.
| Family Type | # Families | Family Size |
| Married-Couple | 10,680 (81.0%) | 3.04 |
| Single Male/Father | 906 (6.9%) | 2.54 |
| Single Female/Mother | 1,602 (12.1%) | 2.92 |
| Total Families | 13,188 (100.0%) | 2.99 |
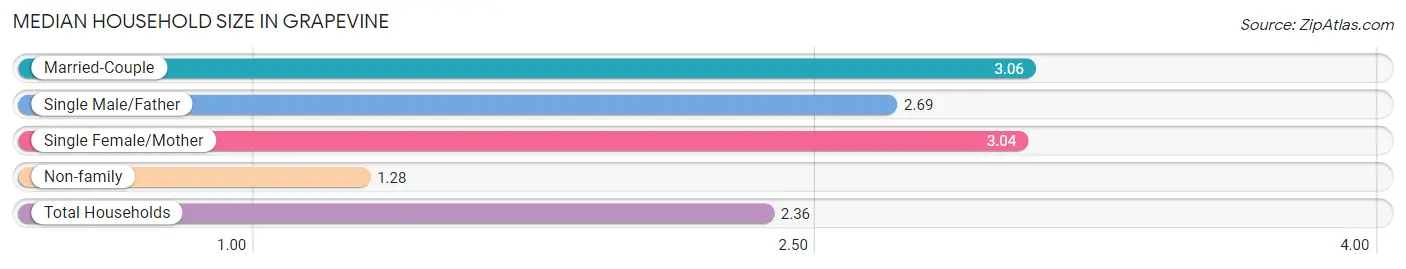
Median Household Size in Grapevine
The median household size in Grapevine is 2.36 persons per household, with married-couple households (10,680 | 49.9%) accounting for the largest median household size of 3.06 persons per household. non-family households (8,195 | 38.3%) represent the smallest median household size with 1.28 persons per household.
| Household Type | # Households | Household Size |
| Married-Couple | 10,680 (49.9%) | 3.06 |
| Single Male/Father | 906 (4.2%) | 2.69 |
| Single Female/Mother | 1,602 (7.5%) | 3.04 |
| Non-family | 8,195 (38.3%) | 1.28 |
| Total Households | 21,383 (100.0%) | 2.36 |
Household Size by Marriage Status in Grapevine
Out of a total of 21,383 households in Grapevine, 13,188 (61.7%) are family households, while 8,195 (38.3%) are nonfamily households. The most numerous type of family households are 2-person households, comprising 6,320, and the most common type of nonfamily households are 1-person households, comprising 6,434.
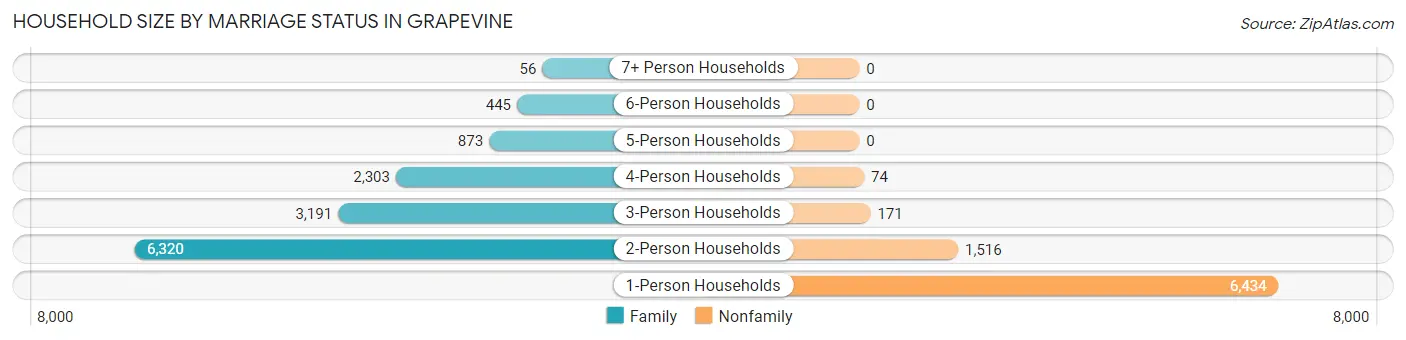
| Household Size | Family Households | Nonfamily Households |
| 1-Person Households | - | 6,434 (30.1%) |
| 2-Person Households | 6,320 (29.6%) | 1,516 (7.1%) |
| 3-Person Households | 3,191 (14.9%) | 171 (0.8%) |
| 4-Person Households | 2,303 (10.8%) | 74 (0.4%) |
| 5-Person Households | 873 (4.1%) | 0 (0.0%) |
| 6-Person Households | 445 (2.1%) | 0 (0.0%) |
| 7+ Person Households | 56 (0.3%) | 0 (0.0%) |
| Total | 13,188 (61.7%) | 8,195 (38.3%) |
Female Fertility in Grapevine
Fertility by Age in Grapevine
Average fertility rate in Grapevine is 45.0 births per 1,000 women. Women in the age bracket of 20 to 34 years have the highest fertility rate with 80.0 births per 1,000 women. Women in the age bracket of 20 to 34 years acount for 75.3% of all women with births.
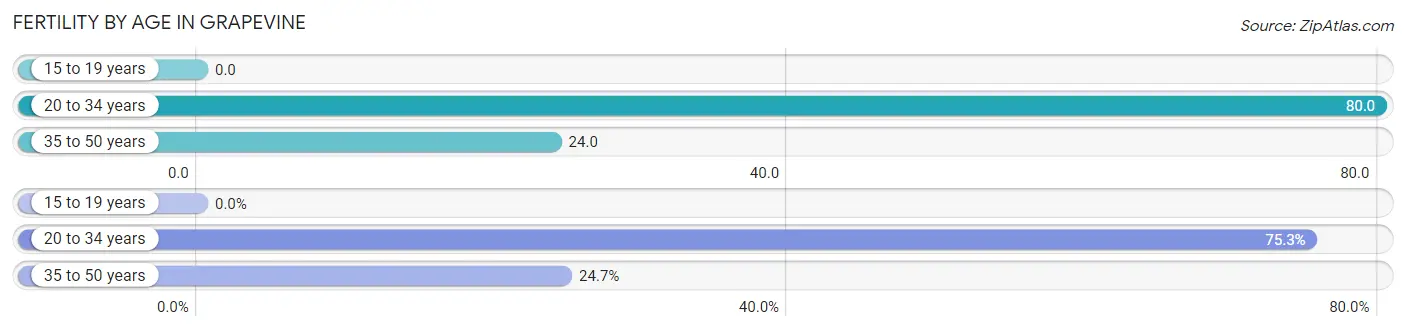
| Age Bracket | Women with Births | Births / 1,000 Women |
| 15 to 19 years | 0 (0.0%) | 0.0 |
| 20 to 34 years | 390 (75.3%) | 80.0 |
| 35 to 50 years | 128 (24.7%) | 24.0 |
| Total | 518 (100.0%) | 45.0 |
Fertility by Age by Marriage Status in Grapevine
79.0% of women with births (518) in Grapevine are married. The highest percentage of unmarried women with births falls into 35 to 50 years age bracket with 28.1% of them unmarried at the time of birth, while the lowest percentage of unmarried women with births belong to 20 to 34 years age bracket with 18.7% of them unmarried.
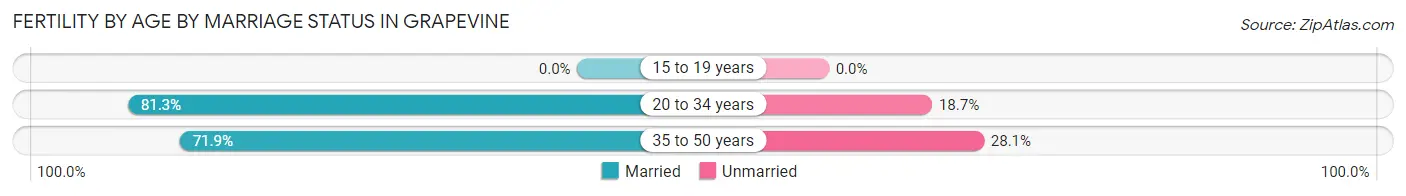
| Age Bracket | Married | Unmarried |
| 15 to 19 years | 0 (0.0%) | 0 (0.0%) |
| 20 to 34 years | 317 (81.3%) | 73 (18.7%) |
| 35 to 50 years | 92 (71.9%) | 36 (28.1%) |
| Total | 409 (79.0%) | 109 (21.0%) |
Fertility by Education in Grapevine
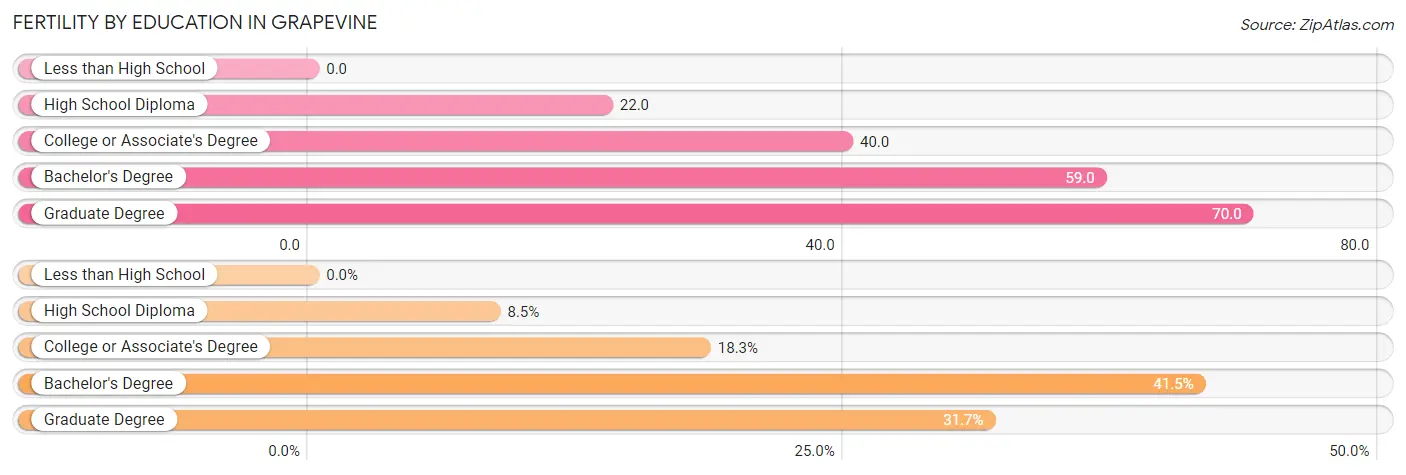
| Educational Attainment | Women with Births | Births / 1,000 Women |
| Less than High School | 0 (0.0%) | 0.0 |
| High School Diploma | 44 (8.5%) | 22.0 |
| College or Associate's Degree | 95 (18.3%) | 40.0 |
| Bachelor's Degree | 215 (41.5%) | 59.0 |
| Graduate Degree | 164 (31.7%) | 70.0 |
| Total | 518 (100.0%) | 45.0 |
Fertility by Education by Marriage Status in Grapevine
21.0% of women with births in Grapevine are unmarried. Women with the educational attainment of graduate degree are most likely to be married with 100.0% of them married at childbirth, while women with the educational attainment of high school diploma are least likely to be married with 65.9% of them unmarried at childbirth.

| Educational Attainment | Married | Unmarried |
| Less than High School | 0 (0.0%) | 0 (0.0%) |
| High School Diploma | 15 (34.1%) | 29 (65.9%) |
| College or Associate's Degree | 74 (77.9%) | 21 (22.1%) |
| Bachelor's Degree | 156 (72.6%) | 59 (27.4%) |
| Graduate Degree | 164 (100.0%) | 0 (0.0%) |
| Total | 409 (79.0%) | 109 (21.0%) |
Employment Characteristics in Grapevine
Employment by Class of Employer in Grapevine
Among the 29,490 employed individuals in Grapevine, private company employees (22,029 | 74.7%), local government employees (1,809 | 6.1%), and not-for-profit organizations (1,544 | 5.2%) make up the most common classes of employment.
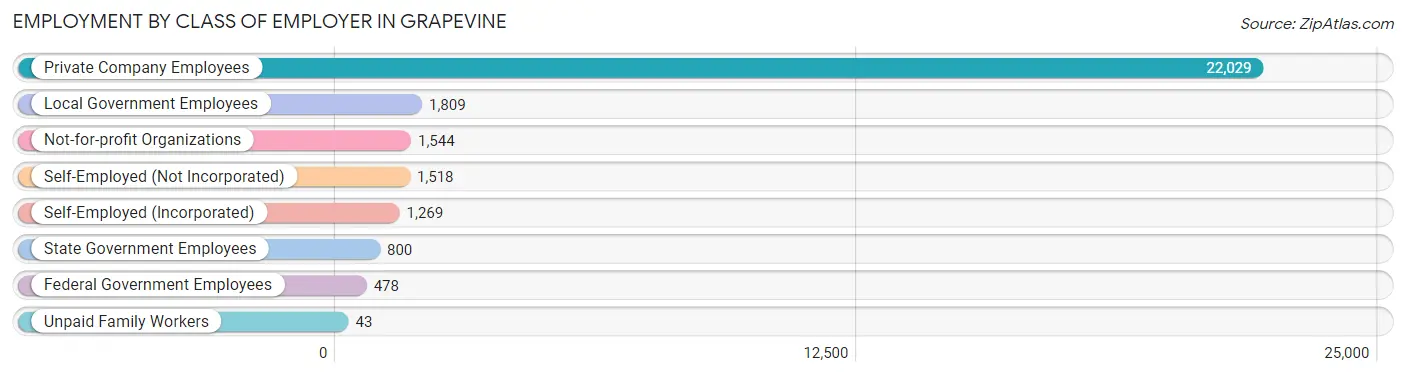
| Employer Class | # Employees | % Employees |
| Private Company Employees | 22,029 | 74.7% |
| Self-Employed (Incorporated) | 1,269 | 4.3% |
| Self-Employed (Not Incorporated) | 1,518 | 5.1% |
| Not-for-profit Organizations | 1,544 | 5.2% |
| Local Government Employees | 1,809 | 6.1% |
| State Government Employees | 800 | 2.7% |
| Federal Government Employees | 478 | 1.6% |
| Unpaid Family Workers | 43 | 0.2% |
| Total | 29,490 | 100.0% |
Employment Status by Age in Grapevine
According to the labor force statistics for Grapevine, out of the total population over 16 years of age (41,418), 76.9% or 31,850 individuals are in the labor force, with 5.0% or 1,592 of them unemployed. The age group with the highest labor force participation rate is 25 to 29 years, with 94.8% or 3,719 individuals in the labor force. Within the labor force, the 16 to 19 years age range has the highest percentage of unemployed individuals, with 17.3% or 178 of them being unemployed.
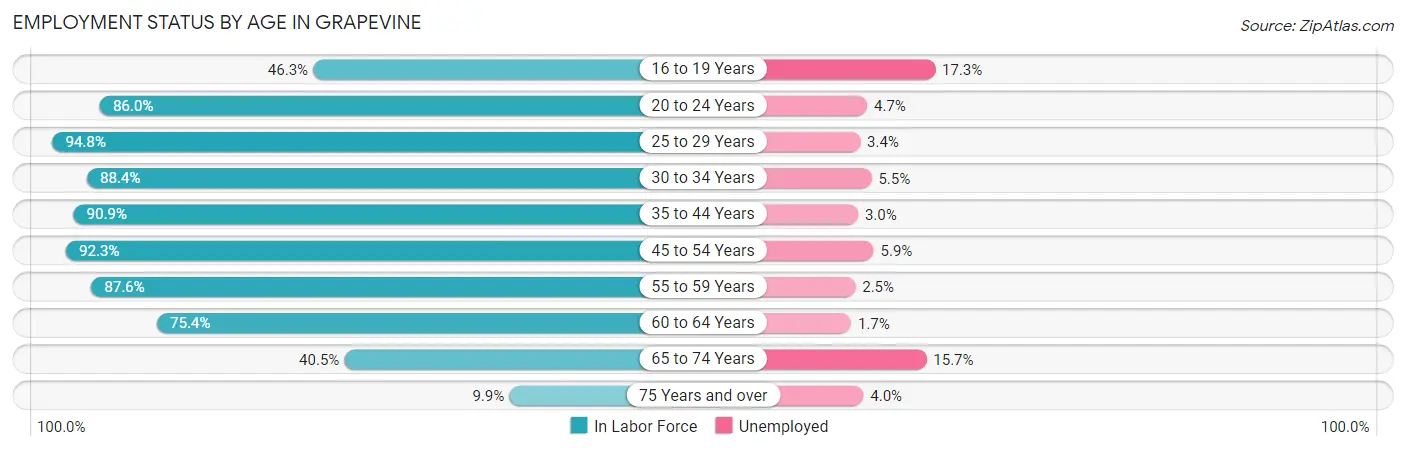
| Age Bracket | In Labor Force | Unemployed |
| 16 to 19 Years | 1,030 (46.3%) | 178 (17.3%) |
| 20 to 24 Years | 2,595 (86.0%) | 122 (4.7%) |
| 25 to 29 Years | 3,719 (94.8%) | 126 (3.4%) |
| 30 to 34 Years | 3,177 (88.4%) | 175 (5.5%) |
| 35 to 44 Years | 5,948 (90.9%) | 178 (3.0%) |
| 45 to 54 Years | 6,918 (92.3%) | 408 (5.9%) |
| 55 to 59 Years | 3,737 (87.6%) | 93 (2.5%) |
| 60 to 64 Years | 2,809 (75.4%) | 48 (1.7%) |
| 65 to 74 Years | 1,660 (40.5%) | 261 (15.7%) |
| 75 Years and over | 250 (9.9%) | 10 (4.0%) |
| Total | 31,850 (76.9%) | 1,592 (5.0%) |
Employment Status by Educational Attainment in Grapevine
According to labor force statistics for Grapevine, 89.0% of individuals (26,298) out of the total population between 25 and 64 years of age (29,548) are in the labor force, with 3.9% or 1,026 of them being unemployed. The group with the highest labor force participation rate are those with the educational attainment of bachelor's degree or higher, with 90.8% or 15,194 individuals in the labor force. Within the labor force, individuals with college / associate degree education have the highest percentage of unemployment, with 5.4% or 337 of them being unemployed.
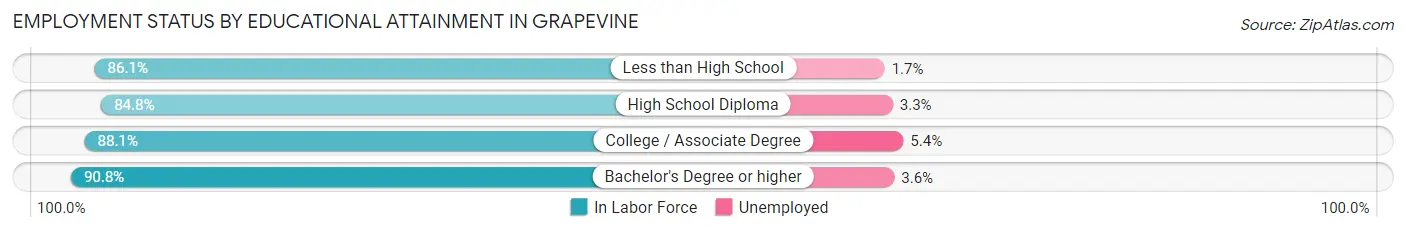
| Educational Attainment | In Labor Force | Unemployed |
| Less than High School | 1,143 (86.1%) | 23 (1.7%) |
| High School Diploma | 3,731 (84.8%) | 145 (3.3%) |
| College / Associate Degree | 6,243 (88.1%) | 383 (5.4%) |
| Bachelor's Degree or higher | 15,194 (90.8%) | 602 (3.6%) |
| Total | 26,298 (89.0%) | 1,152 (3.9%) |
Employment Occupations by Sex in Grapevine
Management, Business, Science and Arts Occupations
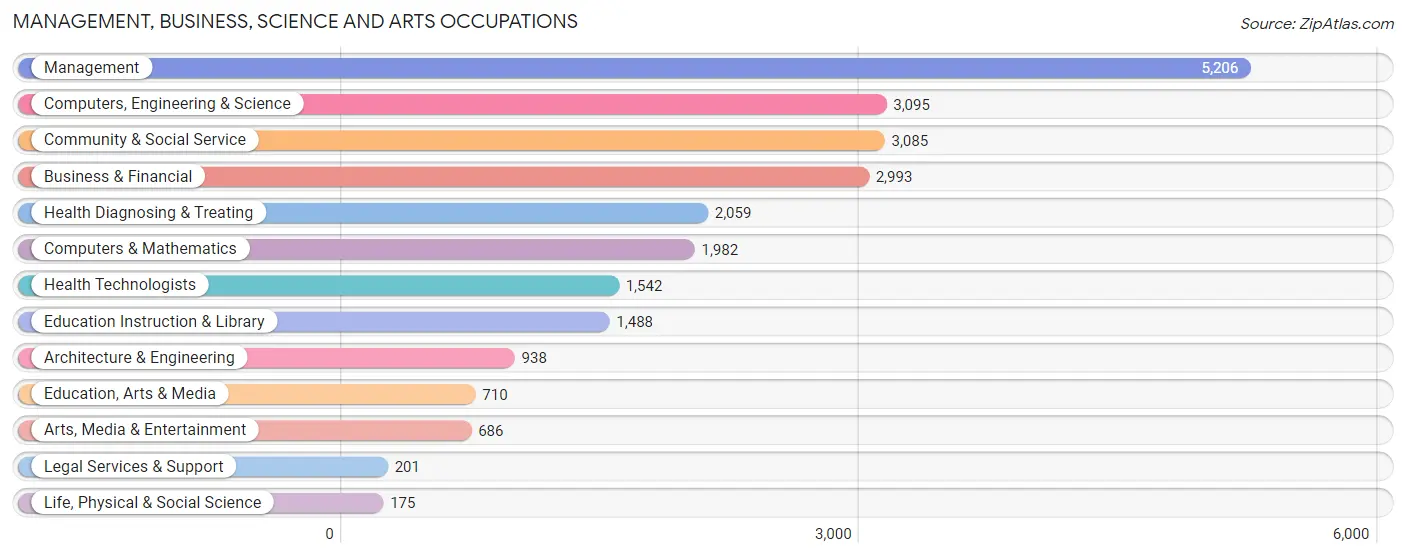
The most common Management, Business, Science and Arts occupations in Grapevine are Management (5,206 | 17.2%), Computers, Engineering & Science (3,095 | 10.2%), Community & Social Service (3,085 | 10.2%), Business & Financial (2,993 | 9.9%), and Health Diagnosing & Treating (2,059 | 6.8%).
Management, Business, Science and Arts Occupations by Sex
Within the Management, Business, Science and Arts occupations in Grapevine, the most male-oriented occupations are Architecture & Engineering (88.2%), Computers, Engineering & Science (73.5%), and Legal Services & Support (69.7%), while the most female-oriented occupations are Education, Arts & Media (81.4%), Health Technologists (78.3%), and Health Diagnosing & Treating (74.7%).
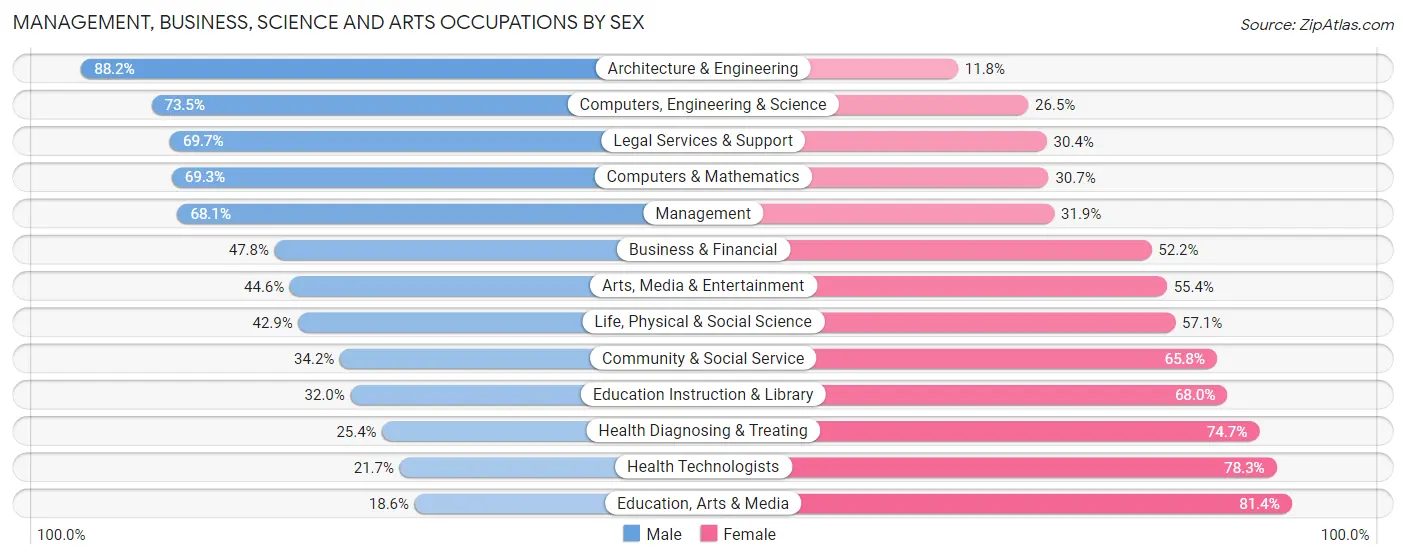
| Occupation | Male | Female |
| Management | 3,545 (68.1%) | 1,661 (31.9%) |
| Business & Financial | 1,431 (47.8%) | 1,562 (52.2%) |
| Computers, Engineering & Science | 2,275 (73.5%) | 820 (26.5%) |
| Computers & Mathematics | 1,373 (69.3%) | 609 (30.7%) |
| Architecture & Engineering | 827 (88.2%) | 111 (11.8%) |
| Life, Physical & Social Science | 75 (42.9%) | 100 (57.1%) |
| Community & Social Service | 1,054 (34.2%) | 2,031 (65.8%) |
| Education, Arts & Media | 132 (18.6%) | 578 (81.4%) |
| Legal Services & Support | 140 (69.7%) | 61 (30.3%) |
| Education Instruction & Library | 476 (32.0%) | 1,012 (68.0%) |
| Arts, Media & Entertainment | 306 (44.6%) | 380 (55.4%) |
| Health Diagnosing & Treating | 522 (25.4%) | 1,537 (74.7%) |
| Health Technologists | 335 (21.7%) | 1,207 (78.3%) |
| Total (Category) | 8,827 (53.7%) | 7,611 (46.3%) |
| Total (Overall) | 16,325 (54.0%) | 13,884 (46.0%) |
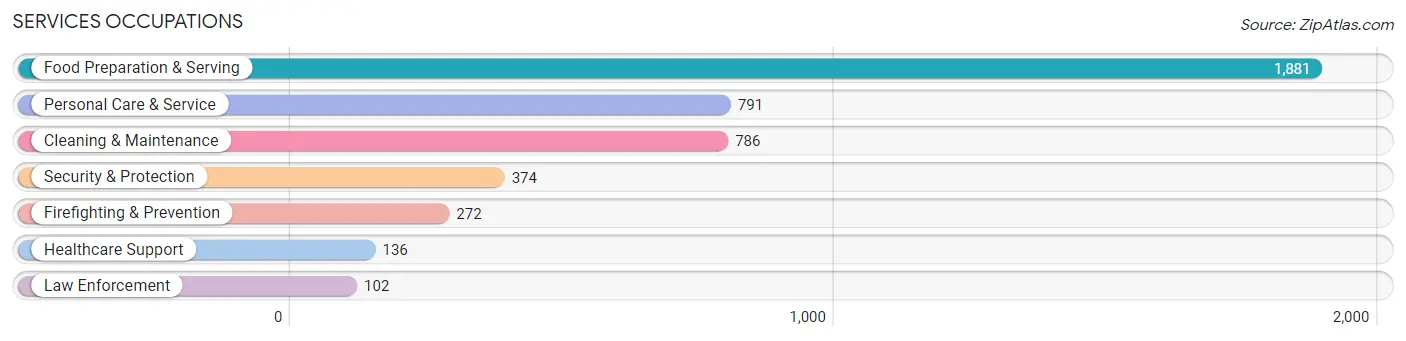
Services Occupations
The most common Services occupations in Grapevine are Food Preparation & Serving (1,881 | 6.2%), Personal Care & Service (791 | 2.6%), Cleaning & Maintenance (786 | 2.6%), Security & Protection (374 | 1.2%), and Firefighting & Prevention (272 | 0.9%).
Services Occupations by Sex
Within the Services occupations in Grapevine, the most male-oriented occupations are Law Enforcement (100.0%), Cleaning & Maintenance (80.1%), and Security & Protection (78.3%), while the most female-oriented occupations are Healthcare Support (90.4%), Personal Care & Service (82.3%), and Food Preparation & Serving (46.7%).
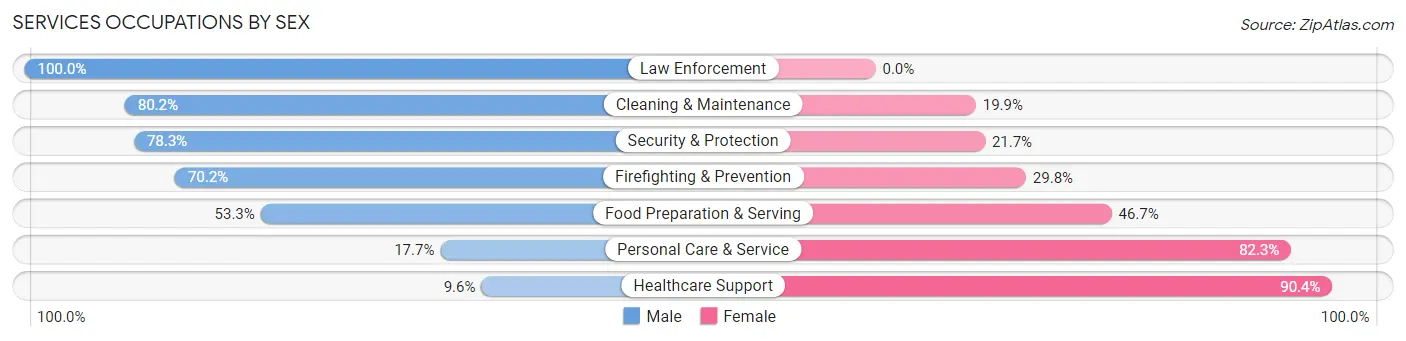
| Occupation | Male | Female |
| Healthcare Support | 13 (9.6%) | 123 (90.4%) |
| Security & Protection | 293 (78.3%) | 81 (21.7%) |
| Firefighting & Prevention | 191 (70.2%) | 81 (29.8%) |
| Law Enforcement | 102 (100.0%) | 0 (0.0%) |
| Food Preparation & Serving | 1,002 (53.3%) | 879 (46.7%) |
| Cleaning & Maintenance | 630 (80.1%) | 156 (19.9%) |
| Personal Care & Service | 140 (17.7%) | 651 (82.3%) |
| Total (Category) | 2,078 (52.4%) | 1,890 (47.6%) |
| Total (Overall) | 16,325 (54.0%) | 13,884 (46.0%) |
Sales and Office Occupations
The most common Sales and Office occupations in Grapevine are Office & Administration (3,312 | 11.0%), and Sales & Related (2,969 | 9.8%).

Sales and Office Occupations by Sex
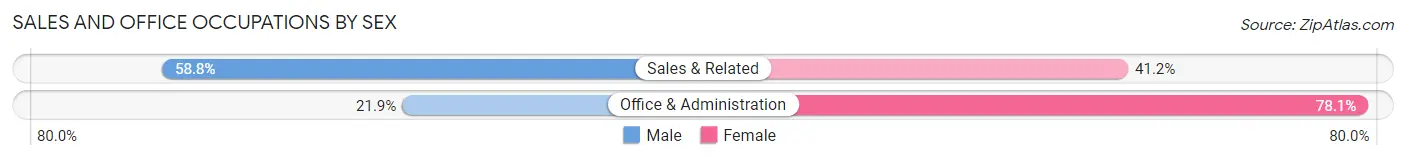
| Occupation | Male | Female |
| Sales & Related | 1,747 (58.8%) | 1,222 (41.2%) |
| Office & Administration | 726 (21.9%) | 2,586 (78.1%) |
| Total (Category) | 2,473 (39.4%) | 3,808 (60.6%) |
| Total (Overall) | 16,325 (54.0%) | 13,884 (46.0%) |
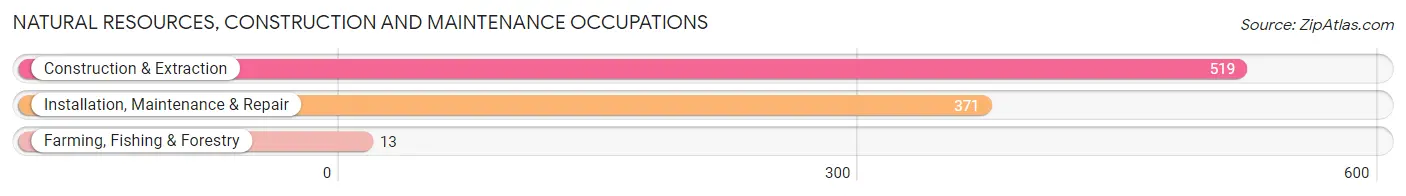
Natural Resources, Construction and Maintenance Occupations
The most common Natural Resources, Construction and Maintenance occupations in Grapevine are Construction & Extraction (519 | 1.7%), Installation, Maintenance & Repair (371 | 1.2%), and Farming, Fishing & Forestry (13 | 0.0%).
Natural Resources, Construction and Maintenance Occupations by Sex
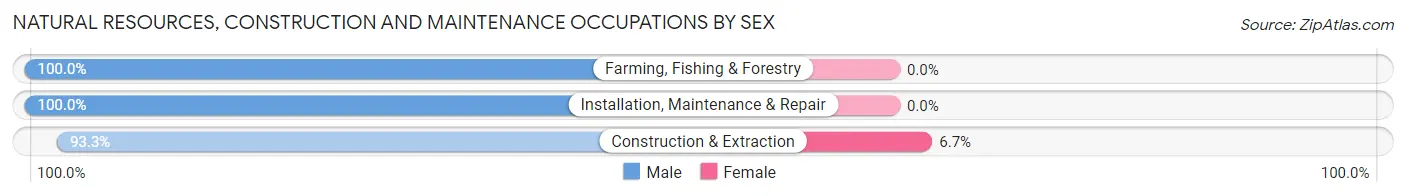
| Occupation | Male | Female |
| Farming, Fishing & Forestry | 13 (100.0%) | 0 (0.0%) |
| Construction & Extraction | 484 (93.3%) | 35 (6.7%) |
| Installation, Maintenance & Repair | 371 (100.0%) | 0 (0.0%) |
| Total (Category) | 868 (96.1%) | 35 (3.9%) |
| Total (Overall) | 16,325 (54.0%) | 13,884 (46.0%) |
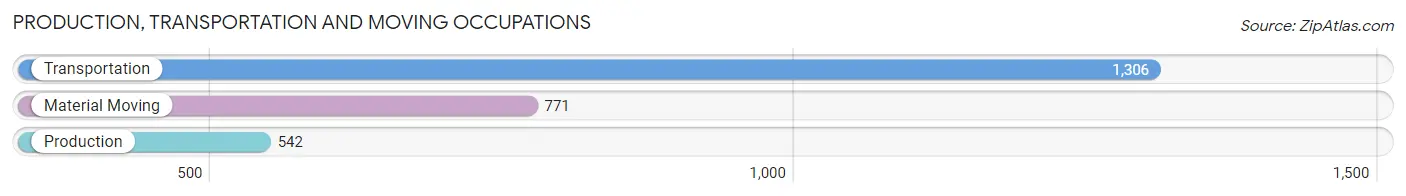
Production, Transportation and Moving Occupations
The most common Production, Transportation and Moving occupations in Grapevine are Transportation (1,306 | 4.3%), Material Moving (771 | 2.5%), and Production (542 | 1.8%).
Production, Transportation and Moving Occupations by Sex
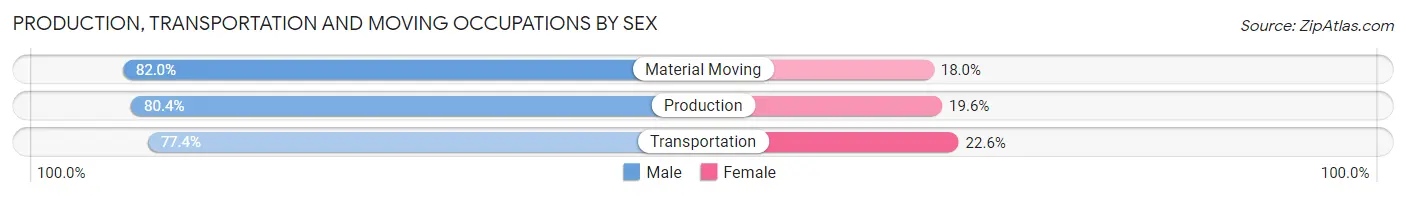
| Occupation | Male | Female |
| Production | 436 (80.4%) | 106 (19.6%) |
| Transportation | 1,011 (77.4%) | 295 (22.6%) |
| Material Moving | 632 (82.0%) | 139 (18.0%) |
| Total (Category) | 2,079 (79.4%) | 540 (20.6%) |
| Total (Overall) | 16,325 (54.0%) | 13,884 (46.0%) |
Employment Industries by Sex in Grapevine
Employment Industries in Grapevine
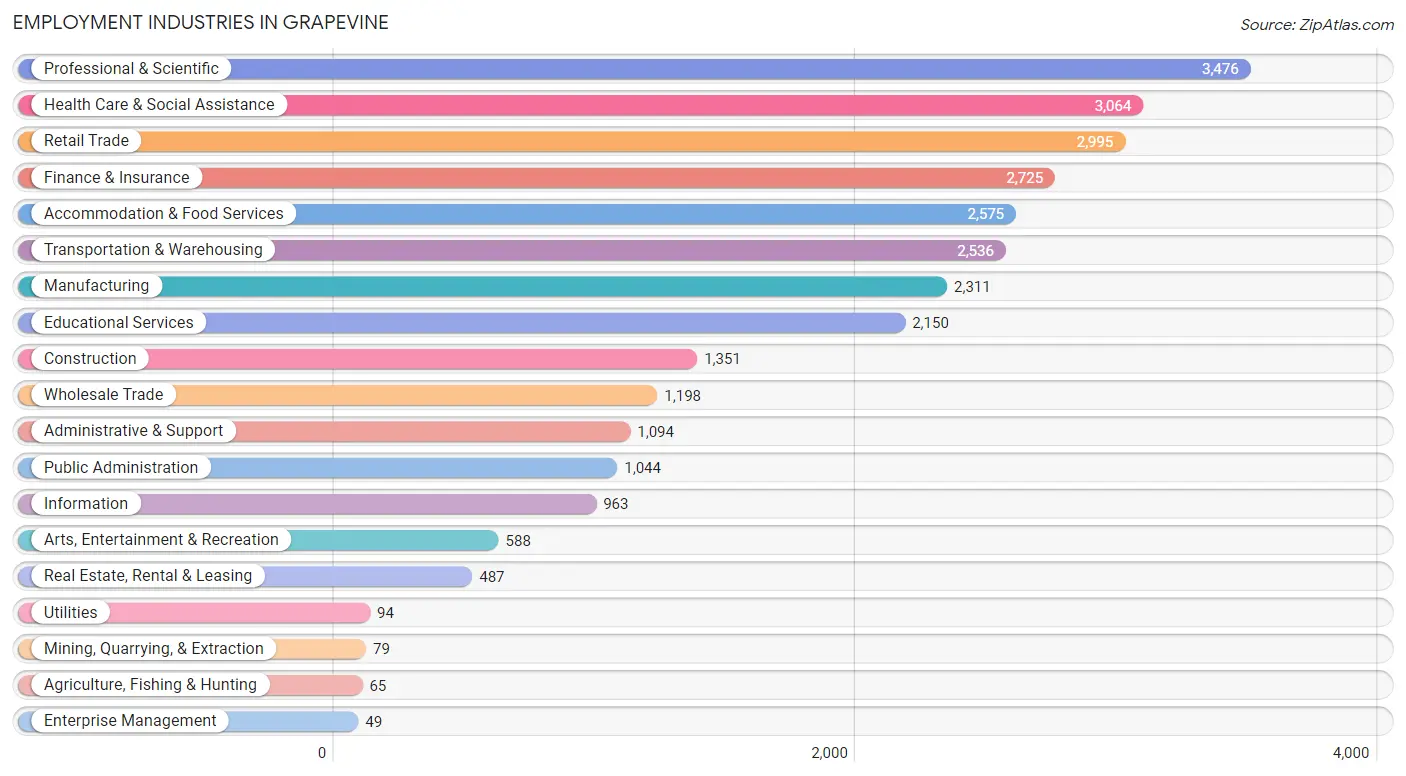
The major employment industries in Grapevine include Professional & Scientific (3,476 | 11.5%), Health Care & Social Assistance (3,064 | 10.1%), Retail Trade (2,995 | 9.9%), Finance & Insurance (2,725 | 9.0%), and Accommodation & Food Services (2,575 | 8.5%).
Employment Industries by Sex in Grapevine
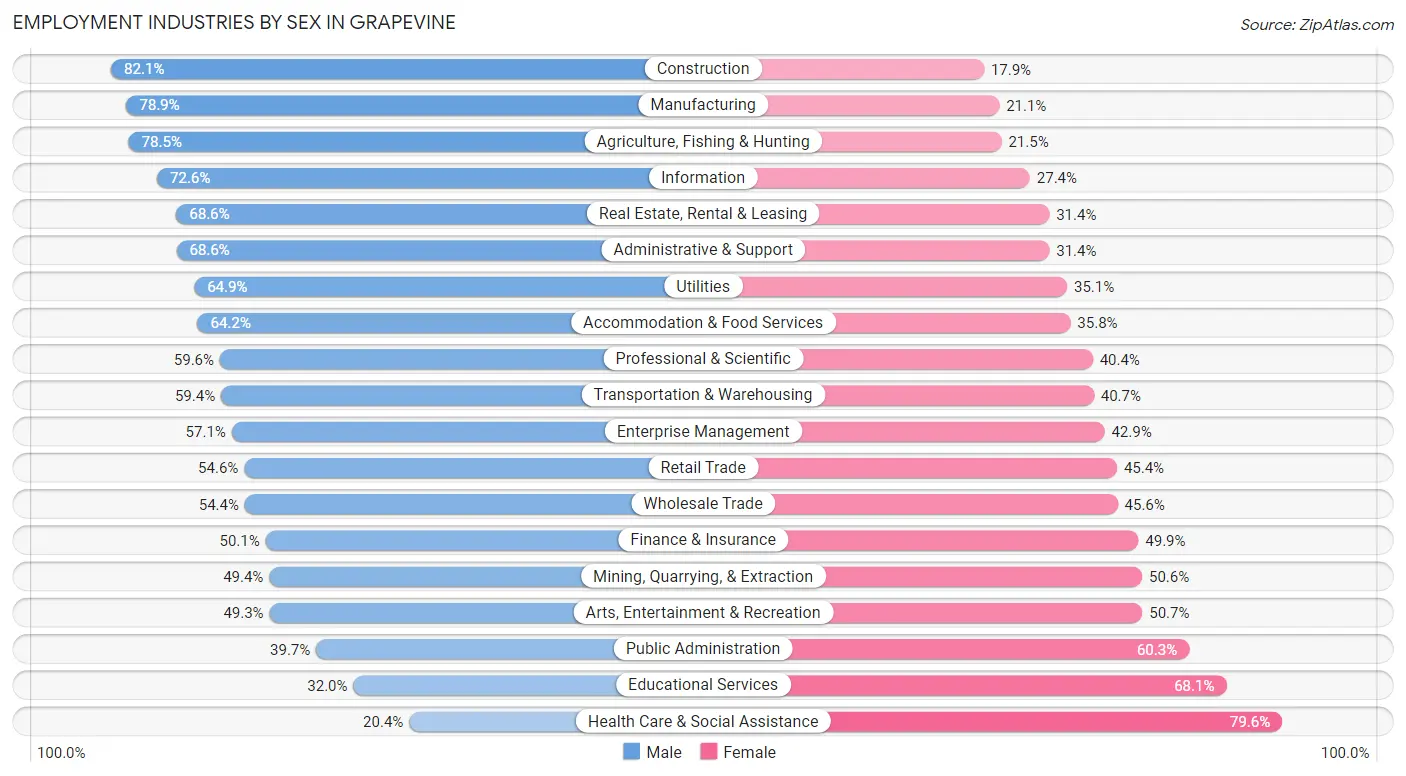
The Grapevine industries that see more men than women are Construction (82.1%), Manufacturing (78.9%), and Agriculture, Fishing & Hunting (78.5%), whereas the industries that tend to have a higher number of women are Health Care & Social Assistance (79.6%), Educational Services (68.0%), and Public Administration (60.3%).
| Industry | Male | Female |
| Agriculture, Fishing & Hunting | 51 (78.5%) | 14 (21.5%) |
| Mining, Quarrying, & Extraction | 39 (49.4%) | 40 (50.6%) |
| Construction | 1,109 (82.1%) | 242 (17.9%) |
| Manufacturing | 1,824 (78.9%) | 487 (21.1%) |
| Wholesale Trade | 652 (54.4%) | 546 (45.6%) |
| Retail Trade | 1,634 (54.6%) | 1,361 (45.4%) |
| Transportation & Warehousing | 1,505 (59.4%) | 1,031 (40.6%) |
| Utilities | 61 (64.9%) | 33 (35.1%) |
| Information | 699 (72.6%) | 264 (27.4%) |
| Finance & Insurance | 1,366 (50.1%) | 1,359 (49.9%) |
| Real Estate, Rental & Leasing | 334 (68.6%) | 153 (31.4%) |
| Professional & Scientific | 2,071 (59.6%) | 1,405 (40.4%) |
| Enterprise Management | 28 (57.1%) | 21 (42.9%) |
| Administrative & Support | 750 (68.6%) | 344 (31.4%) |
| Educational Services | 687 (32.0%) | 1,463 (68.0%) |
| Health Care & Social Assistance | 625 (20.4%) | 2,439 (79.6%) |
| Arts, Entertainment & Recreation | 290 (49.3%) | 298 (50.7%) |
| Accommodation & Food Services | 1,653 (64.2%) | 922 (35.8%) |
| Public Administration | 414 (39.7%) | 630 (60.3%) |
| Total | 16,325 (54.0%) | 13,884 (46.0%) |
Education in Grapevine
School Enrollment in Grapevine
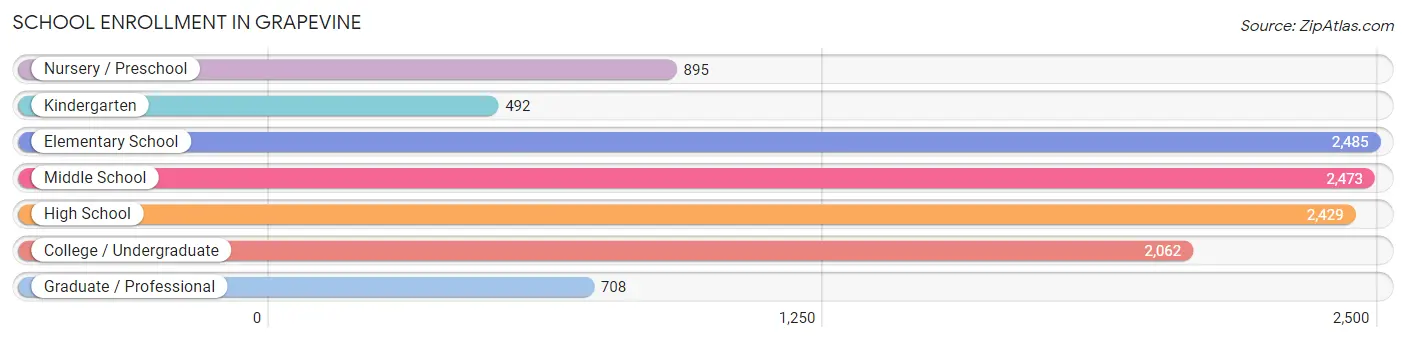
The most common levels of schooling among the 11,544 students in Grapevine are elementary school (2,485 | 21.5%), middle school (2,473 | 21.4%), and high school (2,429 | 21.0%).
| School Level | # Students | % Students |
| Nursery / Preschool | 895 | 7.7% |
| Kindergarten | 492 | 4.3% |
| Elementary School | 2,485 | 21.5% |
| Middle School | 2,473 | 21.4% |
| High School | 2,429 | 21.0% |
| College / Undergraduate | 2,062 | 17.9% |
| Graduate / Professional | 708 | 6.1% |
| Total | 11,544 | 100.0% |
School Enrollment by Age by Funding Source in Grapevine
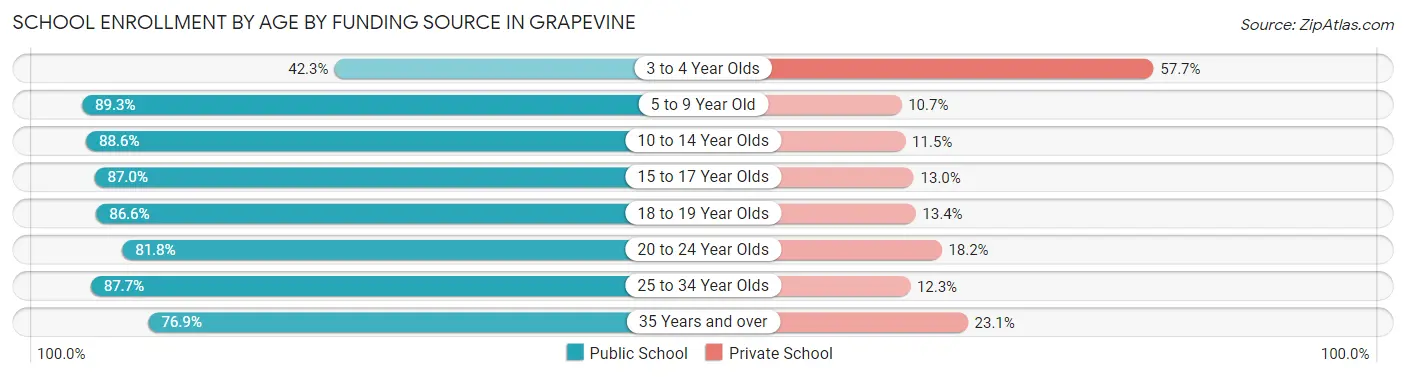
Out of a total of 11,544 students who are enrolled in schools in Grapevine, 1,743 (15.1%) attend a private institution, while the remaining 9,801 (84.9%) are enrolled in public schools. The age group of 3 to 4 year olds has the highest likelihood of being enrolled in private schools, with 308 (57.7% in the age bracket) enrolled. Conversely, the age group of 5 to 9 year old has the lowest likelihood of being enrolled in a private school, with 2,697 (89.3% in the age bracket) attending a public institution.
| Age Bracket | Public School | Private School |
| 3 to 4 Year Olds | 226 (42.3%) | 308 (57.7%) |
| 5 to 9 Year Old | 2,697 (89.3%) | 324 (10.7%) |
| 10 to 14 Year Olds | 2,621 (88.5%) | 339 (11.5%) |
| 15 to 17 Year Olds | 1,408 (87.0%) | 211 (13.0%) |
| 18 to 19 Year Olds | 759 (86.6%) | 117 (13.4%) |
| 20 to 24 Year Olds | 970 (81.8%) | 216 (18.2%) |
| 25 to 34 Year Olds | 703 (87.7%) | 99 (12.3%) |
| 35 Years and over | 420 (76.9%) | 126 (23.1%) |
| Total | 9,801 (84.9%) | 1,743 (15.1%) |
Educational Attainment by Field of Study in Grapevine
Business (5,536 | 26.1%), engineering (2,062 | 9.7%), science & technology (2,035 | 9.6%), social sciences (1,576 | 7.4%), and communications (1,524 | 7.2%) are the most common fields of study among 21,177 individuals in Grapevine who have obtained a bachelor's degree or higher.
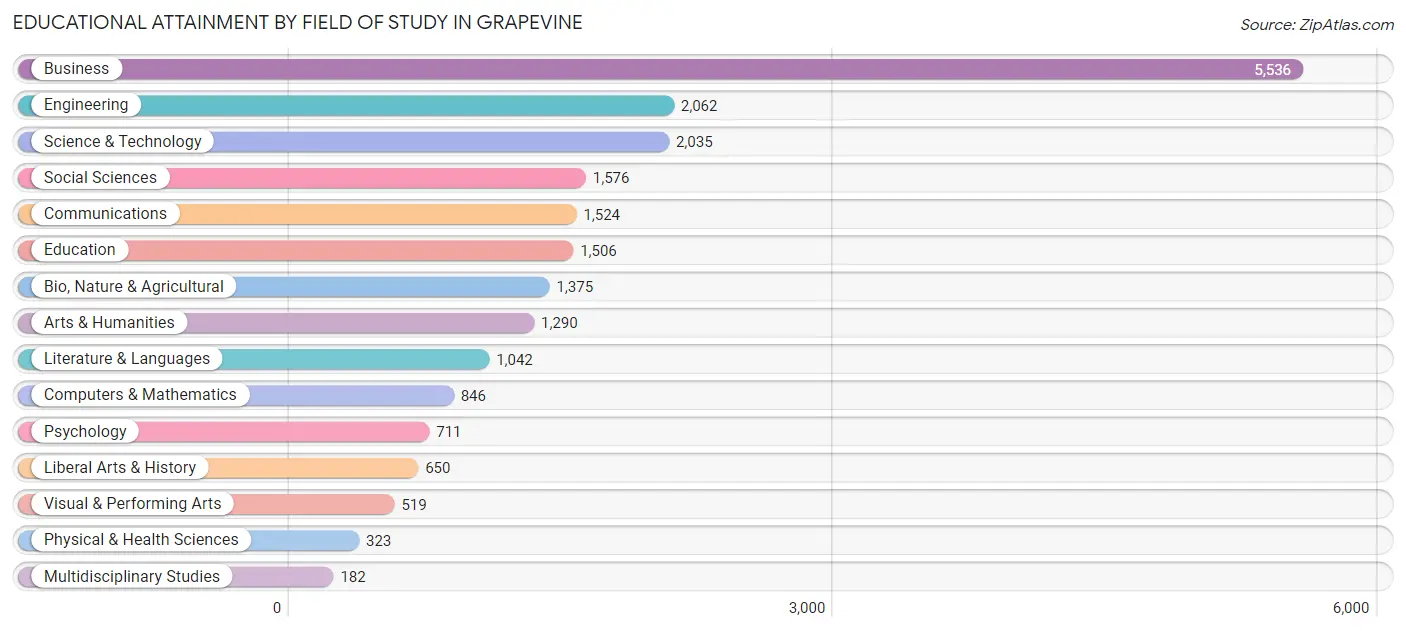
| Field of Study | # Graduates | % Graduates |
| Computers & Mathematics | 846 | 4.0% |
| Bio, Nature & Agricultural | 1,375 | 6.5% |
| Physical & Health Sciences | 323 | 1.5% |
| Psychology | 711 | 3.4% |
| Social Sciences | 1,576 | 7.4% |
| Engineering | 2,062 | 9.7% |
| Multidisciplinary Studies | 182 | 0.9% |
| Science & Technology | 2,035 | 9.6% |
| Business | 5,536 | 26.1% |
| Education | 1,506 | 7.1% |
| Literature & Languages | 1,042 | 4.9% |
| Liberal Arts & History | 650 | 3.1% |
| Visual & Performing Arts | 519 | 2.5% |
| Communications | 1,524 | 7.2% |
| Arts & Humanities | 1,290 | 6.1% |
| Total | 21,177 | 100.0% |
Transportation & Commute in Grapevine
Vehicle Availability by Sex in Grapevine
The most prevalent vehicle ownership categories in Grapevine are males with 2 vehicles (7,737, accounting for 48.6%) and females with 2 vehicles (6,668, making up 57.0%).
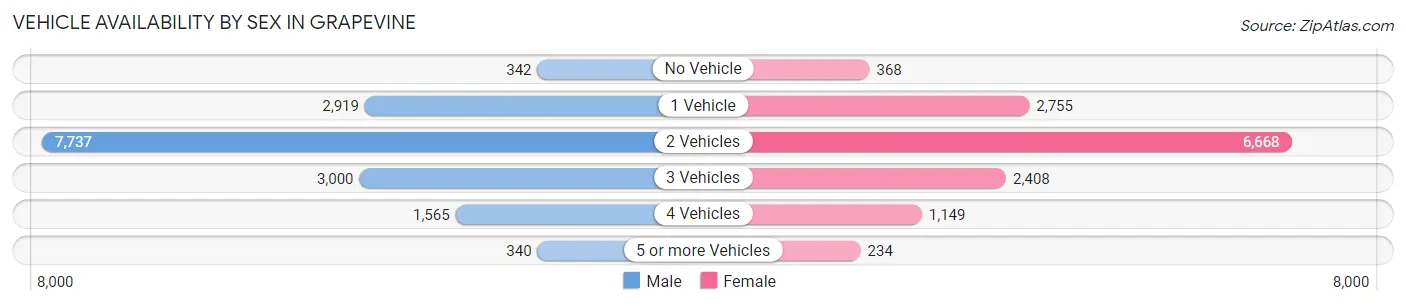
| Vehicles Available | Male | Female |
| No Vehicle | 342 (2.1%) | 368 (2.7%) |
| 1 Vehicle | 2,919 (18.4%) | 2,755 (20.3%) |
| 2 Vehicles | 7,737 (48.6%) | 6,668 (49.1%) |
| 3 Vehicles | 3,000 (18.9%) | 2,408 (17.7%) |
| 4 Vehicles | 1,565 (9.8%) | 1,149 (8.5%) |
| 5 or more Vehicles | 340 (2.1%) | 234 (1.7%) |
| Total | 15,903 (100.0%) | 13,582 (100.0%) |
Commute Time in Grapevine
The most frequently occuring commute durations in Grapevine are 15 to 19 minutes (4,275 commuters, 17.4%), 10 to 14 minutes (3,734 commuters, 15.2%), and 20 to 24 minutes (3,609 commuters, 14.7%).
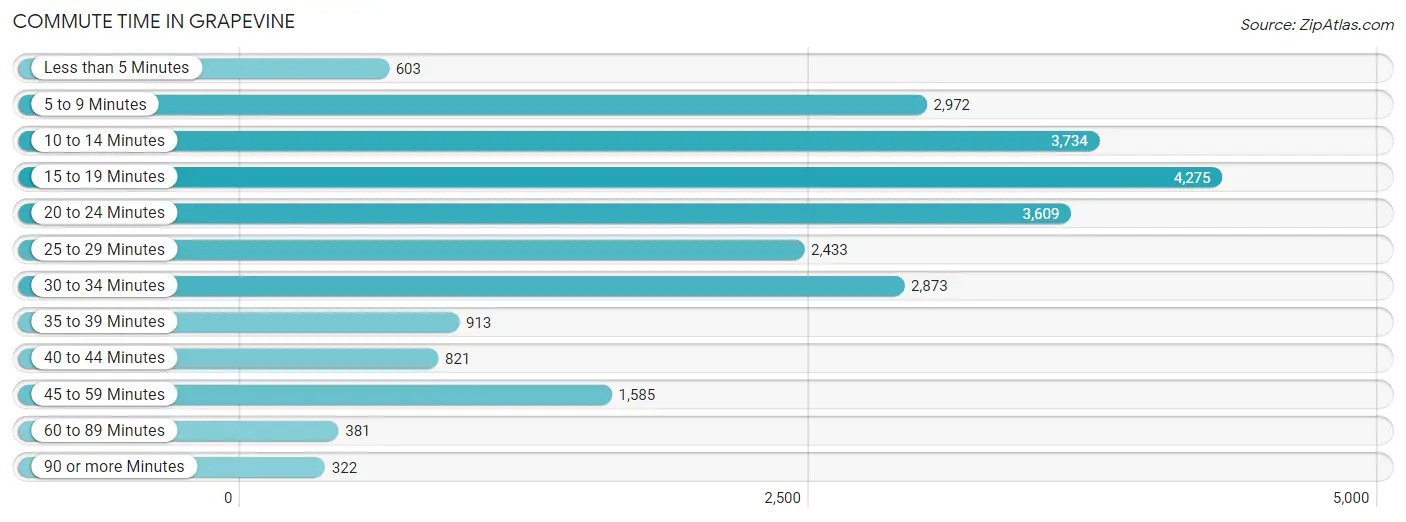
| Commute Time | # Commuters | % Commuters |
| Less than 5 Minutes | 603 | 2.5% |
| 5 to 9 Minutes | 2,972 | 12.1% |
| 10 to 14 Minutes | 3,734 | 15.2% |
| 15 to 19 Minutes | 4,275 | 17.4% |
| 20 to 24 Minutes | 3,609 | 14.7% |
| 25 to 29 Minutes | 2,433 | 9.9% |
| 30 to 34 Minutes | 2,873 | 11.7% |
| 35 to 39 Minutes | 913 | 3.7% |
| 40 to 44 Minutes | 821 | 3.4% |
| 45 to 59 Minutes | 1,585 | 6.5% |
| 60 to 89 Minutes | 381 | 1.5% |
| 90 or more Minutes | 322 | 1.3% |
Commute Time by Sex in Grapevine
The most common commute times in Grapevine are 15 to 19 minutes (2,339 commuters, 17.7%) for males and 15 to 19 minutes (1,936 commuters, 17.2%) for females.
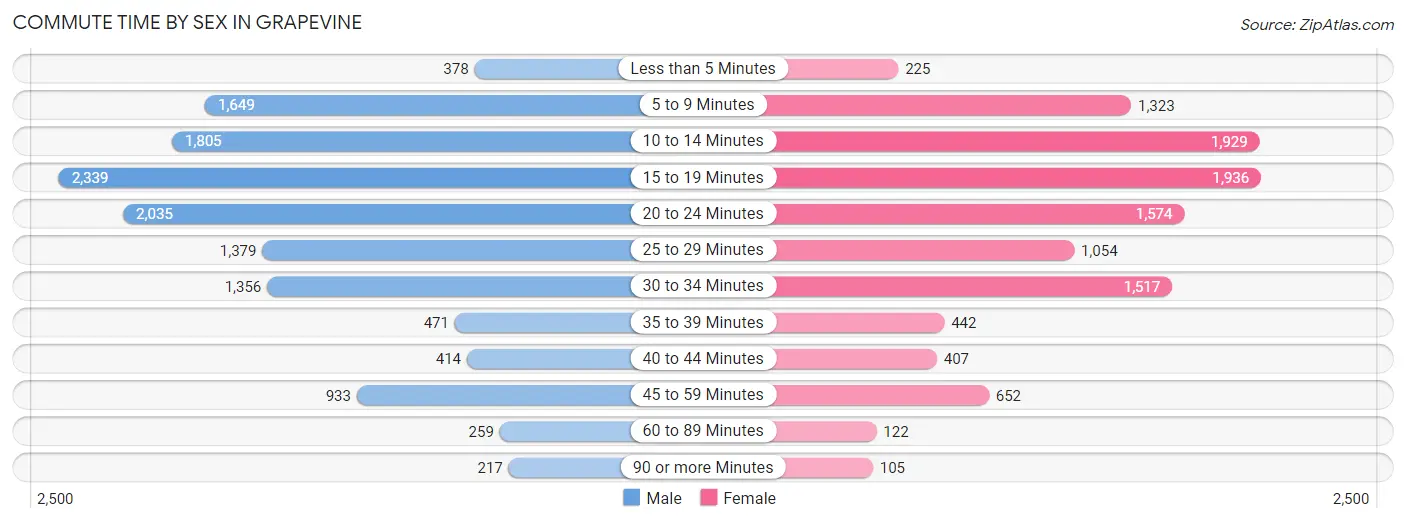
| Commute Time | Male | Female |
| Less than 5 Minutes | 378 (2.9%) | 225 (2.0%) |
| 5 to 9 Minutes | 1,649 (12.5%) | 1,323 (11.7%) |
| 10 to 14 Minutes | 1,805 (13.6%) | 1,929 (17.1%) |
| 15 to 19 Minutes | 2,339 (17.7%) | 1,936 (17.2%) |
| 20 to 24 Minutes | 2,035 (15.4%) | 1,574 (14.0%) |
| 25 to 29 Minutes | 1,379 (10.4%) | 1,054 (9.3%) |
| 30 to 34 Minutes | 1,356 (10.2%) | 1,517 (13.4%) |
| 35 to 39 Minutes | 471 (3.6%) | 442 (3.9%) |
| 40 to 44 Minutes | 414 (3.1%) | 407 (3.6%) |
| 45 to 59 Minutes | 933 (7.0%) | 652 (5.8%) |
| 60 to 89 Minutes | 259 (2.0%) | 122 (1.1%) |
| 90 or more Minutes | 217 (1.6%) | 105 (0.9%) |
Time of Departure to Work by Sex in Grapevine
The most frequent times of departure to work in Grapevine are 7:30 AM to 7:59 AM (2,092, 15.8%) for males and 7:30 AM to 7:59 AM (1,929, 17.1%) for females.
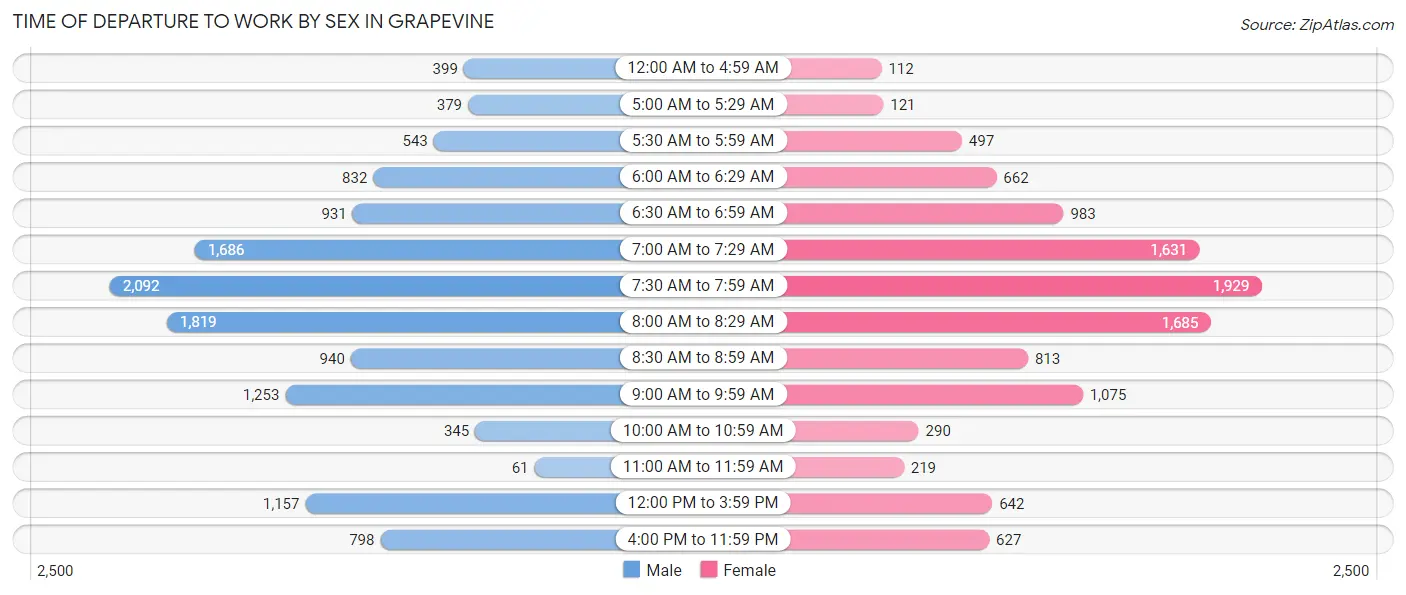
| Time of Departure | Male | Female |
| 12:00 AM to 4:59 AM | 399 (3.0%) | 112 (1.0%) |
| 5:00 AM to 5:29 AM | 379 (2.9%) | 121 (1.1%) |
| 5:30 AM to 5:59 AM | 543 (4.1%) | 497 (4.4%) |
| 6:00 AM to 6:29 AM | 832 (6.3%) | 662 (5.9%) |
| 6:30 AM to 6:59 AM | 931 (7.0%) | 983 (8.7%) |
| 7:00 AM to 7:29 AM | 1,686 (12.7%) | 1,631 (14.4%) |
| 7:30 AM to 7:59 AM | 2,092 (15.8%) | 1,929 (17.1%) |
| 8:00 AM to 8:29 AM | 1,819 (13.7%) | 1,685 (14.9%) |
| 8:30 AM to 8:59 AM | 940 (7.1%) | 813 (7.2%) |
| 9:00 AM to 9:59 AM | 1,253 (9.5%) | 1,075 (9.5%) |
| 10:00 AM to 10:59 AM | 345 (2.6%) | 290 (2.6%) |
| 11:00 AM to 11:59 AM | 61 (0.5%) | 219 (1.9%) |
| 12:00 PM to 3:59 PM | 1,157 (8.7%) | 642 (5.7%) |
| 4:00 PM to 11:59 PM | 798 (6.0%) | 627 (5.6%) |
| Total | 13,235 (100.0%) | 11,286 (100.0%) |
Housing Occupancy in Grapevine
Occupancy by Ownership in Grapevine
Of the total 21,383 dwellings in Grapevine, owner-occupied units account for 11,349 (53.1%), while renter-occupied units make up 10,034 (46.9%).
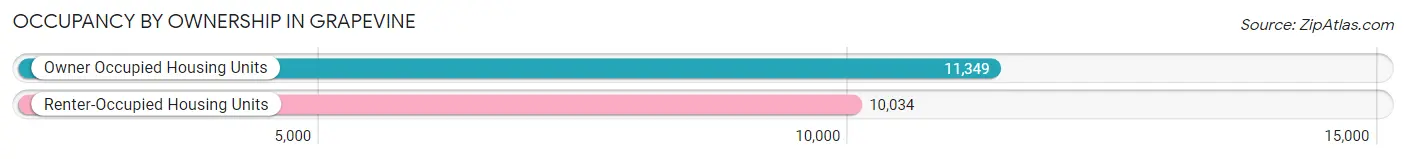
| Occupancy | # Housing Units | % Housing Units |
| Owner Occupied Housing Units | 11,349 | 53.1% |
| Renter-Occupied Housing Units | 10,034 | 46.9% |
| Total Occupied Housing Units | 21,383 | 100.0% |
Occupancy by Household Size in Grapevine
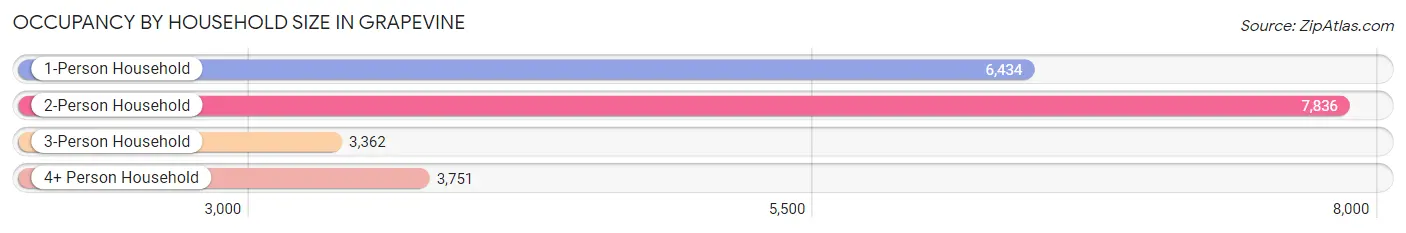
| Household Size | # Housing Units | % Housing Units |
| 1-Person Household | 6,434 | 30.1% |
| 2-Person Household | 7,836 | 36.6% |
| 3-Person Household | 3,362 | 15.7% |
| 4+ Person Household | 3,751 | 17.5% |
| Total Housing Units | 21,383 | 100.0% |
Occupancy by Ownership by Household Size in Grapevine
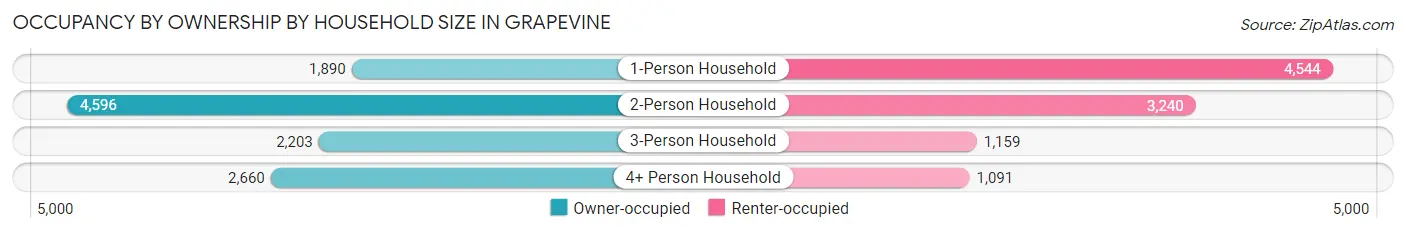
| Household Size | Owner-occupied | Renter-occupied |
| 1-Person Household | 1,890 (29.4%) | 4,544 (70.6%) |
| 2-Person Household | 4,596 (58.7%) | 3,240 (41.3%) |
| 3-Person Household | 2,203 (65.5%) | 1,159 (34.5%) |
| 4+ Person Household | 2,660 (70.9%) | 1,091 (29.1%) |
| Total Housing Units | 11,349 (53.1%) | 10,034 (46.9%) |
Occupancy by Educational Attainment in Grapevine
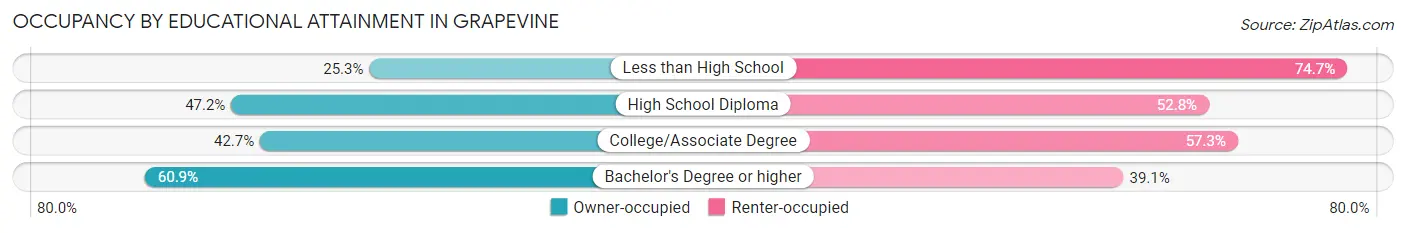
| Household Size | Owner-occupied | Renter-occupied |
| Less than High School | 191 (25.3%) | 563 (74.7%) |
| High School Diploma | 1,365 (47.2%) | 1,525 (52.8%) |
| College/Associate Degree | 2,367 (42.7%) | 3,182 (57.3%) |
| Bachelor's Degree or higher | 7,426 (60.9%) | 4,764 (39.1%) |
Occupancy by Age of Householder in Grapevine
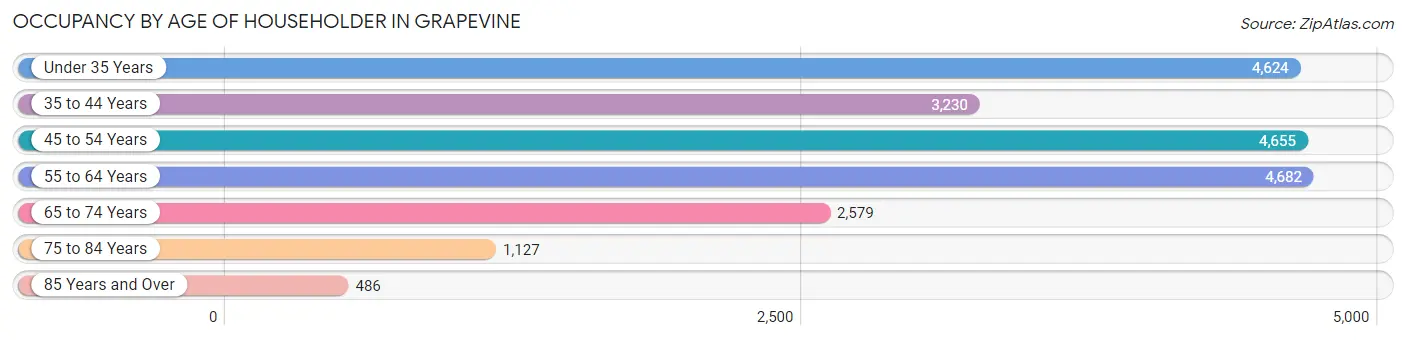
| Age Bracket | # Households | % Households |
| Under 35 Years | 4,624 | 21.6% |
| 35 to 44 Years | 3,230 | 15.1% |
| 45 to 54 Years | 4,655 | 21.8% |
| 55 to 64 Years | 4,682 | 21.9% |
| 65 to 74 Years | 2,579 | 12.1% |
| 75 to 84 Years | 1,127 | 5.3% |
| 85 Years and Over | 486 | 2.3% |
| Total | 21,383 | 100.0% |
Housing Finances in Grapevine
Median Income by Occupancy in Grapevine
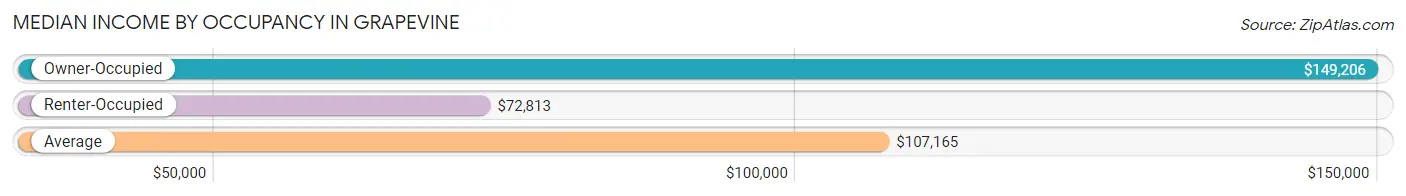
| Occupancy Type | # Households | Median Income |
| Owner-Occupied | 11,349 (53.1%) | $149,206 |
| Renter-Occupied | 10,034 (46.9%) | $72,813 |
| Average | 21,383 (100.0%) | $107,165 |
Occupancy by Householder Income Bracket in Grapevine
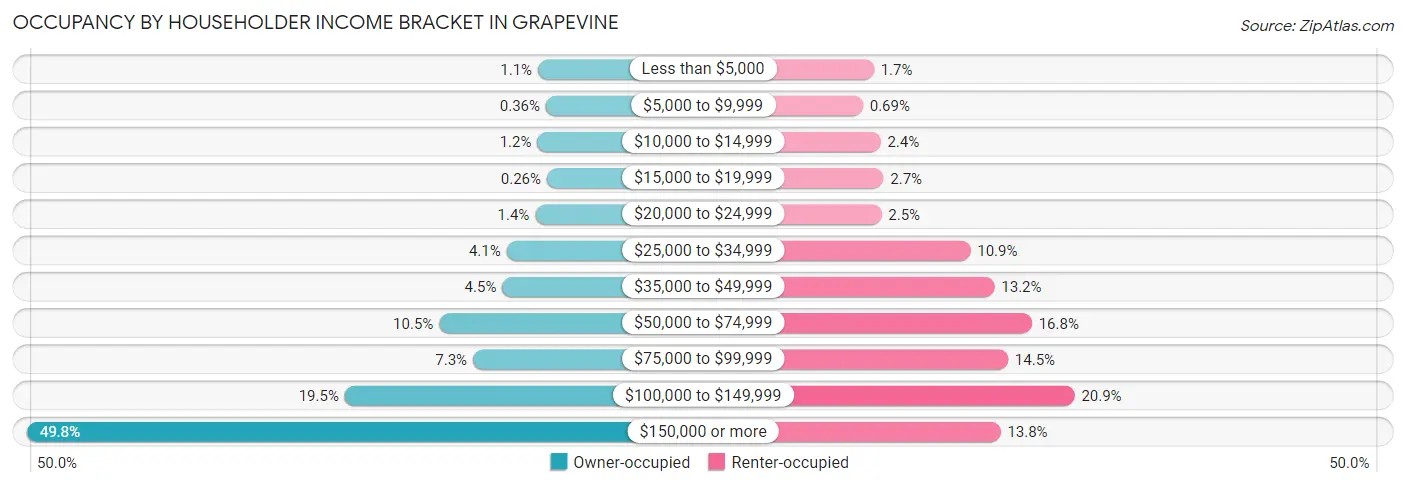
| Income Bracket | Owner-occupied | Renter-occupied |
| Less than $5,000 | 126 (1.1%) | 174 (1.7%) |
| $5,000 to $9,999 | 41 (0.4%) | 69 (0.7%) |
| $10,000 to $14,999 | 133 (1.2%) | 238 (2.4%) |
| $15,000 to $19,999 | 29 (0.3%) | 266 (2.6%) |
| $20,000 to $24,999 | 156 (1.4%) | 247 (2.5%) |
| $25,000 to $34,999 | 465 (4.1%) | 1,097 (10.9%) |
| $35,000 to $49,999 | 512 (4.5%) | 1,326 (13.2%) |
| $50,000 to $74,999 | 1,194 (10.5%) | 1,684 (16.8%) |
| $75,000 to $99,999 | 828 (7.3%) | 1,456 (14.5%) |
| $100,000 to $149,999 | 2,214 (19.5%) | 2,092 (20.8%) |
| $150,000 or more | 5,651 (49.8%) | 1,385 (13.8%) |
| Total | 11,349 (100.0%) | 10,034 (100.0%) |
Monthly Housing Cost Tiers in Grapevine
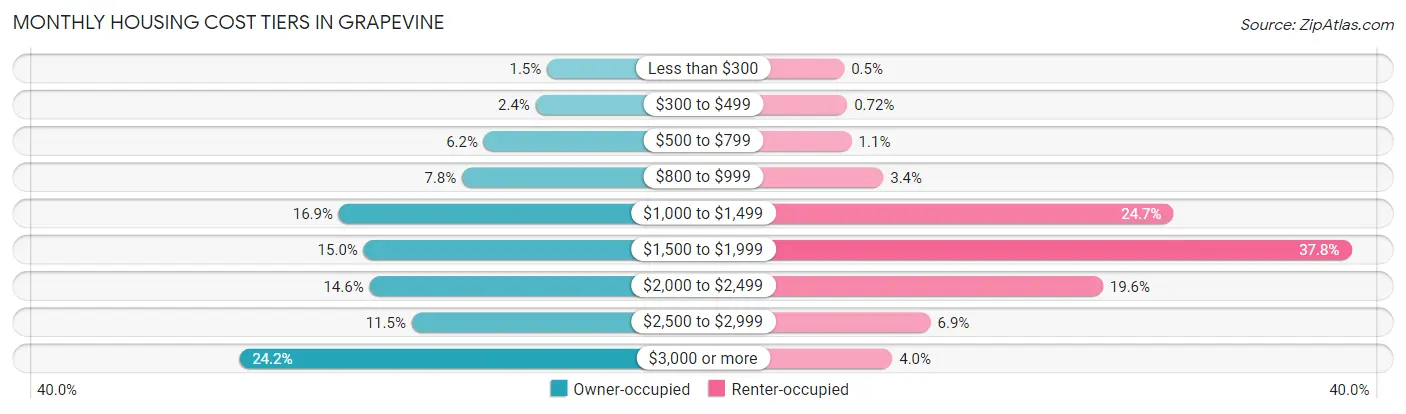
| Monthly Cost | Owner-occupied | Renter-occupied |
| Less than $300 | 172 (1.5%) | 50 (0.5%) |
| $300 to $499 | 268 (2.4%) | 72 (0.7%) |
| $500 to $799 | 701 (6.2%) | 105 (1.1%) |
| $800 to $999 | 883 (7.8%) | 339 (3.4%) |
| $1,000 to $1,499 | 1,913 (16.9%) | 2,482 (24.7%) |
| $1,500 to $1,999 | 1,706 (15.0%) | 3,797 (37.8%) |
| $2,000 to $2,499 | 1,657 (14.6%) | 1,962 (19.6%) |
| $2,500 to $2,999 | 1,304 (11.5%) | 688 (6.9%) |
| $3,000 or more | 2,745 (24.2%) | 405 (4.0%) |
| Total | 11,349 (100.0%) | 10,034 (100.0%) |
Physical Housing Characteristics in Grapevine
Housing Structures in Grapevine
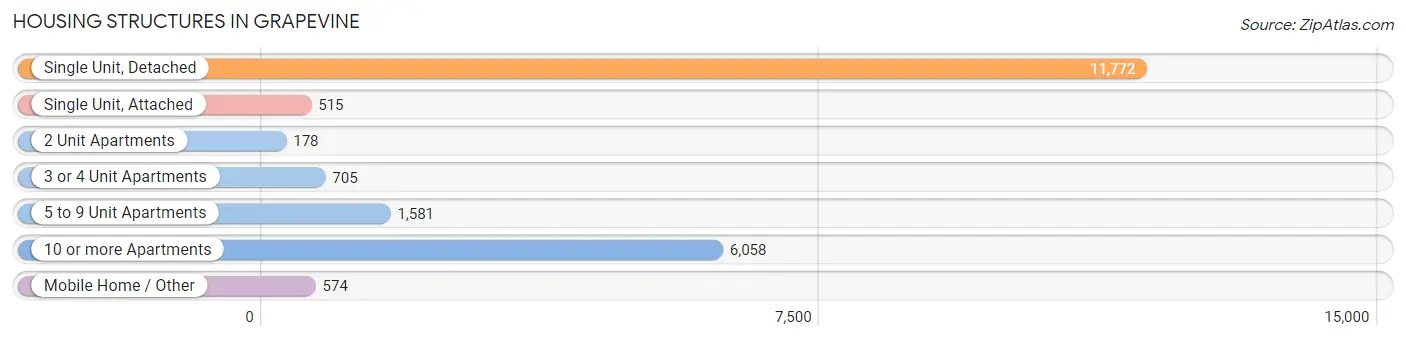
| Structure Type | # Housing Units | % Housing Units |
| Single Unit, Detached | 11,772 | 55.0% |
| Single Unit, Attached | 515 | 2.4% |
| 2 Unit Apartments | 178 | 0.8% |
| 3 or 4 Unit Apartments | 705 | 3.3% |
| 5 to 9 Unit Apartments | 1,581 | 7.4% |
| 10 or more Apartments | 6,058 | 28.3% |
| Mobile Home / Other | 574 | 2.7% |
| Total | 21,383 | 100.0% |
Housing Structures by Occupancy in Grapevine
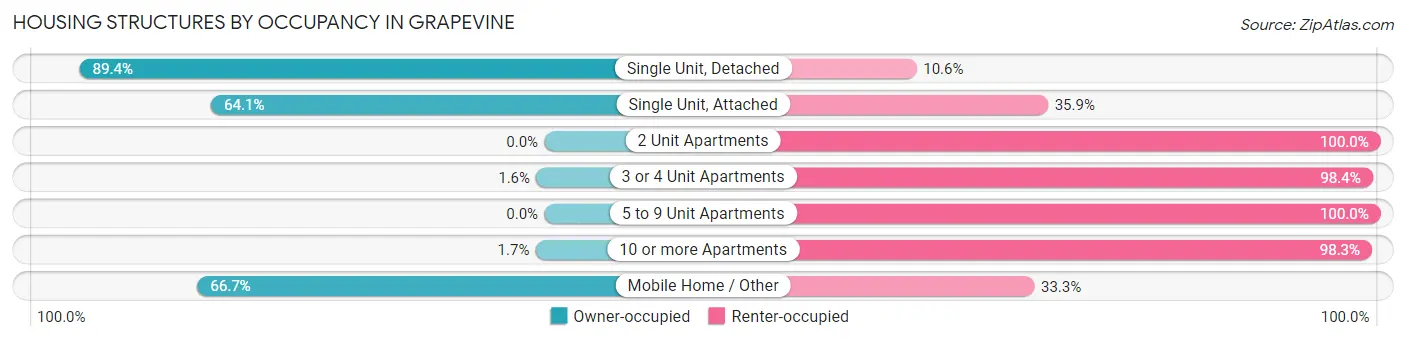
| Structure Type | Owner-occupied | Renter-occupied |
| Single Unit, Detached | 10,523 (89.4%) | 1,249 (10.6%) |
| Single Unit, Attached | 330 (64.1%) | 185 (35.9%) |
| 2 Unit Apartments | 0 (0.0%) | 178 (100.0%) |
| 3 or 4 Unit Apartments | 11 (1.6%) | 694 (98.4%) |
| 5 to 9 Unit Apartments | 0 (0.0%) | 1,581 (100.0%) |
| 10 or more Apartments | 102 (1.7%) | 5,956 (98.3%) |
| Mobile Home / Other | 383 (66.7%) | 191 (33.3%) |
| Total | 11,349 (53.1%) | 10,034 (46.9%) |
Housing Structures by Number of Rooms in Grapevine
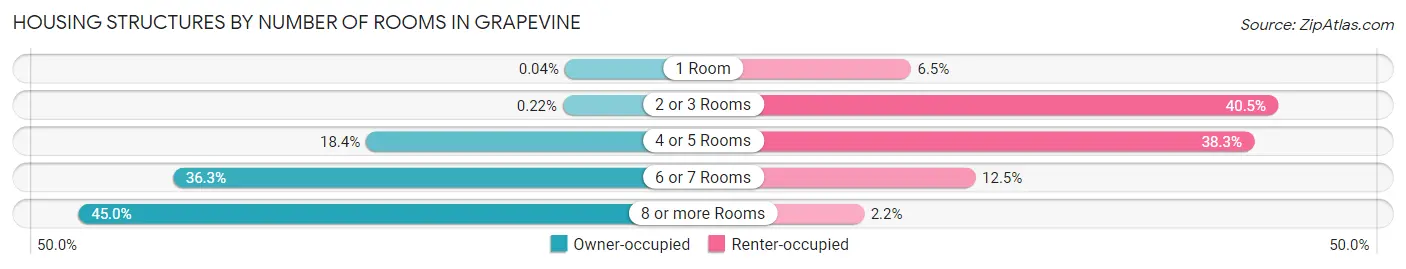
| Number of Rooms | Owner-occupied | Renter-occupied |
| 1 Room | 5 (0.0%) | 655 (6.5%) |
| 2 or 3 Rooms | 25 (0.2%) | 4,064 (40.5%) |
| 4 or 5 Rooms | 2,091 (18.4%) | 3,840 (38.3%) |
| 6 or 7 Rooms | 4,118 (36.3%) | 1,254 (12.5%) |
| 8 or more Rooms | 5,110 (45.0%) | 221 (2.2%) |
| Total | 11,349 (100.0%) | 10,034 (100.0%) |
Housing Structure by Heating Type in Grapevine
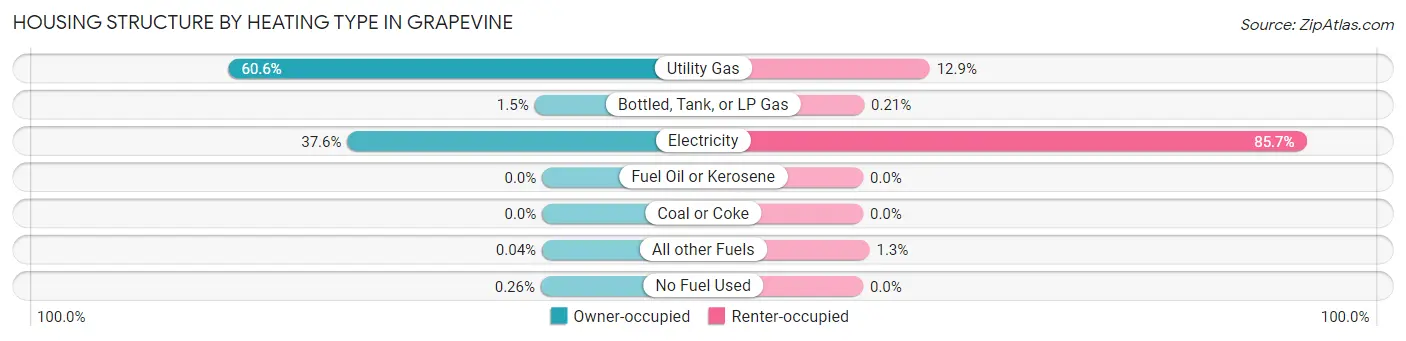
| Heating Type | Owner-occupied | Renter-occupied |
| Utility Gas | 6,877 (60.6%) | 1,293 (12.9%) |
| Bottled, Tank, or LP Gas | 167 (1.5%) | 21 (0.2%) |
| Electricity | 4,272 (37.6%) | 8,594 (85.7%) |
| Fuel Oil or Kerosene | 0 (0.0%) | 0 (0.0%) |
| Coal or Coke | 0 (0.0%) | 0 (0.0%) |
| All other Fuels | 4 (0.0%) | 126 (1.3%) |
| No Fuel Used | 29 (0.3%) | 0 (0.0%) |
| Total | 11,349 (100.0%) | 10,034 (100.0%) |
Household Vehicle Usage in Grapevine
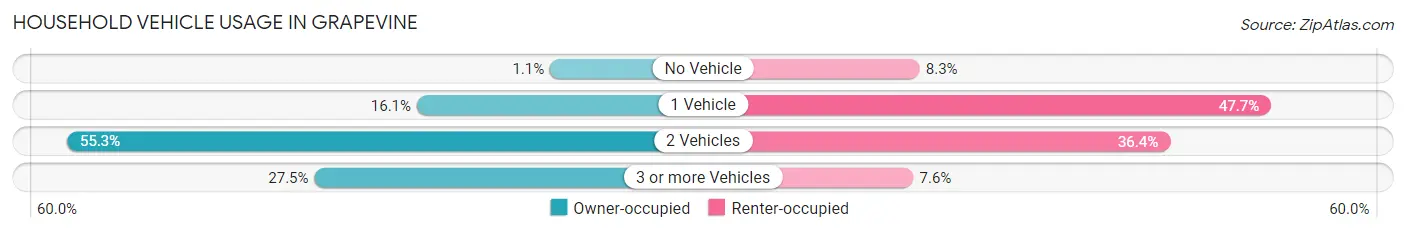
| Vehicles per Household | Owner-occupied | Renter-occupied |
| No Vehicle | 129 (1.1%) | 831 (8.3%) |
| 1 Vehicle | 1,823 (16.1%) | 4,789 (47.7%) |
| 2 Vehicles | 6,272 (55.3%) | 3,653 (36.4%) |
| 3 or more Vehicles | 3,125 (27.5%) | 761 (7.6%) |
| Total | 11,349 (100.0%) | 10,034 (100.0%) |
Real Estate & Mortgages in Grapevine
Real Estate and Mortgage Overview in Grapevine
| Characteristic | Without Mortgage | With Mortgage |
| Housing Units | 3,666 | 7,683 |
| Median Property Value | $414,100 | $441,000 |
| Median Household Income | $103,977 | $4,209 |
| Monthly Housing Costs | $981 | $2,701 |
| Real Estate Taxes | $5,981 | $114 |
Property Value by Mortgage Status in Grapevine
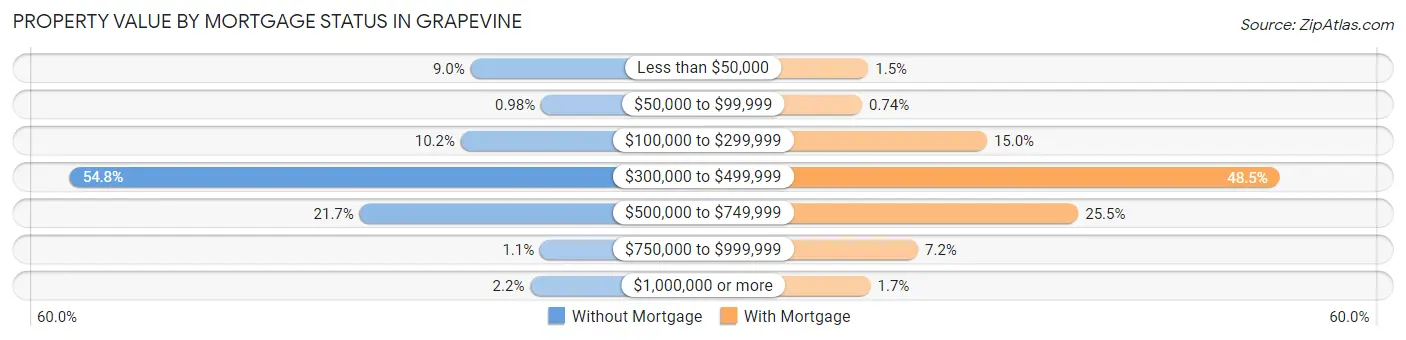
| Property Value | Without Mortgage | With Mortgage |
| Less than $50,000 | 331 (9.0%) | 112 (1.5%) |
| $50,000 to $99,999 | 36 (1.0%) | 57 (0.7%) |
| $100,000 to $299,999 | 372 (10.2%) | 1,154 (15.0%) |
| $300,000 to $499,999 | 2,010 (54.8%) | 3,723 (48.5%) |
| $500,000 to $749,999 | 796 (21.7%) | 1,956 (25.5%) |
| $750,000 to $999,999 | 40 (1.1%) | 549 (7.1%) |
| $1,000,000 or more | 81 (2.2%) | 132 (1.7%) |
| Total | 3,666 (100.0%) | 7,683 (100.0%) |
Household Income by Mortgage Status in Grapevine
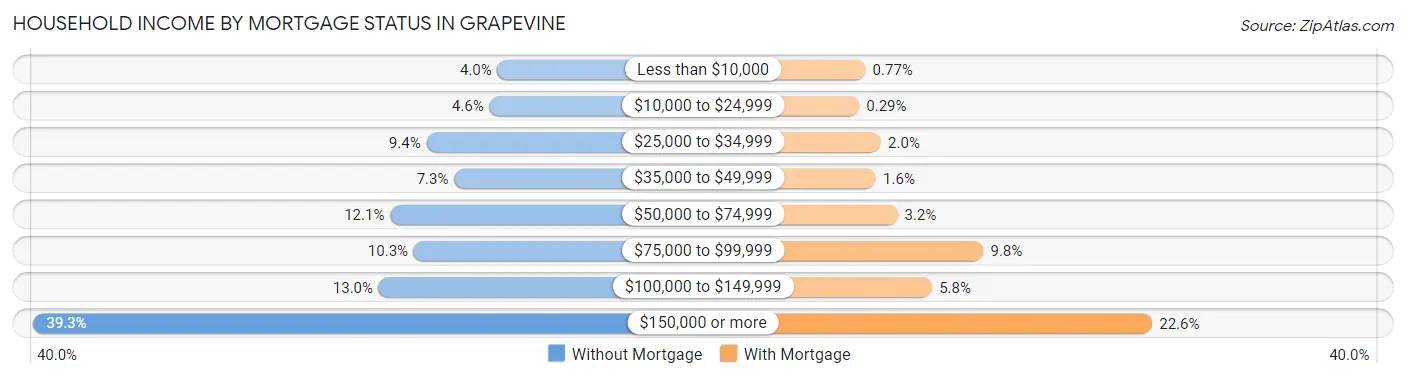
| Household Income | Without Mortgage | With Mortgage |
| Less than $10,000 | 145 (4.0%) | 59 (0.8%) |
| $10,000 to $24,999 | 168 (4.6%) | 22 (0.3%) |
| $25,000 to $34,999 | 344 (9.4%) | 150 (1.9%) |
| $35,000 to $49,999 | 266 (7.3%) | 121 (1.6%) |
| $50,000 to $74,999 | 445 (12.1%) | 246 (3.2%) |
| $75,000 to $99,999 | 379 (10.3%) | 749 (9.8%) |
| $100,000 to $149,999 | 477 (13.0%) | 449 (5.8%) |
| $150,000 or more | 1,442 (39.3%) | 1,737 (22.6%) |
| Total | 3,666 (100.0%) | 7,683 (100.0%) |
Property Value to Household Income Ratio in Grapevine
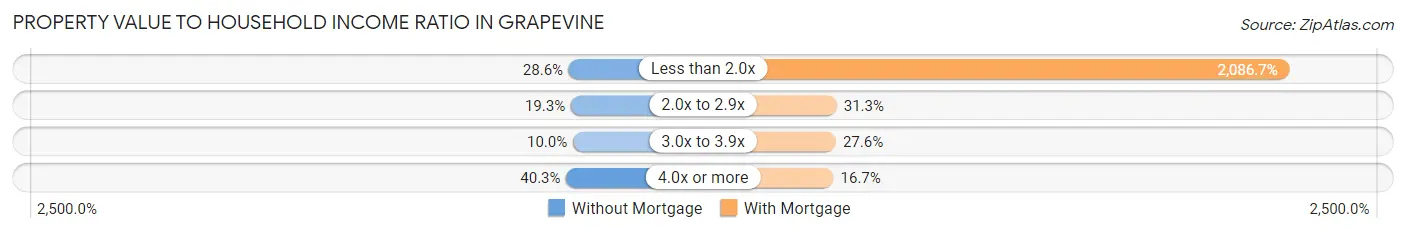
| Value-to-Income Ratio | Without Mortgage | With Mortgage |
| Less than 2.0x | 1,050 (28.6%) | 160,322 (2,086.7%) |
| 2.0x to 2.9x | 708 (19.3%) | 2,402 (31.3%) |
| 3.0x to 3.9x | 366 (10.0%) | 2,121 (27.6%) |
| 4.0x or more | 1,479 (40.3%) | 1,283 (16.7%) |
| Total | 3,666 (100.0%) | 7,683 (100.0%) |
Real Estate Taxes by Mortgage Status in Grapevine
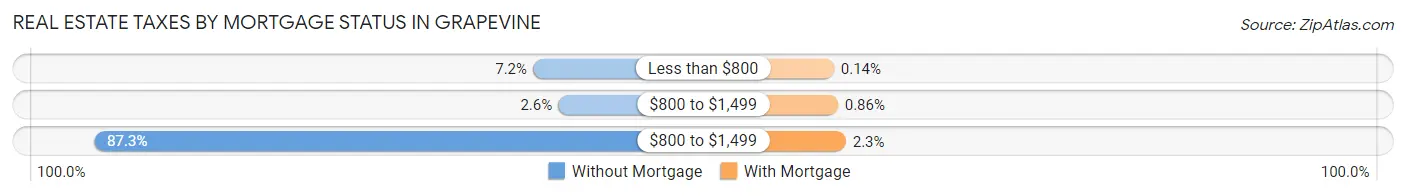
| Property Taxes | Without Mortgage | With Mortgage |
| Less than $800 | 263 (7.2%) | 11 (0.1%) |
| $800 to $1,499 | 94 (2.6%) | 66 (0.9%) |
| $800 to $1,499 | 3,201 (87.3%) | 179 (2.3%) |
| Total | 3,666 (100.0%) | 7,683 (100.0%) |
Health & Disability in Grapevine
Health Insurance Coverage by Age in Grapevine
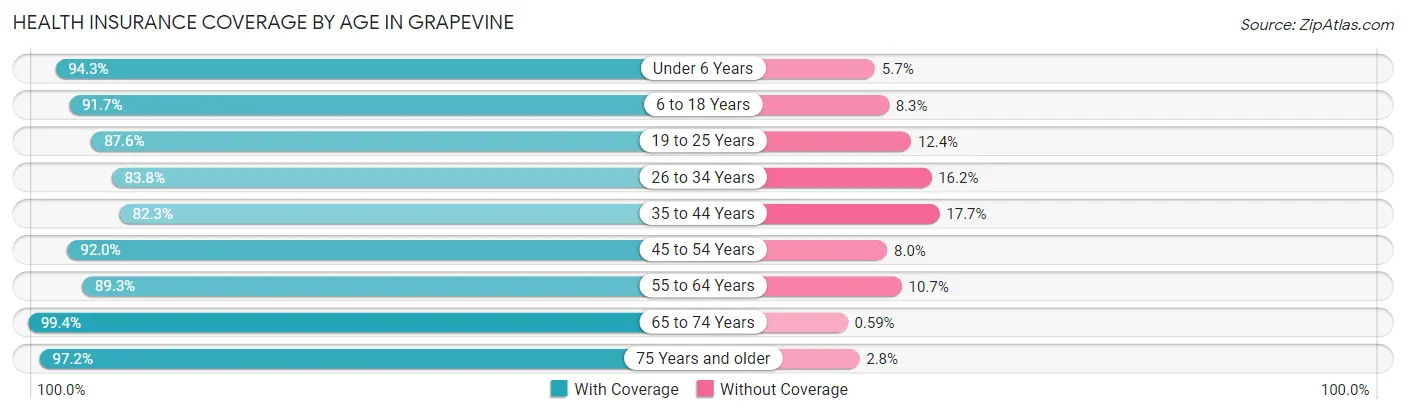
| Age Bracket | With Coverage | Without Coverage |
| Under 6 Years | 3,138 (94.3%) | 190 (5.7%) |
| 6 to 18 Years | 7,222 (91.7%) | 652 (8.3%) |
| 19 to 25 Years | 3,453 (87.6%) | 490 (12.4%) |
| 26 to 34 Years | 5,803 (83.8%) | 1,123 (16.2%) |
| 35 to 44 Years | 5,384 (82.3%) | 1,160 (17.7%) |
| 45 to 54 Years | 6,897 (92.0%) | 598 (8.0%) |
| 55 to 64 Years | 7,112 (89.3%) | 851 (10.7%) |
| 65 to 74 Years | 4,053 (99.4%) | 24 (0.6%) |
| 75 Years and older | 2,295 (97.2%) | 66 (2.8%) |
| Total | 45,357 (89.8%) | 5,154 (10.2%) |
Health Insurance Coverage by Citizenship Status in Grapevine
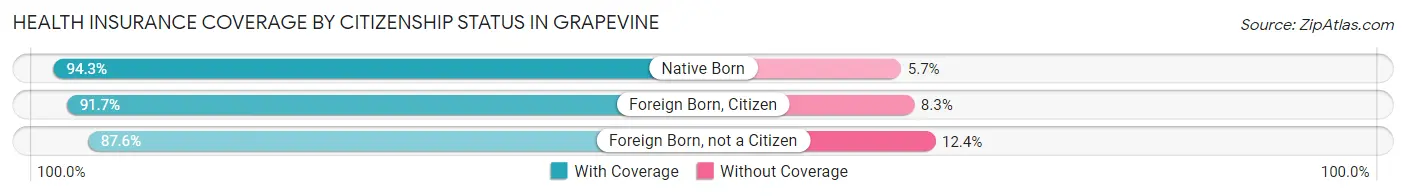
| Citizenship Status | With Coverage | Without Coverage |
| Native Born | 3,138 (94.3%) | 190 (5.7%) |
| Foreign Born, Citizen | 7,222 (91.7%) | 652 (8.3%) |
| Foreign Born, not a Citizen | 3,453 (87.6%) | 490 (12.4%) |
Health Insurance Coverage by Household Income in Grapevine
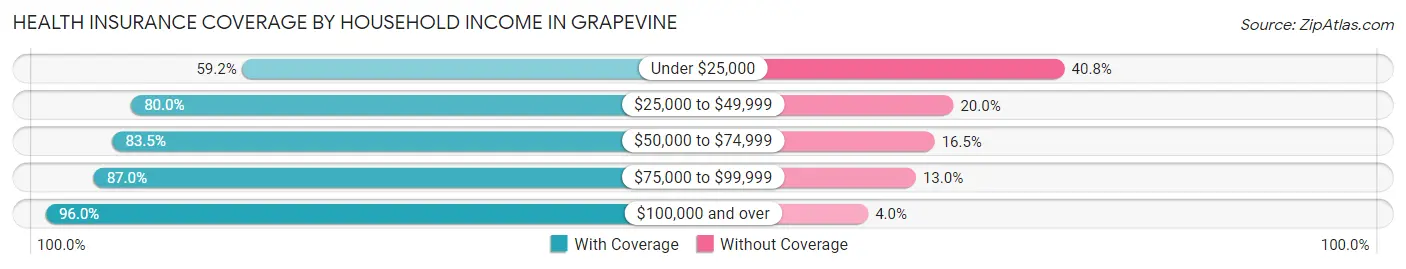
| Household Income | With Coverage | Without Coverage |
| Under $25,000 | 1,451 (59.2%) | 1,001 (40.8%) |
| $25,000 to $49,999 | 5,312 (80.0%) | 1,327 (20.0%) |
| $50,000 to $74,999 | 4,624 (83.5%) | 912 (16.5%) |
| $75,000 to $99,999 | 4,486 (87.0%) | 668 (13.0%) |
| $100,000 and over | 29,428 (96.0%) | 1,230 (4.0%) |
Public vs Private Health Insurance Coverage by Age in Grapevine
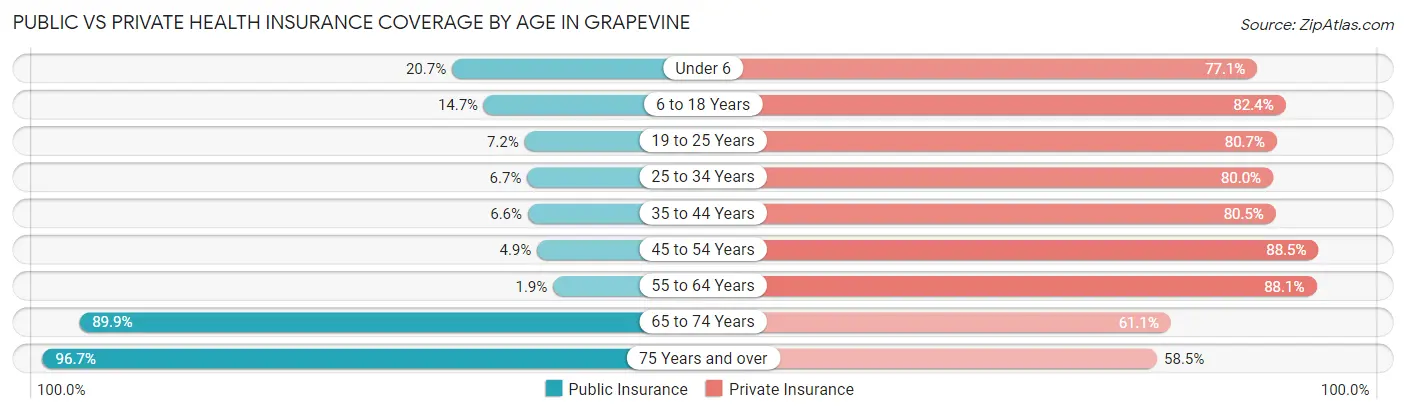
| Age Bracket | Public Insurance | Private Insurance |
| Under 6 | 688 (20.7%) | 2,566 (77.1%) |
| 6 to 18 Years | 1,161 (14.7%) | 6,484 (82.4%) |
| 19 to 25 Years | 284 (7.2%) | 3,183 (80.7%) |
| 25 to 34 Years | 464 (6.7%) | 5,542 (80.0%) |
| 35 to 44 Years | 431 (6.6%) | 5,270 (80.5%) |
| 45 to 54 Years | 365 (4.9%) | 6,629 (88.4%) |
| 55 to 64 Years | 151 (1.9%) | 7,012 (88.1%) |
| 65 to 74 Years | 3,663 (89.8%) | 2,489 (61.1%) |
| 75 Years and over | 2,282 (96.7%) | 1,382 (58.5%) |
| Total | 9,489 (18.8%) | 40,557 (80.3%) |
Disability Status by Sex by Age in Grapevine
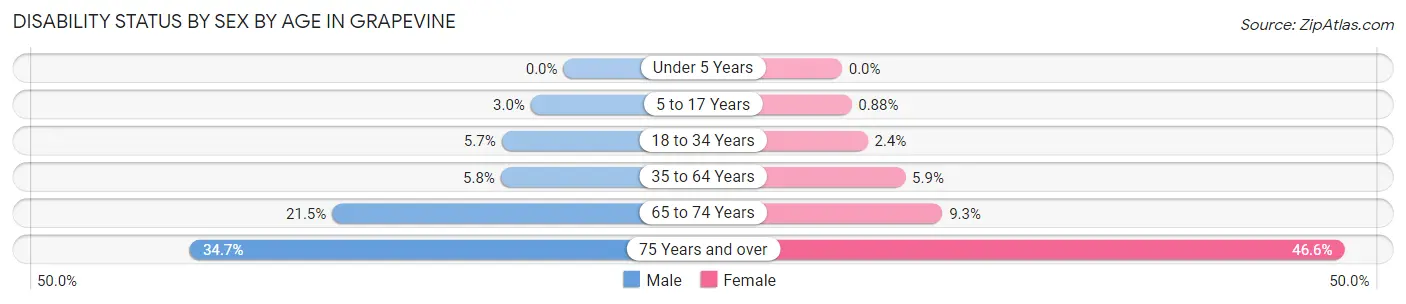
| Age Bracket | Male | Female |
| Under 5 Years | 0 (0.0%) | 0 (0.0%) |
| 5 to 17 Years | 125 (3.0%) | 32 (0.9%) |
| 18 to 34 Years | 361 (5.7%) | 127 (2.4%) |
| 35 to 64 Years | 653 (5.8%) | 634 (5.9%) |
| 65 to 74 Years | 463 (21.5%) | 179 (9.3%) |
| 75 Years and over | 289 (34.6%) | 712 (46.6%) |
Disability Class by Sex by Age in Grapevine
Disability Class: Hearing Difficulty
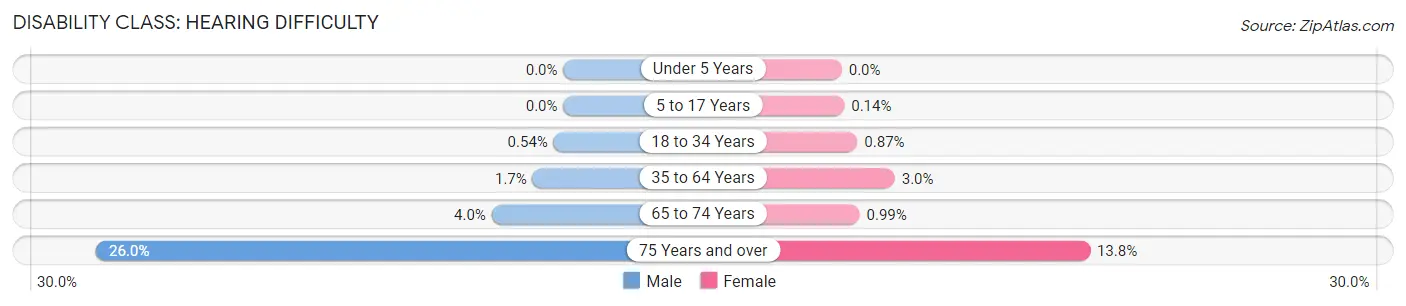
| Age Bracket | Male | Female |
| Under 5 Years | 0 (0.0%) | 0 (0.0%) |
| 5 to 17 Years | 0 (0.0%) | 5 (0.1%) |
| 18 to 34 Years | 34 (0.5%) | 46 (0.9%) |
| 35 to 64 Years | 192 (1.7%) | 318 (2.9%) |
| 65 to 74 Years | 86 (4.0%) | 19 (1.0%) |
| 75 Years and over | 217 (26.0%) | 211 (13.8%) |
Disability Class: Vision Difficulty
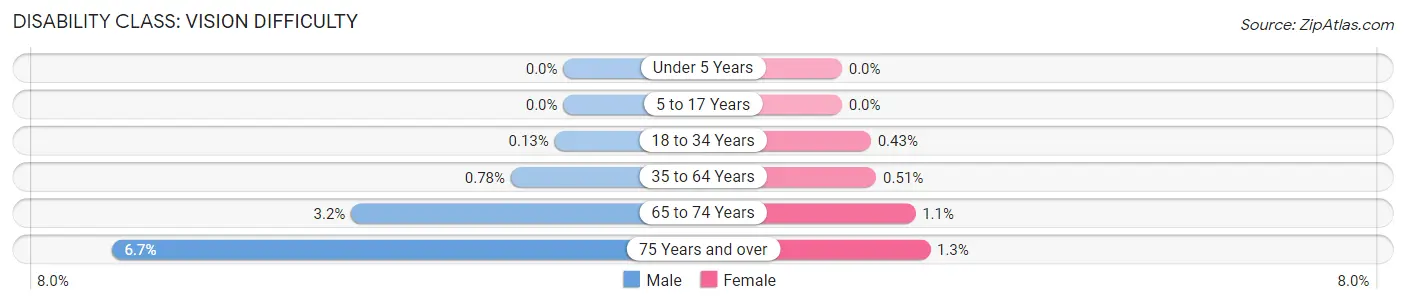
| Age Bracket | Male | Female |
| Under 5 Years | 0 (0.0%) | 0 (0.0%) |
| 5 to 17 Years | 0 (0.0%) | 0 (0.0%) |
| 18 to 34 Years | 8 (0.1%) | 23 (0.4%) |
| 35 to 64 Years | 87 (0.8%) | 55 (0.5%) |
| 65 to 74 Years | 68 (3.2%) | 21 (1.1%) |
| 75 Years and over | 56 (6.7%) | 20 (1.3%) |
Disability Class: Cognitive Difficulty
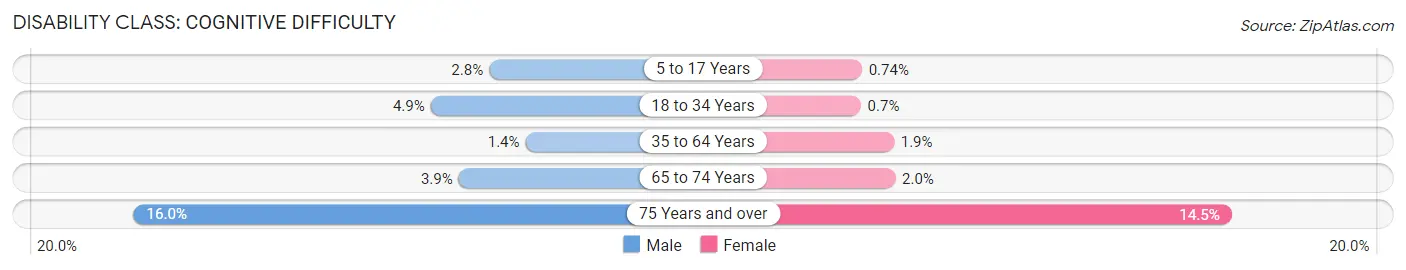
| Age Bracket | Male | Female |
| 5 to 17 Years | 114 (2.8%) | 27 (0.7%) |
| 18 to 34 Years | 310 (4.9%) | 37 (0.7%) |
| 35 to 64 Years | 158 (1.4%) | 208 (1.9%) |
| 65 to 74 Years | 84 (3.9%) | 38 (2.0%) |
| 75 Years and over | 133 (16.0%) | 221 (14.5%) |
Disability Class: Ambulatory Difficulty
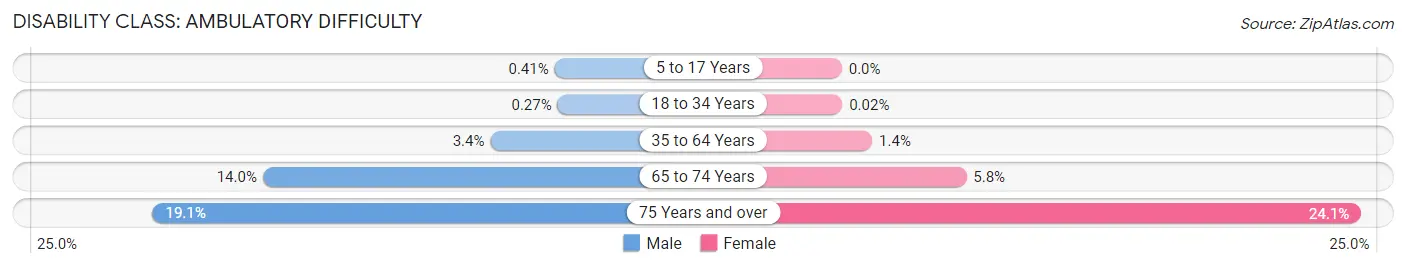
| Age Bracket | Male | Female |
| 5 to 17 Years | 17 (0.4%) | 0 (0.0%) |
| 18 to 34 Years | 17 (0.3%) | 1 (0.0%) |
| 35 to 64 Years | 380 (3.4%) | 152 (1.4%) |
| 65 to 74 Years | 301 (14.0%) | 111 (5.8%) |
| 75 Years and over | 159 (19.1%) | 368 (24.1%) |
Disability Class: Self-Care Difficulty
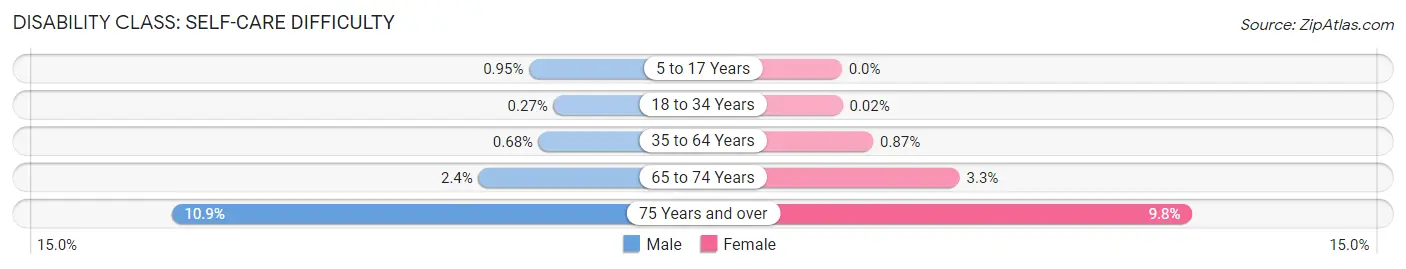
| Age Bracket | Male | Female |
| 5 to 17 Years | 39 (0.9%) | 0 (0.0%) |
| 18 to 34 Years | 17 (0.3%) | 1 (0.0%) |
| 35 to 64 Years | 76 (0.7%) | 94 (0.9%) |
| 65 to 74 Years | 51 (2.4%) | 63 (3.3%) |
| 75 Years and over | 91 (10.9%) | 149 (9.8%) |
Technology Access in Grapevine
Computing Device Access in Grapevine
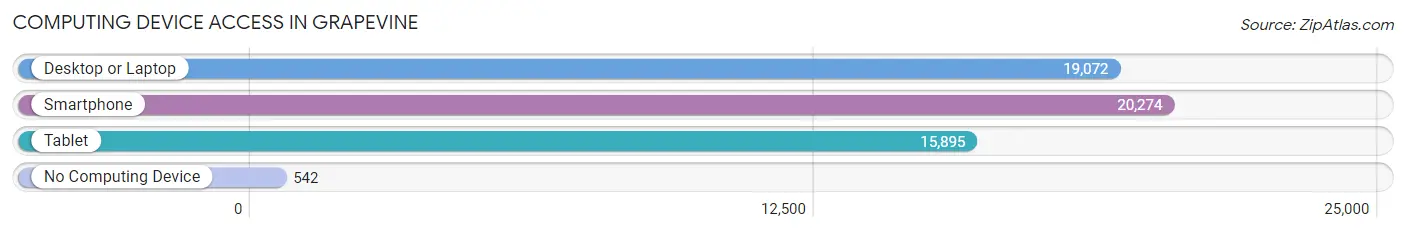
| Device Type | # Households | % Households |
| Desktop or Laptop | 19,072 | 89.2% |
| Smartphone | 20,274 | 94.8% |
| Tablet | 15,895 | 74.3% |
| No Computing Device | 542 | 2.5% |
| Total | 21,383 | 100.0% |
Internet Access in Grapevine
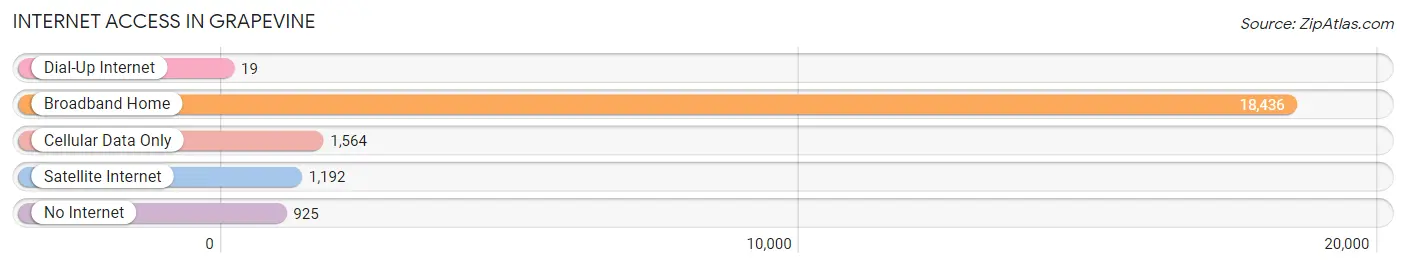
| Internet Type | # Households | % Households |
| Dial-Up Internet | 19 | 0.1% |
| Broadband Home | 18,436 | 86.2% |
| Cellular Data Only | 1,564 | 7.3% |
| Satellite Internet | 1,192 | 5.6% |
| No Internet | 925 | 4.3% |
| Total | 21,383 | 100.0% |
Grapevine Summary
Grapevine, Texas is a city located in the Dallas-Fort Worth metropolitan area in Tarrant County, Texas. It is located in the heart of the Dallas-Fort Worth Metroplex, approximately 25 miles northwest of downtown Dallas and 20 miles northeast of downtown Fort Worth. The city is known for its historic downtown area, which is home to a variety of shops, restaurants, and attractions.
Geography
Grapevine is located in the northeast corner of Tarrant County, Texas, at the intersection of State Highway 121 and State Highway 114. The city is situated on the banks of Lake Grapevine, a 7,000-acre lake that is part of the Trinity River watershed. The city is bordered by the cities of Southlake, Colleyville, and Flower Mound. The city has a total area of 24.2 square miles, of which 22.7 square miles is land and 1.5 square miles is water.
Economy
Grapevine is home to a variety of businesses, including retail, manufacturing, and technology. The city is home to the headquarters of several major companies, including GameStop, Dr Pepper Snapple Group, and Frito-Lay. The city is also home to the Dallas/Fort Worth International Airport, which is the fourth busiest airport in the world.
Grapevine is also home to a variety of tourist attractions, including the Grapevine Vintage Railroad, the Grapevine Mills Mall, and the Gaylord Texan Resort and Convention Center. The city is also home to the Great Wolf Lodge, a family-friendly resort and water park.
Demographics
As of the 2010 census, the population of Grapevine was 46,334. The racial makeup of the city was 79.2% White, 8.2% African American, 0.4% Native American, 5.2% Asian, 0.1% Pacific Islander, 4.3% from other races, and 2.6% from two or more races. Hispanic or Latino of any race were 13.2% of the population.
The median income for a household in the city was $63,837, and the median income for a family was $76,843. The per capita income for the city was $32,845. About 4.2% of families and 5.7% of the population were below the poverty line, including 7.2% of those under age 18 and 4.2% of those age 65 or over.
Conclusion
Grapevine, Texas is a vibrant city located in the Dallas-Fort Worth metropolitan area. The city is known for its historic downtown area, which is home to a variety of shops, restaurants, and attractions. The city is also home to a variety of businesses, including retail, manufacturing, and technology. The city has a diverse population and a strong economy. Grapevine is an ideal place to live, work, and play.
Common Questions
What is Per Capita Income in Grapevine?
Per Capita income in Grapevine is $57,706.
What is the Median Family Income in Grapevine?
Median Family Income in Grapevine is $139,630.
What is the Median Household income in Grapevine?
Median Household Income in Grapevine is $107,165.
What is Income or Wage Gap in Grapevine?
Income or Wage Gap in Grapevine is 18.3%.
Women in Grapevine earn 81.7 cents for every dollar earned by a man.
What is Inequality or Gini Index in Grapevine?
Inequality or Gini Index in Grapevine is 0.43.
What is the Total Population of Grapevine?
Total Population of Grapevine is 50,763.
What is the Total Male Population of Grapevine?
Total Male Population of Grapevine is 26,058.
What is the Total Female Population of Grapevine?
Total Female Population of Grapevine is 24,705.
What is the Ratio of Males per 100 Females in Grapevine?
There are 105.48 Males per 100 Females in Grapevine.
What is the Ratio of Females per 100 Males in Grapevine?
There are 94.81 Females per 100 Males in Grapevine.
What is the Median Population Age in Grapevine?
Median Population Age in Grapevine is 39.8 Years.
What is the Average Family Size in Grapevine
Average Family Size in Grapevine is 3.0 People.
What is the Average Household Size in Grapevine
Average Household Size in Grapevine is 2.4 People.
How Large is the Labor Force in Grapevine?
There are 31,850 People in the Labor Forcein in Grapevine.
What is the Percentage of People in the Labor Force in Grapevine?
76.9% of People are in the Labor Force in Grapevine.
What is the Unemployment Rate in Grapevine?
Unemployment Rate in Grapevine is 5.0%.