Sierra Blanca, TX Map & Demographics
Sierra Blanca Map
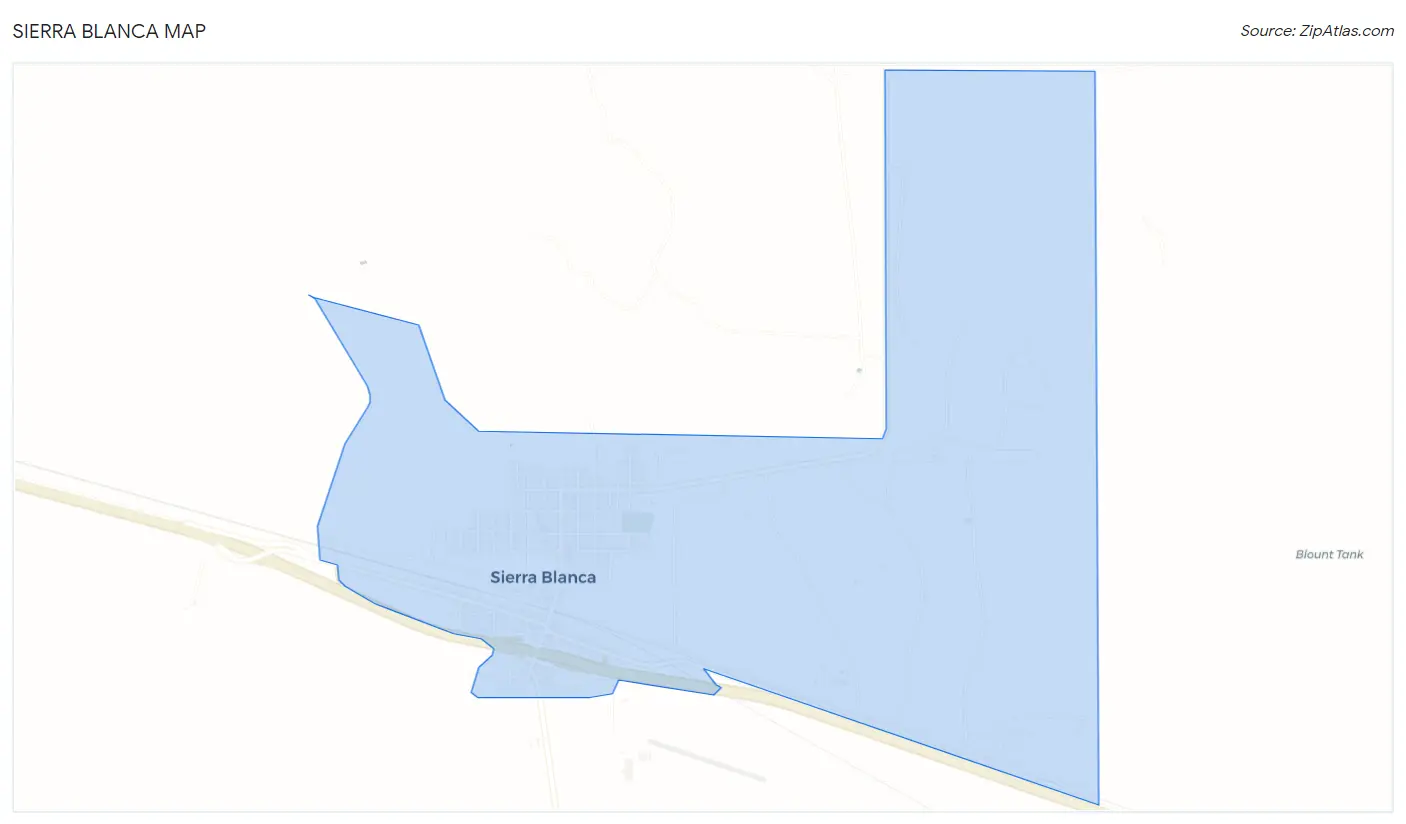
Sierra Blanca Overview
$22,042
PER CAPITA INCOME
$93,393
AVG FAMILY INCOME
$56,563
AVG HOUSEHOLD INCOME
3.9%
WAGE / INCOME GAP [ % ]
96.1¢/ $1
WAGE / INCOME GAP [ $ ]
0.39
INEQUALITY / GINI INDEX
544
TOTAL POPULATION
264
MALE POPULATION
280
FEMALE POPULATION
94.29
MALES / 100 FEMALES
106.06
FEMALES / 100 MALES
30.8
MEDIAN AGE
3.6
AVG FAMILY SIZE
2.9
AVG HOUSEHOLD SIZE
208
LABOR FORCE [ PEOPLE ]
49.5%
PERCENT IN LABOR FORCE
7.7%
UNEMPLOYMENT RATE
Sierra Blanca Zip Codes
Sierra Blanca Area Codes
Income in Sierra Blanca
Income Overview in Sierra Blanca
Per Capita Income in Sierra Blanca is $22,042, while median incomes of families and households are $93,393 and $56,563 respectively.
| Characteristic | Number | Measure |
| Per Capita Income | 544 | $22,042 |
| Median Family Income | 105 | $93,393 |
| Mean Family Income | 105 | $92,194 |
| Median Household Income | 163 | $56,563 |
| Mean Household Income | 163 | $72,280 |
| Income Deficit | 105 | $0 |
| Wage / Income Gap (%) | 544 | 3.86% |
| Wage / Income Gap ($) | 544 | 96.14¢ per $1 |
| Gini / Inequality Index | 544 | 0.39 |
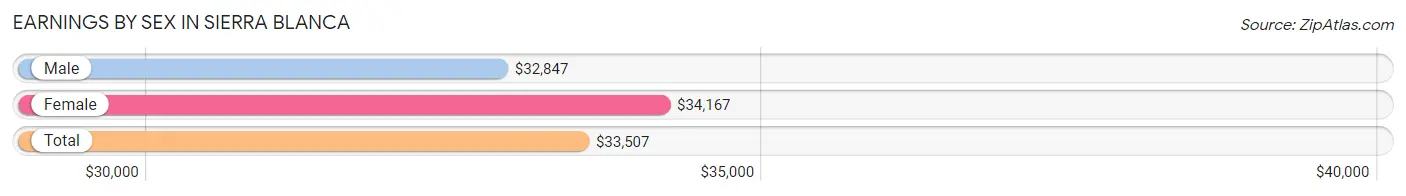
Earnings by Sex in Sierra Blanca
Average Earnings in Sierra Blanca are $33,507, $32,847 for men and $34,167 for women, a difference of 3.9%.
| Sex | Number | Average Earnings |
| Male | 171 (71.0%) | $32,847 |
| Female | 70 (29.0%) | $34,167 |
| Total | 241 (100.0%) | $33,507 |
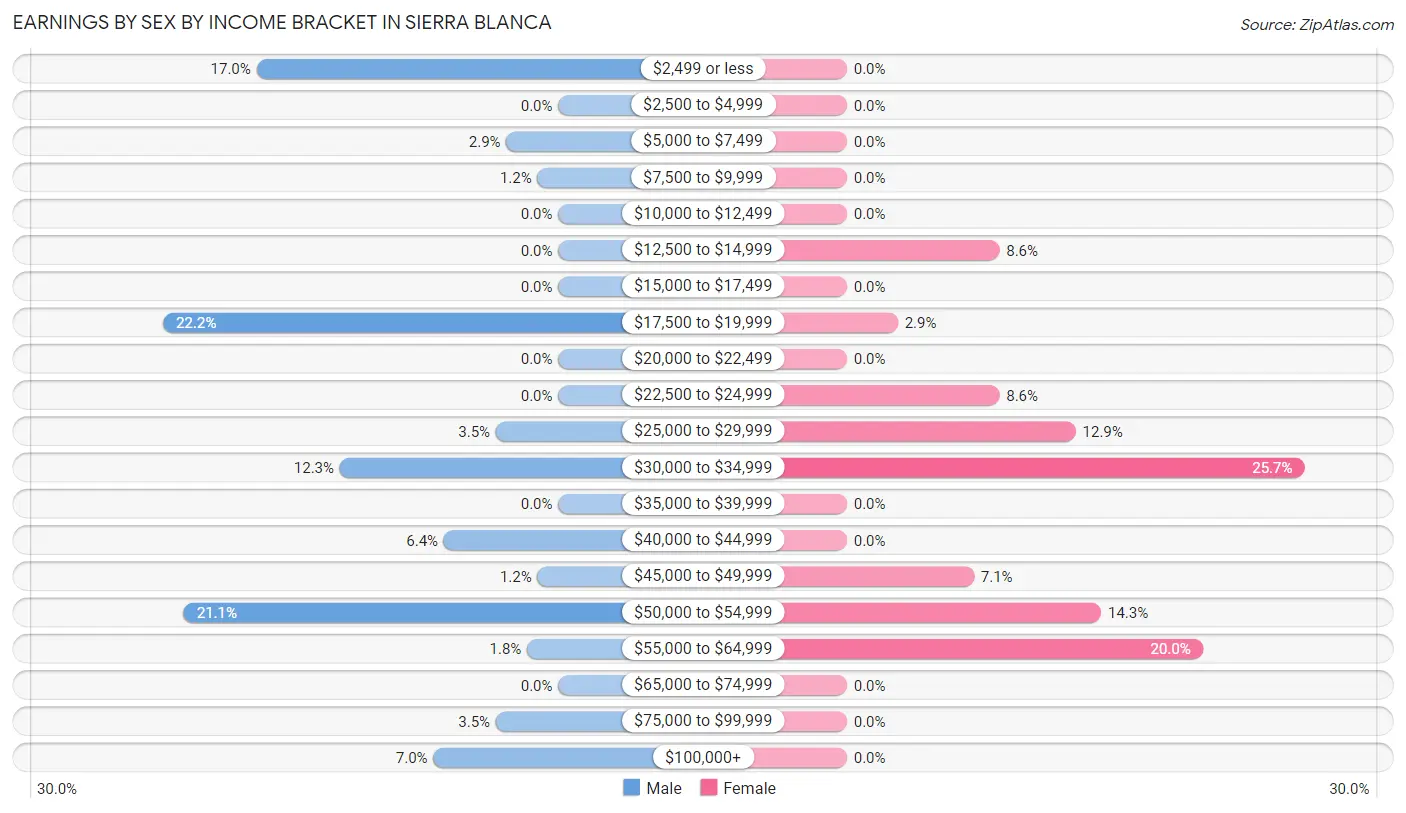
Earnings by Sex by Income Bracket in Sierra Blanca
The most common earnings brackets in Sierra Blanca are $17,500 to $19,999 for men (38 | 22.2%) and $30,000 to $34,999 for women (18 | 25.7%).
| Income | Male | Female |
| $2,499 or less | 29 (17.0%) | 0 (0.0%) |
| $2,500 to $4,999 | 0 (0.0%) | 0 (0.0%) |
| $5,000 to $7,499 | 5 (2.9%) | 0 (0.0%) |
| $7,500 to $9,999 | 2 (1.2%) | 0 (0.0%) |
| $10,000 to $12,499 | 0 (0.0%) | 0 (0.0%) |
| $12,500 to $14,999 | 0 (0.0%) | 6 (8.6%) |
| $15,000 to $17,499 | 0 (0.0%) | 0 (0.0%) |
| $17,500 to $19,999 | 38 (22.2%) | 2 (2.9%) |
| $20,000 to $22,499 | 0 (0.0%) | 0 (0.0%) |
| $22,500 to $24,999 | 0 (0.0%) | 6 (8.6%) |
| $25,000 to $29,999 | 6 (3.5%) | 9 (12.9%) |
| $30,000 to $34,999 | 21 (12.3%) | 18 (25.7%) |
| $35,000 to $39,999 | 0 (0.0%) | 0 (0.0%) |
| $40,000 to $44,999 | 11 (6.4%) | 0 (0.0%) |
| $45,000 to $49,999 | 2 (1.2%) | 5 (7.1%) |
| $50,000 to $54,999 | 36 (21.0%) | 10 (14.3%) |
| $55,000 to $64,999 | 3 (1.8%) | 14 (20.0%) |
| $65,000 to $74,999 | 0 (0.0%) | 0 (0.0%) |
| $75,000 to $99,999 | 6 (3.5%) | 0 (0.0%) |
| $100,000+ | 12 (7.0%) | 0 (0.0%) |
| Total | 171 (100.0%) | 70 (100.0%) |
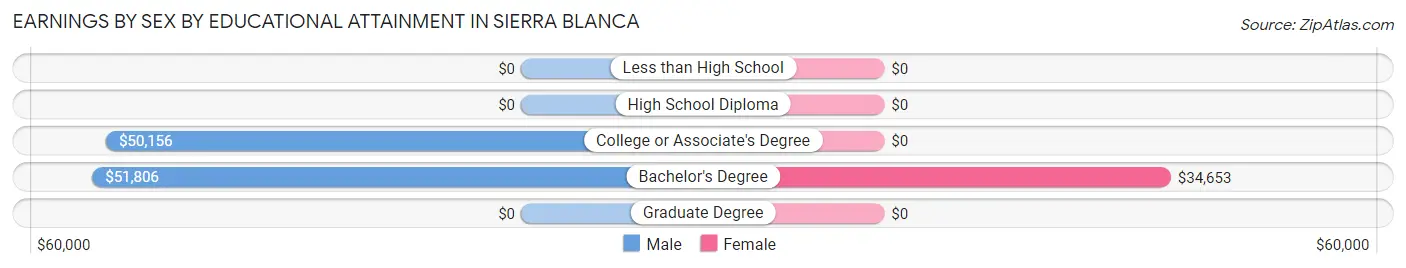
Earnings by Sex by Educational Attainment in Sierra Blanca
Average earnings in Sierra Blanca are $34,444 for men and $34,583 for women, a difference of 0.4%. Men with an educational attainment of bachelor's degree enjoy the highest average annual earnings of $51,806, while those with college or associate's degree education earn the least with $50,156. Women with an educational attainment of bachelor's degree earn the most with the average annual earnings of $34,653, while those with bachelor's degree education have the smallest earnings of $34,653.
| Educational Attainment | Male Income | Female Income |
| Less than High School | - | - |
| High School Diploma | - | - |
| College or Associate's Degree | $50,156 | $0 |
| Bachelor's Degree | $51,806 | $34,653 |
| Graduate Degree | - | - |
| Total | $34,444 | $34,583 |
Family Income in Sierra Blanca
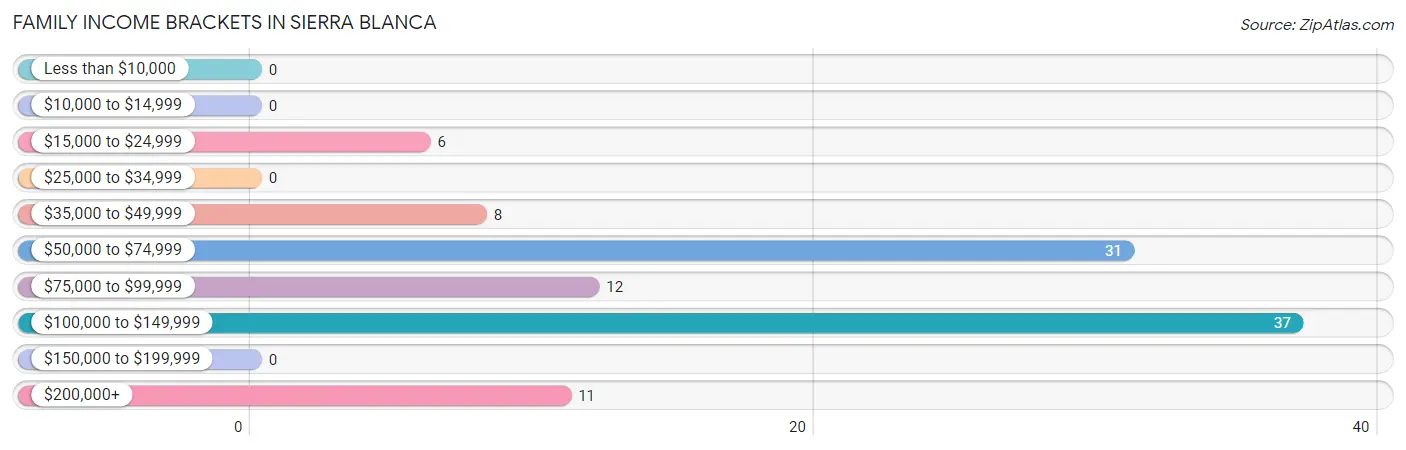
Family Income Brackets in Sierra Blanca
According to the Sierra Blanca family income data, there are 37 families falling into the $100,000 to $149,999 income range, which is the most common income bracket and makes up 35.2% of all families.
| Income Bracket | # Families | % Families |
| Less than $10,000 | 0 | 0.0% |
| $10,000 to $14,999 | 0 | 0.0% |
| $15,000 to $24,999 | 6 | 5.7% |
| $25,000 to $34,999 | 0 | 0.0% |
| $35,000 to $49,999 | 8 | 7.6% |
| $50,000 to $74,999 | 31 | 29.5% |
| $75,000 to $99,999 | 12 | 11.4% |
| $100,000 to $149,999 | 37 | 35.2% |
| $150,000 to $199,999 | 0 | 0.0% |
| $200,000+ | 11 | 10.5% |
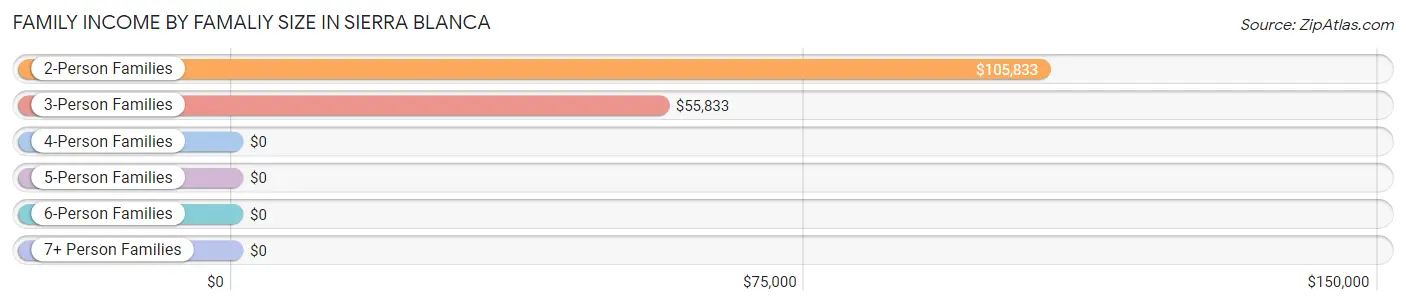
Family Income by Famaliy Size in Sierra Blanca
2-person families (62 | 59.1%) account for the highest median family income in Sierra Blanca with $105,833 per family, while 2-person families (62 | 59.1%) have the highest median income of $52,916 per family member.
| Income Bracket | # Families | Median Income |
| 2-Person Families | 62 (59.1%) | $105,833 |
| 3-Person Families | 22 (20.9%) | $55,833 |
| 4-Person Families | 9 (8.6%) | $0 |
| 5-Person Families | 5 (4.8%) | $0 |
| 6-Person Families | 7 (6.7%) | $0 |
| 7+ Person Families | 0 (0.0%) | $0 |
| Total | 105 (100.0%) | $93,393 |
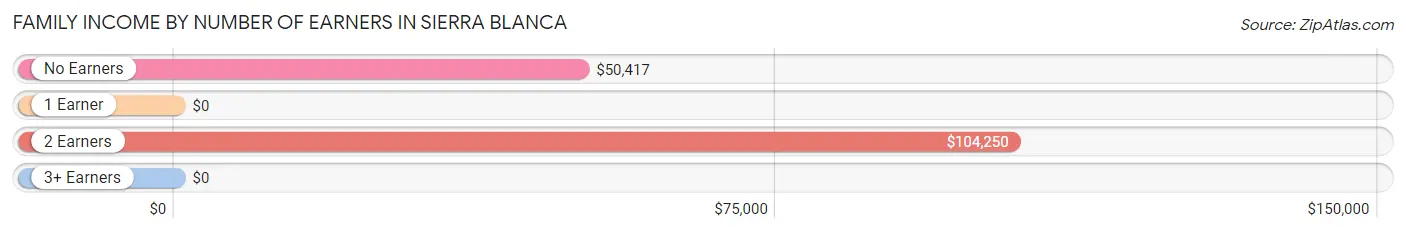
Family Income by Number of Earners in Sierra Blanca
| Number of Earners | # Families | Median Income |
| No Earners | 11 (10.5%) | $50,417 |
| 1 Earner | 30 (28.6%) | $0 |
| 2 Earners | 61 (58.1%) | $104,250 |
| 3+ Earners | 3 (2.9%) | $0 |
| Total | 105 (100.0%) | $93,393 |
Household Income in Sierra Blanca
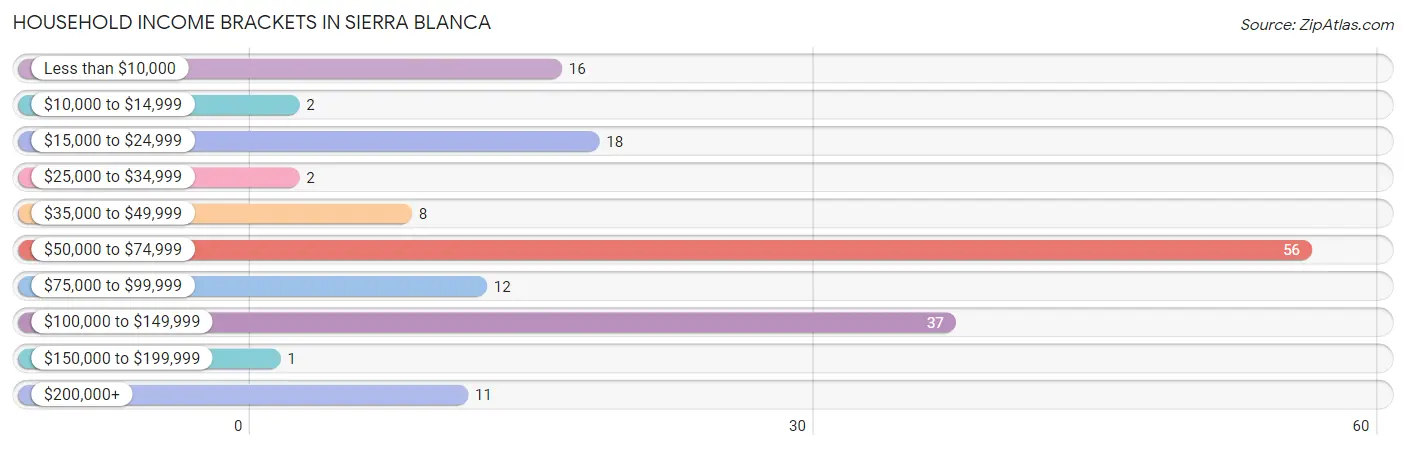
Household Income Brackets in Sierra Blanca
With 56 households falling in the category, the $50,000 to $74,999 income range is the most frequent in Sierra Blanca, accounting for 34.4% of all households. In contrast, only 1 households (0.6%) fall into the $150,000 to $199,999 income bracket, making it the least populous group.
| Income Bracket | # Households | % Households |
| Less than $10,000 | 16 | 9.8% |
| $10,000 to $14,999 | 2 | 1.2% |
| $15,000 to $24,999 | 18 | 11.0% |
| $25,000 to $34,999 | 2 | 1.2% |
| $35,000 to $49,999 | 8 | 4.9% |
| $50,000 to $74,999 | 56 | 34.4% |
| $75,000 to $99,999 | 12 | 7.4% |
| $100,000 to $149,999 | 37 | 22.7% |
| $150,000 to $199,999 | 1 | 0.6% |
| $200,000+ | 11 | 6.7% |
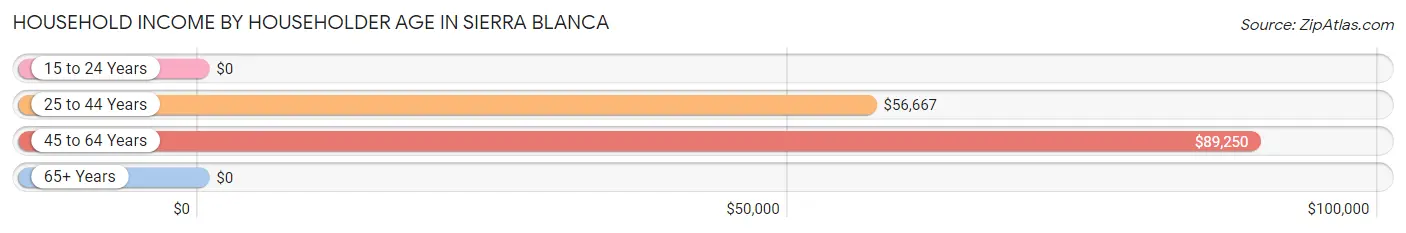
Household Income by Householder Age in Sierra Blanca
The median household income in Sierra Blanca is $56,563, with the highest median household income of $89,250 found in the 45 to 64 years age bracket for the primary householder. A total of 25 households (15.3%) fall into this category.
| Income Bracket | # Households | Median Income |
| 15 to 24 Years | 0 (0.0%) | $0 |
| 25 to 44 Years | 74 (45.4%) | $56,667 |
| 45 to 64 Years | 25 (15.3%) | $89,250 |
| 65+ Years | 64 (39.3%) | $0 |
| Total | 163 (100.0%) | $56,563 |
Poverty in Sierra Blanca
Income Below Poverty by Sex and Age in Sierra Blanca
With 18.1% poverty level for males and 16.8% for females among the residents of Sierra Blanca, 18 to 24 year old males and 75 year old and over females are the most vulnerable to poverty, with 17 males (100.0%) and 3 females (60.0%) in their respective age groups living below the poverty level.
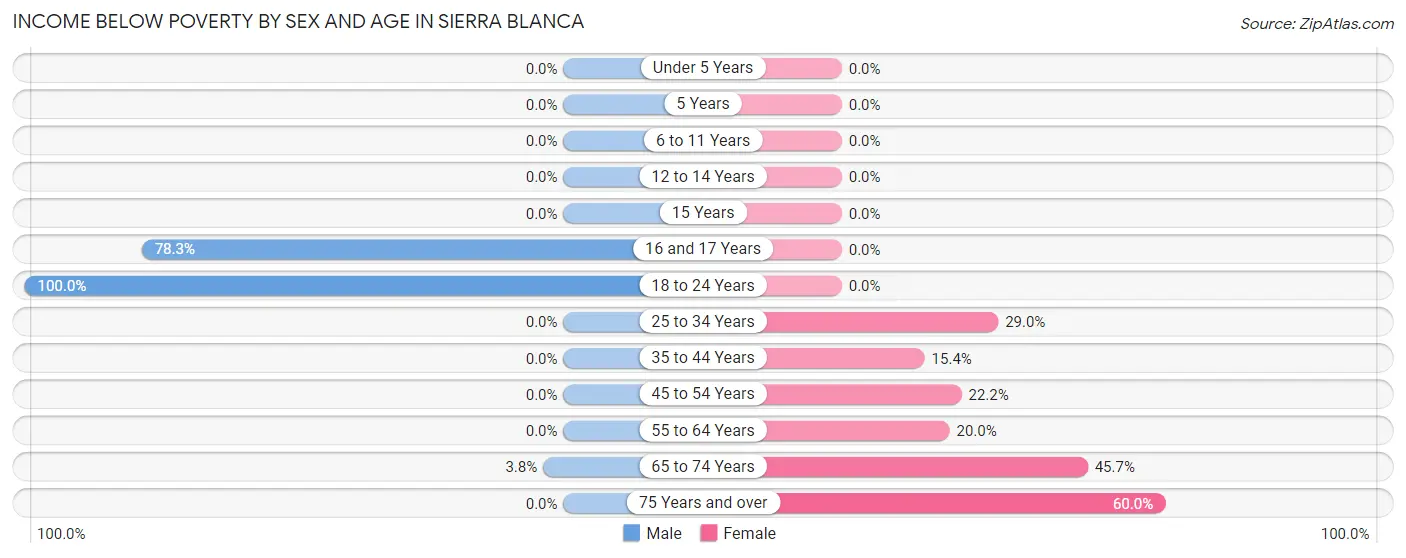
| Age Bracket | Male | Female |
| Under 5 Years | 0 (0.0%) | 0 (0.0%) |
| 5 Years | 0 (0.0%) | 0 (0.0%) |
| 6 to 11 Years | 0 (0.0%) | 0 (0.0%) |
| 12 to 14 Years | 0 (0.0%) | 0 (0.0%) |
| 15 Years | 0 (0.0%) | 0 (0.0%) |
| 16 and 17 Years | 18 (78.3%) | 0 (0.0%) |
| 18 to 24 Years | 17 (100.0%) | 0 (0.0%) |
| 25 to 34 Years | 0 (0.0%) | 9 (29.0%) |
| 35 to 44 Years | 0 (0.0%) | 6 (15.4%) |
| 45 to 54 Years | 0 (0.0%) | 6 (22.2%) |
| 55 to 64 Years | 0 (0.0%) | 2 (20.0%) |
| 65 to 74 Years | 2 (3.8%) | 21 (45.7%) |
| 75 Years and over | 0 (0.0%) | 3 (60.0%) |
| Total | 37 (18.1%) | 47 (16.8%) |
Income Above Poverty by Sex and Age in Sierra Blanca
According to the poverty statistics in Sierra Blanca, males aged 12 to 14 years and females aged under 5 years are the age groups that are most secure financially, with 100.0% of males and 100.0% of females in these age groups living above the poverty line.
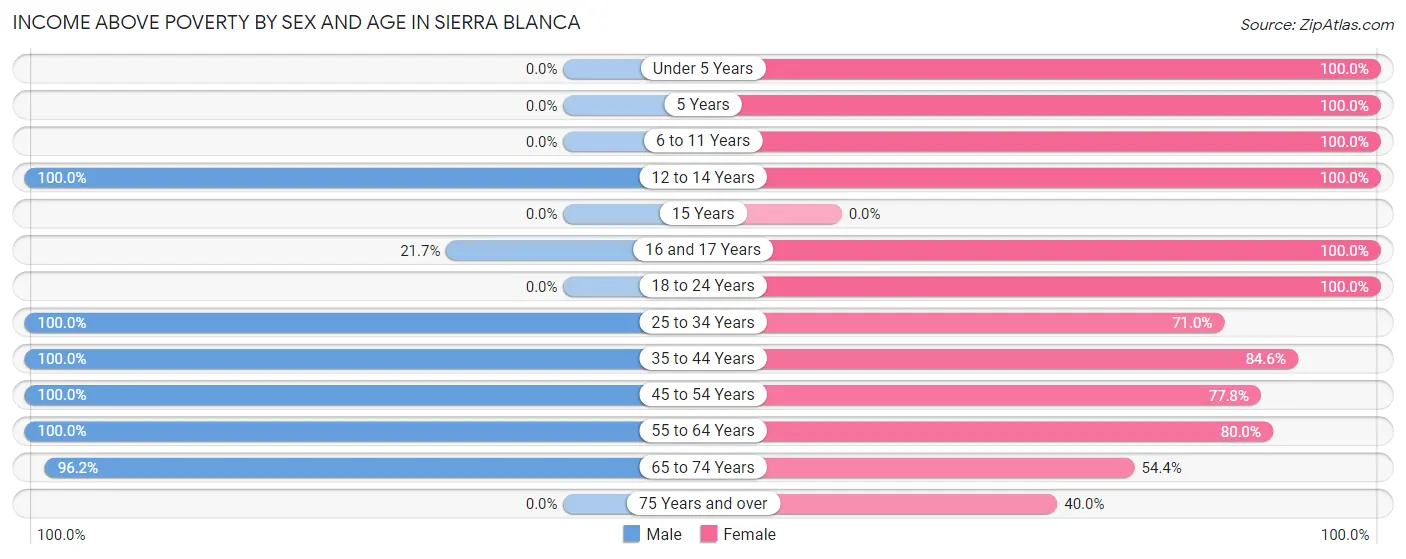
| Age Bracket | Male | Female |
| Under 5 Years | 0 (0.0%) | 74 (100.0%) |
| 5 Years | 0 (0.0%) | 12 (100.0%) |
| 6 to 11 Years | 0 (0.0%) | 8 (100.0%) |
| 12 to 14 Years | 25 (100.0%) | 5 (100.0%) |
| 15 Years | 0 (0.0%) | 0 (0.0%) |
| 16 and 17 Years | 5 (21.7%) | 17 (100.0%) |
| 18 to 24 Years | 0 (0.0%) | 6 (100.0%) |
| 25 to 34 Years | 43 (100.0%) | 22 (71.0%) |
| 35 to 44 Years | 20 (100.0%) | 33 (84.6%) |
| 45 to 54 Years | 9 (100.0%) | 21 (77.8%) |
| 55 to 64 Years | 14 (100.0%) | 8 (80.0%) |
| 65 to 74 Years | 51 (96.2%) | 25 (54.3%) |
| 75 Years and over | 0 (0.0%) | 2 (40.0%) |
| Total | 167 (81.9%) | 233 (83.2%) |
Income Below Poverty Among Married-Couple Families in Sierra Blanca
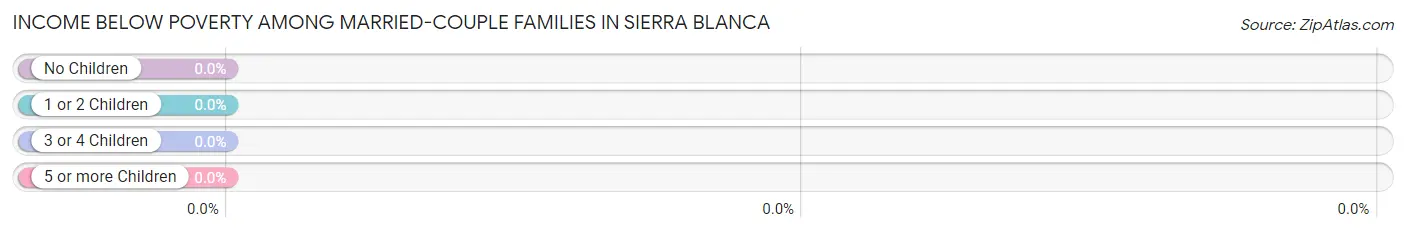
| Children | Above Poverty | Below Poverty |
| No Children | 43 (100.0%) | 0 (0.0%) |
| 1 or 2 Children | 22 (100.0%) | 0 (0.0%) |
| 3 or 4 Children | 7 (100.0%) | 0 (0.0%) |
| 5 or more Children | 0 (0.0%) | 0 (0.0%) |
| Total | 72 (100.0%) | 0 (0.0%) |
Income Below Poverty Among Single-Parent Households in Sierra Blanca
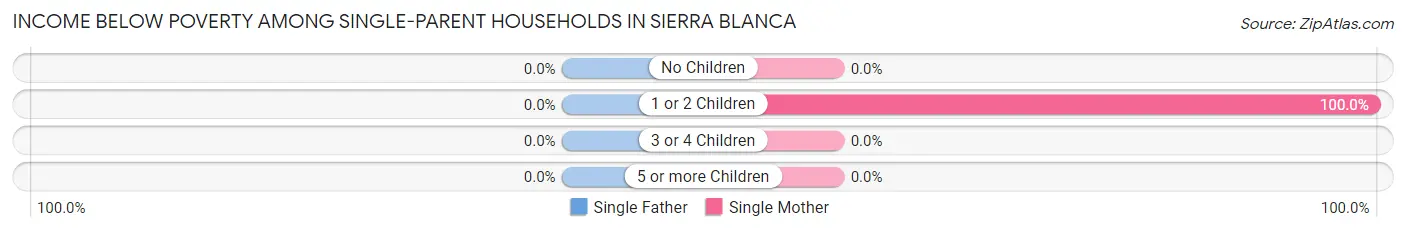
| Children | Single Father | Single Mother |
| No Children | 0 (0.0%) | 0 (0.0%) |
| 1 or 2 Children | 0 (0.0%) | 6 (100.0%) |
| 3 or 4 Children | 0 (0.0%) | 0 (0.0%) |
| 5 or more Children | 0 (0.0%) | 0 (0.0%) |
| Total | 0 (0.0%) | 6 (100.0%) |
Income Below Poverty Among Married-Couple vs Single-Parent Households in Sierra Blanca
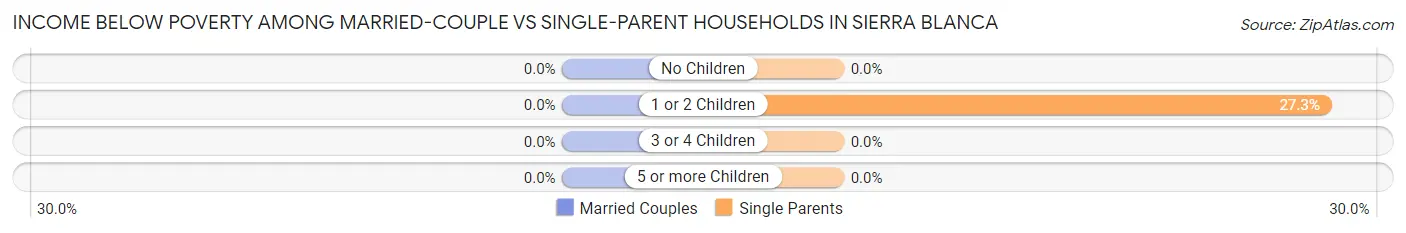
| Children | Married-Couple Families | Single-Parent Households |
| No Children | 0 (0.0%) | 0 (0.0%) |
| 1 or 2 Children | 0 (0.0%) | 6 (27.3%) |
| 3 or 4 Children | 0 (0.0%) | 0 (0.0%) |
| 5 or more Children | 0 (0.0%) | 0 (0.0%) |
| Total | 0 (0.0%) | 6 (18.2%) |
Race in Sierra Blanca
The most populous races in Sierra Blanca are Hispanic or Latino (411 | 75.5%), Two or more Races (318 | 58.5%), and White / Caucasian (149 | 27.4%).
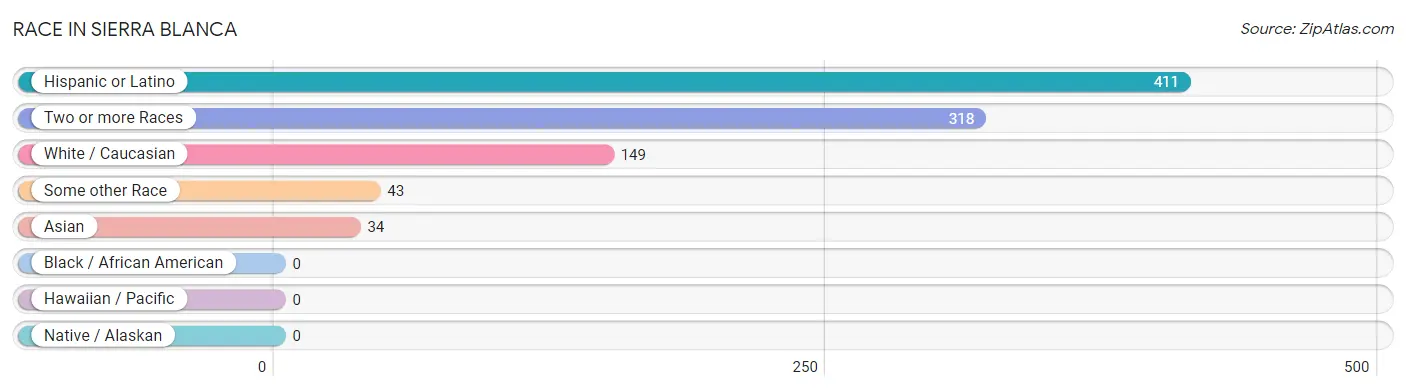
| Race | # Population | % Population |
| Asian | 34 | 6.2% |
| Black / African American | 0 | 0.0% |
| Hawaiian / Pacific | 0 | 0.0% |
| Hispanic or Latino | 411 | 75.5% |
| Native / Alaskan | 0 | 0.0% |
| White / Caucasian | 149 | 27.4% |
| Two or more Races | 318 | 58.5% |
| Some other Race | 43 | 7.9% |
| Total | 544 | 100.0% |
Ancestry in Sierra Blanca
The most populous ancestries reported in Sierra Blanca are Mexican (375 | 68.9%), American (36 | 6.6%), Pakistani (34 | 6.2%), Irish (32 | 5.9%), and English (28 | 5.1%), together accounting for 92.8% of all Sierra Blanca residents.
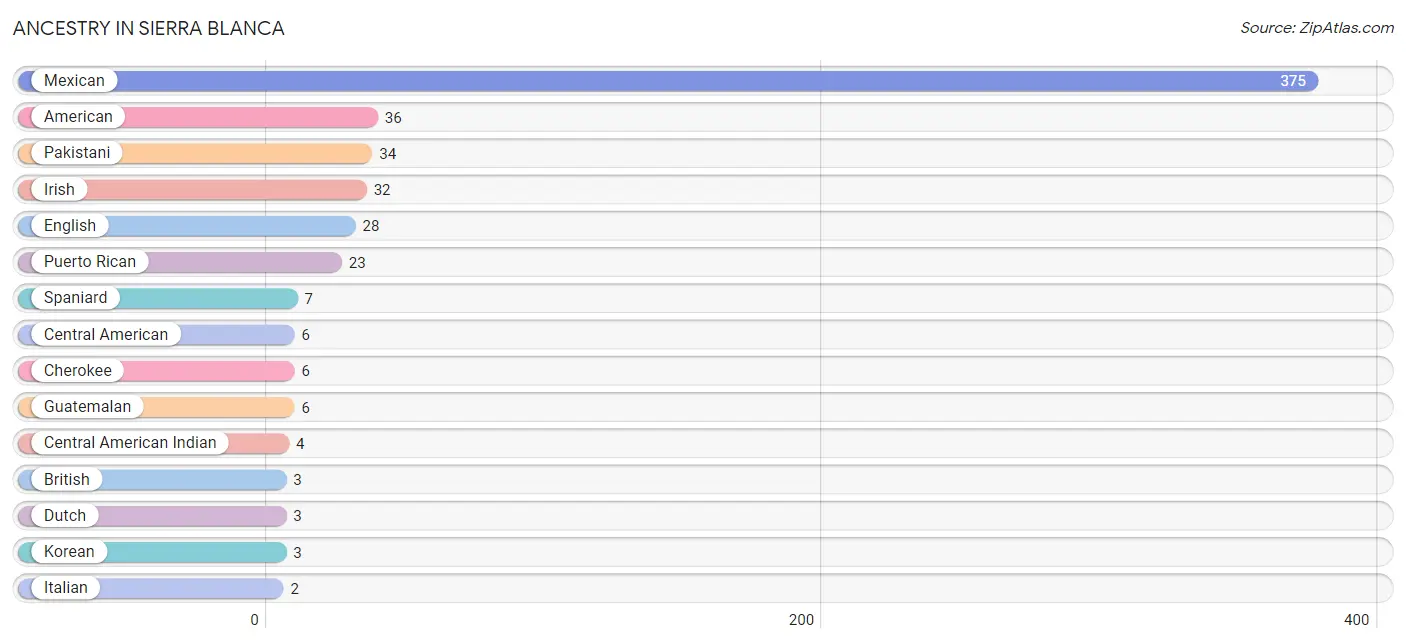
| Ancestry | # Population | % Population |
| American | 36 | 6.6% |
| British | 3 | 0.5% |
| Central American | 6 | 1.1% |
| Central American Indian | 4 | 0.7% |
| Cherokee | 6 | 1.1% |
| Dutch | 3 | 0.5% |
| English | 28 | 5.1% |
| Guatemalan | 6 | 1.1% |
| Irish | 32 | 5.9% |
| Italian | 2 | 0.4% |
| Korean | 3 | 0.5% |
| Mexican | 375 | 68.9% |
| Pakistani | 34 | 6.2% |
| Puerto Rican | 23 | 4.2% |
| Spaniard | 7 | 1.3% | View All 15 Rows |
Immigrants in Sierra Blanca
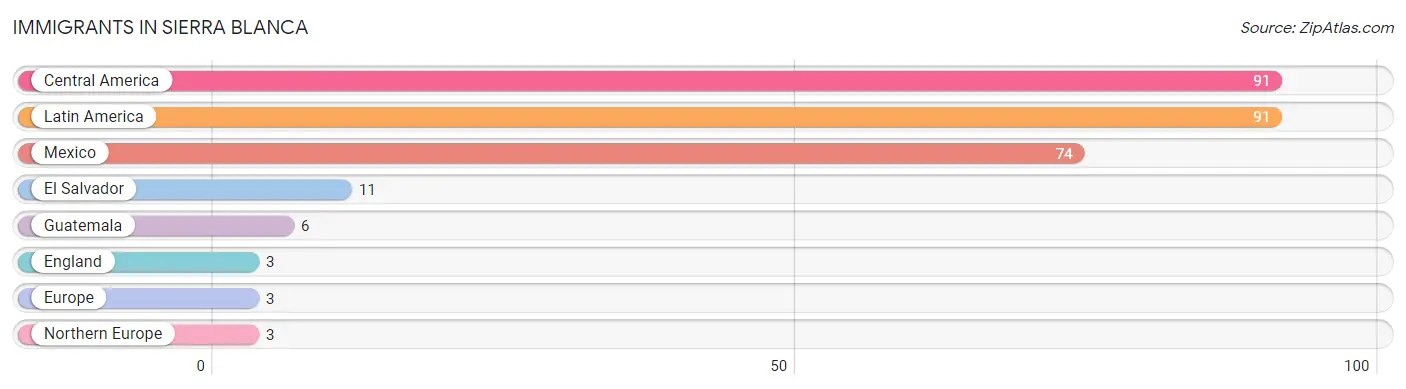
The most numerous immigrant groups reported in Sierra Blanca came from Central America (91 | 16.7%), Latin America (91 | 16.7%), Mexico (74 | 13.6%), El Salvador (11 | 2.0%), and Guatemala (6 | 1.1%), together accounting for 50.2% of all Sierra Blanca residents.
| Immigration Origin | # Population | % Population |
| Central America | 91 | 16.7% |
| El Salvador | 11 | 2.0% |
| England | 3 | 0.5% |
| Europe | 3 | 0.5% |
| Guatemala | 6 | 1.1% |
| Latin America | 91 | 16.7% |
| Mexico | 74 | 13.6% |
| Northern Europe | 3 | 0.5% | View All 8 Rows |
Sex and Age in Sierra Blanca
Sex and Age in Sierra Blanca
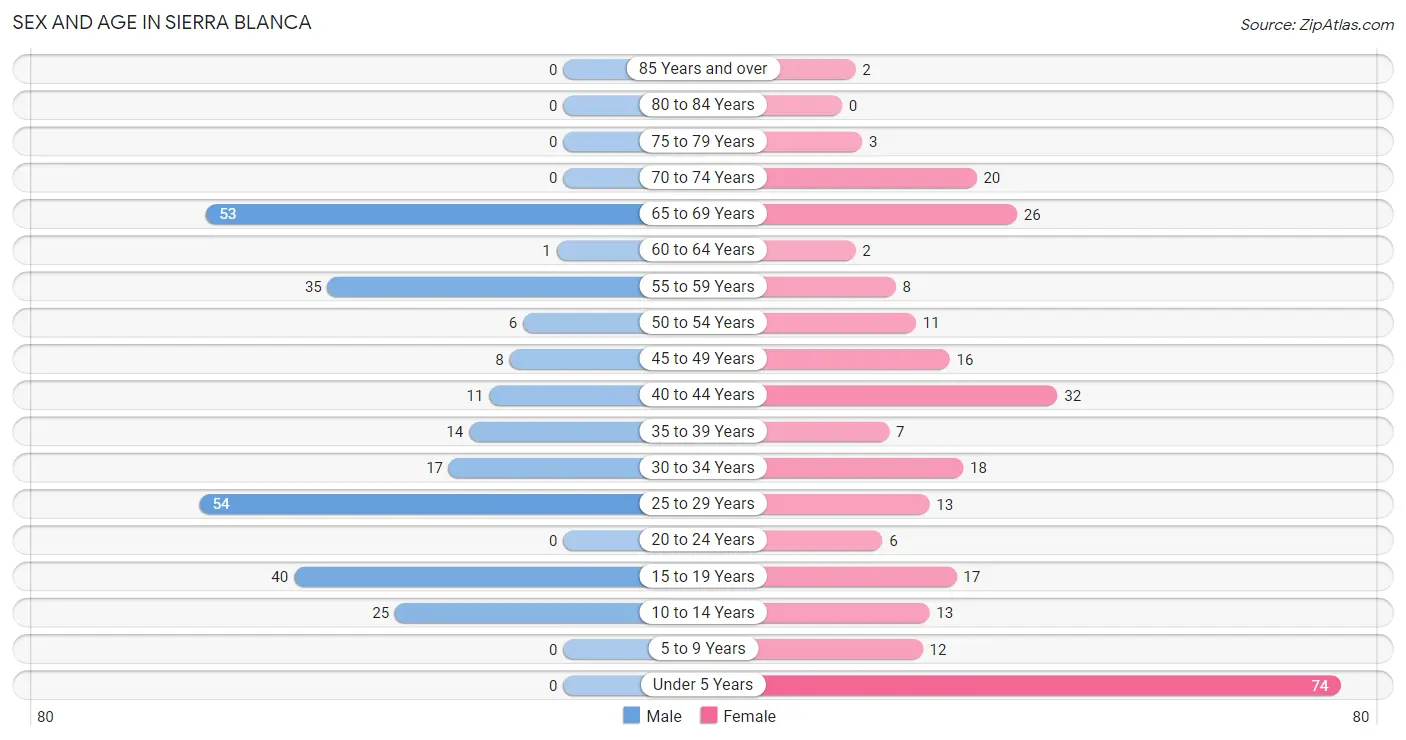
The most populous age groups in Sierra Blanca are 25 to 29 Years (54 | 20.4%) for men and Under 5 Years (74 | 26.4%) for women.
| Age Bracket | Male | Female |
| Under 5 Years | 0 (0.0%) | 74 (26.4%) |
| 5 to 9 Years | 0 (0.0%) | 12 (4.3%) |
| 10 to 14 Years | 25 (9.5%) | 13 (4.6%) |
| 15 to 19 Years | 40 (15.1%) | 17 (6.1%) |
| 20 to 24 Years | 0 (0.0%) | 6 (2.1%) |
| 25 to 29 Years | 54 (20.4%) | 13 (4.6%) |
| 30 to 34 Years | 17 (6.4%) | 18 (6.4%) |
| 35 to 39 Years | 14 (5.3%) | 7 (2.5%) |
| 40 to 44 Years | 11 (4.2%) | 32 (11.4%) |
| 45 to 49 Years | 8 (3.0%) | 16 (5.7%) |
| 50 to 54 Years | 6 (2.3%) | 11 (3.9%) |
| 55 to 59 Years | 35 (13.3%) | 8 (2.9%) |
| 60 to 64 Years | 1 (0.4%) | 2 (0.7%) |
| 65 to 69 Years | 53 (20.1%) | 26 (9.3%) |
| 70 to 74 Years | 0 (0.0%) | 20 (7.1%) |
| 75 to 79 Years | 0 (0.0%) | 3 (1.1%) |
| 80 to 84 Years | 0 (0.0%) | 0 (0.0%) |
| 85 Years and over | 0 (0.0%) | 2 (0.7%) |
| Total | 264 (100.0%) | 280 (100.0%) |
Families and Households in Sierra Blanca
Median Family Size in Sierra Blanca
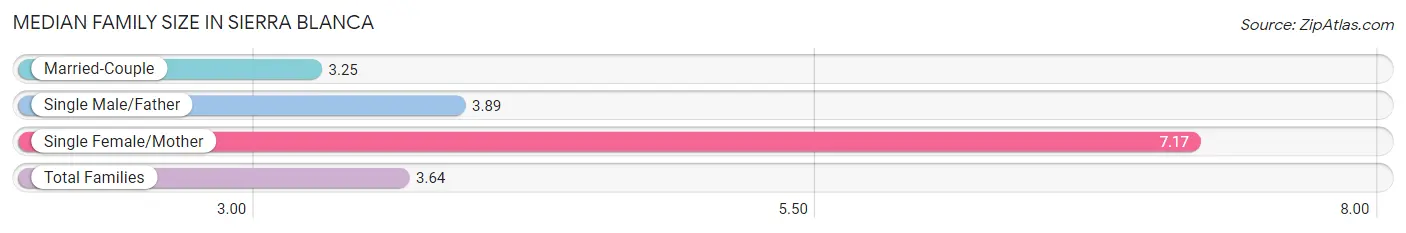
The median family size in Sierra Blanca is 3.64 persons per family, with single female/mother families (6 | 5.7%) accounting for the largest median family size of 7.17 persons per family. On the other hand, married-couple families (72 | 68.6%) represent the smallest median family size with 3.25 persons per family.
| Family Type | # Families | Family Size |
| Married-Couple | 72 (68.6%) | 3.25 |
| Single Male/Father | 27 (25.7%) | 3.89 |
| Single Female/Mother | 6 (5.7%) | 7.17 |
| Total Families | 105 (100.0%) | 3.64 |
Median Household Size in Sierra Blanca
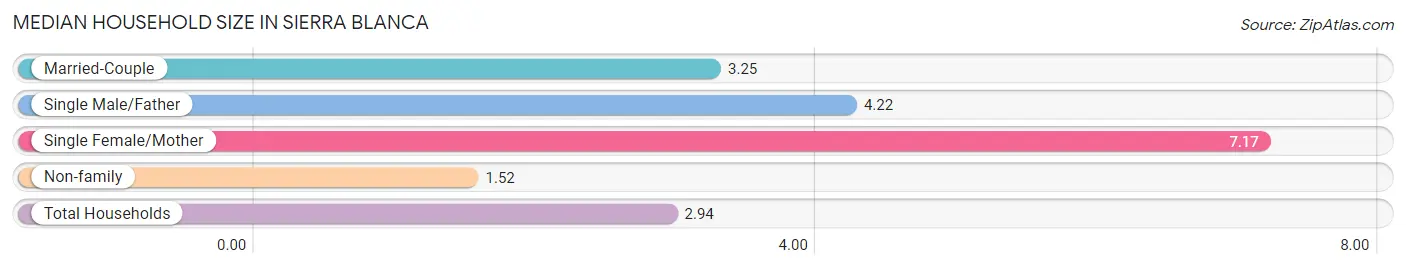
The median household size in Sierra Blanca is 2.94 persons per household, with single female/mother households (6 | 3.7%) accounting for the largest median household size of 7.17 persons per household. non-family households (58 | 35.6%) represent the smallest median household size with 1.52 persons per household.
| Household Type | # Households | Household Size |
| Married-Couple | 72 (44.2%) | 3.25 |
| Single Male/Father | 27 (16.6%) | 4.22 |
| Single Female/Mother | 6 (3.7%) | 7.17 |
| Non-family | 58 (35.6%) | 1.52 |
| Total Households | 163 (100.0%) | 2.94 |
Household Size by Marriage Status in Sierra Blanca
Out of a total of 163 households in Sierra Blanca, 105 (64.4%) are family households, while 58 (35.6%) are nonfamily households. The most numerous type of family households are 2-person households, comprising 46, and the most common type of nonfamily households are 1-person households, comprising 32.
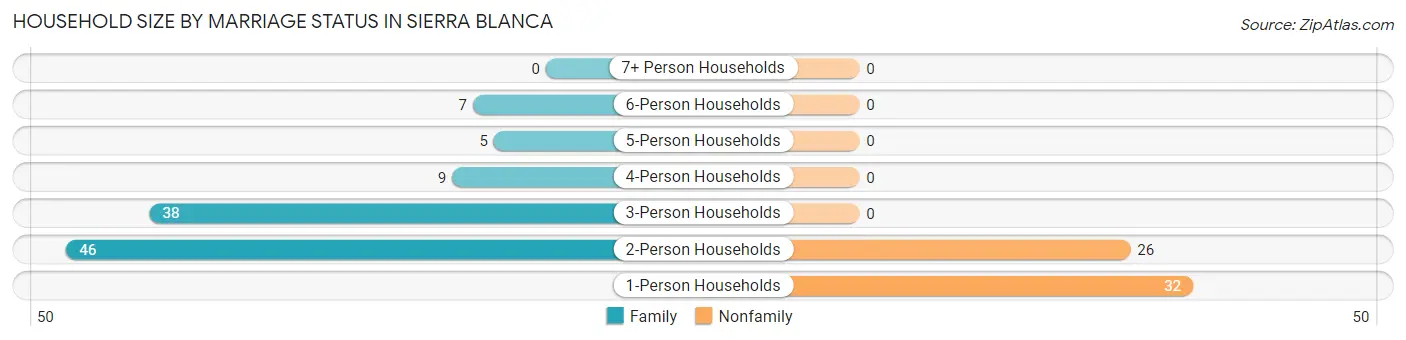
| Household Size | Family Households | Nonfamily Households |
| 1-Person Households | - | 32 (19.6%) |
| 2-Person Households | 46 (28.2%) | 26 (16.0%) |
| 3-Person Households | 38 (23.3%) | 0 (0.0%) |
| 4-Person Households | 9 (5.5%) | 0 (0.0%) |
| 5-Person Households | 5 (3.1%) | 0 (0.0%) |
| 6-Person Households | 7 (4.3%) | 0 (0.0%) |
| 7+ Person Households | 0 (0.0%) | 0 (0.0%) |
| Total | 105 (64.4%) | 58 (35.6%) |
Female Fertility in Sierra Blanca
Fertility by Age in Sierra Blanca
| Age Bracket | Women with Births | Births / 1,000 Women |
| 15 to 19 years | 0 (0.0%) | 0.0 |
| 20 to 34 years | 0 (0.0%) | 0.0 |
| 35 to 50 years | 0 (0.0%) | 0.0 |
| Total | 0 (0.0%) | 0.0 |
Fertility by Age by Marriage Status in Sierra Blanca
| Age Bracket | Married | Unmarried |
| 15 to 19 years | 0 (0.0%) | 0 (0.0%) |
| 20 to 34 years | 0 (0.0%) | 0 (0.0%) |
| 35 to 50 years | 0 (0.0%) | 0 (0.0%) |
| Total | 0 (0.0%) | 0 (0.0%) |
Fertility by Education in Sierra Blanca
| Educational Attainment | Women with Births | Births / 1,000 Women |
| Less than High School | 0 (0.0%) | 0.0 |
| High School Diploma | 0 (0.0%) | 0.0 |
| College or Associate's Degree | 0 (0.0%) | 0.0 |
| Bachelor's Degree | 0 (0.0%) | 0.0 |
| Graduate Degree | 0 (0.0%) | 0.0 |
| Total | 0 (0.0%) | 0.0 |
Fertility by Education by Marriage Status in Sierra Blanca
| Educational Attainment | Married | Unmarried |
| Less than High School | 0 (0.0%) | 0 (0.0%) |
| High School Diploma | 0 (0.0%) | 0 (0.0%) |
| College or Associate's Degree | 0 (0.0%) | 0 (0.0%) |
| Bachelor's Degree | 0 (0.0%) | 0 (0.0%) |
| Graduate Degree | 0 (0.0%) | 0 (0.0%) |
| Total | 0 (0.0%) | 0 (0.0%) |
Employment Characteristics in Sierra Blanca
Employment by Class of Employer in Sierra Blanca
Among the 192 employed individuals in Sierra Blanca, private company employees (111 | 57.8%), local government employees (42 | 21.9%), and state government employees (18 | 9.4%) make up the most common classes of employment.
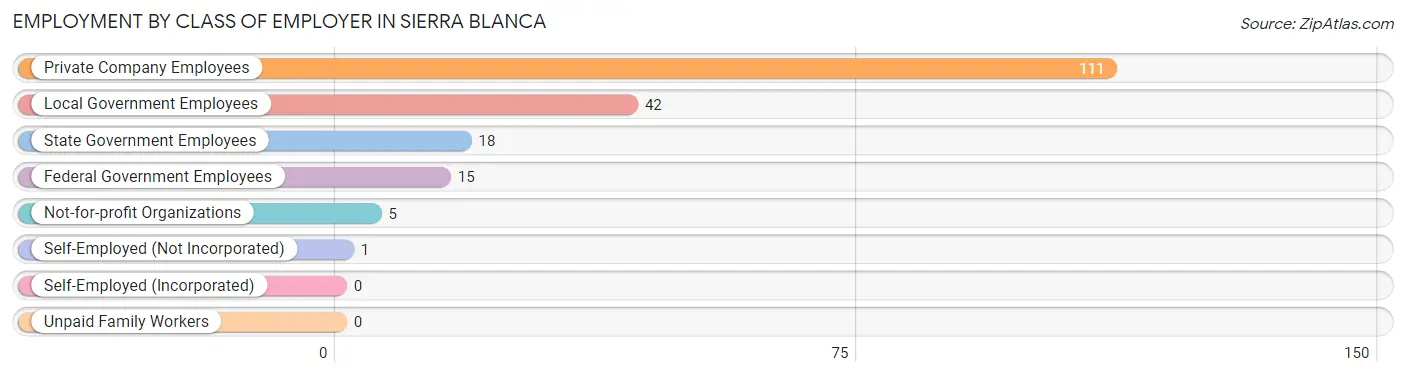
| Employer Class | # Employees | % Employees |
| Private Company Employees | 111 | 57.8% |
| Self-Employed (Incorporated) | 0 | 0.0% |
| Self-Employed (Not Incorporated) | 1 | 0.5% |
| Not-for-profit Organizations | 5 | 2.6% |
| Local Government Employees | 42 | 21.9% |
| State Government Employees | 18 | 9.4% |
| Federal Government Employees | 15 | 7.8% |
| Unpaid Family Workers | 0 | 0.0% |
| Total | 192 | 100.0% |
Employment Status by Age in Sierra Blanca
According to the labor force statistics for Sierra Blanca, out of the total population over 16 years of age (420), 49.5% or 208 individuals are in the labor force, with 7.7% or 16 of them unemployed. The age group with the highest labor force participation rate is 20 to 24 years, with 100.0% or 6 individuals in the labor force. Within the labor force, the 25 to 29 years age range has the highest percentage of unemployed individuals, with 50.0% or 16 of them being unemployed.
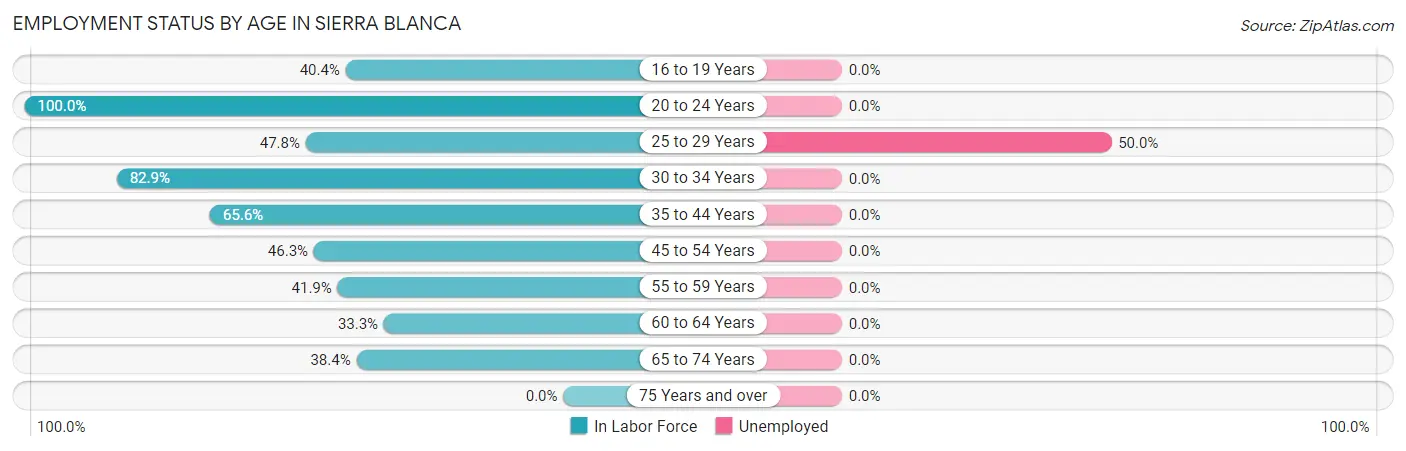
| Age Bracket | In Labor Force | Unemployed |
| 16 to 19 Years | 23 (40.4%) | 0 (0.0%) |
| 20 to 24 Years | 6 (100.0%) | 0 (0.0%) |
| 25 to 29 Years | 32 (47.8%) | 16 (50.0%) |
| 30 to 34 Years | 29 (82.9%) | 0 (0.0%) |
| 35 to 44 Years | 42 (65.6%) | 0 (0.0%) |
| 45 to 54 Years | 19 (46.3%) | 0 (0.0%) |
| 55 to 59 Years | 18 (41.9%) | 0 (0.0%) |
| 60 to 64 Years | 1 (33.3%) | 0 (0.0%) |
| 65 to 74 Years | 38 (38.4%) | 0 (0.0%) |
| 75 Years and over | 0 (0.0%) | 0 (0.0%) |
| Total | 208 (49.5%) | 16 (7.7%) |
Employment Status by Educational Attainment in Sierra Blanca
According to labor force statistics for Sierra Blanca, 55.7% of individuals (141) out of the total population between 25 and 64 years of age (253) are in the labor force, with 11.3% or 16 of them being unemployed. The group with the highest labor force participation rate are those with the educational attainment of bachelor's degree or higher, with 100.0% or 44 individuals in the labor force. Within the labor force, individuals with college / associate degree education have the highest percentage of unemployment, with 28.1% or 16 of them being unemployed.
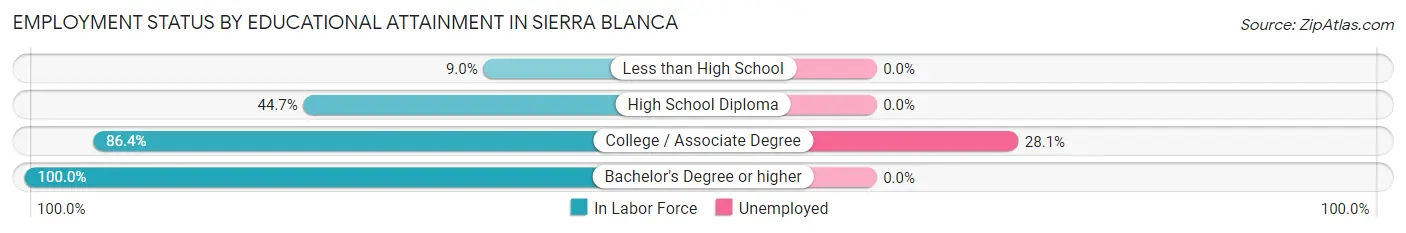
| Educational Attainment | In Labor Force | Unemployed |
| Less than High School | 6 (9.0%) | 0 (0.0%) |
| High School Diploma | 34 (44.7%) | 0 (0.0%) |
| College / Associate Degree | 57 (86.4%) | 19 (28.1%) |
| Bachelor's Degree or higher | 44 (100.0%) | 0 (0.0%) |
| Total | 141 (55.7%) | 29 (11.3%) |
Employment Occupations by Sex in Sierra Blanca
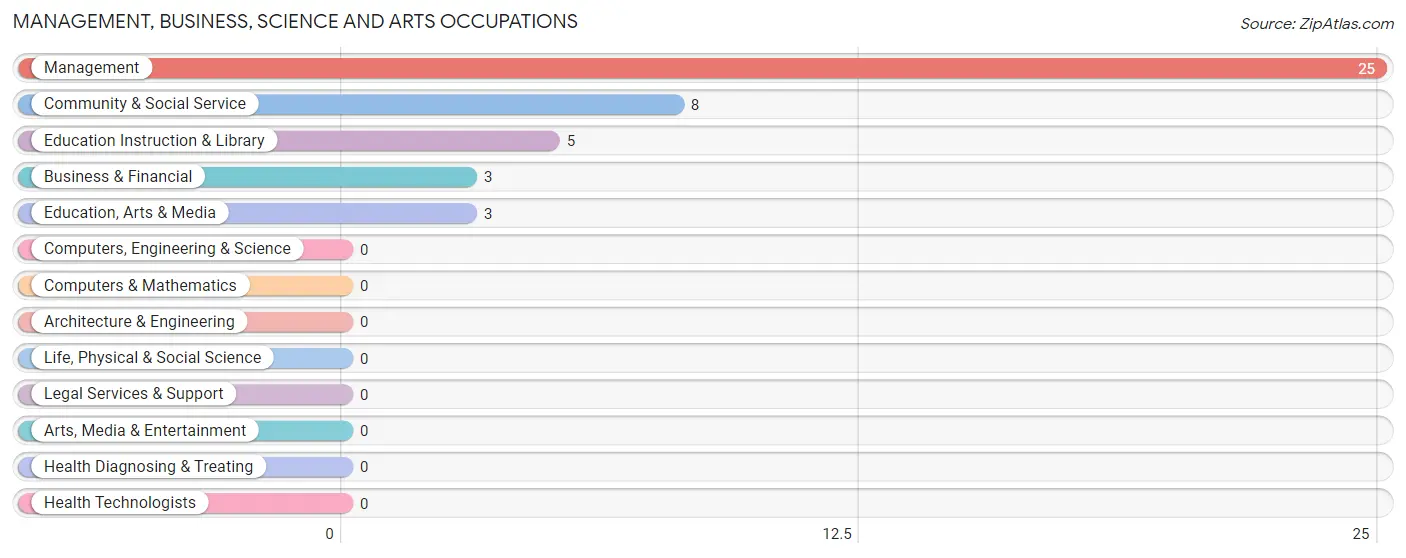
Management, Business, Science and Arts Occupations
The most common Management, Business, Science and Arts occupations in Sierra Blanca are Management (25 | 13.0%), Community & Social Service (8 | 4.2%), Education Instruction & Library (5 | 2.6%), Business & Financial (3 | 1.6%), and Education, Arts & Media (3 | 1.6%).
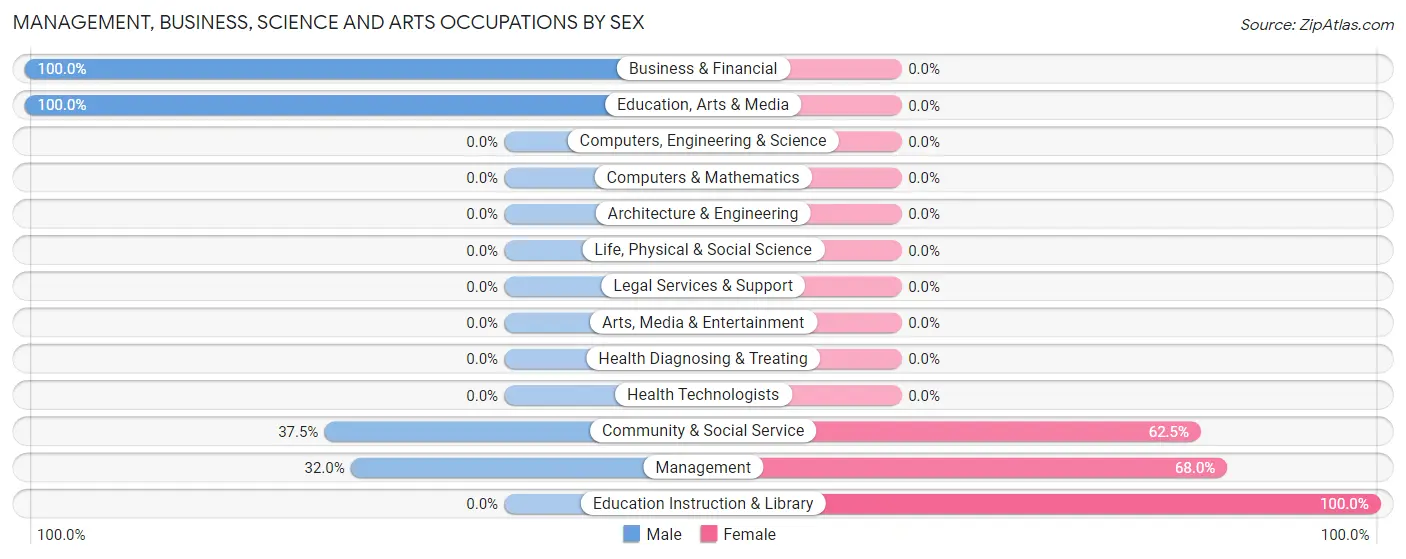
Management, Business, Science and Arts Occupations by Sex
Within the Management, Business, Science and Arts occupations in Sierra Blanca, the most male-oriented occupations are Business & Financial (100.0%), Education, Arts & Media (100.0%), and Community & Social Service (37.5%), while the most female-oriented occupations are Education Instruction & Library (100.0%), Management (68.0%), and Community & Social Service (62.5%).
| Occupation | Male | Female |
| Management | 8 (32.0%) | 17 (68.0%) |
| Business & Financial | 3 (100.0%) | 0 (0.0%) |
| Computers, Engineering & Science | 0 (0.0%) | 0 (0.0%) |
| Computers & Mathematics | 0 (0.0%) | 0 (0.0%) |
| Architecture & Engineering | 0 (0.0%) | 0 (0.0%) |
| Life, Physical & Social Science | 0 (0.0%) | 0 (0.0%) |
| Community & Social Service | 3 (37.5%) | 5 (62.5%) |
| Education, Arts & Media | 3 (100.0%) | 0 (0.0%) |
| Legal Services & Support | 0 (0.0%) | 0 (0.0%) |
| Education Instruction & Library | 0 (0.0%) | 5 (100.0%) |
| Arts, Media & Entertainment | 0 (0.0%) | 0 (0.0%) |
| Health Diagnosing & Treating | 0 (0.0%) | 0 (0.0%) |
| Health Technologists | 0 (0.0%) | 0 (0.0%) |
| Total (Category) | 14 (38.9%) | 22 (61.1%) |
| Total (Overall) | 122 (63.5%) | 70 (36.5%) |
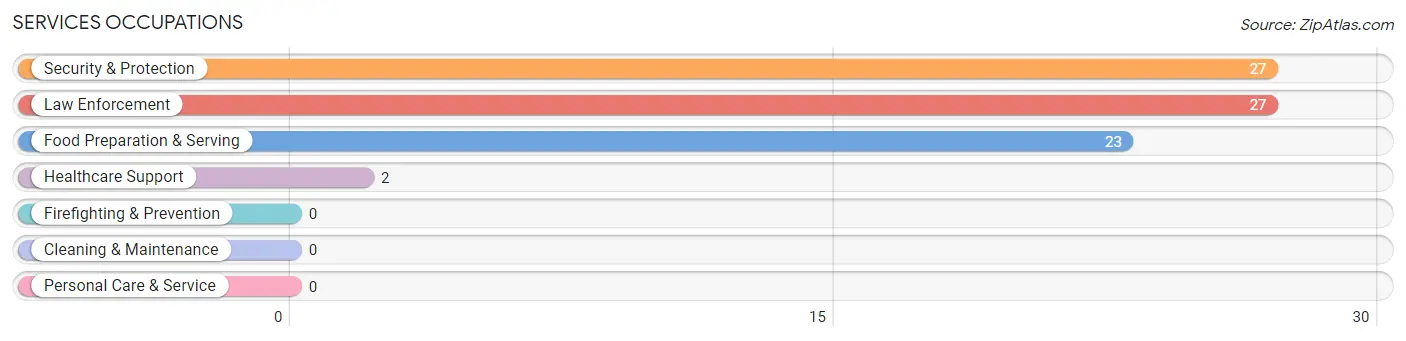
Services Occupations
The most common Services occupations in Sierra Blanca are Security & Protection (27 | 14.1%), Law Enforcement (27 | 14.1%), Food Preparation & Serving (23 | 12.0%), and Healthcare Support (2 | 1.0%).
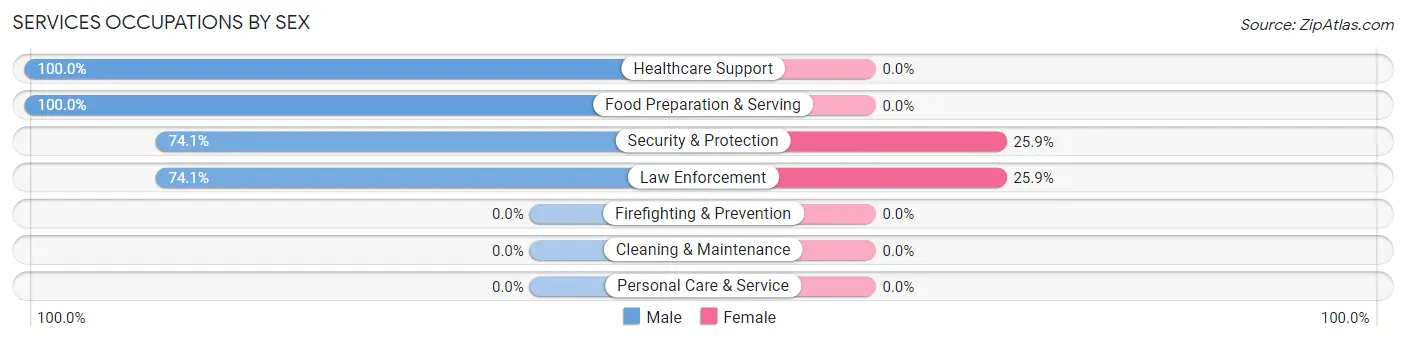
Services Occupations by Sex
Within the Services occupations in Sierra Blanca, the most male-oriented occupations are Healthcare Support (100.0%), Food Preparation & Serving (100.0%), and Security & Protection (74.1%), while the most female-oriented occupations are Security & Protection (25.9%), and Law Enforcement (25.9%).
| Occupation | Male | Female |
| Healthcare Support | 2 (100.0%) | 0 (0.0%) |
| Security & Protection | 20 (74.1%) | 7 (25.9%) |
| Firefighting & Prevention | 0 (0.0%) | 0 (0.0%) |
| Law Enforcement | 20 (74.1%) | 7 (25.9%) |
| Food Preparation & Serving | 23 (100.0%) | 0 (0.0%) |
| Cleaning & Maintenance | 0 (0.0%) | 0 (0.0%) |
| Personal Care & Service | 0 (0.0%) | 0 (0.0%) |
| Total (Category) | 45 (86.5%) | 7 (13.5%) |
| Total (Overall) | 122 (63.5%) | 70 (36.5%) |
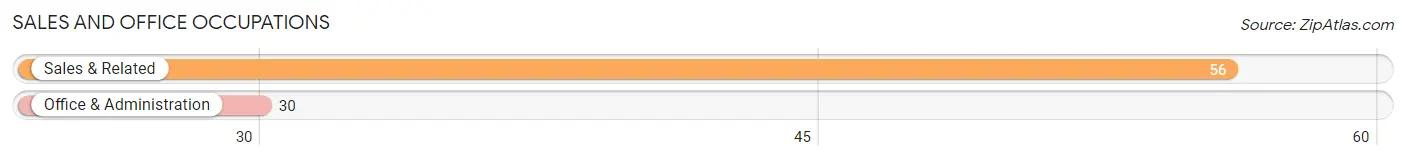
Sales and Office Occupations
The most common Sales and Office occupations in Sierra Blanca are Sales & Related (56 | 29.2%), and Office & Administration (30 | 15.6%).
Sales and Office Occupations by Sex
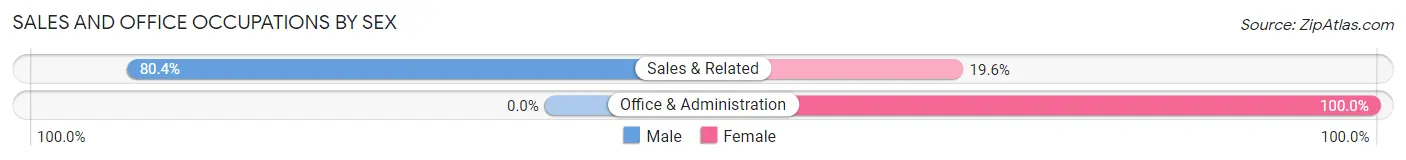
| Occupation | Male | Female |
| Sales & Related | 45 (80.4%) | 11 (19.6%) |
| Office & Administration | 0 (0.0%) | 30 (100.0%) |
| Total (Category) | 45 (52.3%) | 41 (47.7%) |
| Total (Overall) | 122 (63.5%) | 70 (36.5%) |
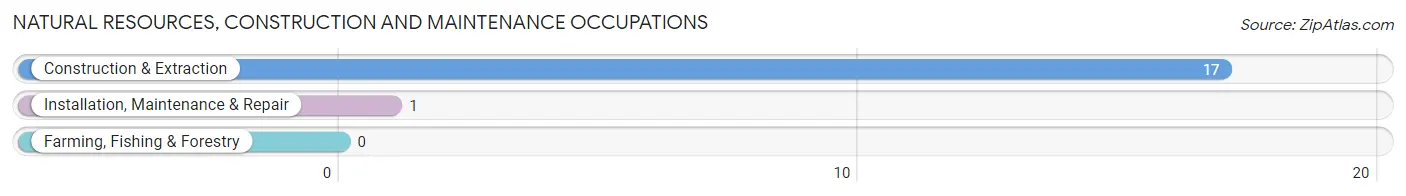
Natural Resources, Construction and Maintenance Occupations
The most common Natural Resources, Construction and Maintenance occupations in Sierra Blanca are Construction & Extraction (17 | 8.8%), and Installation, Maintenance & Repair (1 | 0.5%).
Natural Resources, Construction and Maintenance Occupations by Sex
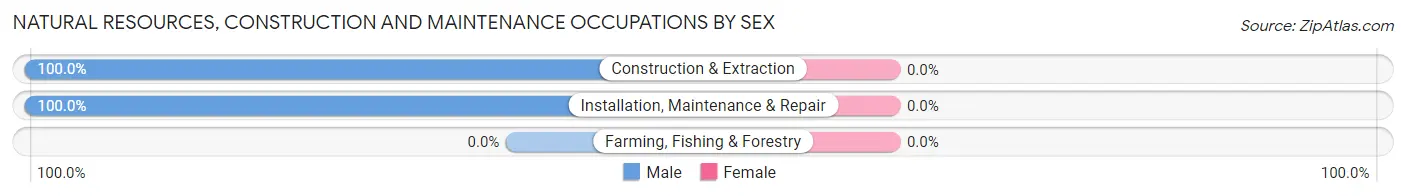
| Occupation | Male | Female |
| Farming, Fishing & Forestry | 0 (0.0%) | 0 (0.0%) |
| Construction & Extraction | 17 (100.0%) | 0 (0.0%) |
| Installation, Maintenance & Repair | 1 (100.0%) | 0 (0.0%) |
| Total (Category) | 18 (100.0%) | 0 (0.0%) |
| Total (Overall) | 122 (63.5%) | 70 (36.5%) |
Production, Transportation and Moving Occupations
Production, Transportation and Moving Occupations by Sex

| Occupation | Male | Female |
| Production | 0 (0.0%) | 0 (0.0%) |
| Transportation | 0 (0.0%) | 0 (0.0%) |
| Material Moving | 0 (0.0%) | 0 (0.0%) |
| Total (Category) | 0 (0.0%) | 0 (0.0%) |
| Total (Overall) | 122 (63.5%) | 70 (36.5%) |
Employment Industries by Sex in Sierra Blanca
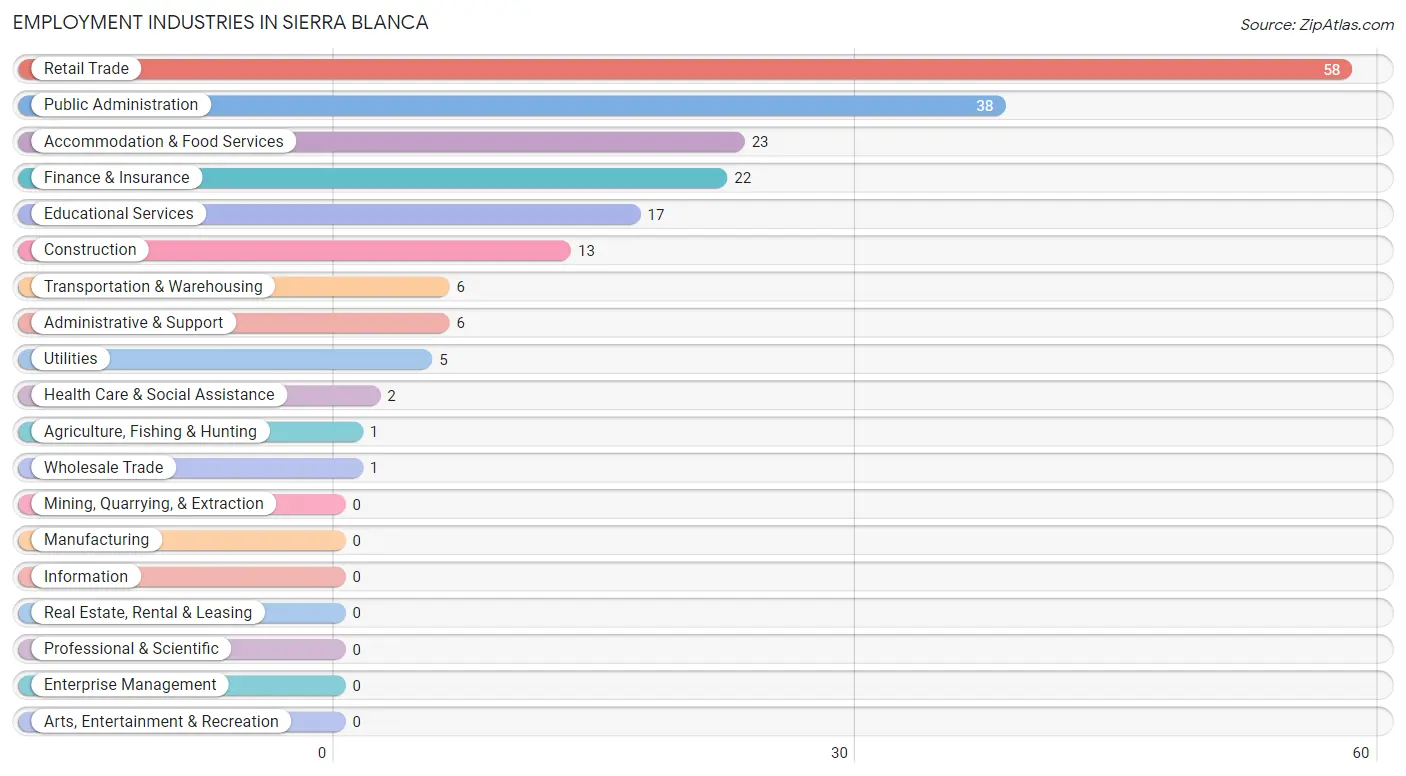
Employment Industries in Sierra Blanca
The major employment industries in Sierra Blanca include Retail Trade (58 | 30.2%), Public Administration (38 | 19.8%), Accommodation & Food Services (23 | 12.0%), Finance & Insurance (22 | 11.5%), and Educational Services (17 | 8.8%).
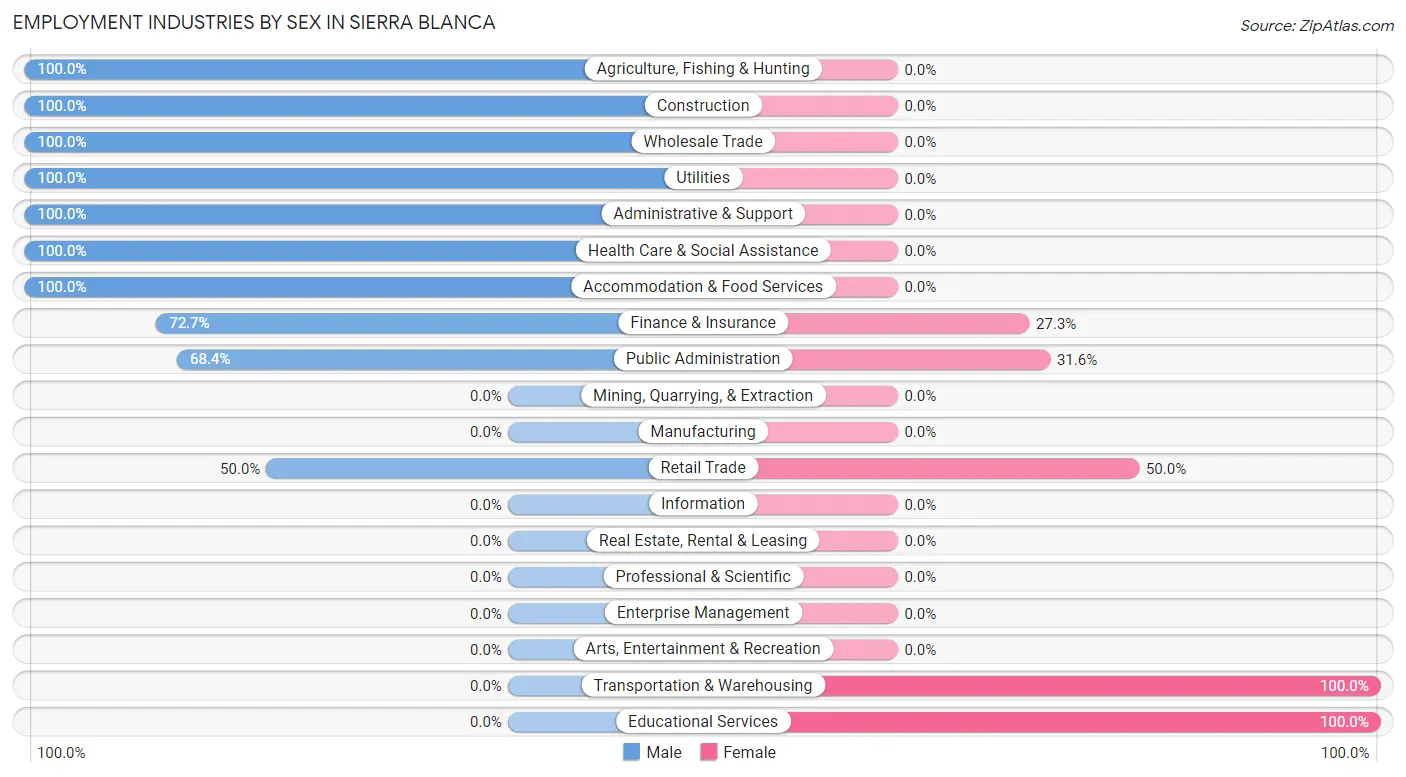
Employment Industries by Sex in Sierra Blanca
The Sierra Blanca industries that see more men than women are Agriculture, Fishing & Hunting (100.0%), Construction (100.0%), and Wholesale Trade (100.0%), whereas the industries that tend to have a higher number of women are Transportation & Warehousing (100.0%), Educational Services (100.0%), and Retail Trade (50.0%).
| Industry | Male | Female |
| Agriculture, Fishing & Hunting | 1 (100.0%) | 0 (0.0%) |
| Mining, Quarrying, & Extraction | 0 (0.0%) | 0 (0.0%) |
| Construction | 13 (100.0%) | 0 (0.0%) |
| Manufacturing | 0 (0.0%) | 0 (0.0%) |
| Wholesale Trade | 1 (100.0%) | 0 (0.0%) |
| Retail Trade | 29 (50.0%) | 29 (50.0%) |
| Transportation & Warehousing | 0 (0.0%) | 6 (100.0%) |
| Utilities | 5 (100.0%) | 0 (0.0%) |
| Information | 0 (0.0%) | 0 (0.0%) |
| Finance & Insurance | 16 (72.7%) | 6 (27.3%) |
| Real Estate, Rental & Leasing | 0 (0.0%) | 0 (0.0%) |
| Professional & Scientific | 0 (0.0%) | 0 (0.0%) |
| Enterprise Management | 0 (0.0%) | 0 (0.0%) |
| Administrative & Support | 6 (100.0%) | 0 (0.0%) |
| Educational Services | 0 (0.0%) | 17 (100.0%) |
| Health Care & Social Assistance | 2 (100.0%) | 0 (0.0%) |
| Arts, Entertainment & Recreation | 0 (0.0%) | 0 (0.0%) |
| Accommodation & Food Services | 23 (100.0%) | 0 (0.0%) |
| Public Administration | 26 (68.4%) | 12 (31.6%) |
| Total | 122 (63.5%) | 70 (36.5%) |
Education in Sierra Blanca
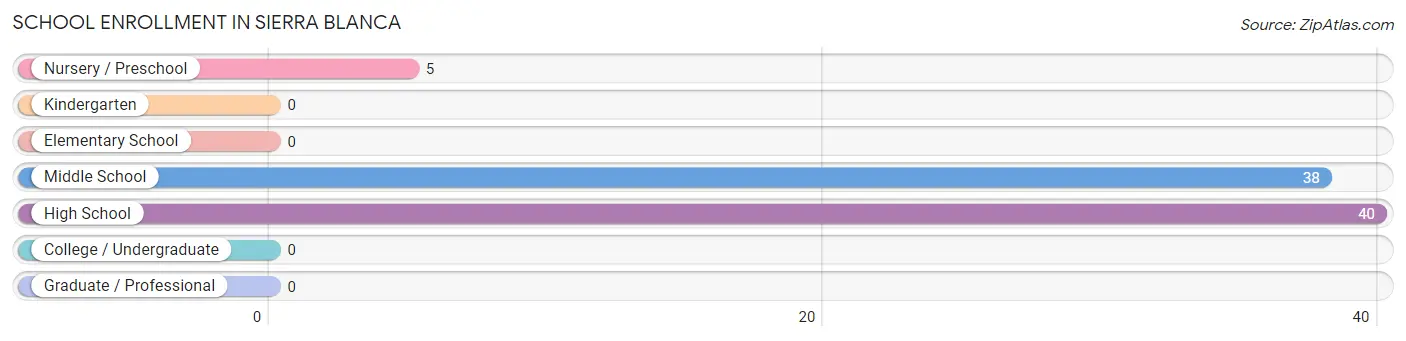
School Enrollment in Sierra Blanca
The most common levels of schooling among the 83 students in Sierra Blanca are high school (40 | 48.2%), middle school (38 | 45.8%), and nursery / preschool (5 | 6.0%).
| School Level | # Students | % Students |
| Nursery / Preschool | 5 | 6.0% |
| Kindergarten | 0 | 0.0% |
| Elementary School | 0 | 0.0% |
| Middle School | 38 | 45.8% |
| High School | 40 | 48.2% |
| College / Undergraduate | 0 | 0.0% |
| Graduate / Professional | 0 | 0.0% |
| Total | 83 | 100.0% |
School Enrollment by Age by Funding Source in Sierra Blanca
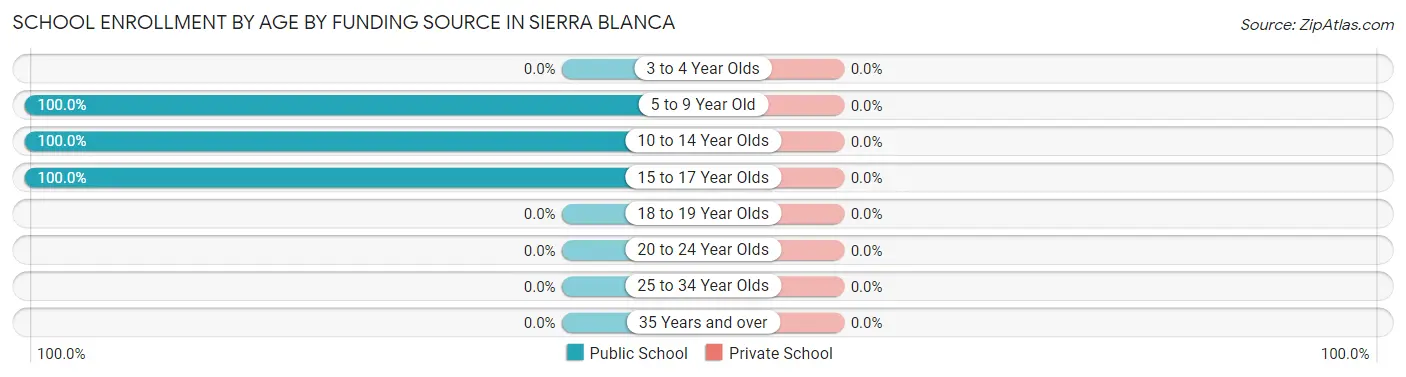
| Age Bracket | Public School | Private School |
| 3 to 4 Year Olds | 0 (0.0%) | 0 (0.0%) |
| 5 to 9 Year Old | 5 (100.0%) | 0 (0.0%) |
| 10 to 14 Year Olds | 38 (100.0%) | 0 (0.0%) |
| 15 to 17 Year Olds | 40 (100.0%) | 0 (0.0%) |
| 18 to 19 Year Olds | 0 (0.0%) | 0 (0.0%) |
| 20 to 24 Year Olds | 0 (0.0%) | 0 (0.0%) |
| 25 to 34 Year Olds | 0 (0.0%) | 0 (0.0%) |
| 35 Years and over | 0 (0.0%) | 0 (0.0%) |
| Total | 83 (100.0%) | 0 (0.0%) |
Educational Attainment by Field of Study in Sierra Blanca
Liberal arts & history (18 | 33.3%), business (11 | 20.4%), psychology (10 | 18.5%), physical & health sciences (9 | 16.7%), and science & technology (3 | 5.6%) are the most common fields of study among 54 individuals in Sierra Blanca who have obtained a bachelor's degree or higher.
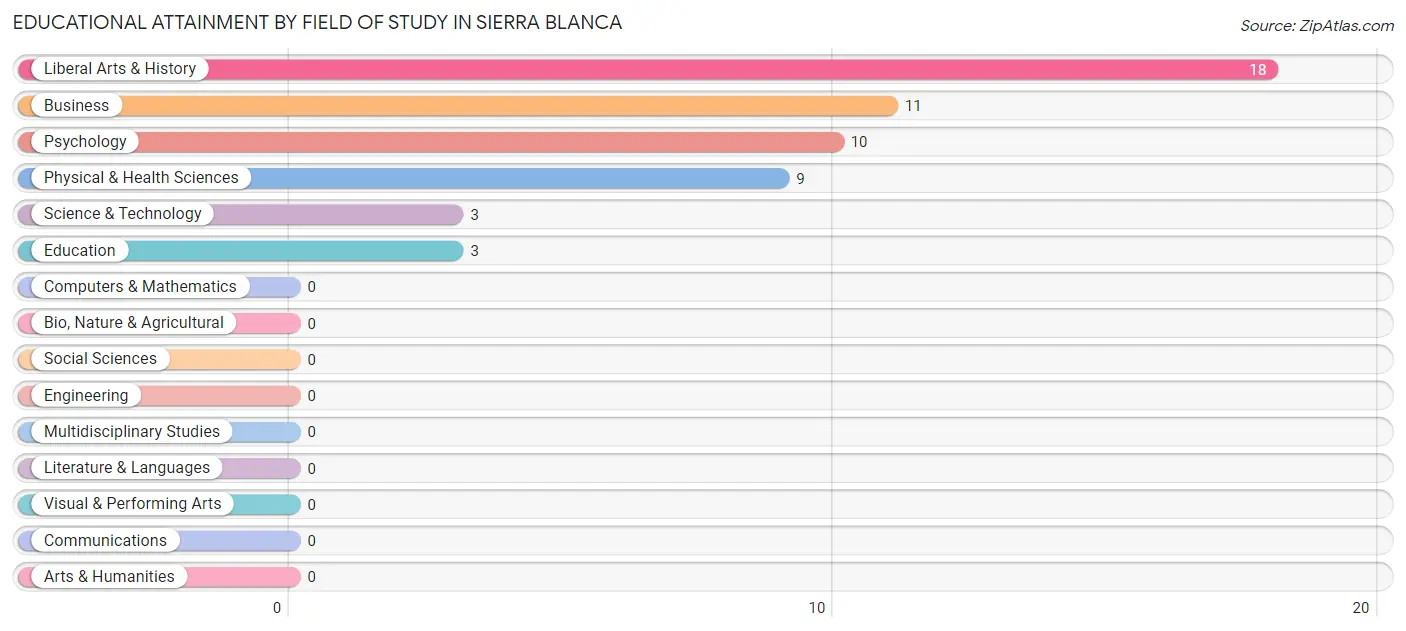
| Field of Study | # Graduates | % Graduates |
| Computers & Mathematics | 0 | 0.0% |
| Bio, Nature & Agricultural | 0 | 0.0% |
| Physical & Health Sciences | 9 | 16.7% |
| Psychology | 10 | 18.5% |
| Social Sciences | 0 | 0.0% |
| Engineering | 0 | 0.0% |
| Multidisciplinary Studies | 0 | 0.0% |
| Science & Technology | 3 | 5.6% |
| Business | 11 | 20.4% |
| Education | 3 | 5.6% |
| Literature & Languages | 0 | 0.0% |
| Liberal Arts & History | 18 | 33.3% |
| Visual & Performing Arts | 0 | 0.0% |
| Communications | 0 | 0.0% |
| Arts & Humanities | 0 | 0.0% |
| Total | 54 | 100.0% |
Transportation & Commute in Sierra Blanca
Vehicle Availability by Sex in Sierra Blanca
The most prevalent vehicle ownership categories in Sierra Blanca are males with 2 vehicles (49, accounting for 40.8%) and females with 2 vehicles (32, making up 70.0%).
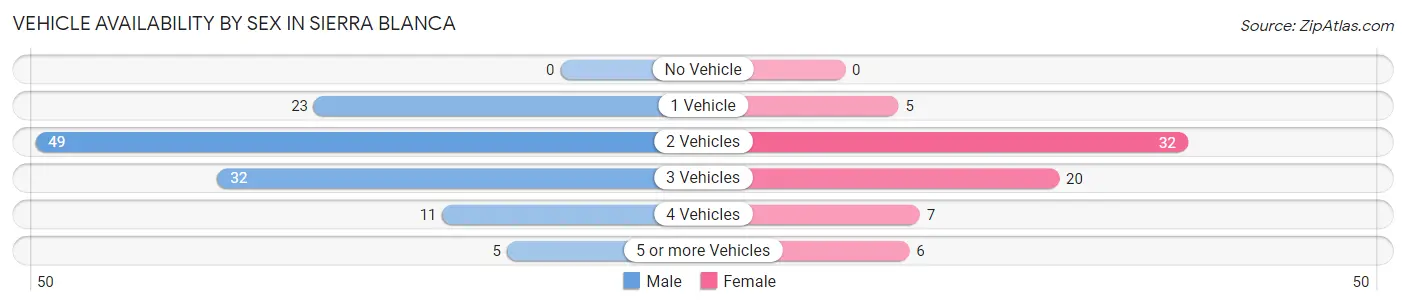
| Vehicles Available | Male | Female |
| No Vehicle | 0 (0.0%) | 0 (0.0%) |
| 1 Vehicle | 23 (19.2%) | 5 (7.1%) |
| 2 Vehicles | 49 (40.8%) | 32 (45.7%) |
| 3 Vehicles | 32 (26.7%) | 20 (28.6%) |
| 4 Vehicles | 11 (9.2%) | 7 (10.0%) |
| 5 or more Vehicles | 5 (4.2%) | 6 (8.6%) |
| Total | 120 (100.0%) | 70 (100.0%) |
Commute Time in Sierra Blanca
The most frequently occuring commute durations in Sierra Blanca are less than 5 minutes (52 commuters, 27.4%), 5 to 9 minutes (40 commuters, 21.0%), and 30 to 34 minutes (38 commuters, 20.0%).
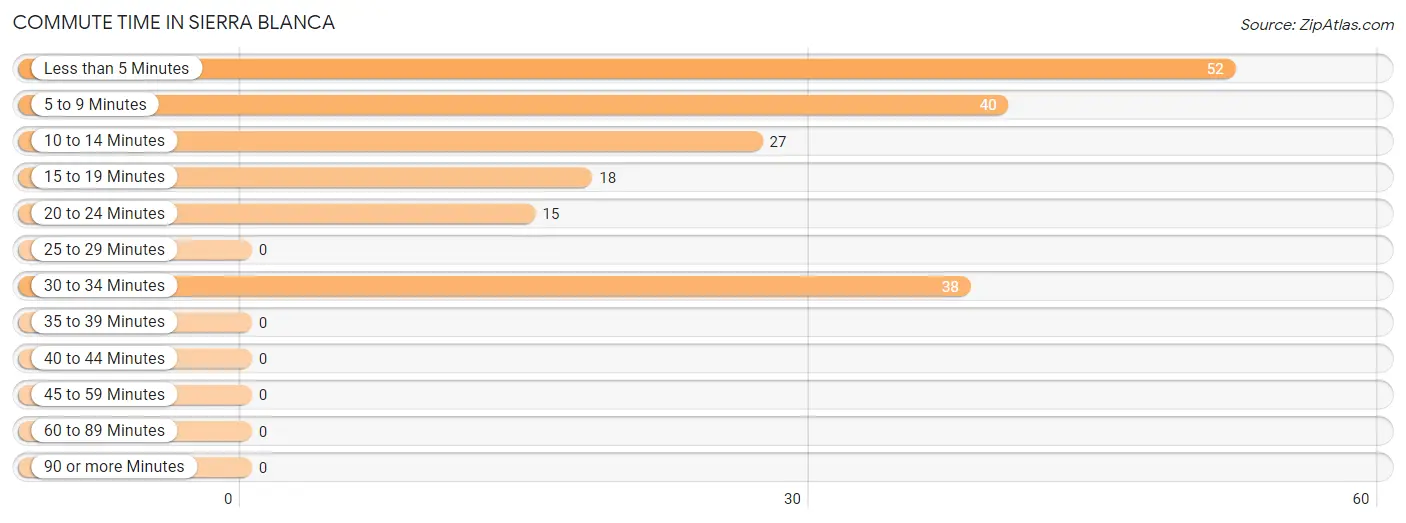
| Commute Time | # Commuters | % Commuters |
| Less than 5 Minutes | 52 | 27.4% |
| 5 to 9 Minutes | 40 | 21.0% |
| 10 to 14 Minutes | 27 | 14.2% |
| 15 to 19 Minutes | 18 | 9.5% |
| 20 to 24 Minutes | 15 | 7.9% |
| 25 to 29 Minutes | 0 | 0.0% |
| 30 to 34 Minutes | 38 | 20.0% |
| 35 to 39 Minutes | 0 | 0.0% |
| 40 to 44 Minutes | 0 | 0.0% |
| 45 to 59 Minutes | 0 | 0.0% |
| 60 to 89 Minutes | 0 | 0.0% |
| 90 or more Minutes | 0 | 0.0% |
Commute Time by Sex in Sierra Blanca
The most common commute times in Sierra Blanca are 30 to 34 minutes (29 commuters, 24.2%) for males and less than 5 minutes (25 commuters, 35.7%) for females.
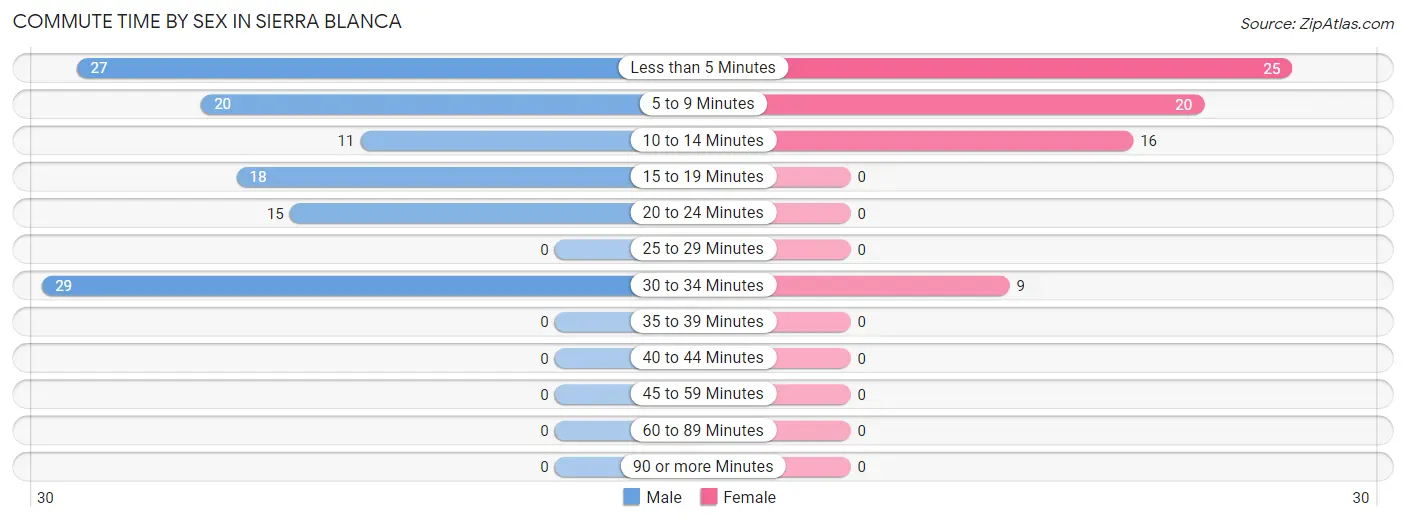
| Commute Time | Male | Female |
| Less than 5 Minutes | 27 (22.5%) | 25 (35.7%) |
| 5 to 9 Minutes | 20 (16.7%) | 20 (28.6%) |
| 10 to 14 Minutes | 11 (9.2%) | 16 (22.9%) |
| 15 to 19 Minutes | 18 (15.0%) | 0 (0.0%) |
| 20 to 24 Minutes | 15 (12.5%) | 0 (0.0%) |
| 25 to 29 Minutes | 0 (0.0%) | 0 (0.0%) |
| 30 to 34 Minutes | 29 (24.2%) | 9 (12.9%) |
| 35 to 39 Minutes | 0 (0.0%) | 0 (0.0%) |
| 40 to 44 Minutes | 0 (0.0%) | 0 (0.0%) |
| 45 to 59 Minutes | 0 (0.0%) | 0 (0.0%) |
| 60 to 89 Minutes | 0 (0.0%) | 0 (0.0%) |
| 90 or more Minutes | 0 (0.0%) | 0 (0.0%) |
Time of Departure to Work by Sex in Sierra Blanca
The most frequent times of departure to work in Sierra Blanca are 7:00 AM to 7:29 AM (29, 24.2%) for males and 7:30 AM to 7:59 AM (34, 48.6%) for females.
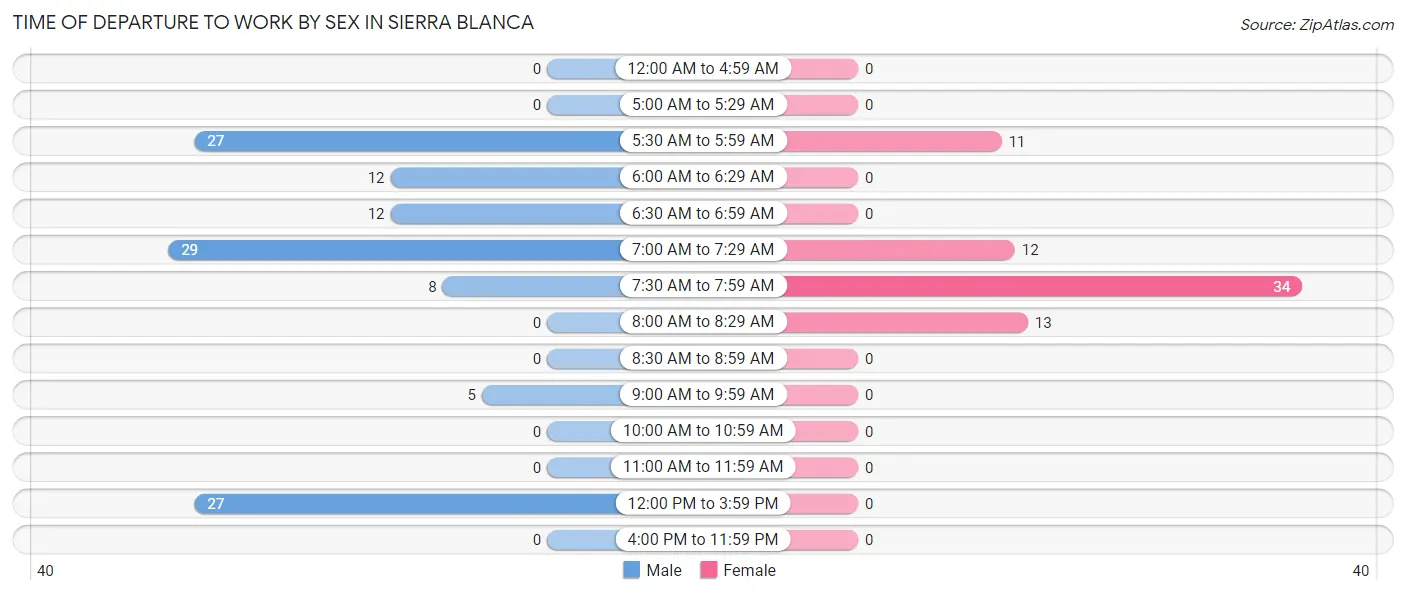
| Time of Departure | Male | Female |
| 12:00 AM to 4:59 AM | 0 (0.0%) | 0 (0.0%) |
| 5:00 AM to 5:29 AM | 0 (0.0%) | 0 (0.0%) |
| 5:30 AM to 5:59 AM | 27 (22.5%) | 11 (15.7%) |
| 6:00 AM to 6:29 AM | 12 (10.0%) | 0 (0.0%) |
| 6:30 AM to 6:59 AM | 12 (10.0%) | 0 (0.0%) |
| 7:00 AM to 7:29 AM | 29 (24.2%) | 12 (17.1%) |
| 7:30 AM to 7:59 AM | 8 (6.7%) | 34 (48.6%) |
| 8:00 AM to 8:29 AM | 0 (0.0%) | 13 (18.6%) |
| 8:30 AM to 8:59 AM | 0 (0.0%) | 0 (0.0%) |
| 9:00 AM to 9:59 AM | 5 (4.2%) | 0 (0.0%) |
| 10:00 AM to 10:59 AM | 0 (0.0%) | 0 (0.0%) |
| 11:00 AM to 11:59 AM | 0 (0.0%) | 0 (0.0%) |
| 12:00 PM to 3:59 PM | 27 (22.5%) | 0 (0.0%) |
| 4:00 PM to 11:59 PM | 0 (0.0%) | 0 (0.0%) |
| Total | 120 (100.0%) | 70 (100.0%) |
Housing Occupancy in Sierra Blanca
Occupancy by Ownership in Sierra Blanca
Of the total 163 dwellings in Sierra Blanca, owner-occupied units account for 115 (70.6%), while renter-occupied units make up 48 (29.4%).
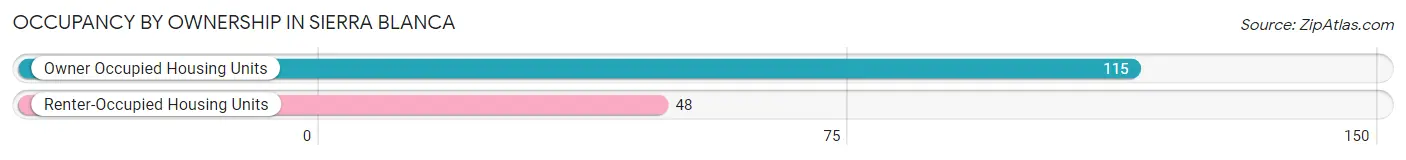
| Occupancy | # Housing Units | % Housing Units |
| Owner Occupied Housing Units | 115 | 70.6% |
| Renter-Occupied Housing Units | 48 | 29.4% |
| Total Occupied Housing Units | 163 | 100.0% |
Occupancy by Household Size in Sierra Blanca
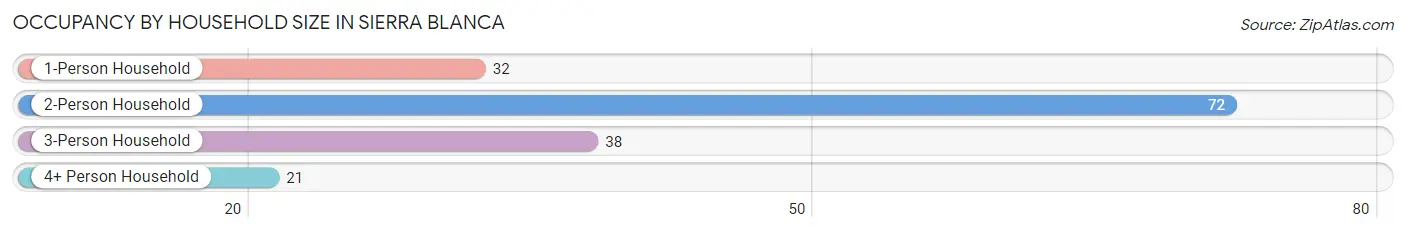
| Household Size | # Housing Units | % Housing Units |
| 1-Person Household | 32 | 19.6% |
| 2-Person Household | 72 | 44.2% |
| 3-Person Household | 38 | 23.3% |
| 4+ Person Household | 21 | 12.9% |
| Total Housing Units | 163 | 100.0% |
Occupancy by Ownership by Household Size in Sierra Blanca
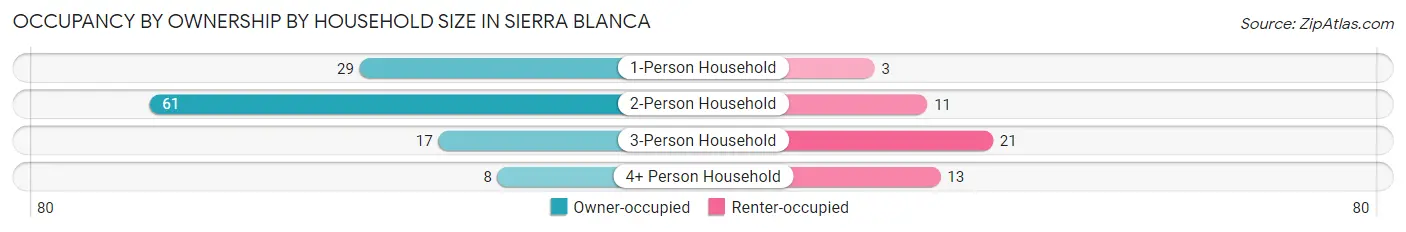
| Household Size | Owner-occupied | Renter-occupied |
| 1-Person Household | 29 (90.6%) | 3 (9.4%) |
| 2-Person Household | 61 (84.7%) | 11 (15.3%) |
| 3-Person Household | 17 (44.7%) | 21 (55.3%) |
| 4+ Person Household | 8 (38.1%) | 13 (61.9%) |
| Total Housing Units | 115 (70.6%) | 48 (29.4%) |
Occupancy by Educational Attainment in Sierra Blanca
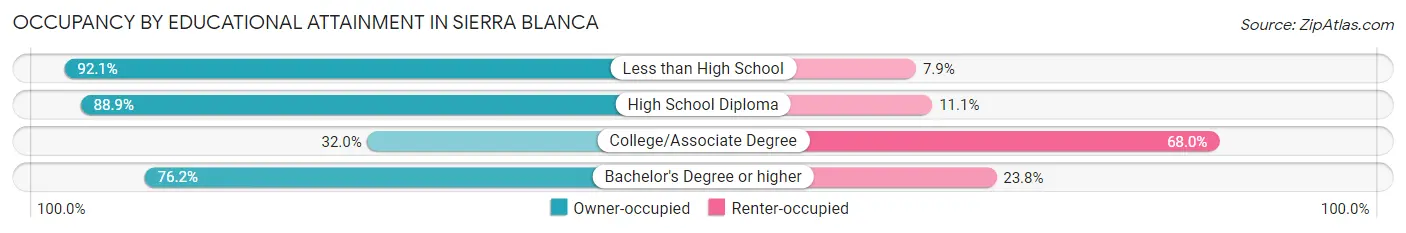
| Household Size | Owner-occupied | Renter-occupied |
| Less than High School | 35 (92.1%) | 3 (7.9%) |
| High School Diploma | 48 (88.9%) | 6 (11.1%) |
| College/Associate Degree | 16 (32.0%) | 34 (68.0%) |
| Bachelor's Degree or higher | 16 (76.2%) | 5 (23.8%) |
Occupancy by Age of Householder in Sierra Blanca
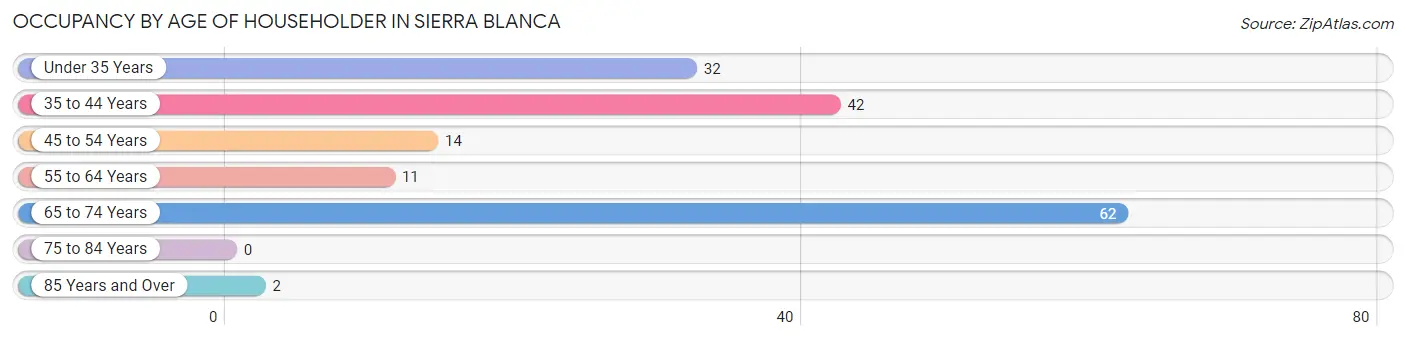
| Age Bracket | # Households | % Households |
| Under 35 Years | 32 | 19.6% |
| 35 to 44 Years | 42 | 25.8% |
| 45 to 54 Years | 14 | 8.6% |
| 55 to 64 Years | 11 | 6.8% |
| 65 to 74 Years | 62 | 38.0% |
| 75 to 84 Years | 0 | 0.0% |
| 85 Years and Over | 2 | 1.2% |
| Total | 163 | 100.0% |
Housing Finances in Sierra Blanca
Median Income by Occupancy in Sierra Blanca
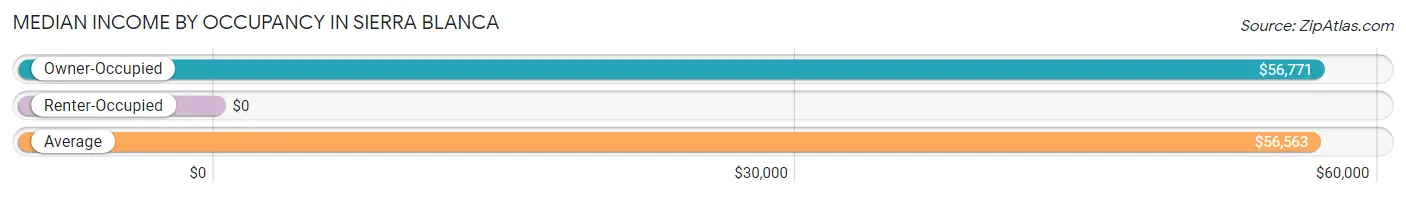
| Occupancy Type | # Households | Median Income |
| Owner-Occupied | 115 (70.6%) | $56,771 |
| Renter-Occupied | 48 (29.4%) | $0 |
| Average | 163 (100.0%) | $56,563 |
Occupancy by Householder Income Bracket in Sierra Blanca
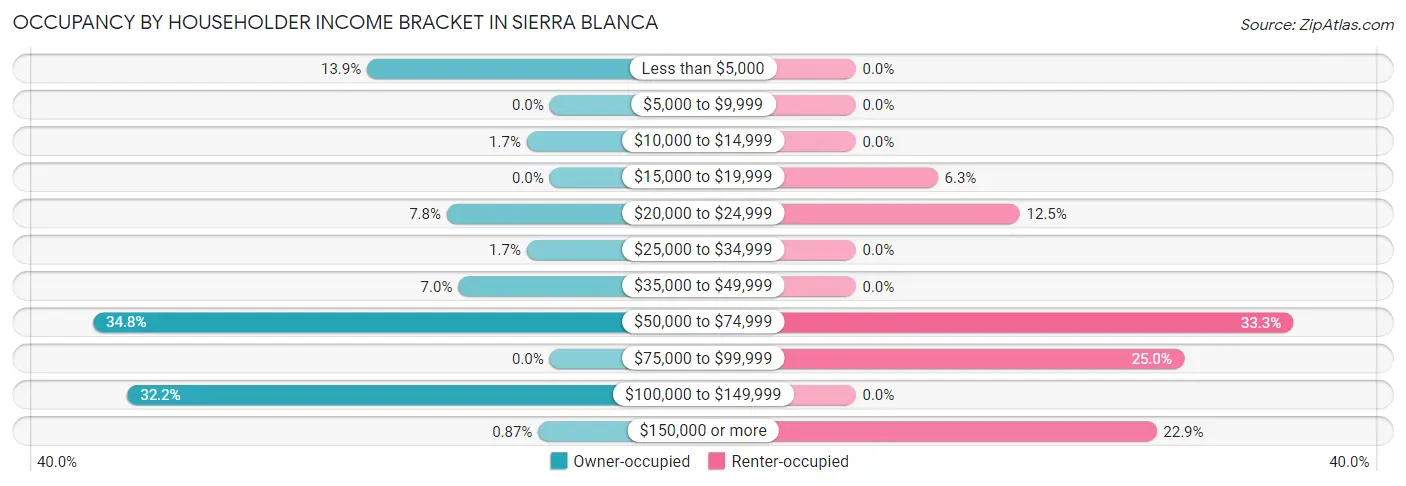
| Income Bracket | Owner-occupied | Renter-occupied |
| Less than $5,000 | 16 (13.9%) | 0 (0.0%) |
| $5,000 to $9,999 | 0 (0.0%) | 0 (0.0%) |
| $10,000 to $14,999 | 2 (1.7%) | 0 (0.0%) |
| $15,000 to $19,999 | 0 (0.0%) | 3 (6.2%) |
| $20,000 to $24,999 | 9 (7.8%) | 6 (12.5%) |
| $25,000 to $34,999 | 2 (1.7%) | 0 (0.0%) |
| $35,000 to $49,999 | 8 (7.0%) | 0 (0.0%) |
| $50,000 to $74,999 | 40 (34.8%) | 16 (33.3%) |
| $75,000 to $99,999 | 0 (0.0%) | 12 (25.0%) |
| $100,000 to $149,999 | 37 (32.2%) | 0 (0.0%) |
| $150,000 or more | 1 (0.9%) | 11 (22.9%) |
| Total | 115 (100.0%) | 48 (100.0%) |
Monthly Housing Cost Tiers in Sierra Blanca
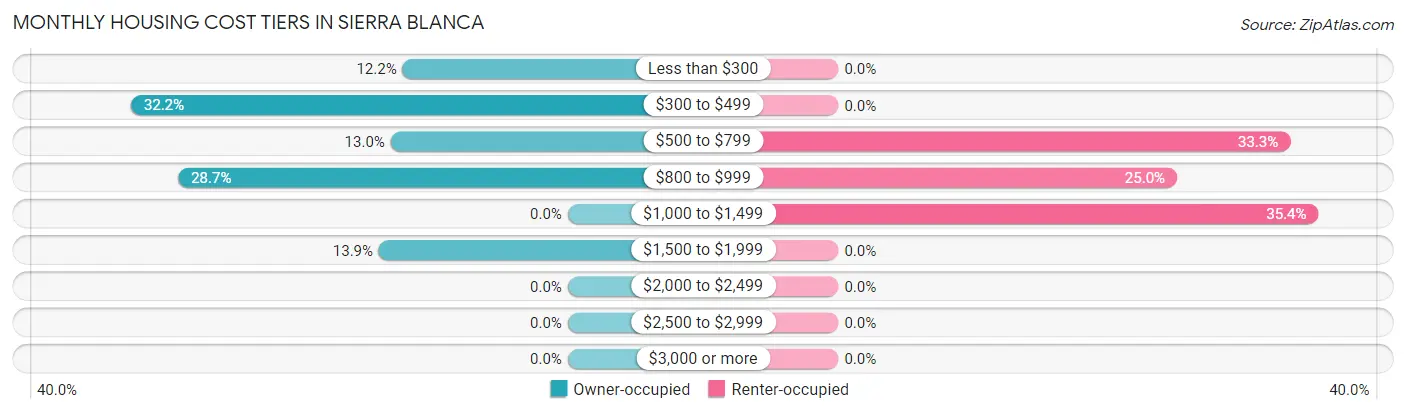
| Monthly Cost | Owner-occupied | Renter-occupied |
| Less than $300 | 14 (12.2%) | 0 (0.0%) |
| $300 to $499 | 37 (32.2%) | 0 (0.0%) |
| $500 to $799 | 15 (13.0%) | 16 (33.3%) |
| $800 to $999 | 33 (28.7%) | 12 (25.0%) |
| $1,000 to $1,499 | 0 (0.0%) | 17 (35.4%) |
| $1,500 to $1,999 | 16 (13.9%) | 0 (0.0%) |
| $2,000 to $2,499 | 0 (0.0%) | 0 (0.0%) |
| $2,500 to $2,999 | 0 (0.0%) | 0 (0.0%) |
| $3,000 or more | 0 (0.0%) | 0 (0.0%) |
| Total | 115 (100.0%) | 48 (100.0%) |
Physical Housing Characteristics in Sierra Blanca
Housing Structures in Sierra Blanca
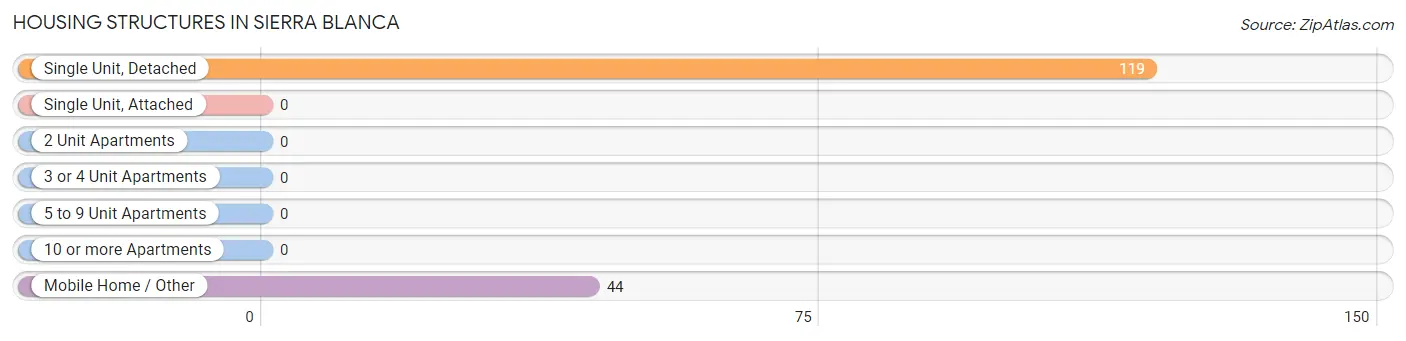
| Structure Type | # Housing Units | % Housing Units |
| Single Unit, Detached | 119 | 73.0% |
| Single Unit, Attached | 0 | 0.0% |
| 2 Unit Apartments | 0 | 0.0% |
| 3 or 4 Unit Apartments | 0 | 0.0% |
| 5 to 9 Unit Apartments | 0 | 0.0% |
| 10 or more Apartments | 0 | 0.0% |
| Mobile Home / Other | 44 | 27.0% |
| Total | 163 | 100.0% |
Housing Structures by Occupancy in Sierra Blanca
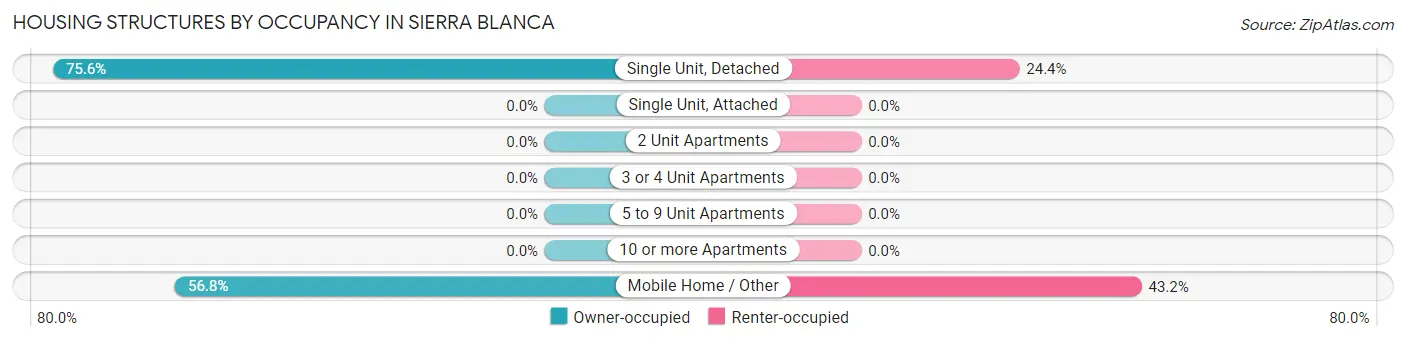
| Structure Type | Owner-occupied | Renter-occupied |
| Single Unit, Detached | 90 (75.6%) | 29 (24.4%) |
| Single Unit, Attached | 0 (0.0%) | 0 (0.0%) |
| 2 Unit Apartments | 0 (0.0%) | 0 (0.0%) |
| 3 or 4 Unit Apartments | 0 (0.0%) | 0 (0.0%) |
| 5 to 9 Unit Apartments | 0 (0.0%) | 0 (0.0%) |
| 10 or more Apartments | 0 (0.0%) | 0 (0.0%) |
| Mobile Home / Other | 25 (56.8%) | 19 (43.2%) |
| Total | 115 (70.6%) | 48 (29.4%) |
Housing Structures by Number of Rooms in Sierra Blanca
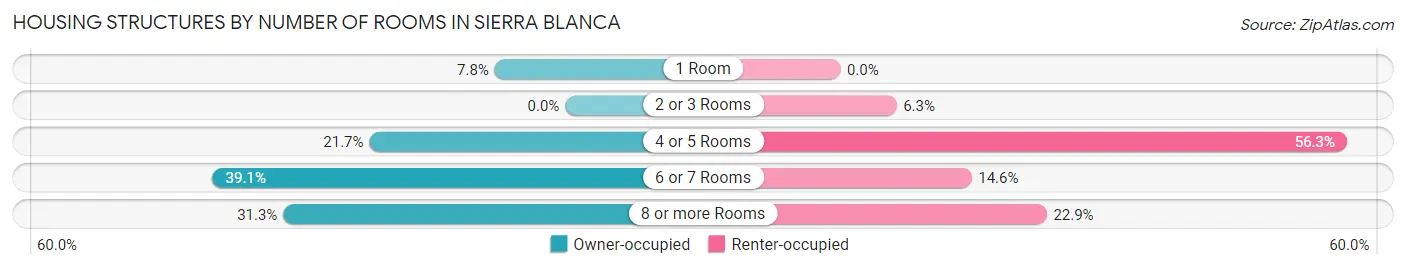
| Number of Rooms | Owner-occupied | Renter-occupied |
| 1 Room | 9 (7.8%) | 0 (0.0%) |
| 2 or 3 Rooms | 0 (0.0%) | 3 (6.2%) |
| 4 or 5 Rooms | 25 (21.7%) | 27 (56.2%) |
| 6 or 7 Rooms | 45 (39.1%) | 7 (14.6%) |
| 8 or more Rooms | 36 (31.3%) | 11 (22.9%) |
| Total | 115 (100.0%) | 48 (100.0%) |
Housing Structure by Heating Type in Sierra Blanca
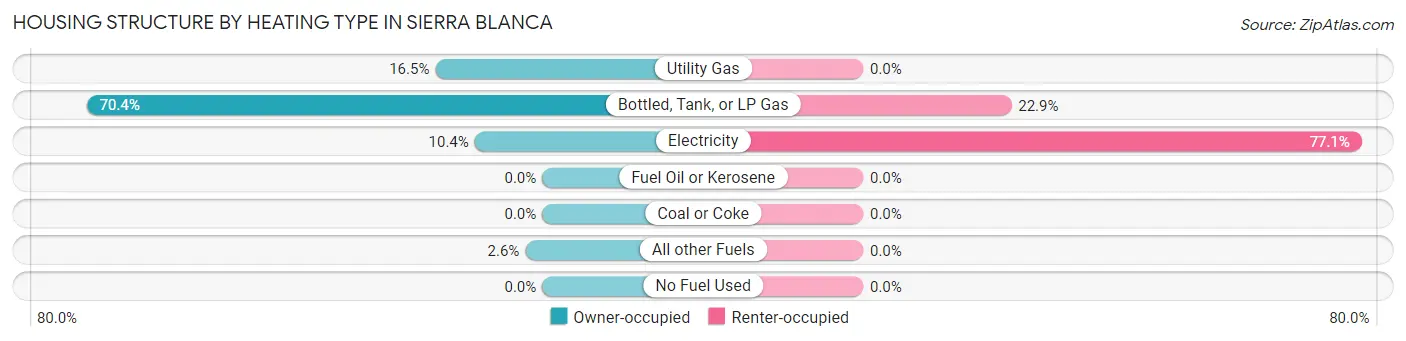
| Heating Type | Owner-occupied | Renter-occupied |
| Utility Gas | 19 (16.5%) | 0 (0.0%) |
| Bottled, Tank, or LP Gas | 81 (70.4%) | 11 (22.9%) |
| Electricity | 12 (10.4%) | 37 (77.1%) |
| Fuel Oil or Kerosene | 0 (0.0%) | 0 (0.0%) |
| Coal or Coke | 0 (0.0%) | 0 (0.0%) |
| All other Fuels | 3 (2.6%) | 0 (0.0%) |
| No Fuel Used | 0 (0.0%) | 0 (0.0%) |
| Total | 115 (100.0%) | 48 (100.0%) |
Household Vehicle Usage in Sierra Blanca
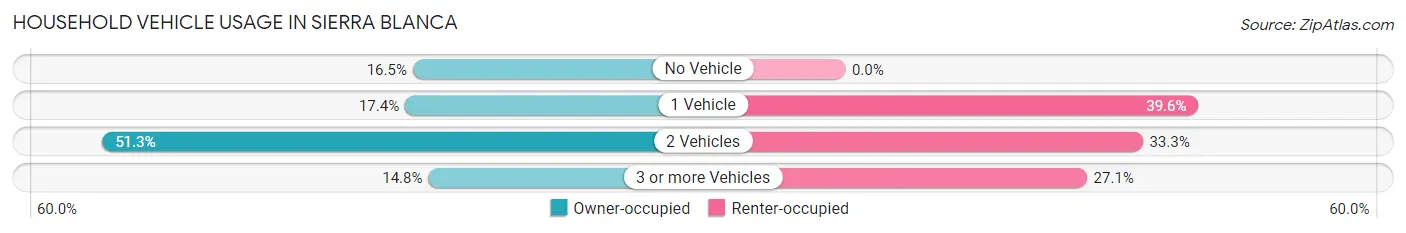
| Vehicles per Household | Owner-occupied | Renter-occupied |
| No Vehicle | 19 (16.5%) | 0 (0.0%) |
| 1 Vehicle | 20 (17.4%) | 19 (39.6%) |
| 2 Vehicles | 59 (51.3%) | 16 (33.3%) |
| 3 or more Vehicles | 17 (14.8%) | 13 (27.1%) |
| Total | 115 (100.0%) | 48 (100.0%) |
Real Estate & Mortgages in Sierra Blanca
Real Estate and Mortgage Overview in Sierra Blanca
| Characteristic | Without Mortgage | With Mortgage |
| Housing Units | 91 | 24 |
| Median Property Value | - | - |
| Median Household Income | $55,521 | $0 |
| Monthly Housing Costs | - | - |
| Real Estate Taxes | $900 | $0 |
Property Value by Mortgage Status in Sierra Blanca
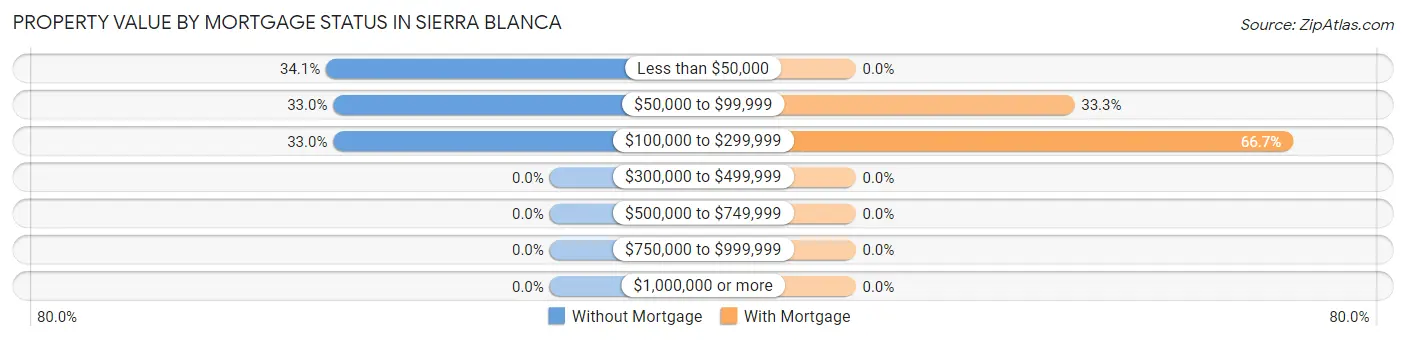
| Property Value | Without Mortgage | With Mortgage |
| Less than $50,000 | 31 (34.1%) | 0 (0.0%) |
| $50,000 to $99,999 | 30 (33.0%) | 8 (33.3%) |
| $100,000 to $299,999 | 30 (33.0%) | 16 (66.7%) |
| $300,000 to $499,999 | 0 (0.0%) | 0 (0.0%) |
| $500,000 to $749,999 | 0 (0.0%) | 0 (0.0%) |
| $750,000 to $999,999 | 0 (0.0%) | 0 (0.0%) |
| $1,000,000 or more | 0 (0.0%) | 0 (0.0%) |
| Total | 91 (100.0%) | 24 (100.0%) |
Household Income by Mortgage Status in Sierra Blanca
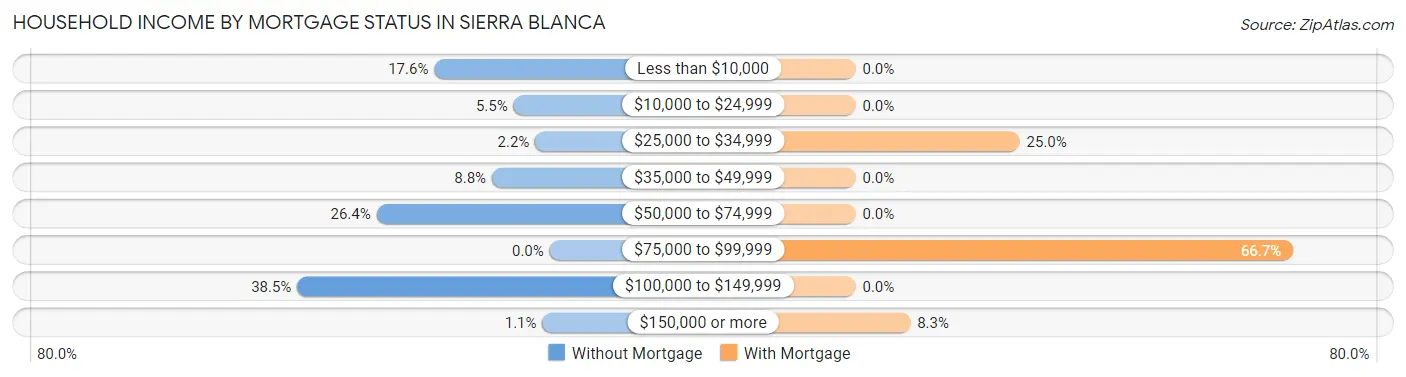
| Household Income | Without Mortgage | With Mortgage |
| Less than $10,000 | 16 (17.6%) | 0 (0.0%) |
| $10,000 to $24,999 | 5 (5.5%) | 0 (0.0%) |
| $25,000 to $34,999 | 2 (2.2%) | 6 (25.0%) |
| $35,000 to $49,999 | 8 (8.8%) | 0 (0.0%) |
| $50,000 to $74,999 | 24 (26.4%) | 0 (0.0%) |
| $75,000 to $99,999 | 0 (0.0%) | 16 (66.7%) |
| $100,000 to $149,999 | 35 (38.5%) | 0 (0.0%) |
| $150,000 or more | 1 (1.1%) | 2 (8.3%) |
| Total | 91 (100.0%) | 24 (100.0%) |
Property Value to Household Income Ratio in Sierra Blanca
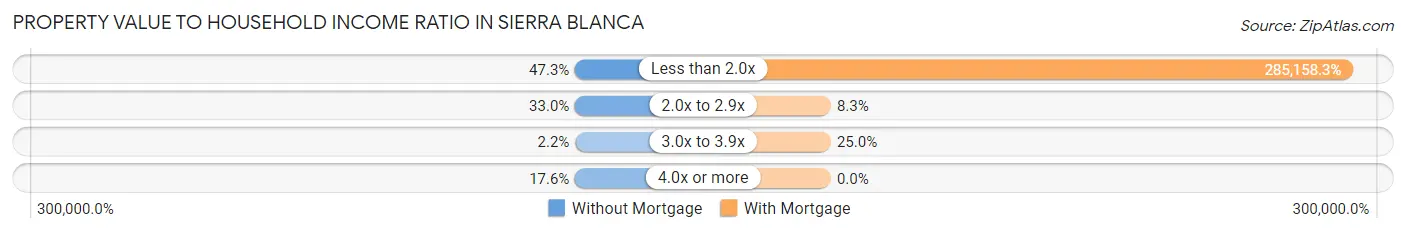
| Value-to-Income Ratio | Without Mortgage | With Mortgage |
| Less than 2.0x | 43 (47.2%) | 68,438 (285,158.3%) |
| 2.0x to 2.9x | 30 (33.0%) | 2 (8.3%) |
| 3.0x to 3.9x | 2 (2.2%) | 6 (25.0%) |
| 4.0x or more | 16 (17.6%) | 0 (0.0%) |
| Total | 91 (100.0%) | 24 (100.0%) |
Real Estate Taxes by Mortgage Status in Sierra Blanca
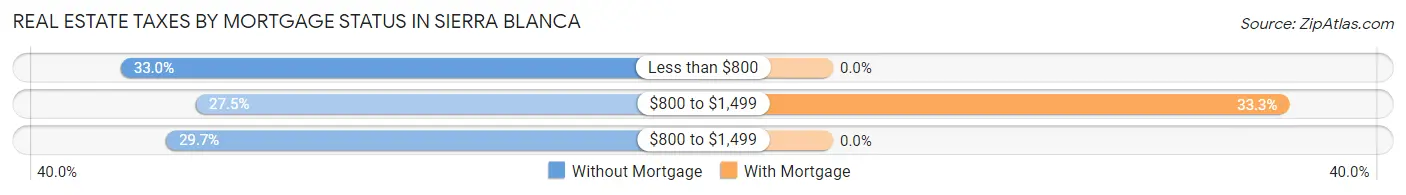
| Property Taxes | Without Mortgage | With Mortgage |
| Less than $800 | 30 (33.0%) | 0 (0.0%) |
| $800 to $1,499 | 25 (27.5%) | 8 (33.3%) |
| $800 to $1,499 | 27 (29.7%) | 0 (0.0%) |
| Total | 91 (100.0%) | 24 (100.0%) |
Health & Disability in Sierra Blanca
Health Insurance Coverage by Age in Sierra Blanca
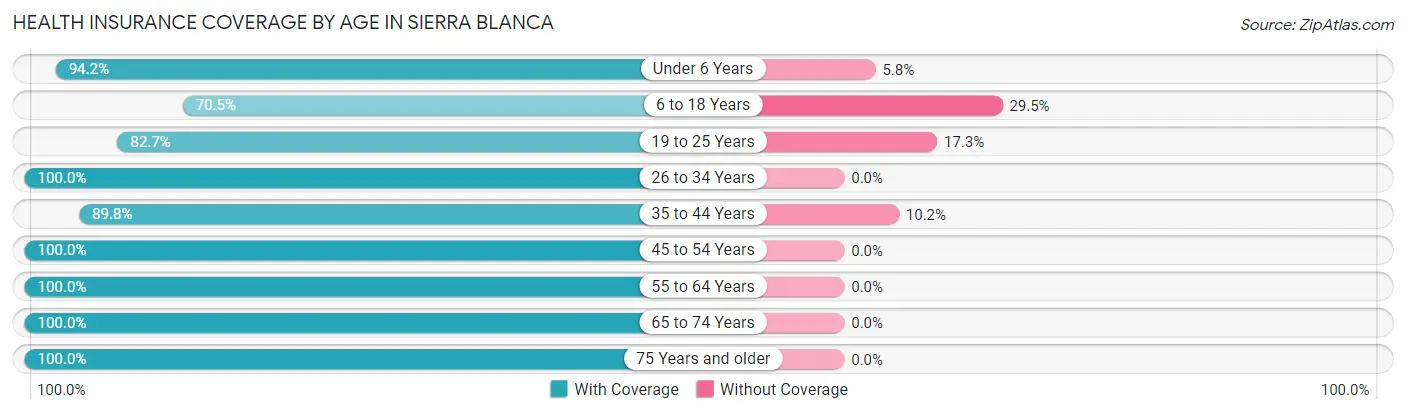
| Age Bracket | With Coverage | Without Coverage |
| Under 6 Years | 81 (94.2%) | 5 (5.8%) |
| 6 to 18 Years | 55 (70.5%) | 23 (29.5%) |
| 19 to 25 Years | 43 (82.7%) | 9 (17.3%) |
| 26 to 34 Years | 45 (100.0%) | 0 (0.0%) |
| 35 to 44 Years | 53 (89.8%) | 6 (10.2%) |
| 45 to 54 Years | 36 (100.0%) | 0 (0.0%) |
| 55 to 64 Years | 24 (100.0%) | 0 (0.0%) |
| 65 to 74 Years | 99 (100.0%) | 0 (0.0%) |
| 75 Years and older | 5 (100.0%) | 0 (0.0%) |
| Total | 441 (91.1%) | 43 (8.9%) |
Health Insurance Coverage by Citizenship Status in Sierra Blanca
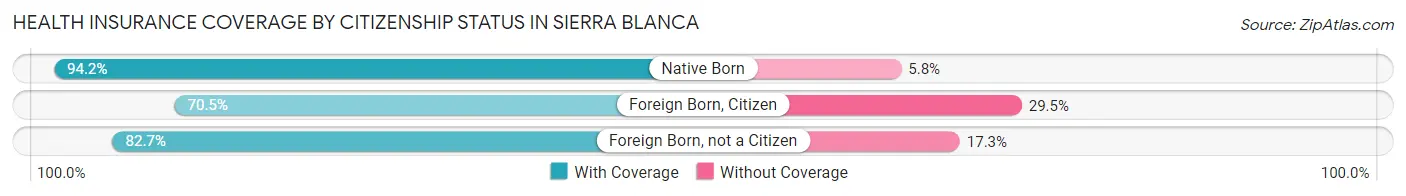
| Citizenship Status | With Coverage | Without Coverage |
| Native Born | 81 (94.2%) | 5 (5.8%) |
| Foreign Born, Citizen | 55 (70.5%) | 23 (29.5%) |
| Foreign Born, not a Citizen | 43 (82.7%) | 9 (17.3%) |
Health Insurance Coverage by Household Income in Sierra Blanca
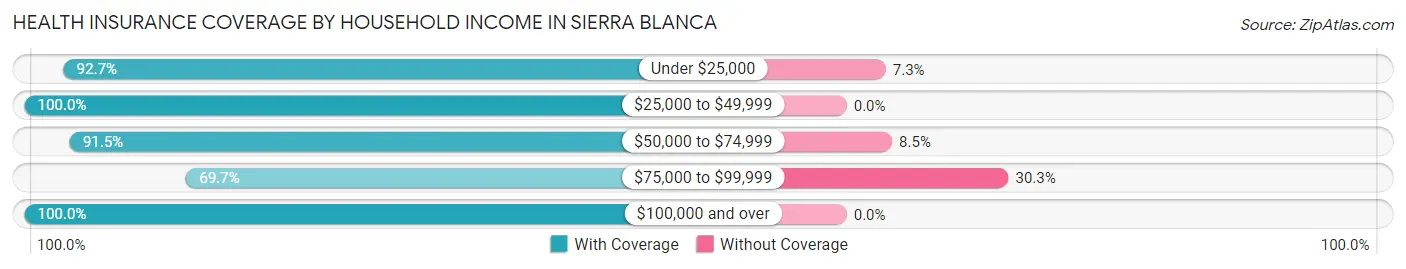
| Household Income | With Coverage | Without Coverage |
| Under $25,000 | 76 (92.7%) | 6 (7.3%) |
| $25,000 to $49,999 | 19 (100.0%) | 0 (0.0%) |
| $50,000 to $74,999 | 183 (91.5%) | 17 (8.5%) |
| $75,000 to $99,999 | 46 (69.7%) | 20 (30.3%) |
| $100,000 and over | 112 (100.0%) | 0 (0.0%) |
Public vs Private Health Insurance Coverage by Age in Sierra Blanca
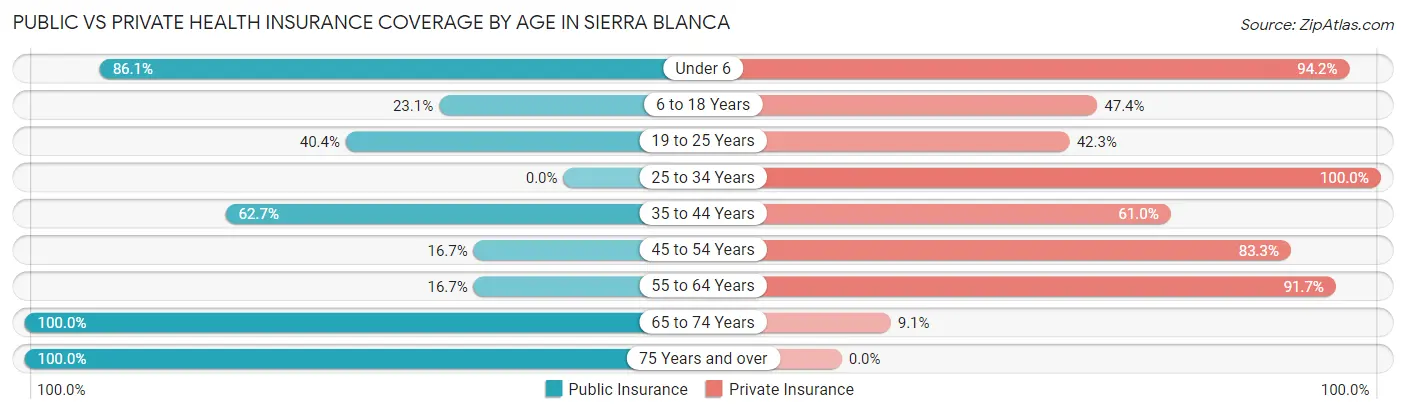
| Age Bracket | Public Insurance | Private Insurance |
| Under 6 | 74 (86.1%) | 81 (94.2%) |
| 6 to 18 Years | 18 (23.1%) | 37 (47.4%) |
| 19 to 25 Years | 21 (40.4%) | 22 (42.3%) |
| 25 to 34 Years | 0 (0.0%) | 45 (100.0%) |
| 35 to 44 Years | 37 (62.7%) | 36 (61.0%) |
| 45 to 54 Years | 6 (16.7%) | 30 (83.3%) |
| 55 to 64 Years | 4 (16.7%) | 22 (91.7%) |
| 65 to 74 Years | 99 (100.0%) | 9 (9.1%) |
| 75 Years and over | 5 (100.0%) | 0 (0.0%) |
| Total | 264 (54.5%) | 282 (58.3%) |
Disability Status by Sex by Age in Sierra Blanca
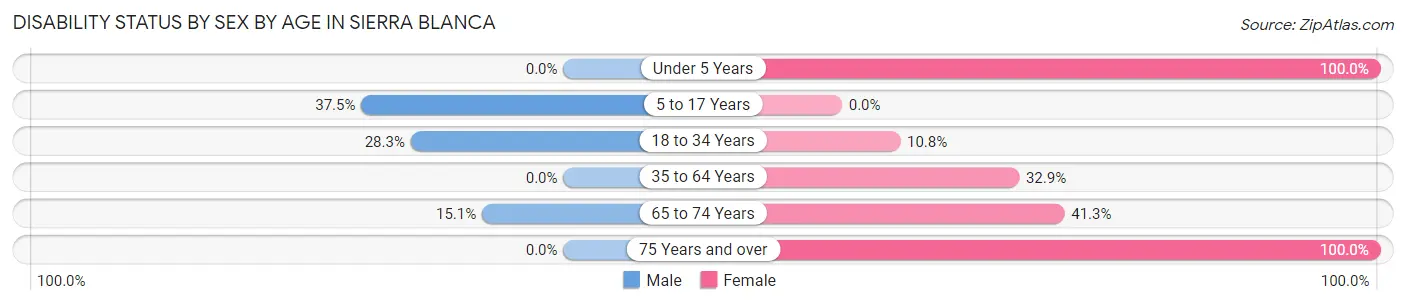
| Age Bracket | Male | Female |
| Under 5 Years | 0 (0.0%) | 74 (100.0%) |
| 5 to 17 Years | 18 (37.5%) | 0 (0.0%) |
| 18 to 34 Years | 17 (28.3%) | 4 (10.8%) |
| 35 to 64 Years | 0 (0.0%) | 25 (32.9%) |
| 65 to 74 Years | 8 (15.1%) | 19 (41.3%) |
| 75 Years and over | 0 (0.0%) | 5 (100.0%) |
Disability Class by Sex by Age in Sierra Blanca
Disability Class: Hearing Difficulty
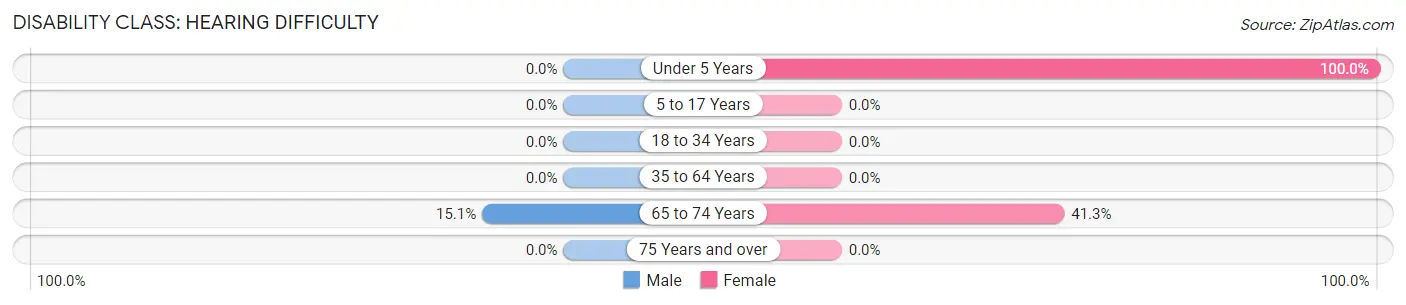
| Age Bracket | Male | Female |
| Under 5 Years | 0 (0.0%) | 74 (100.0%) |
| 5 to 17 Years | 0 (0.0%) | 0 (0.0%) |
| 18 to 34 Years | 0 (0.0%) | 0 (0.0%) |
| 35 to 64 Years | 0 (0.0%) | 0 (0.0%) |
| 65 to 74 Years | 8 (15.1%) | 19 (41.3%) |
| 75 Years and over | 0 (0.0%) | 0 (0.0%) |
Disability Class: Vision Difficulty
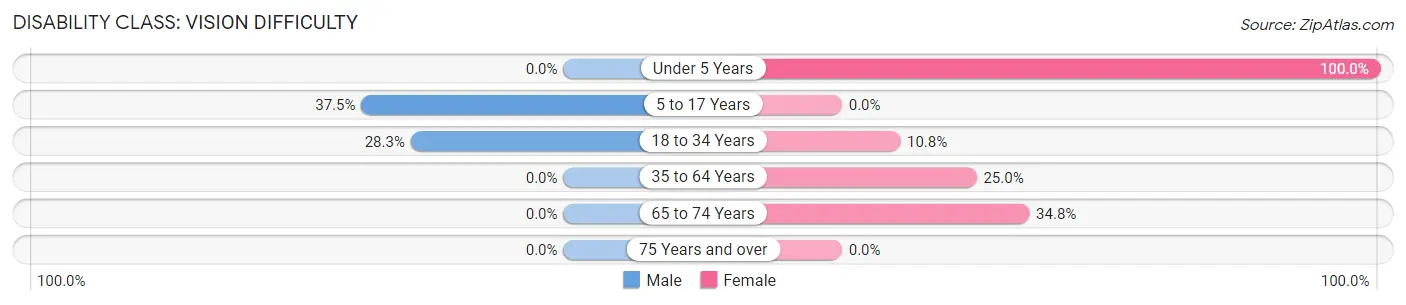
| Age Bracket | Male | Female |
| Under 5 Years | 0 (0.0%) | 74 (100.0%) |
| 5 to 17 Years | 18 (37.5%) | 0 (0.0%) |
| 18 to 34 Years | 17 (28.3%) | 4 (10.8%) |
| 35 to 64 Years | 0 (0.0%) | 19 (25.0%) |
| 65 to 74 Years | 0 (0.0%) | 16 (34.8%) |
| 75 Years and over | 0 (0.0%) | 0 (0.0%) |
Disability Class: Cognitive Difficulty
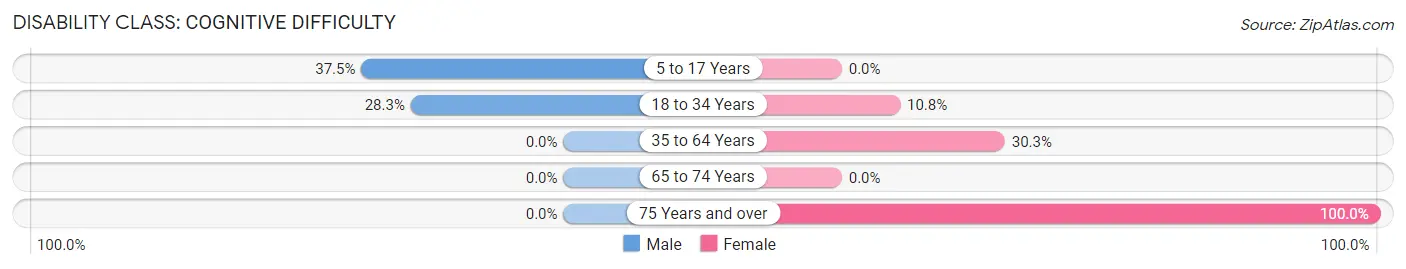
| Age Bracket | Male | Female |
| 5 to 17 Years | 18 (37.5%) | 0 (0.0%) |
| 18 to 34 Years | 17 (28.3%) | 4 (10.8%) |
| 35 to 64 Years | 0 (0.0%) | 23 (30.3%) |
| 65 to 74 Years | 0 (0.0%) | 0 (0.0%) |
| 75 Years and over | 0 (0.0%) | 5 (100.0%) |
Disability Class: Ambulatory Difficulty
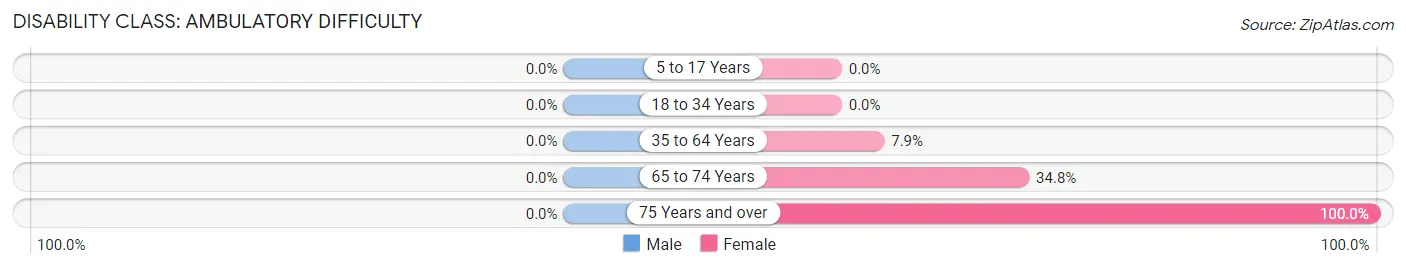
| Age Bracket | Male | Female |
| 5 to 17 Years | 0 (0.0%) | 0 (0.0%) |
| 18 to 34 Years | 0 (0.0%) | 0 (0.0%) |
| 35 to 64 Years | 0 (0.0%) | 6 (7.9%) |
| 65 to 74 Years | 0 (0.0%) | 16 (34.8%) |
| 75 Years and over | 0 (0.0%) | 5 (100.0%) |
Disability Class: Self-Care Difficulty
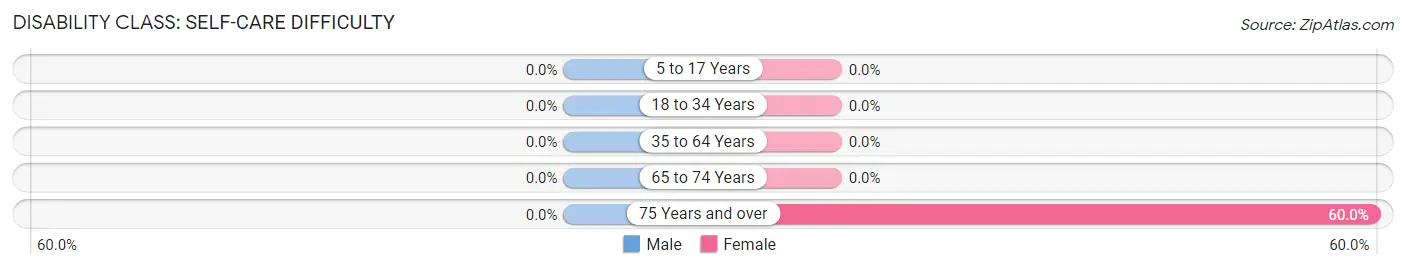
| Age Bracket | Male | Female |
| 5 to 17 Years | 0 (0.0%) | 0 (0.0%) |
| 18 to 34 Years | 0 (0.0%) | 0 (0.0%) |
| 35 to 64 Years | 0 (0.0%) | 0 (0.0%) |
| 65 to 74 Years | 0 (0.0%) | 0 (0.0%) |
| 75 Years and over | 0 (0.0%) | 3 (60.0%) |
Technology Access in Sierra Blanca
Computing Device Access in Sierra Blanca
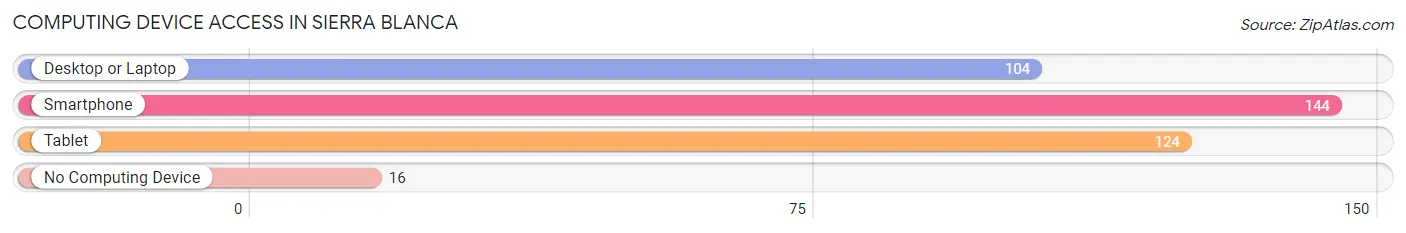
| Device Type | # Households | % Households |
| Desktop or Laptop | 104 | 63.8% |
| Smartphone | 144 | 88.3% |
| Tablet | 124 | 76.1% |
| No Computing Device | 16 | 9.8% |
| Total | 163 | 100.0% |
Internet Access in Sierra Blanca
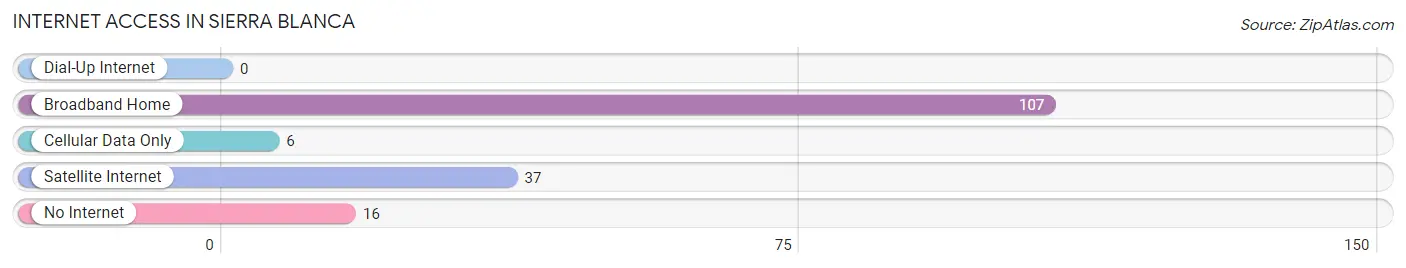
| Internet Type | # Households | % Households |
| Dial-Up Internet | 0 | 0.0% |
| Broadband Home | 107 | 65.6% |
| Cellular Data Only | 6 | 3.7% |
| Satellite Internet | 37 | 22.7% |
| No Internet | 16 | 9.8% |
| Total | 163 | 100.0% |
Sierra Blanca Summary
Sierra Blanca is a small unincorporated community located in Hudspeth County, Texas, United States. It is situated along the Rio Grande, approximately 90 miles southeast of El Paso. The town is known for its unique geography, economy, and demographics.
Geography
Sierra Blanca is located in the Chihuahuan Desert, at an elevation of 4,000 feet. The town is surrounded by the Sierra Blanca Mountains, which are part of the Franklin Mountains. The Rio Grande runs along the eastern edge of the town, and the Hueco Mountains are located to the west. The climate is arid, with hot summers and mild winters.
Economy
Sierra Blanca’s economy is largely based on agriculture and ranching. The town is home to several large ranches, including the Sierra Blanca Ranch, which is one of the largest in the state. The town also has a small tourism industry, with visitors coming to explore the nearby mountains and rivers.
Demographics
As of the 2010 census, Sierra Blanca had a population of 1,919. The population is predominantly Hispanic, with over 90% of the population identifying as such. The median household income is $25,000, and the median age is 33.
History
Sierra Blanca was first settled in the late 19th century by ranchers and farmers. The town was officially established in 1883, and the first post office was opened in 1884. The town was named after the nearby Sierra Blanca Mountains.
In the early 20th century, Sierra Blanca was a popular stop for travelers on the Southern Pacific Railroad. The town was also home to a number of saloons and gambling halls.
In the 1950s, the town began to decline as the railroad stopped running through the area. The population decreased, and many of the businesses closed.
In the late 20th century, Sierra Blanca began to experience a resurgence. The town was featured in the movie The Three Burials of Melquiades Estrada, and the population began to grow again. Today, Sierra Blanca is a small but vibrant community.
Conclusion
Sierra Blanca is a small unincorporated community located in Hudspeth County, Texas. It is known for its unique geography, economy, and demographics. The town is situated in the Chihuahuan Desert, and is surrounded by the Sierra Blanca Mountains. The economy is largely based on agriculture and ranching, and the population is predominantly Hispanic. Sierra Blanca has experienced a resurgence in recent years, and is now a small but vibrant community.
Common Questions
What is Per Capita Income in Sierra Blanca?
Per Capita income in Sierra Blanca is $22,042.
What is the Median Family Income in Sierra Blanca?
Median Family Income in Sierra Blanca is $93,393.
What is the Median Household income in Sierra Blanca?
Median Household Income in Sierra Blanca is $56,563.
What is Income or Wage Gap in Sierra Blanca?
Income or Wage Gap in Sierra Blanca is 3.9%.
Women in Sierra Blanca earn 96.1 cents for every dollar earned by a man.
What is Inequality or Gini Index in Sierra Blanca?
Inequality or Gini Index in Sierra Blanca is 0.39.
What is the Total Population of Sierra Blanca?
Total Population of Sierra Blanca is 544.
What is the Total Male Population of Sierra Blanca?
Total Male Population of Sierra Blanca is 264.
What is the Total Female Population of Sierra Blanca?
Total Female Population of Sierra Blanca is 280.
What is the Ratio of Males per 100 Females in Sierra Blanca?
There are 94.29 Males per 100 Females in Sierra Blanca.
What is the Ratio of Females per 100 Males in Sierra Blanca?
There are 106.06 Females per 100 Males in Sierra Blanca.
What is the Median Population Age in Sierra Blanca?
Median Population Age in Sierra Blanca is 30.8 Years.
What is the Average Family Size in Sierra Blanca
Average Family Size in Sierra Blanca is 3.6 People.
What is the Average Household Size in Sierra Blanca
Average Household Size in Sierra Blanca is 2.9 People.
How Large is the Labor Force in Sierra Blanca?
There are 208 People in the Labor Forcein in Sierra Blanca.
What is the Percentage of People in the Labor Force in Sierra Blanca?
49.5% of People are in the Labor Force in Sierra Blanca.
What is the Unemployment Rate in Sierra Blanca?
Unemployment Rate in Sierra Blanca is 7.7%.