Parker, TX Map & Demographics
Parker Map
Parker Overview
$68,579
PER CAPITA INCOME
$208,068
AVG FAMILY INCOME
$202,727
AVG HOUSEHOLD INCOME
45.3%
WAGE / INCOME GAP [ % ]
54.7¢/ $1
WAGE / INCOME GAP [ $ ]
0.41
INEQUALITY / GINI INDEX
5,573
TOTAL POPULATION
2,935
MALE POPULATION
2,638
FEMALE POPULATION
111.26
MALES / 100 FEMALES
89.88
FEMALES / 100 MALES
43.8
MEDIAN AGE
4.0
AVG FAMILY SIZE
3.9
AVG HOUSEHOLD SIZE
2,605
LABOR FORCE [ PEOPLE ]
58.9%
PERCENT IN LABOR FORCE
2.3%
UNEMPLOYMENT RATE
Income in Parker
Income Overview in Parker
Per Capita Income in Parker is $68,579, while median incomes of families and households are $208,068 and $202,727 respectively.
| Characteristic | Number | Measure |
| Per Capita Income | 5,573 | $68,579 |
| Median Family Income | 1,382 | $208,068 |
| Mean Family Income | 1,382 | $268,915 |
| Median Household Income | 1,422 | $202,727 |
| Mean Household Income | 1,422 | $266,130 |
| Income Deficit | 1,382 | $0 |
| Wage / Income Gap (%) | 5,573 | 45.34% |
| Wage / Income Gap ($) | 5,573 | 54.66¢ per $1 |
| Gini / Inequality Index | 5,573 | 0.41 |
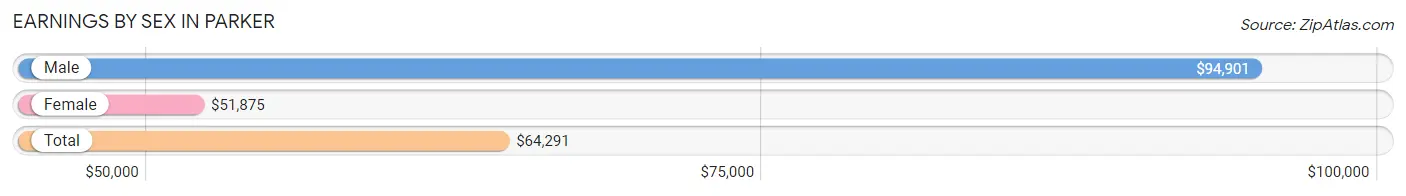
Earnings by Sex in Parker
Average Earnings in Parker are $64,291, $94,901 for men and $51,875 for women, a difference of 45.3%.
| Sex | Number | Average Earnings |
| Male | 1,484 (54.6%) | $94,901 |
| Female | 1,232 (45.4%) | $51,875 |
| Total | 2,716 (100.0%) | $64,291 |
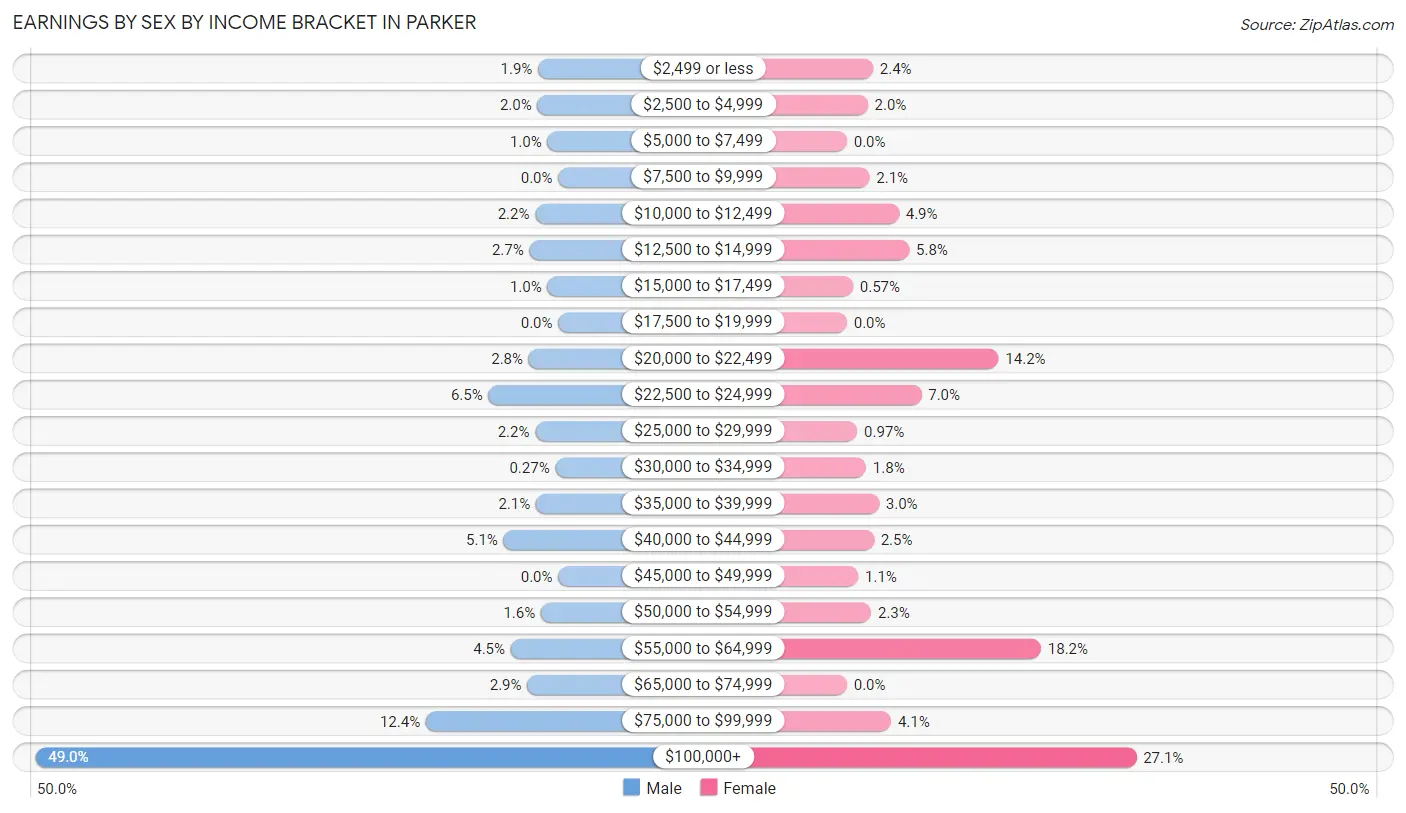
Earnings by Sex by Income Bracket in Parker
The most common earnings brackets in Parker are $100,000+ for men (727 | 49.0%) and $100,000+ for women (334 | 27.1%).
| Income | Male | Female |
| $2,499 or less | 28 (1.9%) | 30 (2.4%) |
| $2,500 to $4,999 | 29 (1.9%) | 24 (1.9%) |
| $5,000 to $7,499 | 15 (1.0%) | 0 (0.0%) |
| $7,500 to $9,999 | 0 (0.0%) | 26 (2.1%) |
| $10,000 to $12,499 | 32 (2.2%) | 60 (4.9%) |
| $12,500 to $14,999 | 40 (2.7%) | 72 (5.8%) |
| $15,000 to $17,499 | 15 (1.0%) | 7 (0.6%) |
| $17,500 to $19,999 | 0 (0.0%) | 0 (0.0%) |
| $20,000 to $22,499 | 41 (2.8%) | 175 (14.2%) |
| $22,500 to $24,999 | 97 (6.5%) | 86 (7.0%) |
| $25,000 to $29,999 | 32 (2.2%) | 12 (1.0%) |
| $30,000 to $34,999 | 4 (0.3%) | 22 (1.8%) |
| $35,000 to $39,999 | 31 (2.1%) | 37 (3.0%) |
| $40,000 to $44,999 | 76 (5.1%) | 31 (2.5%) |
| $45,000 to $49,999 | 0 (0.0%) | 13 (1.1%) |
| $50,000 to $54,999 | 24 (1.6%) | 28 (2.3%) |
| $55,000 to $64,999 | 66 (4.4%) | 224 (18.2%) |
| $65,000 to $74,999 | 43 (2.9%) | 0 (0.0%) |
| $75,000 to $99,999 | 184 (12.4%) | 51 (4.1%) |
| $100,000+ | 727 (49.0%) | 334 (27.1%) |
| Total | 1,484 (100.0%) | 1,232 (100.0%) |
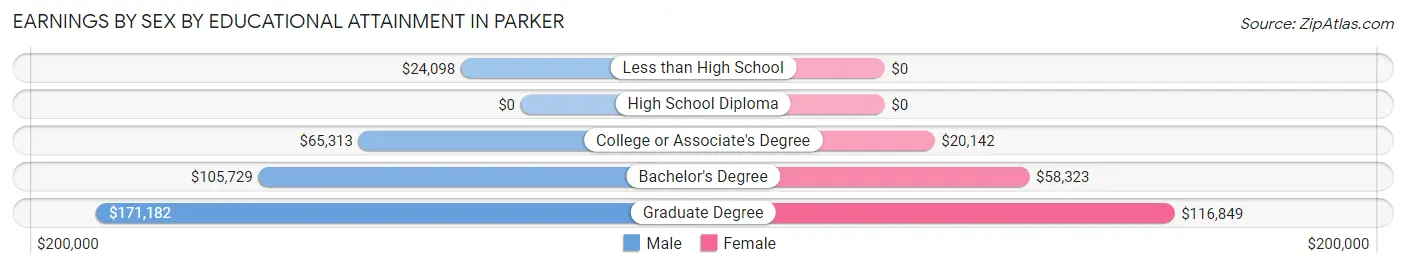
Earnings by Sex by Educational Attainment in Parker
Average earnings in Parker are $114,712 for men and $58,383 for women, a difference of 49.1%. Men with an educational attainment of graduate degree enjoy the highest average annual earnings of $171,182, while those with less than high school education earn the least with $24,098. Women with an educational attainment of graduate degree earn the most with the average annual earnings of $116,849, while those with college or associate's degree education have the smallest earnings of $20,142.
| Educational Attainment | Male Income | Female Income |
| Less than High School | $24,098 | $0 |
| High School Diploma | - | - |
| College or Associate's Degree | $65,313 | $20,142 |
| Bachelor's Degree | $105,729 | $58,323 |
| Graduate Degree | $171,182 | $116,849 |
| Total | $114,712 | $58,383 |
Family Income in Parker
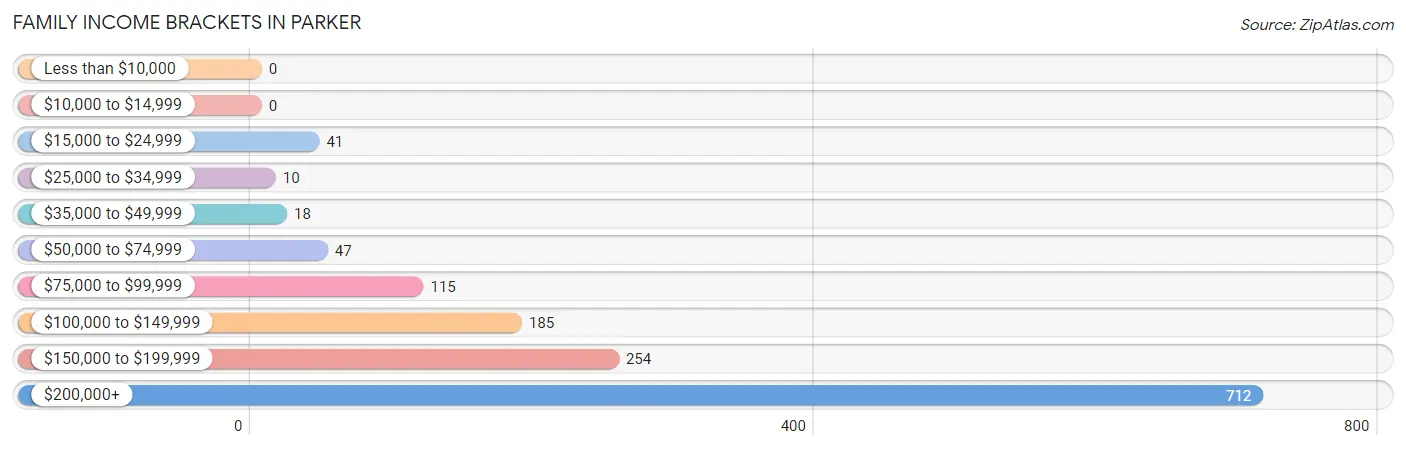
Family Income Brackets in Parker
According to the Parker family income data, there are 712 families falling into the $200,000+ income range, which is the most common income bracket and makes up 51.5% of all families.
| Income Bracket | # Families | % Families |
| Less than $10,000 | 0 | 0.0% |
| $10,000 to $14,999 | 0 | 0.0% |
| $15,000 to $24,999 | 41 | 3.0% |
| $25,000 to $34,999 | 10 | 0.7% |
| $35,000 to $49,999 | 18 | 1.3% |
| $50,000 to $74,999 | 47 | 3.4% |
| $75,000 to $99,999 | 115 | 8.3% |
| $100,000 to $149,999 | 185 | 13.4% |
| $150,000 to $199,999 | 254 | 18.4% |
| $200,000+ | 712 | 51.5% |
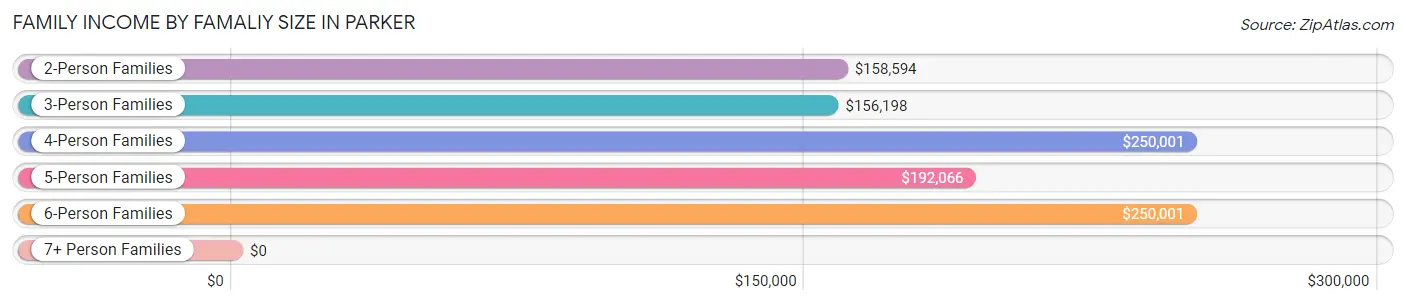
Family Income by Famaliy Size in Parker
4-person families (279 | 20.2%) account for the highest median family income in Parker with $250,001 per family, while 2-person families (376 | 27.2%) have the highest median income of $79,297 per family member.
| Income Bracket | # Families | Median Income |
| 2-Person Families | 376 (27.2%) | $158,594 |
| 3-Person Families | 199 (14.4%) | $156,198 |
| 4-Person Families | 279 (20.2%) | $250,001 |
| 5-Person Families | 294 (21.3%) | $192,066 |
| 6-Person Families | 224 (16.2%) | $250,001 |
| 7+ Person Families | 10 (0.7%) | $0 |
| Total | 1,382 (100.0%) | $208,068 |
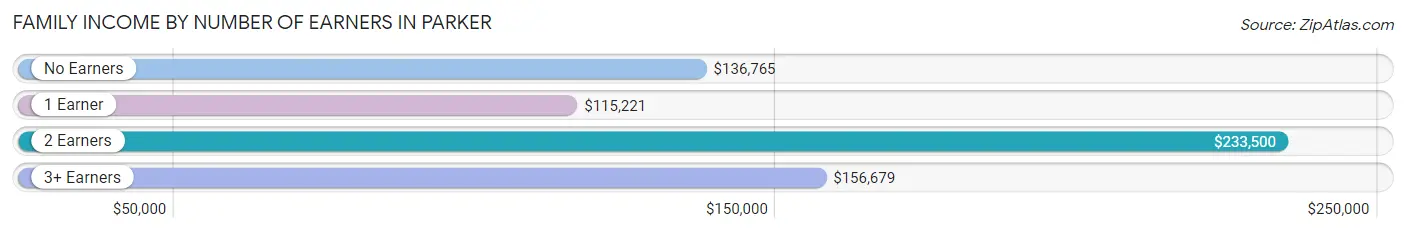
Family Income by Number of Earners in Parker
The median family income in Parker is $208,068, with families comprising 2 earners (778) having the highest median family income of $233,500, while families with 1 earner (197) have the lowest median family income of $115,221, accounting for 56.3% and 14.2% of families, respectively.
| Number of Earners | # Families | Median Income |
| No Earners | 166 (12.0%) | $136,765 |
| 1 Earner | 197 (14.2%) | $115,221 |
| 2 Earners | 778 (56.3%) | $233,500 |
| 3+ Earners | 241 (17.4%) | $156,679 |
| Total | 1,382 (100.0%) | $208,068 |
Household Income in Parker
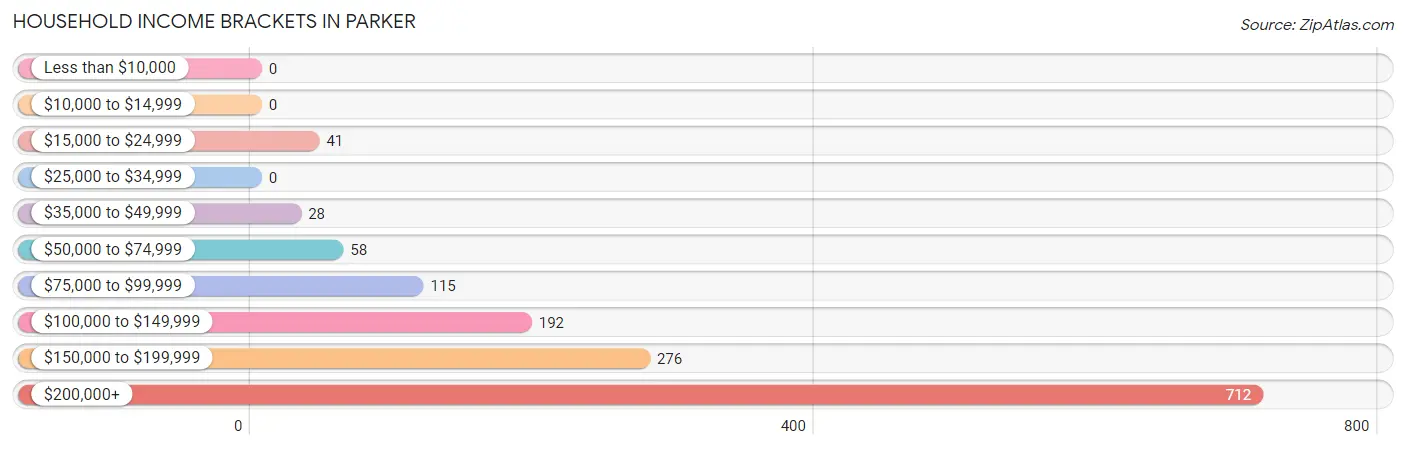
Household Income Brackets in Parker
With 712 households falling in the category, the $200,000+ income range is the most frequent in Parker, accounting for 50.1% of all households.
| Income Bracket | # Households | % Households |
| Less than $10,000 | 0 | 0.0% |
| $10,000 to $14,999 | 0 | 0.0% |
| $15,000 to $24,999 | 41 | 2.9% |
| $25,000 to $34,999 | 0 | 0.0% |
| $35,000 to $49,999 | 28 | 2.0% |
| $50,000 to $74,999 | 58 | 4.1% |
| $75,000 to $99,999 | 115 | 8.1% |
| $100,000 to $149,999 | 192 | 13.5% |
| $150,000 to $199,999 | 276 | 19.4% |
| $200,000+ | 712 | 50.1% |
Household Income by Householder Age in Parker
The median household income in Parker is $202,727, with the highest median household income of $250,001 found in the 45 to 64 years age bracket for the primary householder. A total of 749 households (52.7%) fall into this category.
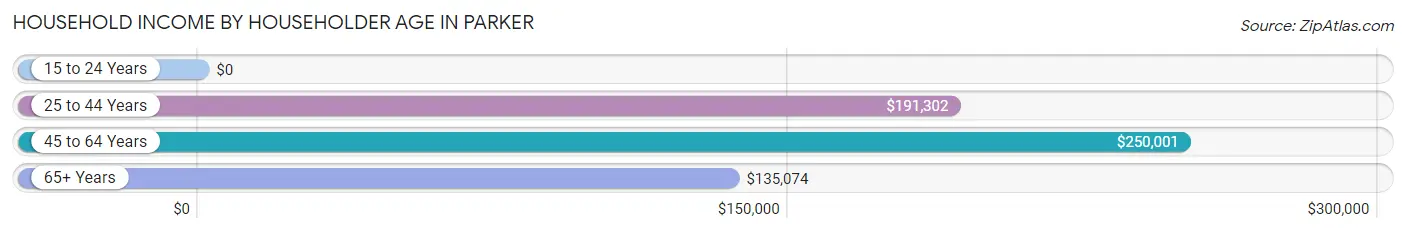
| Income Bracket | # Households | Median Income |
| 15 to 24 Years | 0 (0.0%) | $0 |
| 25 to 44 Years | 438 (30.8%) | $191,302 |
| 45 to 64 Years | 749 (52.7%) | $250,001 |
| 65+ Years | 235 (16.5%) | $135,074 |
| Total | 1,422 (100.0%) | $202,727 |
Poverty in Parker
Income Below Poverty by Sex and Age in Parker
With 4.0% poverty level for males and 1.3% for females among the residents of Parker, 12 to 14 year old males and 35 to 44 year old females are the most vulnerable to poverty, with 35 males (47.9%) and 34 females (8.4%) in their respective age groups living below the poverty level.
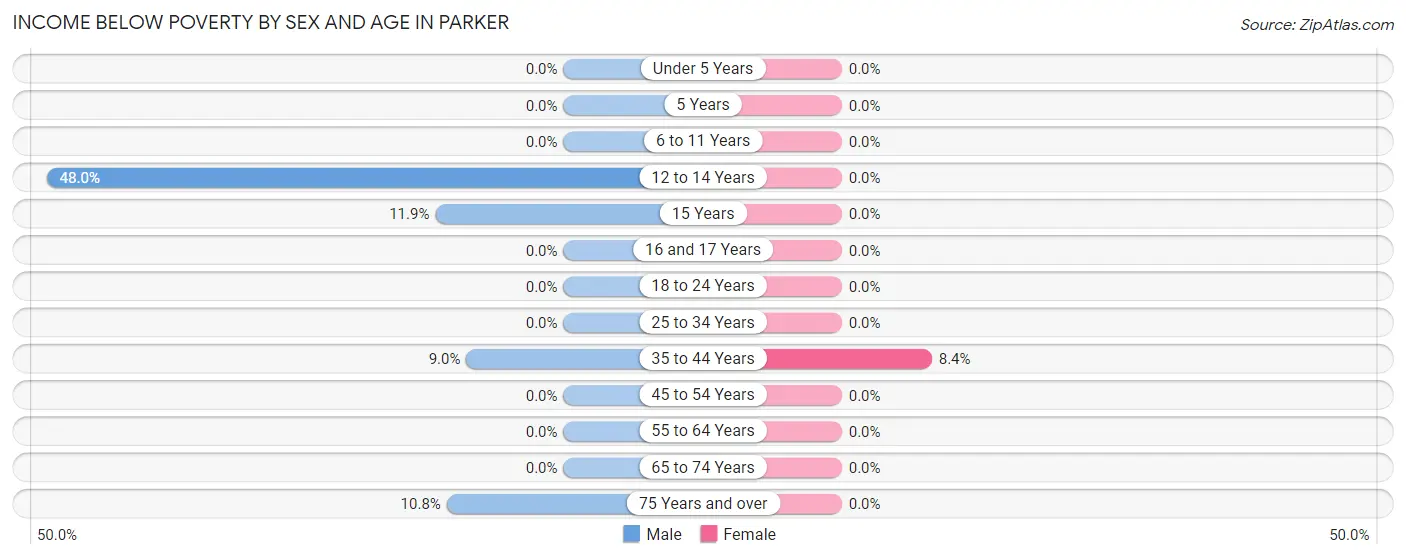
| Age Bracket | Male | Female |
| Under 5 Years | 0 (0.0%) | 0 (0.0%) |
| 5 Years | 0 (0.0%) | 0 (0.0%) |
| 6 to 11 Years | 0 (0.0%) | 0 (0.0%) |
| 12 to 14 Years | 35 (47.9%) | 0 (0.0%) |
| 15 Years | 29 (11.9%) | 0 (0.0%) |
| 16 and 17 Years | 0 (0.0%) | 0 (0.0%) |
| 18 to 24 Years | 0 (0.0%) | 0 (0.0%) |
| 25 to 34 Years | 0 (0.0%) | 0 (0.0%) |
| 35 to 44 Years | 41 (9.0%) | 34 (8.4%) |
| 45 to 54 Years | 0 (0.0%) | 0 (0.0%) |
| 55 to 64 Years | 0 (0.0%) | 0 (0.0%) |
| 65 to 74 Years | 0 (0.0%) | 0 (0.0%) |
| 75 Years and over | 13 (10.8%) | 0 (0.0%) |
| Total | 118 (4.0%) | 34 (1.3%) |
Income Above Poverty by Sex and Age in Parker
According to the poverty statistics in Parker, males aged under 5 years and females aged under 5 years are the age groups that are most secure financially, with 100.0% of males and 100.0% of females in these age groups living above the poverty line.
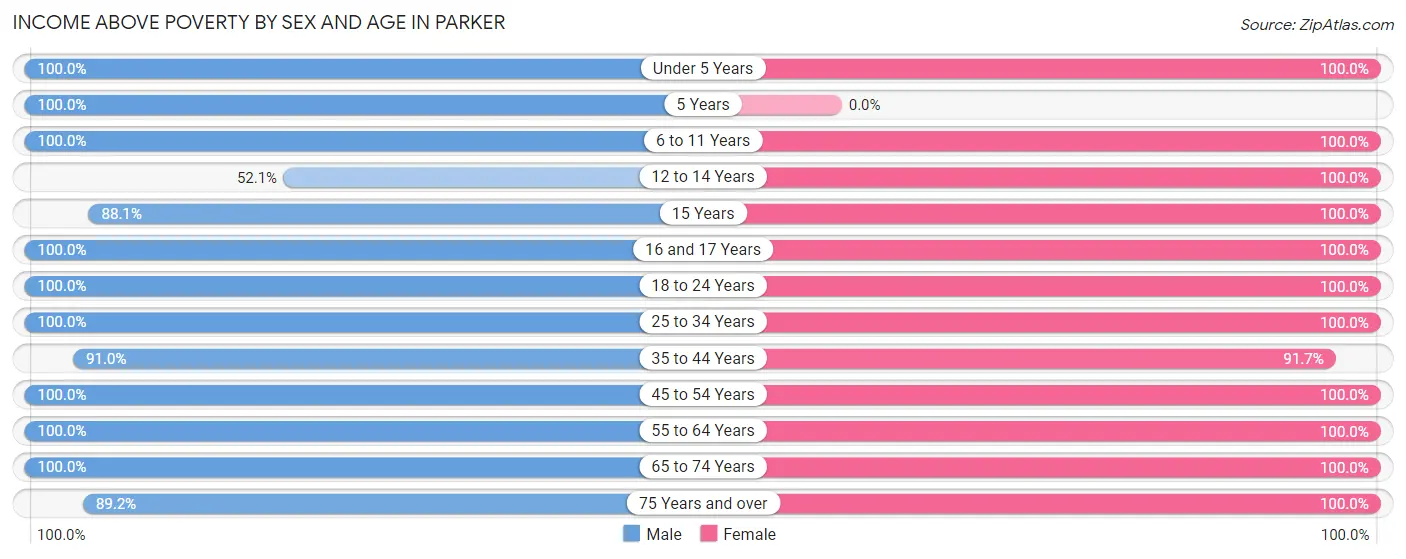
| Age Bracket | Male | Female |
| Under 5 Years | 70 (100.0%) | 84 (100.0%) |
| 5 Years | 25 (100.0%) | 0 (0.0%) |
| 6 to 11 Years | 390 (100.0%) | 152 (100.0%) |
| 12 to 14 Years | 38 (52.0%) | 107 (100.0%) |
| 15 Years | 215 (88.1%) | 6 (100.0%) |
| 16 and 17 Years | 92 (100.0%) | 66 (100.0%) |
| 18 to 24 Years | 404 (100.0%) | 210 (100.0%) |
| 25 to 34 Years | 49 (100.0%) | 135 (100.0%) |
| 35 to 44 Years | 414 (91.0%) | 373 (91.6%) |
| 45 to 54 Years | 387 (100.0%) | 415 (100.0%) |
| 55 to 64 Years | 405 (100.0%) | 357 (100.0%) |
| 65 to 74 Years | 221 (100.0%) | 374 (100.0%) |
| 75 Years and over | 107 (89.2%) | 325 (100.0%) |
| Total | 2,817 (96.0%) | 2,604 (98.7%) |
Income Below Poverty Among Married-Couple Families in Parker
The poverty statistics for married-couple families in Parker show that 3.1% or 41 of the total 1,315 families live below the poverty line. Families with 1 or 2 children have the highest poverty rate of 7.1%, comprising of 41 families. On the other hand, families with no children have the lowest poverty rate of 0.0%, which includes 0 families.
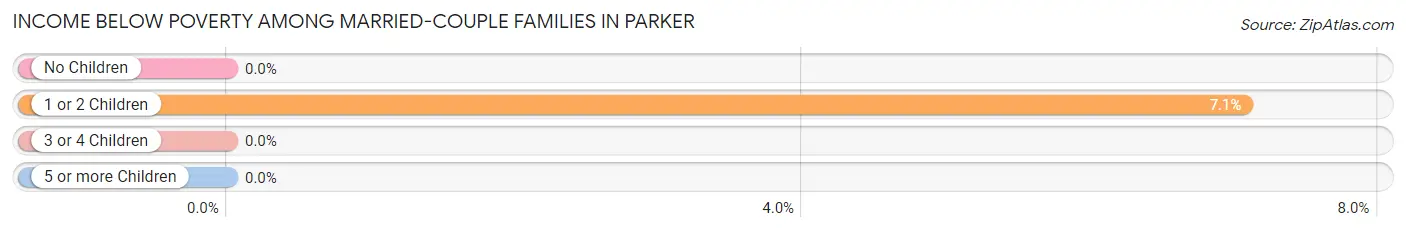
| Children | Above Poverty | Below Poverty |
| No Children | 557 (100.0%) | 0 (0.0%) |
| 1 or 2 Children | 539 (92.9%) | 41 (7.1%) |
| 3 or 4 Children | 178 (100.0%) | 0 (0.0%) |
| 5 or more Children | 0 (0.0%) | 0 (0.0%) |
| Total | 1,274 (96.9%) | 41 (3.1%) |
Income Below Poverty Among Single-Parent Households in Parker
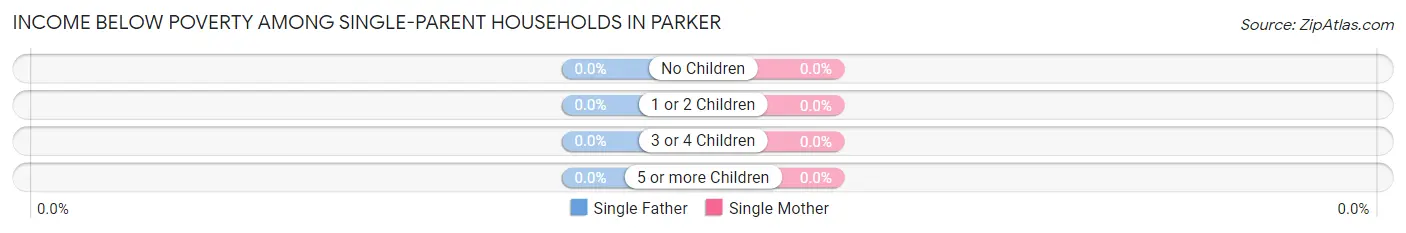
| Children | Single Father | Single Mother |
| No Children | 0 (0.0%) | 0 (0.0%) |
| 1 or 2 Children | 0 (0.0%) | 0 (0.0%) |
| 3 or 4 Children | 0 (0.0%) | 0 (0.0%) |
| 5 or more Children | 0 (0.0%) | 0 (0.0%) |
| Total | 0 (0.0%) | 0 (0.0%) |
Income Below Poverty Among Married-Couple vs Single-Parent Households in Parker
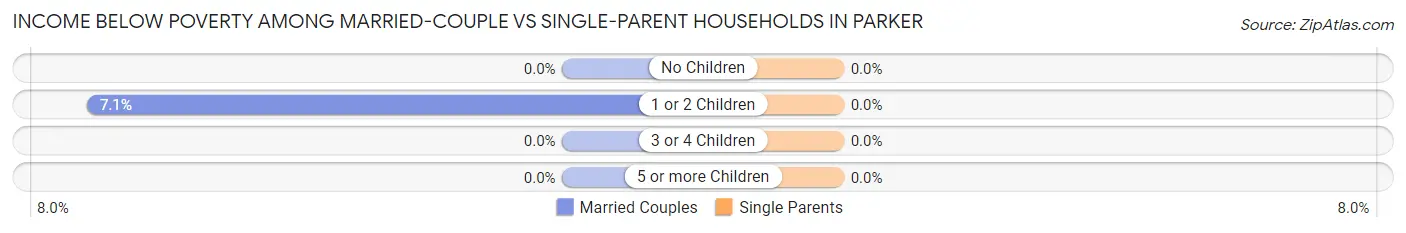
| Children | Married-Couple Families | Single-Parent Households |
| No Children | 0 (0.0%) | 0 (0.0%) |
| 1 or 2 Children | 41 (7.1%) | 0 (0.0%) |
| 3 or 4 Children | 0 (0.0%) | 0 (0.0%) |
| 5 or more Children | 0 (0.0%) | 0 (0.0%) |
| Total | 41 (3.1%) | 0 (0.0%) |
Race in Parker
The most populous races in Parker are White / Caucasian (3,583 | 64.3%), Asian (1,044 | 18.7%), and Black / African American (567 | 10.2%).
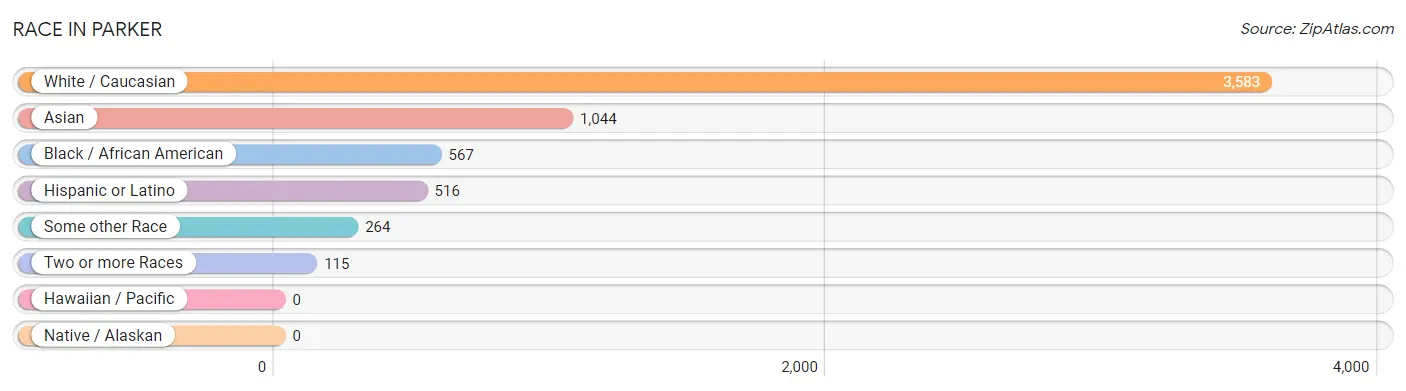
| Race | # Population | % Population |
| Asian | 1,044 | 18.7% |
| Black / African American | 567 | 10.2% |
| Hawaiian / Pacific | 0 | 0.0% |
| Hispanic or Latino | 516 | 9.3% |
| Native / Alaskan | 0 | 0.0% |
| White / Caucasian | 3,583 | 64.3% |
| Two or more Races | 115 | 2.1% |
| Some other Race | 264 | 4.7% |
| Total | 5,573 | 100.0% |
Ancestry in Parker
The most populous ancestries reported in Parker are Polish (1,060 | 19.0%), Thai (728 | 13.1%), Mexican (516 | 9.3%), English (444 | 8.0%), and Irish (444 | 8.0%), together accounting for 57.3% of all Parker residents.
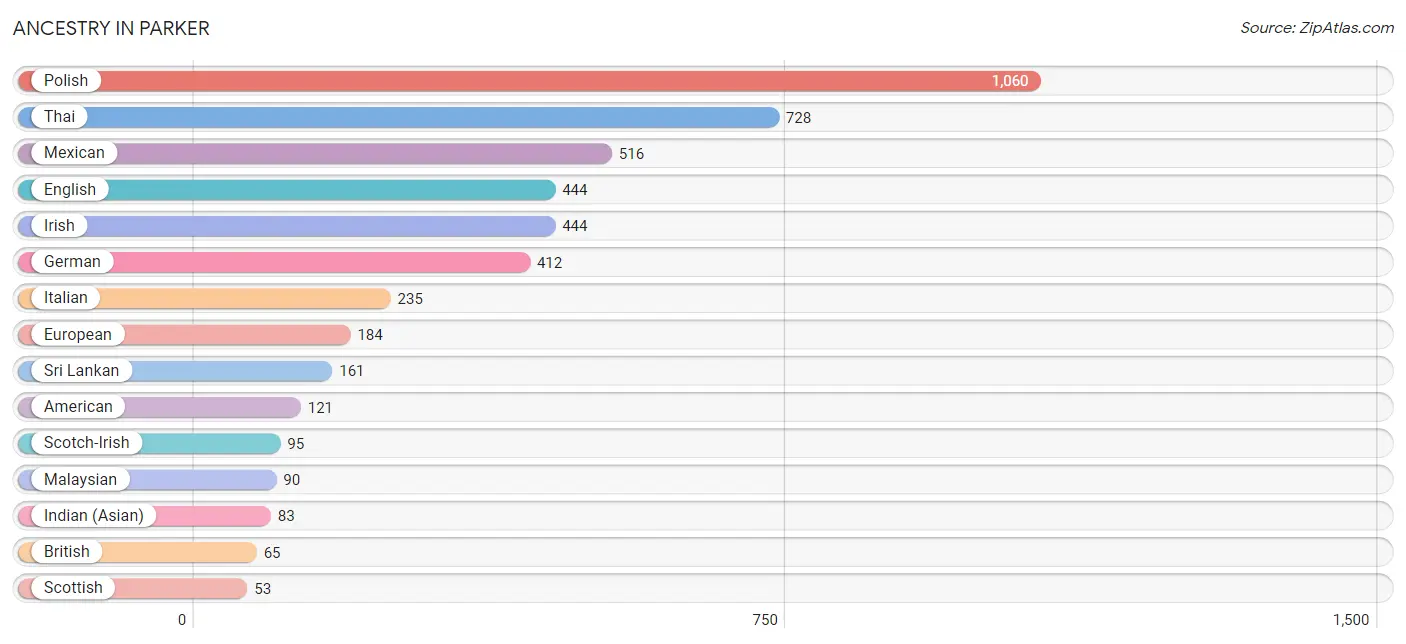
| Ancestry | # Population | % Population |
| African | 13 | 0.2% |
| American | 121 | 2.2% |
| Arab | 24 | 0.4% |
| British | 65 | 1.2% |
| Czech | 28 | 0.5% |
| Dutch | 24 | 0.4% |
| Egyptian | 11 | 0.2% |
| English | 444 | 8.0% |
| European | 184 | 3.3% |
| French | 9 | 0.2% |
| German | 412 | 7.4% |
| Greek | 17 | 0.3% |
| Hungarian | 9 | 0.2% |
| Indian (Asian) | 83 | 1.5% |
| Iranian | 7 | 0.1% |
| Irish | 444 | 8.0% |
| Italian | 235 | 4.2% |
| Lebanese | 13 | 0.2% |
| Malaysian | 90 | 1.6% |
| Mexican | 516 | 9.3% |
| Northern European | 7 | 0.1% |
| Norwegian | 11 | 0.2% |
| Polish | 1,060 | 19.0% |
| Scotch-Irish | 95 | 1.7% |
| Scottish | 53 | 0.9% |
| Sri Lankan | 161 | 2.9% |
| Subsaharan African | 13 | 0.2% |
| Swedish | 43 | 0.8% |
| Swiss | 49 | 0.9% |
| Thai | 728 | 13.1% |
| Ukrainian | 11 | 0.2% | View All 31 Rows |
Immigrants in Parker
The most numerous immigrant groups reported in Parker came from Asia (694 | 12.4%), South Central Asia (480 | 8.6%), India (455 | 8.2%), Central America (350 | 6.3%), and Latin America (350 | 6.3%), together accounting for 41.8% of all Parker residents.
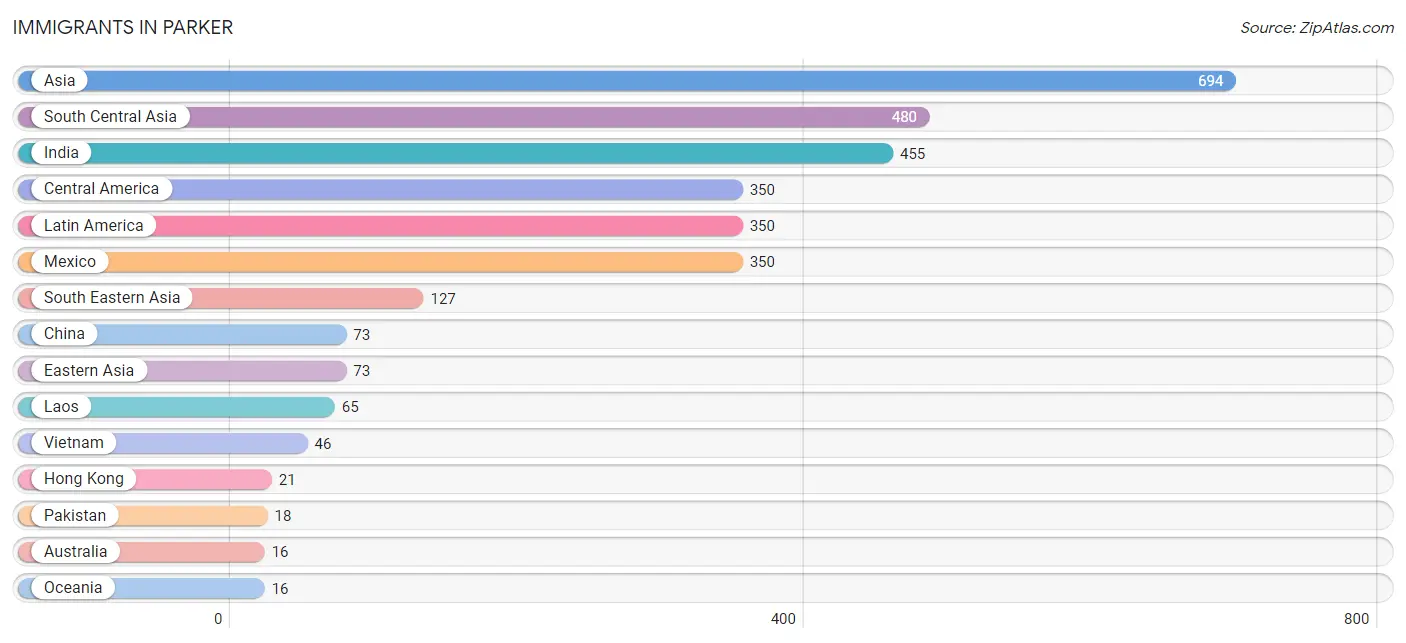
| Immigration Origin | # Population | % Population |
| Africa | 5 | 0.1% |
| Asia | 694 | 12.4% |
| Australia | 16 | 0.3% |
| Central America | 350 | 6.3% |
| China | 73 | 1.3% |
| Eastern Asia | 73 | 1.3% |
| Eastern Europe | 5 | 0.1% |
| Egypt | 5 | 0.1% |
| Europe | 5 | 0.1% |
| Hong Kong | 21 | 0.4% |
| India | 455 | 8.2% |
| Iran | 7 | 0.1% |
| Laos | 65 | 1.2% |
| Latin America | 350 | 6.3% |
| Mexico | 350 | 6.3% |
| Northern Africa | 5 | 0.1% |
| Oceania | 16 | 0.3% |
| Pakistan | 18 | 0.3% |
| Poland | 5 | 0.1% |
| South Central Asia | 480 | 8.6% |
| South Eastern Asia | 127 | 2.3% |
| Thailand | 16 | 0.3% |
| Vietnam | 46 | 0.8% |
| Western Asia | 14 | 0.3% | View All 24 Rows |
Sex and Age in Parker
Sex and Age in Parker
The most populous age groups in Parker are 15 to 19 Years (429 | 14.6%) for men and 45 to 49 Years (324 | 12.3%) for women.
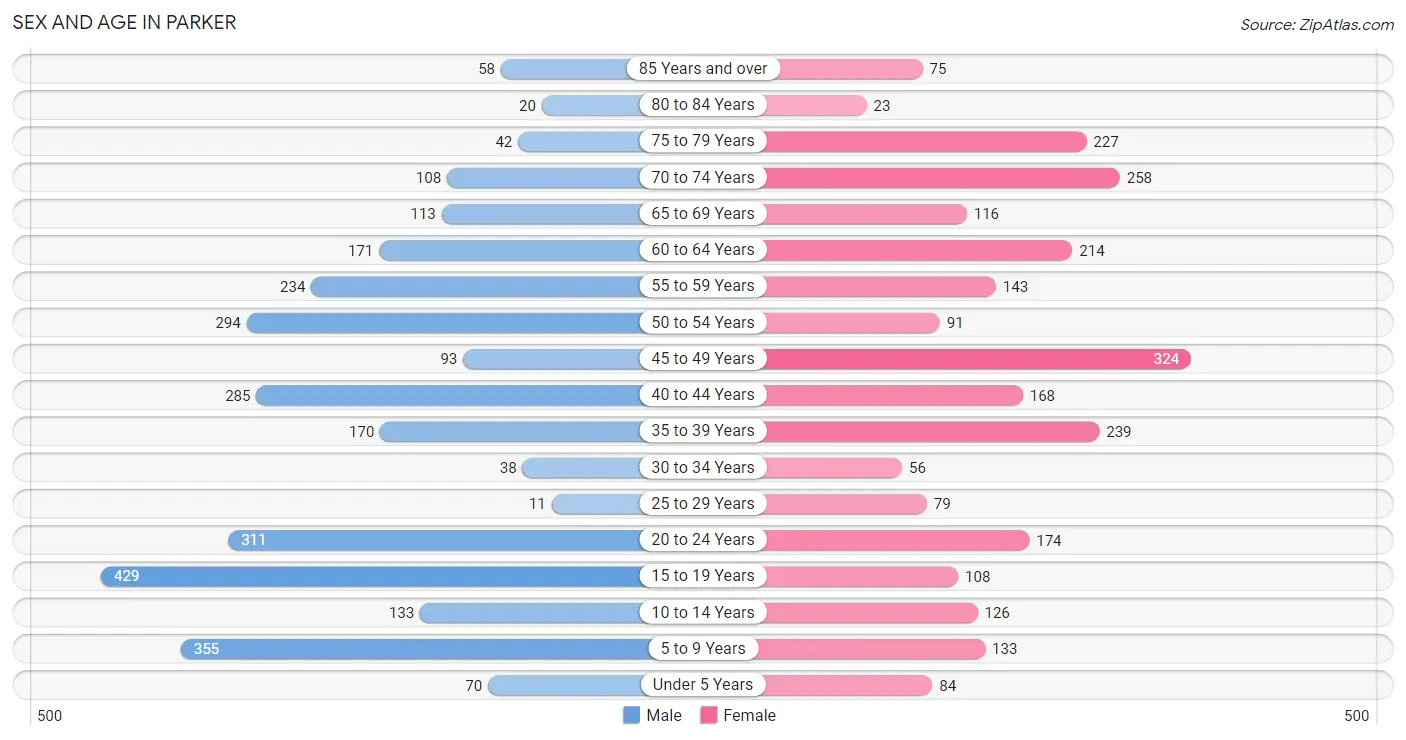
| Age Bracket | Male | Female |
| Under 5 Years | 70 (2.4%) | 84 (3.2%) |
| 5 to 9 Years | 355 (12.1%) | 133 (5.0%) |
| 10 to 14 Years | 133 (4.5%) | 126 (4.8%) |
| 15 to 19 Years | 429 (14.6%) | 108 (4.1%) |
| 20 to 24 Years | 311 (10.6%) | 174 (6.6%) |
| 25 to 29 Years | 11 (0.4%) | 79 (3.0%) |
| 30 to 34 Years | 38 (1.3%) | 56 (2.1%) |
| 35 to 39 Years | 170 (5.8%) | 239 (9.1%) |
| 40 to 44 Years | 285 (9.7%) | 168 (6.4%) |
| 45 to 49 Years | 93 (3.2%) | 324 (12.3%) |
| 50 to 54 Years | 294 (10.0%) | 91 (3.5%) |
| 55 to 59 Years | 234 (8.0%) | 143 (5.4%) |
| 60 to 64 Years | 171 (5.8%) | 214 (8.1%) |
| 65 to 69 Years | 113 (3.8%) | 116 (4.4%) |
| 70 to 74 Years | 108 (3.7%) | 258 (9.8%) |
| 75 to 79 Years | 42 (1.4%) | 227 (8.6%) |
| 80 to 84 Years | 20 (0.7%) | 23 (0.9%) |
| 85 Years and over | 58 (2.0%) | 75 (2.8%) |
| Total | 2,935 (100.0%) | 2,638 (100.0%) |
Families and Households in Parker
Median Family Size in Parker
The median family size in Parker is 3.97 persons per family, with married-couple families (1,315 | 95.2%) accounting for the largest median family size of 4.03 persons per family. On the other hand, single female/mother families (31 | 2.2%) represent the smallest median family size with 2.61 persons per family.
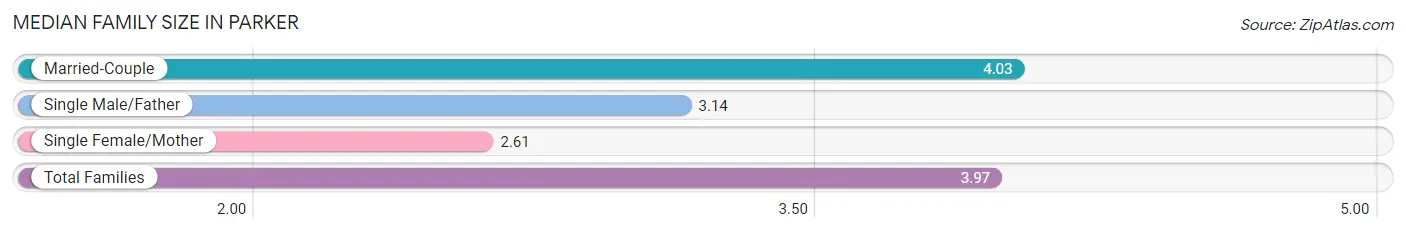
| Family Type | # Families | Family Size |
| Married-Couple | 1,315 (95.2%) | 4.03 |
| Single Male/Father | 36 (2.6%) | 3.14 |
| Single Female/Mother | 31 (2.2%) | 2.61 |
| Total Families | 1,382 (100.0%) | 3.97 |
Median Household Size in Parker
The median household size in Parker is 3.92 persons per household, with married-couple households (1,315 | 92.5%) accounting for the largest median household size of 4.04 persons per household. non-family households (40 | 2.8%) represent the smallest median household size with 1.28 persons per household.
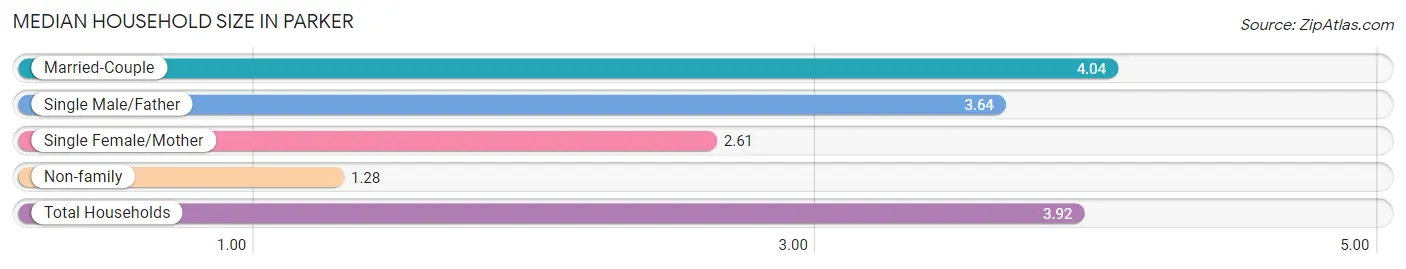
| Household Type | # Households | Household Size |
| Married-Couple | 1,315 (92.5%) | 4.04 |
| Single Male/Father | 36 (2.5%) | 3.64 |
| Single Female/Mother | 31 (2.2%) | 2.61 |
| Non-family | 40 (2.8%) | 1.28 |
| Total Households | 1,422 (100.0%) | 3.92 |
Household Size by Marriage Status in Parker
Out of a total of 1,422 households in Parker, 1,382 (97.2%) are family households, while 40 (2.8%) are nonfamily households. The most numerous type of family households are 2-person households, comprising 361, and the most common type of nonfamily households are 1-person households, comprising 29.
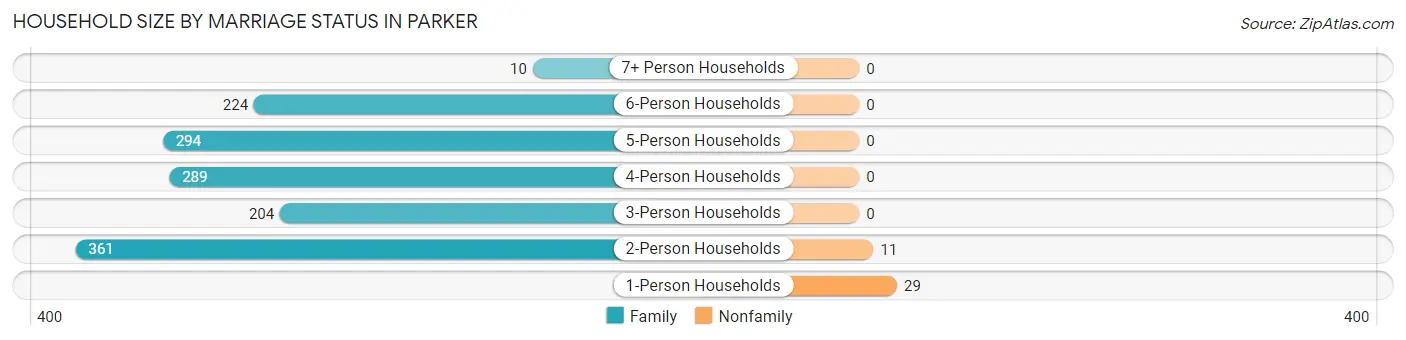
| Household Size | Family Households | Nonfamily Households |
| 1-Person Households | - | 29 (2.0%) |
| 2-Person Households | 361 (25.4%) | 11 (0.8%) |
| 3-Person Households | 204 (14.3%) | 0 (0.0%) |
| 4-Person Households | 289 (20.3%) | 0 (0.0%) |
| 5-Person Households | 294 (20.7%) | 0 (0.0%) |
| 6-Person Households | 224 (15.8%) | 0 (0.0%) |
| 7+ Person Households | 10 (0.7%) | 0 (0.0%) |
| Total | 1,382 (97.2%) | 40 (2.8%) |
Female Fertility in Parker
Fertility by Age in Parker
Average fertility rate in Parker is 32.0 births per 1,000 women. Women in the age bracket of 20 to 34 years have the highest fertility rate with 36.0 births per 1,000 women. Women in the age bracket of 35 to 50 years acount for 70.3% of all women with births.
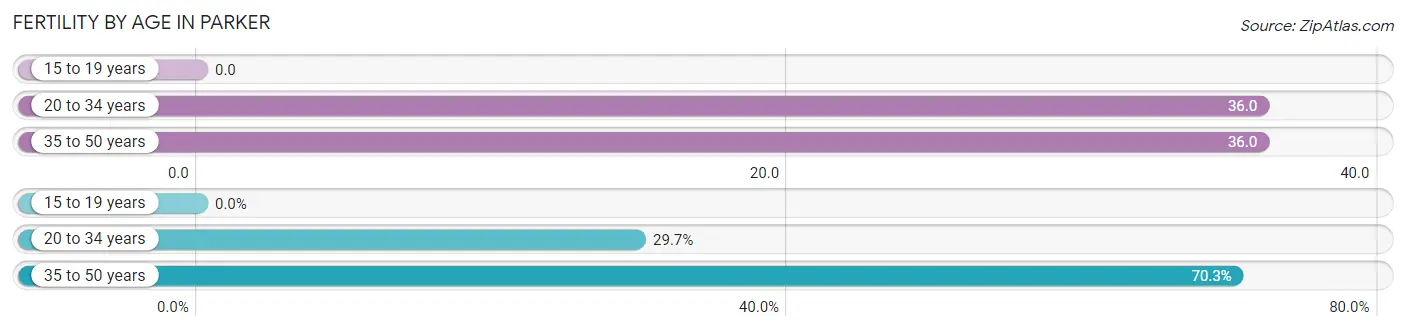
| Age Bracket | Women with Births | Births / 1,000 Women |
| 15 to 19 years | 0 (0.0%) | 0.0 |
| 20 to 34 years | 11 (29.7%) | 36.0 |
| 35 to 50 years | 26 (70.3%) | 36.0 |
| Total | 37 (100.0%) | 32.0 |
Fertility by Age by Marriage Status in Parker
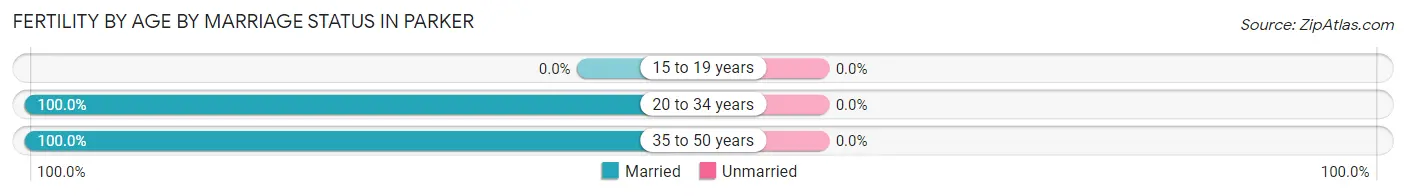
| Age Bracket | Married | Unmarried |
| 15 to 19 years | 0 (0.0%) | 0 (0.0%) |
| 20 to 34 years | 11 (100.0%) | 0 (0.0%) |
| 35 to 50 years | 26 (100.0%) | 0 (0.0%) |
| Total | 37 (100.0%) | 0 (0.0%) |
Fertility by Education in Parker
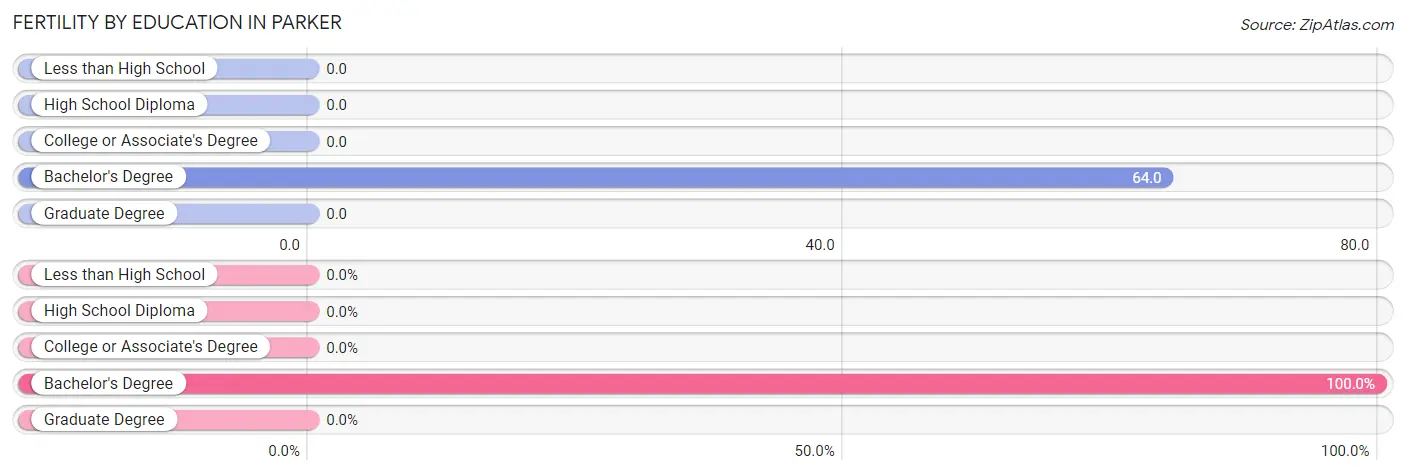
| Educational Attainment | Women with Births | Births / 1,000 Women |
| Less than High School | 0 (0.0%) | 0.0 |
| High School Diploma | 0 (0.0%) | 0.0 |
| College or Associate's Degree | 0 (0.0%) | 0.0 |
| Bachelor's Degree | 37 (100.0%) | 64.0 |
| Graduate Degree | 0 (0.0%) | 0.0 |
| Total | 37 (100.0%) | 32.0 |
Fertility by Education by Marriage Status in Parker
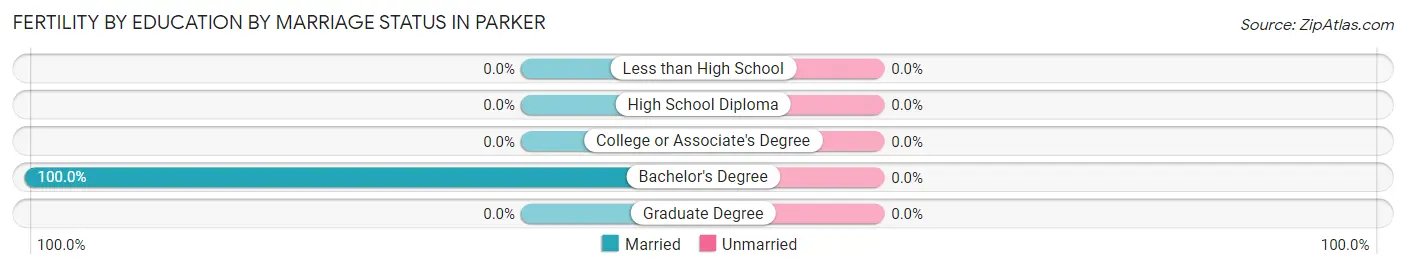
| Educational Attainment | Married | Unmarried |
| Less than High School | 0 (0.0%) | 0 (0.0%) |
| High School Diploma | 0 (0.0%) | 0 (0.0%) |
| College or Associate's Degree | 0 (0.0%) | 0 (0.0%) |
| Bachelor's Degree | 37 (100.0%) | 0 (0.0%) |
| Graduate Degree | 0 (0.0%) | 0 (0.0%) |
| Total | 37 (100.0%) | 0 (0.0%) |
Employment Characteristics in Parker
Employment by Class of Employer in Parker
Among the 2,489 employed individuals in Parker, private company employees (1,910 | 76.7%), local government employees (258 | 10.4%), and self-employed (not incorporated) (112 | 4.5%) make up the most common classes of employment.
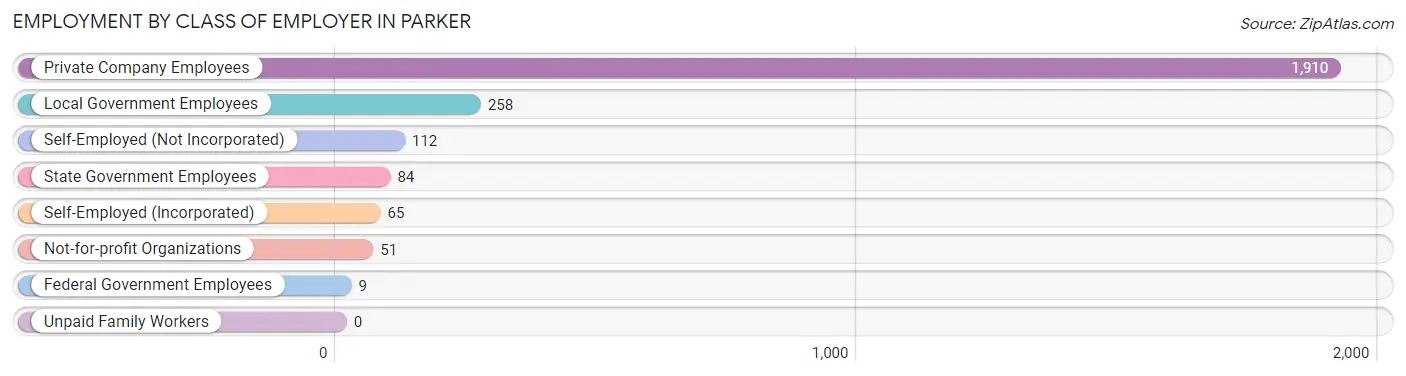
| Employer Class | # Employees | % Employees |
| Private Company Employees | 1,910 | 76.7% |
| Self-Employed (Incorporated) | 65 | 2.6% |
| Self-Employed (Not Incorporated) | 112 | 4.5% |
| Not-for-profit Organizations | 51 | 2.1% |
| Local Government Employees | 258 | 10.4% |
| State Government Employees | 84 | 3.4% |
| Federal Government Employees | 9 | 0.4% |
| Unpaid Family Workers | 0 | 0.0% |
| Total | 2,489 | 100.0% |
Employment Status by Age in Parker
According to the labor force statistics for Parker, out of the total population over 16 years of age (4,422), 58.9% or 2,605 individuals are in the labor force, with 2.3% or 60 of them unemployed. The age group with the highest labor force participation rate is 25 to 29 years, with 100.0% or 90 individuals in the labor force. Within the labor force, the 75 years and over age range has the highest percentage of unemployed individuals, with 100.0% or 16 of them being unemployed.
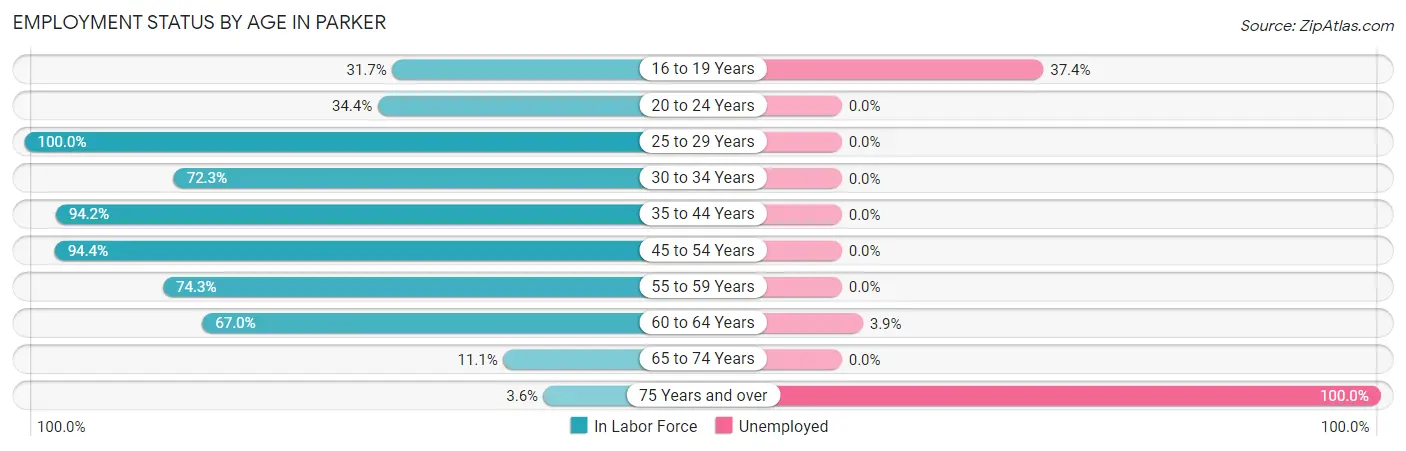
| Age Bracket | In Labor Force | Unemployed |
| 16 to 19 Years | 91 (31.7%) | 34 (37.4%) |
| 20 to 24 Years | 167 (34.4%) | 0 (0.0%) |
| 25 to 29 Years | 90 (100.0%) | 0 (0.0%) |
| 30 to 34 Years | 68 (72.3%) | 0 (0.0%) |
| 35 to 44 Years | 812 (94.2%) | 0 (0.0%) |
| 45 to 54 Years | 757 (94.4%) | 0 (0.0%) |
| 55 to 59 Years | 280 (74.3%) | 0 (0.0%) |
| 60 to 64 Years | 258 (67.0%) | 10 (3.9%) |
| 65 to 74 Years | 66 (11.1%) | 0 (0.0%) |
| 75 Years and over | 16 (3.6%) | 16 (100.0%) |
| Total | 2,605 (58.9%) | 60 (2.3%) |
Employment Status by Educational Attainment in Parker
According to labor force statistics for Parker, 86.8% of individuals (2,265) out of the total population between 25 and 64 years of age (2,610) are in the labor force, with 0.4% or 9 of them being unemployed. The group with the highest labor force participation rate are those with the educational attainment of bachelor's degree or higher, with 90.2% or 1,767 individuals in the labor force. Within the labor force, individuals with bachelor's degree or higher education have the highest percentage of unemployment, with 0.6% or 11 of them being unemployed.
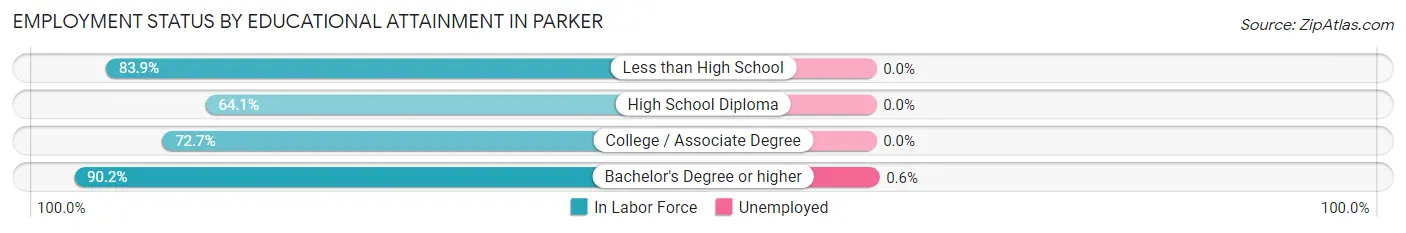
| Educational Attainment | In Labor Force | Unemployed |
| Less than High School | 235 (83.9%) | 0 (0.0%) |
| High School Diploma | 50 (64.1%) | 0 (0.0%) |
| College / Associate Degree | 213 (72.7%) | 0 (0.0%) |
| Bachelor's Degree or higher | 1,767 (90.2%) | 12 (0.6%) |
| Total | 2,265 (86.8%) | 10 (0.4%) |
Employment Occupations by Sex in Parker
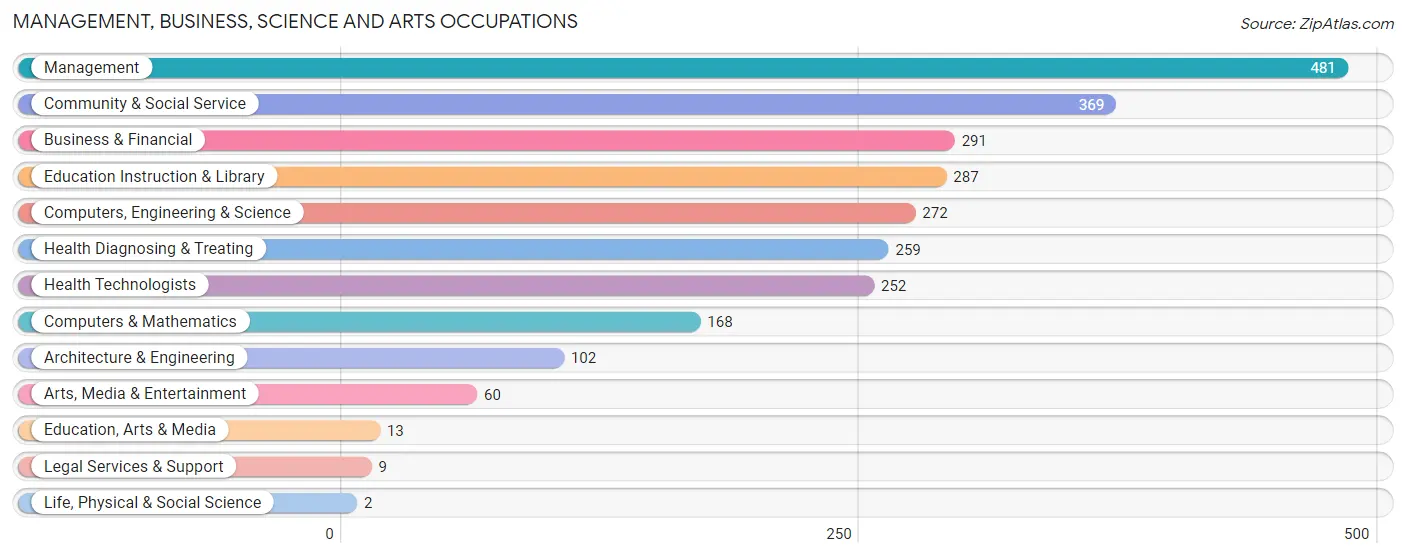
Management, Business, Science and Arts Occupations
The most common Management, Business, Science and Arts occupations in Parker are Management (481 | 18.9%), Community & Social Service (369 | 14.5%), Business & Financial (291 | 11.4%), Education Instruction & Library (287 | 11.3%), and Computers, Engineering & Science (272 | 10.7%).
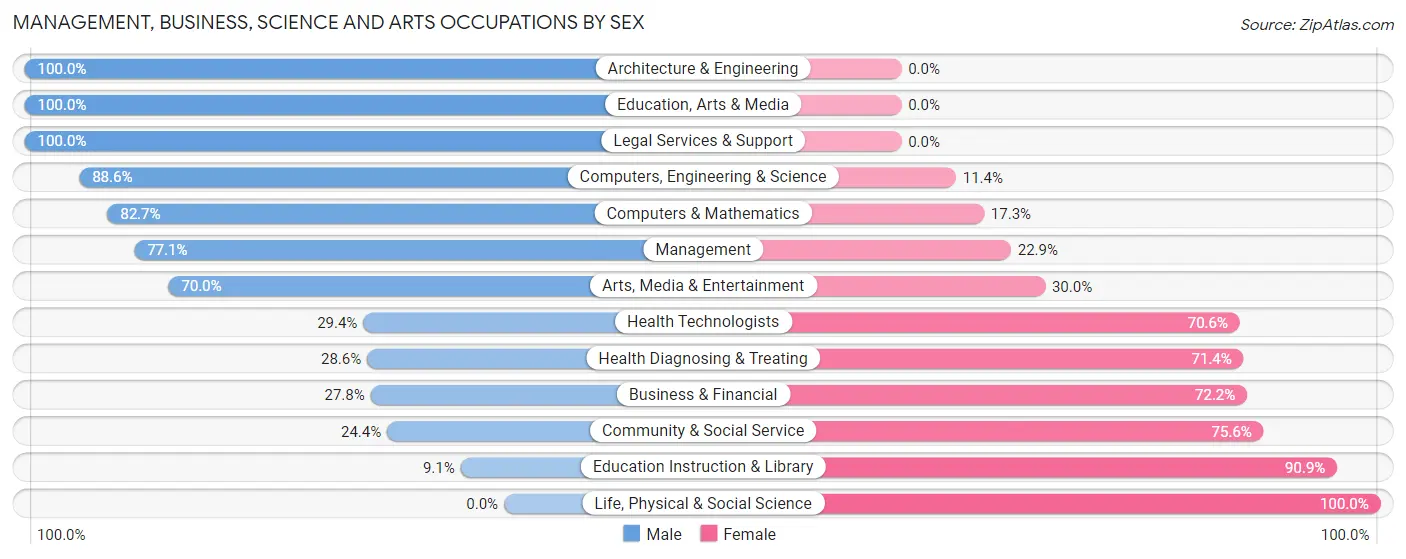
Management, Business, Science and Arts Occupations by Sex
Within the Management, Business, Science and Arts occupations in Parker, the most male-oriented occupations are Architecture & Engineering (100.0%), Education, Arts & Media (100.0%), and Legal Services & Support (100.0%), while the most female-oriented occupations are Life, Physical & Social Science (100.0%), Education Instruction & Library (90.9%), and Community & Social Service (75.6%).
| Occupation | Male | Female |
| Management | 371 (77.1%) | 110 (22.9%) |
| Business & Financial | 81 (27.8%) | 210 (72.2%) |
| Computers, Engineering & Science | 241 (88.6%) | 31 (11.4%) |
| Computers & Mathematics | 139 (82.7%) | 29 (17.3%) |
| Architecture & Engineering | 102 (100.0%) | 0 (0.0%) |
| Life, Physical & Social Science | 0 (0.0%) | 2 (100.0%) |
| Community & Social Service | 90 (24.4%) | 279 (75.6%) |
| Education, Arts & Media | 13 (100.0%) | 0 (0.0%) |
| Legal Services & Support | 9 (100.0%) | 0 (0.0%) |
| Education Instruction & Library | 26 (9.1%) | 261 (90.9%) |
| Arts, Media & Entertainment | 42 (70.0%) | 18 (30.0%) |
| Health Diagnosing & Treating | 74 (28.6%) | 185 (71.4%) |
| Health Technologists | 74 (29.4%) | 178 (70.6%) |
| Total (Category) | 857 (51.3%) | 815 (48.7%) |
| Total (Overall) | 1,421 (55.8%) | 1,124 (44.2%) |
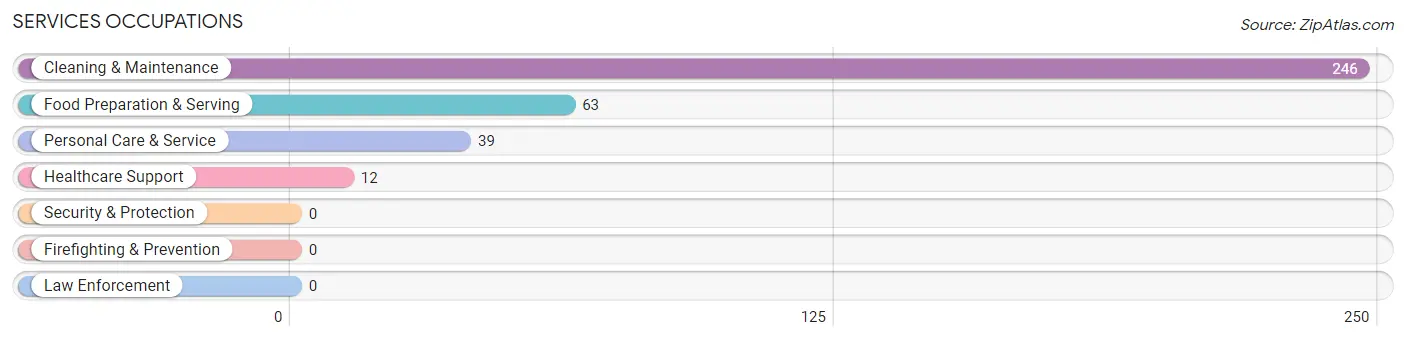
Services Occupations
The most common Services occupations in Parker are Cleaning & Maintenance (246 | 9.7%), Food Preparation & Serving (63 | 2.5%), Personal Care & Service (39 | 1.5%), and Healthcare Support (12 | 0.5%).
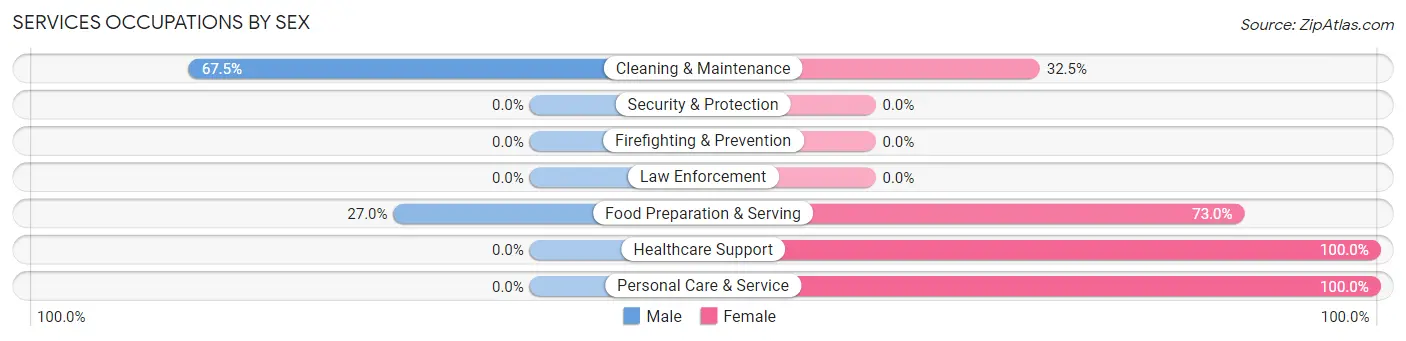
Services Occupations by Sex
Within the Services occupations in Parker, the most male-oriented occupations are Cleaning & Maintenance (67.5%), and Food Preparation & Serving (27.0%), while the most female-oriented occupations are Healthcare Support (100.0%), Personal Care & Service (100.0%), and Food Preparation & Serving (73.0%).
| Occupation | Male | Female |
| Healthcare Support | 0 (0.0%) | 12 (100.0%) |
| Security & Protection | 0 (0.0%) | 0 (0.0%) |
| Firefighting & Prevention | 0 (0.0%) | 0 (0.0%) |
| Law Enforcement | 0 (0.0%) | 0 (0.0%) |
| Food Preparation & Serving | 17 (27.0%) | 46 (73.0%) |
| Cleaning & Maintenance | 166 (67.5%) | 80 (32.5%) |
| Personal Care & Service | 0 (0.0%) | 39 (100.0%) |
| Total (Category) | 183 (50.8%) | 177 (49.2%) |
| Total (Overall) | 1,421 (55.8%) | 1,124 (44.2%) |
Sales and Office Occupations
The most common Sales and Office occupations in Parker are Sales & Related (169 | 6.6%), and Office & Administration (105 | 4.1%).

Sales and Office Occupations by Sex
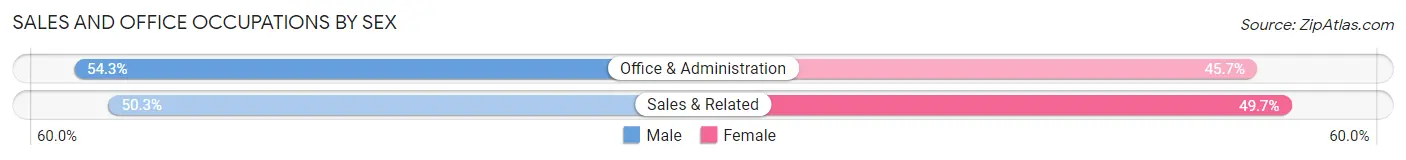
| Occupation | Male | Female |
| Sales & Related | 85 (50.3%) | 84 (49.7%) |
| Office & Administration | 57 (54.3%) | 48 (45.7%) |
| Total (Category) | 142 (51.8%) | 132 (48.2%) |
| Total (Overall) | 1,421 (55.8%) | 1,124 (44.2%) |
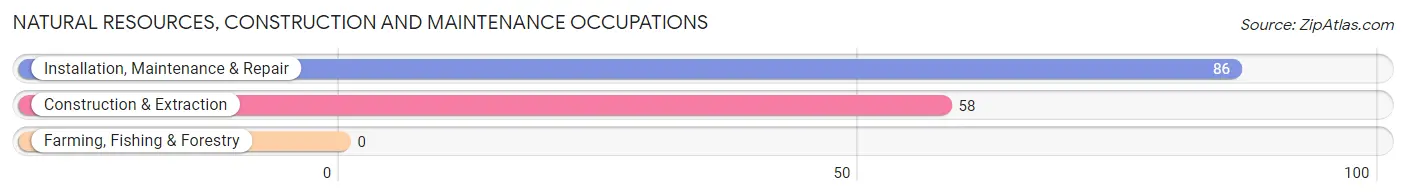
Natural Resources, Construction and Maintenance Occupations
The most common Natural Resources, Construction and Maintenance occupations in Parker are Installation, Maintenance & Repair (86 | 3.4%), and Construction & Extraction (58 | 2.3%).
Natural Resources, Construction and Maintenance Occupations by Sex
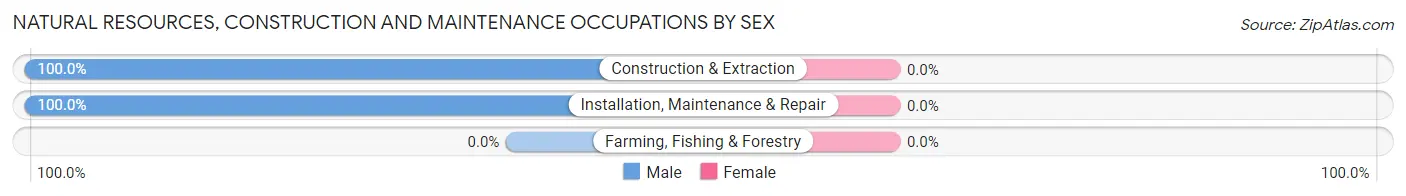
| Occupation | Male | Female |
| Farming, Fishing & Forestry | 0 (0.0%) | 0 (0.0%) |
| Construction & Extraction | 58 (100.0%) | 0 (0.0%) |
| Installation, Maintenance & Repair | 86 (100.0%) | 0 (0.0%) |
| Total (Category) | 144 (100.0%) | 0 (0.0%) |
| Total (Overall) | 1,421 (55.8%) | 1,124 (44.2%) |
Production, Transportation and Moving Occupations
The most common Production, Transportation and Moving occupations in Parker are Production (48 | 1.9%), and Material Moving (47 | 1.8%).
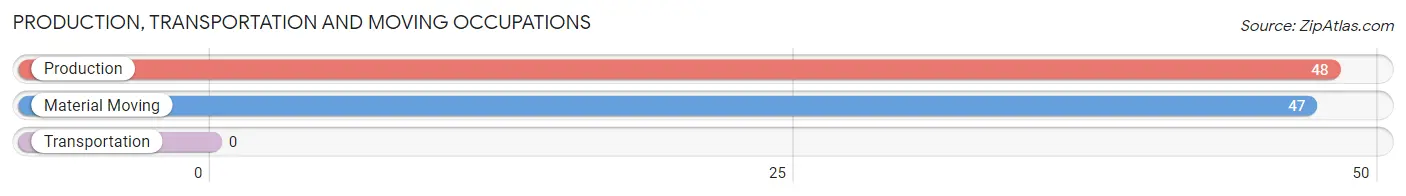
Production, Transportation and Moving Occupations by Sex
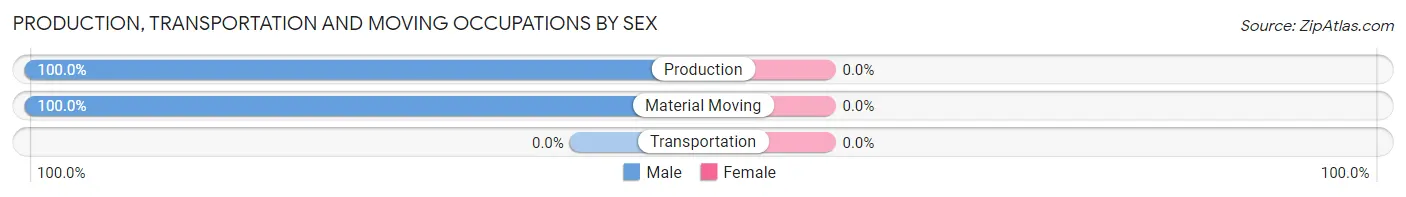
| Occupation | Male | Female |
| Production | 48 (100.0%) | 0 (0.0%) |
| Transportation | 0 (0.0%) | 0 (0.0%) |
| Material Moving | 47 (100.0%) | 0 (0.0%) |
| Total (Category) | 95 (100.0%) | 0 (0.0%) |
| Total (Overall) | 1,421 (55.8%) | 1,124 (44.2%) |
Employment Industries by Sex in Parker
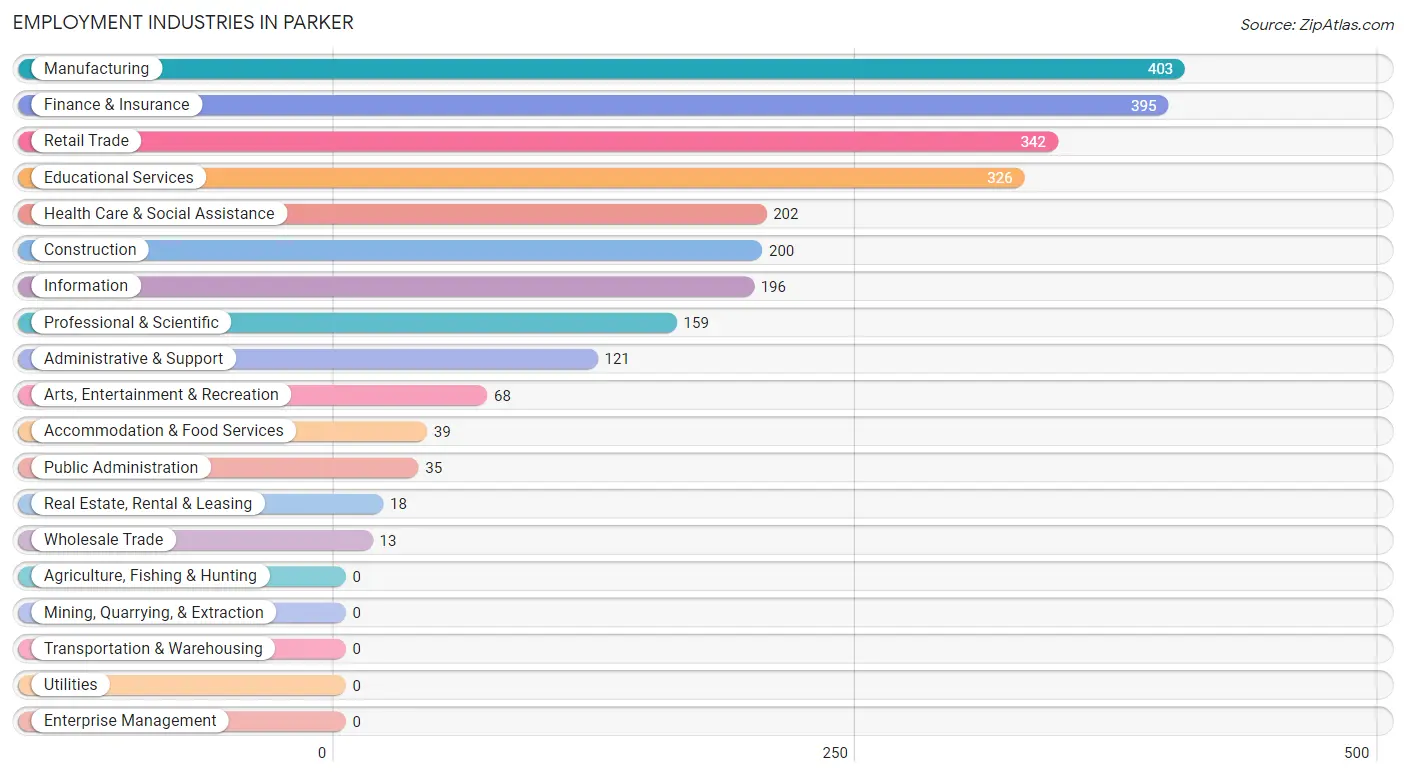
Employment Industries in Parker
The major employment industries in Parker include Manufacturing (403 | 15.8%), Finance & Insurance (395 | 15.5%), Retail Trade (342 | 13.4%), Educational Services (326 | 12.8%), and Health Care & Social Assistance (202 | 7.9%).
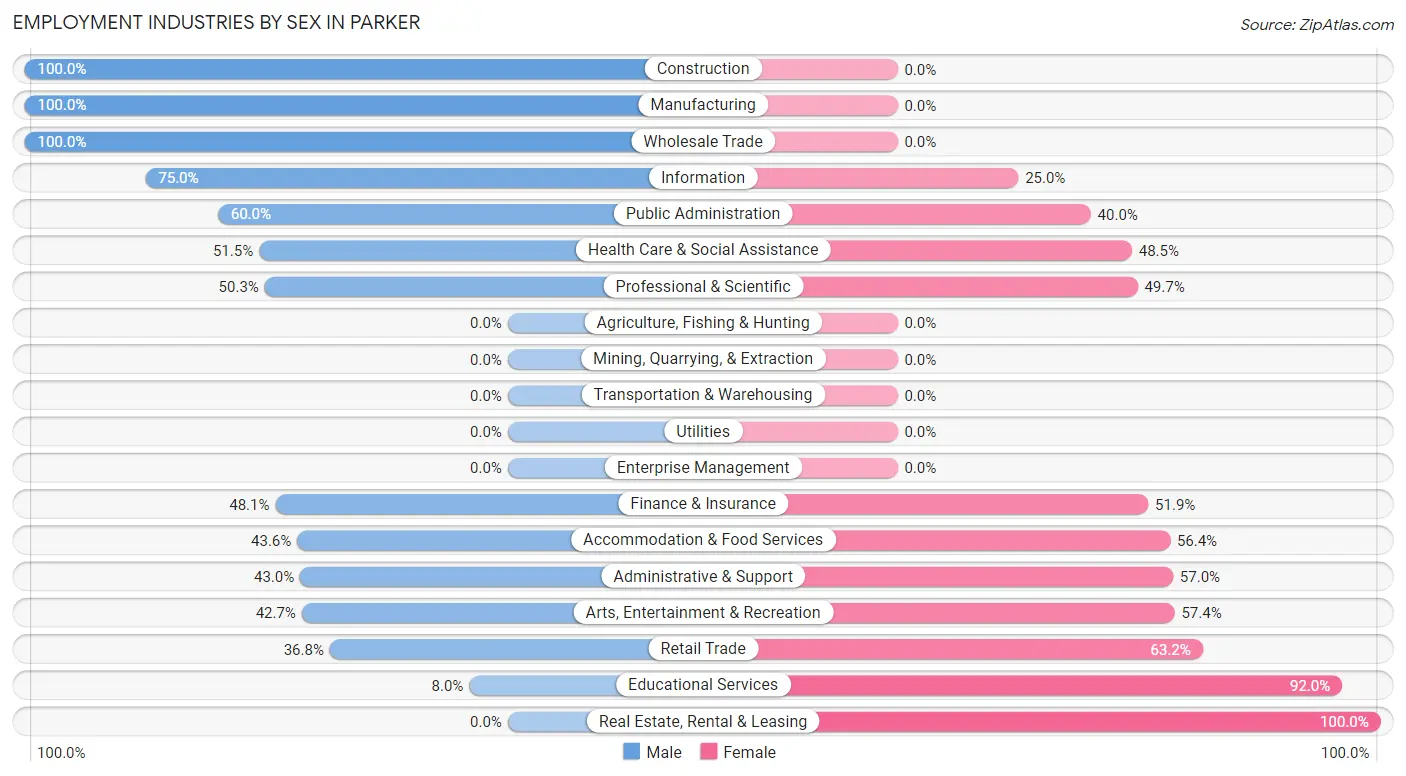
Employment Industries by Sex in Parker
The Parker industries that see more men than women are Construction (100.0%), Manufacturing (100.0%), and Wholesale Trade (100.0%), whereas the industries that tend to have a higher number of women are Real Estate, Rental & Leasing (100.0%), Educational Services (92.0%), and Retail Trade (63.2%).
| Industry | Male | Female |
| Agriculture, Fishing & Hunting | 0 (0.0%) | 0 (0.0%) |
| Mining, Quarrying, & Extraction | 0 (0.0%) | 0 (0.0%) |
| Construction | 200 (100.0%) | 0 (0.0%) |
| Manufacturing | 403 (100.0%) | 0 (0.0%) |
| Wholesale Trade | 13 (100.0%) | 0 (0.0%) |
| Retail Trade | 126 (36.8%) | 216 (63.2%) |
| Transportation & Warehousing | 0 (0.0%) | 0 (0.0%) |
| Utilities | 0 (0.0%) | 0 (0.0%) |
| Information | 147 (75.0%) | 49 (25.0%) |
| Finance & Insurance | 190 (48.1%) | 205 (51.9%) |
| Real Estate, Rental & Leasing | 0 (0.0%) | 18 (100.0%) |
| Professional & Scientific | 80 (50.3%) | 79 (49.7%) |
| Enterprise Management | 0 (0.0%) | 0 (0.0%) |
| Administrative & Support | 52 (43.0%) | 69 (57.0%) |
| Educational Services | 26 (8.0%) | 300 (92.0%) |
| Health Care & Social Assistance | 104 (51.5%) | 98 (48.5%) |
| Arts, Entertainment & Recreation | 29 (42.6%) | 39 (57.4%) |
| Accommodation & Food Services | 17 (43.6%) | 22 (56.4%) |
| Public Administration | 21 (60.0%) | 14 (40.0%) |
| Total | 1,421 (55.8%) | 1,124 (44.2%) |
Education in Parker
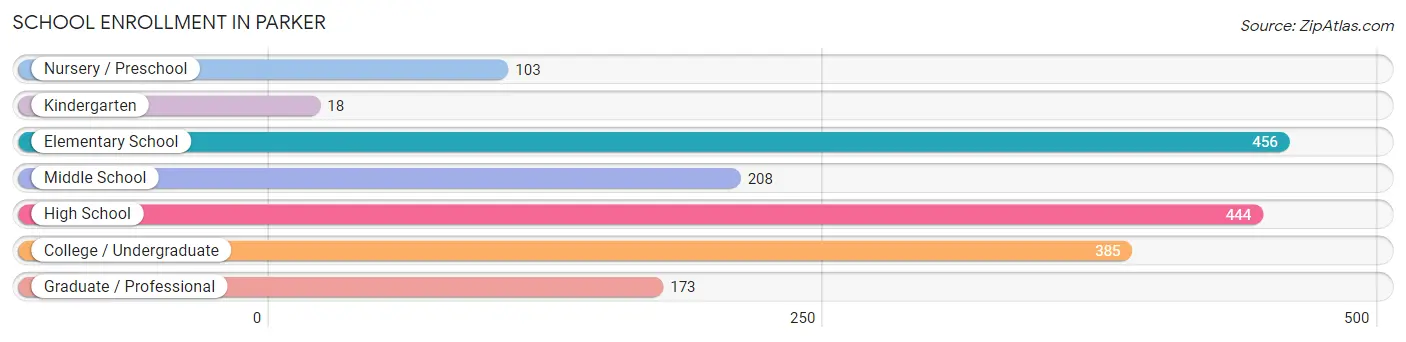
School Enrollment in Parker
The most common levels of schooling among the 1,787 students in Parker are elementary school (456 | 25.5%), high school (444 | 24.8%), and college / undergraduate (385 | 21.5%).
| School Level | # Students | % Students |
| Nursery / Preschool | 103 | 5.8% |
| Kindergarten | 18 | 1.0% |
| Elementary School | 456 | 25.5% |
| Middle School | 208 | 11.6% |
| High School | 444 | 24.8% |
| College / Undergraduate | 385 | 21.5% |
| Graduate / Professional | 173 | 9.7% |
| Total | 1,787 | 100.0% |
School Enrollment by Age by Funding Source in Parker
Out of a total of 1,787 students who are enrolled in schools in Parker, 272 (15.2%) attend a private institution, while the remaining 1,515 (84.8%) are enrolled in public schools. The age group of 3 to 4 year olds has the highest likelihood of being enrolled in private schools, with 78 (100.0% in the age bracket) enrolled. Conversely, the age group of 18 to 19 year olds has the lowest likelihood of being enrolled in a private school, with 129 (100.0% in the age bracket) attending a public institution.
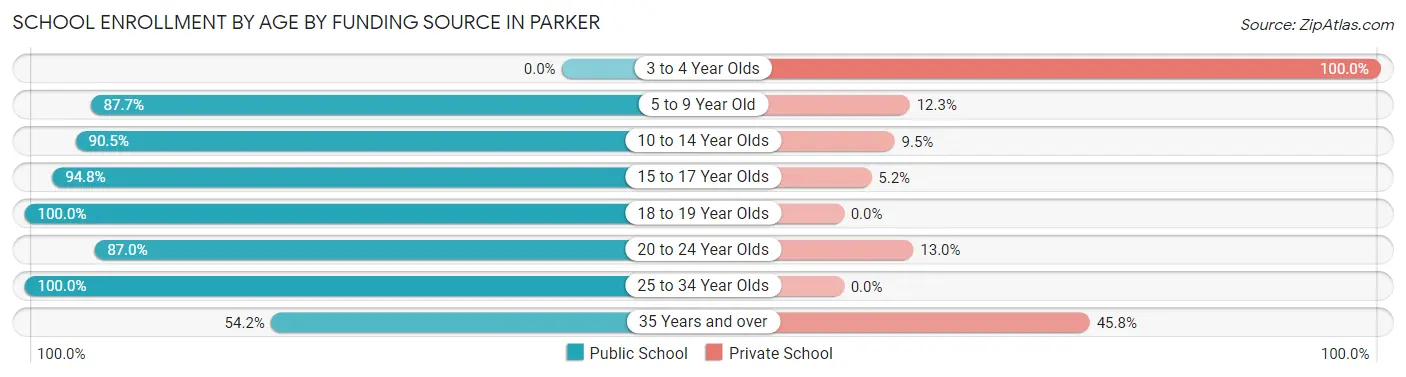
| Age Bracket | Public School | Private School |
| 3 to 4 Year Olds | 0 (0.0%) | 78 (100.0%) |
| 5 to 9 Year Old | 428 (87.7%) | 60 (12.3%) |
| 10 to 14 Year Olds | 229 (90.5%) | 24 (9.5%) |
| 15 to 17 Year Olds | 349 (94.8%) | 19 (5.2%) |
| 18 to 19 Year Olds | 129 (100.0%) | 0 (0.0%) |
| 20 to 24 Year Olds | 315 (87.0%) | 47 (13.0%) |
| 25 to 34 Year Olds | 13 (100.0%) | 0 (0.0%) |
| 35 Years and over | 52 (54.2%) | 44 (45.8%) |
| Total | 1,515 (84.8%) | 272 (15.2%) |
Educational Attainment by Field of Study in Parker
Business (495 | 21.7%), engineering (448 | 19.7%), science & technology (409 | 18.0%), bio, nature & agricultural (166 | 7.3%), and arts & humanities (142 | 6.2%) are the most common fields of study among 2,276 individuals in Parker who have obtained a bachelor's degree or higher.
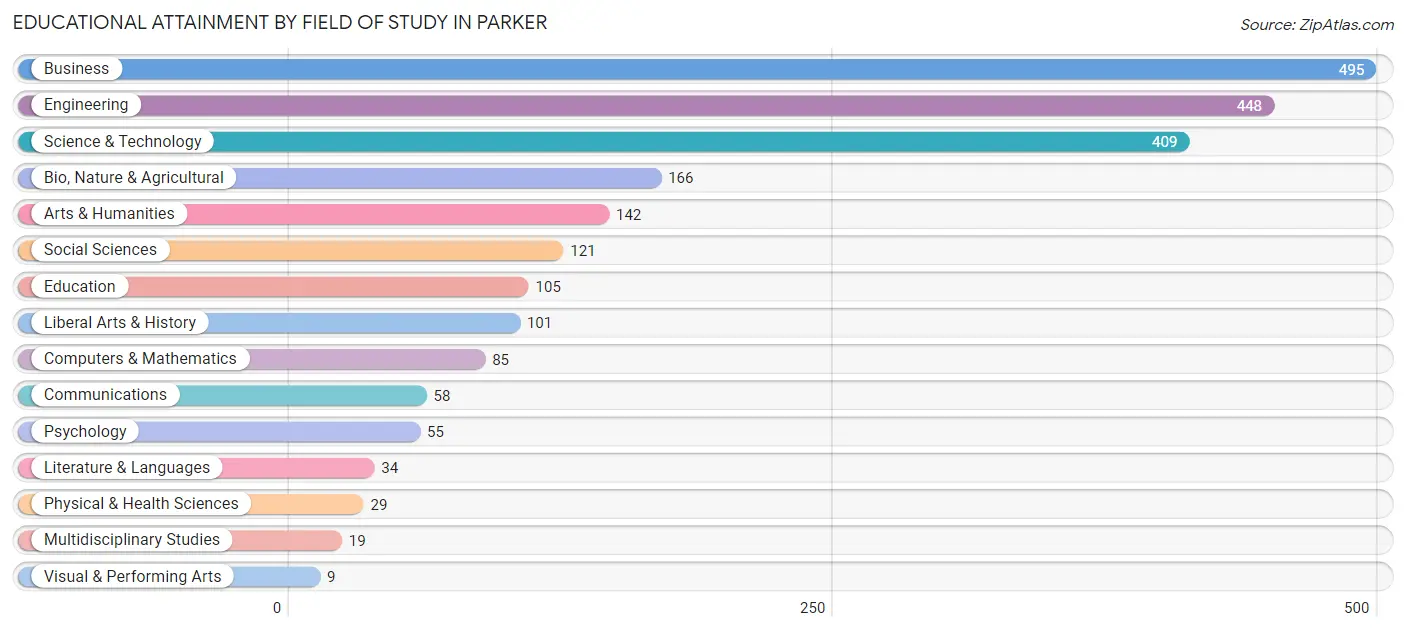
| Field of Study | # Graduates | % Graduates |
| Computers & Mathematics | 85 | 3.7% |
| Bio, Nature & Agricultural | 166 | 7.3% |
| Physical & Health Sciences | 29 | 1.3% |
| Psychology | 55 | 2.4% |
| Social Sciences | 121 | 5.3% |
| Engineering | 448 | 19.7% |
| Multidisciplinary Studies | 19 | 0.8% |
| Science & Technology | 409 | 18.0% |
| Business | 495 | 21.7% |
| Education | 105 | 4.6% |
| Literature & Languages | 34 | 1.5% |
| Liberal Arts & History | 101 | 4.4% |
| Visual & Performing Arts | 9 | 0.4% |
| Communications | 58 | 2.5% |
| Arts & Humanities | 142 | 6.2% |
| Total | 2,276 | 100.0% |
Transportation & Commute in Parker
Vehicle Availability by Sex in Parker
The most prevalent vehicle ownership categories in Parker are males with 3 vehicles (584, accounting for 41.6%) and females with 3 vehicles (390, making up 53.8%).
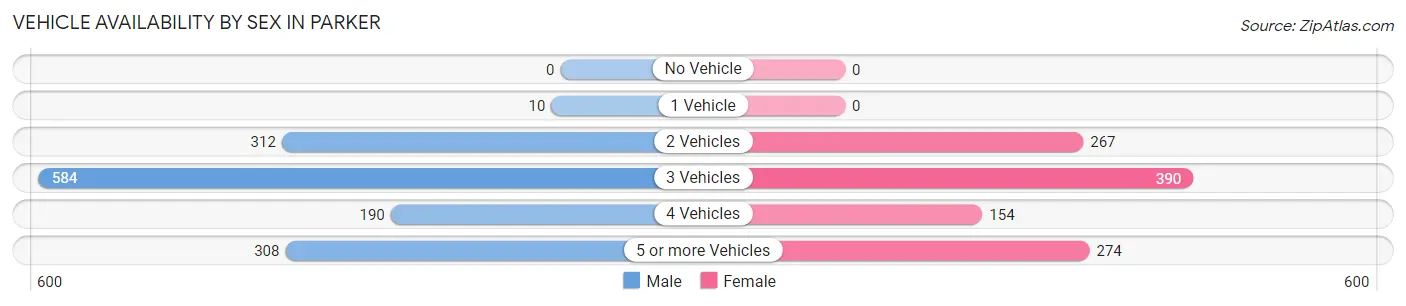
| Vehicles Available | Male | Female |
| No Vehicle | 0 (0.0%) | 0 (0.0%) |
| 1 Vehicle | 10 (0.7%) | 0 (0.0%) |
| 2 Vehicles | 312 (22.2%) | 267 (24.6%) |
| 3 Vehicles | 584 (41.6%) | 390 (35.9%) |
| 4 Vehicles | 190 (13.5%) | 154 (14.2%) |
| 5 or more Vehicles | 308 (21.9%) | 274 (25.3%) |
| Total | 1,404 (100.0%) | 1,085 (100.0%) |
Commute Time in Parker
The most frequently occuring commute durations in Parker are 15 to 19 minutes (270 commuters, 15.6%), 10 to 14 minutes (269 commuters, 15.6%), and 30 to 34 minutes (264 commuters, 15.3%).
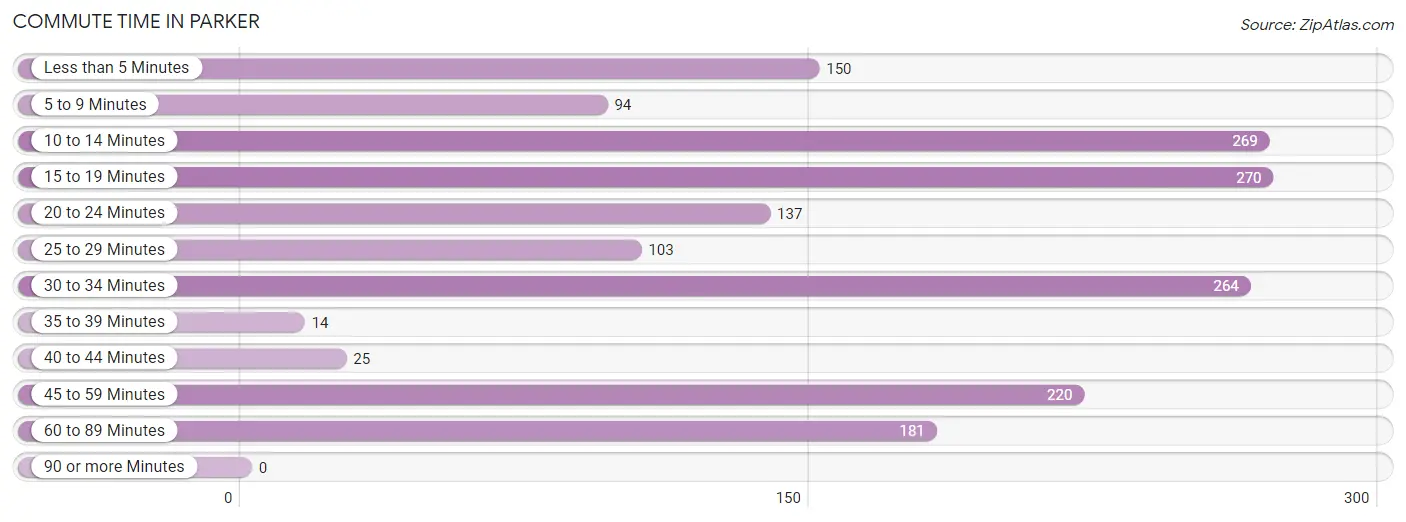
| Commute Time | # Commuters | % Commuters |
| Less than 5 Minutes | 150 | 8.7% |
| 5 to 9 Minutes | 94 | 5.4% |
| 10 to 14 Minutes | 269 | 15.6% |
| 15 to 19 Minutes | 270 | 15.6% |
| 20 to 24 Minutes | 137 | 7.9% |
| 25 to 29 Minutes | 103 | 6.0% |
| 30 to 34 Minutes | 264 | 15.3% |
| 35 to 39 Minutes | 14 | 0.8% |
| 40 to 44 Minutes | 25 | 1.5% |
| 45 to 59 Minutes | 220 | 12.7% |
| 60 to 89 Minutes | 181 | 10.5% |
| 90 or more Minutes | 0 | 0.0% |
Commute Time by Sex in Parker
The most common commute times in Parker are 15 to 19 minutes (177 commuters, 17.1%) for males and 10 to 14 minutes (139 commuters, 20.0%) for females.
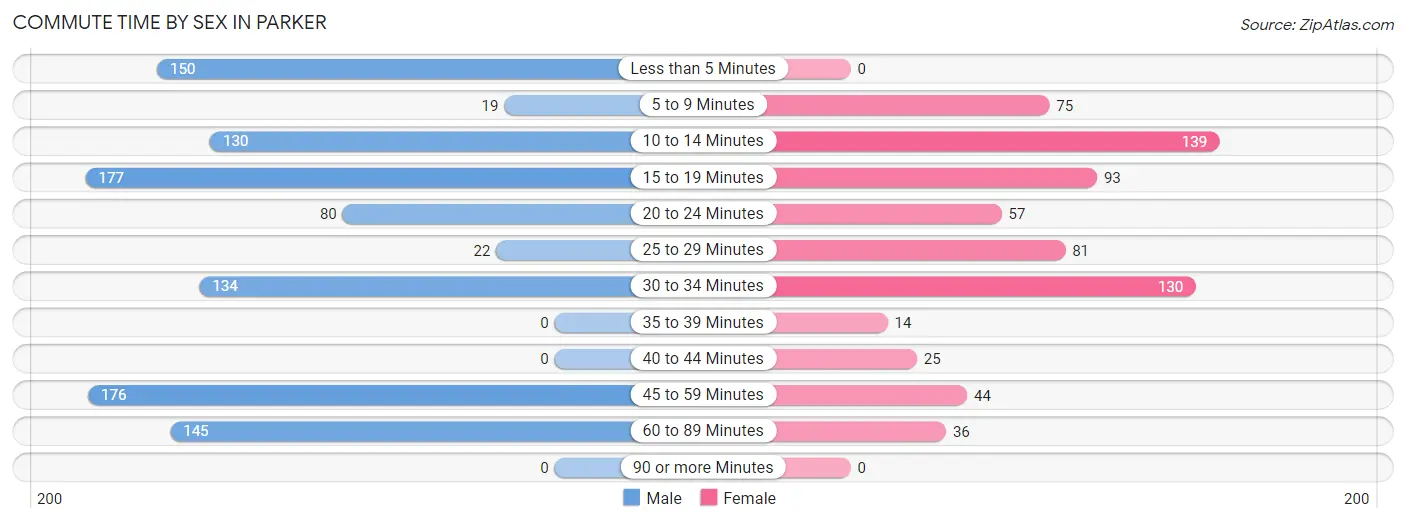
| Commute Time | Male | Female |
| Less than 5 Minutes | 150 (14.5%) | 0 (0.0%) |
| 5 to 9 Minutes | 19 (1.8%) | 75 (10.8%) |
| 10 to 14 Minutes | 130 (12.6%) | 139 (20.0%) |
| 15 to 19 Minutes | 177 (17.1%) | 93 (13.4%) |
| 20 to 24 Minutes | 80 (7.7%) | 57 (8.2%) |
| 25 to 29 Minutes | 22 (2.1%) | 81 (11.7%) |
| 30 to 34 Minutes | 134 (13.0%) | 130 (18.7%) |
| 35 to 39 Minutes | 0 (0.0%) | 14 (2.0%) |
| 40 to 44 Minutes | 0 (0.0%) | 25 (3.6%) |
| 45 to 59 Minutes | 176 (17.0%) | 44 (6.3%) |
| 60 to 89 Minutes | 145 (14.0%) | 36 (5.2%) |
| 90 or more Minutes | 0 (0.0%) | 0 (0.0%) |
Time of Departure to Work by Sex in Parker
The most frequent times of departure to work in Parker are 6:30 AM to 6:59 AM (215, 20.8%) for males and 8:30 AM to 8:59 AM (170, 24.5%) for females.
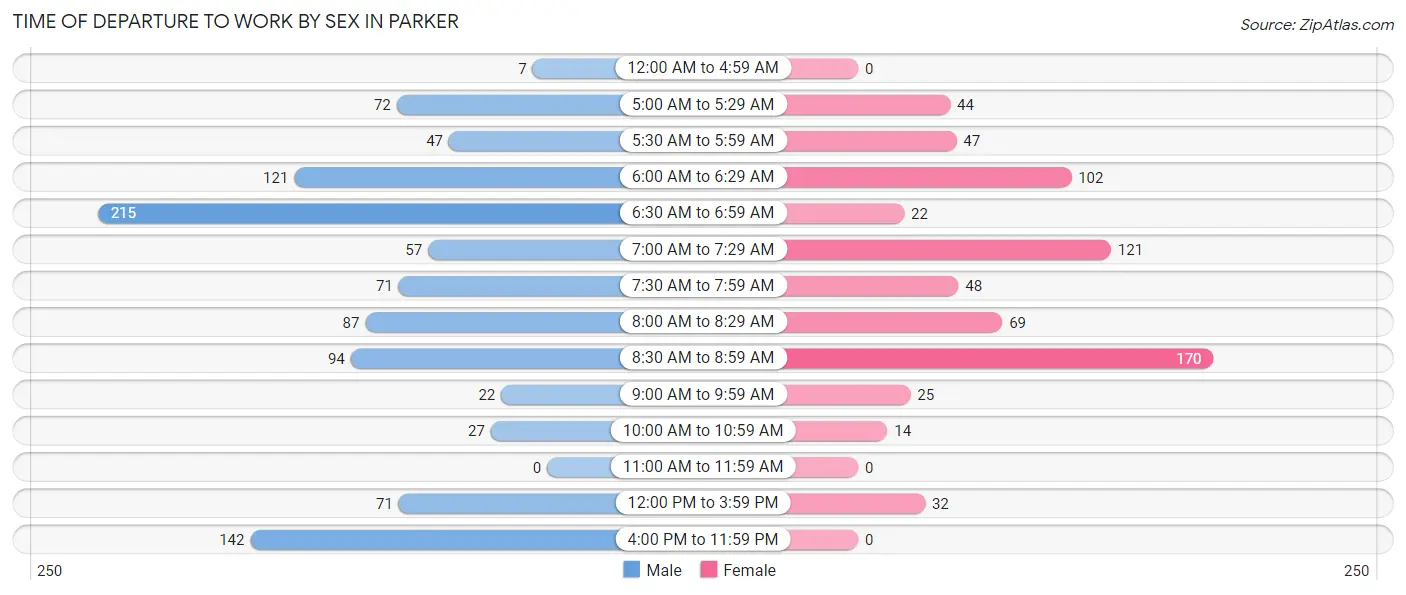
| Time of Departure | Male | Female |
| 12:00 AM to 4:59 AM | 7 (0.7%) | 0 (0.0%) |
| 5:00 AM to 5:29 AM | 72 (7.0%) | 44 (6.3%) |
| 5:30 AM to 5:59 AM | 47 (4.5%) | 47 (6.8%) |
| 6:00 AM to 6:29 AM | 121 (11.7%) | 102 (14.7%) |
| 6:30 AM to 6:59 AM | 215 (20.8%) | 22 (3.2%) |
| 7:00 AM to 7:29 AM | 57 (5.5%) | 121 (17.4%) |
| 7:30 AM to 7:59 AM | 71 (6.9%) | 48 (6.9%) |
| 8:00 AM to 8:29 AM | 87 (8.4%) | 69 (9.9%) |
| 8:30 AM to 8:59 AM | 94 (9.1%) | 170 (24.5%) |
| 9:00 AM to 9:59 AM | 22 (2.1%) | 25 (3.6%) |
| 10:00 AM to 10:59 AM | 27 (2.6%) | 14 (2.0%) |
| 11:00 AM to 11:59 AM | 0 (0.0%) | 0 (0.0%) |
| 12:00 PM to 3:59 PM | 71 (6.9%) | 32 (4.6%) |
| 4:00 PM to 11:59 PM | 142 (13.8%) | 0 (0.0%) |
| Total | 1,033 (100.0%) | 694 (100.0%) |
Housing Occupancy in Parker
Occupancy by Ownership in Parker
Of the total 1,422 dwellings in Parker, owner-occupied units account for 1,400 (98.5%), while renter-occupied units make up 22 (1.5%).
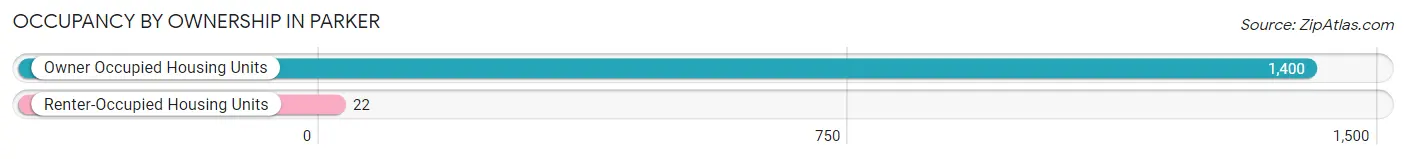
| Occupancy | # Housing Units | % Housing Units |
| Owner Occupied Housing Units | 1,400 | 98.5% |
| Renter-Occupied Housing Units | 22 | 1.5% |
| Total Occupied Housing Units | 1,422 | 100.0% |
Occupancy by Household Size in Parker
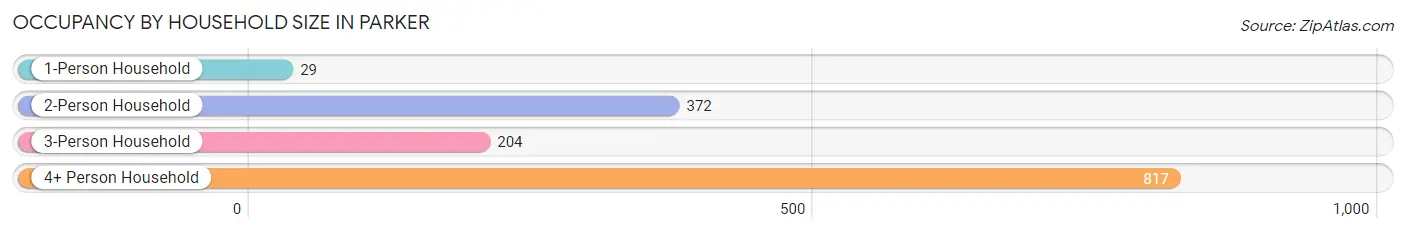
| Household Size | # Housing Units | % Housing Units |
| 1-Person Household | 29 | 2.0% |
| 2-Person Household | 372 | 26.2% |
| 3-Person Household | 204 | 14.3% |
| 4+ Person Household | 817 | 57.5% |
| Total Housing Units | 1,422 | 100.0% |
Occupancy by Ownership by Household Size in Parker
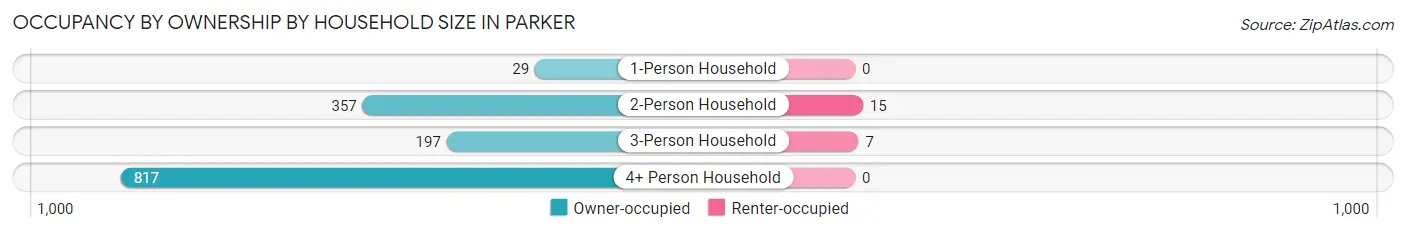
| Household Size | Owner-occupied | Renter-occupied |
| 1-Person Household | 29 (100.0%) | 0 (0.0%) |
| 2-Person Household | 357 (96.0%) | 15 (4.0%) |
| 3-Person Household | 197 (96.6%) | 7 (3.4%) |
| 4+ Person Household | 817 (100.0%) | 0 (0.0%) |
| Total Housing Units | 1,400 (98.5%) | 22 (1.5%) |
Occupancy by Educational Attainment in Parker
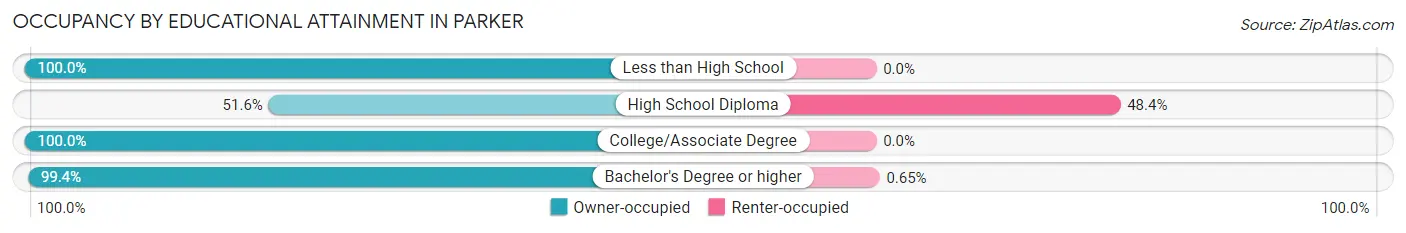
| Household Size | Owner-occupied | Renter-occupied |
| Less than High School | 131 (100.0%) | 0 (0.0%) |
| High School Diploma | 16 (51.6%) | 15 (48.4%) |
| College/Associate Degree | 187 (100.0%) | 0 (0.0%) |
| Bachelor's Degree or higher | 1,066 (99.4%) | 7 (0.6%) |
Occupancy by Age of Householder in Parker
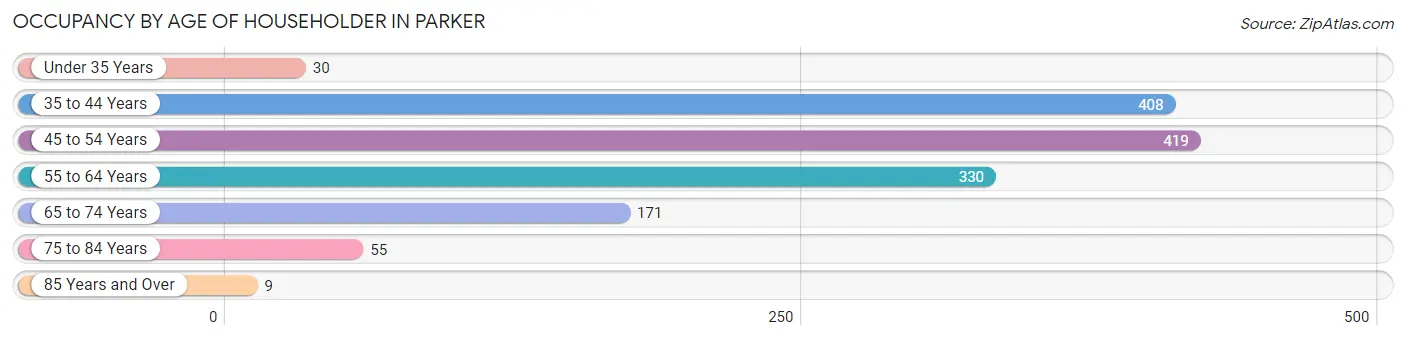
| Age Bracket | # Households | % Households |
| Under 35 Years | 30 | 2.1% |
| 35 to 44 Years | 408 | 28.7% |
| 45 to 54 Years | 419 | 29.5% |
| 55 to 64 Years | 330 | 23.2% |
| 65 to 74 Years | 171 | 12.0% |
| 75 to 84 Years | 55 | 3.9% |
| 85 Years and Over | 9 | 0.6% |
| Total | 1,422 | 100.0% |
Housing Finances in Parker
Median Income by Occupancy in Parker
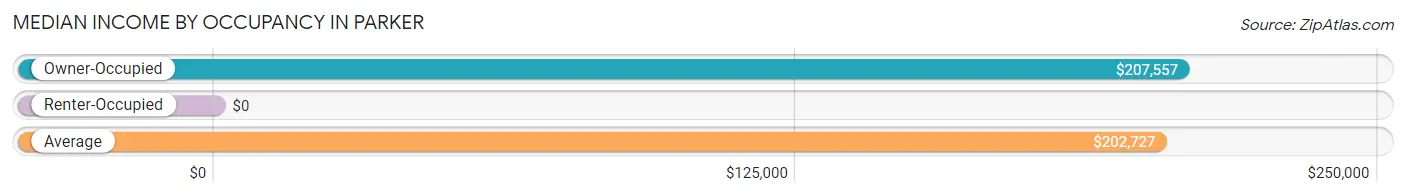
| Occupancy Type | # Households | Median Income |
| Owner-Occupied | 1,400 (98.5%) | $207,557 |
| Renter-Occupied | 22 (1.5%) | $0 |
| Average | 1,422 (100.0%) | $202,727 |
Occupancy by Householder Income Bracket in Parker
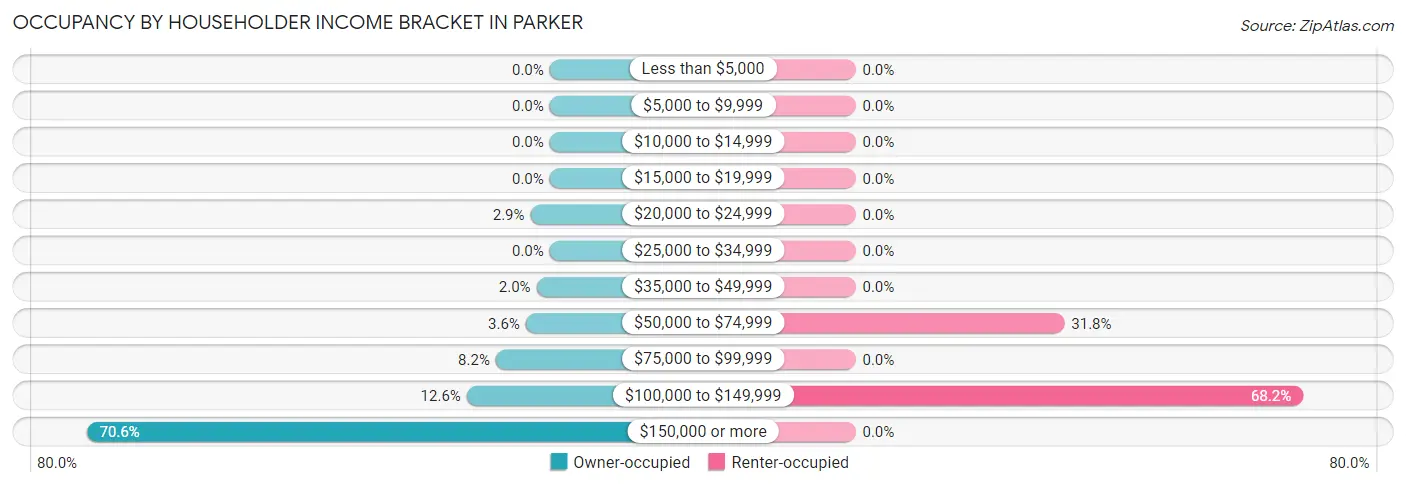
| Income Bracket | Owner-occupied | Renter-occupied |
| Less than $5,000 | 0 (0.0%) | 0 (0.0%) |
| $5,000 to $9,999 | 0 (0.0%) | 0 (0.0%) |
| $10,000 to $14,999 | 0 (0.0%) | 0 (0.0%) |
| $15,000 to $19,999 | 0 (0.0%) | 0 (0.0%) |
| $20,000 to $24,999 | 41 (2.9%) | 0 (0.0%) |
| $25,000 to $34,999 | 0 (0.0%) | 0 (0.0%) |
| $35,000 to $49,999 | 28 (2.0%) | 0 (0.0%) |
| $50,000 to $74,999 | 51 (3.6%) | 7 (31.8%) |
| $75,000 to $99,999 | 115 (8.2%) | 0 (0.0%) |
| $100,000 to $149,999 | 177 (12.6%) | 15 (68.2%) |
| $150,000 or more | 988 (70.6%) | 0 (0.0%) |
| Total | 1,400 (100.0%) | 22 (100.0%) |
Monthly Housing Cost Tiers in Parker
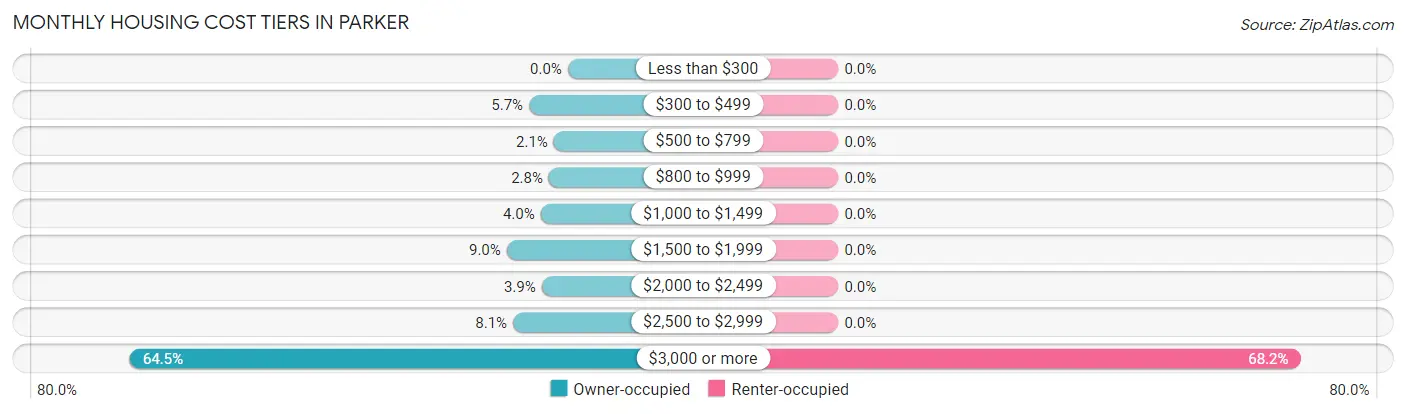
| Monthly Cost | Owner-occupied | Renter-occupied |
| Less than $300 | 0 (0.0%) | 0 (0.0%) |
| $300 to $499 | 80 (5.7%) | 0 (0.0%) |
| $500 to $799 | 29 (2.1%) | 0 (0.0%) |
| $800 to $999 | 39 (2.8%) | 0 (0.0%) |
| $1,000 to $1,499 | 56 (4.0%) | 0 (0.0%) |
| $1,500 to $1,999 | 126 (9.0%) | 0 (0.0%) |
| $2,000 to $2,499 | 54 (3.9%) | 0 (0.0%) |
| $2,500 to $2,999 | 113 (8.1%) | 0 (0.0%) |
| $3,000 or more | 903 (64.5%) | 15 (68.2%) |
| Total | 1,400 (100.0%) | 22 (100.0%) |
Physical Housing Characteristics in Parker
Housing Structures in Parker
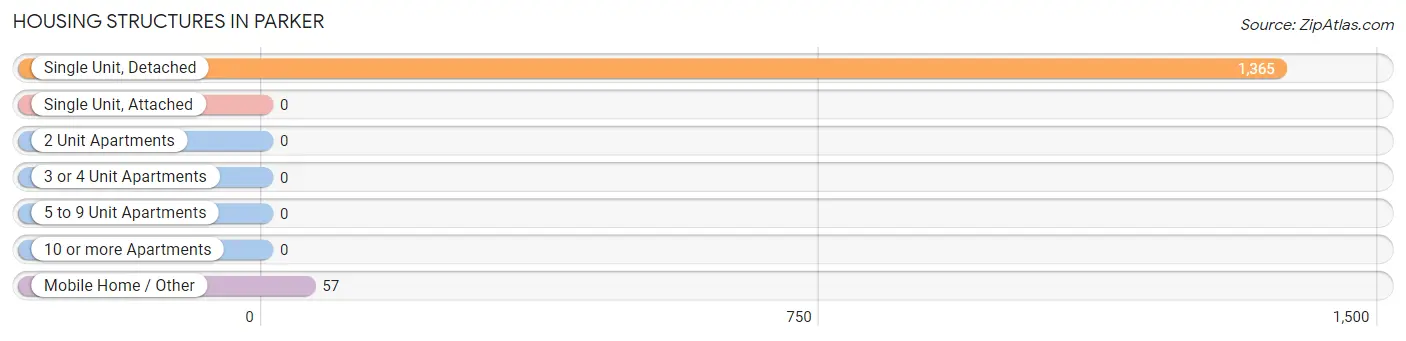
| Structure Type | # Housing Units | % Housing Units |
| Single Unit, Detached | 1,365 | 96.0% |
| Single Unit, Attached | 0 | 0.0% |
| 2 Unit Apartments | 0 | 0.0% |
| 3 or 4 Unit Apartments | 0 | 0.0% |
| 5 to 9 Unit Apartments | 0 | 0.0% |
| 10 or more Apartments | 0 | 0.0% |
| Mobile Home / Other | 57 | 4.0% |
| Total | 1,422 | 100.0% |
Housing Structures by Occupancy in Parker
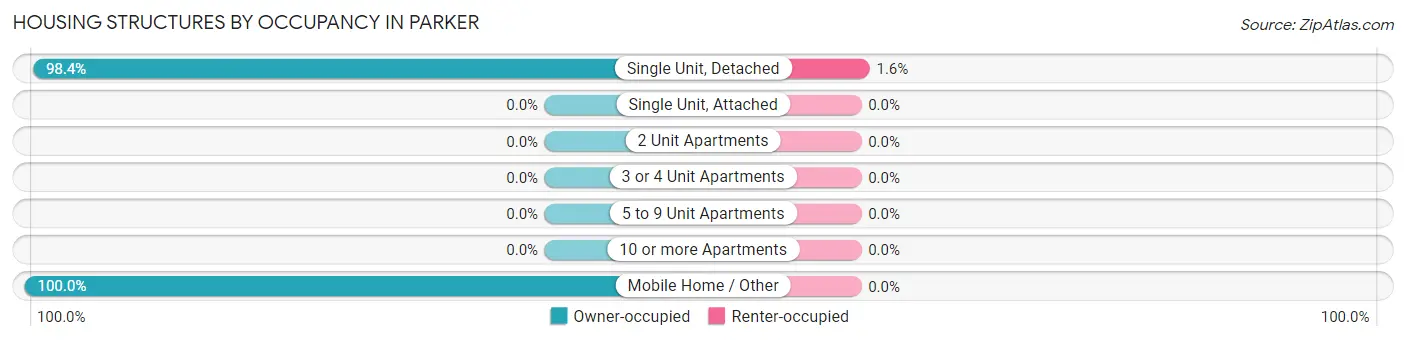
| Structure Type | Owner-occupied | Renter-occupied |
| Single Unit, Detached | 1,343 (98.4%) | 22 (1.6%) |
| Single Unit, Attached | 0 (0.0%) | 0 (0.0%) |
| 2 Unit Apartments | 0 (0.0%) | 0 (0.0%) |
| 3 or 4 Unit Apartments | 0 (0.0%) | 0 (0.0%) |
| 5 to 9 Unit Apartments | 0 (0.0%) | 0 (0.0%) |
| 10 or more Apartments | 0 (0.0%) | 0 (0.0%) |
| Mobile Home / Other | 57 (100.0%) | 0 (0.0%) |
| Total | 1,400 (98.5%) | 22 (1.5%) |
Housing Structures by Number of Rooms in Parker
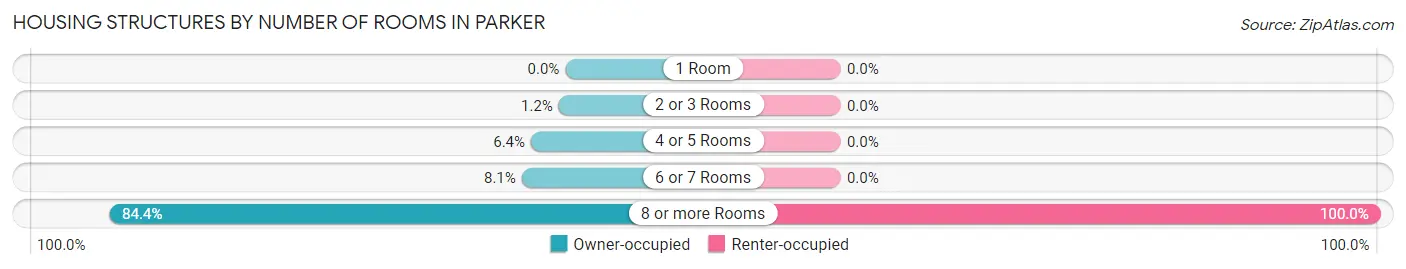
| Number of Rooms | Owner-occupied | Renter-occupied |
| 1 Room | 0 (0.0%) | 0 (0.0%) |
| 2 or 3 Rooms | 17 (1.2%) | 0 (0.0%) |
| 4 or 5 Rooms | 89 (6.4%) | 0 (0.0%) |
| 6 or 7 Rooms | 113 (8.1%) | 0 (0.0%) |
| 8 or more Rooms | 1,181 (84.4%) | 22 (100.0%) |
| Total | 1,400 (100.0%) | 22 (100.0%) |
Housing Structure by Heating Type in Parker
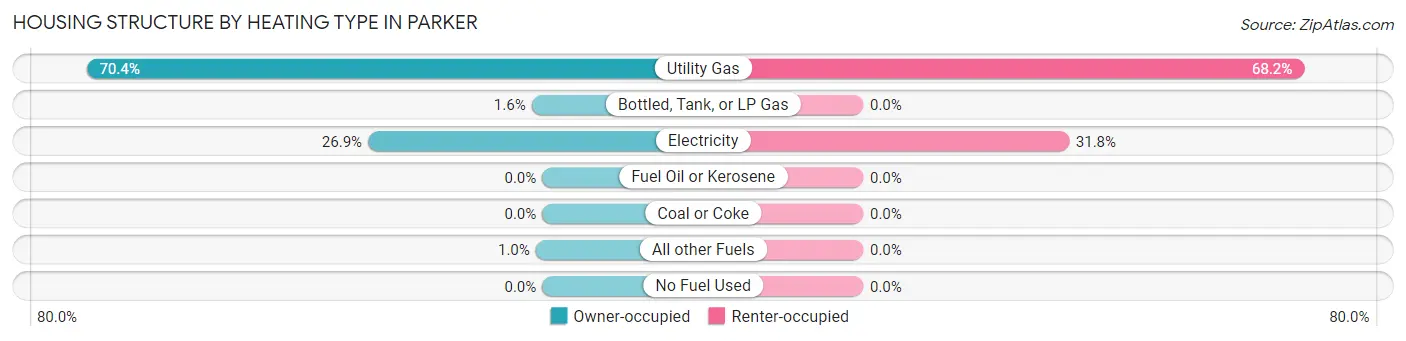
| Heating Type | Owner-occupied | Renter-occupied |
| Utility Gas | 986 (70.4%) | 15 (68.2%) |
| Bottled, Tank, or LP Gas | 23 (1.6%) | 0 (0.0%) |
| Electricity | 377 (26.9%) | 7 (31.8%) |
| Fuel Oil or Kerosene | 0 (0.0%) | 0 (0.0%) |
| Coal or Coke | 0 (0.0%) | 0 (0.0%) |
| All other Fuels | 14 (1.0%) | 0 (0.0%) |
| No Fuel Used | 0 (0.0%) | 0 (0.0%) |
| Total | 1,400 (100.0%) | 22 (100.0%) |
Household Vehicle Usage in Parker
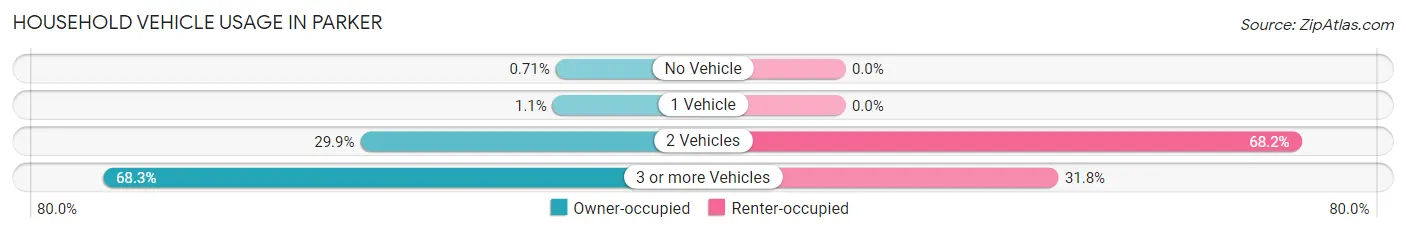
| Vehicles per Household | Owner-occupied | Renter-occupied |
| No Vehicle | 10 (0.7%) | 0 (0.0%) |
| 1 Vehicle | 16 (1.1%) | 0 (0.0%) |
| 2 Vehicles | 418 (29.9%) | 15 (68.2%) |
| 3 or more Vehicles | 956 (68.3%) | 7 (31.8%) |
| Total | 1,400 (100.0%) | 22 (100.0%) |
Real Estate & Mortgages in Parker
Real Estate and Mortgage Overview in Parker
| Characteristic | Without Mortgage | With Mortgage |
| Housing Units | 424 | 976 |
| Median Property Value | $685,800 | $817,300 |
| Median Household Income | $134,219 | $798 |
| Monthly Housing Costs | $1,501 | $868 |
| Real Estate Taxes | $10,001 | $0 |
Property Value by Mortgage Status in Parker
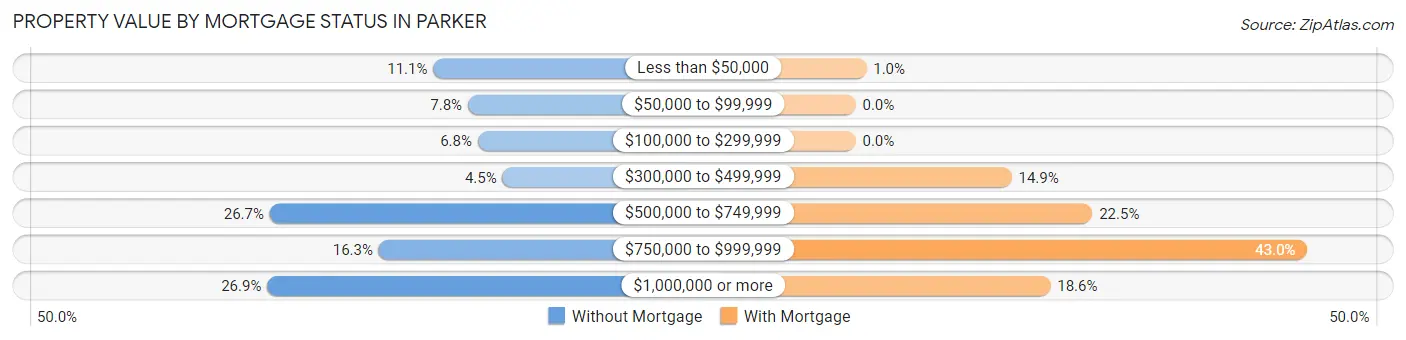
| Property Value | Without Mortgage | With Mortgage |
| Less than $50,000 | 47 (11.1%) | 10 (1.0%) |
| $50,000 to $99,999 | 33 (7.8%) | 0 (0.0%) |
| $100,000 to $299,999 | 29 (6.8%) | 0 (0.0%) |
| $300,000 to $499,999 | 19 (4.5%) | 145 (14.9%) |
| $500,000 to $749,999 | 113 (26.7%) | 220 (22.5%) |
| $750,000 to $999,999 | 69 (16.3%) | 420 (43.0%) |
| $1,000,000 or more | 114 (26.9%) | 181 (18.5%) |
| Total | 424 (100.0%) | 976 (100.0%) |
Household Income by Mortgage Status in Parker
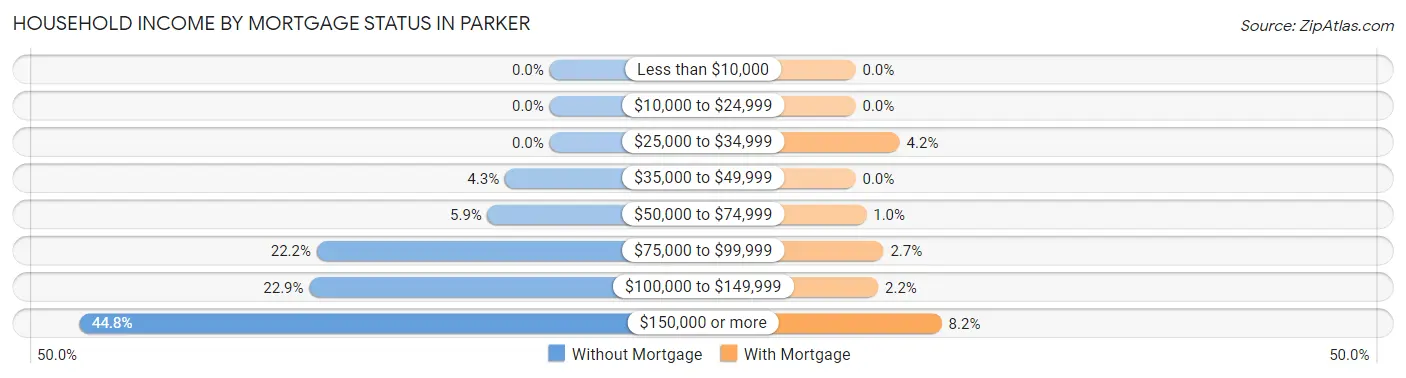
| Household Income | Without Mortgage | With Mortgage |
| Less than $10,000 | 0 (0.0%) | 0 (0.0%) |
| $10,000 to $24,999 | 0 (0.0%) | 0 (0.0%) |
| $25,000 to $34,999 | 0 (0.0%) | 41 (4.2%) |
| $35,000 to $49,999 | 18 (4.3%) | 0 (0.0%) |
| $50,000 to $74,999 | 25 (5.9%) | 10 (1.0%) |
| $75,000 to $99,999 | 94 (22.2%) | 26 (2.7%) |
| $100,000 to $149,999 | 97 (22.9%) | 21 (2.1%) |
| $150,000 or more | 190 (44.8%) | 80 (8.2%) |
| Total | 424 (100.0%) | 976 (100.0%) |
Property Value to Household Income Ratio in Parker
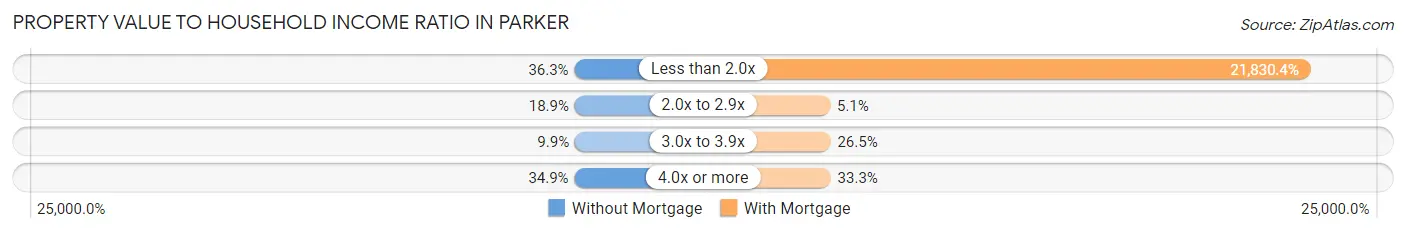
| Value-to-Income Ratio | Without Mortgage | With Mortgage |
| Less than 2.0x | 154 (36.3%) | 213,065 (21,830.4%) |
| 2.0x to 2.9x | 80 (18.9%) | 50 (5.1%) |
| 3.0x to 3.9x | 42 (9.9%) | 259 (26.5%) |
| 4.0x or more | 148 (34.9%) | 325 (33.3%) |
| Total | 424 (100.0%) | 976 (100.0%) |
Real Estate Taxes by Mortgage Status in Parker
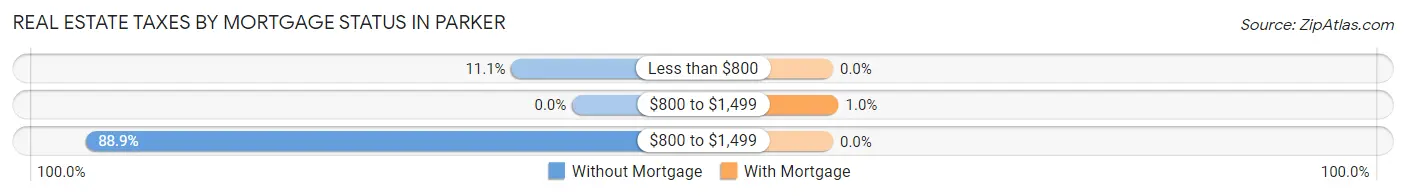
| Property Taxes | Without Mortgage | With Mortgage |
| Less than $800 | 47 (11.1%) | 0 (0.0%) |
| $800 to $1,499 | 0 (0.0%) | 10 (1.0%) |
| $800 to $1,499 | 377 (88.9%) | 0 (0.0%) |
| Total | 424 (100.0%) | 976 (100.0%) |
Health & Disability in Parker
Health Insurance Coverage by Age in Parker
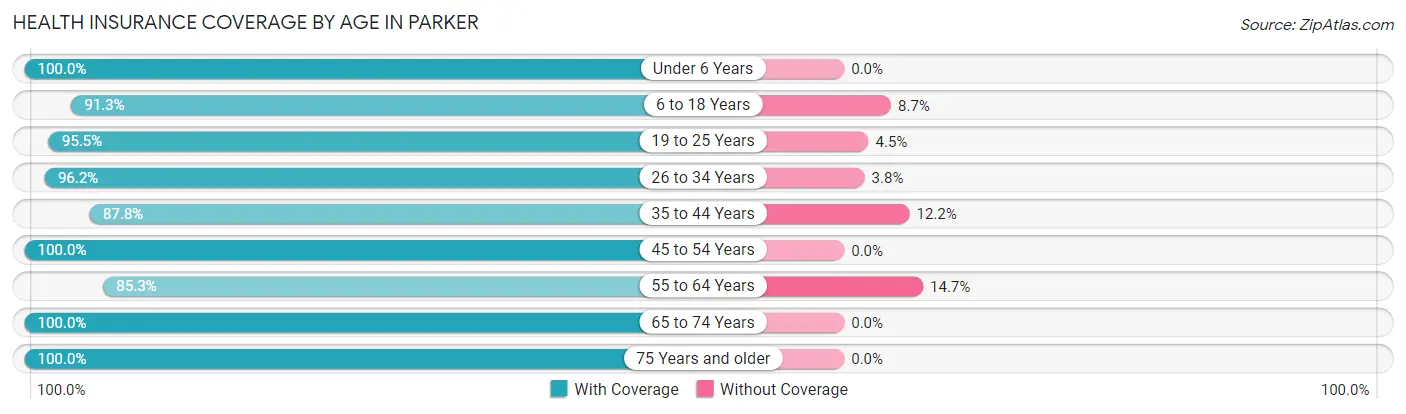
| Age Bracket | With Coverage | Without Coverage |
| Under 6 Years | 179 (100.0%) | 0 (0.0%) |
| 6 to 18 Years | 1,088 (91.3%) | 104 (8.7%) |
| 19 to 25 Years | 527 (95.5%) | 25 (4.5%) |
| 26 to 34 Years | 177 (96.2%) | 7 (3.8%) |
| 35 to 44 Years | 757 (87.8%) | 105 (12.2%) |
| 45 to 54 Years | 802 (100.0%) | 0 (0.0%) |
| 55 to 64 Years | 650 (85.3%) | 112 (14.7%) |
| 65 to 74 Years | 595 (100.0%) | 0 (0.0%) |
| 75 Years and older | 445 (100.0%) | 0 (0.0%) |
| Total | 5,220 (93.7%) | 353 (6.3%) |
Health Insurance Coverage by Citizenship Status in Parker
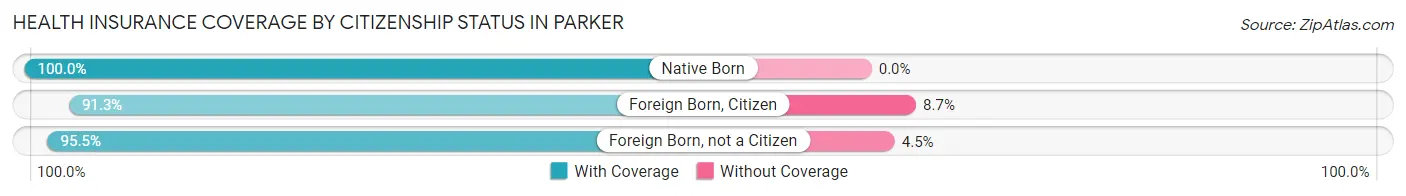
| Citizenship Status | With Coverage | Without Coverage |
| Native Born | 179 (100.0%) | 0 (0.0%) |
| Foreign Born, Citizen | 1,088 (91.3%) | 104 (8.7%) |
| Foreign Born, not a Citizen | 527 (95.5%) | 25 (4.5%) |
Health Insurance Coverage by Household Income in Parker
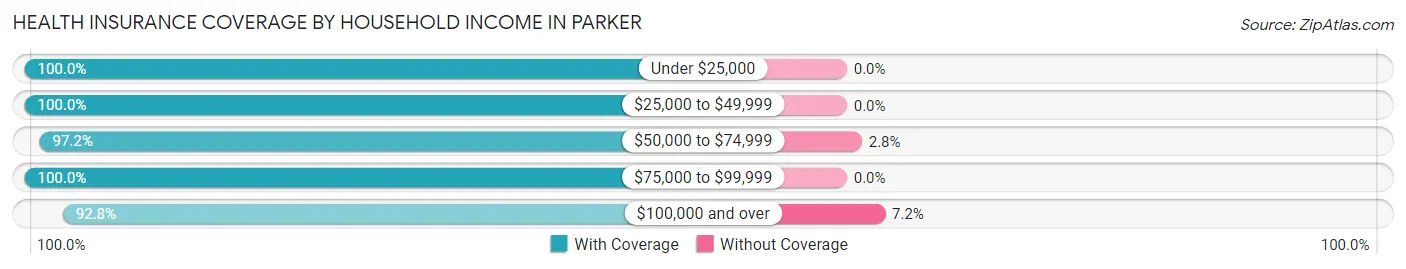
| Household Income | With Coverage | Without Coverage |
| Under $25,000 | 139 (100.0%) | 0 (0.0%) |
| $25,000 to $49,999 | 83 (100.0%) | 0 (0.0%) |
| $50,000 to $74,999 | 242 (97.2%) | 7 (2.8%) |
| $75,000 to $99,999 | 274 (100.0%) | 0 (0.0%) |
| $100,000 and over | 4,482 (92.8%) | 346 (7.2%) |
Public vs Private Health Insurance Coverage by Age in Parker
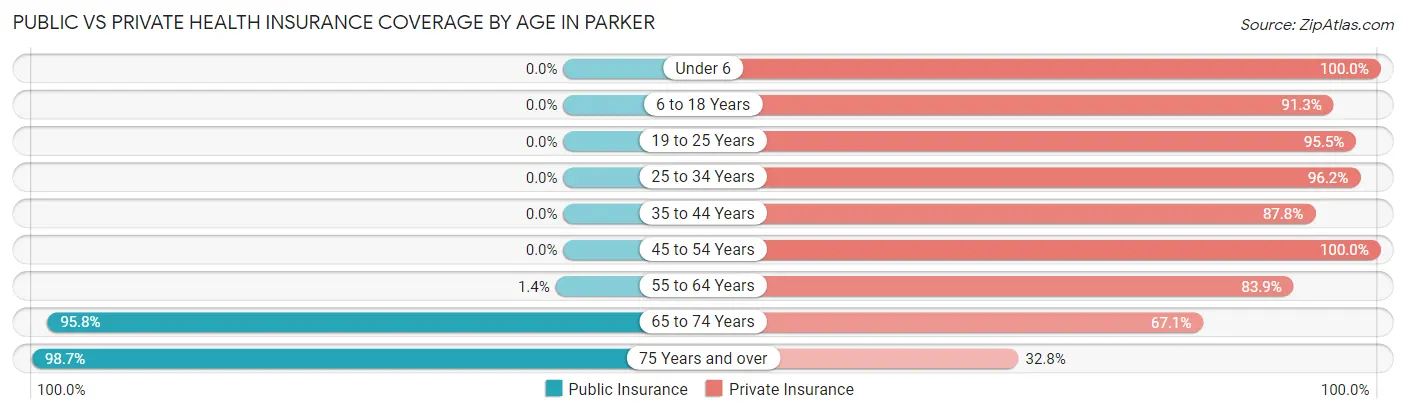
| Age Bracket | Public Insurance | Private Insurance |
| Under 6 | 0 (0.0%) | 179 (100.0%) |
| 6 to 18 Years | 0 (0.0%) | 1,088 (91.3%) |
| 19 to 25 Years | 0 (0.0%) | 527 (95.5%) |
| 25 to 34 Years | 0 (0.0%) | 177 (96.2%) |
| 35 to 44 Years | 0 (0.0%) | 757 (87.8%) |
| 45 to 54 Years | 0 (0.0%) | 802 (100.0%) |
| 55 to 64 Years | 11 (1.4%) | 639 (83.9%) |
| 65 to 74 Years | 570 (95.8%) | 399 (67.1%) |
| 75 Years and over | 439 (98.7%) | 146 (32.8%) |
| Total | 1,020 (18.3%) | 4,714 (84.6%) |
Disability Status by Sex by Age in Parker
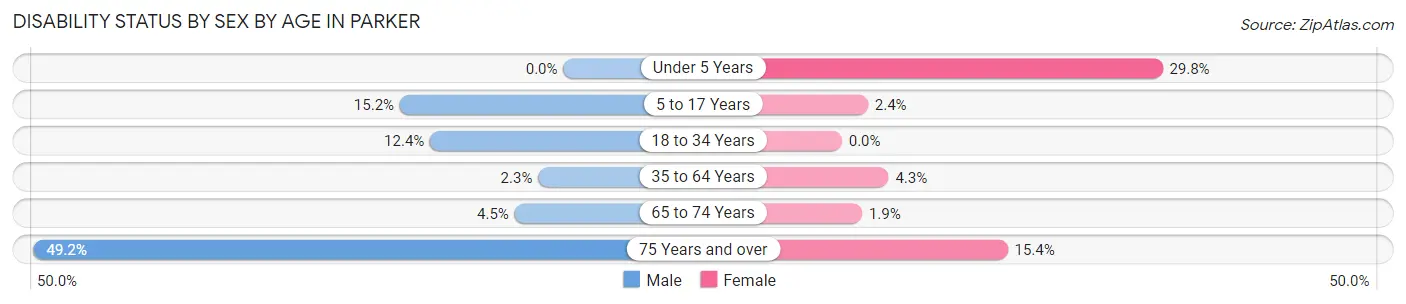
| Age Bracket | Male | Female |
| Under 5 Years | 0 (0.0%) | 25 (29.8%) |
| 5 to 17 Years | 125 (15.2%) | 8 (2.4%) |
| 18 to 34 Years | 56 (12.4%) | 0 (0.0%) |
| 35 to 64 Years | 29 (2.3%) | 51 (4.3%) |
| 65 to 74 Years | 10 (4.5%) | 7 (1.9%) |
| 75 Years and over | 59 (49.2%) | 50 (15.4%) |
Disability Class by Sex by Age in Parker
Disability Class: Hearing Difficulty
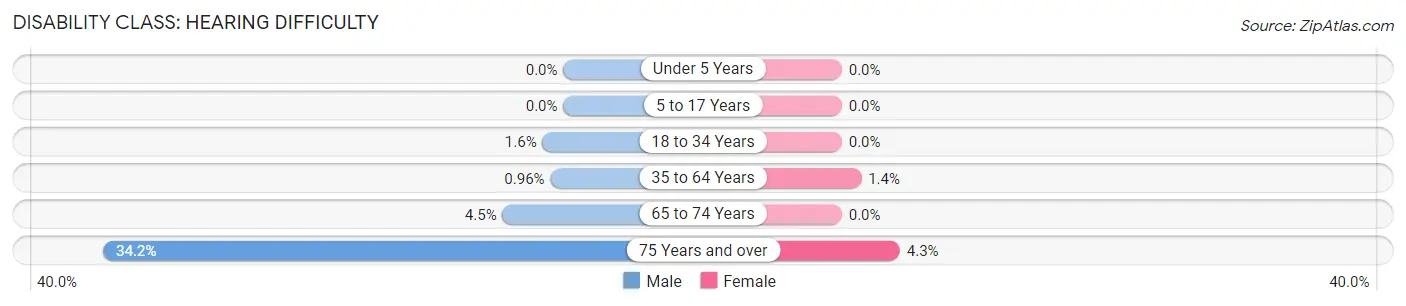
| Age Bracket | Male | Female |
| Under 5 Years | 0 (0.0%) | 0 (0.0%) |
| 5 to 17 Years | 0 (0.0%) | 0 (0.0%) |
| 18 to 34 Years | 7 (1.5%) | 0 (0.0%) |
| 35 to 64 Years | 12 (1.0%) | 17 (1.4%) |
| 65 to 74 Years | 10 (4.5%) | 0 (0.0%) |
| 75 Years and over | 41 (34.2%) | 14 (4.3%) |
Disability Class: Vision Difficulty
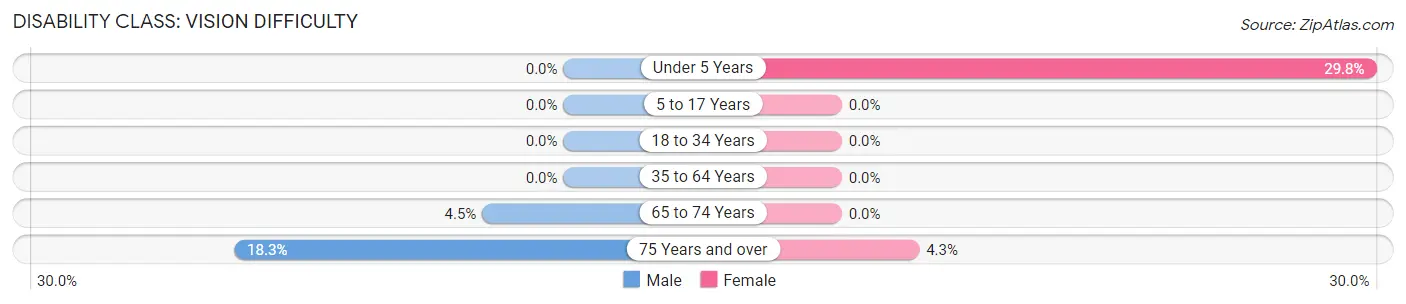
| Age Bracket | Male | Female |
| Under 5 Years | 0 (0.0%) | 25 (29.8%) |
| 5 to 17 Years | 0 (0.0%) | 0 (0.0%) |
| 18 to 34 Years | 0 (0.0%) | 0 (0.0%) |
| 35 to 64 Years | 0 (0.0%) | 0 (0.0%) |
| 65 to 74 Years | 10 (4.5%) | 0 (0.0%) |
| 75 Years and over | 22 (18.3%) | 14 (4.3%) |
Disability Class: Cognitive Difficulty
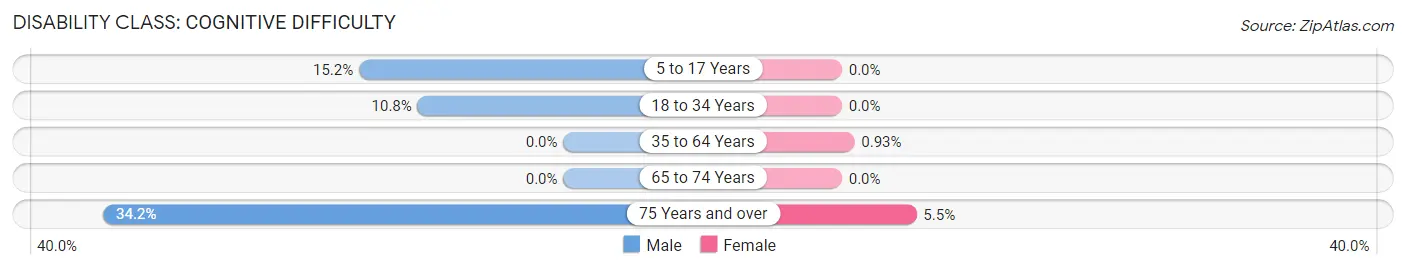
| Age Bracket | Male | Female |
| 5 to 17 Years | 125 (15.2%) | 0 (0.0%) |
| 18 to 34 Years | 49 (10.8%) | 0 (0.0%) |
| 35 to 64 Years | 0 (0.0%) | 11 (0.9%) |
| 65 to 74 Years | 0 (0.0%) | 0 (0.0%) |
| 75 Years and over | 41 (34.2%) | 18 (5.5%) |
Disability Class: Ambulatory Difficulty
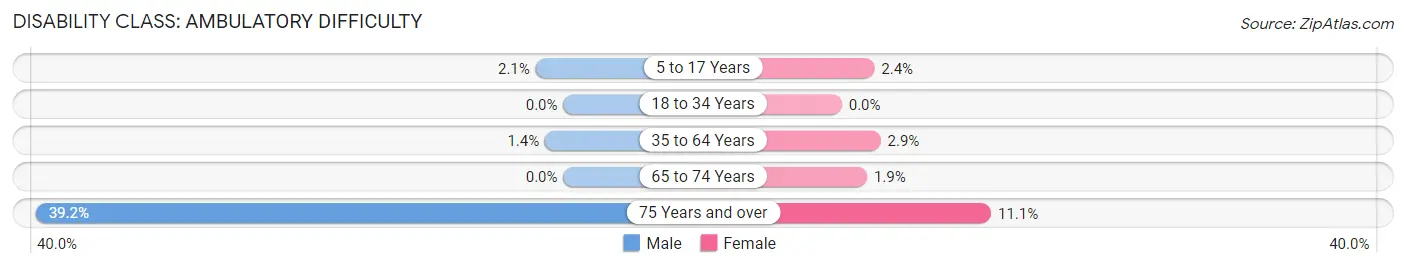
| Age Bracket | Male | Female |
| 5 to 17 Years | 17 (2.1%) | 8 (2.4%) |
| 18 to 34 Years | 0 (0.0%) | 0 (0.0%) |
| 35 to 64 Years | 17 (1.4%) | 34 (2.9%) |
| 65 to 74 Years | 0 (0.0%) | 7 (1.9%) |
| 75 Years and over | 47 (39.2%) | 36 (11.1%) |
Disability Class: Self-Care Difficulty
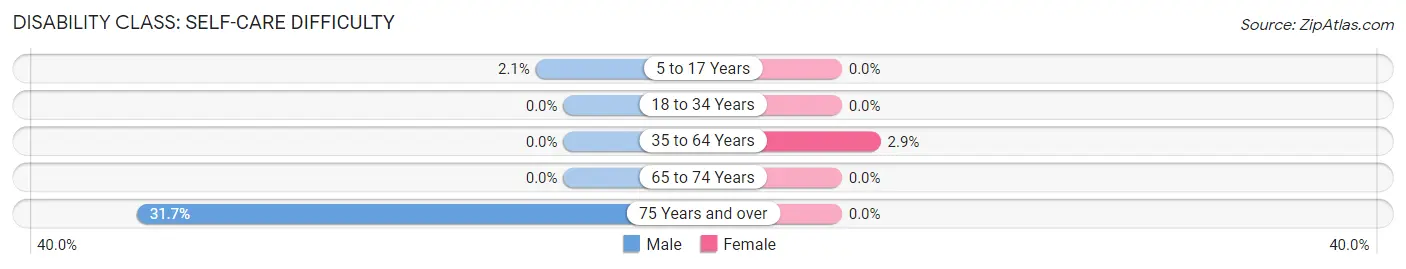
| Age Bracket | Male | Female |
| 5 to 17 Years | 17 (2.1%) | 0 (0.0%) |
| 18 to 34 Years | 0 (0.0%) | 0 (0.0%) |
| 35 to 64 Years | 0 (0.0%) | 34 (2.9%) |
| 65 to 74 Years | 0 (0.0%) | 0 (0.0%) |
| 75 Years and over | 38 (31.7%) | 0 (0.0%) |
Technology Access in Parker
Computing Device Access in Parker
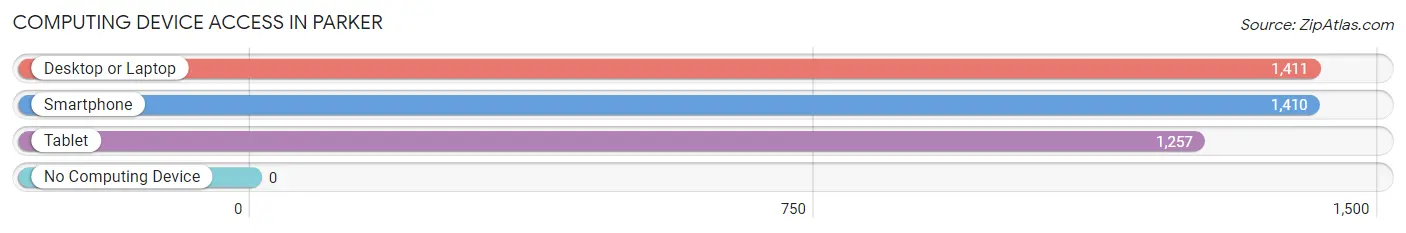
| Device Type | # Households | % Households |
| Desktop or Laptop | 1,411 | 99.2% |
| Smartphone | 1,410 | 99.2% |
| Tablet | 1,257 | 88.4% |
| No Computing Device | 0 | 0.0% |
| Total | 1,422 | 100.0% |
Internet Access in Parker
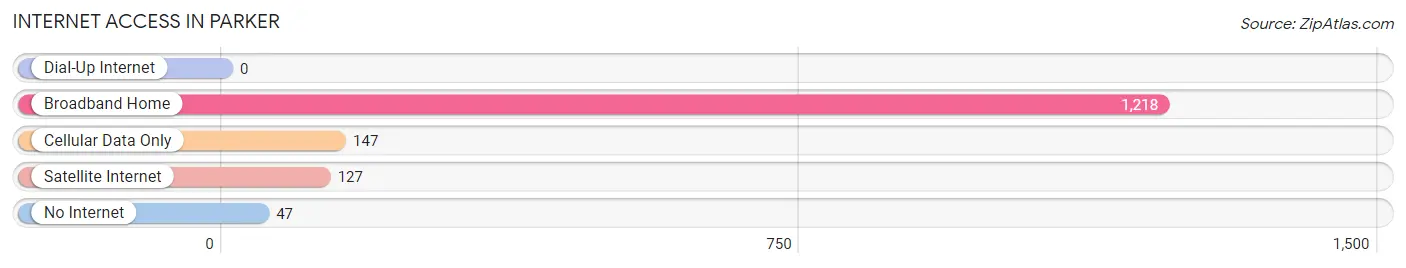
| Internet Type | # Households | % Households |
| Dial-Up Internet | 0 | 0.0% |
| Broadband Home | 1,218 | 85.7% |
| Cellular Data Only | 147 | 10.3% |
| Satellite Internet | 127 | 8.9% |
| No Internet | 47 | 3.3% |
| Total | 1,422 | 100.0% |
Parker Summary
Parker, Texas is a small town located in the northeast corner of the state, about 30 miles northeast of Dallas. It is part of the Dallas-Fort Worth-Arlington metropolitan area and is the county seat of Parker County. The town was founded in 1855 and has a population of approximately 25,000 people.
History
Parker, Texas was founded in 1855 by a group of settlers from Missouri. The town was named after Isaac Parker, a prominent local rancher and businessman. The town was originally a small farming community, but it soon grew to become a major center for the cattle industry. In the late 19th century, Parker was a major stop on the Chisholm Trail, a route used by cowboys to drive cattle from Texas to Kansas.
In the early 20th century, Parker began to experience a period of growth and development. The town was incorporated in 1912 and the first school was built in 1913. The town also saw the construction of a new courthouse in 1914.
In the 1950s, Parker experienced a period of rapid growth as the population increased from 1,000 to over 10,000. This growth was largely due to the expansion of the Dallas-Fort Worth metropolitan area.
Geography
Parker is located in the northeast corner of Texas, about 30 miles northeast of Dallas. It is part of the Dallas-Fort Worth-Arlington metropolitan area and is the county seat of Parker County. The town is situated on the banks of the Brazos River and is surrounded by rolling hills and prairies.
The climate in Parker is generally mild and humid. Summers are hot and humid, with temperatures reaching into the 90s. Winters are mild, with temperatures rarely dropping below freezing.
Economy
The economy of Parker is largely based on agriculture and ranching. The town is home to several large ranches, including the famous 6666 Ranch. The town is also home to several manufacturing companies, including a large paper mill.
Parker is also home to several retail stores, restaurants, and other businesses. The town is also home to several educational institutions, including Weatherford College and the University of Texas at Arlington.
Demographics
As of the 2010 census, the population of Parker was 25,558. The racial makeup of the town was 79.3% White, 11.2% African American, 0.7% Native American, 0.7% Asian, 0.1% Pacific Islander, and 6.9% from other races. Hispanic or Latino of any race were 18.2% of the population.
The median household income in Parker was $50,945, and the median family income was $60,945. The per capita income was $25,945. About 8.3% of families and 10.7% of the population were below the poverty line.
Parker is a small town with a rich history and a diverse population. The town is home to several large ranches and manufacturing companies, as well as several educational institutions. The town is also home to several retail stores, restaurants, and other businesses. The town is a great place to live and work, and it is a great place to raise a family.
Common Questions
What is Per Capita Income in Parker?
Per Capita income in Parker is $68,579.
What is the Median Family Income in Parker?
Median Family Income in Parker is $208,068.
What is the Median Household income in Parker?
Median Household Income in Parker is $202,727.
What is Income or Wage Gap in Parker?
Income or Wage Gap in Parker is 45.3%.
Women in Parker earn 54.7 cents for every dollar earned by a man.
What is Inequality or Gini Index in Parker?
Inequality or Gini Index in Parker is 0.41.
What is the Total Population of Parker?
Total Population of Parker is 5,573.
What is the Total Male Population of Parker?
Total Male Population of Parker is 2,935.
What is the Total Female Population of Parker?
Total Female Population of Parker is 2,638.
What is the Ratio of Males per 100 Females in Parker?
There are 111.26 Males per 100 Females in Parker.
What is the Ratio of Females per 100 Males in Parker?
There are 89.88 Females per 100 Males in Parker.
What is the Median Population Age in Parker?
Median Population Age in Parker is 43.8 Years.
What is the Average Family Size in Parker
Average Family Size in Parker is 4.0 People.
What is the Average Household Size in Parker
Average Household Size in Parker is 3.9 People.
How Large is the Labor Force in Parker?
There are 2,605 People in the Labor Forcein in Parker.
What is the Percentage of People in the Labor Force in Parker?
58.9% of People are in the Labor Force in Parker.
What is the Unemployment Rate in Parker?
Unemployment Rate in Parker is 2.3%.