Tiki Island, TX Map & Demographics
Tiki Island Map
Tiki Island Overview
$115,696
PER CAPITA INCOME
$180,938
AVG FAMILY INCOME
$112,054
AVG HOUSEHOLD INCOME
36.6%
WAGE / INCOME GAP [ % ]
63.4¢/ $1
WAGE / INCOME GAP [ $ ]
$12,857
FAMILY INCOME DEFICIT
0.51
INEQUALITY / GINI INDEX
1,196
TOTAL POPULATION
704
MALE POPULATION
492
FEMALE POPULATION
143.09
MALES / 100 FEMALES
69.89
FEMALES / 100 MALES
56.7
MEDIAN AGE
2.2
AVG FAMILY SIZE
1.7
AVG HOUSEHOLD SIZE
728
LABOR FORCE [ PEOPLE ]
62.5%
PERCENT IN LABOR FORCE
1.8%
UNEMPLOYMENT RATE
Tiki Island Area Codes
Income in Tiki Island
Income Overview in Tiki Island
Per Capita Income in Tiki Island is $115,696, while median incomes of families and households are $180,938 and $112,054 respectively.
| Characteristic | Number | Measure |
| Per Capita Income | 1,196 | $115,696 |
| Median Family Income | 381 | $180,938 |
| Mean Family Income | 381 | $248,876 |
| Median Household Income | 702 | $112,054 |
| Mean Household Income | 702 | $196,860 |
| Income Deficit | 381 | $12,857 |
| Wage / Income Gap (%) | 1,196 | 36.65% |
| Wage / Income Gap ($) | 1,196 | 63.35¢ per $1 |
| Gini / Inequality Index | 1,196 | 0.51 |
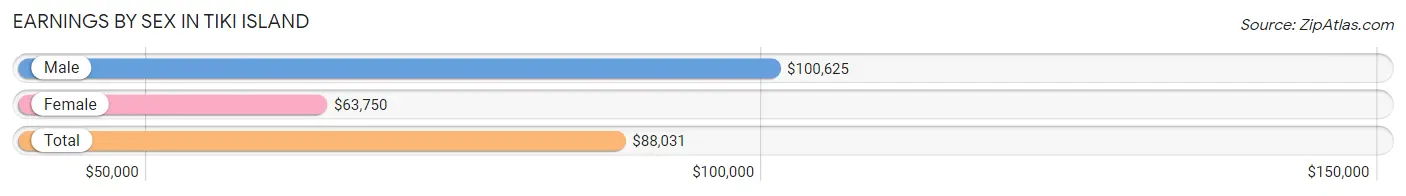
Earnings by Sex in Tiki Island
Average Earnings in Tiki Island are $88,031, $100,625 for men and $63,750 for women, a difference of 36.6%.
| Sex | Number | Average Earnings |
| Male | 492 (64.1%) | $100,625 |
| Female | 275 (35.8%) | $63,750 |
| Total | 767 (100.0%) | $88,031 |
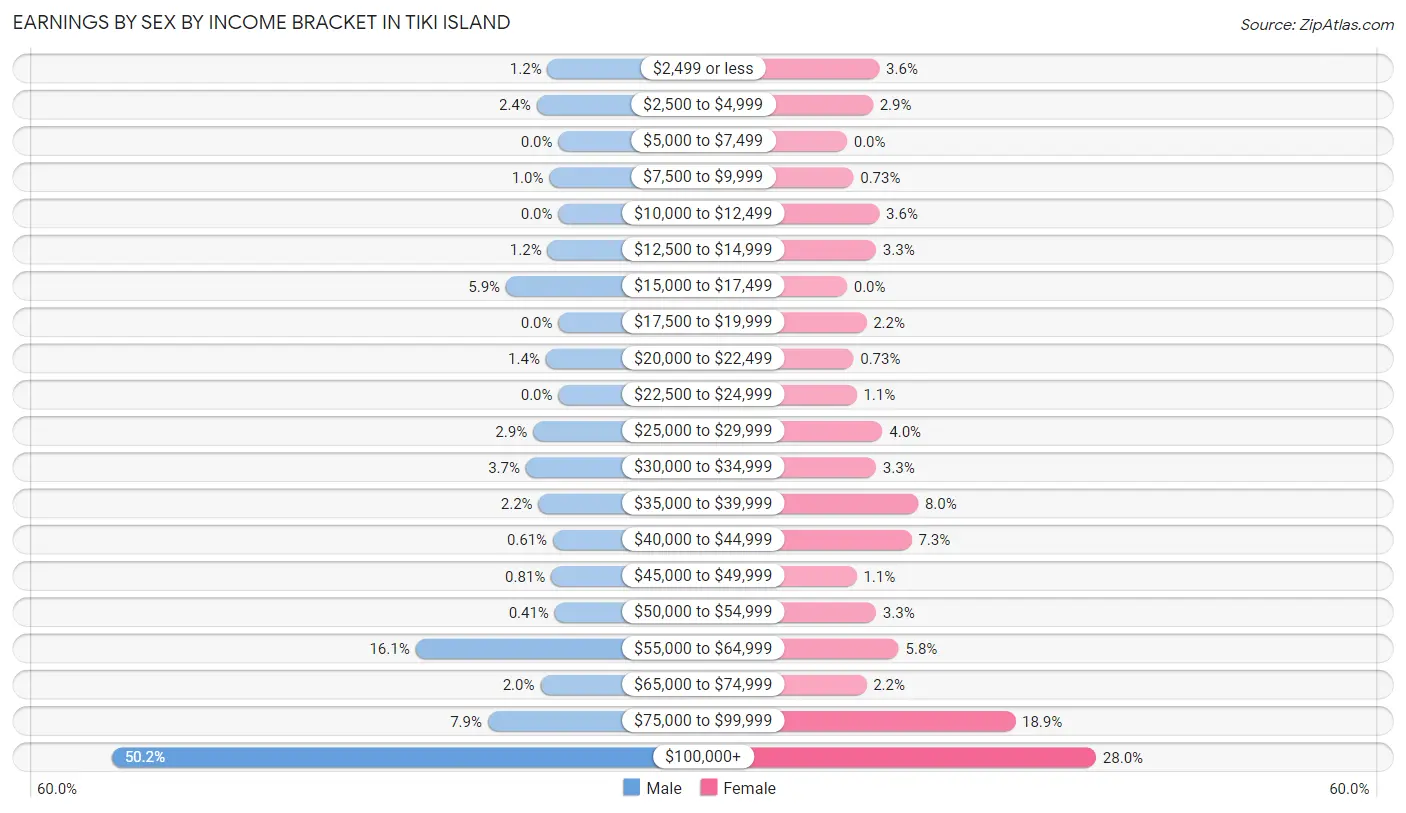
Earnings by Sex by Income Bracket in Tiki Island
The most common earnings brackets in Tiki Island are $100,000+ for men (247 | 50.2%) and $100,000+ for women (77 | 28.0%).
| Income | Male | Female |
| $2,499 or less | 6 (1.2%) | 10 (3.6%) |
| $2,500 to $4,999 | 12 (2.4%) | 8 (2.9%) |
| $5,000 to $7,499 | 0 (0.0%) | 0 (0.0%) |
| $7,500 to $9,999 | 5 (1.0%) | 2 (0.7%) |
| $10,000 to $12,499 | 0 (0.0%) | 10 (3.6%) |
| $12,500 to $14,999 | 6 (1.2%) | 9 (3.3%) |
| $15,000 to $17,499 | 29 (5.9%) | 0 (0.0%) |
| $17,500 to $19,999 | 0 (0.0%) | 6 (2.2%) |
| $20,000 to $22,499 | 7 (1.4%) | 2 (0.7%) |
| $22,500 to $24,999 | 0 (0.0%) | 3 (1.1%) |
| $25,000 to $29,999 | 14 (2.9%) | 11 (4.0%) |
| $30,000 to $34,999 | 18 (3.7%) | 9 (3.3%) |
| $35,000 to $39,999 | 11 (2.2%) | 22 (8.0%) |
| $40,000 to $44,999 | 3 (0.6%) | 20 (7.3%) |
| $45,000 to $49,999 | 4 (0.8%) | 3 (1.1%) |
| $50,000 to $54,999 | 2 (0.4%) | 9 (3.3%) |
| $55,000 to $64,999 | 79 (16.1%) | 16 (5.8%) |
| $65,000 to $74,999 | 10 (2.0%) | 6 (2.2%) |
| $75,000 to $99,999 | 39 (7.9%) | 52 (18.9%) |
| $100,000+ | 247 (50.2%) | 77 (28.0%) |
| Total | 492 (100.0%) | 275 (100.0%) |
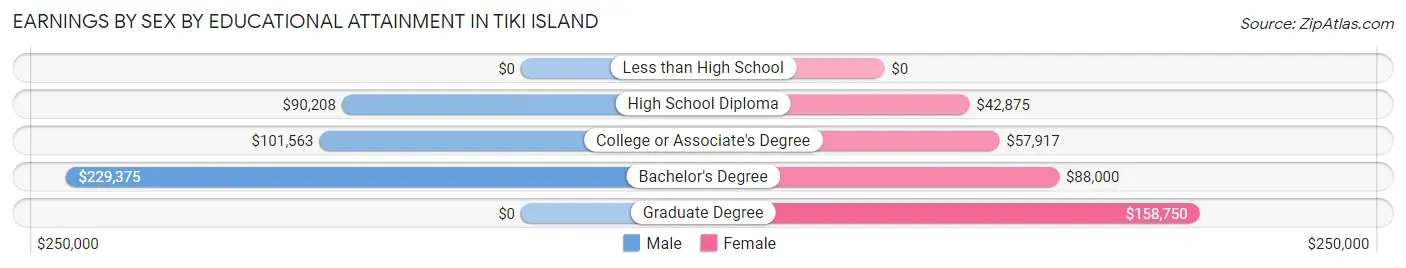
Earnings by Sex by Educational Attainment in Tiki Island
Average earnings in Tiki Island are $109,643 for men and $73,125 for women, a difference of 33.3%. Men with an educational attainment of bachelor's degree enjoy the highest average annual earnings of $229,375, while those with high school diploma education earn the least with $90,208. Women with an educational attainment of graduate degree earn the most with the average annual earnings of $158,750, while those with high school diploma education have the smallest earnings of $42,875.
| Educational Attainment | Male Income | Female Income |
| Less than High School | - | - |
| High School Diploma | $90,208 | $42,875 |
| College or Associate's Degree | $101,563 | $57,917 |
| Bachelor's Degree | $229,375 | $88,000 |
| Graduate Degree | - | - |
| Total | $109,643 | $73,125 |
Family Income in Tiki Island
Family Income Brackets in Tiki Island
According to the Tiki Island family income data, there are 174 families falling into the $200,000+ income range, which is the most common income bracket and makes up 45.7% of all families. Conversely, the $10,000 to $14,999 income bracket is the least frequent group with only 2 families (0.5%) belonging to this category.
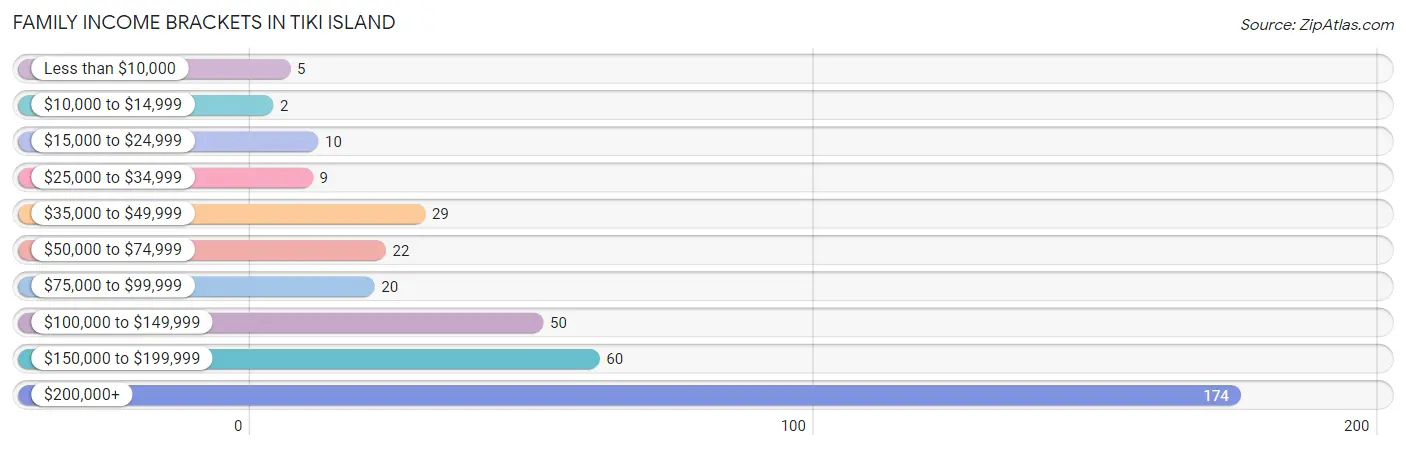
| Income Bracket | # Families | % Families |
| Less than $10,000 | 5 | 1.3% |
| $10,000 to $14,999 | 2 | 0.5% |
| $15,000 to $24,999 | 10 | 2.6% |
| $25,000 to $34,999 | 9 | 2.4% |
| $35,000 to $49,999 | 29 | 7.6% |
| $50,000 to $74,999 | 22 | 5.8% |
| $75,000 to $99,999 | 20 | 5.2% |
| $100,000 to $149,999 | 50 | 13.1% |
| $150,000 to $199,999 | 60 | 15.7% |
| $200,000+ | 174 | 45.7% |
Family Income by Famaliy Size in Tiki Island
3-person families (33 | 8.7%) account for the highest median family income in Tiki Island with $250,001 per family, while 2-person families (323 | 84.8%) have the highest median income of $89,810 per family member.
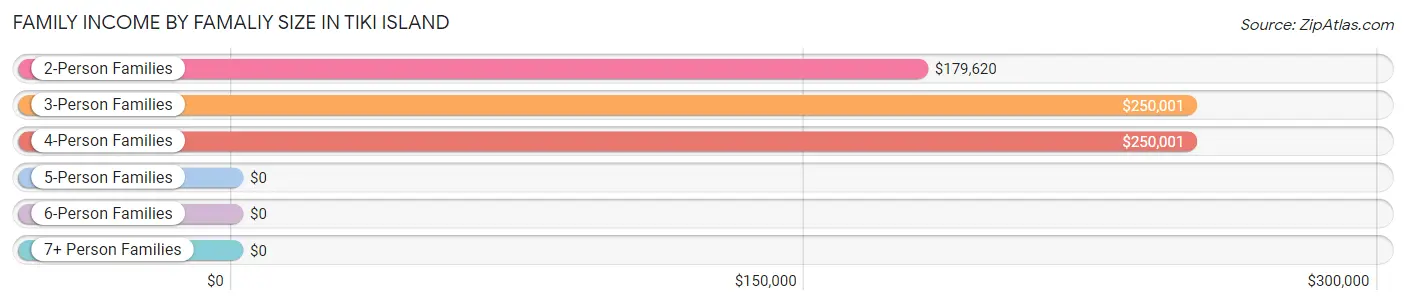
| Income Bracket | # Families | Median Income |
| 2-Person Families | 323 (84.8%) | $179,620 |
| 3-Person Families | 33 (8.7%) | $250,001 |
| 4-Person Families | 25 (6.6%) | $250,001 |
| 5-Person Families | 0 (0.0%) | $0 |
| 6-Person Families | 0 (0.0%) | $0 |
| 7+ Person Families | 0 (0.0%) | $0 |
| Total | 381 (100.0%) | $180,938 |
Family Income by Number of Earners in Tiki Island
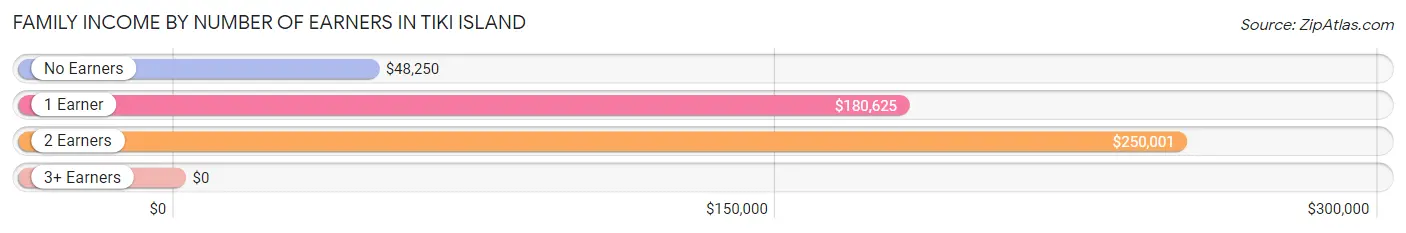
| Number of Earners | # Families | Median Income |
| No Earners | 65 (17.1%) | $48,250 |
| 1 Earner | 108 (28.3%) | $180,625 |
| 2 Earners | 190 (49.9%) | $250,001 |
| 3+ Earners | 18 (4.7%) | $0 |
| Total | 381 (100.0%) | $180,938 |
Household Income in Tiki Island
Household Income Brackets in Tiki Island
With 218 households falling in the category, the $200,000+ income range is the most frequent in Tiki Island, accounting for 31.0% of all households. In contrast, only 7 households (1.0%) fall into the $10,000 to $14,999 income bracket, making it the least populous group.
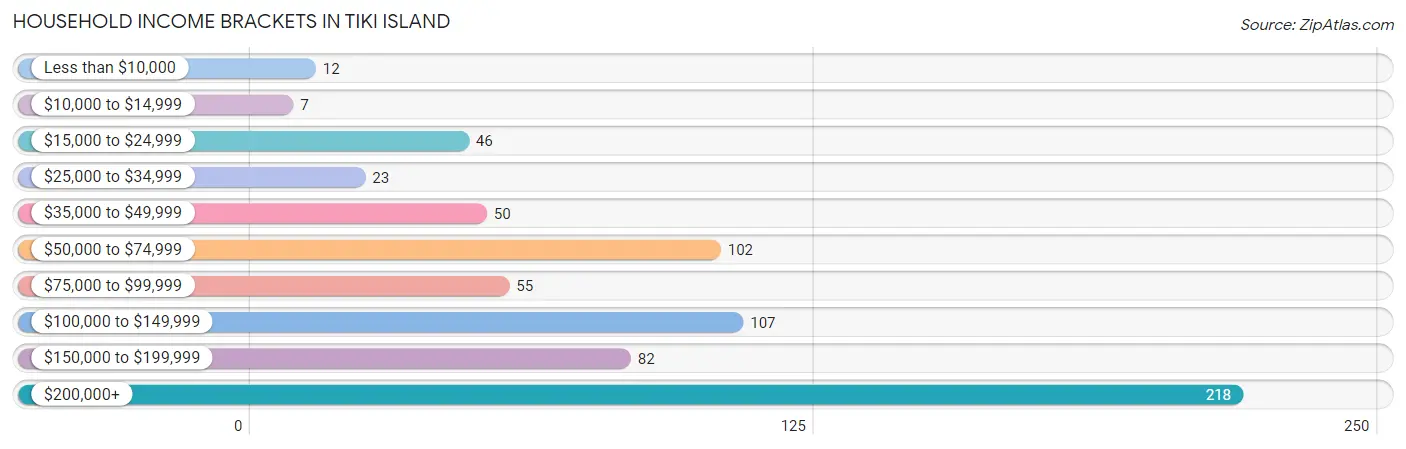
| Income Bracket | # Households | % Households |
| Less than $10,000 | 12 | 1.7% |
| $10,000 to $14,999 | 7 | 1.0% |
| $15,000 to $24,999 | 46 | 6.6% |
| $25,000 to $34,999 | 23 | 3.3% |
| $35,000 to $49,999 | 50 | 7.1% |
| $50,000 to $74,999 | 102 | 14.5% |
| $75,000 to $99,999 | 55 | 7.8% |
| $100,000 to $149,999 | 107 | 15.2% |
| $150,000 to $199,999 | 82 | 11.7% |
| $200,000+ | 218 | 31.1% |
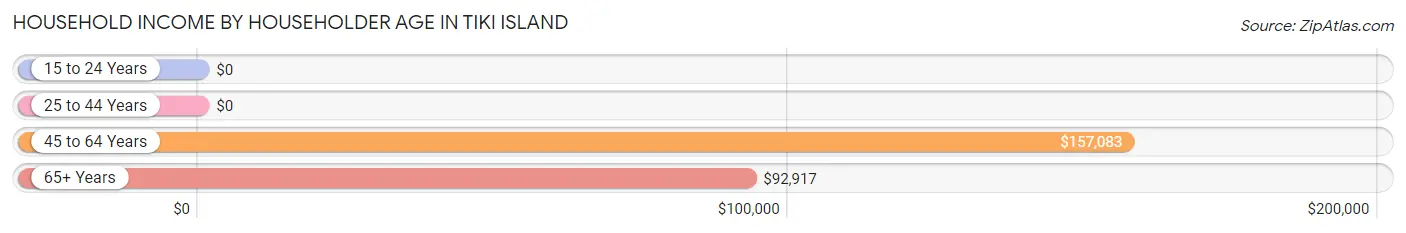
Household Income by Householder Age in Tiki Island
The median household income in Tiki Island is $112,054, with the highest median household income of $157,083 found in the 45 to 64 years age bracket for the primary householder. A total of 335 households (47.7%) fall into this category. Meanwhile, the 15 to 24 years age bracket for the primary householder has the lowest median household income of $0, with 4 households (0.6%) in this group.
| Income Bracket | # Households | Median Income |
| 15 to 24 Years | 4 (0.6%) | $0 |
| 25 to 44 Years | 148 (21.1%) | $0 |
| 45 to 64 Years | 335 (47.7%) | $157,083 |
| 65+ Years | 215 (30.6%) | $92,917 |
| Total | 702 (100.0%) | $112,054 |
Poverty in Tiki Island
Income Below Poverty by Sex and Age in Tiki Island
With 2.3% poverty level for males and 5.5% for females among the residents of Tiki Island, 18 to 24 year old males and 25 to 34 year old females are the most vulnerable to poverty, with 3 males (10.0%) and 7 females (24.1%) in their respective age groups living below the poverty level.
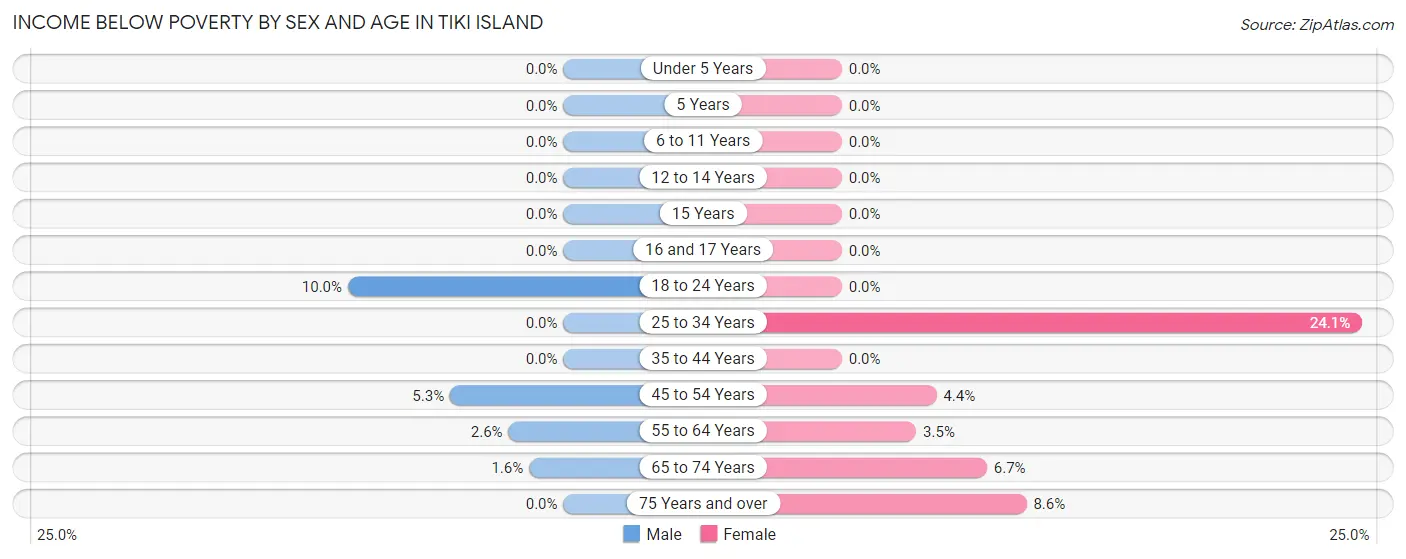
| Age Bracket | Male | Female |
| Under 5 Years | 0 (0.0%) | 0 (0.0%) |
| 5 Years | 0 (0.0%) | 0 (0.0%) |
| 6 to 11 Years | 0 (0.0%) | 0 (0.0%) |
| 12 to 14 Years | 0 (0.0%) | 0 (0.0%) |
| 15 Years | 0 (0.0%) | 0 (0.0%) |
| 16 and 17 Years | 0 (0.0%) | 0 (0.0%) |
| 18 to 24 Years | 3 (10.0%) | 0 (0.0%) |
| 25 to 34 Years | 0 (0.0%) | 7 (24.1%) |
| 35 to 44 Years | 0 (0.0%) | 0 (0.0%) |
| 45 to 54 Years | 6 (5.3%) | 5 (4.4%) |
| 55 to 64 Years | 5 (2.5%) | 5 (3.5%) |
| 65 to 74 Years | 2 (1.6%) | 7 (6.7%) |
| 75 Years and over | 0 (0.0%) | 3 (8.6%) |
| Total | 16 (2.3%) | 27 (5.5%) |
Income Above Poverty by Sex and Age in Tiki Island
According to the poverty statistics in Tiki Island, males aged under 5 years and females aged 15 years are the age groups that are most secure financially, with 100.0% of males and 100.0% of females in these age groups living above the poverty line.
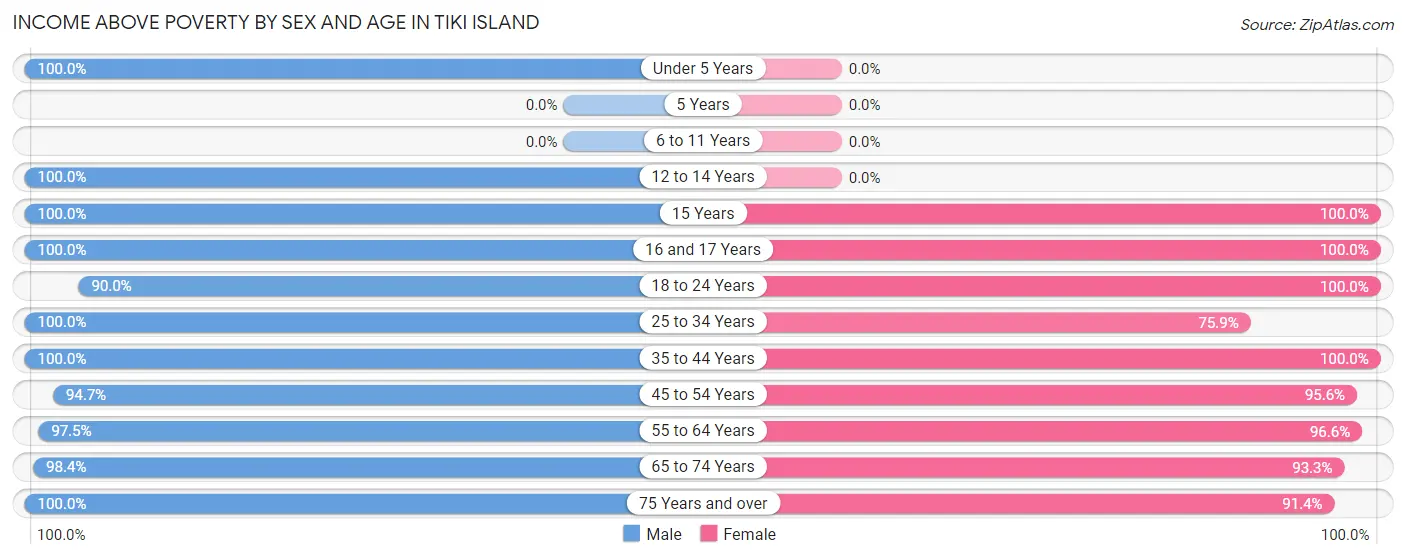
| Age Bracket | Male | Female |
| Under 5 Years | 8 (100.0%) | 0 (0.0%) |
| 5 Years | 0 (0.0%) | 0 (0.0%) |
| 6 to 11 Years | 0 (0.0%) | 0 (0.0%) |
| 12 to 14 Years | 4 (100.0%) | 0 (0.0%) |
| 15 Years | 18 (100.0%) | 2 (100.0%) |
| 16 and 17 Years | 10 (100.0%) | 15 (100.0%) |
| 18 to 24 Years | 27 (90.0%) | 10 (100.0%) |
| 25 to 34 Years | 79 (100.0%) | 22 (75.9%) |
| 35 to 44 Years | 59 (100.0%) | 38 (100.0%) |
| 45 to 54 Years | 108 (94.7%) | 109 (95.6%) |
| 55 to 64 Years | 191 (97.5%) | 140 (96.6%) |
| 65 to 74 Years | 124 (98.4%) | 97 (93.3%) |
| 75 Years and over | 60 (100.0%) | 32 (91.4%) |
| Total | 688 (97.7%) | 465 (94.5%) |
Income Below Poverty Among Married-Couple Families in Tiki Island
The poverty statistics for married-couple families in Tiki Island show that 2.0% or 7 of the total 352 families live below the poverty line. Families with no children have the highest poverty rate of 2.2%, comprising of 7 families. On the other hand, families with 1 or 2 children have the lowest poverty rate of 0.0%, which includes 0 families.
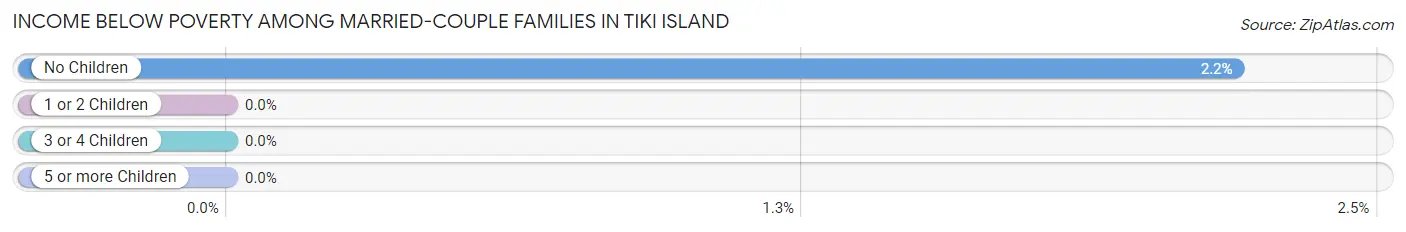
| Children | Above Poverty | Below Poverty |
| No Children | 312 (97.8%) | 7 (2.2%) |
| 1 or 2 Children | 33 (100.0%) | 0 (0.0%) |
| 3 or 4 Children | 0 (0.0%) | 0 (0.0%) |
| 5 or more Children | 0 (0.0%) | 0 (0.0%) |
| Total | 345 (98.0%) | 7 (2.0%) |
Income Below Poverty Among Single-Parent Households in Tiki Island
| Children | Single Father | Single Mother |
| No Children | 0 (0.0%) | 0 (0.0%) |
| 1 or 2 Children | 0 (0.0%) | 0 (0.0%) |
| 3 or 4 Children | 0 (0.0%) | 0 (0.0%) |
| 5 or more Children | 0 (0.0%) | 0 (0.0%) |
| Total | 0 (0.0%) | 0 (0.0%) |
Income Below Poverty Among Married-Couple vs Single-Parent Households in Tiki Island
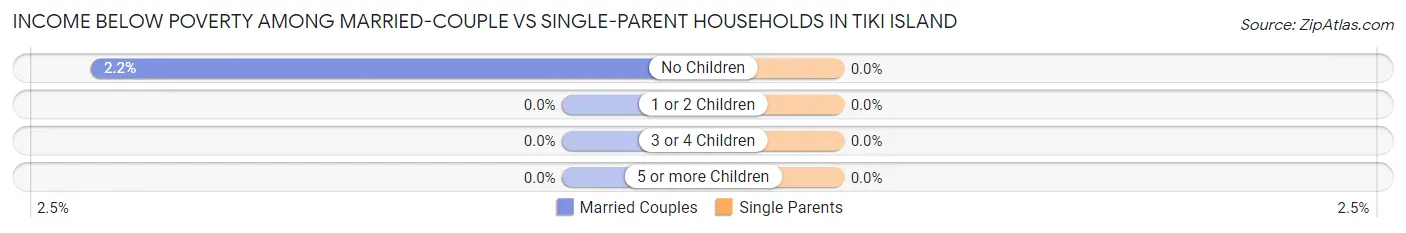
| Children | Married-Couple Families | Single-Parent Households |
| No Children | 7 (2.2%) | 0 (0.0%) |
| 1 or 2 Children | 0 (0.0%) | 0 (0.0%) |
| 3 or 4 Children | 0 (0.0%) | 0 (0.0%) |
| 5 or more Children | 0 (0.0%) | 0 (0.0%) |
| Total | 7 (2.0%) | 0 (0.0%) |
Race in Tiki Island
The most populous races in Tiki Island are White / Caucasian (1,037 | 86.7%), Asian (117 | 9.8%), and Hispanic or Latino (66 | 5.5%).
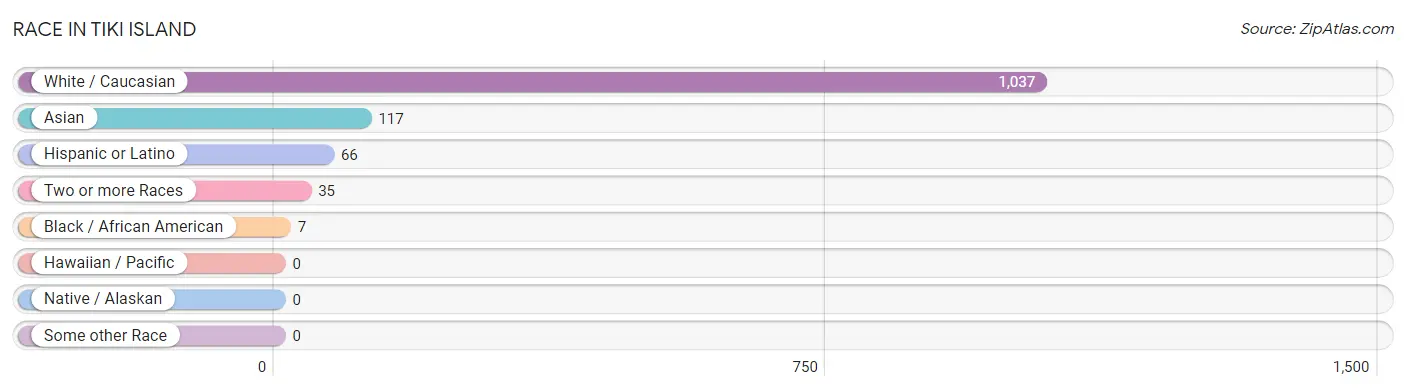
| Race | # Population | % Population |
| Asian | 117 | 9.8% |
| Black / African American | 7 | 0.6% |
| Hawaiian / Pacific | 0 | 0.0% |
| Hispanic or Latino | 66 | 5.5% |
| Native / Alaskan | 0 | 0.0% |
| White / Caucasian | 1,037 | 86.7% |
| Two or more Races | 35 | 2.9% |
| Some other Race | 0 | 0.0% |
| Total | 1,196 | 100.0% |
Ancestry in Tiki Island
The most populous ancestries reported in Tiki Island are English (202 | 16.9%), German (196 | 16.4%), Irish (148 | 12.4%), American (118 | 9.9%), and Italian (70 | 5.9%), together accounting for 61.4% of all Tiki Island residents.
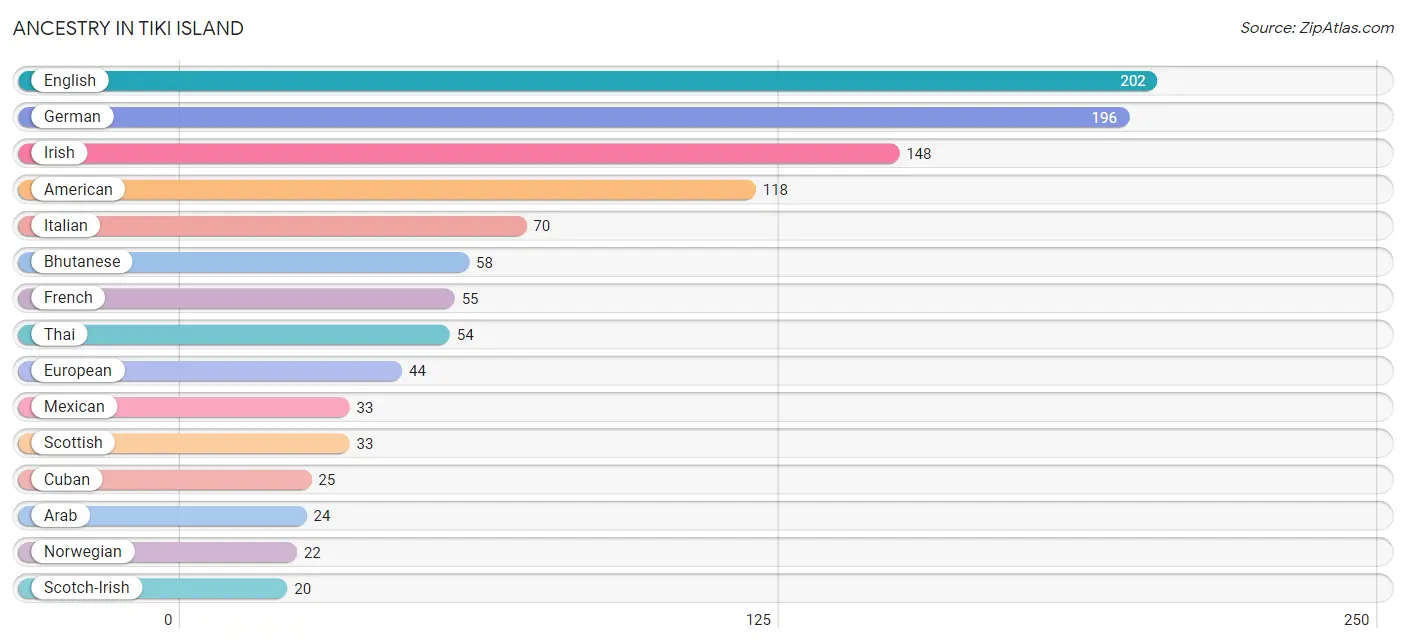
| Ancestry | # Population | % Population |
| American | 118 | 9.9% |
| Arab | 24 | 2.0% |
| Bhutanese | 58 | 4.9% |
| British | 3 | 0.3% |
| Burmese | 9 | 0.7% |
| Cajun | 3 | 0.3% |
| Cuban | 25 | 2.1% |
| Czech | 16 | 1.3% |
| Danish | 6 | 0.5% |
| Dutch | 5 | 0.4% |
| Eastern European | 4 | 0.3% |
| Egyptian | 12 | 1.0% |
| English | 202 | 16.9% |
| European | 44 | 3.7% |
| Finnish | 3 | 0.3% |
| French | 55 | 4.6% |
| French Canadian | 5 | 0.4% |
| German | 196 | 16.4% |
| Greek | 15 | 1.3% |
| Guamanian / Chamorro | 5 | 0.4% |
| Indian (Asian) | 5 | 0.4% |
| Irish | 148 | 12.4% |
| Italian | 70 | 5.9% |
| Lebanese | 12 | 1.0% |
| Mexican | 33 | 2.8% |
| Norwegian | 22 | 1.8% |
| Polish | 14 | 1.2% |
| Puerto Rican | 4 | 0.3% |
| Russian | 2 | 0.2% |
| Scotch-Irish | 20 | 1.7% |
| Scottish | 33 | 2.8% |
| South American | 4 | 0.3% |
| Swedish | 3 | 0.3% |
| Syrian | 12 | 1.0% |
| Thai | 54 | 4.5% |
| Ukrainian | 3 | 0.3% |
| Uruguayan | 4 | 0.3% |
| Welsh | 7 | 0.6% |
| Yugoslavian | 7 | 0.6% | View All 39 Rows |
Immigrants in Tiki Island
The most numerous immigrant groups reported in Tiki Island came from Asia (119 | 10.0%), Eastern Asia (63 | 5.3%), Japan (58 | 4.9%), India (54 | 4.5%), and South Central Asia (54 | 4.5%), together accounting for 29.1% of all Tiki Island residents.
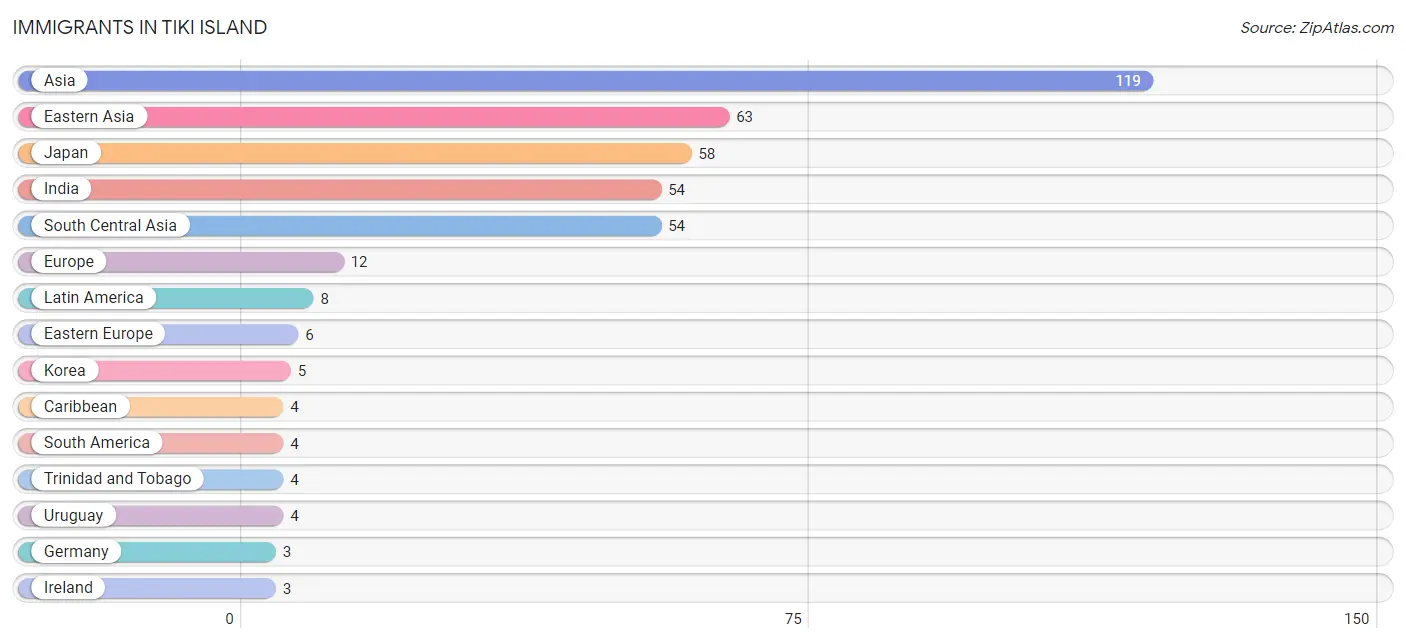
| Immigration Origin | # Population | % Population |
| Asia | 119 | 10.0% |
| Caribbean | 4 | 0.3% |
| Eastern Asia | 63 | 5.3% |
| Eastern Europe | 6 | 0.5% |
| Europe | 12 | 1.0% |
| Germany | 3 | 0.3% |
| India | 54 | 4.5% |
| Ireland | 3 | 0.3% |
| Japan | 58 | 4.9% |
| Korea | 5 | 0.4% |
| Latin America | 8 | 0.7% |
| Northern Europe | 3 | 0.3% |
| Poland | 3 | 0.3% |
| Singapore | 2 | 0.2% |
| South America | 4 | 0.3% |
| South Central Asia | 54 | 4.5% |
| South Eastern Asia | 2 | 0.2% |
| Trinidad and Tobago | 4 | 0.3% |
| Ukraine | 3 | 0.3% |
| Uruguay | 4 | 0.3% |
| Western Europe | 3 | 0.3% | View All 21 Rows |
Sex and Age in Tiki Island
Sex and Age in Tiki Island
The most populous age groups in Tiki Island are 55 to 59 Years (102 | 14.5%) for men and 55 to 59 Years (75 | 15.2%) for women.

| Age Bracket | Male | Female |
| Under 5 Years | 8 (1.1%) | 0 (0.0%) |
| 5 to 9 Years | 0 (0.0%) | 0 (0.0%) |
| 10 to 14 Years | 4 (0.6%) | 0 (0.0%) |
| 15 to 19 Years | 38 (5.4%) | 17 (3.5%) |
| 20 to 24 Years | 20 (2.8%) | 10 (2.0%) |
| 25 to 29 Years | 6 (0.9%) | 23 (4.7%) |
| 30 to 34 Years | 73 (10.4%) | 6 (1.2%) |
| 35 to 39 Years | 30 (4.3%) | 10 (2.0%) |
| 40 to 44 Years | 29 (4.1%) | 28 (5.7%) |
| 45 to 49 Years | 59 (8.4%) | 45 (9.1%) |
| 50 to 54 Years | 55 (7.8%) | 69 (14.0%) |
| 55 to 59 Years | 102 (14.5%) | 75 (15.2%) |
| 60 to 64 Years | 94 (13.4%) | 70 (14.2%) |
| 65 to 69 Years | 80 (11.4%) | 60 (12.2%) |
| 70 to 74 Years | 46 (6.5%) | 44 (8.9%) |
| 75 to 79 Years | 42 (6.0%) | 13 (2.6%) |
| 80 to 84 Years | 12 (1.7%) | 6 (1.2%) |
| 85 Years and over | 6 (0.9%) | 16 (3.3%) |
| Total | 704 (100.0%) | 492 (100.0%) |
Families and Households in Tiki Island
Median Family Size in Tiki Island
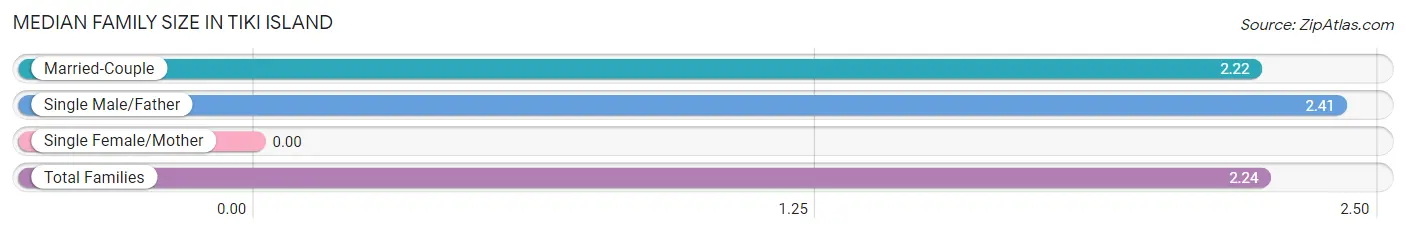
| Family Type | # Families | Family Size |
| Married-Couple | 352 (92.4%) | 2.22 |
| Single Male/Father | 29 (7.6%) | 2.41 |
| Single Female/Mother | 0 (0.0%) | - |
| Total Families | 381 (100.0%) | 2.24 |
Median Household Size in Tiki Island
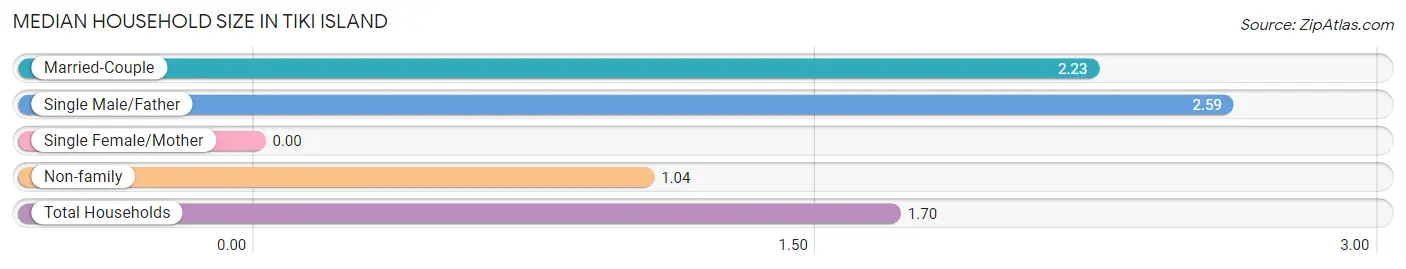
| Household Type | # Households | Household Size |
| Married-Couple | 352 (50.1%) | 2.23 |
| Single Male/Father | 29 (4.1%) | 2.59 |
| Single Female/Mother | 0 (0.0%) | - |
| Non-family | 321 (45.7%) | 1.04 |
| Total Households | 702 (100.0%) | 1.70 |
Household Size by Marriage Status in Tiki Island
Out of a total of 702 households in Tiki Island, 381 (54.3%) are family households, while 321 (45.7%) are nonfamily households. The most numerous type of family households are 2-person households, comprising 316, and the most common type of nonfamily households are 1-person households, comprising 307.
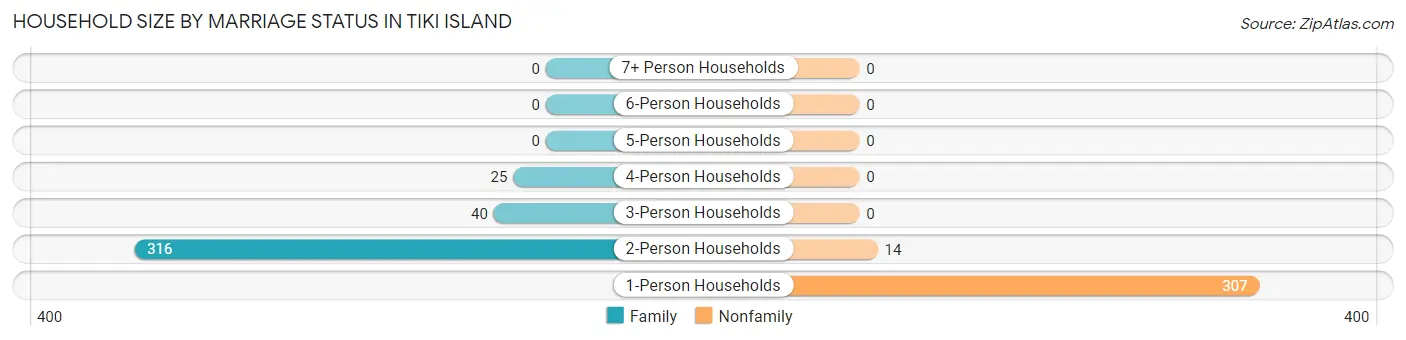
| Household Size | Family Households | Nonfamily Households |
| 1-Person Households | - | 307 (43.7%) |
| 2-Person Households | 316 (45.0%) | 14 (2.0%) |
| 3-Person Households | 40 (5.7%) | 0 (0.0%) |
| 4-Person Households | 25 (3.6%) | 0 (0.0%) |
| 5-Person Households | 0 (0.0%) | 0 (0.0%) |
| 6-Person Households | 0 (0.0%) | 0 (0.0%) |
| 7+ Person Households | 0 (0.0%) | 0 (0.0%) |
| Total | 381 (54.3%) | 321 (45.7%) |
Female Fertility in Tiki Island
Fertility by Age in Tiki Island
Average fertility rate in Tiki Island is 54.0 births per 1,000 women. Women in the age bracket of 20 to 34 years have the highest fertility rate with 77.0 births per 1,000 women. Women in the age bracket of 35 to 50 years acount for 62.5% of all women with births.
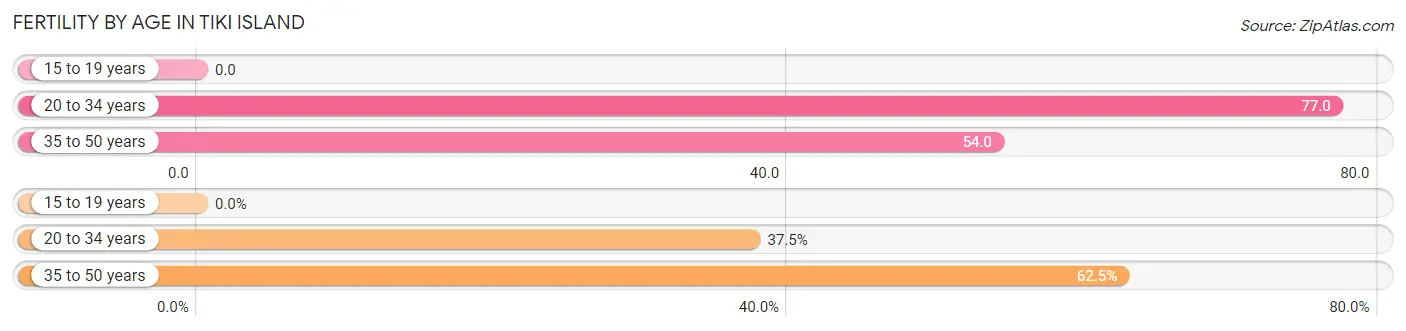
| Age Bracket | Women with Births | Births / 1,000 Women |
| 15 to 19 years | 0 (0.0%) | 0.0 |
| 20 to 34 years | 3 (37.5%) | 77.0 |
| 35 to 50 years | 5 (62.5%) | 54.0 |
| Total | 8 (100.0%) | 54.0 |
Fertility by Age by Marriage Status in Tiki Island
62.5% of women with births (8) in Tiki Island are married. The highest percentage of unmarried women with births falls into 20 to 34 years age bracket with 100.0% of them unmarried at the time of birth, while the lowest percentage of unmarried women with births belong to 35 to 50 years age bracket with 0.0% of them unmarried.
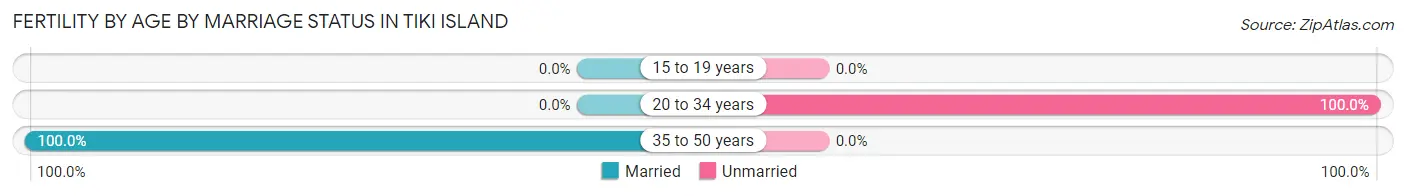
| Age Bracket | Married | Unmarried |
| 15 to 19 years | 0 (0.0%) | 0 (0.0%) |
| 20 to 34 years | 0 (0.0%) | 3 (100.0%) |
| 35 to 50 years | 5 (100.0%) | 0 (0.0%) |
| Total | 5 (62.5%) | 3 (37.5%) |
Fertility by Education in Tiki Island
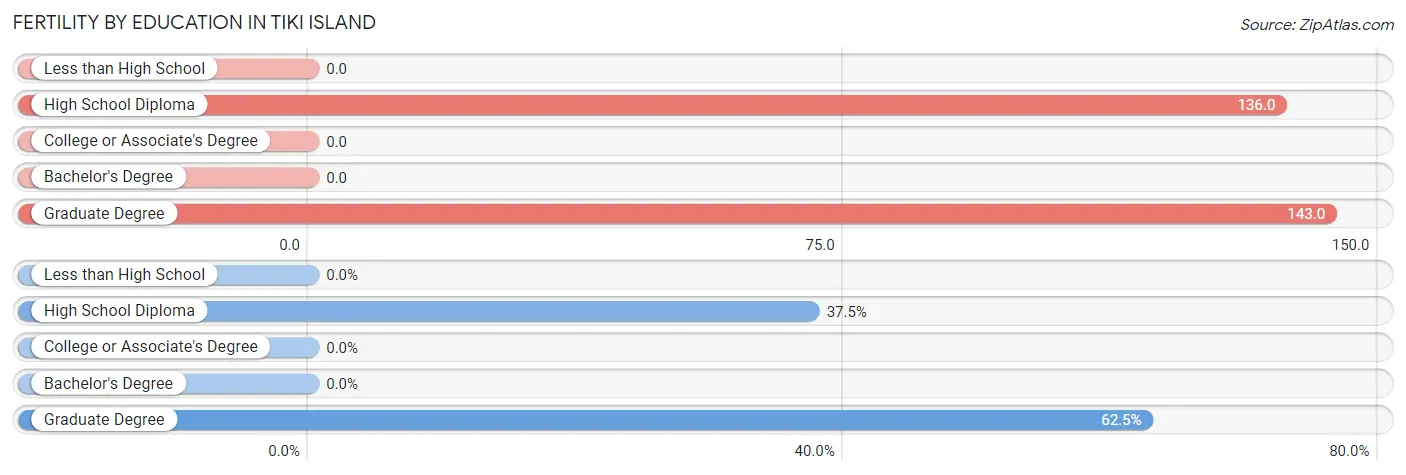
| Educational Attainment | Women with Births | Births / 1,000 Women |
| Less than High School | 0 (0.0%) | 0.0 |
| High School Diploma | 3 (37.5%) | 136.0 |
| College or Associate's Degree | 0 (0.0%) | 0.0 |
| Bachelor's Degree | 0 (0.0%) | 0.0 |
| Graduate Degree | 5 (62.5%) | 143.0 |
| Total | 8 (100.0%) | 54.0 |
Fertility by Education by Marriage Status in Tiki Island
37.5% of women with births in Tiki Island are unmarried. Women with the educational attainment of graduate degree are most likely to be married with 100.0% of them married at childbirth, while women with the educational attainment of high school diploma are least likely to be married with 100.0% of them unmarried at childbirth.
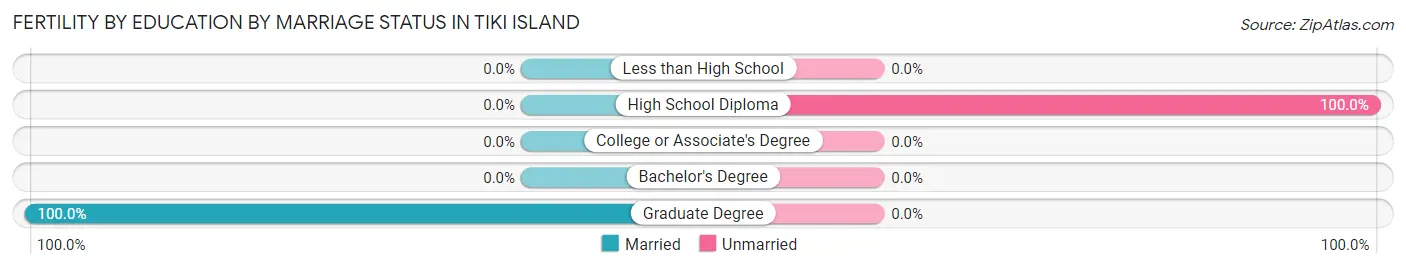
| Educational Attainment | Married | Unmarried |
| Less than High School | 0 (0.0%) | 0 (0.0%) |
| High School Diploma | 0 (0.0%) | 3 (100.0%) |
| College or Associate's Degree | 0 (0.0%) | 0 (0.0%) |
| Bachelor's Degree | 0 (0.0%) | 0 (0.0%) |
| Graduate Degree | 5 (100.0%) | 0 (0.0%) |
| Total | 5 (62.5%) | 3 (37.5%) |
Employment Characteristics in Tiki Island
Employment by Class of Employer in Tiki Island
Among the 712 employed individuals in Tiki Island, private company employees (383 | 53.8%), state government employees (121 | 17.0%), and self-employed (incorporated) (88 | 12.4%) make up the most common classes of employment.
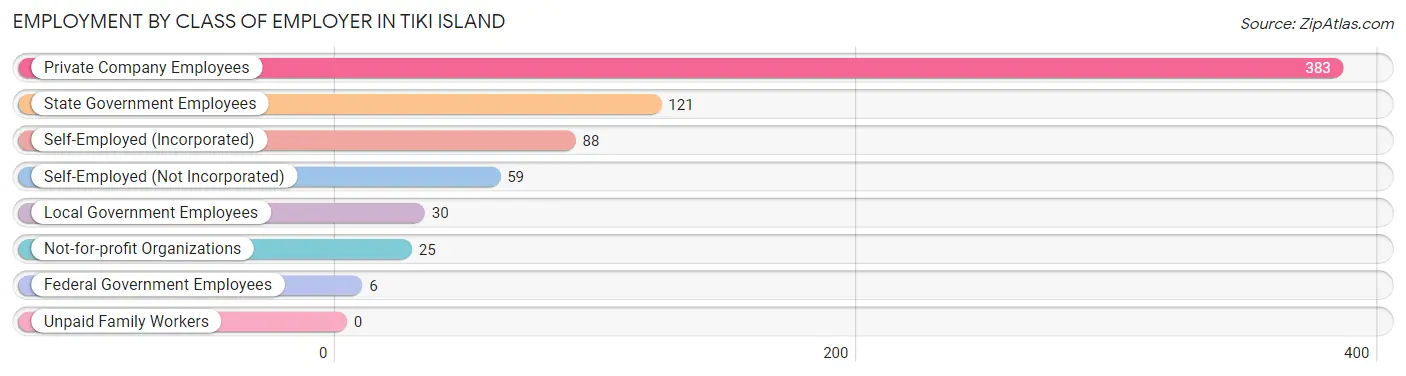
| Employer Class | # Employees | % Employees |
| Private Company Employees | 383 | 53.8% |
| Self-Employed (Incorporated) | 88 | 12.4% |
| Self-Employed (Not Incorporated) | 59 | 8.3% |
| Not-for-profit Organizations | 25 | 3.5% |
| Local Government Employees | 30 | 4.2% |
| State Government Employees | 121 | 17.0% |
| Federal Government Employees | 6 | 0.8% |
| Unpaid Family Workers | 0 | 0.0% |
| Total | 712 | 100.0% |
Employment Status by Age in Tiki Island
According to the labor force statistics for Tiki Island, out of the total population over 16 years of age (1,164), 62.5% or 728 individuals are in the labor force, with 1.8% or 13 of them unemployed. The age group with the highest labor force participation rate is 20 to 24 years, with 100.0% or 30 individuals in the labor force. Within the labor force, the 75 years and over age range has the highest percentage of unemployed individuals, with 30.4% or 7 of them being unemployed.
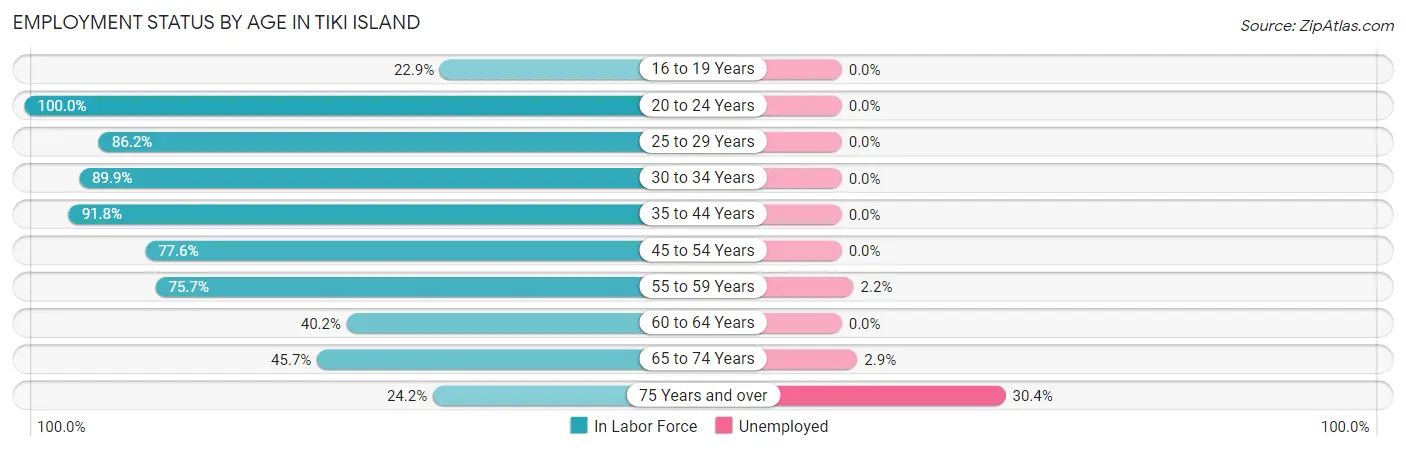
| Age Bracket | In Labor Force | Unemployed |
| 16 to 19 Years | 8 (22.9%) | 0 (0.0%) |
| 20 to 24 Years | 30 (100.0%) | 0 (0.0%) |
| 25 to 29 Years | 25 (86.2%) | 0 (0.0%) |
| 30 to 34 Years | 71 (89.9%) | 0 (0.0%) |
| 35 to 44 Years | 89 (91.8%) | 0 (0.0%) |
| 45 to 54 Years | 177 (77.6%) | 0 (0.0%) |
| 55 to 59 Years | 134 (75.7%) | 3 (2.2%) |
| 60 to 64 Years | 66 (40.2%) | 0 (0.0%) |
| 65 to 74 Years | 105 (45.7%) | 3 (2.9%) |
| 75 Years and over | 23 (24.2%) | 7 (30.4%) |
| Total | 728 (62.5%) | 13 (1.8%) |
Employment Status by Educational Attainment in Tiki Island
According to labor force statistics for Tiki Island, 72.6% of individuals (562) out of the total population between 25 and 64 years of age (774) are in the labor force, with 0.5% or 3 of them being unemployed. The group with the highest labor force participation rate are those with the educational attainment of bachelor's degree or higher, with 73.5% or 299 individuals in the labor force. Within the labor force, individuals with bachelor's degree or higher education have the highest percentage of unemployment, with 1.0% or 3 of them being unemployed.
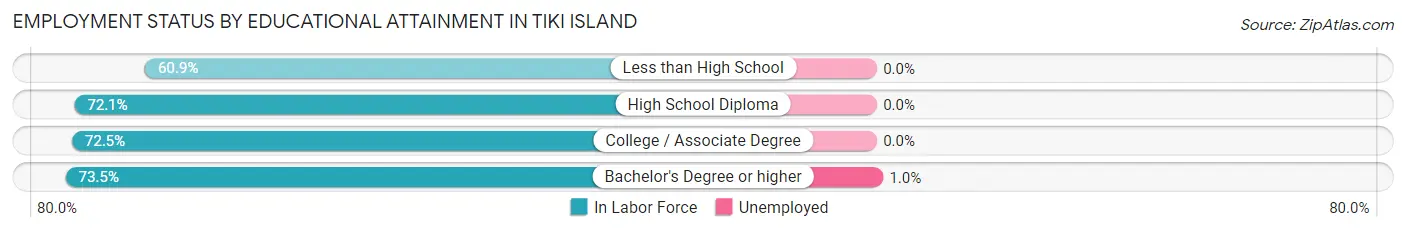
| Educational Attainment | In Labor Force | Unemployed |
| Less than High School | 14 (60.9%) | 0 (0.0%) |
| High School Diploma | 101 (72.1%) | 0 (0.0%) |
| College / Associate Degree | 148 (72.5%) | 0 (0.0%) |
| Bachelor's Degree or higher | 299 (73.5%) | 4 (1.0%) |
| Total | 562 (72.6%) | 4 (0.5%) |
Employment Occupations by Sex in Tiki Island
Management, Business, Science and Arts Occupations
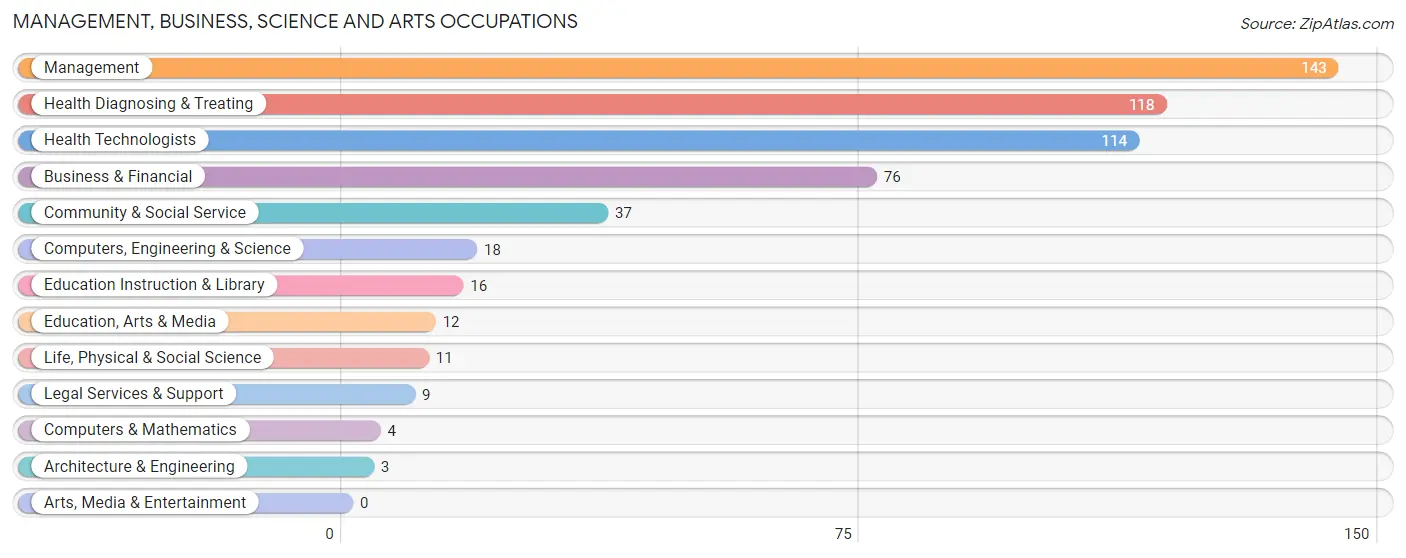
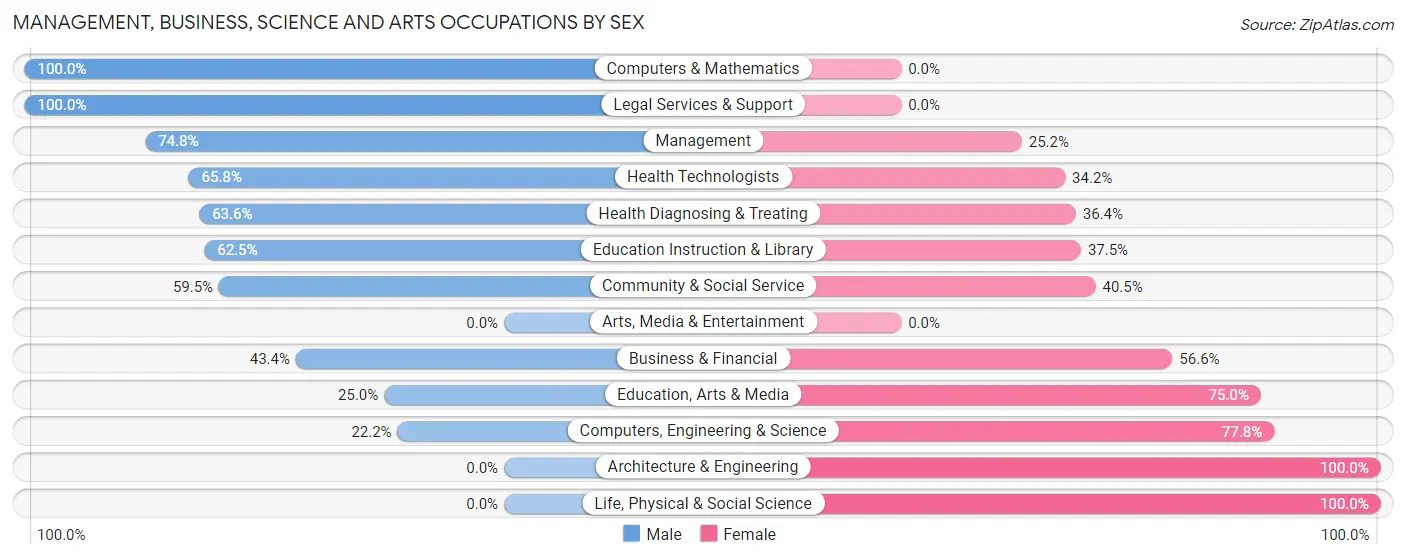
The most common Management, Business, Science and Arts occupations in Tiki Island are Management (143 | 20.0%), Health Diagnosing & Treating (118 | 16.5%), Health Technologists (114 | 15.9%), Business & Financial (76 | 10.6%), and Community & Social Service (37 | 5.2%).
Management, Business, Science and Arts Occupations by Sex
Within the Management, Business, Science and Arts occupations in Tiki Island, the most male-oriented occupations are Computers & Mathematics (100.0%), Legal Services & Support (100.0%), and Management (74.8%), while the most female-oriented occupations are Architecture & Engineering (100.0%), Life, Physical & Social Science (100.0%), and Computers, Engineering & Science (77.8%).
| Occupation | Male | Female |
| Management | 107 (74.8%) | 36 (25.2%) |
| Business & Financial | 33 (43.4%) | 43 (56.6%) |
| Computers, Engineering & Science | 4 (22.2%) | 14 (77.8%) |
| Computers & Mathematics | 4 (100.0%) | 0 (0.0%) |
| Architecture & Engineering | 0 (0.0%) | 3 (100.0%) |
| Life, Physical & Social Science | 0 (0.0%) | 11 (100.0%) |
| Community & Social Service | 22 (59.5%) | 15 (40.5%) |
| Education, Arts & Media | 3 (25.0%) | 9 (75.0%) |
| Legal Services & Support | 9 (100.0%) | 0 (0.0%) |
| Education Instruction & Library | 10 (62.5%) | 6 (37.5%) |
| Arts, Media & Entertainment | 0 (0.0%) | 0 (0.0%) |
| Health Diagnosing & Treating | 75 (63.6%) | 43 (36.4%) |
| Health Technologists | 75 (65.8%) | 39 (34.2%) |
| Total (Category) | 241 (61.5%) | 151 (38.5%) |
| Total (Overall) | 452 (63.2%) | 263 (36.8%) |
Services Occupations
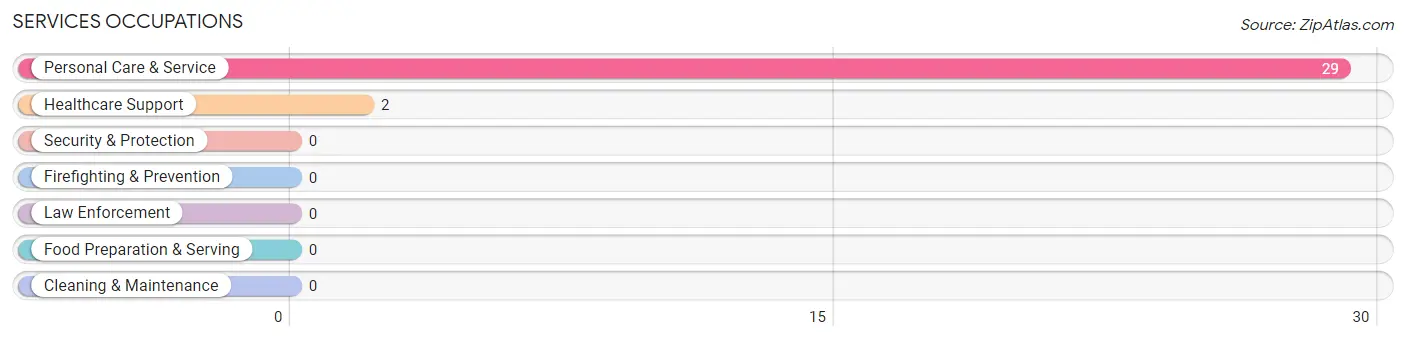
The most common Services occupations in Tiki Island are Personal Care & Service (29 | 4.1%), and Healthcare Support (2 | 0.3%).
Services Occupations by Sex
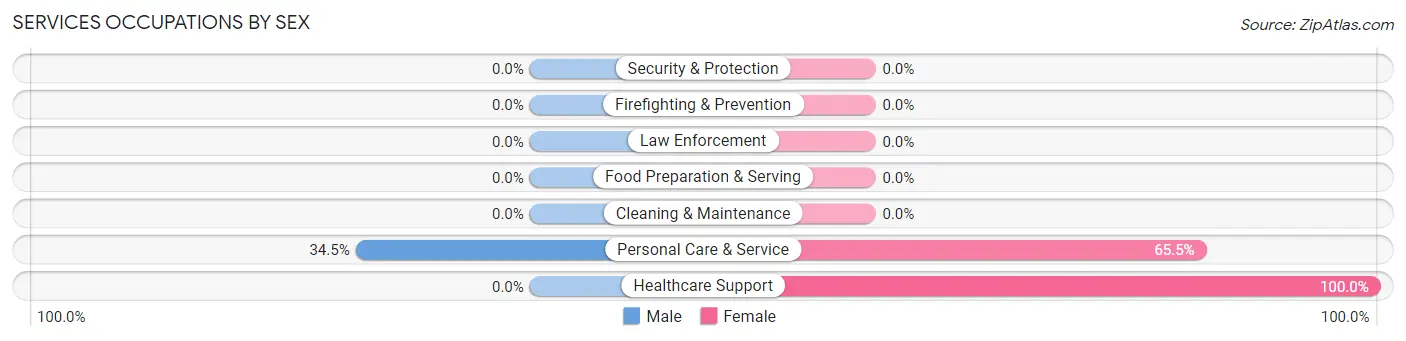
| Occupation | Male | Female |
| Healthcare Support | 0 (0.0%) | 2 (100.0%) |
| Security & Protection | 0 (0.0%) | 0 (0.0%) |
| Firefighting & Prevention | 0 (0.0%) | 0 (0.0%) |
| Law Enforcement | 0 (0.0%) | 0 (0.0%) |
| Food Preparation & Serving | 0 (0.0%) | 0 (0.0%) |
| Cleaning & Maintenance | 0 (0.0%) | 0 (0.0%) |
| Personal Care & Service | 10 (34.5%) | 19 (65.5%) |
| Total (Category) | 10 (32.3%) | 21 (67.7%) |
| Total (Overall) | 452 (63.2%) | 263 (36.8%) |
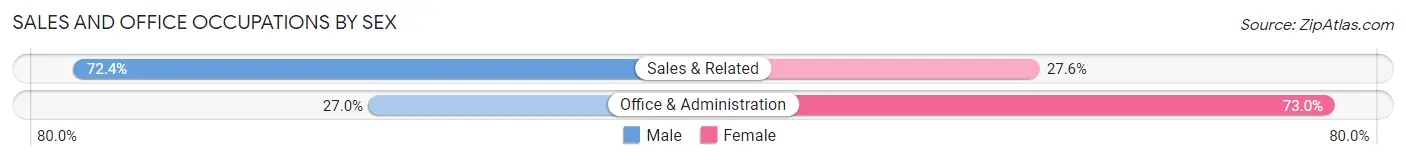
Sales and Office Occupations
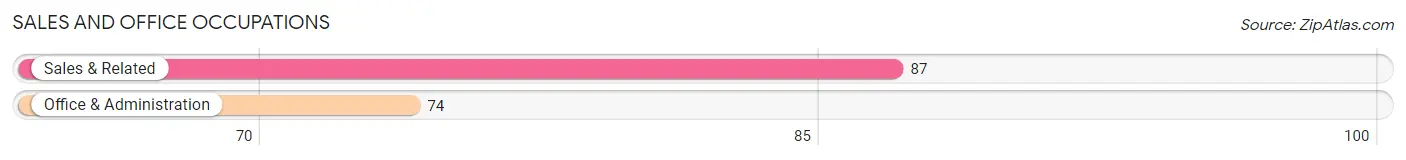
The most common Sales and Office occupations in Tiki Island are Sales & Related (87 | 12.2%), and Office & Administration (74 | 10.3%).
Sales and Office Occupations by Sex
| Occupation | Male | Female |
| Sales & Related | 63 (72.4%) | 24 (27.6%) |
| Office & Administration | 20 (27.0%) | 54 (73.0%) |
| Total (Category) | 83 (51.5%) | 78 (48.4%) |
| Total (Overall) | 452 (63.2%) | 263 (36.8%) |
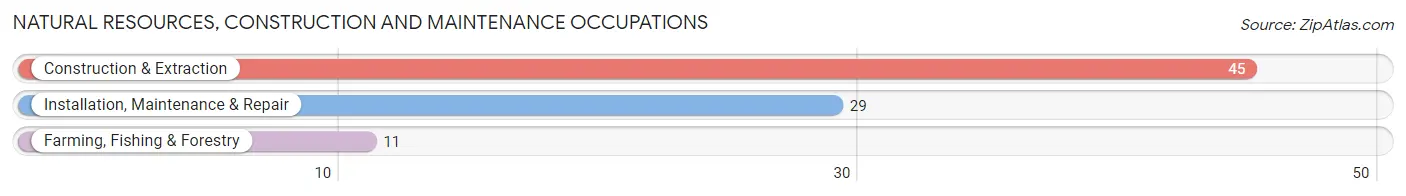
Natural Resources, Construction and Maintenance Occupations
The most common Natural Resources, Construction and Maintenance occupations in Tiki Island are Construction & Extraction (45 | 6.3%), Installation, Maintenance & Repair (29 | 4.1%), and Farming, Fishing & Forestry (11 | 1.5%).
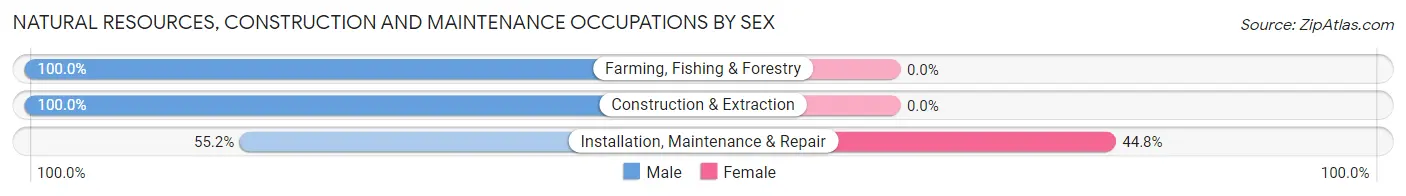
Natural Resources, Construction and Maintenance Occupations by Sex
| Occupation | Male | Female |
| Farming, Fishing & Forestry | 11 (100.0%) | 0 (0.0%) |
| Construction & Extraction | 45 (100.0%) | 0 (0.0%) |
| Installation, Maintenance & Repair | 16 (55.2%) | 13 (44.8%) |
| Total (Category) | 72 (84.7%) | 13 (15.3%) |
| Total (Overall) | 452 (63.2%) | 263 (36.8%) |
Production, Transportation and Moving Occupations
The most common Production, Transportation and Moving occupations in Tiki Island are Transportation (29 | 4.1%), and Production (17 | 2.4%).
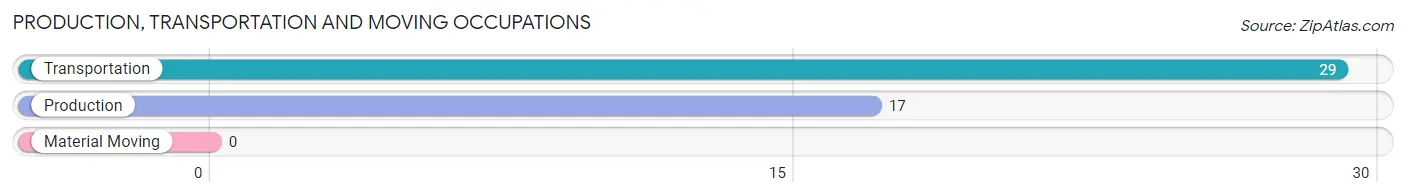
Production, Transportation and Moving Occupations by Sex

| Occupation | Male | Female |
| Production | 17 (100.0%) | 0 (0.0%) |
| Transportation | 29 (100.0%) | 0 (0.0%) |
| Material Moving | 0 (0.0%) | 0 (0.0%) |
| Total (Category) | 46 (100.0%) | 0 (0.0%) |
| Total (Overall) | 452 (63.2%) | 263 (36.8%) |
Employment Industries by Sex in Tiki Island
Employment Industries in Tiki Island
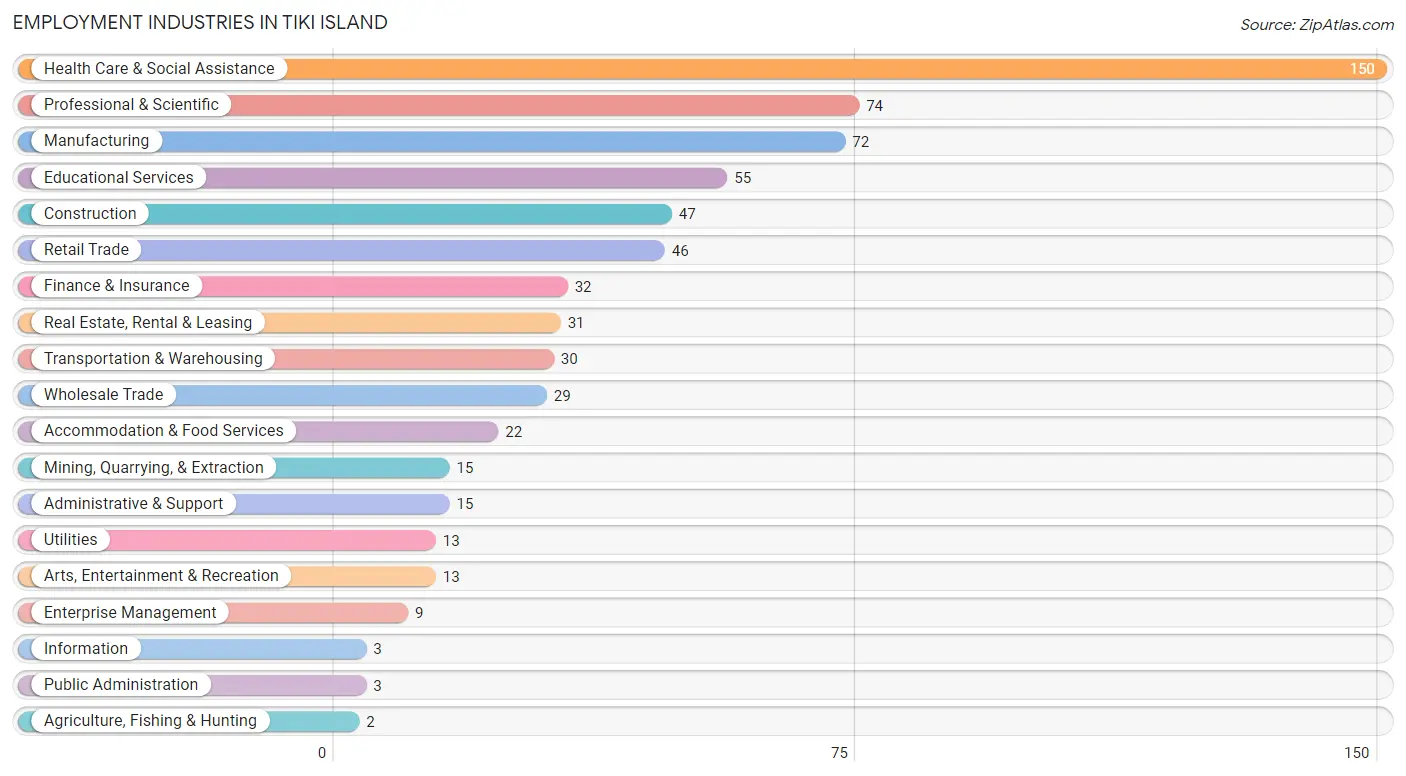
The major employment industries in Tiki Island include Health Care & Social Assistance (150 | 21.0%), Professional & Scientific (74 | 10.3%), Manufacturing (72 | 10.1%), Educational Services (55 | 7.7%), and Construction (47 | 6.6%).
Employment Industries by Sex in Tiki Island
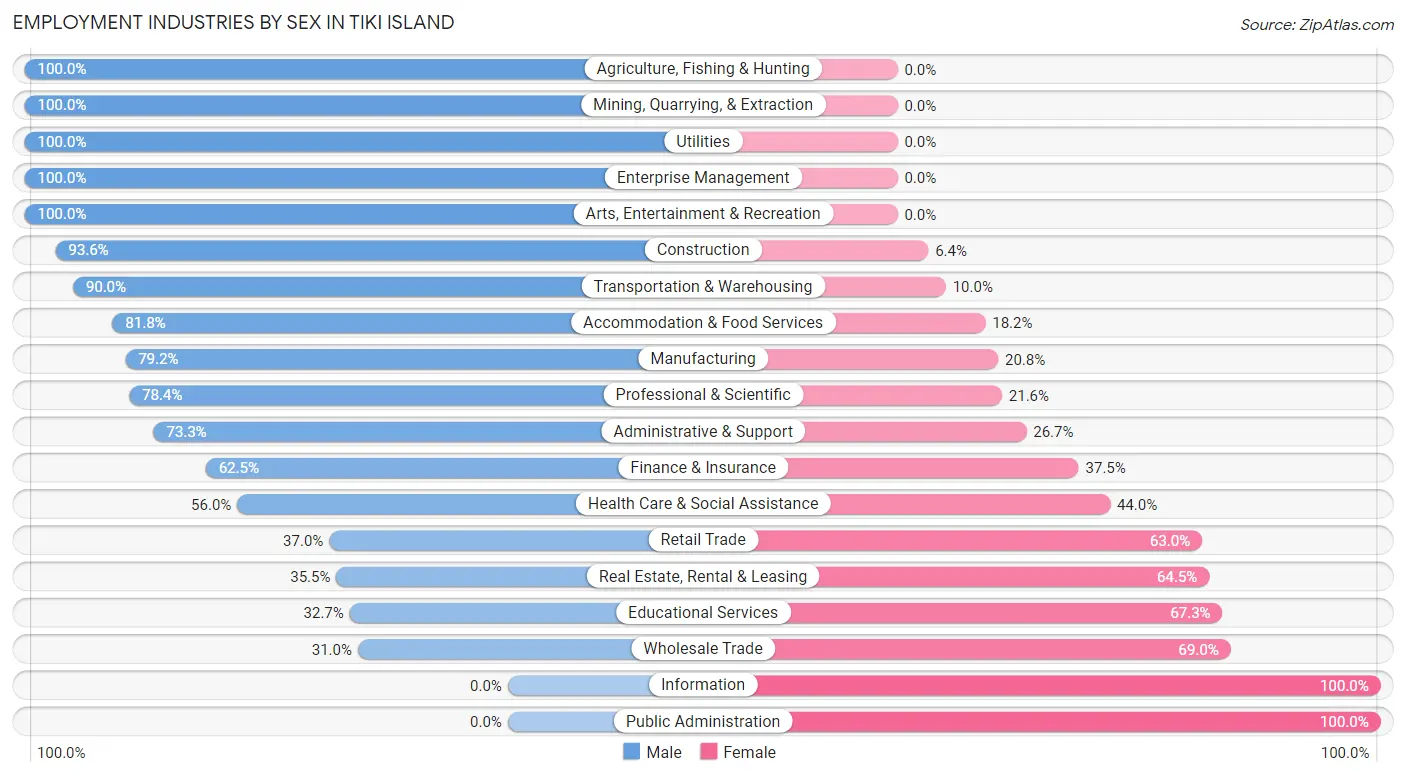
The Tiki Island industries that see more men than women are Agriculture, Fishing & Hunting (100.0%), Mining, Quarrying, & Extraction (100.0%), and Utilities (100.0%), whereas the industries that tend to have a higher number of women are Information (100.0%), Public Administration (100.0%), and Wholesale Trade (69.0%).
| Industry | Male | Female |
| Agriculture, Fishing & Hunting | 2 (100.0%) | 0 (0.0%) |
| Mining, Quarrying, & Extraction | 15 (100.0%) | 0 (0.0%) |
| Construction | 44 (93.6%) | 3 (6.4%) |
| Manufacturing | 57 (79.2%) | 15 (20.8%) |
| Wholesale Trade | 9 (31.0%) | 20 (69.0%) |
| Retail Trade | 17 (37.0%) | 29 (63.0%) |
| Transportation & Warehousing | 27 (90.0%) | 3 (10.0%) |
| Utilities | 13 (100.0%) | 0 (0.0%) |
| Information | 0 (0.0%) | 3 (100.0%) |
| Finance & Insurance | 20 (62.5%) | 12 (37.5%) |
| Real Estate, Rental & Leasing | 11 (35.5%) | 20 (64.5%) |
| Professional & Scientific | 58 (78.4%) | 16 (21.6%) |
| Enterprise Management | 9 (100.0%) | 0 (0.0%) |
| Administrative & Support | 11 (73.3%) | 4 (26.7%) |
| Educational Services | 18 (32.7%) | 37 (67.3%) |
| Health Care & Social Assistance | 84 (56.0%) | 66 (44.0%) |
| Arts, Entertainment & Recreation | 13 (100.0%) | 0 (0.0%) |
| Accommodation & Food Services | 18 (81.8%) | 4 (18.2%) |
| Public Administration | 0 (0.0%) | 3 (100.0%) |
| Total | 452 (63.2%) | 263 (36.8%) |
Education in Tiki Island
School Enrollment in Tiki Island
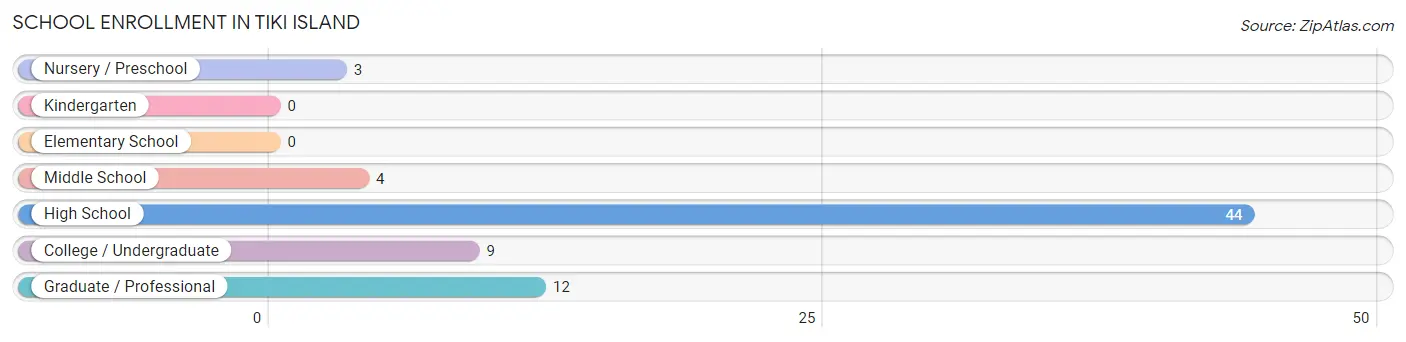
The most common levels of schooling among the 72 students in Tiki Island are high school (44 | 61.1%), graduate / professional (12 | 16.7%), and college / undergraduate (9 | 12.5%).
| School Level | # Students | % Students |
| Nursery / Preschool | 3 | 4.2% |
| Kindergarten | 0 | 0.0% |
| Elementary School | 0 | 0.0% |
| Middle School | 4 | 5.6% |
| High School | 44 | 61.1% |
| College / Undergraduate | 9 | 12.5% |
| Graduate / Professional | 12 | 16.7% |
| Total | 72 | 100.0% |
School Enrollment by Age by Funding Source in Tiki Island
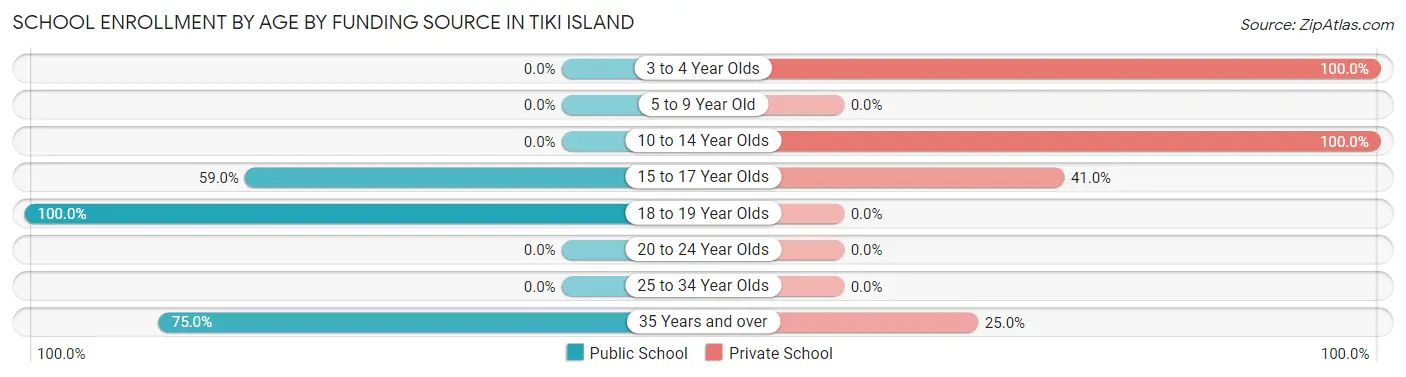
Out of a total of 72 students who are enrolled in schools in Tiki Island, 28 (38.9%) attend a private institution, while the remaining 44 (61.1%) are enrolled in public schools. The age group of 3 to 4 year olds has the highest likelihood of being enrolled in private schools, with 3 (100.0% in the age bracket) enrolled. Conversely, the age group of 18 to 19 year olds has the lowest likelihood of being enrolled in a private school, with 6 (100.0% in the age bracket) attending a public institution.
| Age Bracket | Public School | Private School |
| 3 to 4 Year Olds | 0 (0.0%) | 3 (100.0%) |
| 5 to 9 Year Old | 0 (0.0%) | 0 (0.0%) |
| 10 to 14 Year Olds | 0 (0.0%) | 4 (100.0%) |
| 15 to 17 Year Olds | 23 (59.0%) | 16 (41.0%) |
| 18 to 19 Year Olds | 6 (100.0%) | 0 (0.0%) |
| 20 to 24 Year Olds | 0 (0.0%) | 0 (0.0%) |
| 25 to 34 Year Olds | 0 (0.0%) | 0 (0.0%) |
| 35 Years and over | 15 (75.0%) | 5 (25.0%) |
| Total | 44 (61.1%) | 28 (38.9%) |
Educational Attainment by Field of Study in Tiki Island
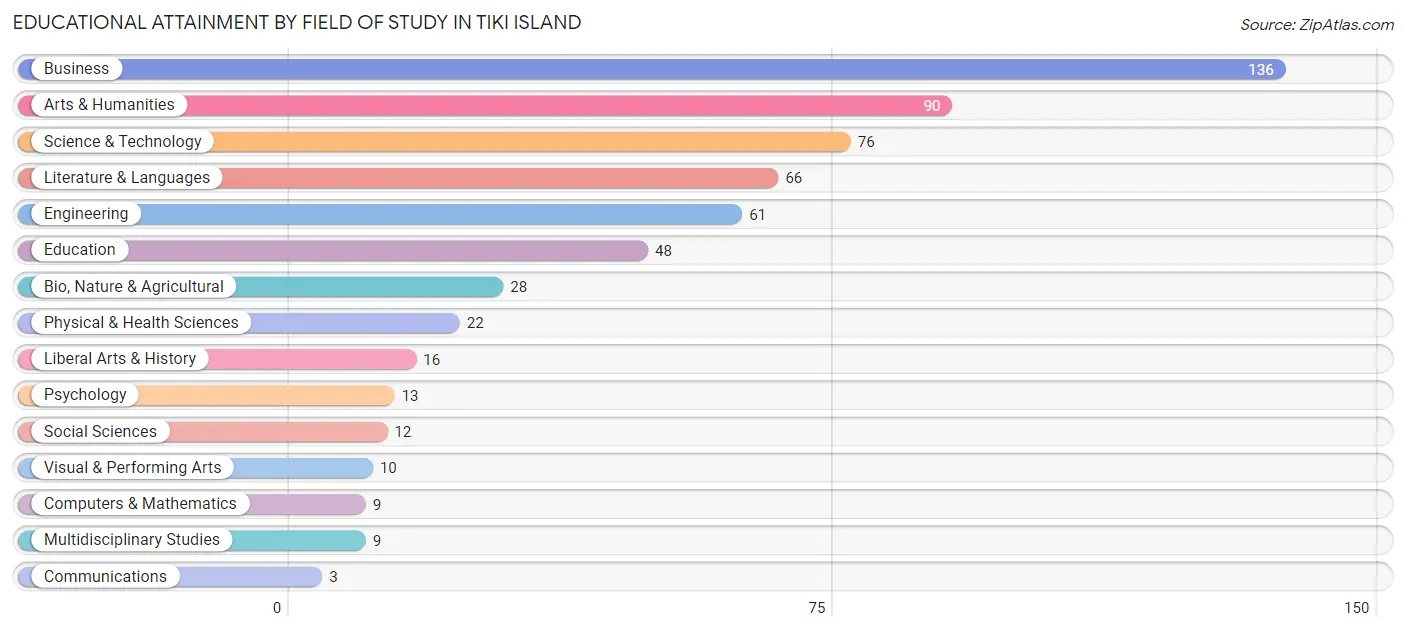
Business (136 | 22.7%), arts & humanities (90 | 15.0%), science & technology (76 | 12.7%), literature & languages (66 | 11.0%), and engineering (61 | 10.2%) are the most common fields of study among 599 individuals in Tiki Island who have obtained a bachelor's degree or higher.
| Field of Study | # Graduates | % Graduates |
| Computers & Mathematics | 9 | 1.5% |
| Bio, Nature & Agricultural | 28 | 4.7% |
| Physical & Health Sciences | 22 | 3.7% |
| Psychology | 13 | 2.2% |
| Social Sciences | 12 | 2.0% |
| Engineering | 61 | 10.2% |
| Multidisciplinary Studies | 9 | 1.5% |
| Science & Technology | 76 | 12.7% |
| Business | 136 | 22.7% |
| Education | 48 | 8.0% |
| Literature & Languages | 66 | 11.0% |
| Liberal Arts & History | 16 | 2.7% |
| Visual & Performing Arts | 10 | 1.7% |
| Communications | 3 | 0.5% |
| Arts & Humanities | 90 | 15.0% |
| Total | 599 | 100.0% |
Transportation & Commute in Tiki Island
Vehicle Availability by Sex in Tiki Island
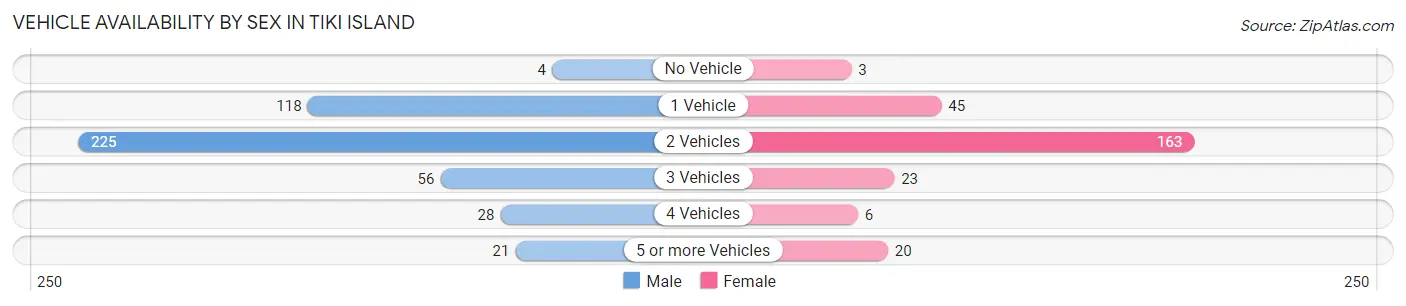
The most prevalent vehicle ownership categories in Tiki Island are males with 2 vehicles (225, accounting for 49.8%) and females with 2 vehicles (163, making up 86.5%).
| Vehicles Available | Male | Female |
| No Vehicle | 4 (0.9%) | 3 (1.1%) |
| 1 Vehicle | 118 (26.1%) | 45 (17.3%) |
| 2 Vehicles | 225 (49.8%) | 163 (62.7%) |
| 3 Vehicles | 56 (12.4%) | 23 (8.8%) |
| 4 Vehicles | 28 (6.2%) | 6 (2.3%) |
| 5 or more Vehicles | 21 (4.6%) | 20 (7.7%) |
| Total | 452 (100.0%) | 260 (100.0%) |
Commute Time in Tiki Island
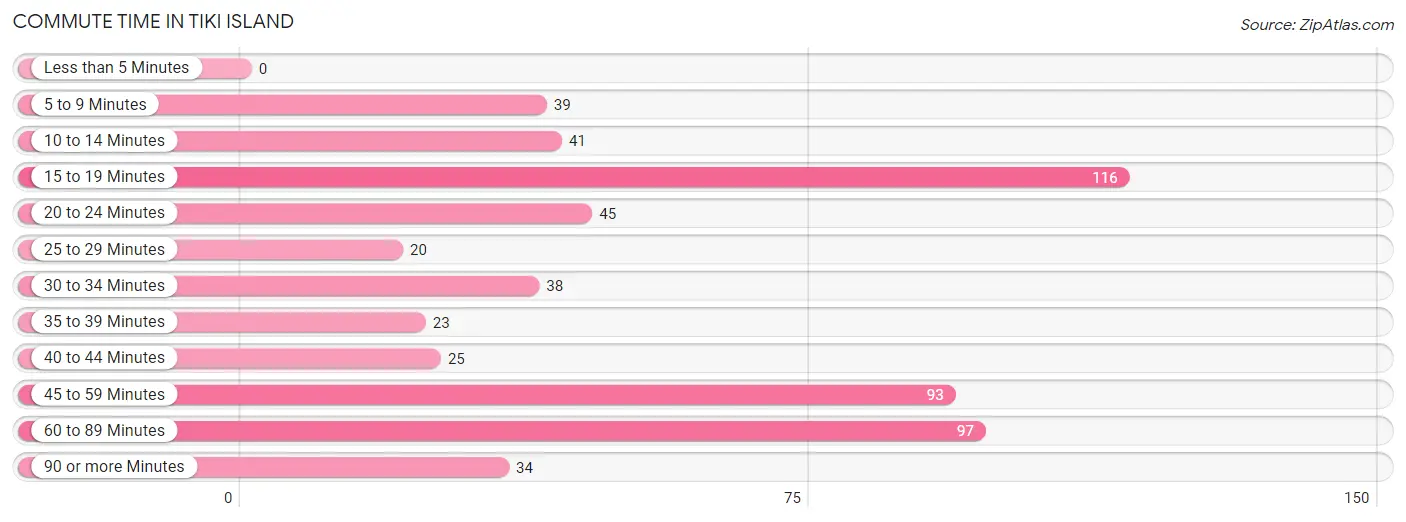
The most frequently occuring commute durations in Tiki Island are 15 to 19 minutes (116 commuters, 20.3%), 60 to 89 minutes (97 commuters, 17.0%), and 45 to 59 minutes (93 commuters, 16.3%).
| Commute Time | # Commuters | % Commuters |
| Less than 5 Minutes | 0 | 0.0% |
| 5 to 9 Minutes | 39 | 6.8% |
| 10 to 14 Minutes | 41 | 7.2% |
| 15 to 19 Minutes | 116 | 20.3% |
| 20 to 24 Minutes | 45 | 7.9% |
| 25 to 29 Minutes | 20 | 3.5% |
| 30 to 34 Minutes | 38 | 6.7% |
| 35 to 39 Minutes | 23 | 4.0% |
| 40 to 44 Minutes | 25 | 4.4% |
| 45 to 59 Minutes | 93 | 16.3% |
| 60 to 89 Minutes | 97 | 17.0% |
| 90 or more Minutes | 34 | 5.9% |
Commute Time by Sex in Tiki Island
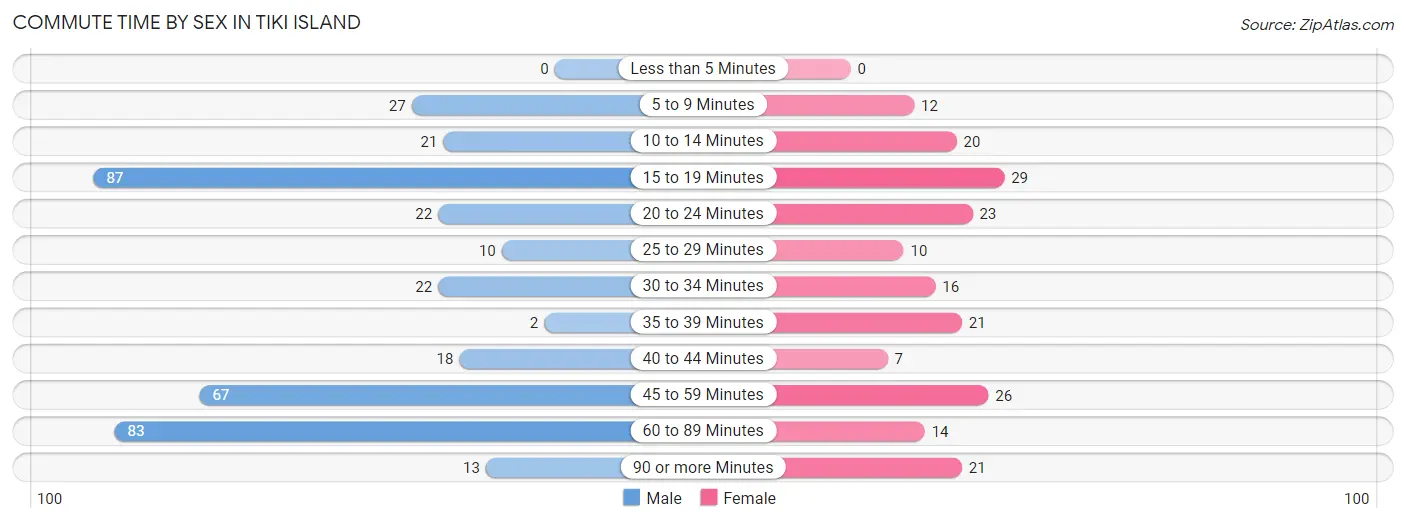
The most common commute times in Tiki Island are 15 to 19 minutes (87 commuters, 23.4%) for males and 15 to 19 minutes (29 commuters, 14.6%) for females.
| Commute Time | Male | Female |
| Less than 5 Minutes | 0 (0.0%) | 0 (0.0%) |
| 5 to 9 Minutes | 27 (7.3%) | 12 (6.0%) |
| 10 to 14 Minutes | 21 (5.7%) | 20 (10.1%) |
| 15 to 19 Minutes | 87 (23.4%) | 29 (14.6%) |
| 20 to 24 Minutes | 22 (5.9%) | 23 (11.6%) |
| 25 to 29 Minutes | 10 (2.7%) | 10 (5.0%) |
| 30 to 34 Minutes | 22 (5.9%) | 16 (8.0%) |
| 35 to 39 Minutes | 2 (0.5%) | 21 (10.5%) |
| 40 to 44 Minutes | 18 (4.8%) | 7 (3.5%) |
| 45 to 59 Minutes | 67 (18.0%) | 26 (13.1%) |
| 60 to 89 Minutes | 83 (22.3%) | 14 (7.0%) |
| 90 or more Minutes | 13 (3.5%) | 21 (10.5%) |
Time of Departure to Work by Sex in Tiki Island
The most frequent times of departure to work in Tiki Island are 5:30 AM to 5:59 AM (74, 19.9%) for males and 7:30 AM to 7:59 AM (54, 27.1%) for females.
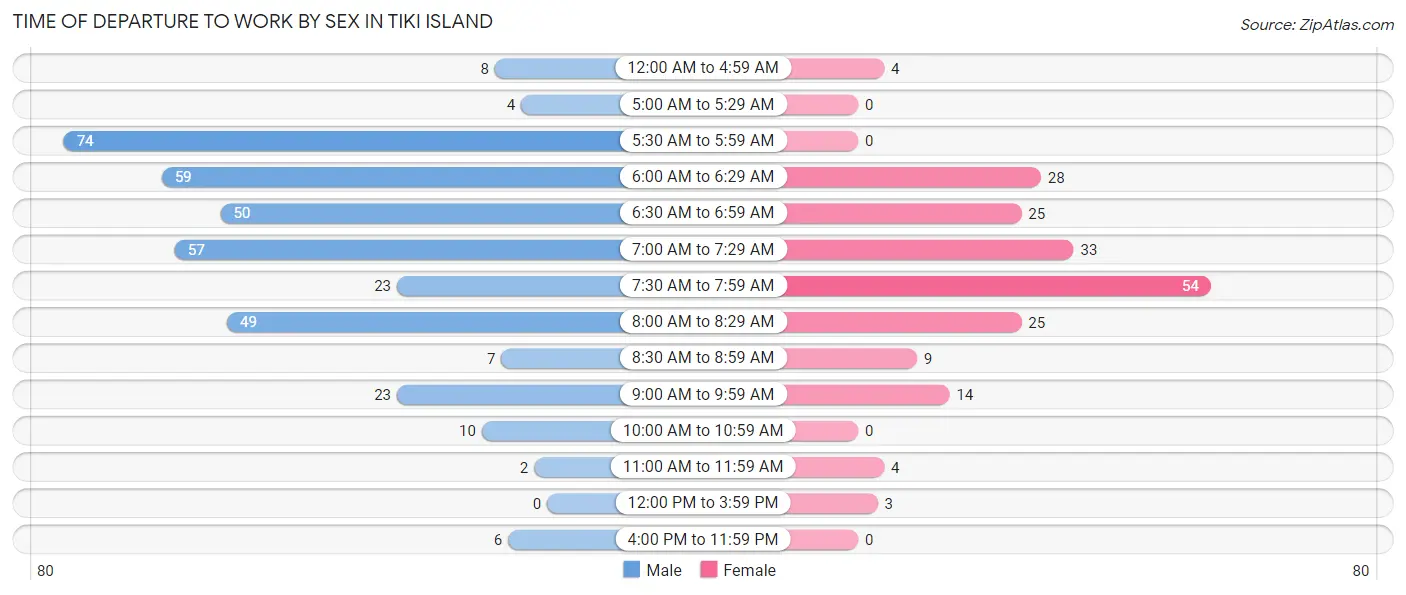
| Time of Departure | Male | Female |
| 12:00 AM to 4:59 AM | 8 (2.1%) | 4 (2.0%) |
| 5:00 AM to 5:29 AM | 4 (1.1%) | 0 (0.0%) |
| 5:30 AM to 5:59 AM | 74 (19.9%) | 0 (0.0%) |
| 6:00 AM to 6:29 AM | 59 (15.9%) | 28 (14.1%) |
| 6:30 AM to 6:59 AM | 50 (13.4%) | 25 (12.6%) |
| 7:00 AM to 7:29 AM | 57 (15.3%) | 33 (16.6%) |
| 7:30 AM to 7:59 AM | 23 (6.2%) | 54 (27.1%) |
| 8:00 AM to 8:29 AM | 49 (13.2%) | 25 (12.6%) |
| 8:30 AM to 8:59 AM | 7 (1.9%) | 9 (4.5%) |
| 9:00 AM to 9:59 AM | 23 (6.2%) | 14 (7.0%) |
| 10:00 AM to 10:59 AM | 10 (2.7%) | 0 (0.0%) |
| 11:00 AM to 11:59 AM | 2 (0.5%) | 4 (2.0%) |
| 12:00 PM to 3:59 PM | 0 (0.0%) | 3 (1.5%) |
| 4:00 PM to 11:59 PM | 6 (1.6%) | 0 (0.0%) |
| Total | 372 (100.0%) | 199 (100.0%) |
Housing Occupancy in Tiki Island
Occupancy by Ownership in Tiki Island
Of the total 702 dwellings in Tiki Island, owner-occupied units account for 579 (82.5%), while renter-occupied units make up 123 (17.5%).
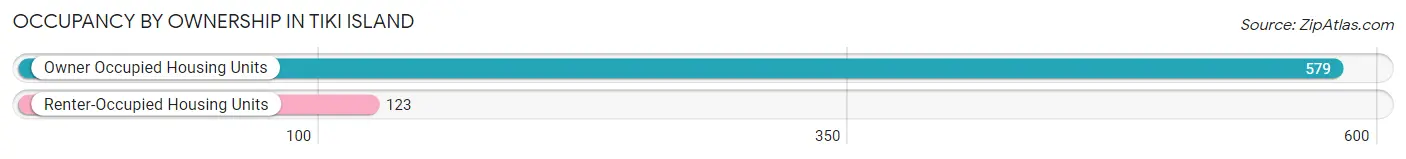
| Occupancy | # Housing Units | % Housing Units |
| Owner Occupied Housing Units | 579 | 82.5% |
| Renter-Occupied Housing Units | 123 | 17.5% |
| Total Occupied Housing Units | 702 | 100.0% |
Occupancy by Household Size in Tiki Island
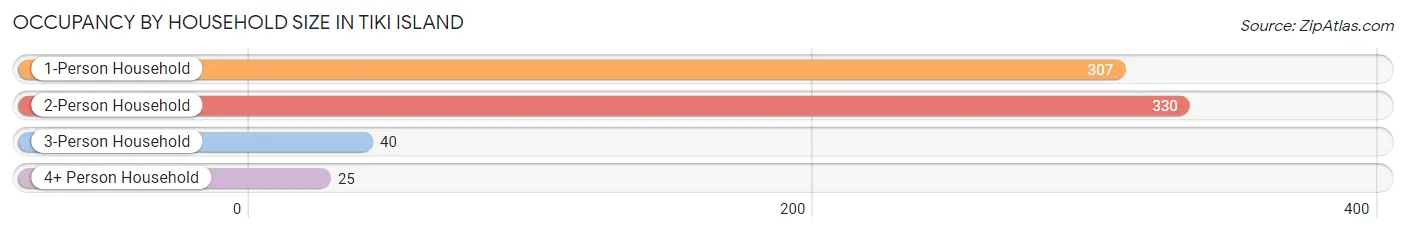
| Household Size | # Housing Units | % Housing Units |
| 1-Person Household | 307 | 43.7% |
| 2-Person Household | 330 | 47.0% |
| 3-Person Household | 40 | 5.7% |
| 4+ Person Household | 25 | 3.6% |
| Total Housing Units | 702 | 100.0% |
Occupancy by Ownership by Household Size in Tiki Island
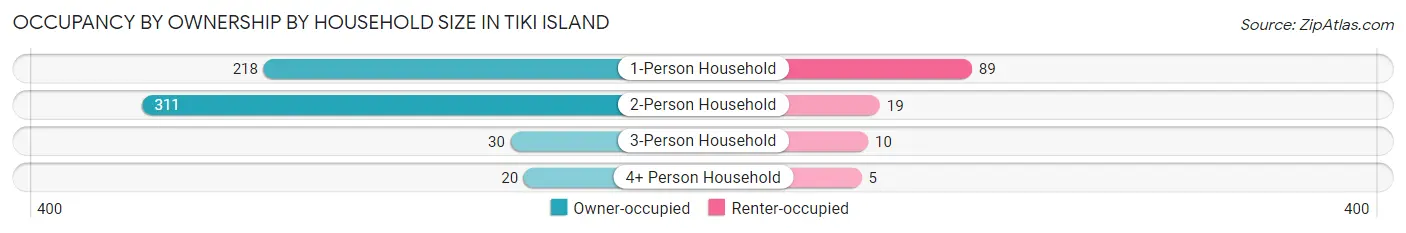
| Household Size | Owner-occupied | Renter-occupied |
| 1-Person Household | 218 (71.0%) | 89 (29.0%) |
| 2-Person Household | 311 (94.2%) | 19 (5.8%) |
| 3-Person Household | 30 (75.0%) | 10 (25.0%) |
| 4+ Person Household | 20 (80.0%) | 5 (20.0%) |
| Total Housing Units | 579 (82.5%) | 123 (17.5%) |
Occupancy by Educational Attainment in Tiki Island
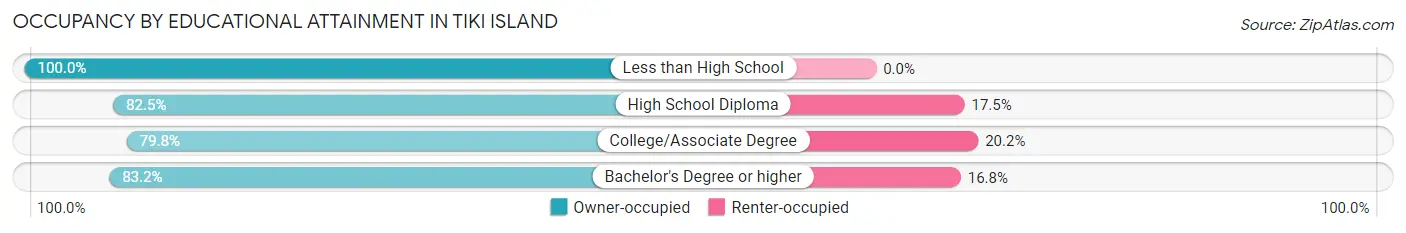
| Household Size | Owner-occupied | Renter-occupied |
| Less than High School | 8 (100.0%) | 0 (0.0%) |
| High School Diploma | 80 (82.5%) | 17 (17.5%) |
| College/Associate Degree | 134 (79.8%) | 34 (20.2%) |
| Bachelor's Degree or higher | 357 (83.2%) | 72 (16.8%) |
Occupancy by Age of Householder in Tiki Island
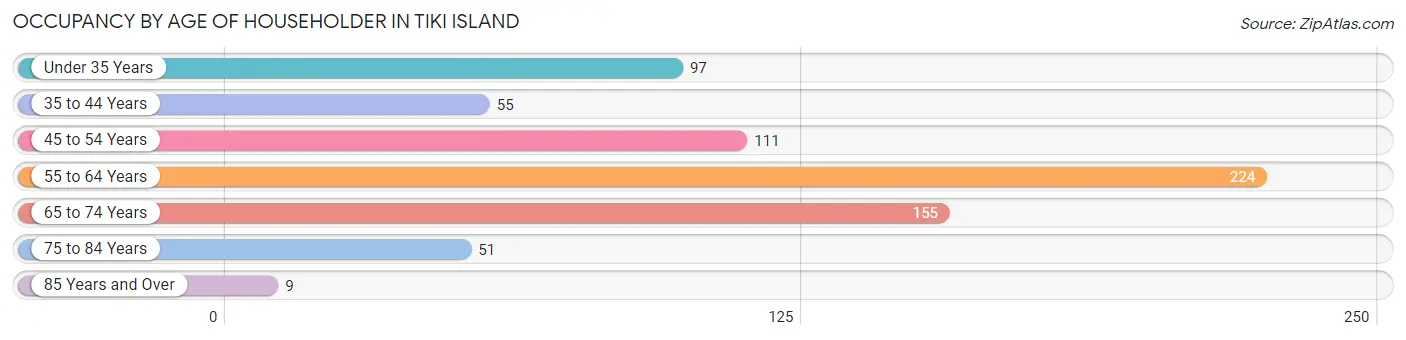
| Age Bracket | # Households | % Households |
| Under 35 Years | 97 | 13.8% |
| 35 to 44 Years | 55 | 7.8% |
| 45 to 54 Years | 111 | 15.8% |
| 55 to 64 Years | 224 | 31.9% |
| 65 to 74 Years | 155 | 22.1% |
| 75 to 84 Years | 51 | 7.3% |
| 85 Years and Over | 9 | 1.3% |
| Total | 702 | 100.0% |
Housing Finances in Tiki Island
Median Income by Occupancy in Tiki Island

| Occupancy Type | # Households | Median Income |
| Owner-Occupied | 579 (82.5%) | $134,688 |
| Renter-Occupied | 123 (17.5%) | $64,375 |
| Average | 702 (100.0%) | $112,054 |
Occupancy by Householder Income Bracket in Tiki Island
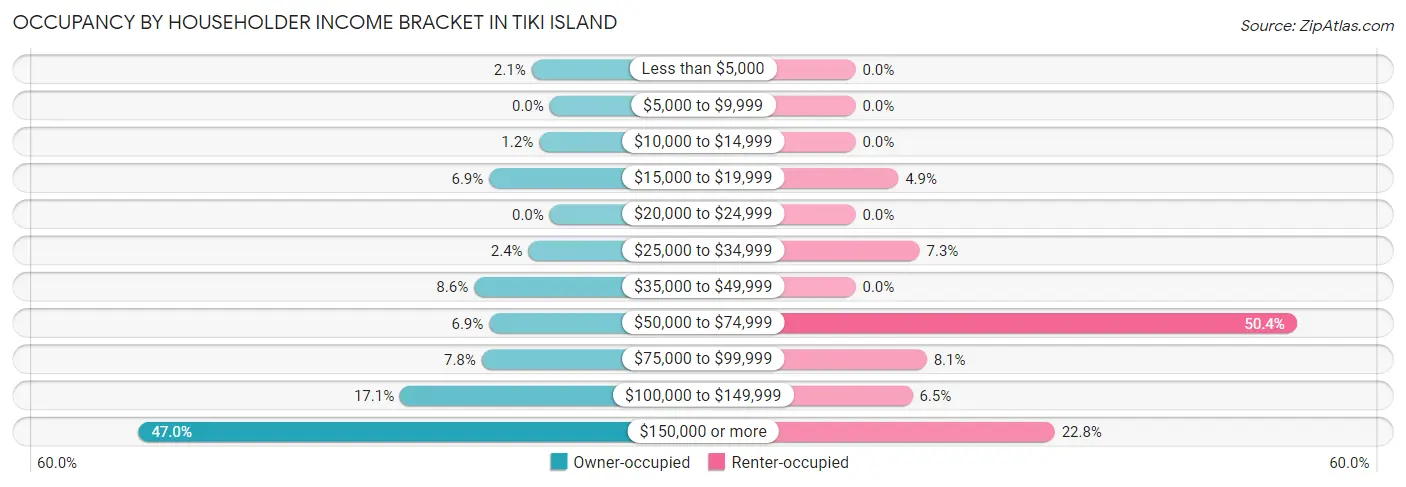
| Income Bracket | Owner-occupied | Renter-occupied |
| Less than $5,000 | 12 (2.1%) | 0 (0.0%) |
| $5,000 to $9,999 | 0 (0.0%) | 0 (0.0%) |
| $10,000 to $14,999 | 7 (1.2%) | 0 (0.0%) |
| $15,000 to $19,999 | 40 (6.9%) | 6 (4.9%) |
| $20,000 to $24,999 | 0 (0.0%) | 0 (0.0%) |
| $25,000 to $34,999 | 14 (2.4%) | 9 (7.3%) |
| $35,000 to $49,999 | 50 (8.6%) | 0 (0.0%) |
| $50,000 to $74,999 | 40 (6.9%) | 62 (50.4%) |
| $75,000 to $99,999 | 45 (7.8%) | 10 (8.1%) |
| $100,000 to $149,999 | 99 (17.1%) | 8 (6.5%) |
| $150,000 or more | 272 (47.0%) | 28 (22.8%) |
| Total | 579 (100.0%) | 123 (100.0%) |
Monthly Housing Cost Tiers in Tiki Island
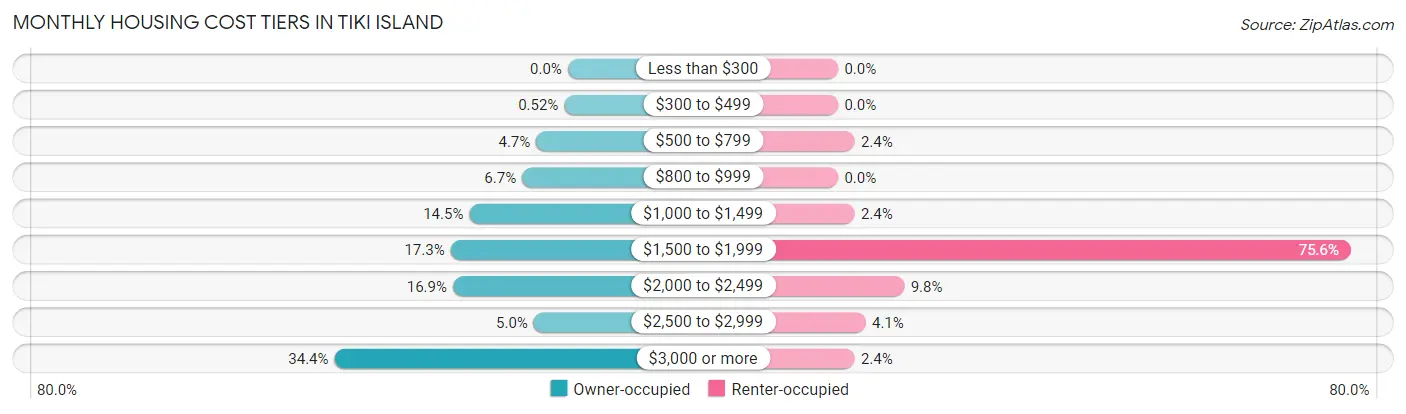
| Monthly Cost | Owner-occupied | Renter-occupied |
| Less than $300 | 0 (0.0%) | 0 (0.0%) |
| $300 to $499 | 3 (0.5%) | 0 (0.0%) |
| $500 to $799 | 27 (4.7%) | 3 (2.4%) |
| $800 to $999 | 39 (6.7%) | 0 (0.0%) |
| $1,000 to $1,499 | 84 (14.5%) | 3 (2.4%) |
| $1,500 to $1,999 | 100 (17.3%) | 93 (75.6%) |
| $2,000 to $2,499 | 98 (16.9%) | 12 (9.8%) |
| $2,500 to $2,999 | 29 (5.0%) | 5 (4.1%) |
| $3,000 or more | 199 (34.4%) | 3 (2.4%) |
| Total | 579 (100.0%) | 123 (100.0%) |
Physical Housing Characteristics in Tiki Island
Housing Structures in Tiki Island
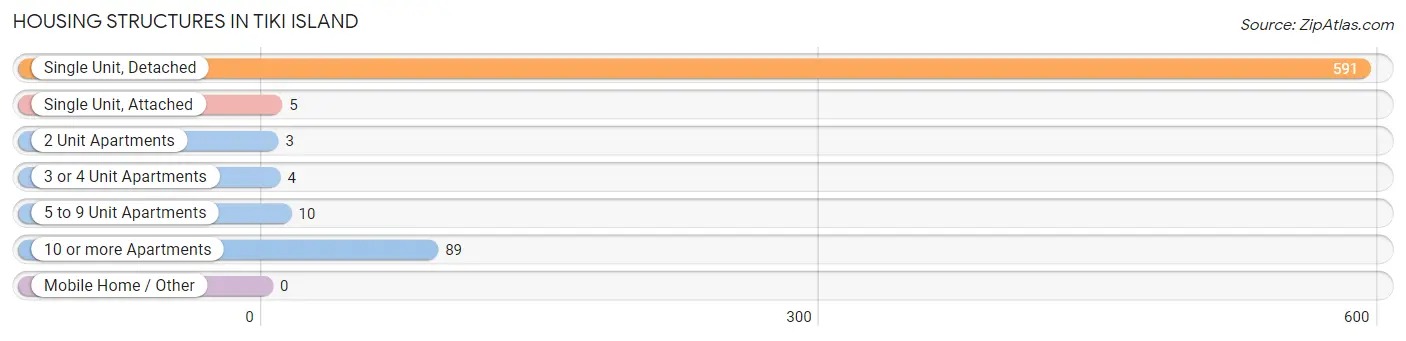
| Structure Type | # Housing Units | % Housing Units |
| Single Unit, Detached | 591 | 84.2% |
| Single Unit, Attached | 5 | 0.7% |
| 2 Unit Apartments | 3 | 0.4% |
| 3 or 4 Unit Apartments | 4 | 0.6% |
| 5 to 9 Unit Apartments | 10 | 1.4% |
| 10 or more Apartments | 89 | 12.7% |
| Mobile Home / Other | 0 | 0.0% |
| Total | 702 | 100.0% |
Housing Structures by Occupancy in Tiki Island
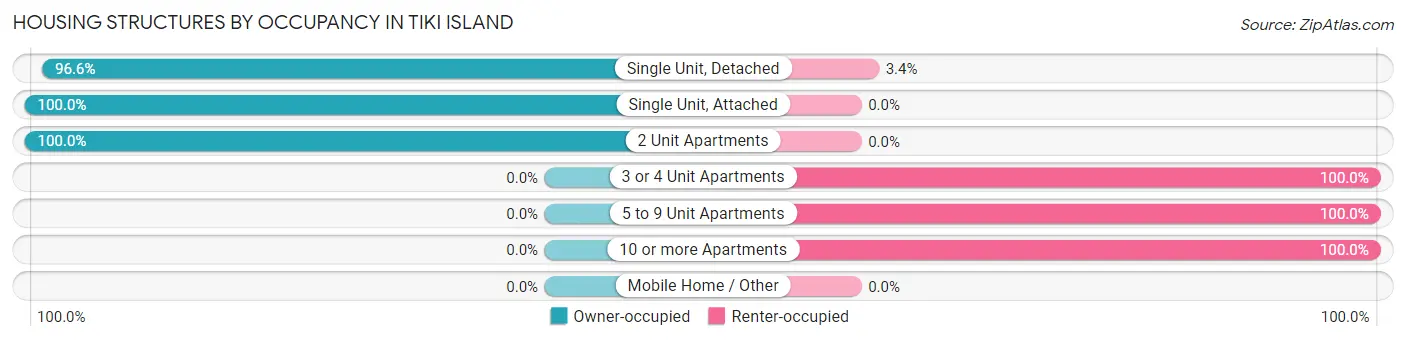
| Structure Type | Owner-occupied | Renter-occupied |
| Single Unit, Detached | 571 (96.6%) | 20 (3.4%) |
| Single Unit, Attached | 5 (100.0%) | 0 (0.0%) |
| 2 Unit Apartments | 3 (100.0%) | 0 (0.0%) |
| 3 or 4 Unit Apartments | 0 (0.0%) | 4 (100.0%) |
| 5 to 9 Unit Apartments | 0 (0.0%) | 10 (100.0%) |
| 10 or more Apartments | 0 (0.0%) | 89 (100.0%) |
| Mobile Home / Other | 0 (0.0%) | 0 (0.0%) |
| Total | 579 (82.5%) | 123 (17.5%) |
Housing Structures by Number of Rooms in Tiki Island
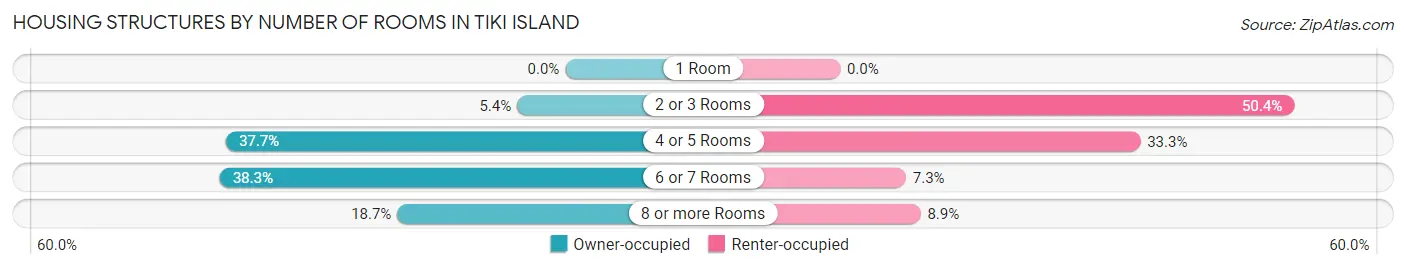
| Number of Rooms | Owner-occupied | Renter-occupied |
| 1 Room | 0 (0.0%) | 0 (0.0%) |
| 2 or 3 Rooms | 31 (5.3%) | 62 (50.4%) |
| 4 or 5 Rooms | 218 (37.7%) | 41 (33.3%) |
| 6 or 7 Rooms | 222 (38.3%) | 9 (7.3%) |
| 8 or more Rooms | 108 (18.6%) | 11 (8.9%) |
| Total | 579 (100.0%) | 123 (100.0%) |
Housing Structure by Heating Type in Tiki Island
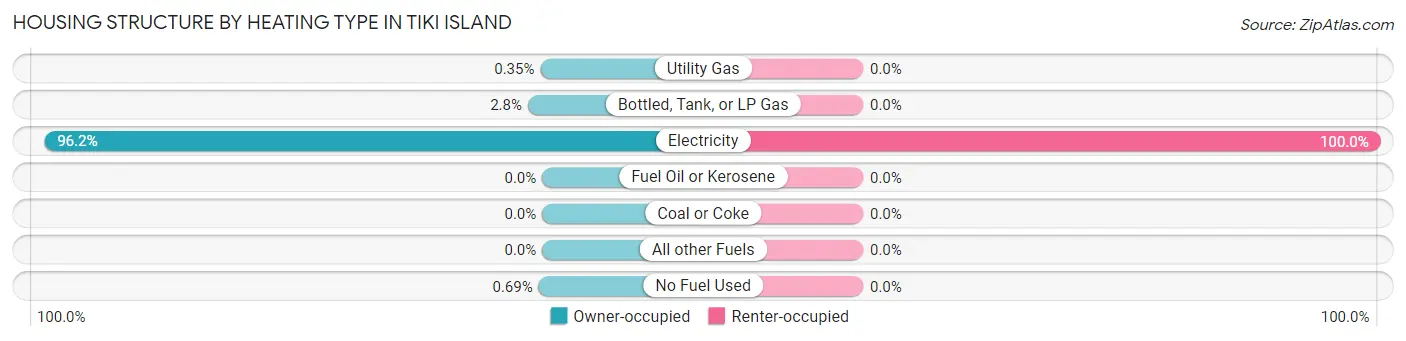
| Heating Type | Owner-occupied | Renter-occupied |
| Utility Gas | 2 (0.4%) | 0 (0.0%) |
| Bottled, Tank, or LP Gas | 16 (2.8%) | 0 (0.0%) |
| Electricity | 557 (96.2%) | 123 (100.0%) |
| Fuel Oil or Kerosene | 0 (0.0%) | 0 (0.0%) |
| Coal or Coke | 0 (0.0%) | 0 (0.0%) |
| All other Fuels | 0 (0.0%) | 0 (0.0%) |
| No Fuel Used | 4 (0.7%) | 0 (0.0%) |
| Total | 579 (100.0%) | 123 (100.0%) |
Household Vehicle Usage in Tiki Island
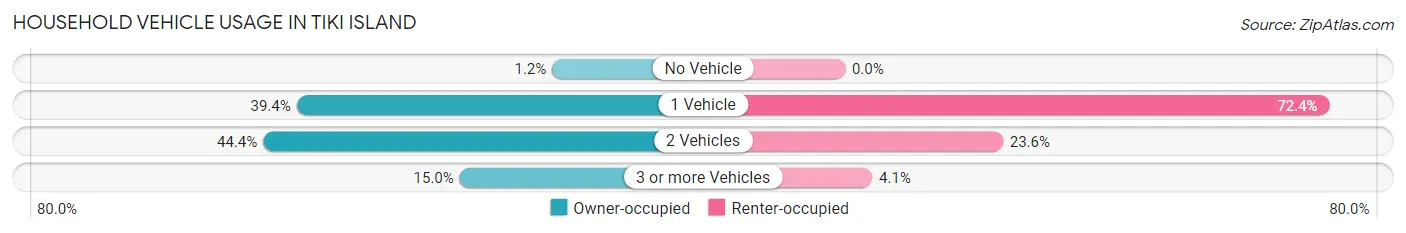
| Vehicles per Household | Owner-occupied | Renter-occupied |
| No Vehicle | 7 (1.2%) | 0 (0.0%) |
| 1 Vehicle | 228 (39.4%) | 89 (72.4%) |
| 2 Vehicles | 257 (44.4%) | 29 (23.6%) |
| 3 or more Vehicles | 87 (15.0%) | 5 (4.1%) |
| Total | 579 (100.0%) | 123 (100.0%) |
Real Estate & Mortgages in Tiki Island
Real Estate and Mortgage Overview in Tiki Island
| Characteristic | Without Mortgage | With Mortgage |
| Housing Units | 297 | 282 |
| Median Property Value | $562,500 | $649,300 |
| Median Household Income | $107,917 | $199 |
| Monthly Housing Costs | $1,501 | $188 |
| Real Estate Taxes | $10,001 | $3 |
Property Value by Mortgage Status in Tiki Island
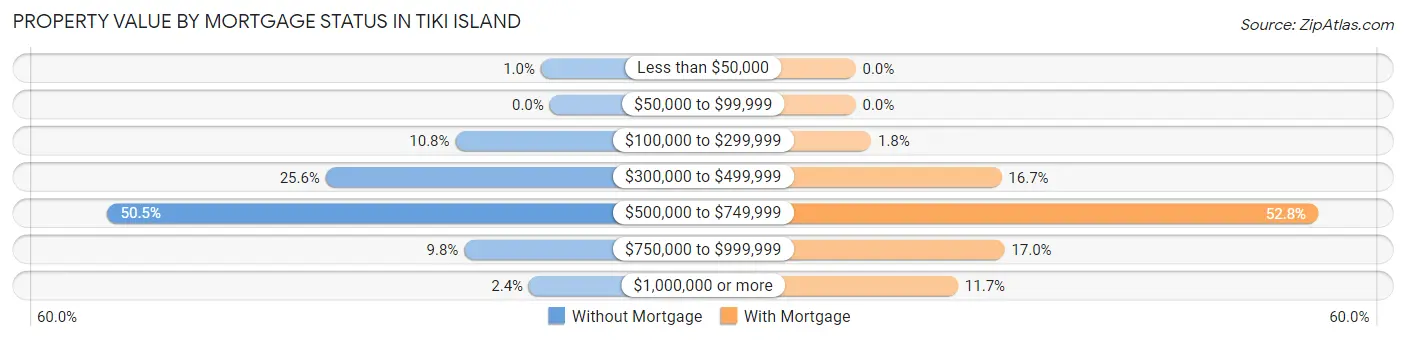
| Property Value | Without Mortgage | With Mortgage |
| Less than $50,000 | 3 (1.0%) | 0 (0.0%) |
| $50,000 to $99,999 | 0 (0.0%) | 0 (0.0%) |
| $100,000 to $299,999 | 32 (10.8%) | 5 (1.8%) |
| $300,000 to $499,999 | 76 (25.6%) | 47 (16.7%) |
| $500,000 to $749,999 | 150 (50.5%) | 149 (52.8%) |
| $750,000 to $999,999 | 29 (9.8%) | 48 (17.0%) |
| $1,000,000 or more | 7 (2.4%) | 33 (11.7%) |
| Total | 297 (100.0%) | 282 (100.0%) |
Household Income by Mortgage Status in Tiki Island
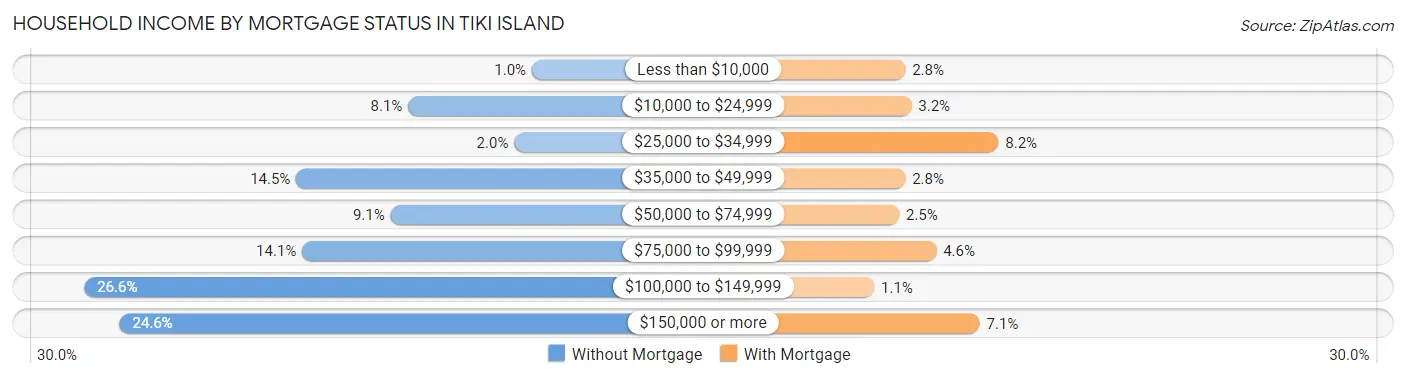
| Household Income | Without Mortgage | With Mortgage |
| Less than $10,000 | 3 (1.0%) | 8 (2.8%) |
| $10,000 to $24,999 | 24 (8.1%) | 9 (3.2%) |
| $25,000 to $34,999 | 6 (2.0%) | 23 (8.2%) |
| $35,000 to $49,999 | 43 (14.5%) | 8 (2.8%) |
| $50,000 to $74,999 | 27 (9.1%) | 7 (2.5%) |
| $75,000 to $99,999 | 42 (14.1%) | 13 (4.6%) |
| $100,000 to $149,999 | 79 (26.6%) | 3 (1.1%) |
| $150,000 or more | 73 (24.6%) | 20 (7.1%) |
| Total | 297 (100.0%) | 282 (100.0%) |
Property Value to Household Income Ratio in Tiki Island
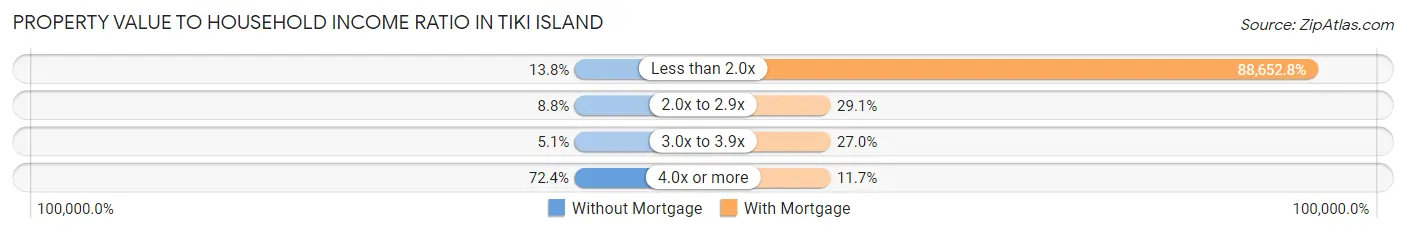
| Value-to-Income Ratio | Without Mortgage | With Mortgage |
| Less than 2.0x | 41 (13.8%) | 250,001 (88,652.8%) |
| 2.0x to 2.9x | 26 (8.7%) | 82 (29.1%) |
| 3.0x to 3.9x | 15 (5.1%) | 76 (27.0%) |
| 4.0x or more | 215 (72.4%) | 33 (11.7%) |
| Total | 297 (100.0%) | 282 (100.0%) |
Real Estate Taxes by Mortgage Status in Tiki Island
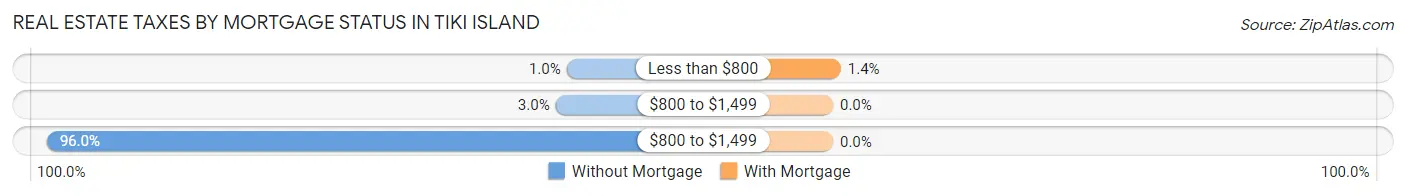
| Property Taxes | Without Mortgage | With Mortgage |
| Less than $800 | 3 (1.0%) | 4 (1.4%) |
| $800 to $1,499 | 9 (3.0%) | 0 (0.0%) |
| $800 to $1,499 | 285 (96.0%) | 0 (0.0%) |
| Total | 297 (100.0%) | 282 (100.0%) |
Health & Disability in Tiki Island
Health Insurance Coverage by Age in Tiki Island
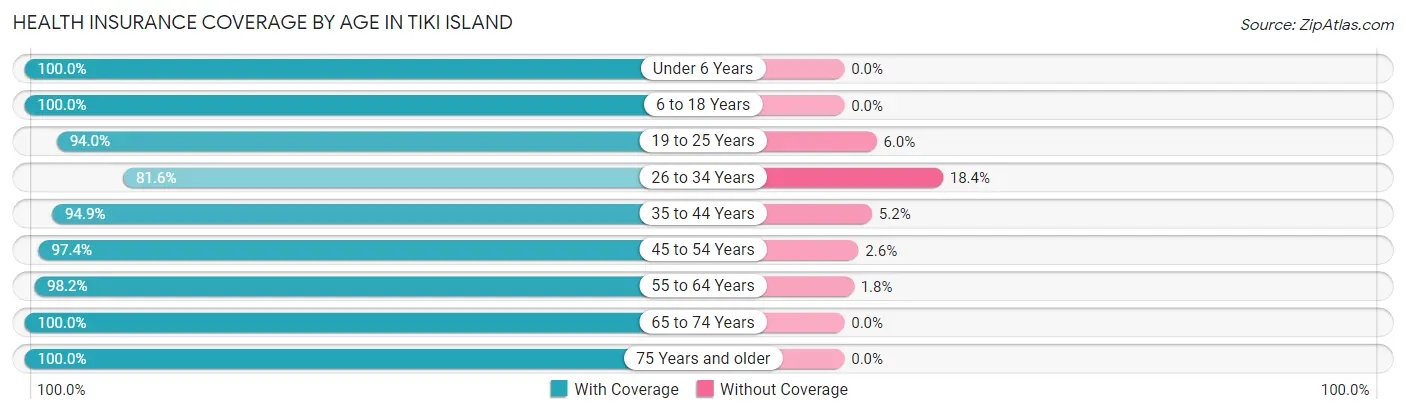
| Age Bracket | With Coverage | Without Coverage |
| Under 6 Years | 8 (100.0%) | 0 (0.0%) |
| 6 to 18 Years | 49 (100.0%) | 0 (0.0%) |
| 19 to 25 Years | 47 (94.0%) | 3 (6.0%) |
| 26 to 34 Years | 80 (81.6%) | 18 (18.4%) |
| 35 to 44 Years | 92 (94.9%) | 5 (5.1%) |
| 45 to 54 Years | 222 (97.4%) | 6 (2.6%) |
| 55 to 64 Years | 335 (98.2%) | 6 (1.8%) |
| 65 to 74 Years | 230 (100.0%) | 0 (0.0%) |
| 75 Years and older | 95 (100.0%) | 0 (0.0%) |
| Total | 1,158 (96.8%) | 38 (3.2%) |
Health Insurance Coverage by Citizenship Status in Tiki Island
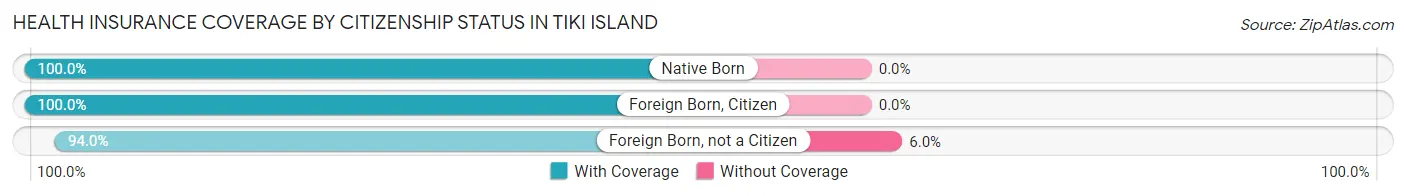
| Citizenship Status | With Coverage | Without Coverage |
| Native Born | 8 (100.0%) | 0 (0.0%) |
| Foreign Born, Citizen | 49 (100.0%) | 0 (0.0%) |
| Foreign Born, not a Citizen | 47 (94.0%) | 3 (6.0%) |
Health Insurance Coverage by Household Income in Tiki Island
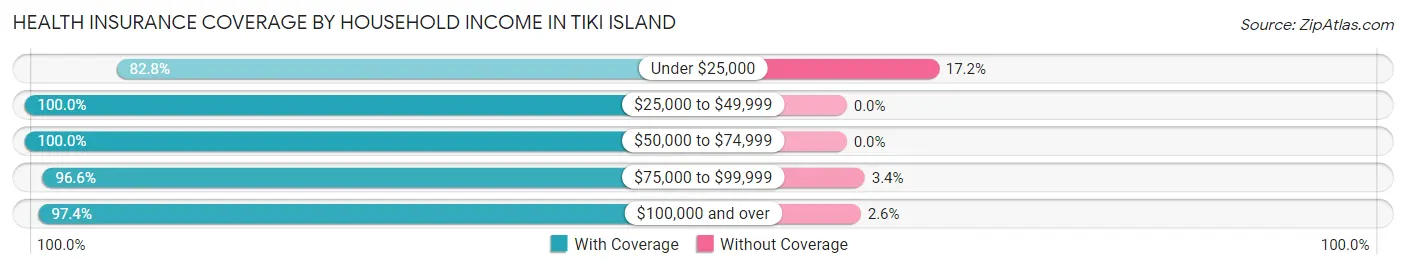
| Household Income | With Coverage | Without Coverage |
| Under $25,000 | 72 (82.8%) | 15 (17.2%) |
| $25,000 to $49,999 | 118 (100.0%) | 0 (0.0%) |
| $50,000 to $74,999 | 138 (100.0%) | 0 (0.0%) |
| $75,000 to $99,999 | 86 (96.6%) | 3 (3.4%) |
| $100,000 and over | 744 (97.4%) | 20 (2.6%) |
Public vs Private Health Insurance Coverage by Age in Tiki Island
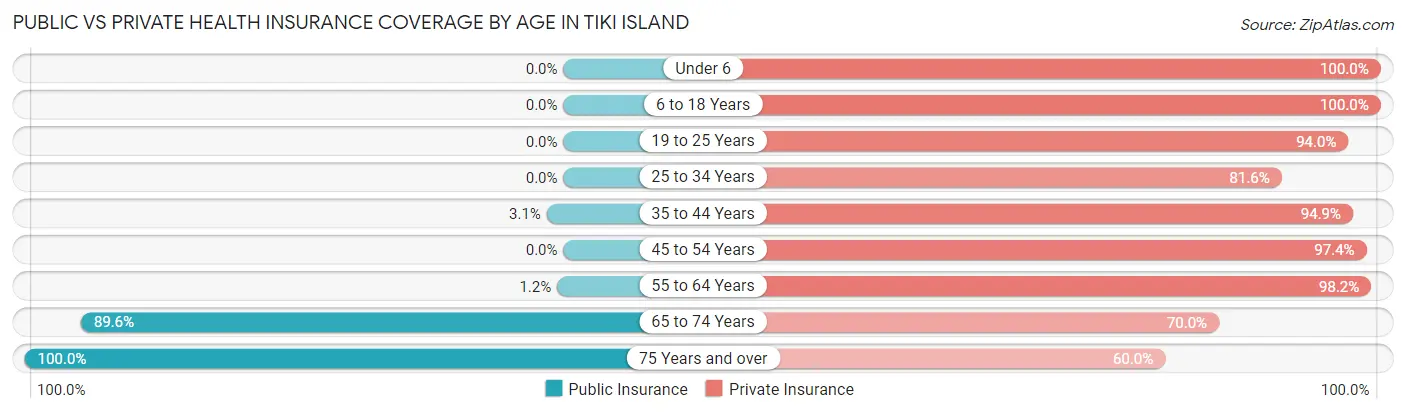
| Age Bracket | Public Insurance | Private Insurance |
| Under 6 | 0 (0.0%) | 8 (100.0%) |
| 6 to 18 Years | 0 (0.0%) | 49 (100.0%) |
| 19 to 25 Years | 0 (0.0%) | 47 (94.0%) |
| 25 to 34 Years | 0 (0.0%) | 80 (81.6%) |
| 35 to 44 Years | 3 (3.1%) | 92 (94.9%) |
| 45 to 54 Years | 0 (0.0%) | 222 (97.4%) |
| 55 to 64 Years | 4 (1.2%) | 335 (98.2%) |
| 65 to 74 Years | 206 (89.6%) | 161 (70.0%) |
| 75 Years and over | 95 (100.0%) | 57 (60.0%) |
| Total | 308 (25.8%) | 1,051 (87.9%) |
Disability Status by Sex by Age in Tiki Island
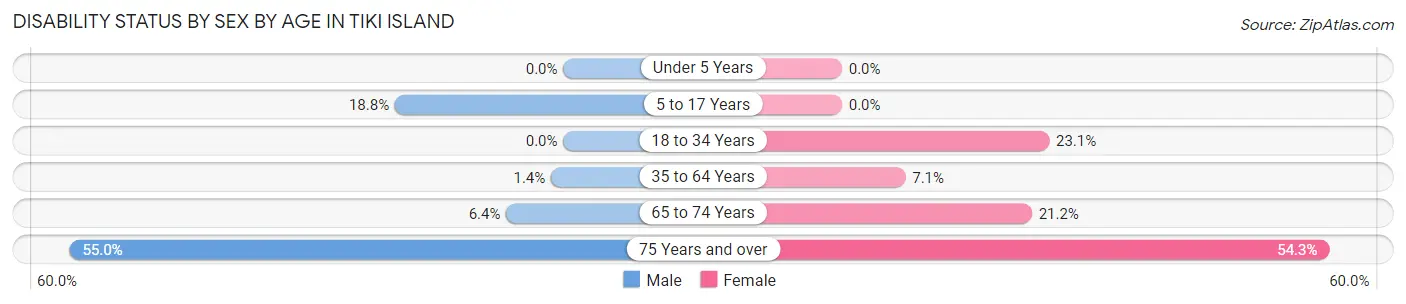
| Age Bracket | Male | Female |
| Under 5 Years | 0 (0.0%) | 0 (0.0%) |
| 5 to 17 Years | 6 (18.8%) | 0 (0.0%) |
| 18 to 34 Years | 0 (0.0%) | 9 (23.1%) |
| 35 to 64 Years | 5 (1.4%) | 21 (7.1%) |
| 65 to 74 Years | 8 (6.4%) | 22 (21.1%) |
| 75 Years and over | 33 (55.0%) | 19 (54.3%) |
Disability Class by Sex by Age in Tiki Island
Disability Class: Hearing Difficulty
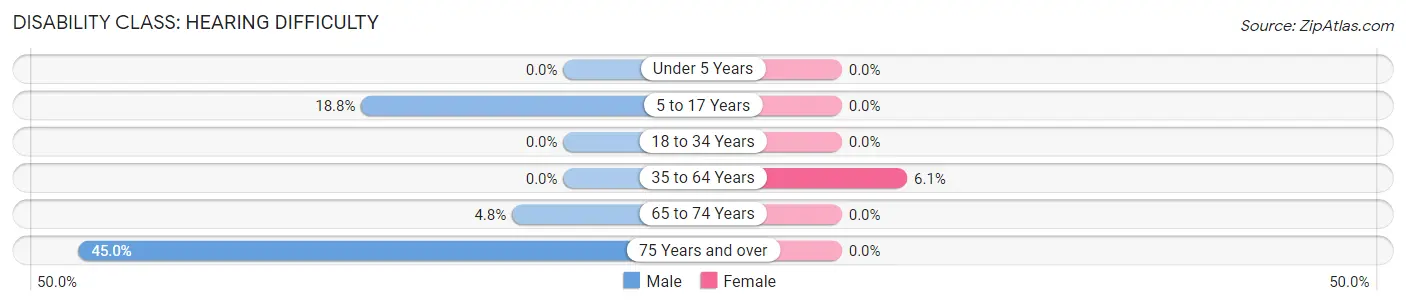
| Age Bracket | Male | Female |
| Under 5 Years | 0 (0.0%) | 0 (0.0%) |
| 5 to 17 Years | 6 (18.8%) | 0 (0.0%) |
| 18 to 34 Years | 0 (0.0%) | 0 (0.0%) |
| 35 to 64 Years | 0 (0.0%) | 18 (6.1%) |
| 65 to 74 Years | 6 (4.8%) | 0 (0.0%) |
| 75 Years and over | 27 (45.0%) | 0 (0.0%) |
Disability Class: Vision Difficulty
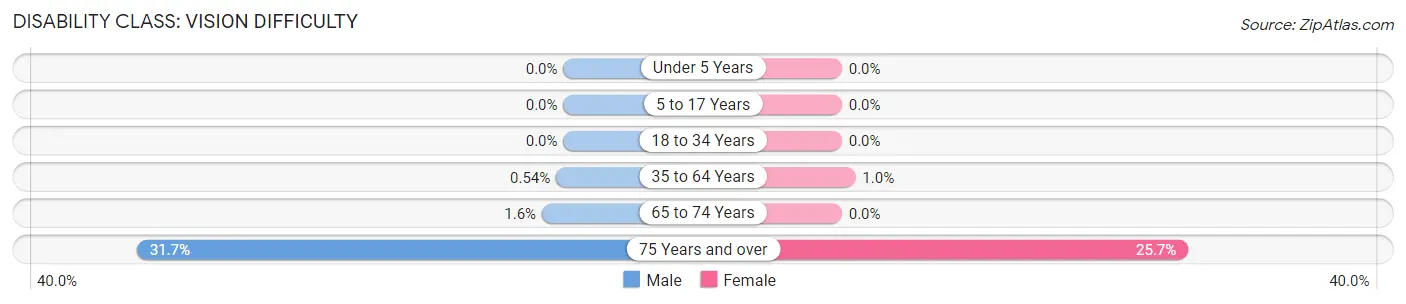
| Age Bracket | Male | Female |
| Under 5 Years | 0 (0.0%) | 0 (0.0%) |
| 5 to 17 Years | 0 (0.0%) | 0 (0.0%) |
| 18 to 34 Years | 0 (0.0%) | 0 (0.0%) |
| 35 to 64 Years | 2 (0.5%) | 3 (1.0%) |
| 65 to 74 Years | 2 (1.6%) | 0 (0.0%) |
| 75 Years and over | 19 (31.7%) | 9 (25.7%) |
Disability Class: Cognitive Difficulty
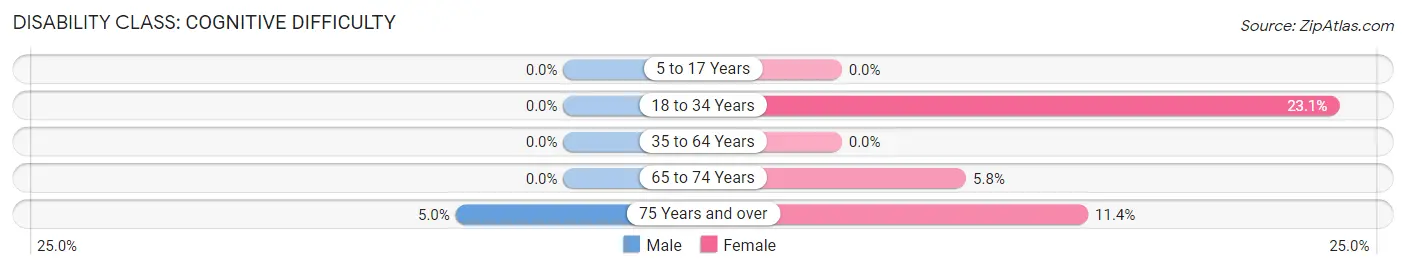
| Age Bracket | Male | Female |
| 5 to 17 Years | 0 (0.0%) | 0 (0.0%) |
| 18 to 34 Years | 0 (0.0%) | 9 (23.1%) |
| 35 to 64 Years | 0 (0.0%) | 0 (0.0%) |
| 65 to 74 Years | 0 (0.0%) | 6 (5.8%) |
| 75 Years and over | 3 (5.0%) | 4 (11.4%) |
Disability Class: Ambulatory Difficulty
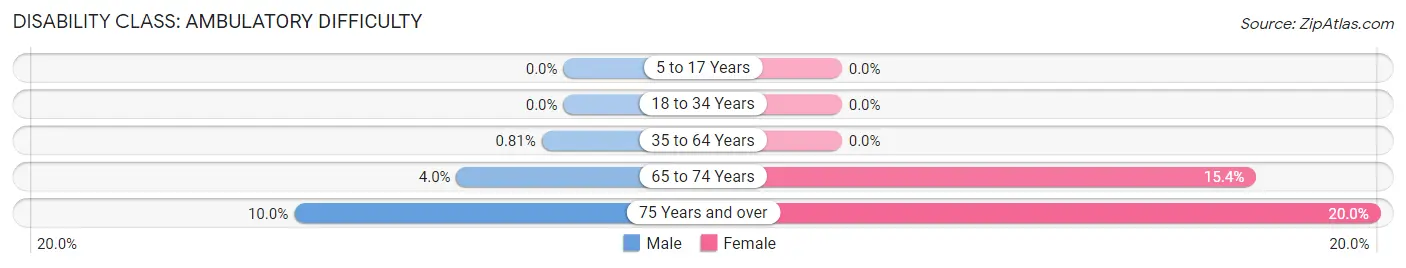
| Age Bracket | Male | Female |
| 5 to 17 Years | 0 (0.0%) | 0 (0.0%) |
| 18 to 34 Years | 0 (0.0%) | 0 (0.0%) |
| 35 to 64 Years | 3 (0.8%) | 0 (0.0%) |
| 65 to 74 Years | 5 (4.0%) | 16 (15.4%) |
| 75 Years and over | 6 (10.0%) | 7 (20.0%) |
Disability Class: Self-Care Difficulty
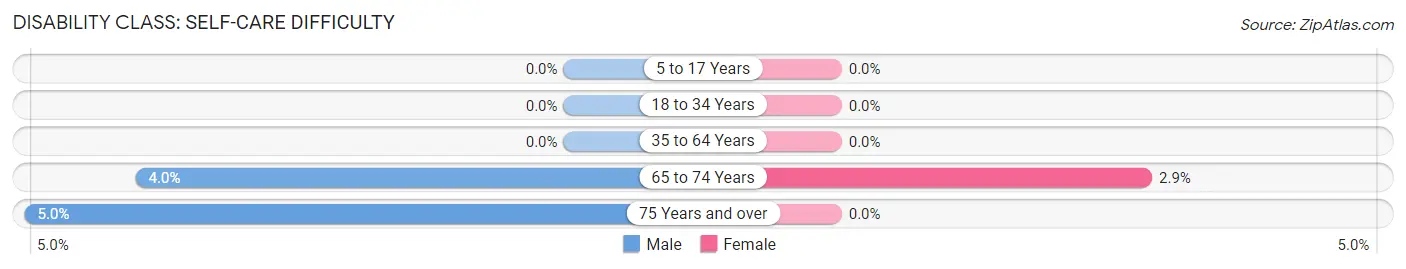
| Age Bracket | Male | Female |
| 5 to 17 Years | 0 (0.0%) | 0 (0.0%) |
| 18 to 34 Years | 0 (0.0%) | 0 (0.0%) |
| 35 to 64 Years | 0 (0.0%) | 0 (0.0%) |
| 65 to 74 Years | 5 (4.0%) | 3 (2.9%) |
| 75 Years and over | 3 (5.0%) | 0 (0.0%) |
Technology Access in Tiki Island
Computing Device Access in Tiki Island
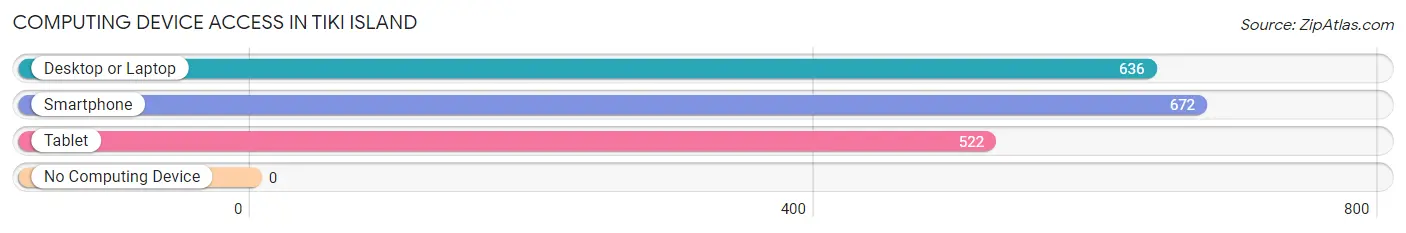
| Device Type | # Households | % Households |
| Desktop or Laptop | 636 | 90.6% |
| Smartphone | 672 | 95.7% |
| Tablet | 522 | 74.4% |
| No Computing Device | 0 | 0.0% |
| Total | 702 | 100.0% |
Internet Access in Tiki Island
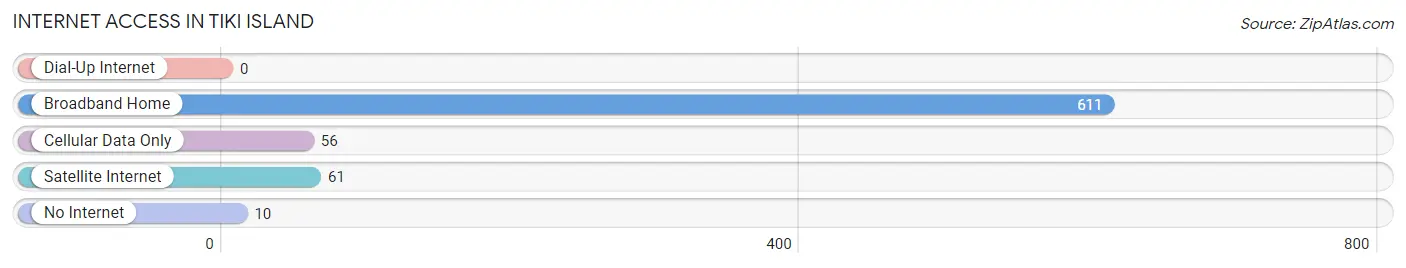
| Internet Type | # Households | % Households |
| Dial-Up Internet | 0 | 0.0% |
| Broadband Home | 611 | 87.0% |
| Cellular Data Only | 56 | 8.0% |
| Satellite Internet | 61 | 8.7% |
| No Internet | 10 | 1.4% |
| Total | 702 | 100.0% |
Tiki Island Summary
Tiki Island is a small island located in Galveston Bay, Texas. It is part of the city of Galveston and is located approximately 10 miles south of the city. The island is approximately 1.5 miles long and 0.5 miles wide, and is home to approximately 1,000 people.
History
Tiki Island was originally inhabited by the Karankawa Indians, who were a nomadic tribe that lived along the Texas coast. The island was first settled by Europeans in the late 1800s, when a group of fishermen from Louisiana moved to the island. The island was named after the Tiki god, which was a popular figure in the culture of the Karankawa Indians.
In the early 1900s, the island was developed as a resort destination, with a hotel, casino, and other attractions. The island was also home to a number of wealthy families, who built large homes on the island.
In the 1950s, the island was developed as a residential community, and the population began to grow. The island was incorporated as a city in 1962, and the population has continued to grow since then.
Geography
Tiki Island is located in Galveston Bay, which is part of the Gulf of Mexico. The island is approximately 1.5 miles long and 0.5 miles wide, and is surrounded by water on all sides. The island is connected to the mainland by a bridge, which was built in the 1950s.
The island is mostly flat, with some areas of marshland. The highest point on the island is approximately 10 feet above sea level. The island is home to a number of beaches, which are popular with tourists and locals alike.
Economy
The economy of Tiki Island is largely based on tourism and real estate. The island is home to a number of hotels, restaurants, and other attractions, which attract tourists from all over the world. The island is also home to a number of luxury homes, which are popular with wealthy buyers.
The island is also home to a number of businesses, including a marina, boat repair shop, and a number of other small businesses. The island is also home to a number of fishing charters, which take tourists out into the bay to fish.
Demographics
As of the 2010 census, the population of Tiki Island was 1,037. The population is largely white (90.2%), with a small percentage of African Americans (4.2%) and Hispanics (3.3%). The median household income is $76,250, and the median home value is $521,000.
The island is home to a number of churches, including the Tiki Island Baptist Church, the Tiki Island United Methodist Church, and the Tiki Island Catholic Church. The island is also home to a number of schools, including the Tiki Island Elementary School and the Tiki Island High School.
Conclusion
Tiki Island is a small island located in Galveston Bay, Texas. It is part of the city of Galveston and is home to approximately 1,000 people. The island has a long history, and was originally inhabited by the Karankawa Indians. The island was developed as a resort destination in the early 1900s, and was later developed as a residential community. The economy of the island is largely based on tourism and real estate, and the population is largely white. The island is home to a number of churches, schools, and other attractions, and is a popular destination for tourists and locals alike.
Common Questions
What is Per Capita Income in Tiki Island?
Per Capita income in Tiki Island is $115,696.
What is the Median Family Income in Tiki Island?
Median Family Income in Tiki Island is $180,938.
What is the Median Household income in Tiki Island?
Median Household Income in Tiki Island is $112,054.
What is Income or Wage Gap in Tiki Island?
Income or Wage Gap in Tiki Island is 36.6%.
Women in Tiki Island earn 63.4 cents for every dollar earned by a man.
What is Family Income Deficit in Tiki Island?
Family Income Deficit in Tiki Island is $12,857.
Families that are below poverty line in Tiki Island earn $12,857 less on average than the poverty threshold level.
What is Inequality or Gini Index in Tiki Island?
Inequality or Gini Index in Tiki Island is 0.51.
What is the Total Population of Tiki Island?
Total Population of Tiki Island is 1,196.
What is the Total Male Population of Tiki Island?
Total Male Population of Tiki Island is 704.
What is the Total Female Population of Tiki Island?
Total Female Population of Tiki Island is 492.
What is the Ratio of Males per 100 Females in Tiki Island?
There are 143.09 Males per 100 Females in Tiki Island.
What is the Ratio of Females per 100 Males in Tiki Island?
There are 69.89 Females per 100 Males in Tiki Island.
What is the Median Population Age in Tiki Island?
Median Population Age in Tiki Island is 56.7 Years.
What is the Average Family Size in Tiki Island
Average Family Size in Tiki Island is 2.2 People.
What is the Average Household Size in Tiki Island
Average Household Size in Tiki Island is 1.7 People.
How Large is the Labor Force in Tiki Island?
There are 728 People in the Labor Forcein in Tiki Island.
What is the Percentage of People in the Labor Force in Tiki Island?
62.5% of People are in the Labor Force in Tiki Island.
What is the Unemployment Rate in Tiki Island?
Unemployment Rate in Tiki Island is 1.8%.