Hudson Bend, TX Map & Demographics
Hudson Bend Map
Hudson Bend Overview
$81,078
PER CAPITA INCOME
$129,942
AVG FAMILY INCOME
$90,179
AVG HOUSEHOLD INCOME
19.7%
WAGE / INCOME GAP [ % ]
80.3¢/ $1
WAGE / INCOME GAP [ $ ]
0.56
INEQUALITY / GINI INDEX
3,672
TOTAL POPULATION
1,962
MALE POPULATION
1,710
FEMALE POPULATION
114.74
MALES / 100 FEMALES
87.16
FEMALES / 100 MALES
52.6
MEDIAN AGE
2.6
AVG FAMILY SIZE
2.1
AVG HOUSEHOLD SIZE
2,063
LABOR FORCE [ PEOPLE ]
63.6%
PERCENT IN LABOR FORCE
3.9%
UNEMPLOYMENT RATE
Income in Hudson Bend
Income Overview in Hudson Bend
Per Capita Income in Hudson Bend is $81,078, while median incomes of families and households are $129,942 and $90,179 respectively.
| Characteristic | Number | Measure |
| Per Capita Income | 3,672 | $81,078 |
| Median Family Income | 978 | $129,942 |
| Mean Family Income | 978 | $225,298 |
| Median Household Income | 1,731 | $90,179 |
| Mean Household Income | 1,731 | $170,685 |
| Income Deficit | 978 | $0 |
| Wage / Income Gap (%) | 3,672 | 19.68% |
| Wage / Income Gap ($) | 3,672 | 80.32¢ per $1 |
| Gini / Inequality Index | 3,672 | 0.56 |
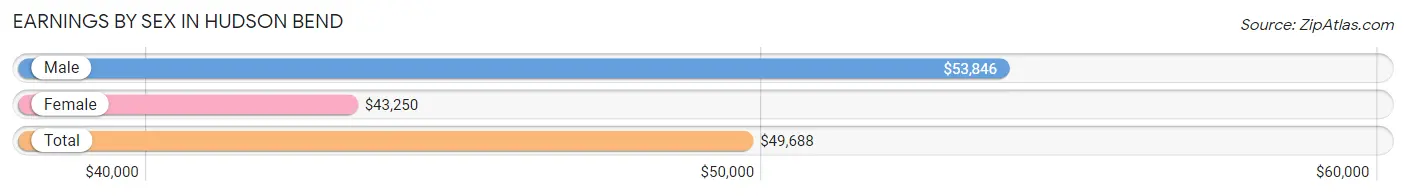
Earnings by Sex in Hudson Bend
Average Earnings in Hudson Bend are $49,688, $53,846 for men and $43,250 for women, a difference of 19.7%.
| Sex | Number | Average Earnings |
| Male | 1,046 (49.0%) | $53,846 |
| Female | 1,090 (51.0%) | $43,250 |
| Total | 2,136 (100.0%) | $49,688 |
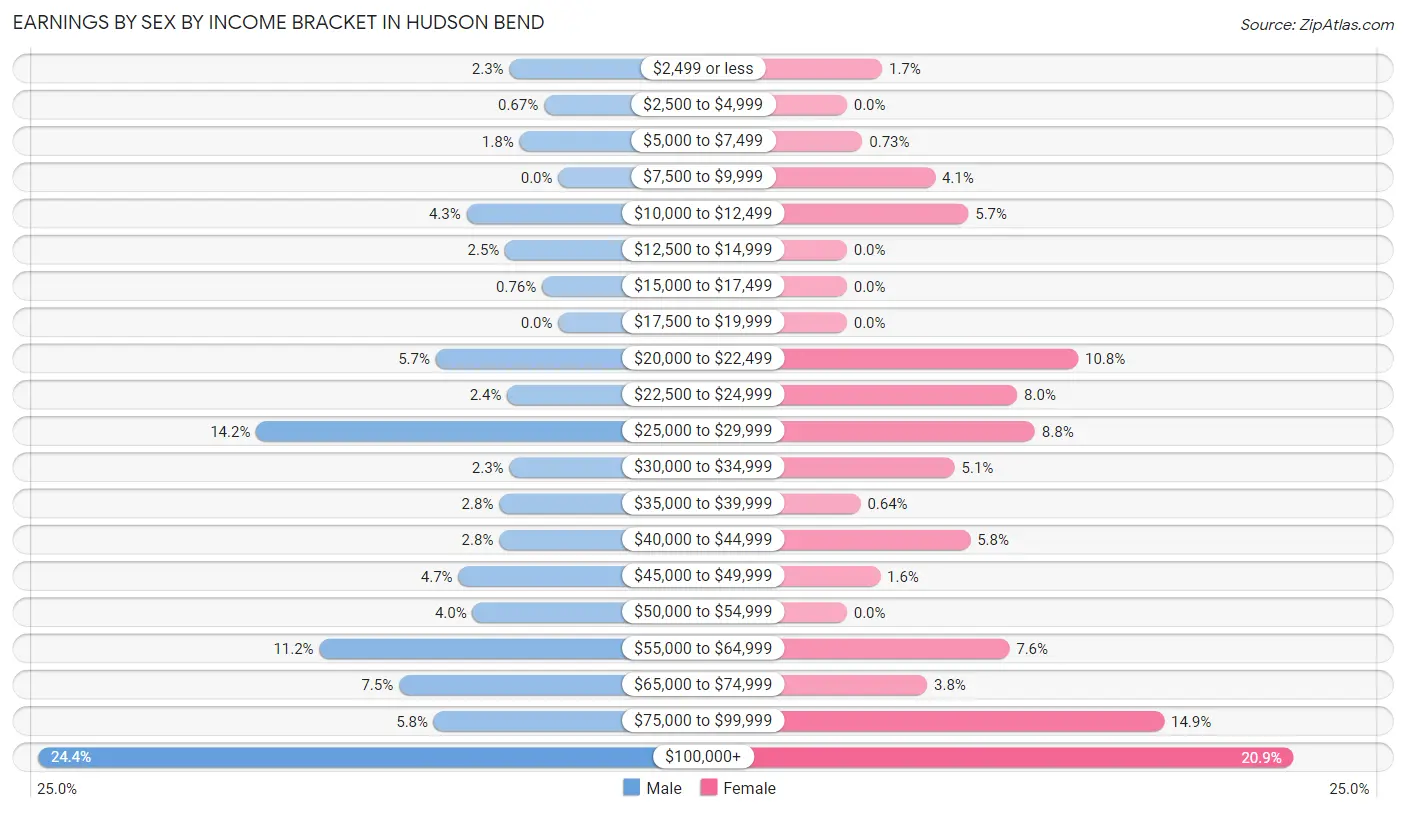
Earnings by Sex by Income Bracket in Hudson Bend
The most common earnings brackets in Hudson Bend are $100,000+ for men (255 | 24.4%) and $100,000+ for women (228 | 20.9%).
| Income | Male | Female |
| $2,499 or less | 24 (2.3%) | 18 (1.7%) |
| $2,500 to $4,999 | 7 (0.7%) | 0 (0.0%) |
| $5,000 to $7,499 | 19 (1.8%) | 8 (0.7%) |
| $7,500 to $9,999 | 0 (0.0%) | 45 (4.1%) |
| $10,000 to $12,499 | 45 (4.3%) | 62 (5.7%) |
| $12,500 to $14,999 | 26 (2.5%) | 0 (0.0%) |
| $15,000 to $17,499 | 8 (0.8%) | 0 (0.0%) |
| $17,500 to $19,999 | 0 (0.0%) | 0 (0.0%) |
| $20,000 to $22,499 | 60 (5.7%) | 118 (10.8%) |
| $22,500 to $24,999 | 25 (2.4%) | 87 (8.0%) |
| $25,000 to $29,999 | 148 (14.1%) | 96 (8.8%) |
| $30,000 to $34,999 | 24 (2.3%) | 55 (5.1%) |
| $35,000 to $39,999 | 29 (2.8%) | 7 (0.6%) |
| $40,000 to $44,999 | 29 (2.8%) | 63 (5.8%) |
| $45,000 to $49,999 | 49 (4.7%) | 17 (1.6%) |
| $50,000 to $54,999 | 42 (4.0%) | 0 (0.0%) |
| $55,000 to $64,999 | 117 (11.2%) | 83 (7.6%) |
| $65,000 to $74,999 | 78 (7.5%) | 41 (3.8%) |
| $75,000 to $99,999 | 61 (5.8%) | 162 (14.9%) |
| $100,000+ | 255 (24.4%) | 228 (20.9%) |
| Total | 1,046 (100.0%) | 1,090 (100.0%) |
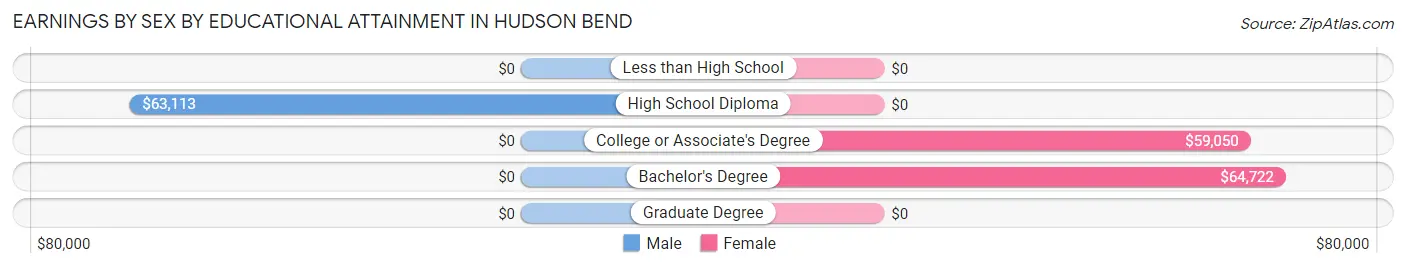
Earnings by Sex by Educational Attainment in Hudson Bend
Average earnings in Hudson Bend are $58,513 for men and $59,900 for women, a difference of 2.3%. Men with an educational attainment of high school diploma enjoy the highest average annual earnings of $63,113, while those with high school diploma education earn the least with $63,113. Women with an educational attainment of bachelor's degree earn the most with the average annual earnings of $64,722, while those with college or associate's degree education have the smallest earnings of $59,050.
| Educational Attainment | Male Income | Female Income |
| Less than High School | - | - |
| High School Diploma | $63,113 | $0 |
| College or Associate's Degree | - | - |
| Bachelor's Degree | - | - |
| Graduate Degree | - | - |
| Total | $58,513 | $59,900 |
Family Income in Hudson Bend
Family Income Brackets in Hudson Bend
According to the Hudson Bend family income data, there are 320 families falling into the $200,000+ income range, which is the most common income bracket and makes up 32.7% of all families.
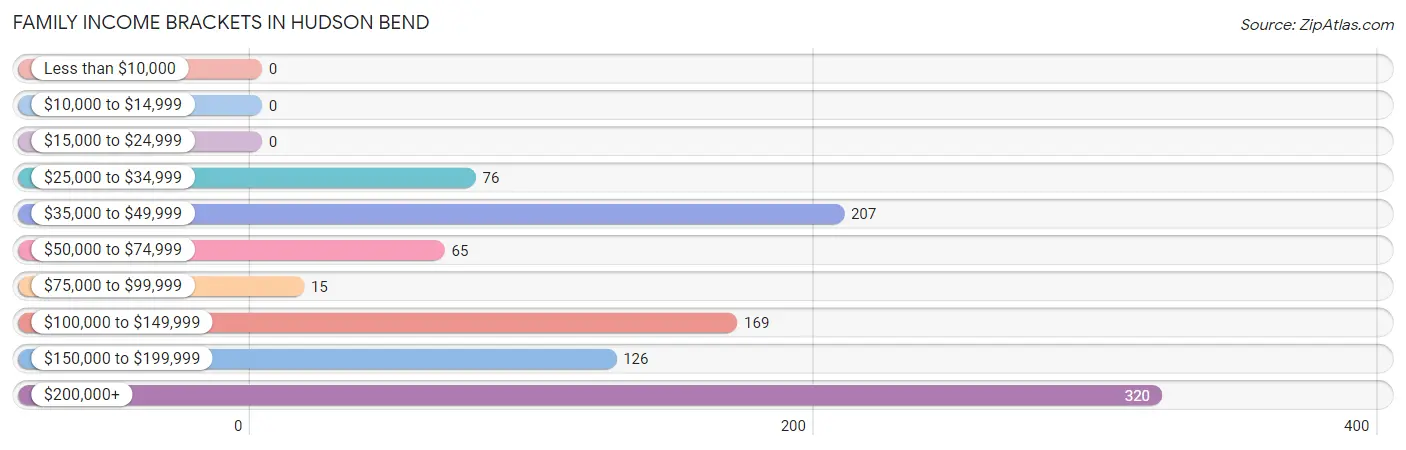
| Income Bracket | # Families | % Families |
| Less than $10,000 | 0 | 0.0% |
| $10,000 to $14,999 | 0 | 0.0% |
| $15,000 to $24,999 | 0 | 0.0% |
| $25,000 to $34,999 | 76 | 7.8% |
| $35,000 to $49,999 | 207 | 21.2% |
| $50,000 to $74,999 | 65 | 6.6% |
| $75,000 to $99,999 | 15 | 1.5% |
| $100,000 to $149,999 | 169 | 17.3% |
| $150,000 to $199,999 | 126 | 12.9% |
| $200,000+ | 320 | 32.7% |
Family Income by Famaliy Size in Hudson Bend
4-person families (108 | 11.0%) account for the highest median family income in Hudson Bend with $250,001 per family, while 4-person families (108 | 11.0%) have the highest median income of $62,500 per family member.
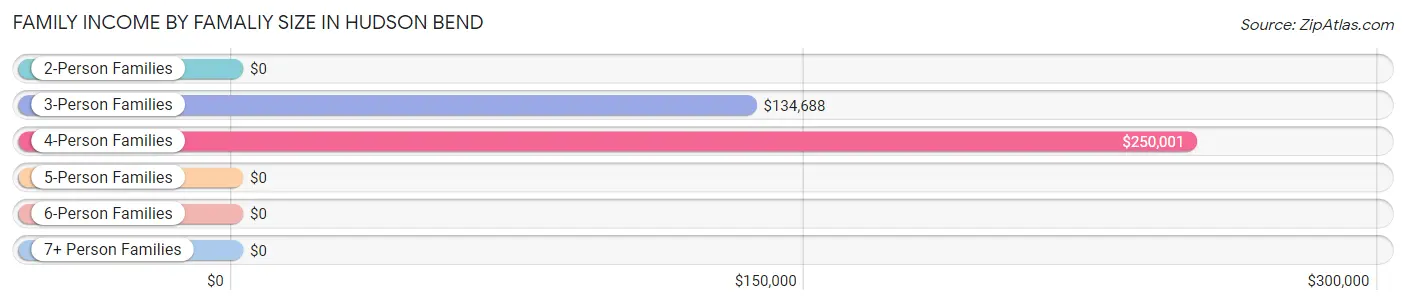
| Income Bracket | # Families | Median Income |
| 2-Person Families | 547 (55.9%) | $0 |
| 3-Person Families | 252 (25.8%) | $134,688 |
| 4-Person Families | 108 (11.0%) | $250,001 |
| 5-Person Families | 42 (4.3%) | $0 |
| 6-Person Families | 29 (3.0%) | $0 |
| 7+ Person Families | 0 (0.0%) | $0 |
| Total | 978 (100.0%) | $129,942 |
Family Income by Number of Earners in Hudson Bend
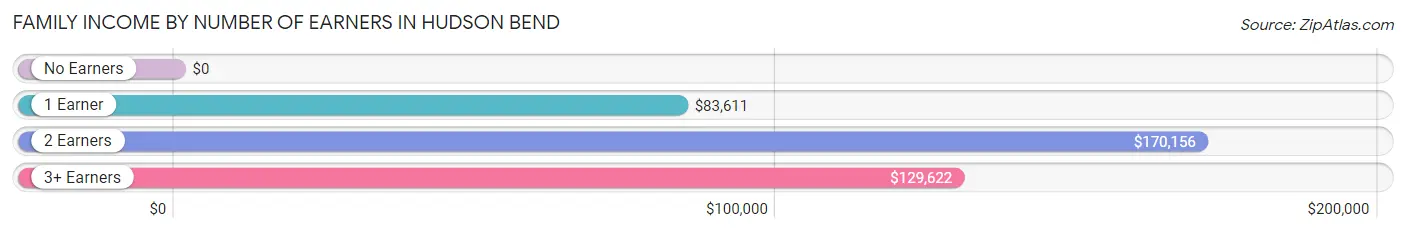
| Number of Earners | # Families | Median Income |
| No Earners | 160 (16.4%) | $0 |
| 1 Earner | 294 (30.1%) | $83,611 |
| 2 Earners | 399 (40.8%) | $170,156 |
| 3+ Earners | 125 (12.8%) | $129,622 |
| Total | 978 (100.0%) | $129,942 |
Household Income in Hudson Bend
Household Income Brackets in Hudson Bend
With 447 households falling in the category, the $200,000+ income range is the most frequent in Hudson Bend, accounting for 25.8% of all households. In contrast, only 14 households (0.8%) fall into the less than $10,000 income bracket, making it the least populous group.
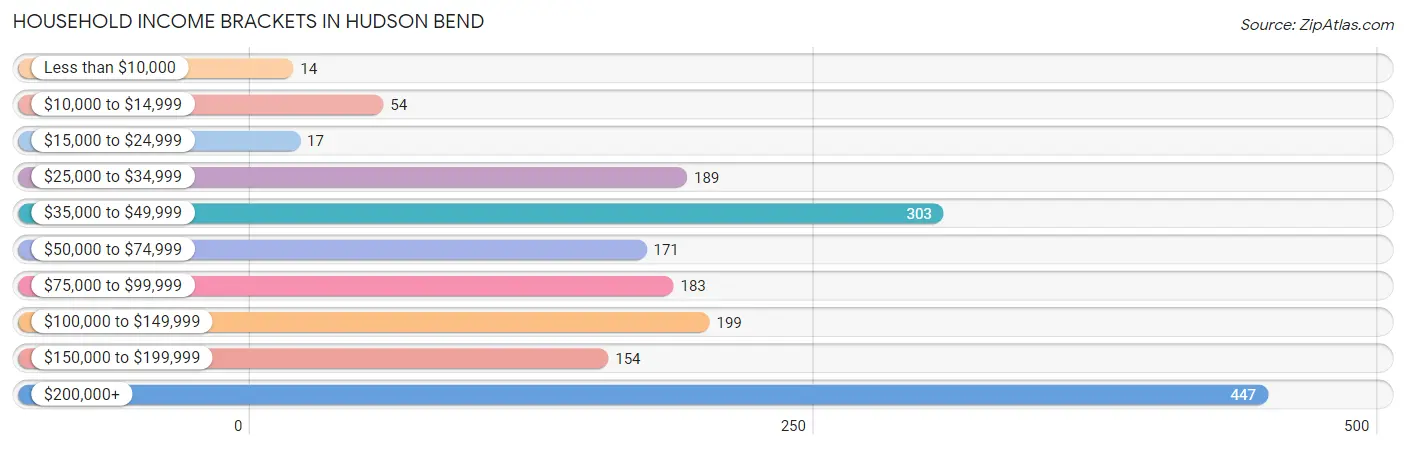
| Income Bracket | # Households | % Households |
| Less than $10,000 | 14 | 0.8% |
| $10,000 to $14,999 | 54 | 3.1% |
| $15,000 to $24,999 | 17 | 1.0% |
| $25,000 to $34,999 | 189 | 10.9% |
| $35,000 to $49,999 | 303 | 17.5% |
| $50,000 to $74,999 | 171 | 9.9% |
| $75,000 to $99,999 | 183 | 10.6% |
| $100,000 to $149,999 | 199 | 11.5% |
| $150,000 to $199,999 | 154 | 8.9% |
| $200,000+ | 447 | 25.8% |
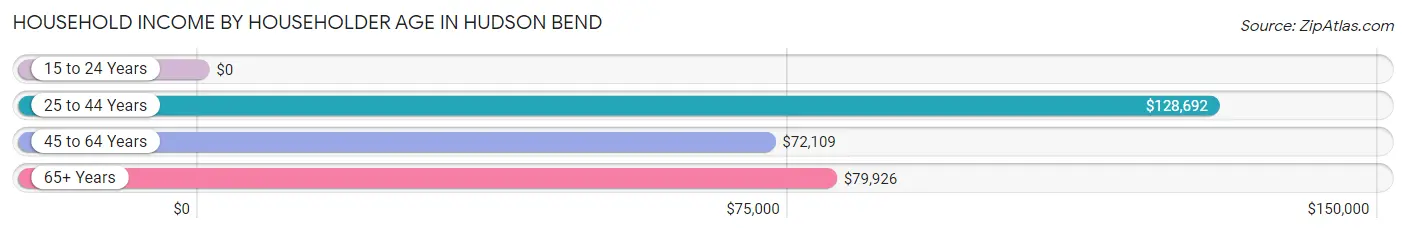
Household Income by Householder Age in Hudson Bend
The median household income in Hudson Bend is $90,179, with the highest median household income of $128,692 found in the 25 to 44 years age bracket for the primary householder. A total of 221 households (12.8%) fall into this category. Meanwhile, the 15 to 24 years age bracket for the primary householder has the lowest median household income of $0, with 9 households (0.5%) in this group.
| Income Bracket | # Households | Median Income |
| 15 to 24 Years | 9 (0.5%) | $0 |
| 25 to 44 Years | 221 (12.8%) | $128,692 |
| 45 to 64 Years | 960 (55.5%) | $72,109 |
| 65+ Years | 541 (31.2%) | $79,926 |
| Total | 1,731 (100.0%) | $90,179 |
Poverty in Hudson Bend
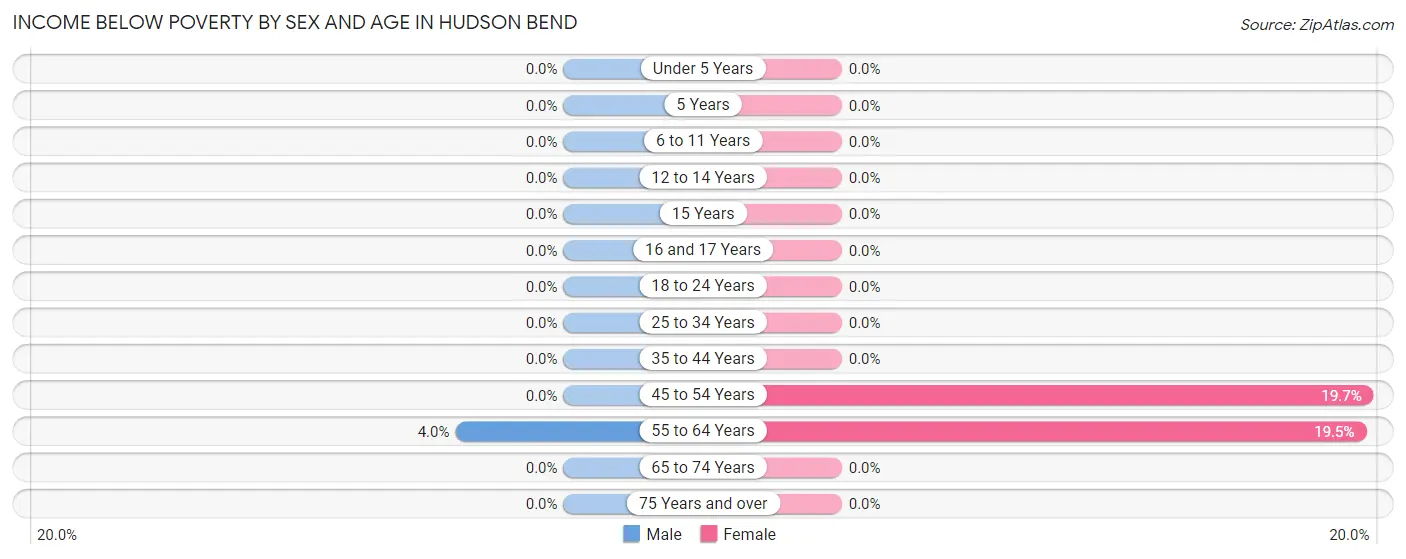
Income Below Poverty by Sex and Age in Hudson Bend
With 0.7% poverty level for males and 9.7% for females among the residents of Hudson Bend, 55 to 64 year old males and 45 to 54 year old females are the most vulnerable to poverty, with 14 males (4.0%) and 92 females (19.7%) in their respective age groups living below the poverty level.
| Age Bracket | Male | Female |
| Under 5 Years | 0 (0.0%) | 0 (0.0%) |
| 5 Years | 0 (0.0%) | 0 (0.0%) |
| 6 to 11 Years | 0 (0.0%) | 0 (0.0%) |
| 12 to 14 Years | 0 (0.0%) | 0 (0.0%) |
| 15 Years | 0 (0.0%) | 0 (0.0%) |
| 16 and 17 Years | 0 (0.0%) | 0 (0.0%) |
| 18 to 24 Years | 0 (0.0%) | 0 (0.0%) |
| 25 to 34 Years | 0 (0.0%) | 0 (0.0%) |
| 35 to 44 Years | 0 (0.0%) | 0 (0.0%) |
| 45 to 54 Years | 0 (0.0%) | 92 (19.7%) |
| 55 to 64 Years | 14 (4.0%) | 74 (19.5%) |
| 65 to 74 Years | 0 (0.0%) | 0 (0.0%) |
| 75 Years and over | 0 (0.0%) | 0 (0.0%) |
| Total | 14 (0.7%) | 166 (9.7%) |
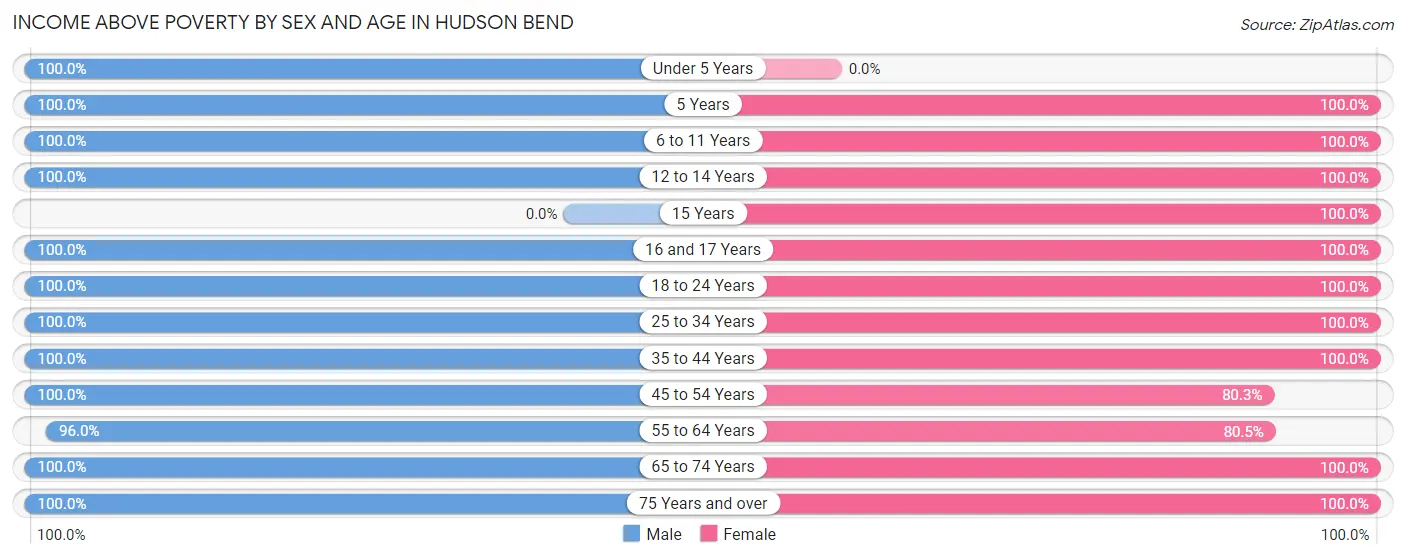
Income Above Poverty by Sex and Age in Hudson Bend
According to the poverty statistics in Hudson Bend, males aged under 5 years and females aged 5 years are the age groups that are most secure financially, with 100.0% of males and 100.0% of females in these age groups living above the poverty line.
| Age Bracket | Male | Female |
| Under 5 Years | 37 (100.0%) | 0 (0.0%) |
| 5 Years | 23 (100.0%) | 18 (100.0%) |
| 6 to 11 Years | 158 (100.0%) | 62 (100.0%) |
| 12 to 14 Years | 75 (100.0%) | 40 (100.0%) |
| 15 Years | 0 (0.0%) | 16 (100.0%) |
| 16 and 17 Years | 37 (100.0%) | 14 (100.0%) |
| 18 to 24 Years | 71 (100.0%) | 166 (100.0%) |
| 25 to 34 Years | 226 (100.0%) | 115 (100.0%) |
| 35 to 44 Years | 154 (100.0%) | 100 (100.0%) |
| 45 to 54 Years | 344 (100.0%) | 374 (80.3%) |
| 55 to 64 Years | 335 (96.0%) | 306 (80.5%) |
| 65 to 74 Years | 269 (100.0%) | 197 (100.0%) |
| 75 Years and over | 219 (100.0%) | 136 (100.0%) |
| Total | 1,948 (99.3%) | 1,544 (90.3%) |
Income Below Poverty Among Married-Couple Families in Hudson Bend
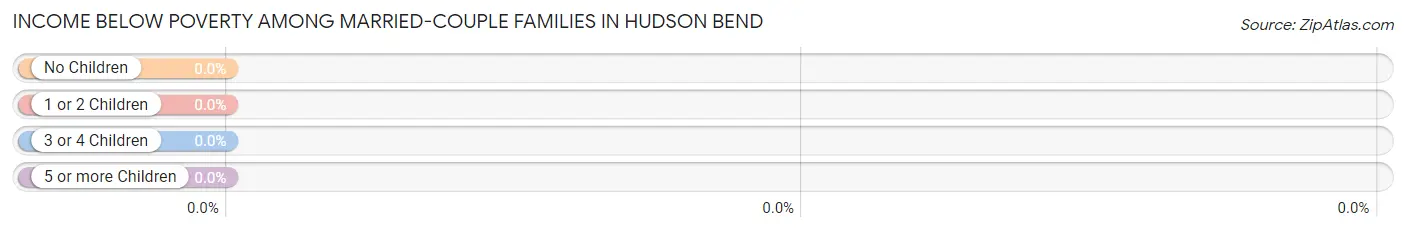
| Children | Above Poverty | Below Poverty |
| No Children | 502 (100.0%) | 0 (0.0%) |
| 1 or 2 Children | 155 (100.0%) | 0 (0.0%) |
| 3 or 4 Children | 45 (100.0%) | 0 (0.0%) |
| 5 or more Children | 0 (0.0%) | 0 (0.0%) |
| Total | 702 (100.0%) | 0 (0.0%) |
Income Below Poverty Among Single-Parent Households in Hudson Bend
| Children | Single Father | Single Mother |
| No Children | 0 (0.0%) | 0 (0.0%) |
| 1 or 2 Children | 0 (0.0%) | 0 (0.0%) |
| 3 or 4 Children | 0 (0.0%) | 0 (0.0%) |
| 5 or more Children | 0 (0.0%) | 0 (0.0%) |
| Total | 0 (0.0%) | 0 (0.0%) |
Income Below Poverty Among Married-Couple vs Single-Parent Households in Hudson Bend
| Children | Married-Couple Families | Single-Parent Households |
| No Children | 0 (0.0%) | 0 (0.0%) |
| 1 or 2 Children | 0 (0.0%) | 0 (0.0%) |
| 3 or 4 Children | 0 (0.0%) | 0 (0.0%) |
| 5 or more Children | 0 (0.0%) | 0 (0.0%) |
| Total | 0 (0.0%) | 0 (0.0%) |
Race in Hudson Bend
The most populous races in Hudson Bend are White / Caucasian (2,633 | 71.7%), Hispanic or Latino (693 | 18.9%), and Two or more Races (613 | 16.7%).
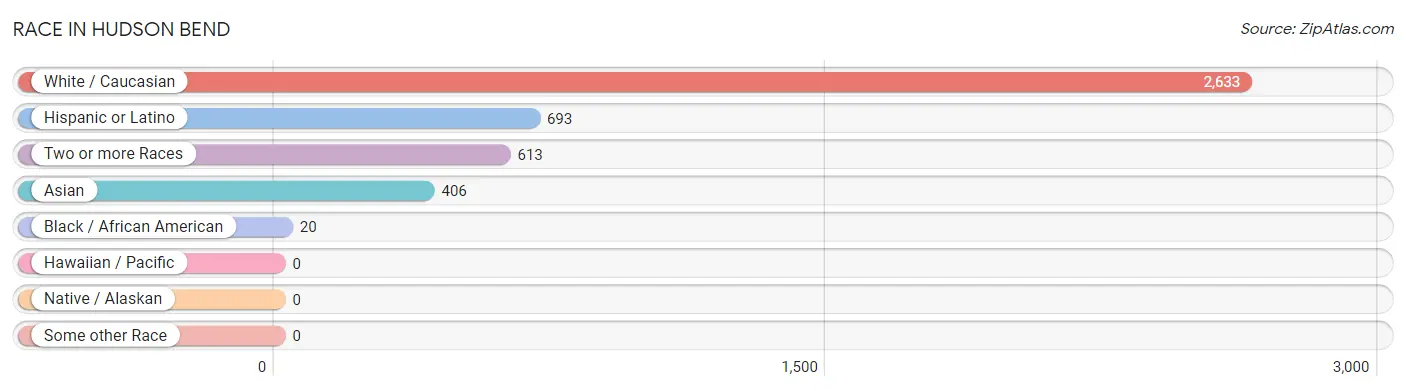
| Race | # Population | % Population |
| Asian | 406 | 11.1% |
| Black / African American | 20 | 0.5% |
| Hawaiian / Pacific | 0 | 0.0% |
| Hispanic or Latino | 693 | 18.9% |
| Native / Alaskan | 0 | 0.0% |
| White / Caucasian | 2,633 | 71.7% |
| Two or more Races | 613 | 16.7% |
| Some other Race | 0 | 0.0% |
| Total | 3,672 | 100.0% |
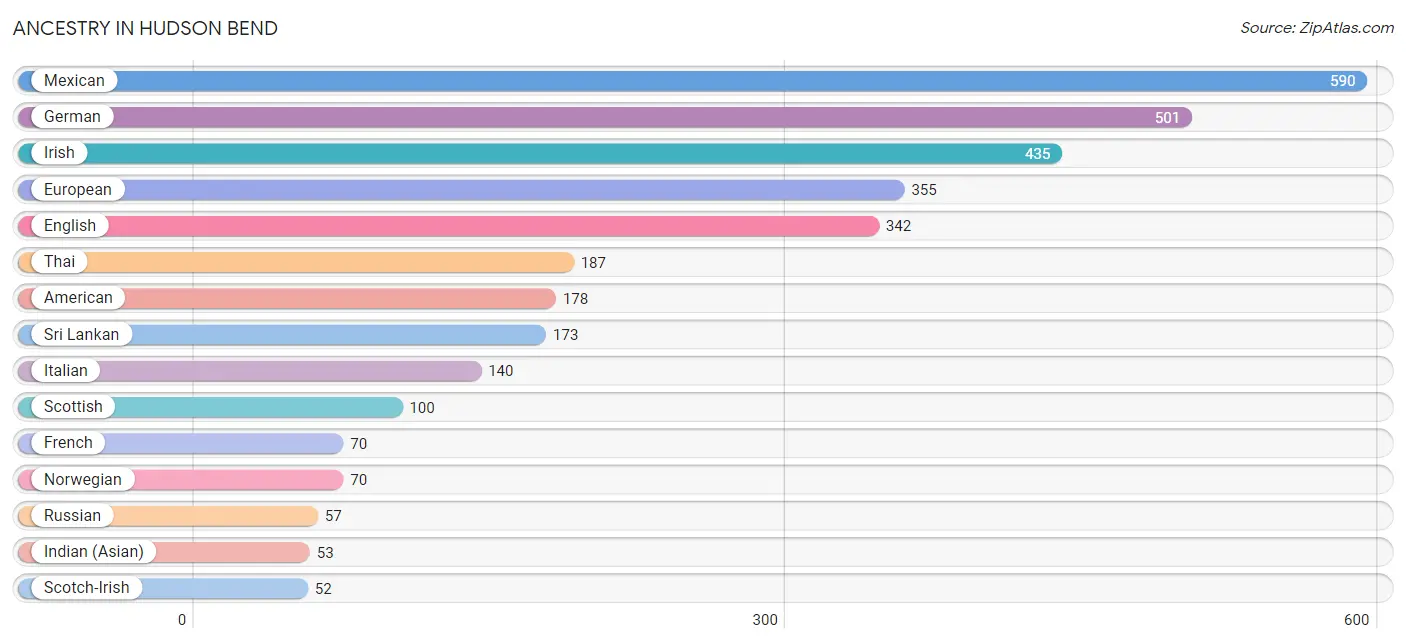
Ancestry in Hudson Bend
The most populous ancestries reported in Hudson Bend are Mexican (590 | 16.1%), German (501 | 13.6%), Irish (435 | 11.8%), European (355 | 9.7%), and English (342 | 9.3%), together accounting for 60.5% of all Hudson Bend residents.
| Ancestry | # Population | % Population |
| American | 178 | 4.9% |
| Austrian | 17 | 0.5% |
| Bolivian | 29 | 0.8% |
| British | 31 | 0.8% |
| Burmese | 25 | 0.7% |
| Chickasaw | 9 | 0.3% |
| Czech | 27 | 0.7% |
| Czechoslovakian | 17 | 0.5% |
| Danish | 19 | 0.5% |
| Dutch | 25 | 0.7% |
| Eastern European | 37 | 1.0% |
| English | 342 | 9.3% |
| European | 355 | 9.7% |
| French | 70 | 1.9% |
| French Canadian | 12 | 0.3% |
| German | 501 | 13.6% |
| Hungarian | 17 | 0.5% |
| Indian (Asian) | 53 | 1.4% |
| Irish | 435 | 11.8% |
| Italian | 140 | 3.8% |
| Jamaican | 14 | 0.4% |
| Korean | 6 | 0.2% |
| Lithuanian | 39 | 1.1% |
| Mexican | 590 | 16.1% |
| Norwegian | 70 | 1.9% |
| Polish | 28 | 0.8% |
| Puerto Rican | 38 | 1.0% |
| Romanian | 7 | 0.2% |
| Russian | 57 | 1.5% |
| Scandinavian | 19 | 0.5% |
| Scotch-Irish | 52 | 1.4% |
| Scottish | 100 | 2.7% |
| South African | 23 | 0.6% |
| South American | 29 | 0.8% |
| Spaniard | 27 | 0.7% |
| Sri Lankan | 173 | 4.7% |
| Subsaharan African | 23 | 0.6% |
| Swedish | 9 | 0.3% |
| Swiss | 24 | 0.6% |
| Thai | 187 | 5.1% | View All 40 Rows |
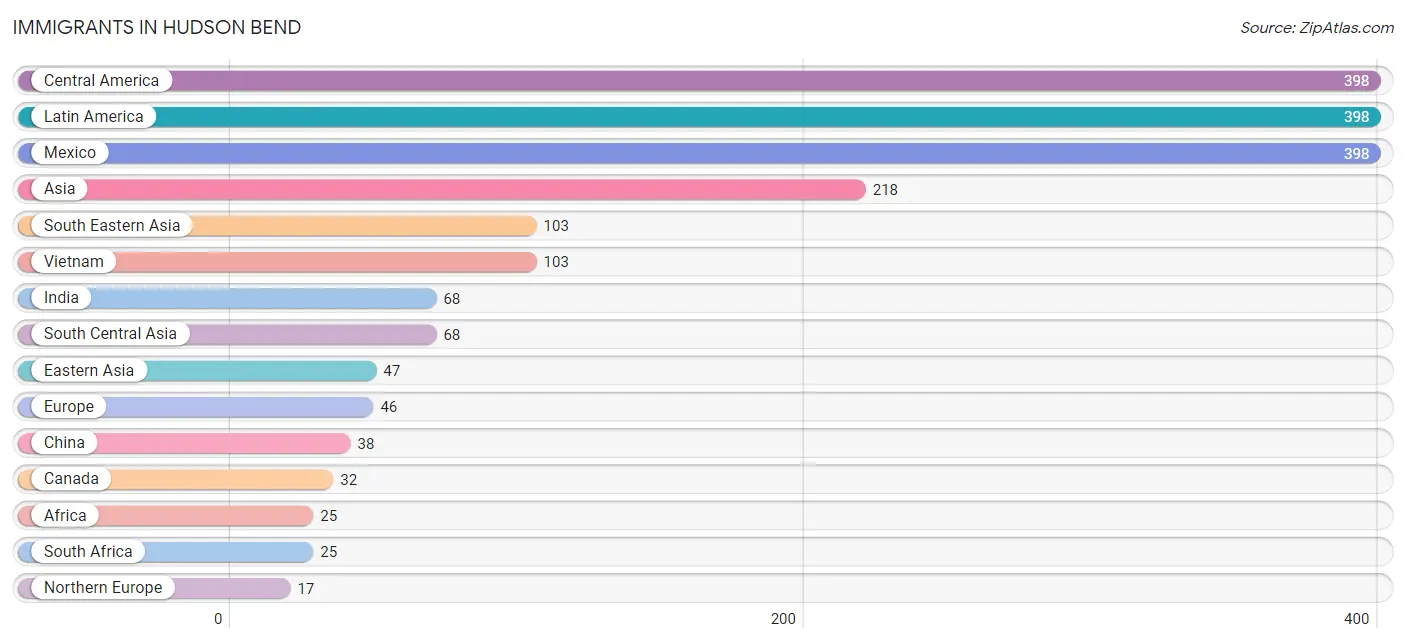
Immigrants in Hudson Bend
The most numerous immigrant groups reported in Hudson Bend came from Central America (398 | 10.8%), Latin America (398 | 10.8%), Mexico (398 | 10.8%), Asia (218 | 5.9%), and South Eastern Asia (103 | 2.8%), together accounting for 41.3% of all Hudson Bend residents.
| Immigration Origin | # Population | % Population |
| Africa | 25 | 0.7% |
| Asia | 218 | 5.9% |
| Canada | 32 | 0.9% |
| Central America | 398 | 10.8% |
| China | 38 | 1.0% |
| Eastern Asia | 47 | 1.3% |
| Eastern Europe | 13 | 0.4% |
| Europe | 46 | 1.3% |
| Germany | 8 | 0.2% |
| India | 68 | 1.8% |
| Korea | 9 | 0.3% |
| Latin America | 398 | 10.8% |
| Mexico | 398 | 10.8% |
| Northern Europe | 17 | 0.5% |
| Poland | 13 | 0.4% |
| Scotland | 10 | 0.3% |
| South Africa | 25 | 0.7% |
| South Central Asia | 68 | 1.8% |
| South Eastern Asia | 103 | 2.8% |
| Switzerland | 8 | 0.2% |
| Vietnam | 103 | 2.8% |
| Western Europe | 16 | 0.4% | View All 22 Rows |
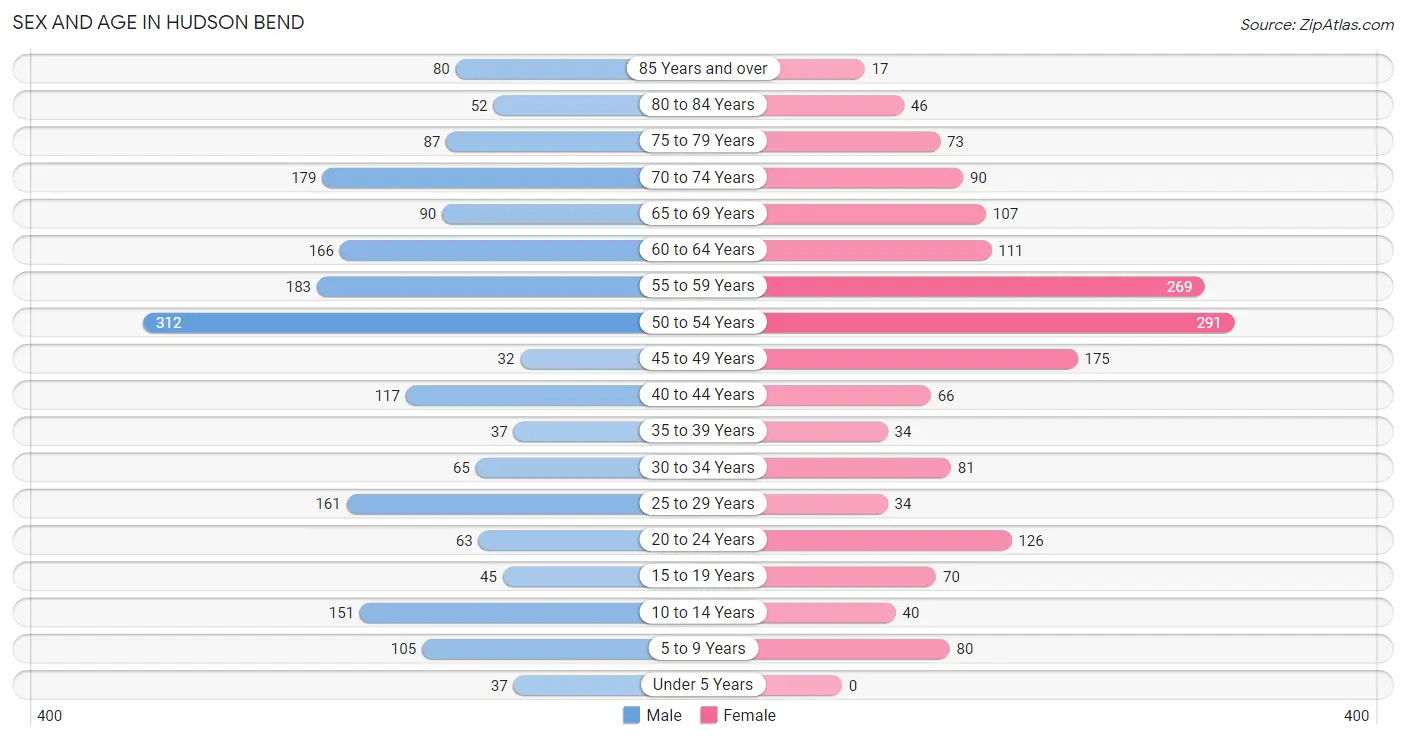
Sex and Age in Hudson Bend
Sex and Age in Hudson Bend
The most populous age groups in Hudson Bend are 50 to 54 Years (312 | 15.9%) for men and 50 to 54 Years (291 | 17.0%) for women.
| Age Bracket | Male | Female |
| Under 5 Years | 37 (1.9%) | 0 (0.0%) |
| 5 to 9 Years | 105 (5.3%) | 80 (4.7%) |
| 10 to 14 Years | 151 (7.7%) | 40 (2.3%) |
| 15 to 19 Years | 45 (2.3%) | 70 (4.1%) |
| 20 to 24 Years | 63 (3.2%) | 126 (7.4%) |
| 25 to 29 Years | 161 (8.2%) | 34 (2.0%) |
| 30 to 34 Years | 65 (3.3%) | 81 (4.7%) |
| 35 to 39 Years | 37 (1.9%) | 34 (2.0%) |
| 40 to 44 Years | 117 (6.0%) | 66 (3.9%) |
| 45 to 49 Years | 32 (1.6%) | 175 (10.2%) |
| 50 to 54 Years | 312 (15.9%) | 291 (17.0%) |
| 55 to 59 Years | 183 (9.3%) | 269 (15.7%) |
| 60 to 64 Years | 166 (8.5%) | 111 (6.5%) |
| 65 to 69 Years | 90 (4.6%) | 107 (6.3%) |
| 70 to 74 Years | 179 (9.1%) | 90 (5.3%) |
| 75 to 79 Years | 87 (4.4%) | 73 (4.3%) |
| 80 to 84 Years | 52 (2.6%) | 46 (2.7%) |
| 85 Years and over | 80 (4.1%) | 17 (1.0%) |
| Total | 1,962 (100.0%) | 1,710 (100.0%) |
Families and Households in Hudson Bend
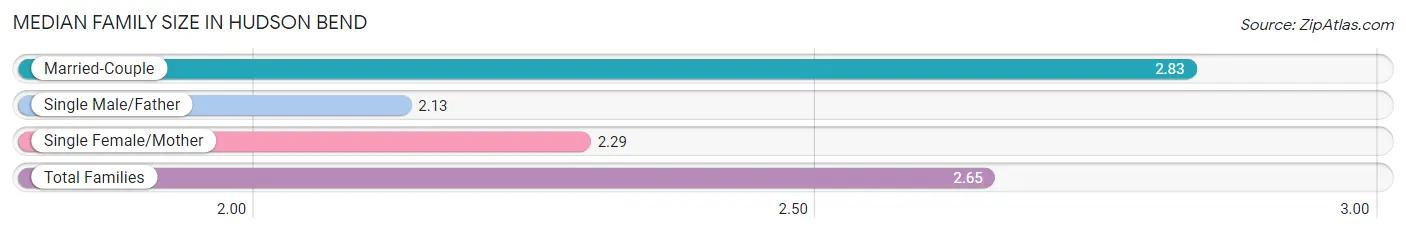
Median Family Size in Hudson Bend
The median family size in Hudson Bend is 2.65 persons per family, with married-couple families (702 | 71.8%) accounting for the largest median family size of 2.83 persons per family. On the other hand, single male/father families (183 | 18.7%) represent the smallest median family size with 2.13 persons per family.
| Family Type | # Families | Family Size |
| Married-Couple | 702 (71.8%) | 2.83 |
| Single Male/Father | 183 (18.7%) | 2.13 |
| Single Female/Mother | 93 (9.5%) | 2.29 |
| Total Families | 978 (100.0%) | 2.65 |
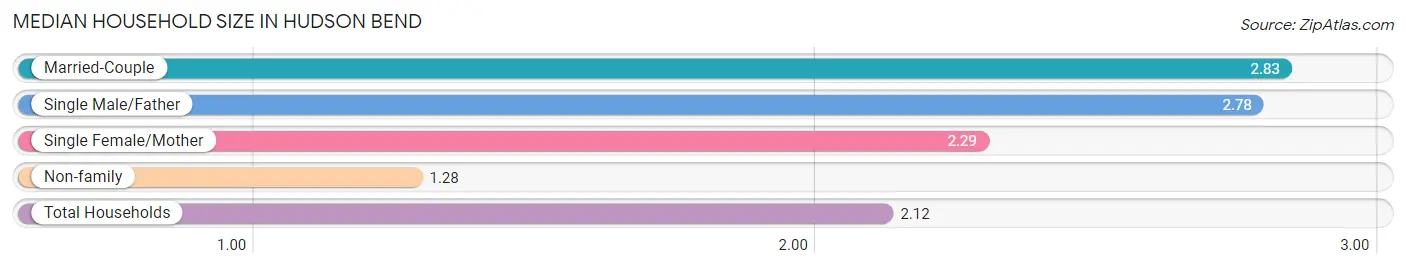
Median Household Size in Hudson Bend
The median household size in Hudson Bend is 2.12 persons per household, with married-couple households (702 | 40.6%) accounting for the largest median household size of 2.83 persons per household. non-family households (753 | 43.5%) represent the smallest median household size with 1.28 persons per household.
| Household Type | # Households | Household Size |
| Married-Couple | 702 (40.6%) | 2.83 |
| Single Male/Father | 183 (10.6%) | 2.78 |
| Single Female/Mother | 93 (5.4%) | 2.29 |
| Non-family | 753 (43.5%) | 1.28 |
| Total Households | 1,731 (100.0%) | 2.12 |
Household Size by Marriage Status in Hudson Bend
Out of a total of 1,731 households in Hudson Bend, 978 (56.5%) are family households, while 753 (43.5%) are nonfamily households. The most numerous type of family households are 2-person households, comprising 421, and the most common type of nonfamily households are 1-person households, comprising 580.
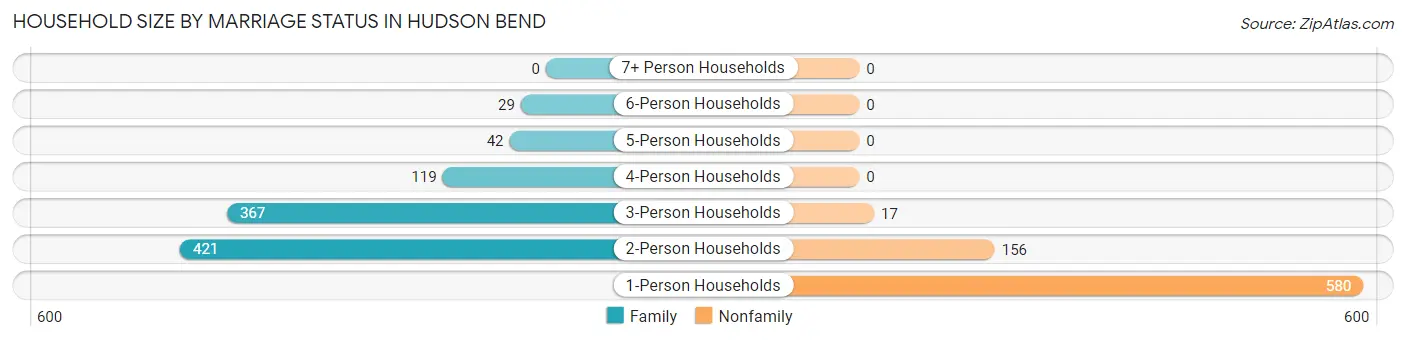
| Household Size | Family Households | Nonfamily Households |
| 1-Person Households | - | 580 (33.5%) |
| 2-Person Households | 421 (24.3%) | 156 (9.0%) |
| 3-Person Households | 367 (21.2%) | 17 (1.0%) |
| 4-Person Households | 119 (6.9%) | 0 (0.0%) |
| 5-Person Households | 42 (2.4%) | 0 (0.0%) |
| 6-Person Households | 29 (1.7%) | 0 (0.0%) |
| 7+ Person Households | 0 (0.0%) | 0 (0.0%) |
| Total | 978 (56.5%) | 753 (43.5%) |
Female Fertility in Hudson Bend
Fertility by Age in Hudson Bend
| Age Bracket | Women with Births | Births / 1,000 Women |
| 15 to 19 years | 0 (0.0%) | 0.0 |
| 20 to 34 years | 0 (0.0%) | 0.0 |
| 35 to 50 years | 0 (0.0%) | 0.0 |
| Total | 0 (0.0%) | 0.0 |
Fertility by Age by Marriage Status in Hudson Bend
| Age Bracket | Married | Unmarried |
| 15 to 19 years | 0 (0.0%) | 0 (0.0%) |
| 20 to 34 years | 0 (0.0%) | 0 (0.0%) |
| 35 to 50 years | 0 (0.0%) | 0 (0.0%) |
| Total | 0 (0.0%) | 0 (0.0%) |
Fertility by Education in Hudson Bend
| Educational Attainment | Women with Births | Births / 1,000 Women |
| Less than High School | 0 (0.0%) | 0.0 |
| High School Diploma | 0 (0.0%) | 0.0 |
| College or Associate's Degree | 0 (0.0%) | 0.0 |
| Bachelor's Degree | 0 (0.0%) | 0.0 |
| Graduate Degree | 0 (0.0%) | 0.0 |
| Total | 0 (0.0%) | 0.0 |
Fertility by Education by Marriage Status in Hudson Bend
| Educational Attainment | Married | Unmarried |
| Less than High School | 0 (0.0%) | 0 (0.0%) |
| High School Diploma | 0 (0.0%) | 0 (0.0%) |
| College or Associate's Degree | 0 (0.0%) | 0 (0.0%) |
| Bachelor's Degree | 0 (0.0%) | 0 (0.0%) |
| Graduate Degree | 0 (0.0%) | 0 (0.0%) |
| Total | 0 (0.0%) | 0 (0.0%) |
Employment Characteristics in Hudson Bend
Employment by Class of Employer in Hudson Bend
Among the 1,961 employed individuals in Hudson Bend, private company employees (1,174 | 59.9%), self-employed (not incorporated) (297 | 15.1%), and self-employed (incorporated) (252 | 12.9%) make up the most common classes of employment.
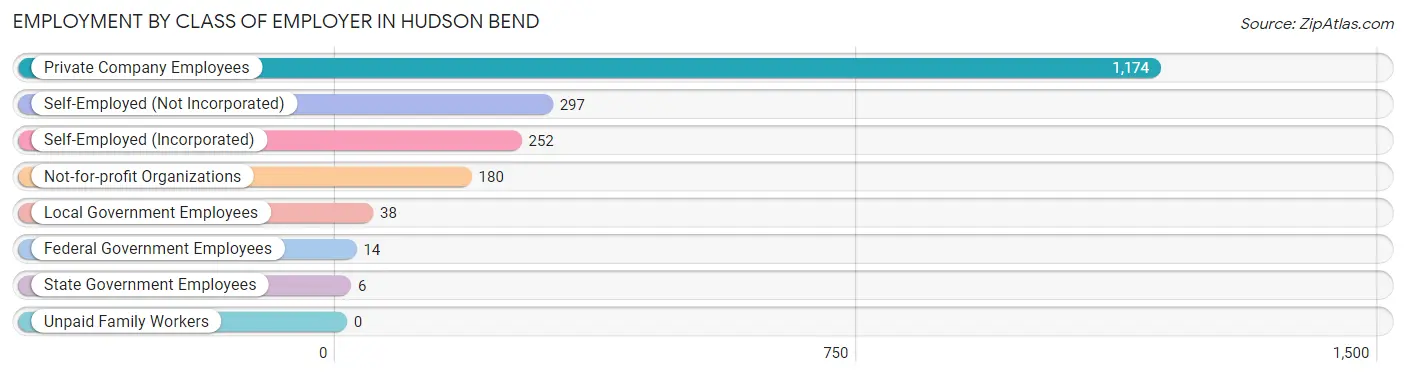
| Employer Class | # Employees | % Employees |
| Private Company Employees | 1,174 | 59.9% |
| Self-Employed (Incorporated) | 252 | 12.9% |
| Self-Employed (Not Incorporated) | 297 | 15.1% |
| Not-for-profit Organizations | 180 | 9.2% |
| Local Government Employees | 38 | 1.9% |
| State Government Employees | 6 | 0.3% |
| Federal Government Employees | 14 | 0.7% |
| Unpaid Family Workers | 0 | 0.0% |
| Total | 1,961 | 100.0% |
Employment Status by Age in Hudson Bend
According to the labor force statistics for Hudson Bend, out of the total population over 16 years of age (3,243), 63.6% or 2,063 individuals are in the labor force, with 3.9% or 80 of them unemployed. The age group with the highest labor force participation rate is 30 to 34 years, with 100.0% or 146 individuals in the labor force. Within the labor force, the 55 to 59 years age range has the highest percentage of unemployed individuals, with 15.3% or 53 of them being unemployed.
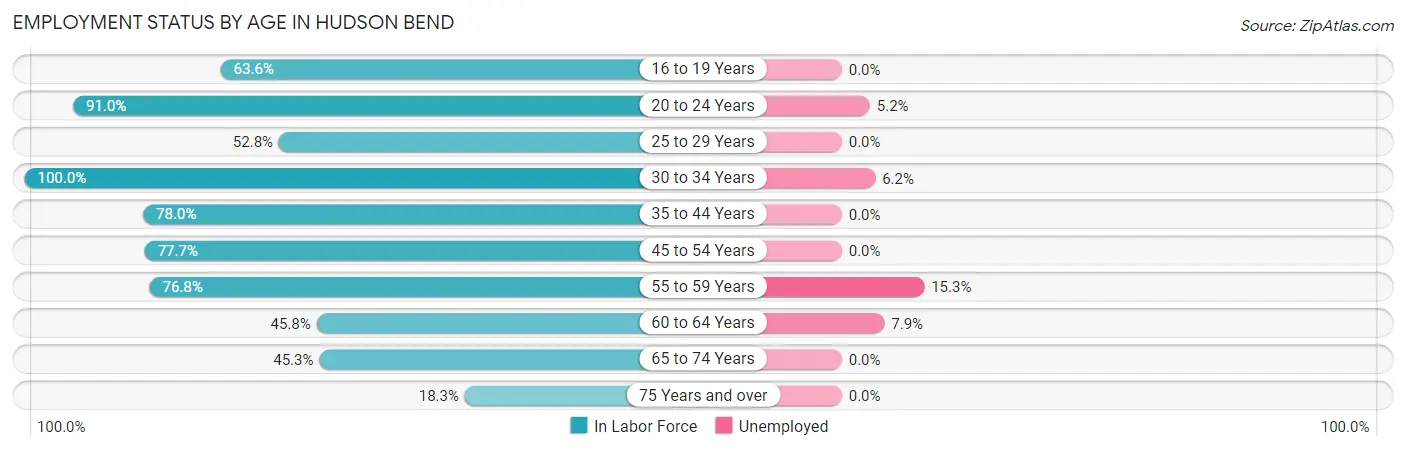
| Age Bracket | In Labor Force | Unemployed |
| 16 to 19 Years | 63 (63.6%) | 0 (0.0%) |
| 20 to 24 Years | 172 (91.0%) | 9 (5.2%) |
| 25 to 29 Years | 103 (52.8%) | 0 (0.0%) |
| 30 to 34 Years | 146 (100.0%) | 9 (6.2%) |
| 35 to 44 Years | 198 (78.0%) | 0 (0.0%) |
| 45 to 54 Years | 629 (77.7%) | 0 (0.0%) |
| 55 to 59 Years | 347 (76.8%) | 53 (15.3%) |
| 60 to 64 Years | 127 (45.8%) | 10 (7.9%) |
| 65 to 74 Years | 211 (45.3%) | 0 (0.0%) |
| 75 Years and over | 65 (18.3%) | 0 (0.0%) |
| Total | 2,063 (63.6%) | 80 (3.9%) |
Employment Status by Educational Attainment in Hudson Bend
According to labor force statistics for Hudson Bend, 72.6% of individuals (1,549) out of the total population between 25 and 64 years of age (2,134) are in the labor force, with 4.6% or 71 of them being unemployed. The group with the highest labor force participation rate are those with the educational attainment of college / associate degree, with 80.7% or 317 individuals in the labor force. Within the labor force, individuals with college / associate degree education have the highest percentage of unemployment, with 16.7% or 53 of them being unemployed.
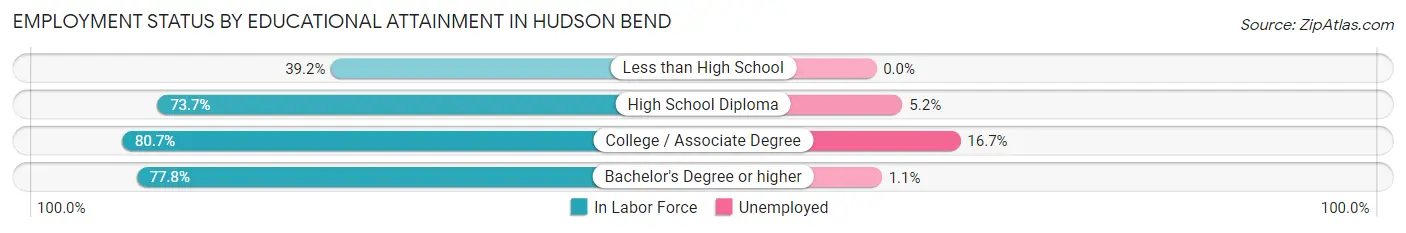
| Educational Attainment | In Labor Force | Unemployed |
| Less than High School | 114 (39.2%) | 0 (0.0%) |
| High School Diploma | 174 (73.7%) | 12 (5.2%) |
| College / Associate Degree | 317 (80.7%) | 66 (16.7%) |
| Bachelor's Degree or higher | 944 (77.8%) | 13 (1.1%) |
| Total | 1,549 (72.6%) | 98 (4.6%) |
Employment Occupations by Sex in Hudson Bend
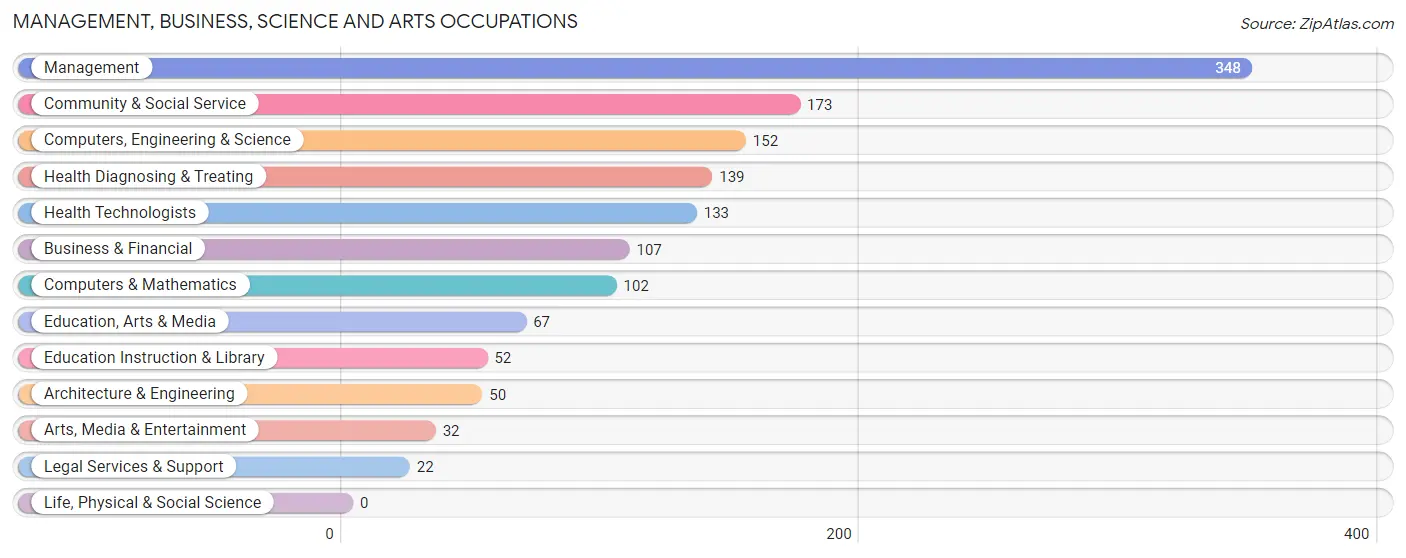
Management, Business, Science and Arts Occupations
The most common Management, Business, Science and Arts occupations in Hudson Bend are Management (348 | 17.6%), Community & Social Service (173 | 8.7%), Computers, Engineering & Science (152 | 7.7%), Health Diagnosing & Treating (139 | 7.0%), and Health Technologists (133 | 6.7%).
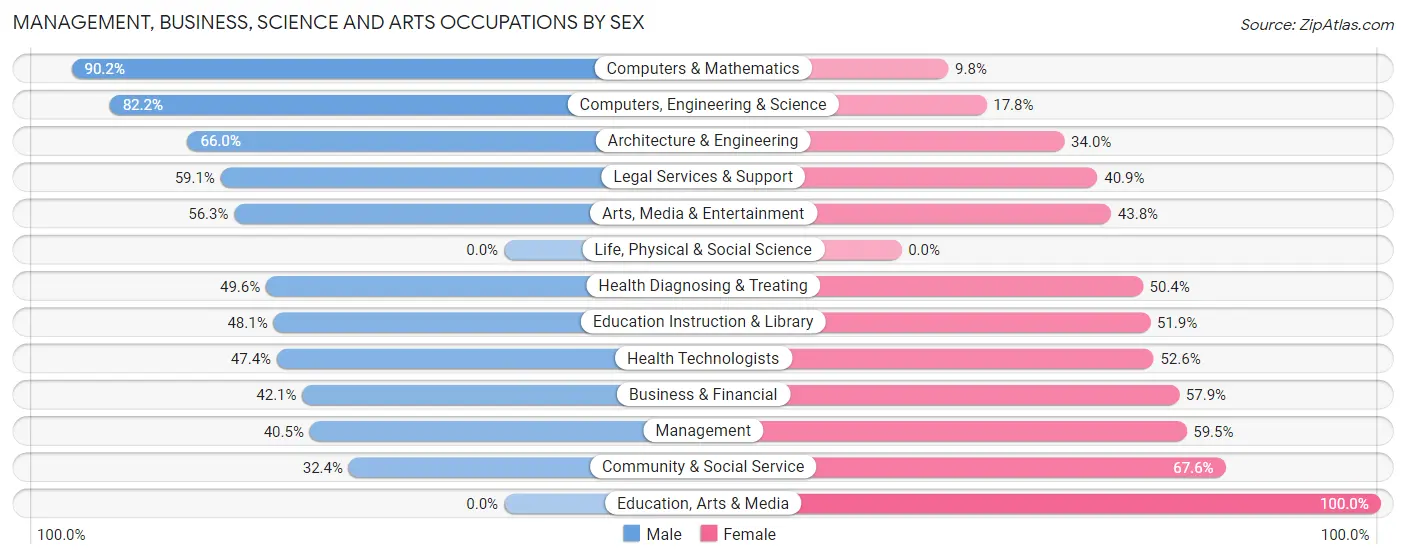
Management, Business, Science and Arts Occupations by Sex
Within the Management, Business, Science and Arts occupations in Hudson Bend, the most male-oriented occupations are Computers & Mathematics (90.2%), Computers, Engineering & Science (82.2%), and Architecture & Engineering (66.0%), while the most female-oriented occupations are Education, Arts & Media (100.0%), Community & Social Service (67.6%), and Management (59.5%).
| Occupation | Male | Female |
| Management | 141 (40.5%) | 207 (59.5%) |
| Business & Financial | 45 (42.1%) | 62 (57.9%) |
| Computers, Engineering & Science | 125 (82.2%) | 27 (17.8%) |
| Computers & Mathematics | 92 (90.2%) | 10 (9.8%) |
| Architecture & Engineering | 33 (66.0%) | 17 (34.0%) |
| Life, Physical & Social Science | 0 (0.0%) | 0 (0.0%) |
| Community & Social Service | 56 (32.4%) | 117 (67.6%) |
| Education, Arts & Media | 0 (0.0%) | 67 (100.0%) |
| Legal Services & Support | 13 (59.1%) | 9 (40.9%) |
| Education Instruction & Library | 25 (48.1%) | 27 (51.9%) |
| Arts, Media & Entertainment | 18 (56.2%) | 14 (43.8%) |
| Health Diagnosing & Treating | 69 (49.6%) | 70 (50.4%) |
| Health Technologists | 63 (47.4%) | 70 (52.6%) |
| Total (Category) | 436 (47.4%) | 483 (52.6%) |
| Total (Overall) | 1,008 (50.9%) | 972 (49.1%) |
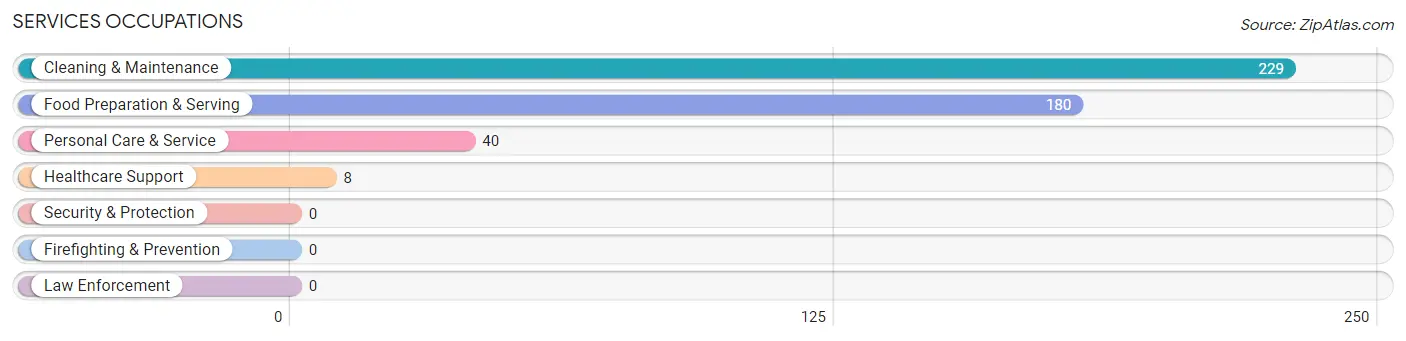
Services Occupations
The most common Services occupations in Hudson Bend are Cleaning & Maintenance (229 | 11.6%), Food Preparation & Serving (180 | 9.1%), Personal Care & Service (40 | 2.0%), and Healthcare Support (8 | 0.4%).
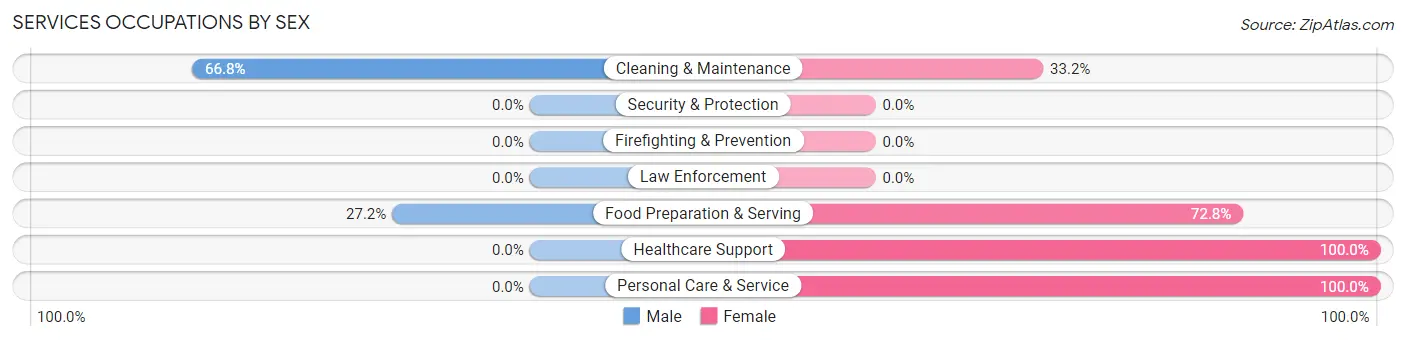
Services Occupations by Sex
Within the Services occupations in Hudson Bend, the most male-oriented occupations are Cleaning & Maintenance (66.8%), and Food Preparation & Serving (27.2%), while the most female-oriented occupations are Healthcare Support (100.0%), Personal Care & Service (100.0%), and Food Preparation & Serving (72.8%).
| Occupation | Male | Female |
| Healthcare Support | 0 (0.0%) | 8 (100.0%) |
| Security & Protection | 0 (0.0%) | 0 (0.0%) |
| Firefighting & Prevention | 0 (0.0%) | 0 (0.0%) |
| Law Enforcement | 0 (0.0%) | 0 (0.0%) |
| Food Preparation & Serving | 49 (27.2%) | 131 (72.8%) |
| Cleaning & Maintenance | 153 (66.8%) | 76 (33.2%) |
| Personal Care & Service | 0 (0.0%) | 40 (100.0%) |
| Total (Category) | 202 (44.2%) | 255 (55.8%) |
| Total (Overall) | 1,008 (50.9%) | 972 (49.1%) |
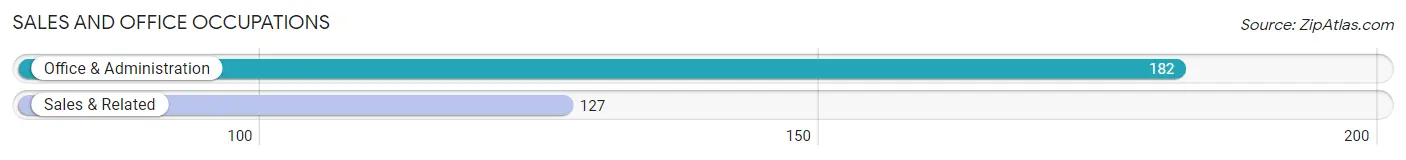
Sales and Office Occupations
The most common Sales and Office occupations in Hudson Bend are Office & Administration (182 | 9.2%), and Sales & Related (127 | 6.4%).
Sales and Office Occupations by Sex
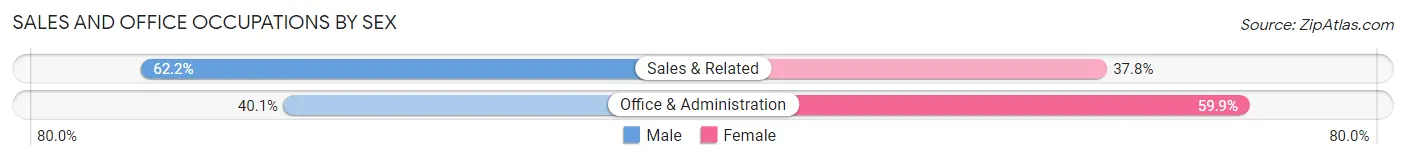
| Occupation | Male | Female |
| Sales & Related | 79 (62.2%) | 48 (37.8%) |
| Office & Administration | 73 (40.1%) | 109 (59.9%) |
| Total (Category) | 152 (49.2%) | 157 (50.8%) |
| Total (Overall) | 1,008 (50.9%) | 972 (49.1%) |
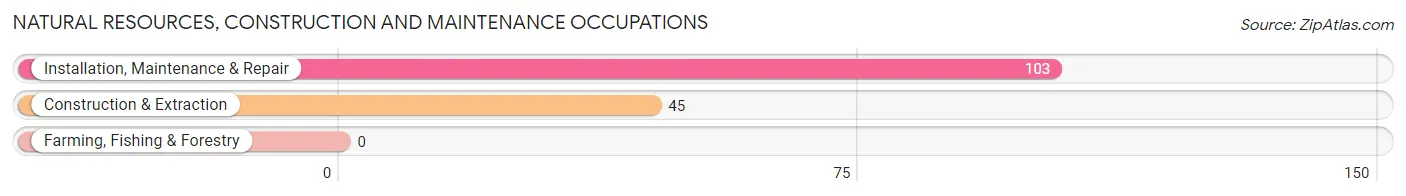
Natural Resources, Construction and Maintenance Occupations
The most common Natural Resources, Construction and Maintenance occupations in Hudson Bend are Installation, Maintenance & Repair (103 | 5.2%), and Construction & Extraction (45 | 2.3%).
Natural Resources, Construction and Maintenance Occupations by Sex
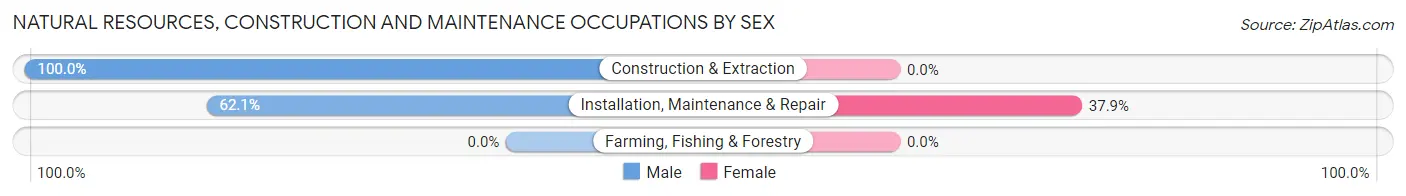
| Occupation | Male | Female |
| Farming, Fishing & Forestry | 0 (0.0%) | 0 (0.0%) |
| Construction & Extraction | 45 (100.0%) | 0 (0.0%) |
| Installation, Maintenance & Repair | 64 (62.1%) | 39 (37.9%) |
| Total (Category) | 109 (73.7%) | 39 (26.4%) |
| Total (Overall) | 1,008 (50.9%) | 972 (49.1%) |
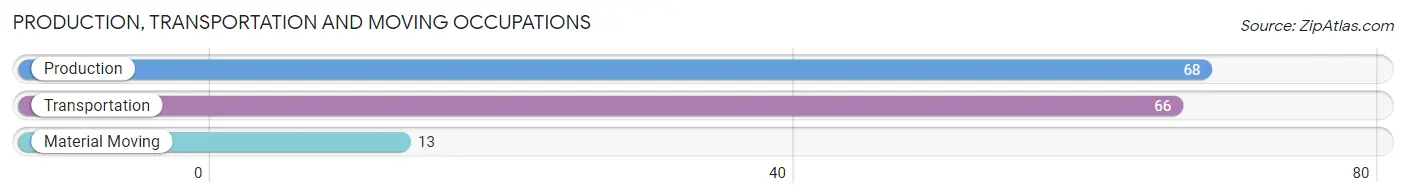
Production, Transportation and Moving Occupations
The most common Production, Transportation and Moving occupations in Hudson Bend are Production (68 | 3.4%), Transportation (66 | 3.3%), and Material Moving (13 | 0.7%).
Production, Transportation and Moving Occupations by Sex
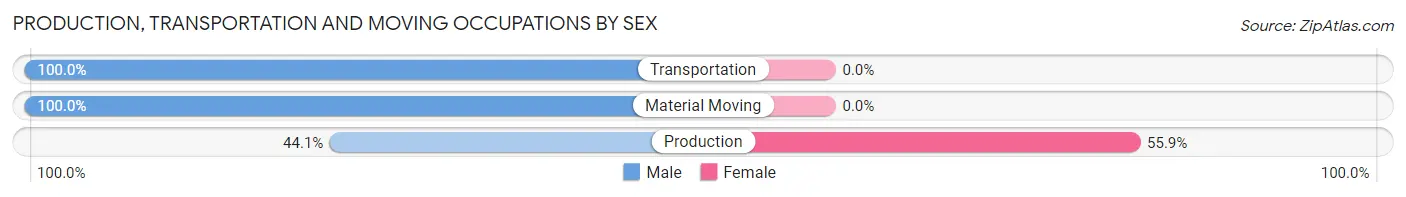
| Occupation | Male | Female |
| Production | 30 (44.1%) | 38 (55.9%) |
| Transportation | 66 (100.0%) | 0 (0.0%) |
| Material Moving | 13 (100.0%) | 0 (0.0%) |
| Total (Category) | 109 (74.2%) | 38 (25.9%) |
| Total (Overall) | 1,008 (50.9%) | 972 (49.1%) |
Employment Industries by Sex in Hudson Bend
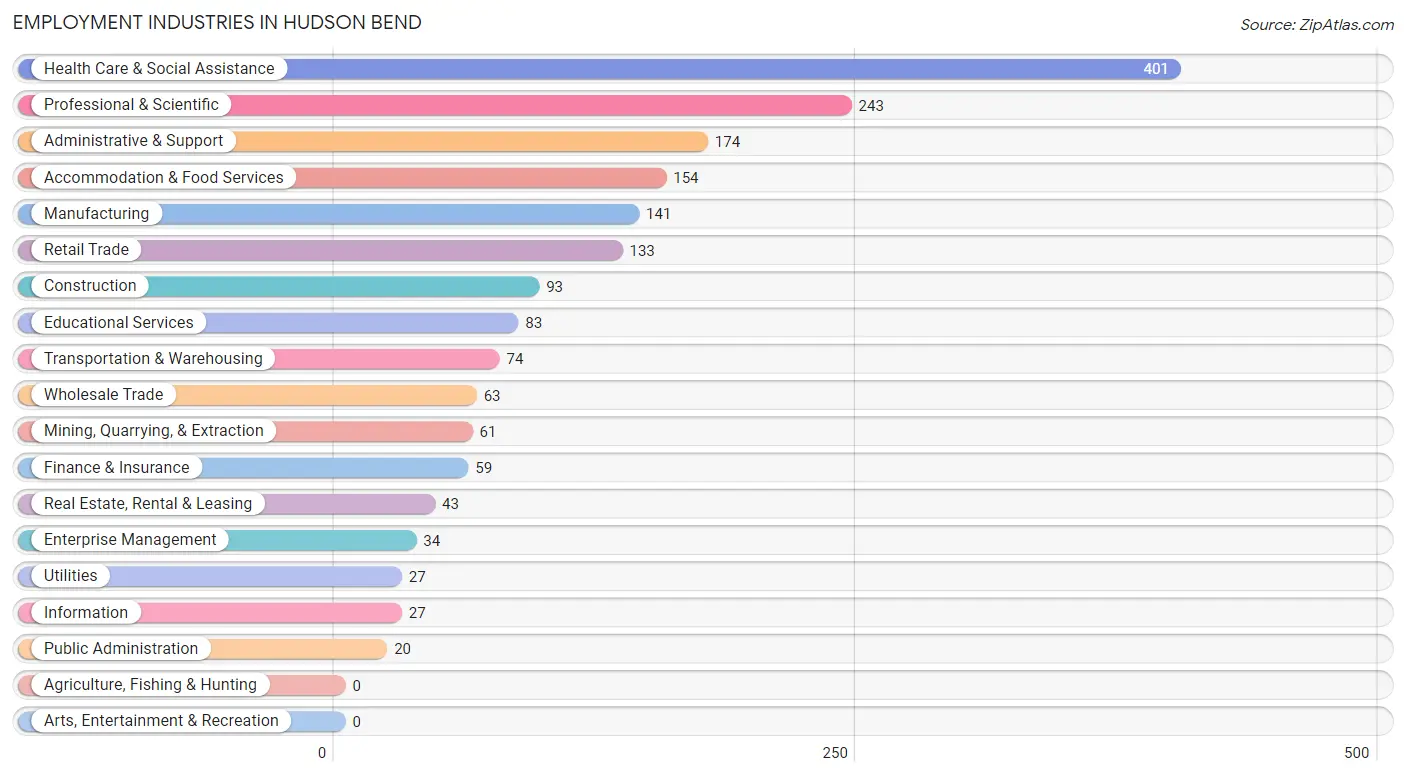
Employment Industries in Hudson Bend
The major employment industries in Hudson Bend include Health Care & Social Assistance (401 | 20.3%), Professional & Scientific (243 | 12.3%), Administrative & Support (174 | 8.8%), Accommodation & Food Services (154 | 7.8%), and Manufacturing (141 | 7.1%).
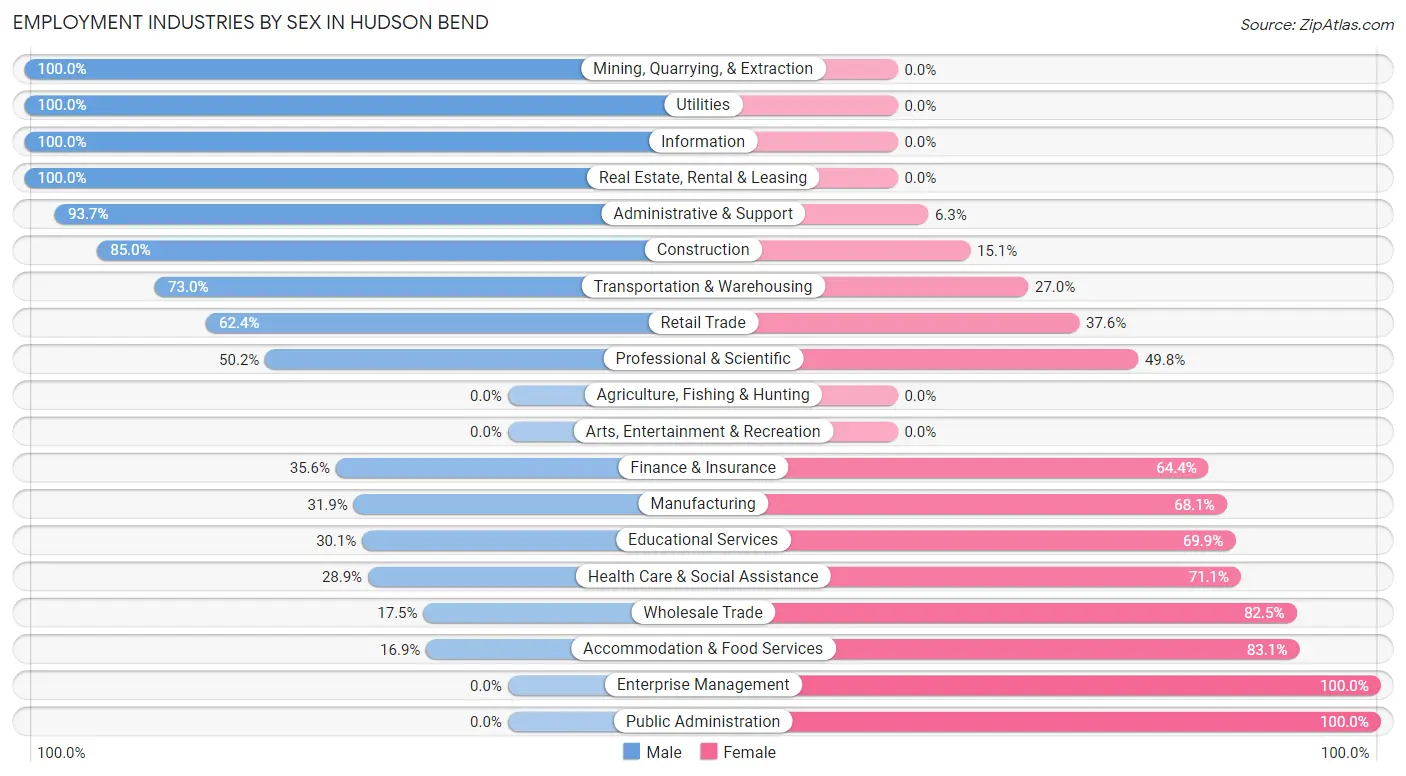
Employment Industries by Sex in Hudson Bend
The Hudson Bend industries that see more men than women are Mining, Quarrying, & Extraction (100.0%), Utilities (100.0%), and Information (100.0%), whereas the industries that tend to have a higher number of women are Enterprise Management (100.0%), Public Administration (100.0%), and Accommodation & Food Services (83.1%).
| Industry | Male | Female |
| Agriculture, Fishing & Hunting | 0 (0.0%) | 0 (0.0%) |
| Mining, Quarrying, & Extraction | 61 (100.0%) | 0 (0.0%) |
| Construction | 79 (85.0%) | 14 (15.0%) |
| Manufacturing | 45 (31.9%) | 96 (68.1%) |
| Wholesale Trade | 11 (17.5%) | 52 (82.5%) |
| Retail Trade | 83 (62.4%) | 50 (37.6%) |
| Transportation & Warehousing | 54 (73.0%) | 20 (27.0%) |
| Utilities | 27 (100.0%) | 0 (0.0%) |
| Information | 27 (100.0%) | 0 (0.0%) |
| Finance & Insurance | 21 (35.6%) | 38 (64.4%) |
| Real Estate, Rental & Leasing | 43 (100.0%) | 0 (0.0%) |
| Professional & Scientific | 122 (50.2%) | 121 (49.8%) |
| Enterprise Management | 0 (0.0%) | 34 (100.0%) |
| Administrative & Support | 163 (93.7%) | 11 (6.3%) |
| Educational Services | 25 (30.1%) | 58 (69.9%) |
| Health Care & Social Assistance | 116 (28.9%) | 285 (71.1%) |
| Arts, Entertainment & Recreation | 0 (0.0%) | 0 (0.0%) |
| Accommodation & Food Services | 26 (16.9%) | 128 (83.1%) |
| Public Administration | 0 (0.0%) | 20 (100.0%) |
| Total | 1,008 (50.9%) | 972 (49.1%) |
Education in Hudson Bend
School Enrollment in Hudson Bend
The most common levels of schooling among the 792 students in Hudson Bend are high school (196 | 24.7%), elementary school (181 | 22.9%), and college / undergraduate (145 | 18.3%).
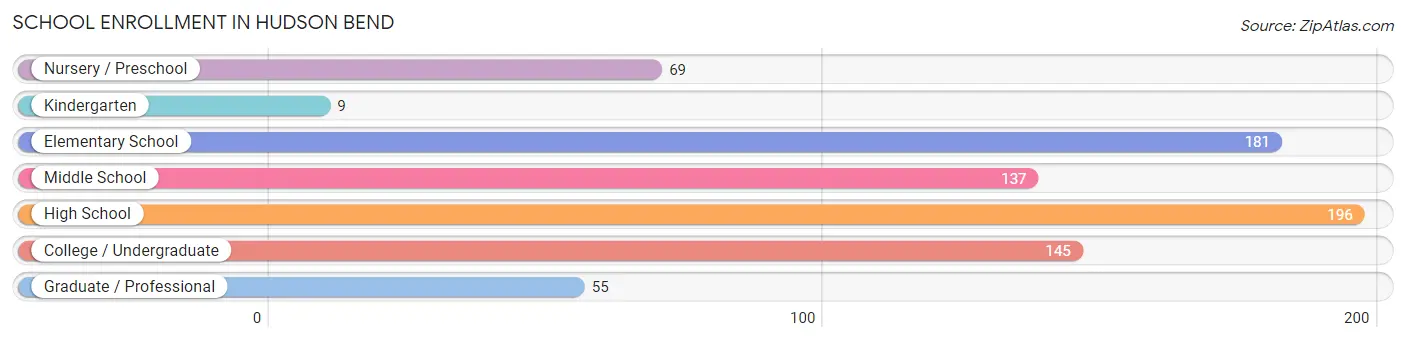
| School Level | # Students | % Students |
| Nursery / Preschool | 69 | 8.7% |
| Kindergarten | 9 | 1.1% |
| Elementary School | 181 | 22.9% |
| Middle School | 137 | 17.3% |
| High School | 196 | 24.7% |
| College / Undergraduate | 145 | 18.3% |
| Graduate / Professional | 55 | 6.9% |
| Total | 792 | 100.0% |
School Enrollment by Age by Funding Source in Hudson Bend
Out of a total of 792 students who are enrolled in schools in Hudson Bend, 164 (20.7%) attend a private institution, while the remaining 628 (79.3%) are enrolled in public schools. The age group of 20 to 24 year olds has the highest likelihood of being enrolled in private schools, with 135 (78.9% in the age bracket) enrolled. Conversely, the age group of 3 to 4 year olds has the lowest likelihood of being enrolled in a private school, with 37 (100.0% in the age bracket) attending a public institution.
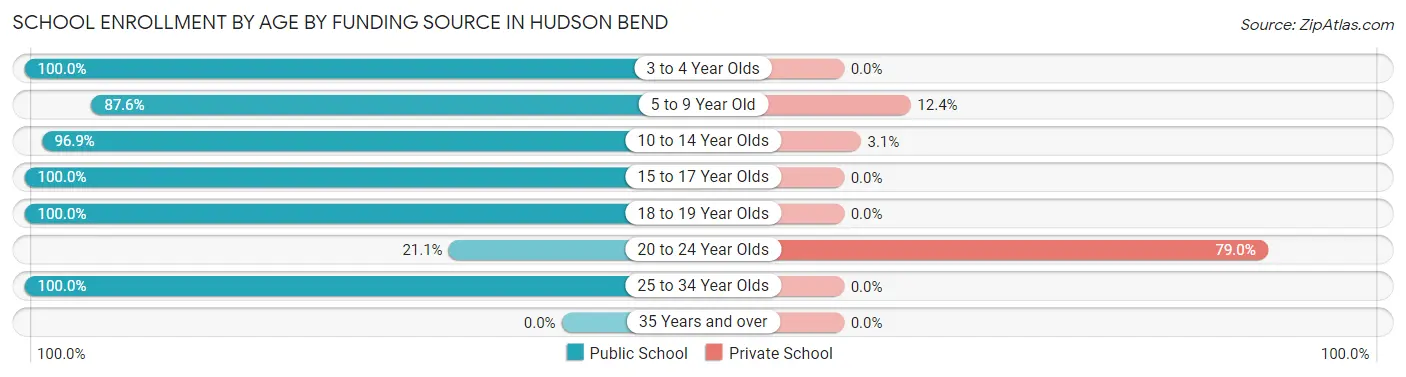
| Age Bracket | Public School | Private School |
| 3 to 4 Year Olds | 37 (100.0%) | 0 (0.0%) |
| 5 to 9 Year Old | 162 (87.6%) | 23 (12.4%) |
| 10 to 14 Year Olds | 185 (96.9%) | 6 (3.1%) |
| 15 to 17 Year Olds | 67 (100.0%) | 0 (0.0%) |
| 18 to 19 Year Olds | 8 (100.0%) | 0 (0.0%) |
| 20 to 24 Year Olds | 36 (21.0%) | 135 (78.9%) |
| 25 to 34 Year Olds | 133 (100.0%) | 0 (0.0%) |
| 35 Years and over | 0 (0.0%) | 0 (0.0%) |
| Total | 628 (79.3%) | 164 (20.7%) |
Educational Attainment by Field of Study in Hudson Bend
Business (490 | 26.9%), visual & performing arts (261 | 14.3%), engineering (177 | 9.7%), education (163 | 8.9%), and bio, nature & agricultural (157 | 8.6%) are the most common fields of study among 1,824 individuals in Hudson Bend who have obtained a bachelor's degree or higher.
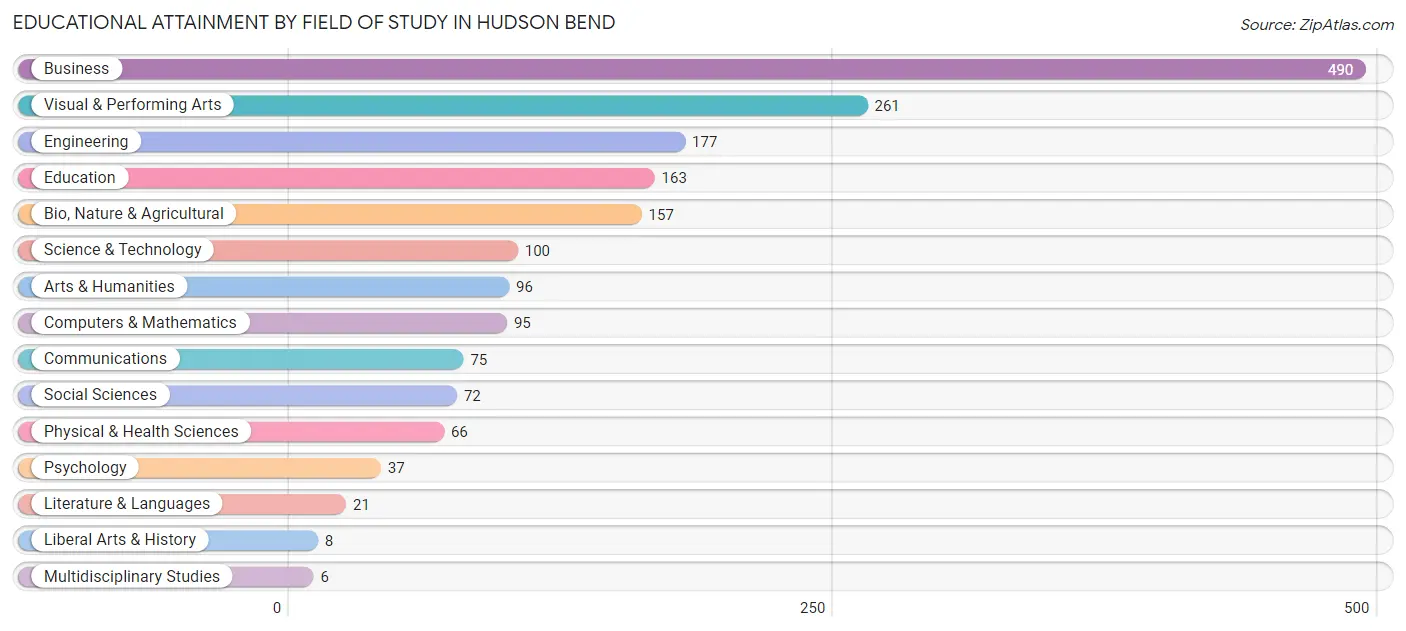
| Field of Study | # Graduates | % Graduates |
| Computers & Mathematics | 95 | 5.2% |
| Bio, Nature & Agricultural | 157 | 8.6% |
| Physical & Health Sciences | 66 | 3.6% |
| Psychology | 37 | 2.0% |
| Social Sciences | 72 | 4.0% |
| Engineering | 177 | 9.7% |
| Multidisciplinary Studies | 6 | 0.3% |
| Science & Technology | 100 | 5.5% |
| Business | 490 | 26.9% |
| Education | 163 | 8.9% |
| Literature & Languages | 21 | 1.1% |
| Liberal Arts & History | 8 | 0.4% |
| Visual & Performing Arts | 261 | 14.3% |
| Communications | 75 | 4.1% |
| Arts & Humanities | 96 | 5.3% |
| Total | 1,824 | 100.0% |
Transportation & Commute in Hudson Bend
Vehicle Availability by Sex in Hudson Bend
The most prevalent vehicle ownership categories in Hudson Bend are males with 3 vehicles (354, accounting for 35.8%) and females with 3 vehicles (344, making up 36.4%).
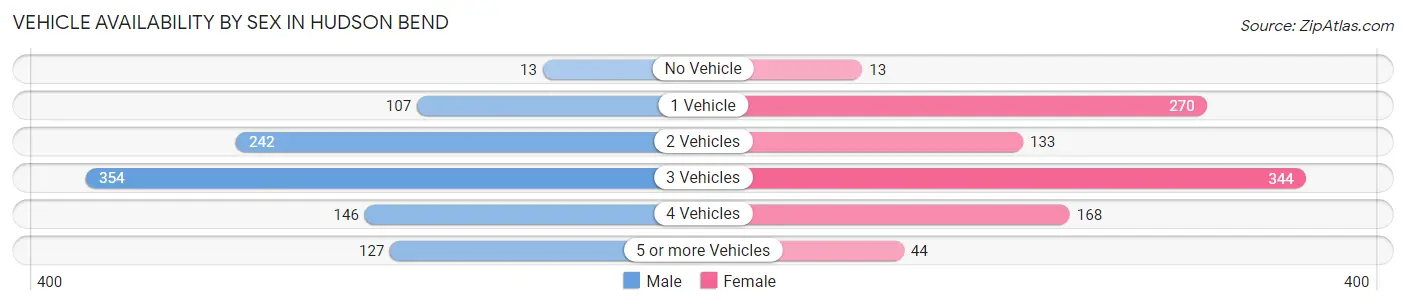
| Vehicles Available | Male | Female |
| No Vehicle | 13 (1.3%) | 13 (1.3%) |
| 1 Vehicle | 107 (10.8%) | 270 (27.8%) |
| 2 Vehicles | 242 (24.5%) | 133 (13.7%) |
| 3 Vehicles | 354 (35.8%) | 344 (35.4%) |
| 4 Vehicles | 146 (14.8%) | 168 (17.3%) |
| 5 or more Vehicles | 127 (12.8%) | 44 (4.5%) |
| Total | 989 (100.0%) | 972 (100.0%) |
Commute Time in Hudson Bend
The most frequently occuring commute durations in Hudson Bend are 10 to 14 minutes (238 commuters, 17.4%), 35 to 39 minutes (215 commuters, 15.7%), and 30 to 34 minutes (176 commuters, 12.9%).
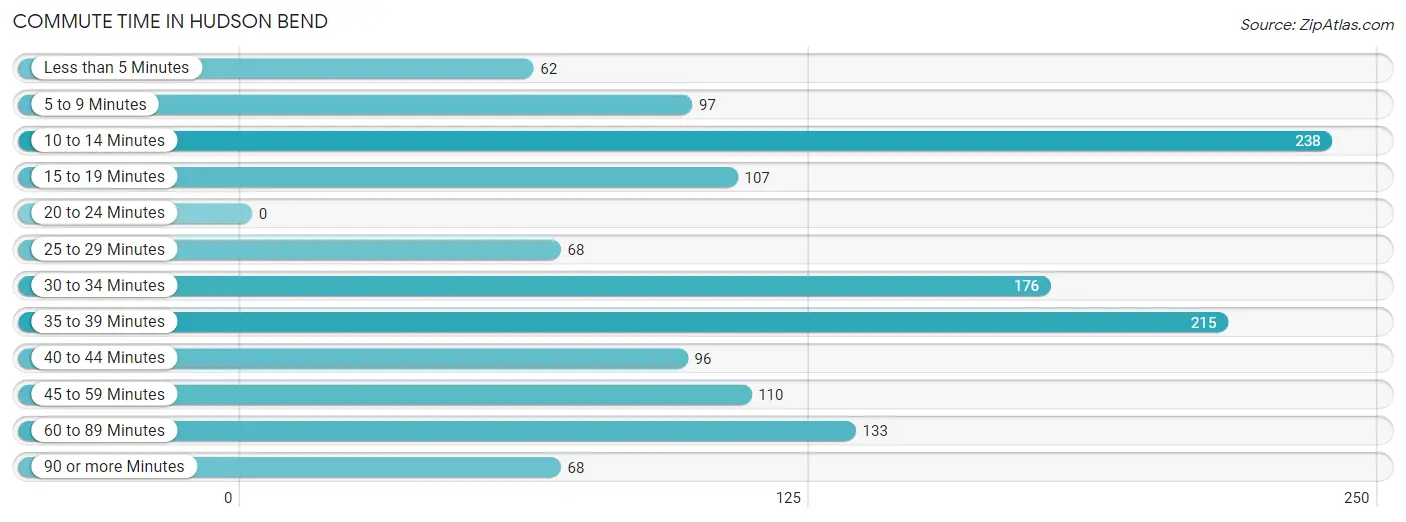
| Commute Time | # Commuters | % Commuters |
| Less than 5 Minutes | 62 | 4.5% |
| 5 to 9 Minutes | 97 | 7.1% |
| 10 to 14 Minutes | 238 | 17.4% |
| 15 to 19 Minutes | 107 | 7.8% |
| 20 to 24 Minutes | 0 | 0.0% |
| 25 to 29 Minutes | 68 | 5.0% |
| 30 to 34 Minutes | 176 | 12.9% |
| 35 to 39 Minutes | 215 | 15.7% |
| 40 to 44 Minutes | 96 | 7.0% |
| 45 to 59 Minutes | 110 | 8.0% |
| 60 to 89 Minutes | 133 | 9.7% |
| 90 or more Minutes | 68 | 5.0% |
Commute Time by Sex in Hudson Bend
The most common commute times in Hudson Bend are 35 to 39 minutes (117 commuters, 18.1%) for males and 10 to 14 minutes (197 commuters, 27.3%) for females.
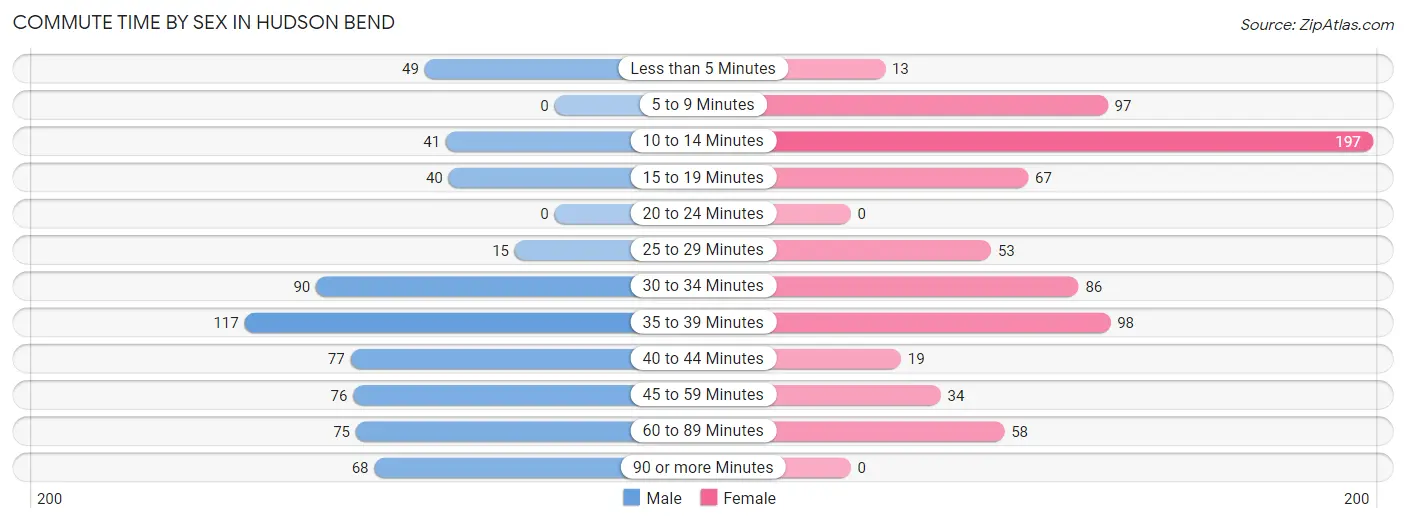
| Commute Time | Male | Female |
| Less than 5 Minutes | 49 (7.6%) | 13 (1.8%) |
| 5 to 9 Minutes | 0 (0.0%) | 97 (13.4%) |
| 10 to 14 Minutes | 41 (6.3%) | 197 (27.3%) |
| 15 to 19 Minutes | 40 (6.2%) | 67 (9.3%) |
| 20 to 24 Minutes | 0 (0.0%) | 0 (0.0%) |
| 25 to 29 Minutes | 15 (2.3%) | 53 (7.3%) |
| 30 to 34 Minutes | 90 (13.9%) | 86 (11.9%) |
| 35 to 39 Minutes | 117 (18.1%) | 98 (13.6%) |
| 40 to 44 Minutes | 77 (11.9%) | 19 (2.6%) |
| 45 to 59 Minutes | 76 (11.7%) | 34 (4.7%) |
| 60 to 89 Minutes | 75 (11.6%) | 58 (8.0%) |
| 90 or more Minutes | 68 (10.5%) | 0 (0.0%) |
Time of Departure to Work by Sex in Hudson Bend
The most frequent times of departure to work in Hudson Bend are 8:00 AM to 8:29 AM (186, 28.7%) for males and 8:00 AM to 8:29 AM (158, 21.9%) for females.
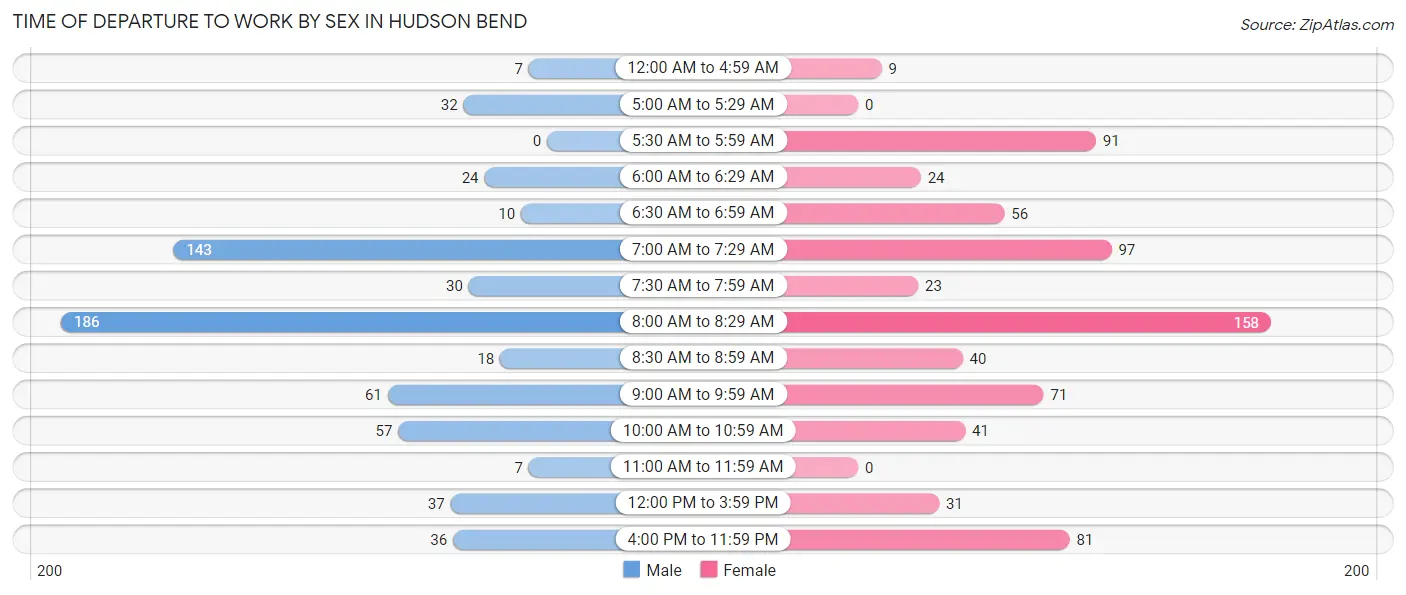
| Time of Departure | Male | Female |
| 12:00 AM to 4:59 AM | 7 (1.1%) | 9 (1.3%) |
| 5:00 AM to 5:29 AM | 32 (4.9%) | 0 (0.0%) |
| 5:30 AM to 5:59 AM | 0 (0.0%) | 91 (12.6%) |
| 6:00 AM to 6:29 AM | 24 (3.7%) | 24 (3.3%) |
| 6:30 AM to 6:59 AM | 10 (1.5%) | 56 (7.8%) |
| 7:00 AM to 7:29 AM | 143 (22.1%) | 97 (13.4%) |
| 7:30 AM to 7:59 AM | 30 (4.6%) | 23 (3.2%) |
| 8:00 AM to 8:29 AM | 186 (28.7%) | 158 (21.9%) |
| 8:30 AM to 8:59 AM | 18 (2.8%) | 40 (5.5%) |
| 9:00 AM to 9:59 AM | 61 (9.4%) | 71 (9.8%) |
| 10:00 AM to 10:59 AM | 57 (8.8%) | 41 (5.7%) |
| 11:00 AM to 11:59 AM | 7 (1.1%) | 0 (0.0%) |
| 12:00 PM to 3:59 PM | 37 (5.7%) | 31 (4.3%) |
| 4:00 PM to 11:59 PM | 36 (5.6%) | 81 (11.2%) |
| Total | 648 (100.0%) | 722 (100.0%) |
Housing Occupancy in Hudson Bend
Occupancy by Ownership in Hudson Bend
Of the total 1,731 dwellings in Hudson Bend, owner-occupied units account for 1,197 (69.2%), while renter-occupied units make up 534 (30.8%).
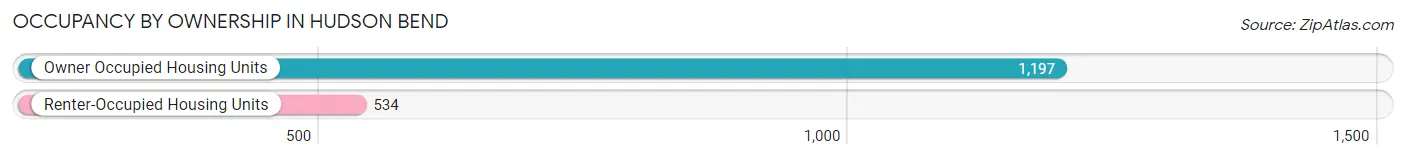
| Occupancy | # Housing Units | % Housing Units |
| Owner Occupied Housing Units | 1,197 | 69.2% |
| Renter-Occupied Housing Units | 534 | 30.8% |
| Total Occupied Housing Units | 1,731 | 100.0% |
Occupancy by Household Size in Hudson Bend
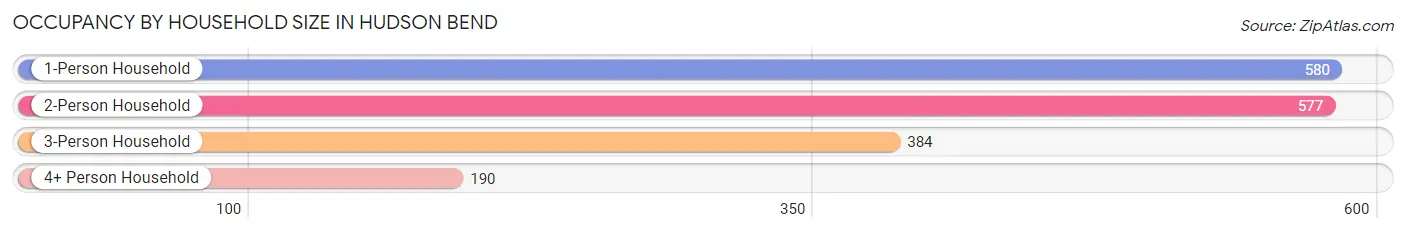
| Household Size | # Housing Units | % Housing Units |
| 1-Person Household | 580 | 33.5% |
| 2-Person Household | 577 | 33.3% |
| 3-Person Household | 384 | 22.2% |
| 4+ Person Household | 190 | 11.0% |
| Total Housing Units | 1,731 | 100.0% |
Occupancy by Ownership by Household Size in Hudson Bend
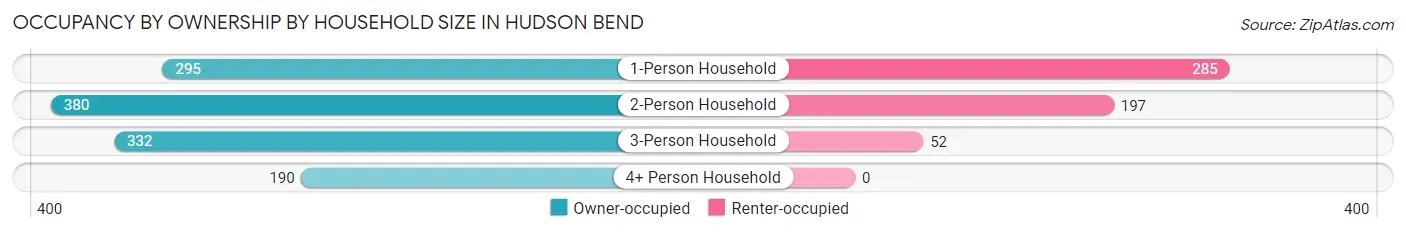
| Household Size | Owner-occupied | Renter-occupied |
| 1-Person Household | 295 (50.9%) | 285 (49.1%) |
| 2-Person Household | 380 (65.9%) | 197 (34.1%) |
| 3-Person Household | 332 (86.5%) | 52 (13.5%) |
| 4+ Person Household | 190 (100.0%) | 0 (0.0%) |
| Total Housing Units | 1,197 (69.2%) | 534 (30.8%) |
Occupancy by Educational Attainment in Hudson Bend
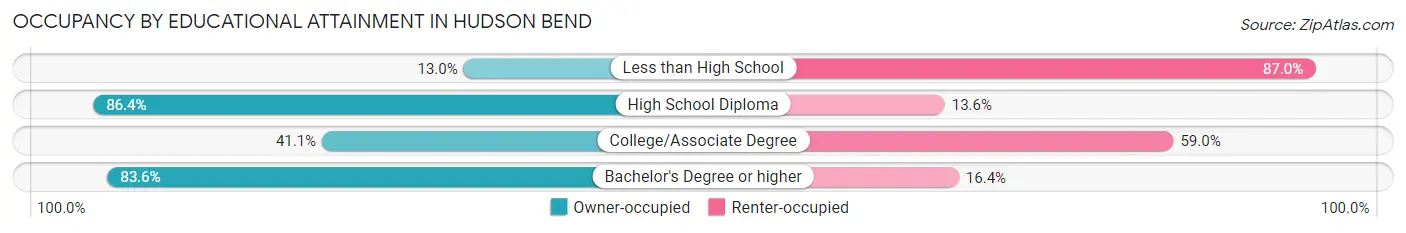
| Household Size | Owner-occupied | Renter-occupied |
| Less than High School | 17 (13.0%) | 114 (87.0%) |
| High School Diploma | 127 (86.4%) | 20 (13.6%) |
| College/Associate Degree | 156 (41.0%) | 224 (59.0%) |
| Bachelor's Degree or higher | 897 (83.6%) | 176 (16.4%) |
Occupancy by Age of Householder in Hudson Bend
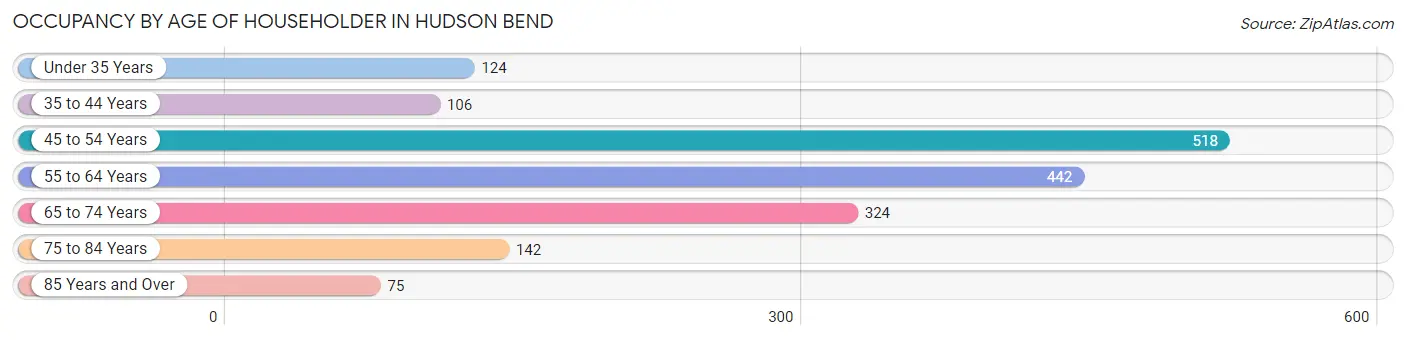
| Age Bracket | # Households | % Households |
| Under 35 Years | 124 | 7.2% |
| 35 to 44 Years | 106 | 6.1% |
| 45 to 54 Years | 518 | 29.9% |
| 55 to 64 Years | 442 | 25.5% |
| 65 to 74 Years | 324 | 18.7% |
| 75 to 84 Years | 142 | 8.2% |
| 85 Years and Over | 75 | 4.3% |
| Total | 1,731 | 100.0% |
Housing Finances in Hudson Bend
Median Income by Occupancy in Hudson Bend
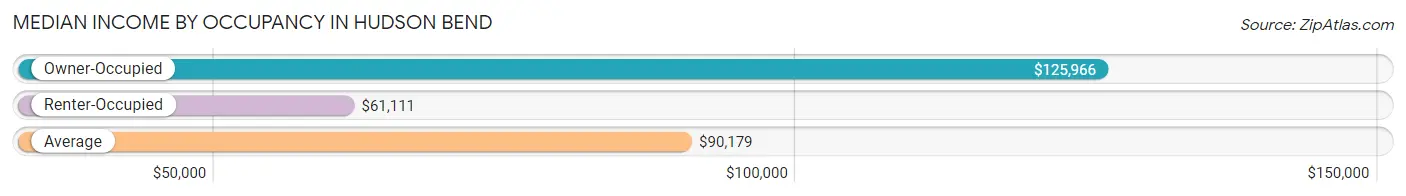
| Occupancy Type | # Households | Median Income |
| Owner-Occupied | 1,197 (69.2%) | $125,966 |
| Renter-Occupied | 534 (30.8%) | $61,111 |
| Average | 1,731 (100.0%) | $90,179 |
Occupancy by Householder Income Bracket in Hudson Bend
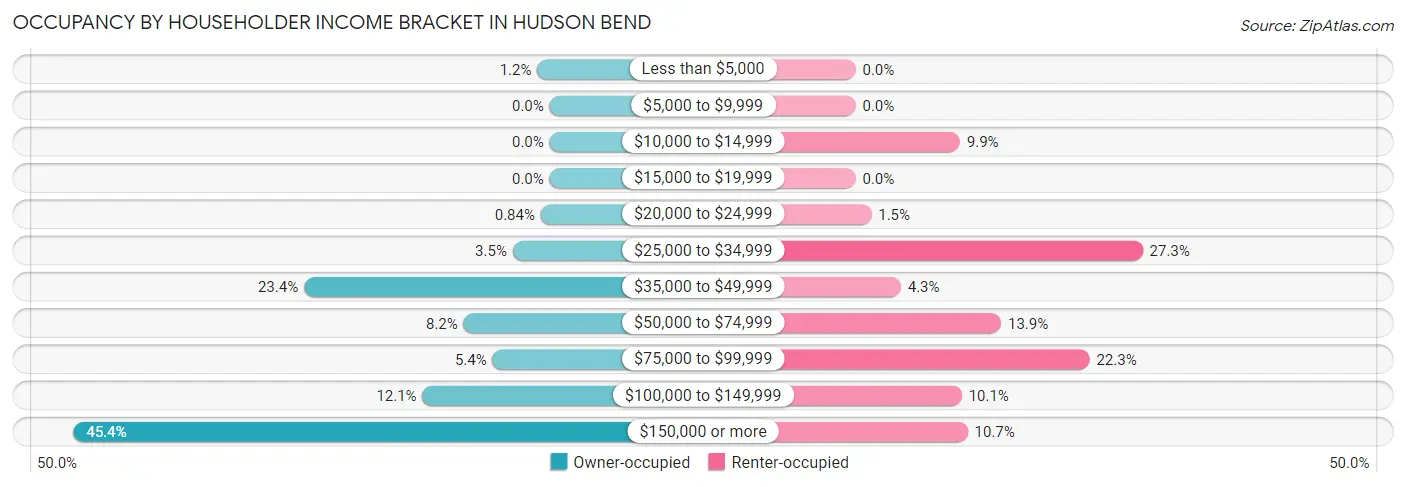
| Income Bracket | Owner-occupied | Renter-occupied |
| Less than $5,000 | 14 (1.2%) | 0 (0.0%) |
| $5,000 to $9,999 | 0 (0.0%) | 0 (0.0%) |
| $10,000 to $14,999 | 0 (0.0%) | 53 (9.9%) |
| $15,000 to $19,999 | 0 (0.0%) | 0 (0.0%) |
| $20,000 to $24,999 | 10 (0.8%) | 8 (1.5%) |
| $25,000 to $34,999 | 42 (3.5%) | 146 (27.3%) |
| $35,000 to $49,999 | 280 (23.4%) | 23 (4.3%) |
| $50,000 to $74,999 | 98 (8.2%) | 74 (13.9%) |
| $75,000 to $99,999 | 65 (5.4%) | 119 (22.3%) |
| $100,000 to $149,999 | 145 (12.1%) | 54 (10.1%) |
| $150,000 or more | 543 (45.4%) | 57 (10.7%) |
| Total | 1,197 (100.0%) | 534 (100.0%) |
Monthly Housing Cost Tiers in Hudson Bend
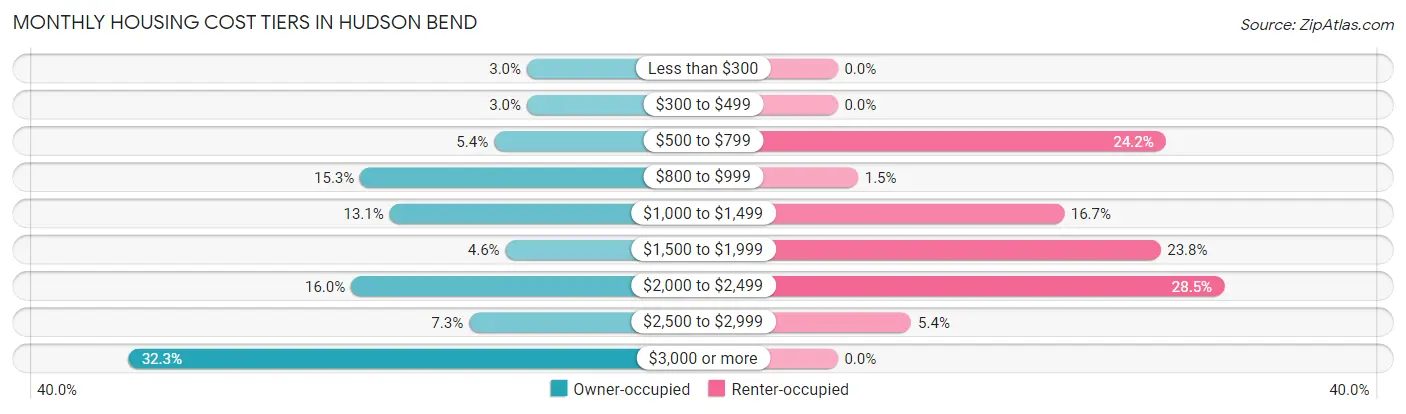
| Monthly Cost | Owner-occupied | Renter-occupied |
| Less than $300 | 36 (3.0%) | 0 (0.0%) |
| $300 to $499 | 36 (3.0%) | 0 (0.0%) |
| $500 to $799 | 65 (5.4%) | 129 (24.2%) |
| $800 to $999 | 183 (15.3%) | 8 (1.5%) |
| $1,000 to $1,499 | 157 (13.1%) | 89 (16.7%) |
| $1,500 to $1,999 | 55 (4.6%) | 127 (23.8%) |
| $2,000 to $2,499 | 191 (16.0%) | 152 (28.5%) |
| $2,500 to $2,999 | 87 (7.3%) | 29 (5.4%) |
| $3,000 or more | 387 (32.3%) | 0 (0.0%) |
| Total | 1,197 (100.0%) | 534 (100.0%) |
Physical Housing Characteristics in Hudson Bend
Housing Structures in Hudson Bend
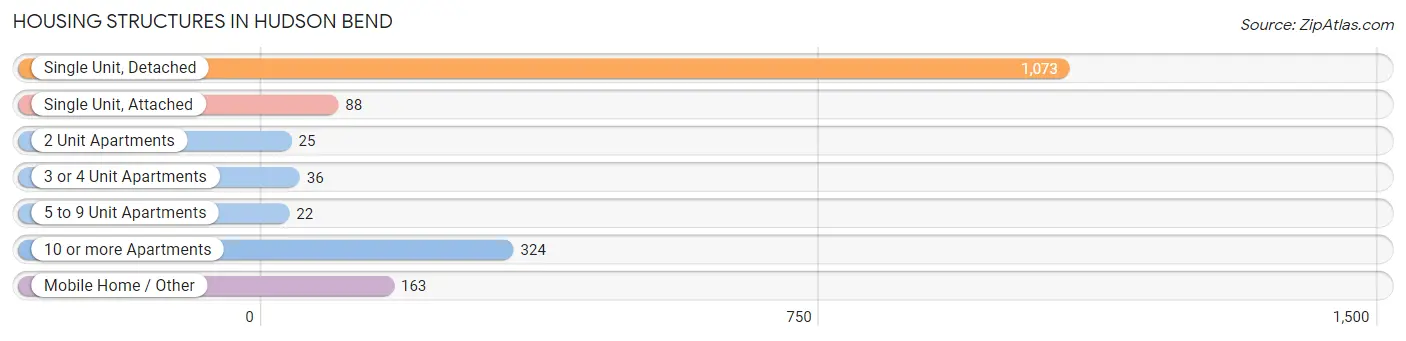
| Structure Type | # Housing Units | % Housing Units |
| Single Unit, Detached | 1,073 | 62.0% |
| Single Unit, Attached | 88 | 5.1% |
| 2 Unit Apartments | 25 | 1.4% |
| 3 or 4 Unit Apartments | 36 | 2.1% |
| 5 to 9 Unit Apartments | 22 | 1.3% |
| 10 or more Apartments | 324 | 18.7% |
| Mobile Home / Other | 163 | 9.4% |
| Total | 1,731 | 100.0% |
Housing Structures by Occupancy in Hudson Bend
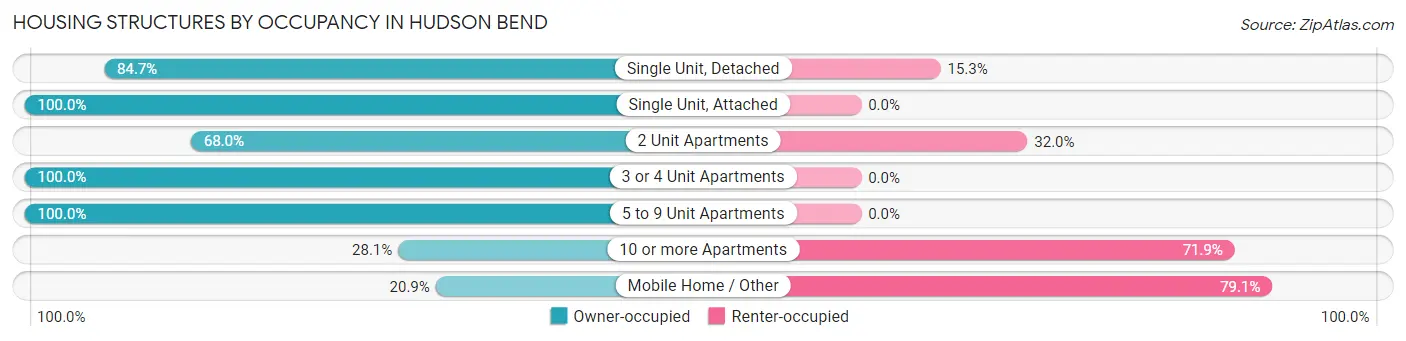
| Structure Type | Owner-occupied | Renter-occupied |
| Single Unit, Detached | 909 (84.7%) | 164 (15.3%) |
| Single Unit, Attached | 88 (100.0%) | 0 (0.0%) |
| 2 Unit Apartments | 17 (68.0%) | 8 (32.0%) |
| 3 or 4 Unit Apartments | 36 (100.0%) | 0 (0.0%) |
| 5 to 9 Unit Apartments | 22 (100.0%) | 0 (0.0%) |
| 10 or more Apartments | 91 (28.1%) | 233 (71.9%) |
| Mobile Home / Other | 34 (20.9%) | 129 (79.1%) |
| Total | 1,197 (69.2%) | 534 (30.8%) |
Housing Structures by Number of Rooms in Hudson Bend
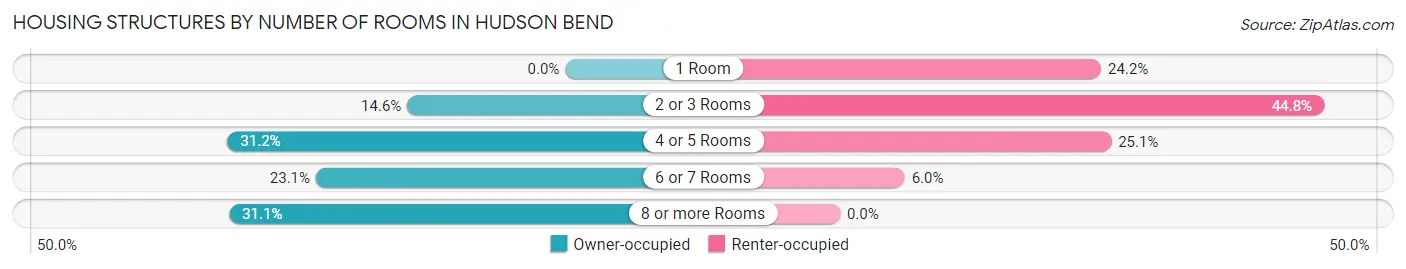
| Number of Rooms | Owner-occupied | Renter-occupied |
| 1 Room | 0 (0.0%) | 129 (24.2%) |
| 2 or 3 Rooms | 175 (14.6%) | 239 (44.8%) |
| 4 or 5 Rooms | 374 (31.2%) | 134 (25.1%) |
| 6 or 7 Rooms | 276 (23.1%) | 32 (6.0%) |
| 8 or more Rooms | 372 (31.1%) | 0 (0.0%) |
| Total | 1,197 (100.0%) | 534 (100.0%) |
Housing Structure by Heating Type in Hudson Bend
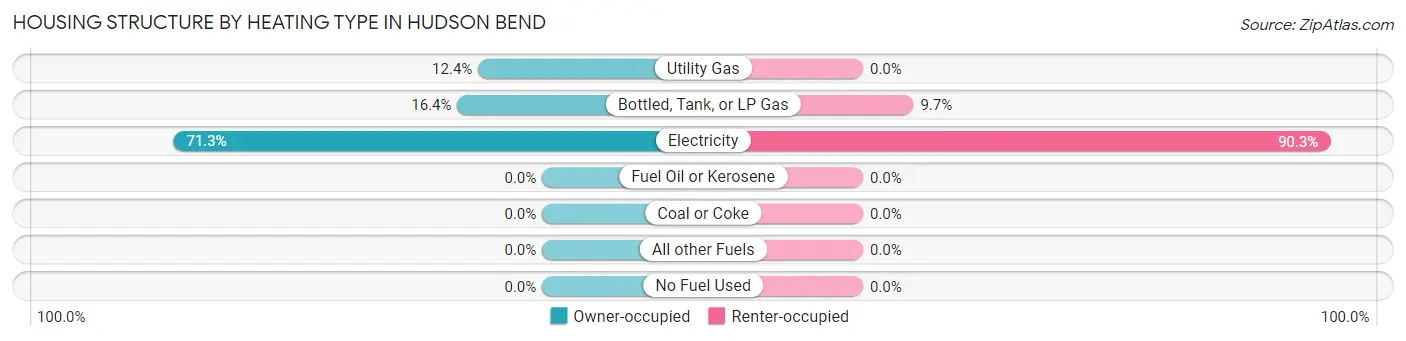
| Heating Type | Owner-occupied | Renter-occupied |
| Utility Gas | 148 (12.4%) | 0 (0.0%) |
| Bottled, Tank, or LP Gas | 196 (16.4%) | 52 (9.7%) |
| Electricity | 853 (71.3%) | 482 (90.3%) |
| Fuel Oil or Kerosene | 0 (0.0%) | 0 (0.0%) |
| Coal or Coke | 0 (0.0%) | 0 (0.0%) |
| All other Fuels | 0 (0.0%) | 0 (0.0%) |
| No Fuel Used | 0 (0.0%) | 0 (0.0%) |
| Total | 1,197 (100.0%) | 534 (100.0%) |
Household Vehicle Usage in Hudson Bend
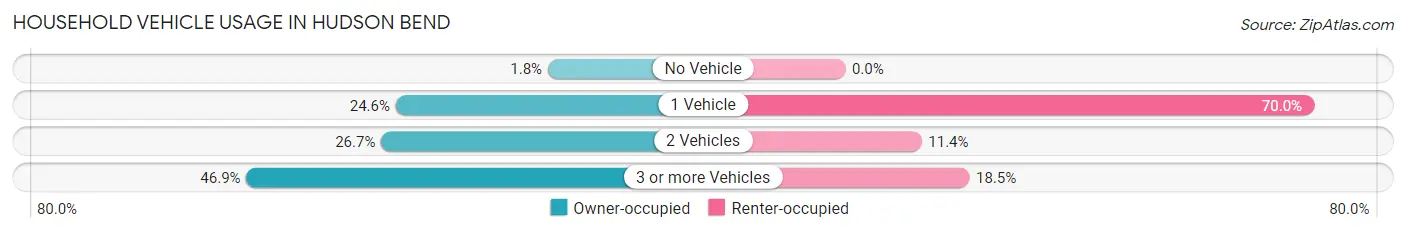
| Vehicles per Household | Owner-occupied | Renter-occupied |
| No Vehicle | 22 (1.8%) | 0 (0.0%) |
| 1 Vehicle | 294 (24.6%) | 374 (70.0%) |
| 2 Vehicles | 320 (26.7%) | 61 (11.4%) |
| 3 or more Vehicles | 561 (46.9%) | 99 (18.5%) |
| Total | 1,197 (100.0%) | 534 (100.0%) |
Real Estate & Mortgages in Hudson Bend
Real Estate and Mortgage Overview in Hudson Bend
| Characteristic | Without Mortgage | With Mortgage |
| Housing Units | 576 | 621 |
| Median Property Value | $664,000 | $647,600 |
| Median Household Income | $59,800 | $377 |
| Monthly Housing Costs | $945 | $355 |
| Real Estate Taxes | $4,758 | $35 |
Property Value by Mortgage Status in Hudson Bend
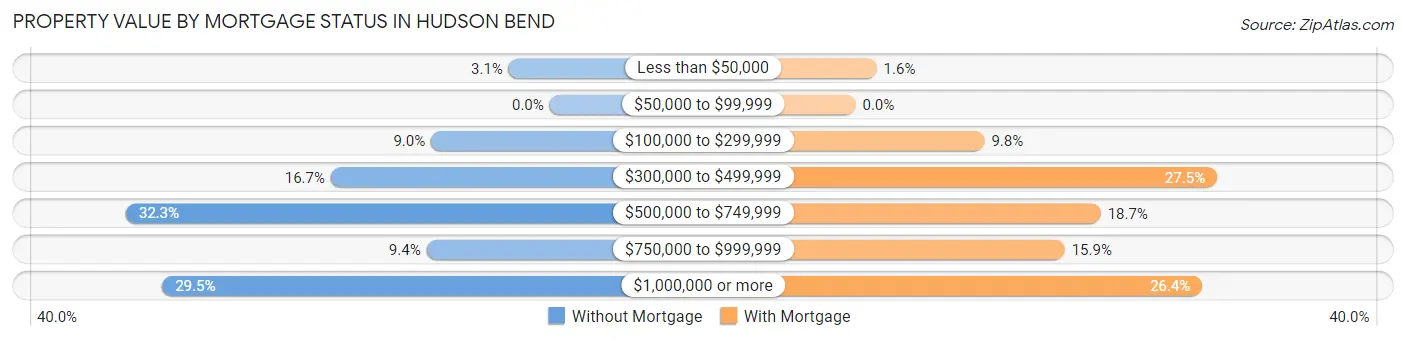
| Property Value | Without Mortgage | With Mortgage |
| Less than $50,000 | 18 (3.1%) | 10 (1.6%) |
| $50,000 to $99,999 | 0 (0.0%) | 0 (0.0%) |
| $100,000 to $299,999 | 52 (9.0%) | 61 (9.8%) |
| $300,000 to $499,999 | 96 (16.7%) | 171 (27.5%) |
| $500,000 to $749,999 | 186 (32.3%) | 116 (18.7%) |
| $750,000 to $999,999 | 54 (9.4%) | 99 (15.9%) |
| $1,000,000 or more | 170 (29.5%) | 164 (26.4%) |
| Total | 576 (100.0%) | 621 (100.0%) |
Household Income by Mortgage Status in Hudson Bend
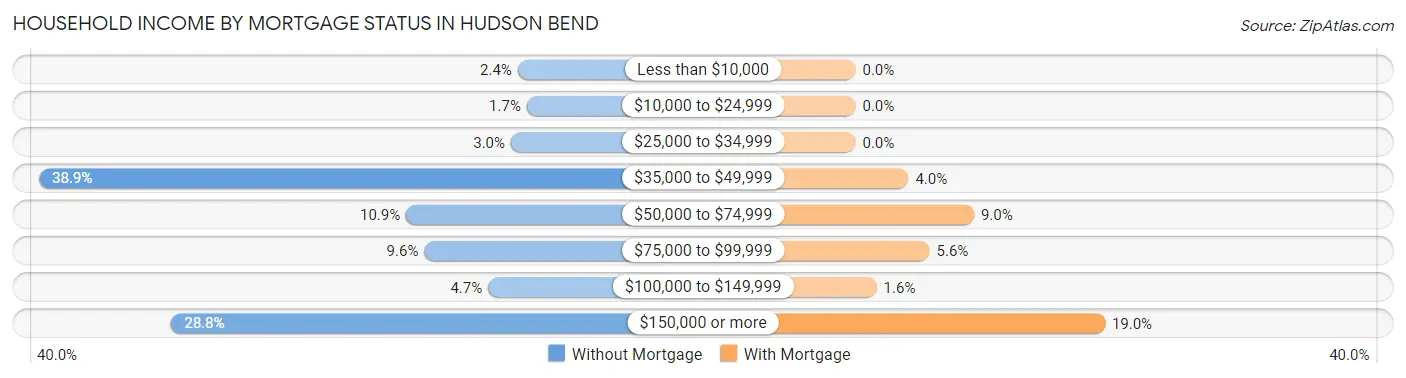
| Household Income | Without Mortgage | With Mortgage |
| Less than $10,000 | 14 (2.4%) | 0 (0.0%) |
| $10,000 to $24,999 | 10 (1.7%) | 0 (0.0%) |
| $25,000 to $34,999 | 17 (2.9%) | 0 (0.0%) |
| $35,000 to $49,999 | 224 (38.9%) | 25 (4.0%) |
| $50,000 to $74,999 | 63 (10.9%) | 56 (9.0%) |
| $75,000 to $99,999 | 55 (9.6%) | 35 (5.6%) |
| $100,000 to $149,999 | 27 (4.7%) | 10 (1.6%) |
| $150,000 or more | 166 (28.8%) | 118 (19.0%) |
| Total | 576 (100.0%) | 621 (100.0%) |
Property Value to Household Income Ratio in Hudson Bend
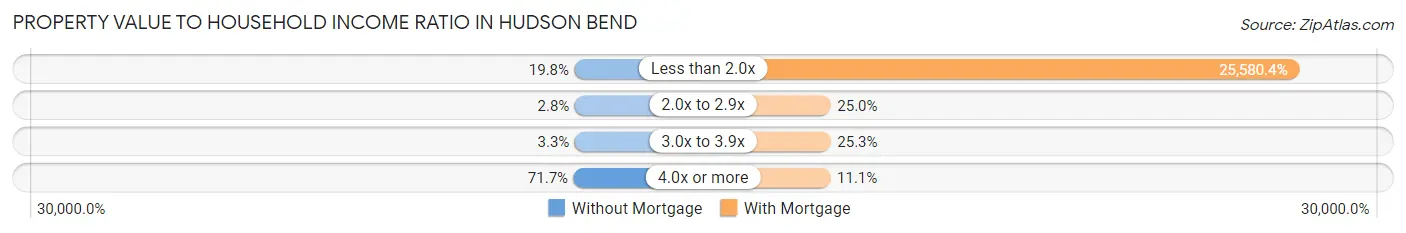
| Value-to-Income Ratio | Without Mortgage | With Mortgage |
| Less than 2.0x | 114 (19.8%) | 158,854 (25,580.4%) |
| 2.0x to 2.9x | 16 (2.8%) | 155 (25.0%) |
| 3.0x to 3.9x | 19 (3.3%) | 157 (25.3%) |
| 4.0x or more | 413 (71.7%) | 69 (11.1%) |
| Total | 576 (100.0%) | 621 (100.0%) |
Real Estate Taxes by Mortgage Status in Hudson Bend
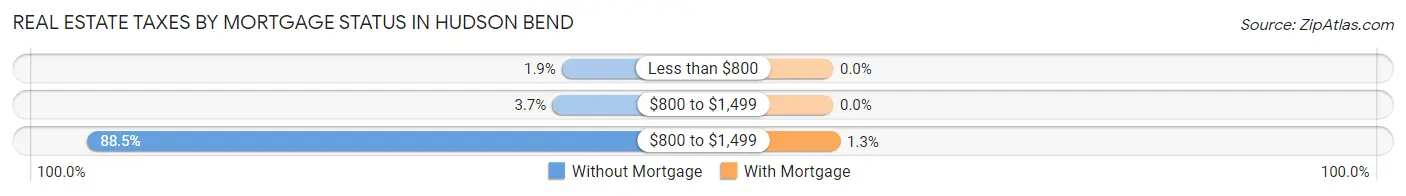
| Property Taxes | Without Mortgage | With Mortgage |
| Less than $800 | 11 (1.9%) | 0 (0.0%) |
| $800 to $1,499 | 21 (3.6%) | 0 (0.0%) |
| $800 to $1,499 | 510 (88.5%) | 8 (1.3%) |
| Total | 576 (100.0%) | 621 (100.0%) |
Health & Disability in Hudson Bend
Health Insurance Coverage by Age in Hudson Bend
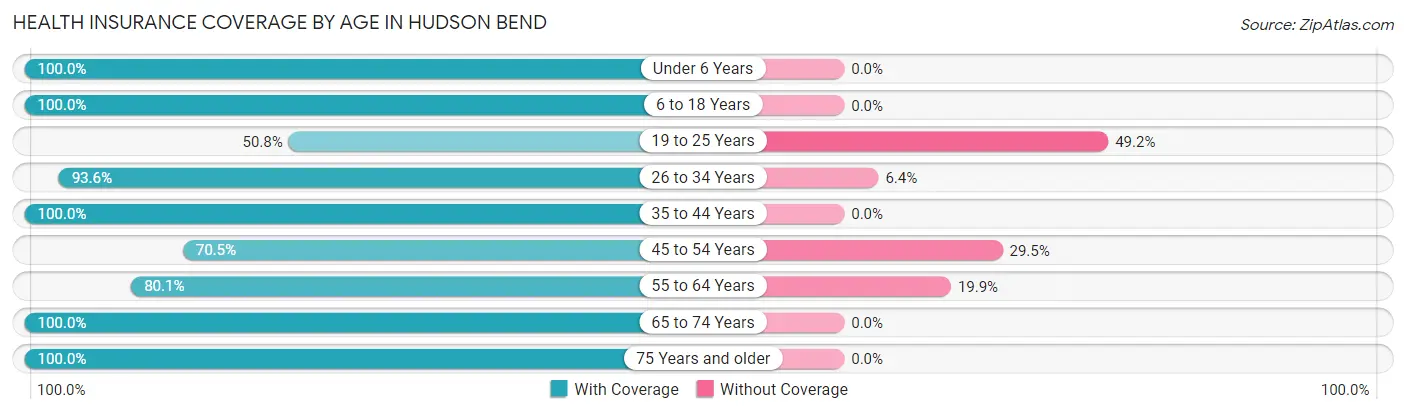
| Age Bracket | With Coverage | Without Coverage |
| Under 6 Years | 78 (100.0%) | 0 (0.0%) |
| 6 to 18 Years | 410 (100.0%) | 0 (0.0%) |
| 19 to 25 Years | 130 (50.8%) | 126 (49.2%) |
| 26 to 34 Years | 294 (93.6%) | 20 (6.4%) |
| 35 to 44 Years | 254 (100.0%) | 0 (0.0%) |
| 45 to 54 Years | 571 (70.5%) | 239 (29.5%) |
| 55 to 64 Years | 584 (80.1%) | 145 (19.9%) |
| 65 to 74 Years | 466 (100.0%) | 0 (0.0%) |
| 75 Years and older | 355 (100.0%) | 0 (0.0%) |
| Total | 3,142 (85.6%) | 530 (14.4%) |
Health Insurance Coverage by Citizenship Status in Hudson Bend
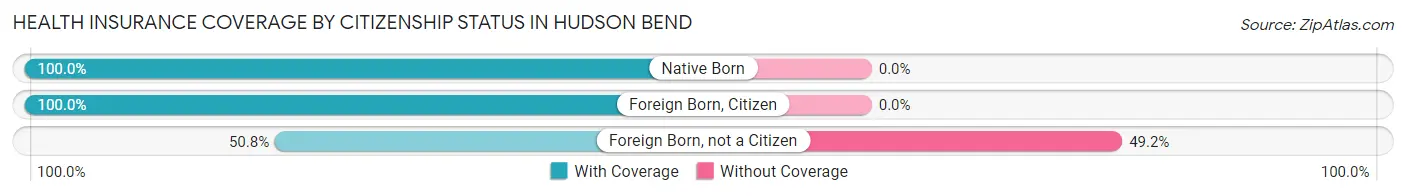
| Citizenship Status | With Coverage | Without Coverage |
| Native Born | 78 (100.0%) | 0 (0.0%) |
| Foreign Born, Citizen | 410 (100.0%) | 0 (0.0%) |
| Foreign Born, not a Citizen | 130 (50.8%) | 126 (49.2%) |
Health Insurance Coverage by Household Income in Hudson Bend
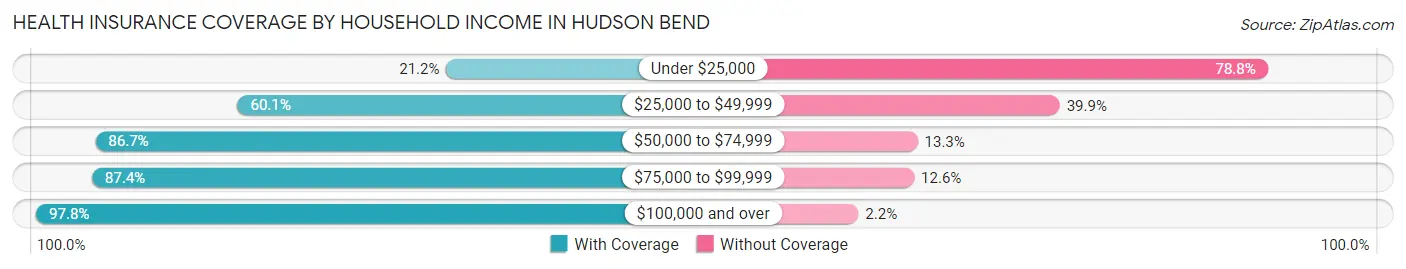
| Household Income | With Coverage | Without Coverage |
| Under $25,000 | 18 (21.2%) | 67 (78.8%) |
| $25,000 to $49,999 | 506 (60.1%) | 336 (39.9%) |
| $50,000 to $74,999 | 268 (86.7%) | 41 (13.3%) |
| $75,000 to $99,999 | 277 (87.4%) | 40 (12.6%) |
| $100,000 and over | 2,073 (97.8%) | 46 (2.2%) |
Public vs Private Health Insurance Coverage by Age in Hudson Bend
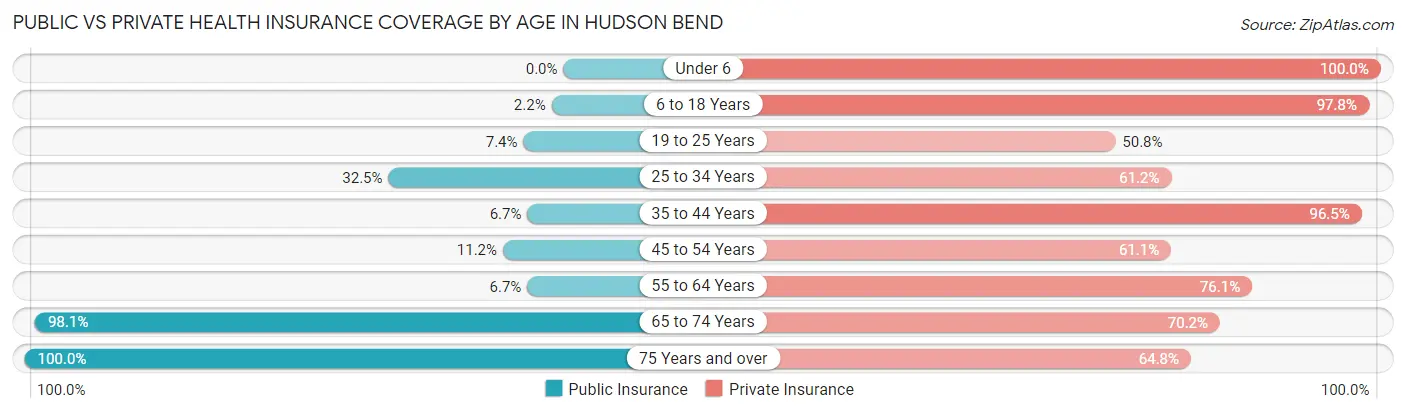
| Age Bracket | Public Insurance | Private Insurance |
| Under 6 | 0 (0.0%) | 78 (100.0%) |
| 6 to 18 Years | 9 (2.2%) | 401 (97.8%) |
| 19 to 25 Years | 19 (7.4%) | 130 (50.8%) |
| 25 to 34 Years | 102 (32.5%) | 192 (61.2%) |
| 35 to 44 Years | 17 (6.7%) | 245 (96.5%) |
| 45 to 54 Years | 91 (11.2%) | 495 (61.1%) |
| 55 to 64 Years | 49 (6.7%) | 555 (76.1%) |
| 65 to 74 Years | 457 (98.1%) | 327 (70.2%) |
| 75 Years and over | 355 (100.0%) | 230 (64.8%) |
| Total | 1,099 (29.9%) | 2,653 (72.3%) |
Disability Status by Sex by Age in Hudson Bend
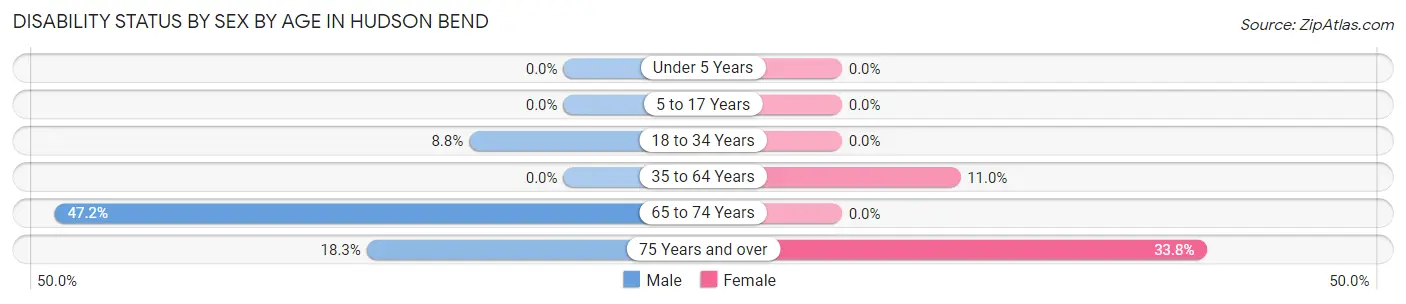
| Age Bracket | Male | Female |
| Under 5 Years | 0 (0.0%) | 0 (0.0%) |
| 5 to 17 Years | 0 (0.0%) | 0 (0.0%) |
| 18 to 34 Years | 26 (8.7%) | 0 (0.0%) |
| 35 to 64 Years | 0 (0.0%) | 104 (11.0%) |
| 65 to 74 Years | 127 (47.2%) | 0 (0.0%) |
| 75 Years and over | 40 (18.3%) | 46 (33.8%) |
Disability Class by Sex by Age in Hudson Bend
Disability Class: Hearing Difficulty
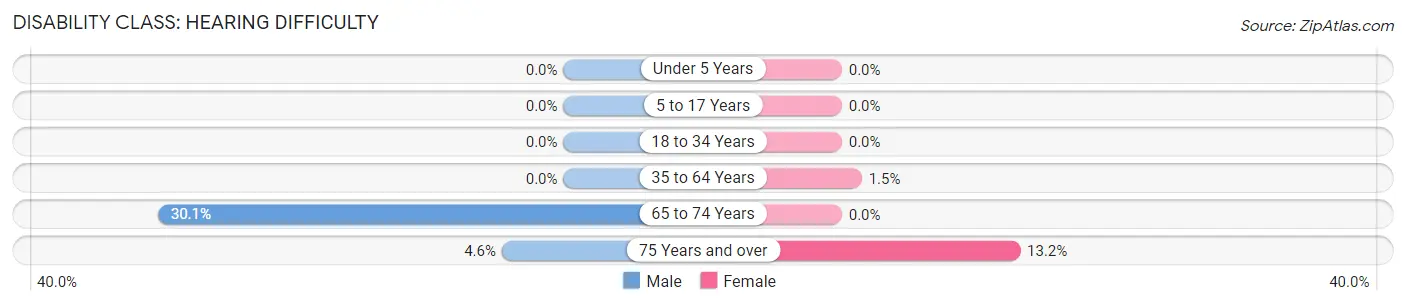
| Age Bracket | Male | Female |
| Under 5 Years | 0 (0.0%) | 0 (0.0%) |
| 5 to 17 Years | 0 (0.0%) | 0 (0.0%) |
| 18 to 34 Years | 0 (0.0%) | 0 (0.0%) |
| 35 to 64 Years | 0 (0.0%) | 14 (1.5%) |
| 65 to 74 Years | 81 (30.1%) | 0 (0.0%) |
| 75 Years and over | 10 (4.6%) | 18 (13.2%) |
Disability Class: Vision Difficulty
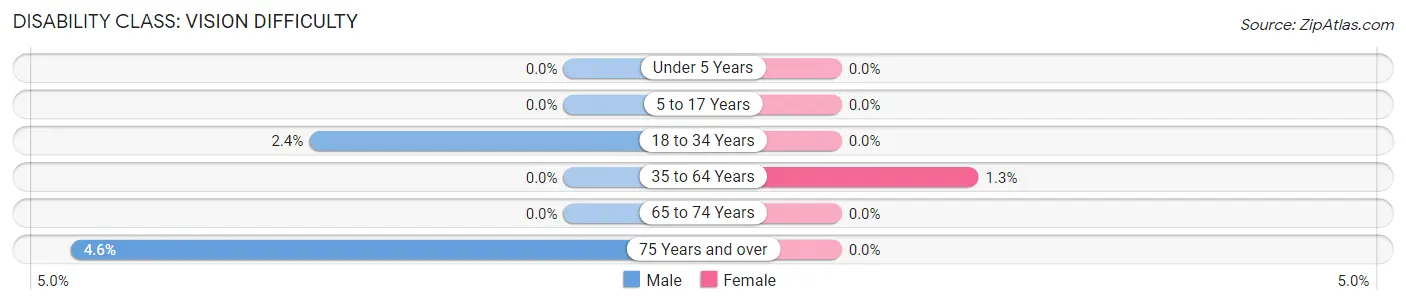
| Age Bracket | Male | Female |
| Under 5 Years | 0 (0.0%) | 0 (0.0%) |
| 5 to 17 Years | 0 (0.0%) | 0 (0.0%) |
| 18 to 34 Years | 7 (2.4%) | 0 (0.0%) |
| 35 to 64 Years | 0 (0.0%) | 12 (1.3%) |
| 65 to 74 Years | 0 (0.0%) | 0 (0.0%) |
| 75 Years and over | 10 (4.6%) | 0 (0.0%) |
Disability Class: Cognitive Difficulty
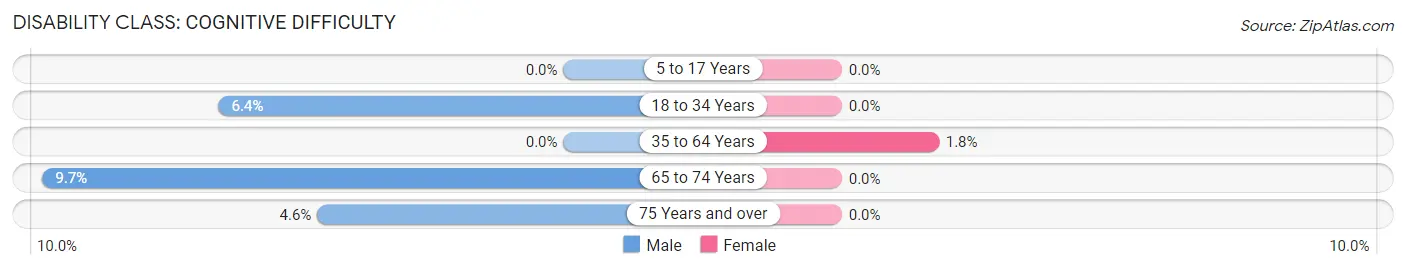
| Age Bracket | Male | Female |
| 5 to 17 Years | 0 (0.0%) | 0 (0.0%) |
| 18 to 34 Years | 19 (6.4%) | 0 (0.0%) |
| 35 to 64 Years | 0 (0.0%) | 17 (1.8%) |
| 65 to 74 Years | 26 (9.7%) | 0 (0.0%) |
| 75 Years and over | 10 (4.6%) | 0 (0.0%) |
Disability Class: Ambulatory Difficulty
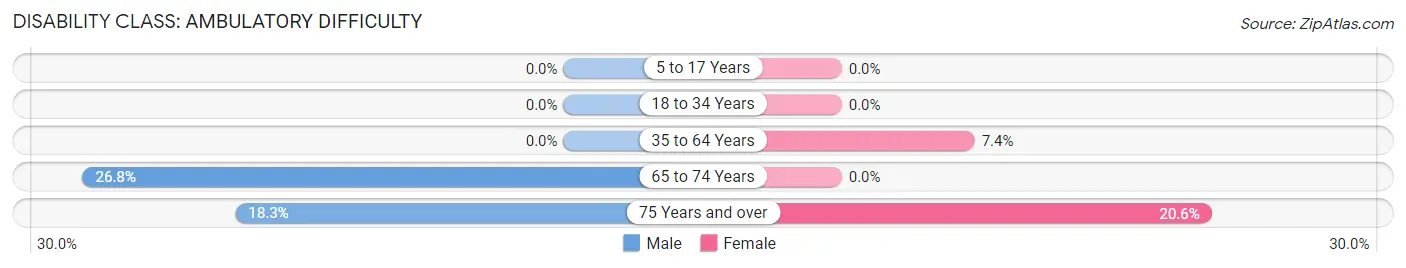
| Age Bracket | Male | Female |
| 5 to 17 Years | 0 (0.0%) | 0 (0.0%) |
| 18 to 34 Years | 0 (0.0%) | 0 (0.0%) |
| 35 to 64 Years | 0 (0.0%) | 70 (7.4%) |
| 65 to 74 Years | 72 (26.8%) | 0 (0.0%) |
| 75 Years and over | 40 (18.3%) | 28 (20.6%) |
Disability Class: Self-Care Difficulty
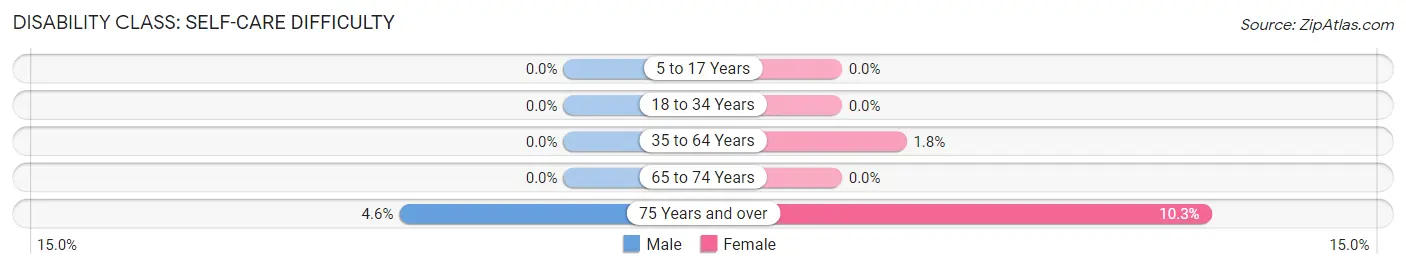
| Age Bracket | Male | Female |
| 5 to 17 Years | 0 (0.0%) | 0 (0.0%) |
| 18 to 34 Years | 0 (0.0%) | 0 (0.0%) |
| 35 to 64 Years | 0 (0.0%) | 17 (1.8%) |
| 65 to 74 Years | 0 (0.0%) | 0 (0.0%) |
| 75 Years and over | 10 (4.6%) | 14 (10.3%) |
Technology Access in Hudson Bend
Computing Device Access in Hudson Bend
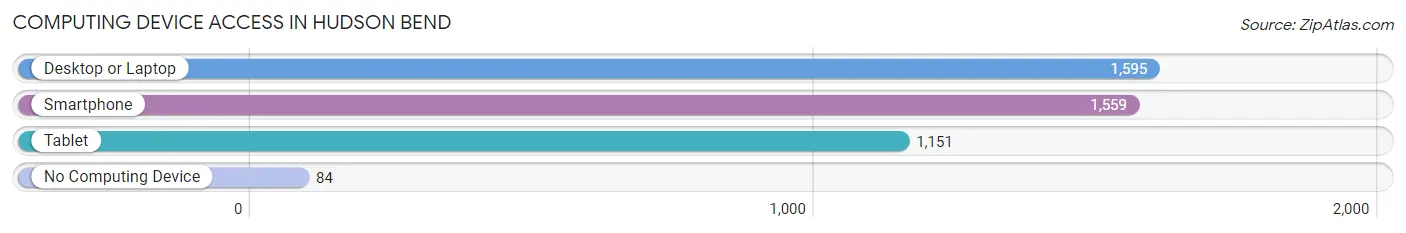
| Device Type | # Households | % Households |
| Desktop or Laptop | 1,595 | 92.1% |
| Smartphone | 1,559 | 90.1% |
| Tablet | 1,151 | 66.5% |
| No Computing Device | 84 | 4.9% |
| Total | 1,731 | 100.0% |
Internet Access in Hudson Bend
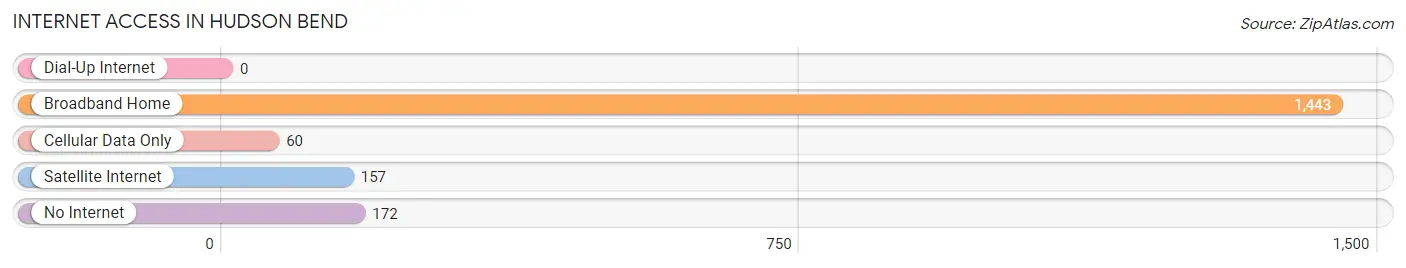
| Internet Type | # Households | % Households |
| Dial-Up Internet | 0 | 0.0% |
| Broadband Home | 1,443 | 83.4% |
| Cellular Data Only | 60 | 3.5% |
| Satellite Internet | 157 | 9.1% |
| No Internet | 172 | 9.9% |
| Total | 1,731 | 100.0% |
Hudson Bend Summary
Hudson Bend is a small unincorporated community located in Travis County, Texas, United States. It is situated on the north shore of Lake Travis, approximately 20 miles west of Austin. The community is part of the Austin–Round Rock–San Marcos metropolitan area.
History
Hudson Bend was first settled in the late 1800s by a group of settlers from the nearby town of Hudson. The settlers were attracted to the area by the abundance of fish and game in the area. The community was named after the Hudson family, who were among the first settlers.
The first post office in Hudson Bend was established in 1891. The community grew slowly over the years, and by the mid-1900s, it had become a popular destination for fishing and boating.
Geography
Hudson Bend is located in western Travis County, approximately 20 miles west of Austin. It is situated on the north shore of Lake Travis, a large reservoir on the Colorado River. The community is surrounded by rolling hills and is home to several parks and recreational areas.
The climate in Hudson Bend is generally mild, with hot summers and mild winters. The average annual temperature is around 70 degrees Fahrenheit.
Economy
Hudson Bend is primarily a residential community, with most of its residents employed in the nearby cities of Austin and Round Rock. The community is home to several small businesses, including a marina, a restaurant, and a few retail stores.
The local economy is largely dependent on tourism, with many visitors coming to the area to enjoy the lake and the surrounding parks and recreational areas. The community is also home to several wineries and vineyards, which attract visitors from all over the state.
Demographics
As of the 2010 census, the population of Hudson Bend was 1,845. The racial makeup of the community was 94.3% White, 1.2% African American, 0.3% Native American, 0.7% Asian, and 3.5% from other races.
The median household income in Hudson Bend was $68,750, and the median family income was $76,250. The per capita income was $30,945. The poverty rate was 8.3%.
Conclusion
Hudson Bend is a small unincorporated community located in Travis County, Texas, United States. It is situated on the north shore of Lake Travis, approximately 20 miles west of Austin. The community is part of the Austin–Round Rock–San Marcos metropolitan area. The community is primarily residential, with most of its residents employed in the nearby cities of Austin and Round Rock. The local economy is largely dependent on tourism, with many visitors coming to the area to enjoy the lake and the surrounding parks and recreational areas. As of the 2010 census, the population of Hudson Bend was 1,845. The racial makeup of the community was 94.3% White, 1.2% African American, 0.3% Native American, 0.7% Asian, and 3.5% from other races. The median household income in Hudson Bend was $68,750, and the median family income was $76,250. The per capita income was $30,945. The poverty rate was 8.3%.
Common Questions
What is Per Capita Income in Hudson Bend?
Per Capita income in Hudson Bend is $81,078.
What is the Median Family Income in Hudson Bend?
Median Family Income in Hudson Bend is $129,942.
What is the Median Household income in Hudson Bend?
Median Household Income in Hudson Bend is $90,179.
What is Income or Wage Gap in Hudson Bend?
Income or Wage Gap in Hudson Bend is 19.7%.
Women in Hudson Bend earn 80.3 cents for every dollar earned by a man.
What is Inequality or Gini Index in Hudson Bend?
Inequality or Gini Index in Hudson Bend is 0.56.
What is the Total Population of Hudson Bend?
Total Population of Hudson Bend is 3,672.
What is the Total Male Population of Hudson Bend?
Total Male Population of Hudson Bend is 1,962.
What is the Total Female Population of Hudson Bend?
Total Female Population of Hudson Bend is 1,710.
What is the Ratio of Males per 100 Females in Hudson Bend?
There are 114.74 Males per 100 Females in Hudson Bend.
What is the Ratio of Females per 100 Males in Hudson Bend?
There are 87.16 Females per 100 Males in Hudson Bend.
What is the Median Population Age in Hudson Bend?
Median Population Age in Hudson Bend is 52.6 Years.
What is the Average Family Size in Hudson Bend
Average Family Size in Hudson Bend is 2.6 People.
What is the Average Household Size in Hudson Bend
Average Household Size in Hudson Bend is 2.1 People.
How Large is the Labor Force in Hudson Bend?
There are 2,063 People in the Labor Forcein in Hudson Bend.
What is the Percentage of People in the Labor Force in Hudson Bend?
63.6% of People are in the Labor Force in Hudson Bend.
What is the Unemployment Rate in Hudson Bend?
Unemployment Rate in Hudson Bend is 3.9%.