Hackberry, TX Map & Demographics
Hackberry Map
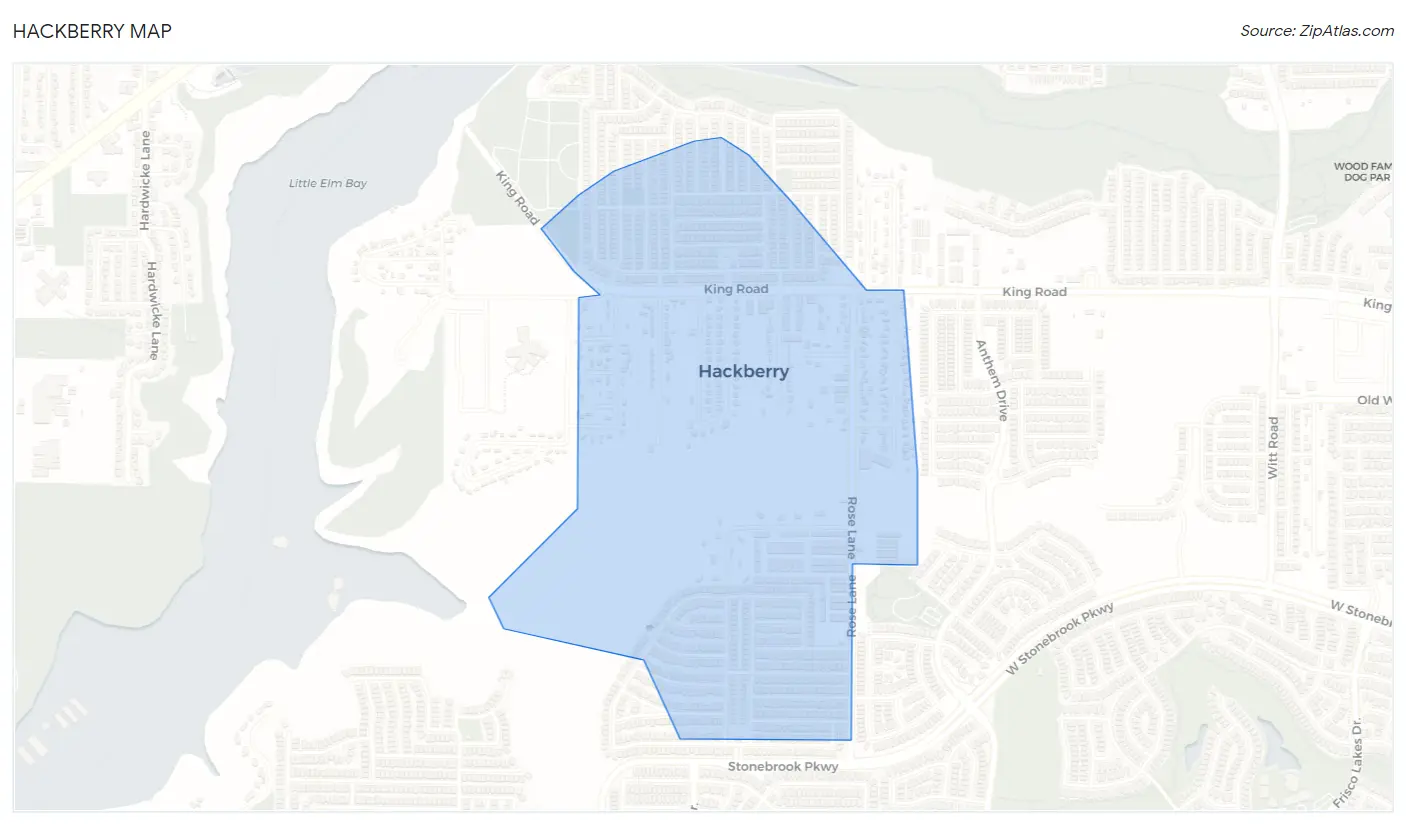
Hackberry Overview
$42,105
PER CAPITA INCOME
$116,875
AVG FAMILY INCOME
$112,981
AVG HOUSEHOLD INCOME
14.8%
WAGE / INCOME GAP [ % ]
85.2¢/ $1
WAGE / INCOME GAP [ $ ]
0.32
INEQUALITY / GINI INDEX
2,862
TOTAL POPULATION
1,393
MALE POPULATION
1,469
FEMALE POPULATION
94.83
MALES / 100 FEMALES
105.46
FEMALES / 100 MALES
32.7
MEDIAN AGE
3.4
AVG FAMILY SIZE
3.0
AVG HOUSEHOLD SIZE
1,574
LABOR FORCE [ PEOPLE ]
78.6%
PERCENT IN LABOR FORCE
2.8%
UNEMPLOYMENT RATE
Income in Hackberry
Income Overview in Hackberry
Per Capita Income in Hackberry is $42,105, while median incomes of families and households are $116,875 and $112,981 respectively.
| Characteristic | Number | Measure |
| Per Capita Income | 2,862 | $42,105 |
| Median Family Income | 744 | $116,875 |
| Mean Family Income | 744 | $119,106 |
| Median Household Income | 962 | $112,981 |
| Mean Household Income | 962 | $120,355 |
| Income Deficit | 744 | $0 |
| Wage / Income Gap (%) | 2,862 | 14.82% |
| Wage / Income Gap ($) | 2,862 | 85.18¢ per $1 |
| Gini / Inequality Index | 2,862 | 0.32 |
Earnings by Sex in Hackberry
Average Earnings in Hackberry are $59,967, $67,692 for men and $57,663 for women, a difference of 14.8%.
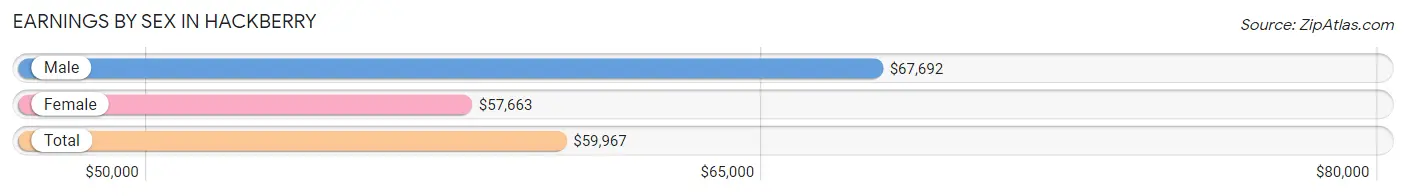
| Sex | Number | Average Earnings |
| Male | 770 (48.7%) | $67,692 |
| Female | 811 (51.3%) | $57,663 |
| Total | 1,581 (100.0%) | $59,967 |
Earnings by Sex by Income Bracket in Hackberry
The most common earnings brackets in Hackberry are $100,000+ for men (196 | 25.5%) and $100,000+ for women (147 | 18.1%).
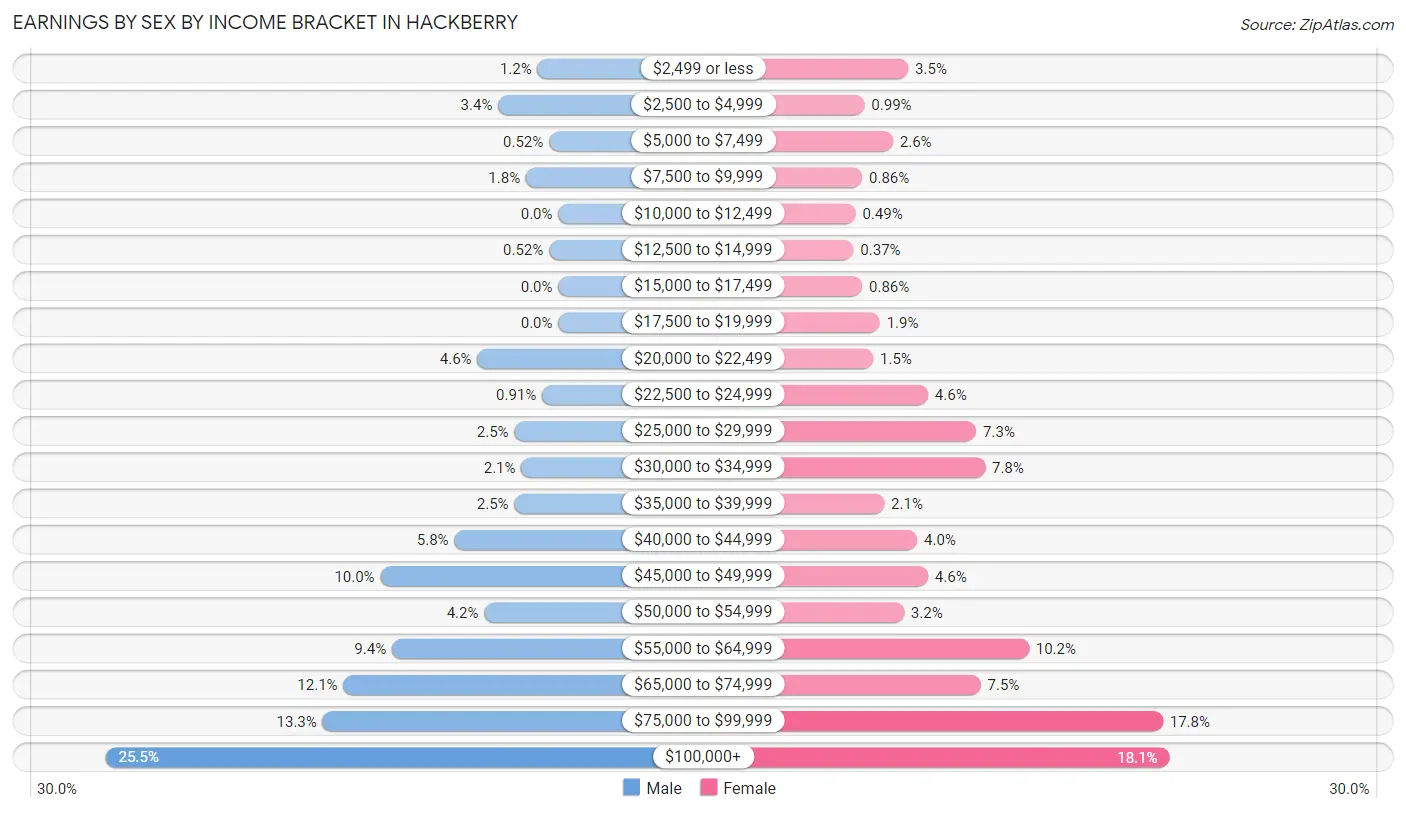
| Income | Male | Female |
| $2,499 or less | 9 (1.2%) | 28 (3.5%) |
| $2,500 to $4,999 | 26 (3.4%) | 8 (1.0%) |
| $5,000 to $7,499 | 4 (0.5%) | 21 (2.6%) |
| $7,500 to $9,999 | 14 (1.8%) | 7 (0.9%) |
| $10,000 to $12,499 | 0 (0.0%) | 4 (0.5%) |
| $12,500 to $14,999 | 4 (0.5%) | 3 (0.4%) |
| $15,000 to $17,499 | 0 (0.0%) | 7 (0.9%) |
| $17,500 to $19,999 | 0 (0.0%) | 15 (1.8%) |
| $20,000 to $22,499 | 35 (4.5%) | 12 (1.5%) |
| $22,500 to $24,999 | 7 (0.9%) | 37 (4.6%) |
| $25,000 to $29,999 | 19 (2.5%) | 59 (7.3%) |
| $30,000 to $34,999 | 16 (2.1%) | 63 (7.8%) |
| $35,000 to $39,999 | 19 (2.5%) | 17 (2.1%) |
| $40,000 to $44,999 | 45 (5.8%) | 32 (4.0%) |
| $45,000 to $49,999 | 77 (10.0%) | 37 (4.6%) |
| $50,000 to $54,999 | 32 (4.2%) | 26 (3.2%) |
| $55,000 to $64,999 | 72 (9.3%) | 83 (10.2%) |
| $65,000 to $74,999 | 93 (12.1%) | 61 (7.5%) |
| $75,000 to $99,999 | 102 (13.3%) | 144 (17.8%) |
| $100,000+ | 196 (25.5%) | 147 (18.1%) |
| Total | 770 (100.0%) | 811 (100.0%) |
Earnings by Sex by Educational Attainment in Hackberry
Average earnings in Hackberry are $66,875 for men and $58,967 for women, a difference of 11.8%. Men with an educational attainment of graduate degree enjoy the highest average annual earnings of $104,583, while those with less than high school education earn the least with $33,750. Women with an educational attainment of graduate degree earn the most with the average annual earnings of $85,278, while those with high school diploma education have the smallest earnings of $32,583.
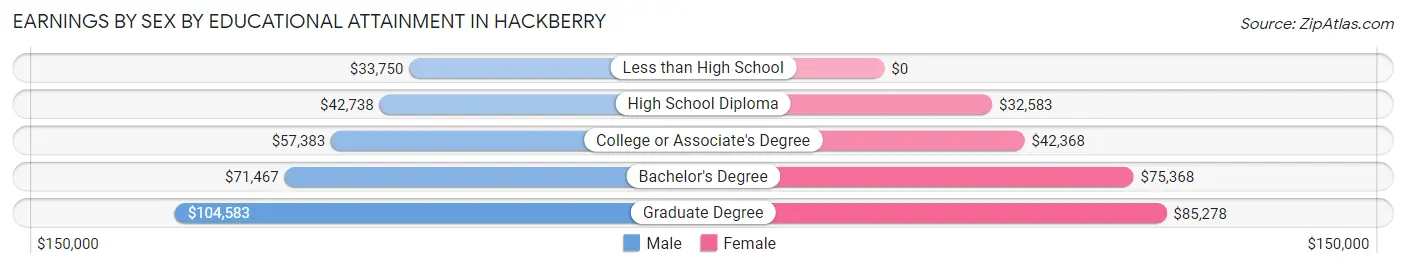
| Educational Attainment | Male Income | Female Income |
| Less than High School | $33,750 | $0 |
| High School Diploma | $42,738 | $32,583 |
| College or Associate's Degree | $57,383 | $42,368 |
| Bachelor's Degree | $71,467 | $75,368 |
| Graduate Degree | $104,583 | $85,278 |
| Total | $66,875 | $58,967 |
Family Income in Hackberry
Family Income Brackets in Hackberry
According to the Hackberry family income data, there are 217 families falling into the $100,000 to $149,999 income range, which is the most common income bracket and makes up 29.2% of all families.
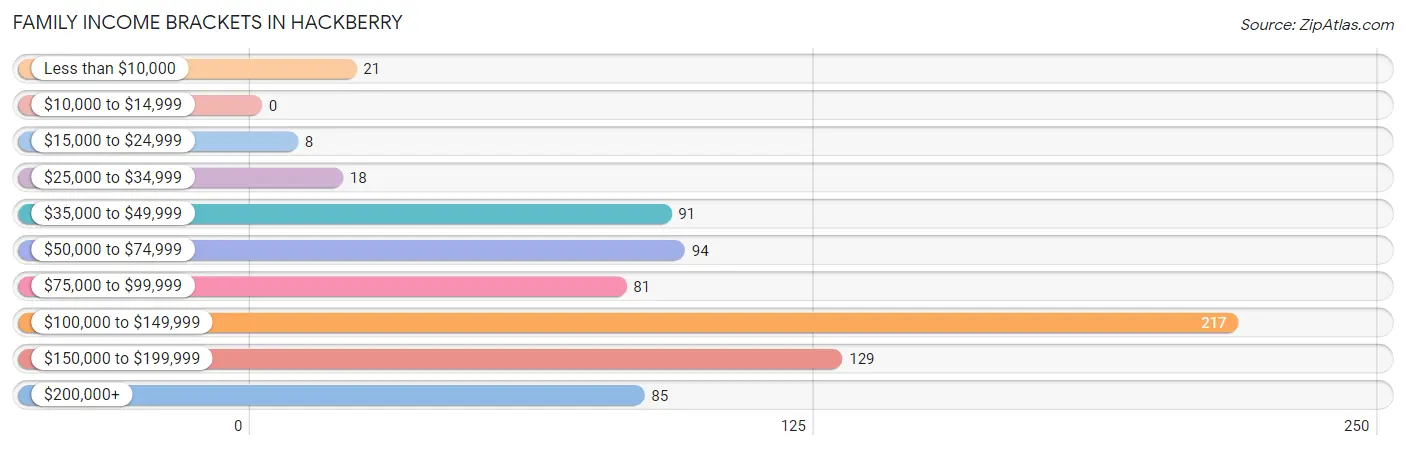
| Income Bracket | # Families | % Families |
| Less than $10,000 | 21 | 2.8% |
| $10,000 to $14,999 | 0 | 0.0% |
| $15,000 to $24,999 | 8 | 1.1% |
| $25,000 to $34,999 | 18 | 2.4% |
| $35,000 to $49,999 | 91 | 12.2% |
| $50,000 to $74,999 | 94 | 12.6% |
| $75,000 to $99,999 | 81 | 10.9% |
| $100,000 to $149,999 | 217 | 29.2% |
| $150,000 to $199,999 | 129 | 17.3% |
| $200,000+ | 85 | 11.4% |
Family Income by Famaliy Size in Hackberry
4-person families (124 | 16.7%) account for the highest median family income in Hackberry with $147,115 per family, while 2-person families (277 | 37.2%) have the highest median income of $58,282 per family member.

| Income Bracket | # Families | Median Income |
| 2-Person Families | 277 (37.2%) | $116,563 |
| 3-Person Families | 184 (24.7%) | $112,100 |
| 4-Person Families | 124 (16.7%) | $147,115 |
| 5-Person Families | 69 (9.3%) | $128,173 |
| 6-Person Families | 50 (6.7%) | $0 |
| 7+ Person Families | 40 (5.4%) | $0 |
| Total | 744 (100.0%) | $116,875 |
Family Income by Number of Earners in Hackberry
The median family income in Hackberry is $116,875, with families comprising 2 earners (423) having the highest median family income of $138,207, while families with no earners (42) have the lowest median family income of $37,100, accounting for 56.9% and 5.7% of families, respectively.
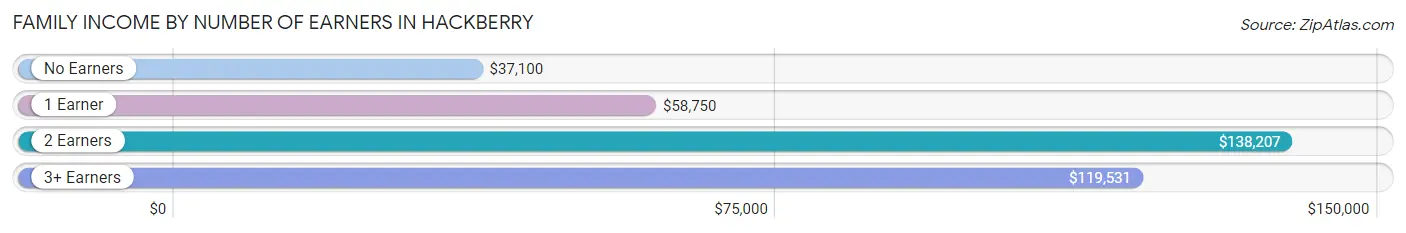
| Number of Earners | # Families | Median Income |
| No Earners | 42 (5.7%) | $37,100 |
| 1 Earner | 242 (32.5%) | $58,750 |
| 2 Earners | 423 (56.9%) | $138,207 |
| 3+ Earners | 37 (5.0%) | $119,531 |
| Total | 744 (100.0%) | $116,875 |
Household Income in Hackberry
Household Income Brackets in Hackberry
With 297 households falling in the category, the $100,000 to $149,999 income range is the most frequent in Hackberry, accounting for 30.9% of all households.
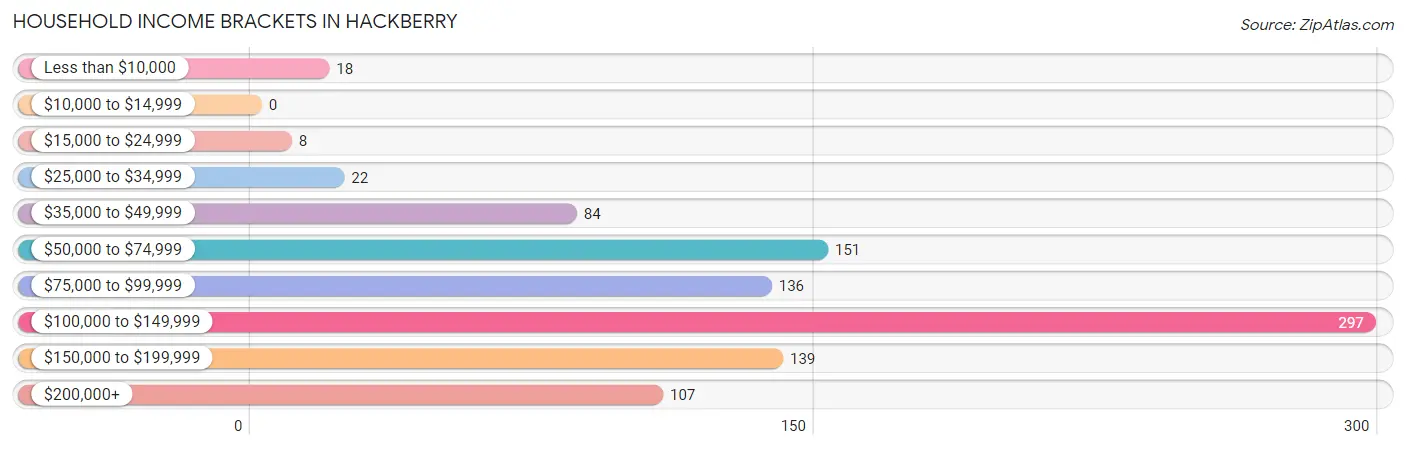
| Income Bracket | # Households | % Households |
| Less than $10,000 | 18 | 1.9% |
| $10,000 to $14,999 | 0 | 0.0% |
| $15,000 to $24,999 | 8 | 0.8% |
| $25,000 to $34,999 | 22 | 2.3% |
| $35,000 to $49,999 | 84 | 8.7% |
| $50,000 to $74,999 | 151 | 15.7% |
| $75,000 to $99,999 | 136 | 14.1% |
| $100,000 to $149,999 | 297 | 30.9% |
| $150,000 to $199,999 | 139 | 14.4% |
| $200,000+ | 107 | 11.1% |
Household Income by Householder Age in Hackberry
The median household income in Hackberry is $112,981, with the highest median household income of $126,000 found in the 25 to 44 years age bracket for the primary householder. A total of 534 households (55.5%) fall into this category. Meanwhile, the 15 to 24 years age bracket for the primary householder has the lowest median household income of $0, with 20 households (2.1%) in this group.
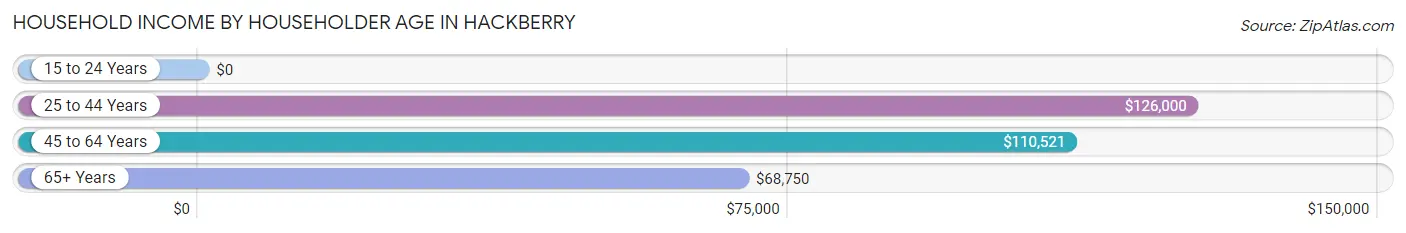
| Income Bracket | # Households | Median Income |
| 15 to 24 Years | 20 (2.1%) | $0 |
| 25 to 44 Years | 534 (55.5%) | $126,000 |
| 45 to 64 Years | 329 (34.2%) | $110,521 |
| 65+ Years | 79 (8.2%) | $68,750 |
| Total | 962 (100.0%) | $112,981 |
Poverty in Hackberry
Income Below Poverty by Sex and Age in Hackberry
With 8.2% poverty level for males and 4.4% for females among the residents of Hackberry, 5 year old males and 16 and 17 year old females are the most vulnerable to poverty, with 21 males (65.6%) and 5 females (16.7%) in their respective age groups living below the poverty level.
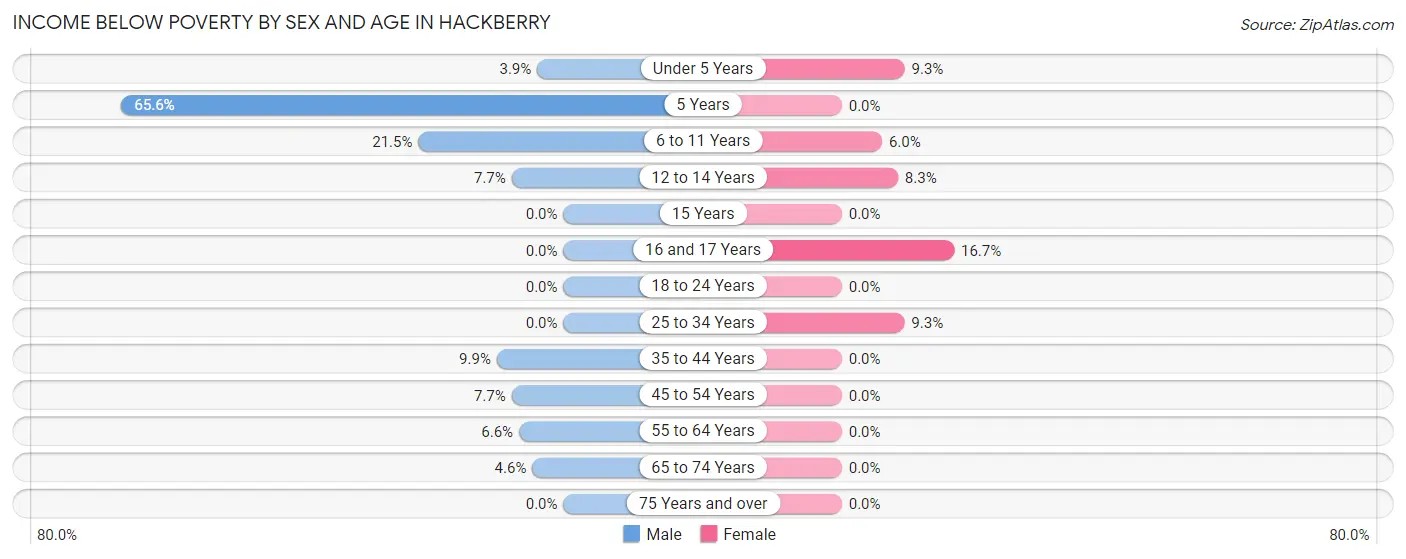
| Age Bracket | Male | Female |
| Under 5 Years | 6 (3.9%) | 18 (9.3%) |
| 5 Years | 21 (65.6%) | 0 (0.0%) |
| 6 to 11 Years | 28 (21.5%) | 8 (6.0%) |
| 12 to 14 Years | 10 (7.7%) | 5 (8.3%) |
| 15 Years | 0 (0.0%) | 0 (0.0%) |
| 16 and 17 Years | 0 (0.0%) | 5 (16.7%) |
| 18 to 24 Years | 0 (0.0%) | 0 (0.0%) |
| 25 to 34 Years | 0 (0.0%) | 28 (9.3%) |
| 35 to 44 Years | 26 (9.9%) | 0 (0.0%) |
| 45 to 54 Years | 14 (7.7%) | 0 (0.0%) |
| 55 to 64 Years | 6 (6.6%) | 0 (0.0%) |
| 65 to 74 Years | 3 (4.6%) | 0 (0.0%) |
| 75 Years and over | 0 (0.0%) | 0 (0.0%) |
| Total | 114 (8.2%) | 64 (4.4%) |
Income Above Poverty by Sex and Age in Hackberry
According to the poverty statistics in Hackberry, males aged 15 years and females aged 5 years are the age groups that are most secure financially, with 100.0% of males and 100.0% of females in these age groups living above the poverty line.
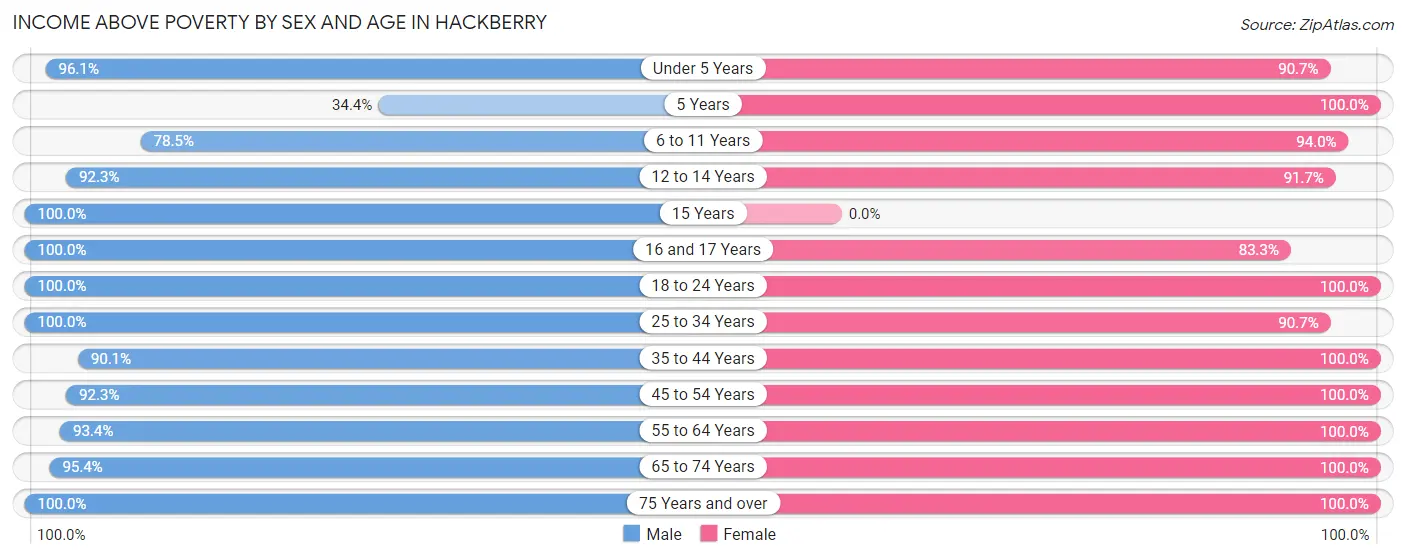
| Age Bracket | Male | Female |
| Under 5 Years | 148 (96.1%) | 175 (90.7%) |
| 5 Years | 11 (34.4%) | 9 (100.0%) |
| 6 to 11 Years | 102 (78.5%) | 126 (94.0%) |
| 12 to 14 Years | 120 (92.3%) | 55 (91.7%) |
| 15 Years | 7 (100.0%) | 0 (0.0%) |
| 16 and 17 Years | 25 (100.0%) | 25 (83.3%) |
| 18 to 24 Years | 50 (100.0%) | 64 (100.0%) |
| 25 to 34 Years | 213 (100.0%) | 273 (90.7%) |
| 35 to 44 Years | 237 (90.1%) | 292 (100.0%) |
| 45 to 54 Years | 168 (92.3%) | 180 (100.0%) |
| 55 to 64 Years | 85 (93.4%) | 100 (100.0%) |
| 65 to 74 Years | 62 (95.4%) | 69 (100.0%) |
| 75 Years and over | 51 (100.0%) | 27 (100.0%) |
| Total | 1,279 (91.8%) | 1,395 (95.6%) |
Income Below Poverty Among Married-Couple Families in Hackberry
The poverty statistics for married-couple families in Hackberry show that 3.8% or 23 of the total 602 families live below the poverty line. Families with 3 or 4 children have the highest poverty rate of 16.4%, comprising of 23 families. On the other hand, families with no children have the lowest poverty rate of 0.0%, which includes 0 families.
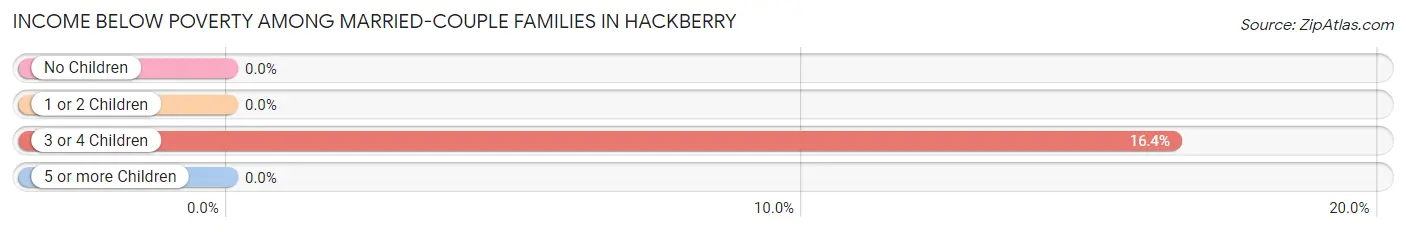
| Children | Above Poverty | Below Poverty |
| No Children | 275 (100.0%) | 0 (0.0%) |
| 1 or 2 Children | 187 (100.0%) | 0 (0.0%) |
| 3 or 4 Children | 117 (83.6%) | 23 (16.4%) |
| 5 or more Children | 0 (0.0%) | 0 (0.0%) |
| Total | 579 (96.2%) | 23 (3.8%) |
Income Below Poverty Among Single-Parent Households in Hackberry
According to the poverty data in Hackberry, 20.0% or 3 single-father households and 6.3% or 8 single-mother households are living below the poverty line. Among single-father households, those with 1 or 2 children have the highest poverty rate, with 3 households (100.0%) experiencing poverty. Likewise, among single-mother households, those with 3 or 4 children have the highest poverty rate, with 8 households (47.1%) falling below the poverty line.
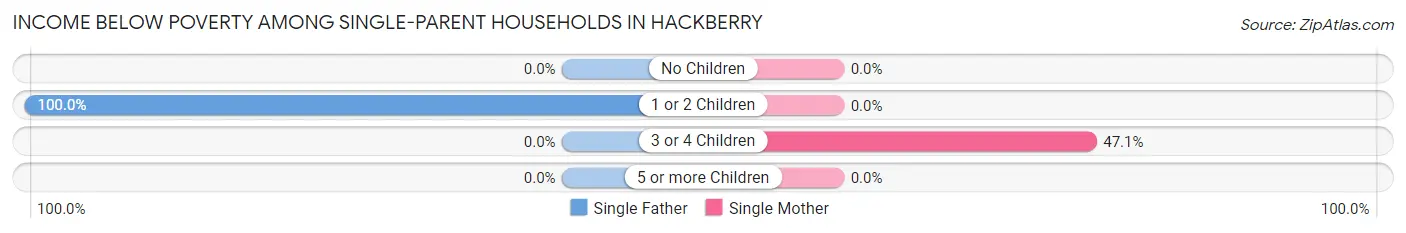
| Children | Single Father | Single Mother |
| No Children | 0 (0.0%) | 0 (0.0%) |
| 1 or 2 Children | 3 (100.0%) | 0 (0.0%) |
| 3 or 4 Children | 0 (0.0%) | 8 (47.1%) |
| 5 or more Children | 0 (0.0%) | 0 (0.0%) |
| Total | 3 (20.0%) | 8 (6.3%) |
Income Below Poverty Among Married-Couple vs Single-Parent Households in Hackberry
The poverty data for Hackberry shows that 23 of the married-couple family households (3.8%) and 11 of the single-parent households (7.7%) are living below the poverty level. Within the married-couple family households, those with 3 or 4 children have the highest poverty rate, with 23 households (16.4%) falling below the poverty line. Among the single-parent households, those with 3 or 4 children have the highest poverty rate, with 8 household (47.1%) living below poverty.
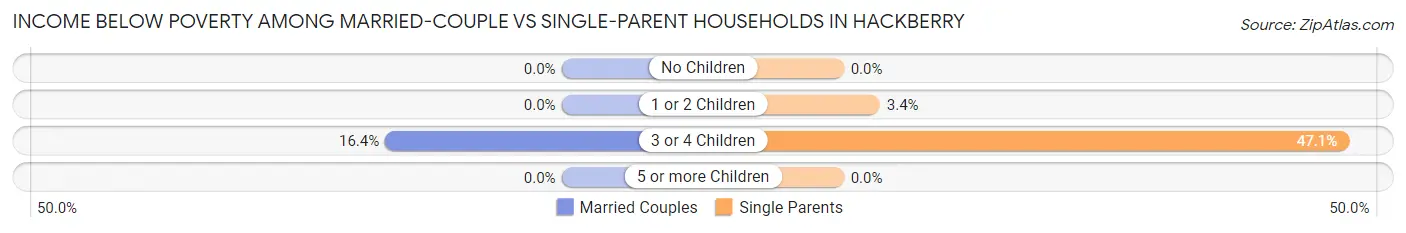
| Children | Married-Couple Families | Single-Parent Households |
| No Children | 0 (0.0%) | 0 (0.0%) |
| 1 or 2 Children | 0 (0.0%) | 3 (3.4%) |
| 3 or 4 Children | 23 (16.4%) | 8 (47.1%) |
| 5 or more Children | 0 (0.0%) | 0 (0.0%) |
| Total | 23 (3.8%) | 11 (7.7%) |
Race in Hackberry
The most populous races in Hackberry are White / Caucasian (1,695 | 59.2%), Hispanic or Latino (650 | 22.7%), and Black / African American (473 | 16.5%).
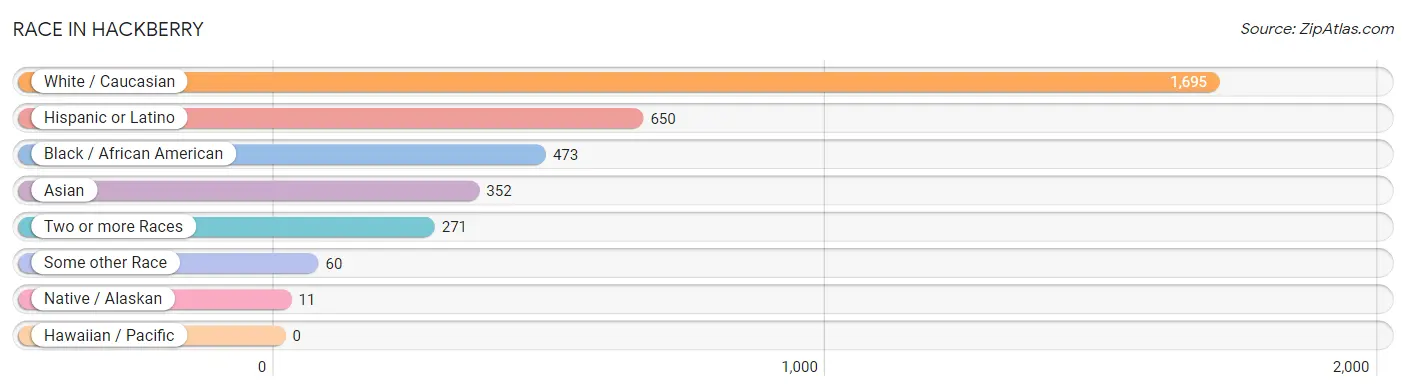
| Race | # Population | % Population |
| Asian | 352 | 12.3% |
| Black / African American | 473 | 16.5% |
| Hawaiian / Pacific | 0 | 0.0% |
| Hispanic or Latino | 650 | 22.7% |
| Native / Alaskan | 11 | 0.4% |
| White / Caucasian | 1,695 | 59.2% |
| Two or more Races | 271 | 9.5% |
| Some other Race | 60 | 2.1% |
| Total | 2,862 | 100.0% |
Ancestry in Hackberry
The most populous ancestries reported in Hackberry are Mexican (472 | 16.5%), Irish (265 | 9.3%), American (216 | 7.5%), German (213 | 7.4%), and Subsaharan African (164 | 5.7%), together accounting for 46.5% of all Hackberry residents.
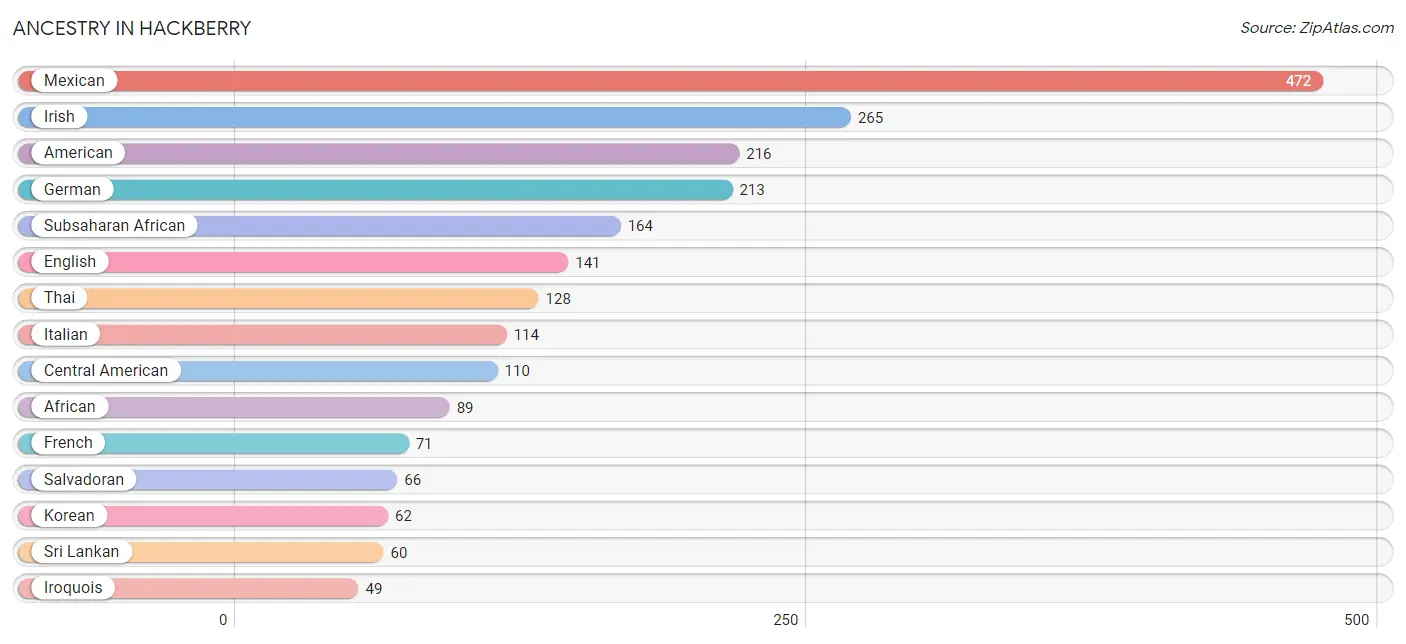
| Ancestry | # Population | % Population |
| African | 89 | 3.1% |
| Albanian | 13 | 0.4% |
| American | 216 | 7.5% |
| Australian | 10 | 0.4% |
| Austrian | 8 | 0.3% |
| Barbadian | 3 | 0.1% |
| Bhutanese | 5 | 0.2% |
| Brazilian | 6 | 0.2% |
| British | 19 | 0.7% |
| Bulgarian | 13 | 0.4% |
| Burmese | 30 | 1.1% |
| Central American | 110 | 3.8% |
| Central American Indian | 17 | 0.6% |
| Cherokee | 4 | 0.1% |
| Chilean | 11 | 0.4% |
| Choctaw | 9 | 0.3% |
| Cuban | 17 | 0.6% |
| Cypriot | 2 | 0.1% |
| Czech | 10 | 0.4% |
| Danish | 2 | 0.1% |
| Dutch | 28 | 1.0% |
| Eastern European | 3 | 0.1% |
| Ecuadorian | 14 | 0.5% |
| English | 141 | 4.9% |
| European | 14 | 0.5% |
| Finnish | 2 | 0.1% |
| French | 71 | 2.5% |
| French Canadian | 20 | 0.7% |
| German | 213 | 7.4% |
| Guatemalan | 44 | 1.5% |
| Guyanese | 3 | 0.1% |
| Hungarian | 6 | 0.2% |
| Indian (Asian) | 27 | 0.9% |
| Iranian | 20 | 0.7% |
| Irish | 265 | 9.3% |
| Iroquois | 49 | 1.7% |
| Italian | 114 | 4.0% |
| Kenyan | 22 | 0.8% |
| Korean | 62 | 2.2% |
| Mexican | 472 | 16.5% |
| Nigerian | 39 | 1.4% |
| Norwegian | 3 | 0.1% |
| Peruvian | 9 | 0.3% |
| Polish | 23 | 0.8% |
| Portuguese | 6 | 0.2% |
| Puerto Rican | 12 | 0.4% |
| Russian | 34 | 1.2% |
| Salvadoran | 66 | 2.3% |
| Scotch-Irish | 11 | 0.4% |
| Scottish | 13 | 0.4% |
| Sierra Leonean | 8 | 0.3% |
| South American | 34 | 1.2% |
| South American Indian | 9 | 0.3% |
| Sri Lankan | 60 | 2.1% |
| Subsaharan African | 164 | 5.7% |
| Swedish | 17 | 0.6% |
| Swiss | 11 | 0.4% |
| Thai | 128 | 4.5% |
| Ukrainian | 11 | 0.4% | View All 59 Rows |
Immigrants in Hackberry
The most numerous immigrant groups reported in Hackberry came from Latin America (339 | 11.8%), Asia (251 | 8.8%), Central America (237 | 8.3%), Mexico (150 | 5.2%), and South Central Asia (132 | 4.6%), together accounting for 38.7% of all Hackberry residents.
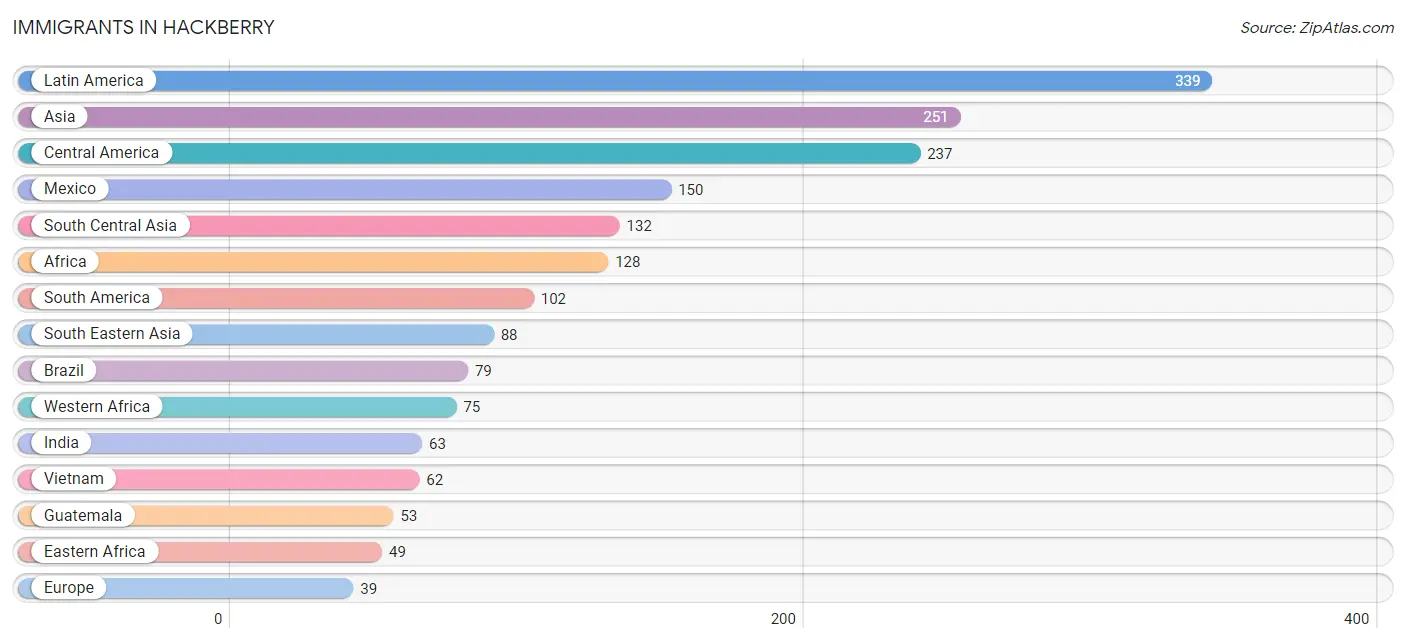
| Immigration Origin | # Population | % Population |
| Africa | 128 | 4.5% |
| Albania | 13 | 0.4% |
| Asia | 251 | 8.8% |
| Brazil | 79 | 2.8% |
| Bulgaria | 13 | 0.4% |
| Canada | 38 | 1.3% |
| Central America | 237 | 8.3% |
| China | 5 | 0.2% |
| Eastern Africa | 49 | 1.7% |
| Eastern Asia | 31 | 1.1% |
| Eastern Europe | 29 | 1.0% |
| Ecuador | 14 | 0.5% |
| El Salvador | 34 | 1.2% |
| Ethiopia | 25 | 0.9% |
| Europe | 39 | 1.4% |
| Ghana | 9 | 0.3% |
| Guatemala | 53 | 1.8% |
| India | 63 | 2.2% |
| Iran | 20 | 0.7% |
| Kenya | 15 | 0.5% |
| Korea | 26 | 0.9% |
| Latin America | 339 | 11.8% |
| Mexico | 150 | 5.2% |
| Nepal | 36 | 1.3% |
| Nigeria | 30 | 1.1% |
| Northern Europe | 10 | 0.4% |
| Pakistan | 13 | 0.4% |
| Peru | 9 | 0.3% |
| Philippines | 26 | 0.9% |
| Russia | 3 | 0.1% |
| Sierra Leone | 18 | 0.6% |
| South Africa | 4 | 0.1% |
| South America | 102 | 3.6% |
| South Central Asia | 132 | 4.6% |
| South Eastern Asia | 88 | 3.1% |
| Vietnam | 62 | 2.2% |
| Western Africa | 75 | 2.6% | View All 37 Rows |
Sex and Age in Hackberry
Sex and Age in Hackberry
The most populous age groups in Hackberry are Under 5 Years (154 | 11.1%) for men and 30 to 34 Years (217 | 14.8%) for women.
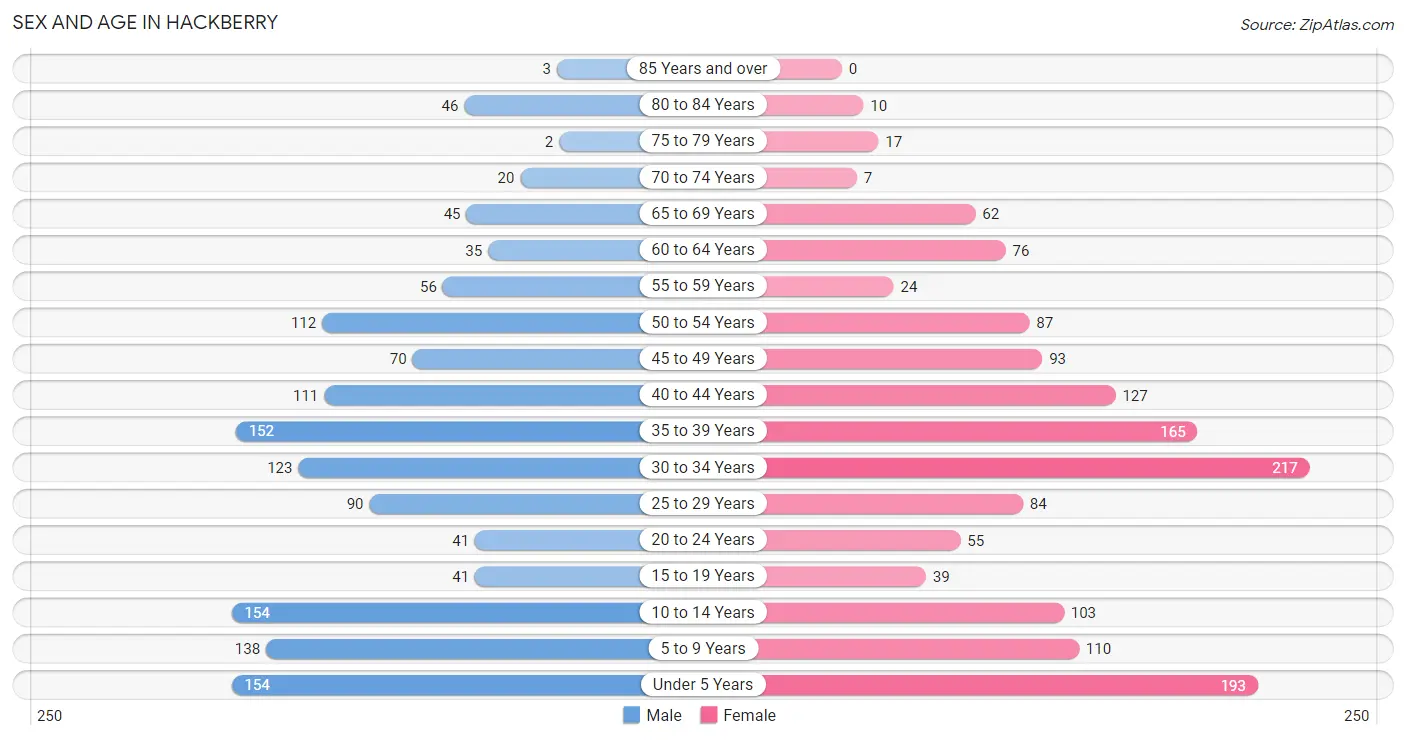
| Age Bracket | Male | Female |
| Under 5 Years | 154 (11.1%) | 193 (13.1%) |
| 5 to 9 Years | 138 (9.9%) | 110 (7.5%) |
| 10 to 14 Years | 154 (11.1%) | 103 (7.0%) |
| 15 to 19 Years | 41 (2.9%) | 39 (2.6%) |
| 20 to 24 Years | 41 (2.9%) | 55 (3.7%) |
| 25 to 29 Years | 90 (6.5%) | 84 (5.7%) |
| 30 to 34 Years | 123 (8.8%) | 217 (14.8%) |
| 35 to 39 Years | 152 (10.9%) | 165 (11.2%) |
| 40 to 44 Years | 111 (8.0%) | 127 (8.6%) |
| 45 to 49 Years | 70 (5.0%) | 93 (6.3%) |
| 50 to 54 Years | 112 (8.0%) | 87 (5.9%) |
| 55 to 59 Years | 56 (4.0%) | 24 (1.6%) |
| 60 to 64 Years | 35 (2.5%) | 76 (5.2%) |
| 65 to 69 Years | 45 (3.2%) | 62 (4.2%) |
| 70 to 74 Years | 20 (1.4%) | 7 (0.5%) |
| 75 to 79 Years | 2 (0.1%) | 17 (1.2%) |
| 80 to 84 Years | 46 (3.3%) | 10 (0.7%) |
| 85 Years and over | 3 (0.2%) | 0 (0.0%) |
| Total | 1,393 (100.0%) | 1,469 (100.0%) |
Families and Households in Hackberry
Median Family Size in Hackberry
The median family size in Hackberry is 3.35 persons per family, with married-couple families (602 | 80.9%) accounting for the largest median family size of 3.48 persons per family. On the other hand, single male/father families (15 | 2.0%) represent the smallest median family size with 2.73 persons per family.
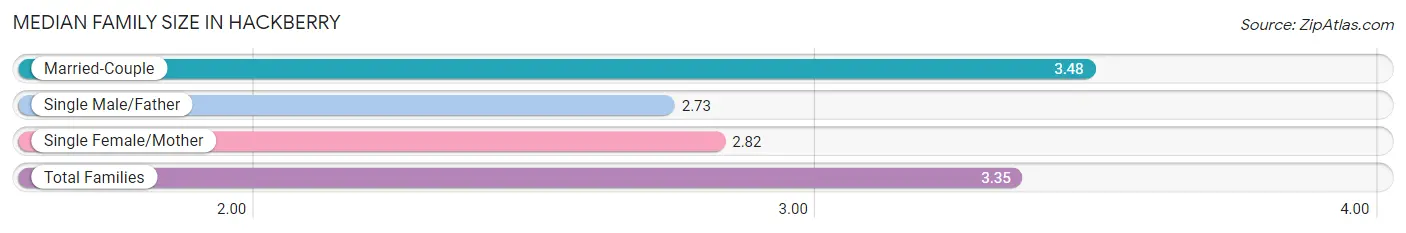
| Family Type | # Families | Family Size |
| Married-Couple | 602 (80.9%) | 3.48 |
| Single Male/Father | 15 (2.0%) | 2.73 |
| Single Female/Mother | 127 (17.1%) | 2.82 |
| Total Families | 744 (100.0%) | 3.35 |
Median Household Size in Hackberry
The median household size in Hackberry is 2.98 persons per household, with married-couple households (602 | 62.6%) accounting for the largest median household size of 3.52 persons per household. non-family households (218 | 22.7%) represent the smallest median household size with 1.36 persons per household.
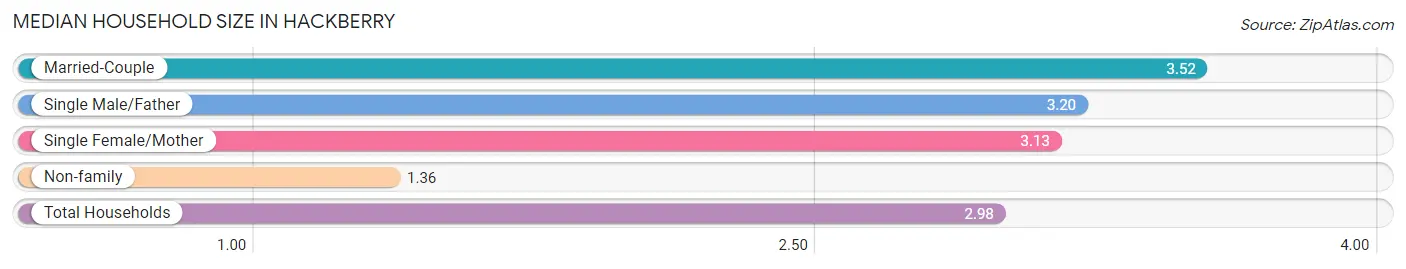
| Household Type | # Households | Household Size |
| Married-Couple | 602 (62.6%) | 3.52 |
| Single Male/Father | 15 (1.6%) | 3.20 |
| Single Female/Mother | 127 (13.2%) | 3.13 |
| Non-family | 218 (22.7%) | 1.36 |
| Total Households | 962 (100.0%) | 2.98 |
Household Size by Marriage Status in Hackberry
Out of a total of 962 households in Hackberry, 744 (77.3%) are family households, while 218 (22.7%) are nonfamily households. The most numerous type of family households are 2-person households, comprising 254, and the most common type of nonfamily households are 1-person households, comprising 177.
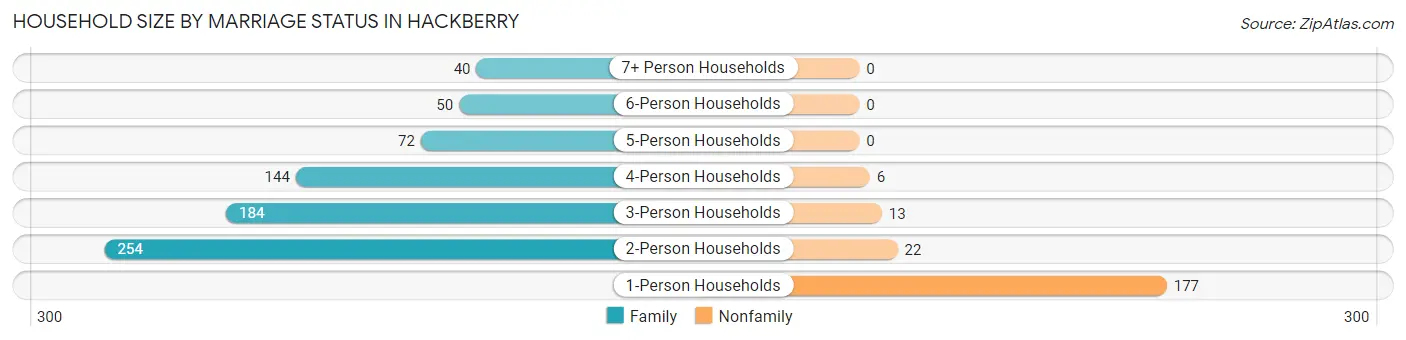
| Household Size | Family Households | Nonfamily Households |
| 1-Person Households | - | 177 (18.4%) |
| 2-Person Households | 254 (26.4%) | 22 (2.3%) |
| 3-Person Households | 184 (19.1%) | 13 (1.3%) |
| 4-Person Households | 144 (15.0%) | 6 (0.6%) |
| 5-Person Households | 72 (7.5%) | 0 (0.0%) |
| 6-Person Households | 50 (5.2%) | 0 (0.0%) |
| 7+ Person Households | 40 (4.2%) | 0 (0.0%) |
| Total | 744 (77.3%) | 218 (22.7%) |
Female Fertility in Hackberry
Fertility by Age in Hackberry
Average fertility rate in Hackberry is 122.0 births per 1,000 women. Women in the age bracket of 20 to 34 years have the highest fertility rate with 199.0 births per 1,000 women. Women in the age bracket of 20 to 34 years acount for 73.2% of all women with births.
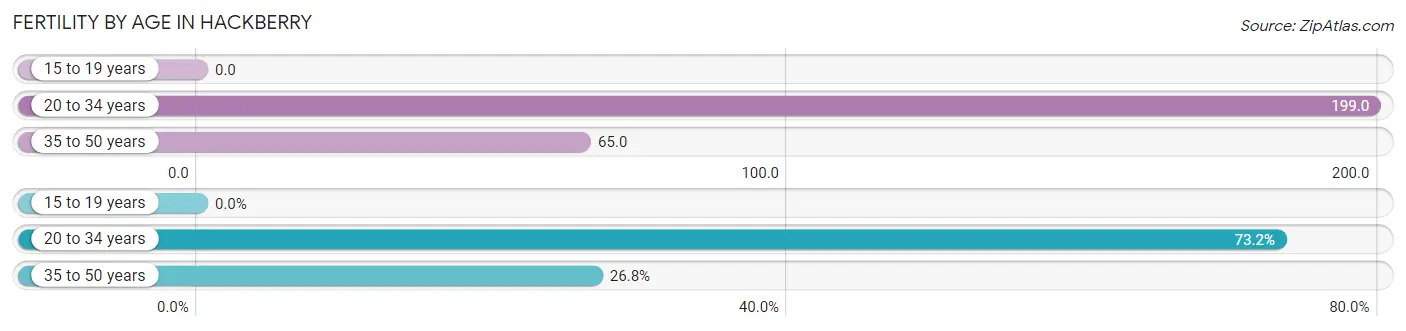
| Age Bracket | Women with Births | Births / 1,000 Women |
| 15 to 19 years | 0 (0.0%) | 0.0 |
| 20 to 34 years | 71 (73.2%) | 199.0 |
| 35 to 50 years | 26 (26.8%) | 65.0 |
| Total | 97 (100.0%) | 122.0 |
Fertility by Age by Marriage Status in Hackberry
89.7% of women with births (97) in Hackberry are married. The highest percentage of unmarried women with births falls into 20 to 34 years age bracket with 14.1% of them unmarried at the time of birth, while the lowest percentage of unmarried women with births belong to 35 to 50 years age bracket with 0.0% of them unmarried.
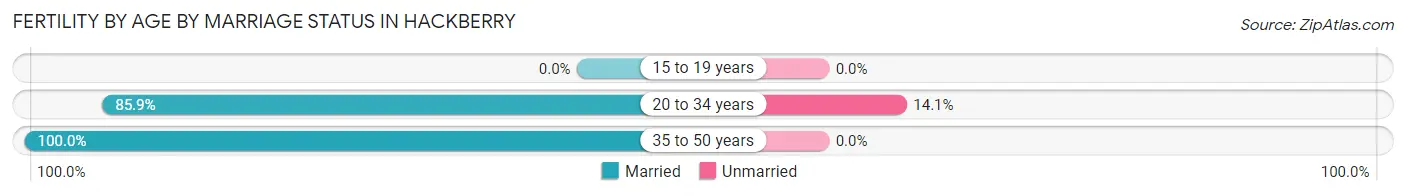
| Age Bracket | Married | Unmarried |
| 15 to 19 years | 0 (0.0%) | 0 (0.0%) |
| 20 to 34 years | 61 (85.9%) | 10 (14.1%) |
| 35 to 50 years | 26 (100.0%) | 0 (0.0%) |
| Total | 87 (89.7%) | 10 (10.3%) |
Fertility by Education in Hackberry
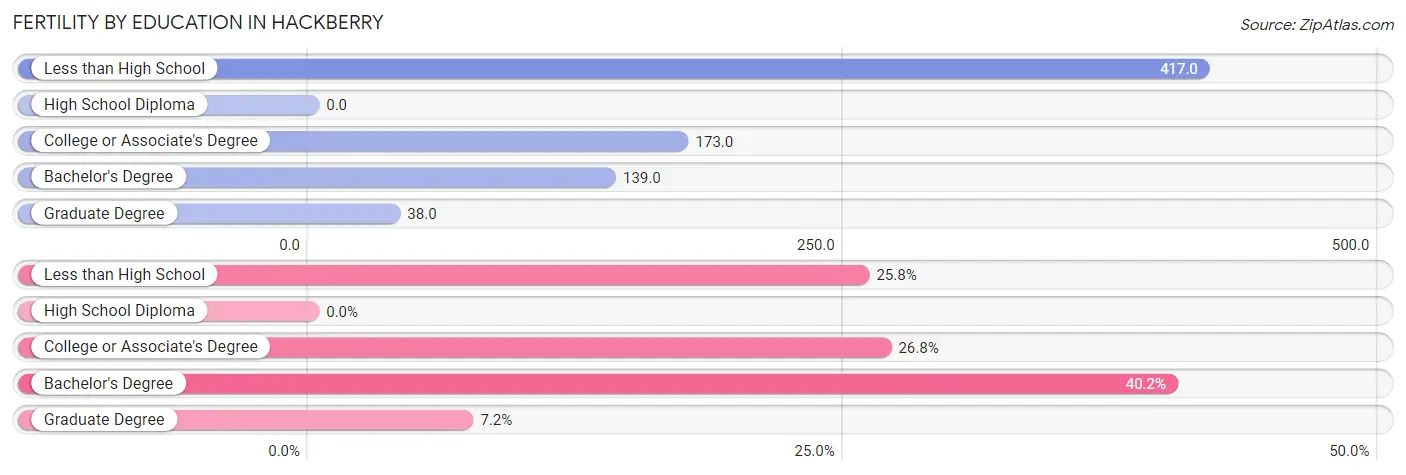
| Educational Attainment | Women with Births | Births / 1,000 Women |
| Less than High School | 25 (25.8%) | 417.0 |
| High School Diploma | 0 (0.0%) | 0.0 |
| College or Associate's Degree | 26 (26.8%) | 173.0 |
| Bachelor's Degree | 39 (40.2%) | 139.0 |
| Graduate Degree | 7 (7.2%) | 38.0 |
| Total | 97 (100.0%) | 122.0 |
Fertility by Education by Marriage Status in Hackberry
10.3% of women with births in Hackberry are unmarried. Women with the educational attainment of less than high school are most likely to be married with 100.0% of them married at childbirth, while women with the educational attainment of college or associate's degree are least likely to be married with 38.5% of them unmarried at childbirth.
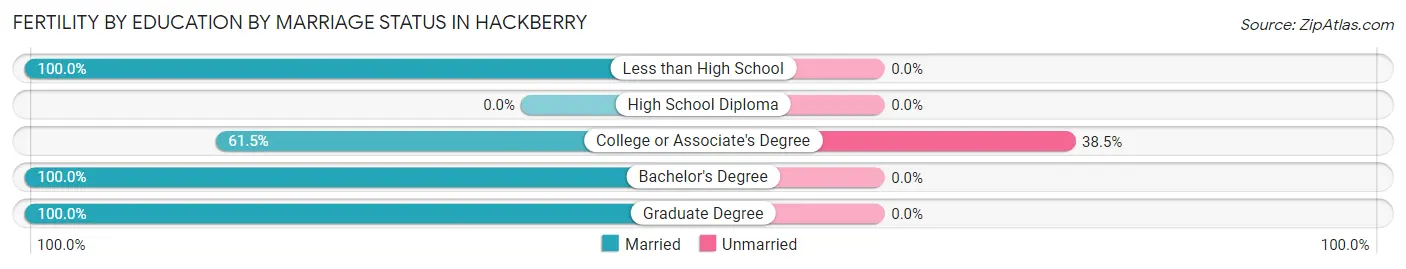
| Educational Attainment | Married | Unmarried |
| Less than High School | 25 (100.0%) | 0 (0.0%) |
| High School Diploma | 0 (0.0%) | 0 (0.0%) |
| College or Associate's Degree | 16 (61.5%) | 10 (38.5%) |
| Bachelor's Degree | 39 (100.0%) | 0 (0.0%) |
| Graduate Degree | 7 (100.0%) | 0 (0.0%) |
| Total | 87 (89.7%) | 10 (10.3%) |
Employment Characteristics in Hackberry
Employment by Class of Employer in Hackberry
Among the 1,494 employed individuals in Hackberry, private company employees (1,129 | 75.6%), not-for-profit organizations (133 | 8.9%), and local government employees (97 | 6.5%) make up the most common classes of employment.
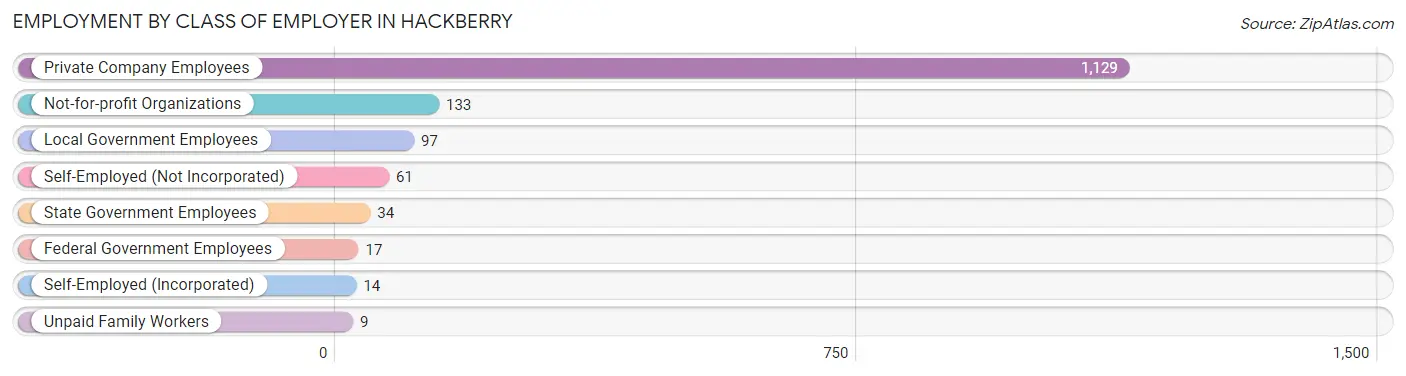
| Employer Class | # Employees | % Employees |
| Private Company Employees | 1,129 | 75.6% |
| Self-Employed (Incorporated) | 14 | 0.9% |
| Self-Employed (Not Incorporated) | 61 | 4.1% |
| Not-for-profit Organizations | 133 | 8.9% |
| Local Government Employees | 97 | 6.5% |
| State Government Employees | 34 | 2.3% |
| Federal Government Employees | 17 | 1.1% |
| Unpaid Family Workers | 9 | 0.6% |
| Total | 1,494 | 100.0% |
Employment Status by Age in Hackberry
According to the labor force statistics for Hackberry, out of the total population over 16 years of age (2,003), 78.6% or 1,574 individuals are in the labor force, with 2.8% or 44 of them unemployed. The age group with the highest labor force participation rate is 35 to 44 years, with 95.3% or 529 individuals in the labor force. Within the labor force, the 45 to 54 years age range has the highest percentage of unemployed individuals, with 8.1% or 24 of them being unemployed.
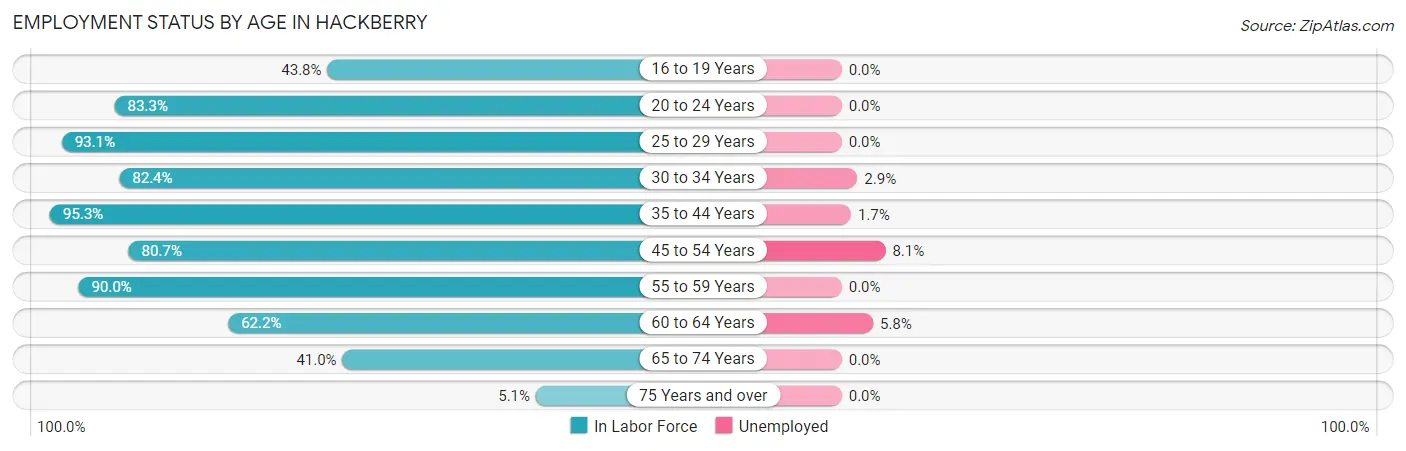
| Age Bracket | In Labor Force | Unemployed |
| 16 to 19 Years | 32 (43.8%) | 0 (0.0%) |
| 20 to 24 Years | 80 (83.3%) | 0 (0.0%) |
| 25 to 29 Years | 162 (93.1%) | 0 (0.0%) |
| 30 to 34 Years | 280 (82.4%) | 8 (2.9%) |
| 35 to 44 Years | 529 (95.3%) | 9 (1.7%) |
| 45 to 54 Years | 292 (80.7%) | 24 (8.1%) |
| 55 to 59 Years | 72 (90.0%) | 0 (0.0%) |
| 60 to 64 Years | 69 (62.2%) | 4 (5.8%) |
| 65 to 74 Years | 55 (41.0%) | 0 (0.0%) |
| 75 Years and over | 4 (5.1%) | 0 (0.0%) |
| Total | 1,574 (78.6%) | 44 (2.8%) |
Employment Status by Educational Attainment in Hackberry
According to labor force statistics for Hackberry, 86.6% of individuals (1,405) out of the total population between 25 and 64 years of age (1,622) are in the labor force, with 3.2% or 45 of them being unemployed. The group with the highest labor force participation rate are those with the educational attainment of bachelor's degree or higher, with 89.7% or 798 individuals in the labor force. Within the labor force, individuals with high school diploma education have the highest percentage of unemployment, with 8.7% or 17 of them being unemployed.
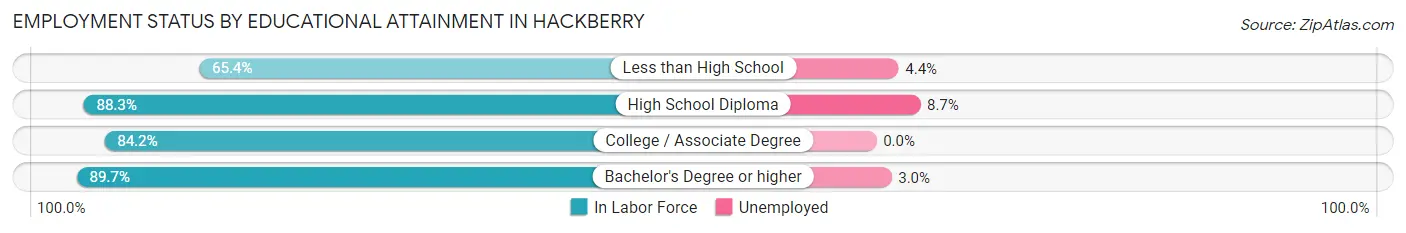
| Educational Attainment | In Labor Force | Unemployed |
| Less than High School | 68 (65.4%) | 5 (4.4%) |
| High School Diploma | 196 (88.3%) | 19 (8.7%) |
| College / Associate Degree | 342 (84.2%) | 0 (0.0%) |
| Bachelor's Degree or higher | 798 (89.7%) | 27 (3.0%) |
| Total | 1,405 (86.6%) | 52 (3.2%) |
Employment Occupations by Sex in Hackberry
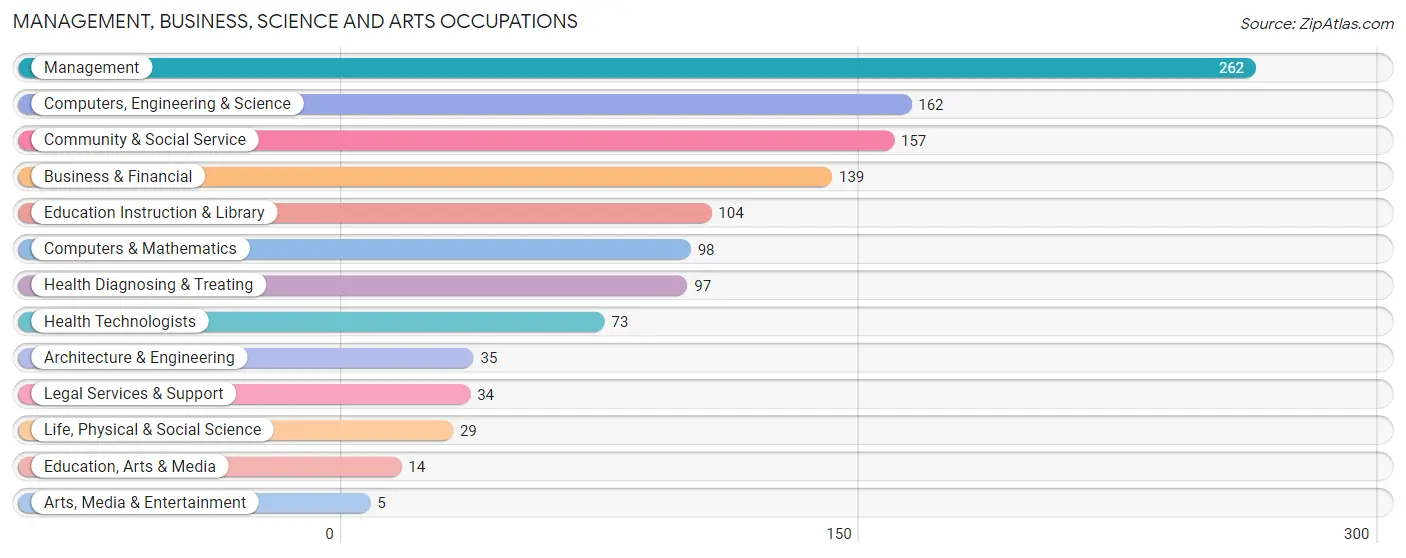
Management, Business, Science and Arts Occupations
The most common Management, Business, Science and Arts occupations in Hackberry are Management (262 | 17.2%), Computers, Engineering & Science (162 | 10.6%), Community & Social Service (157 | 10.3%), Business & Financial (139 | 9.1%), and Education Instruction & Library (104 | 6.8%).
Management, Business, Science and Arts Occupations by Sex
Within the Management, Business, Science and Arts occupations in Hackberry, the most male-oriented occupations are Architecture & Engineering (100.0%), Computers & Mathematics (89.8%), and Computers, Engineering & Science (79.0%), while the most female-oriented occupations are Education Instruction & Library (87.5%), Life, Physical & Social Science (82.8%), and Education, Arts & Media (78.6%).
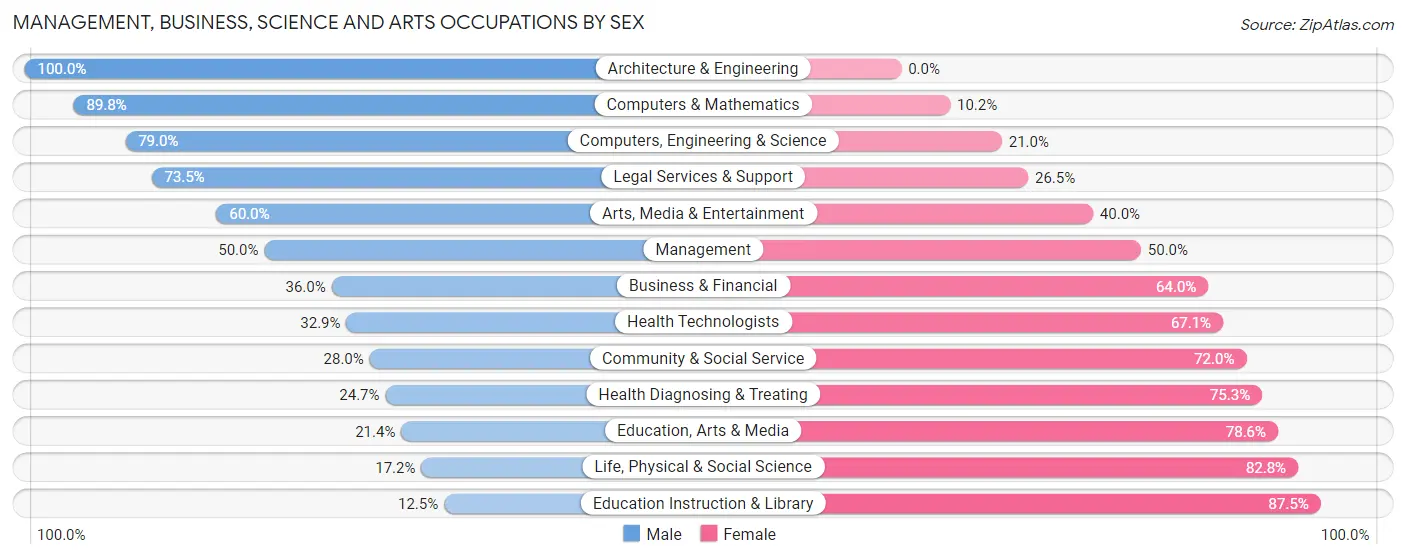
| Occupation | Male | Female |
| Management | 131 (50.0%) | 131 (50.0%) |
| Business & Financial | 50 (36.0%) | 89 (64.0%) |
| Computers, Engineering & Science | 128 (79.0%) | 34 (21.0%) |
| Computers & Mathematics | 88 (89.8%) | 10 (10.2%) |
| Architecture & Engineering | 35 (100.0%) | 0 (0.0%) |
| Life, Physical & Social Science | 5 (17.2%) | 24 (82.8%) |
| Community & Social Service | 44 (28.0%) | 113 (72.0%) |
| Education, Arts & Media | 3 (21.4%) | 11 (78.6%) |
| Legal Services & Support | 25 (73.5%) | 9 (26.5%) |
| Education Instruction & Library | 13 (12.5%) | 91 (87.5%) |
| Arts, Media & Entertainment | 3 (60.0%) | 2 (40.0%) |
| Health Diagnosing & Treating | 24 (24.7%) | 73 (75.3%) |
| Health Technologists | 24 (32.9%) | 49 (67.1%) |
| Total (Category) | 377 (46.1%) | 440 (53.9%) |
| Total (Overall) | 751 (49.3%) | 772 (50.7%) |
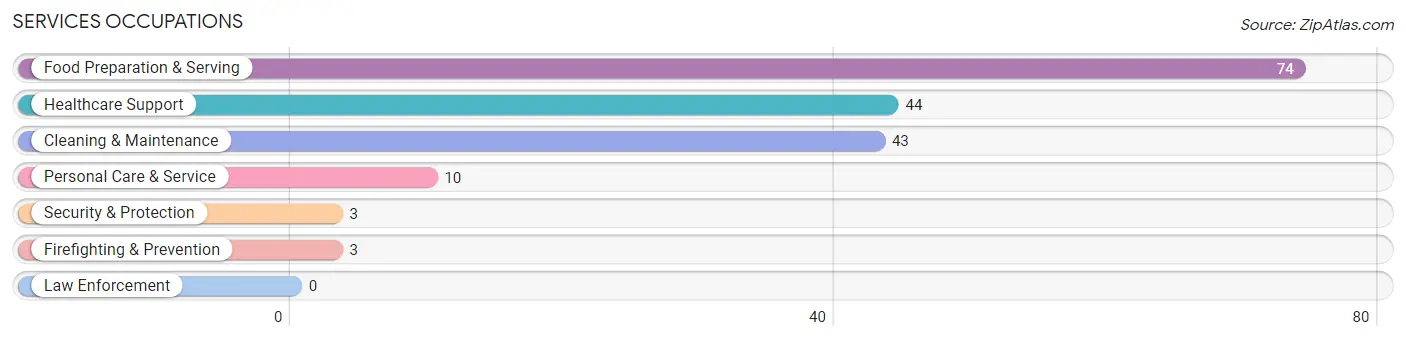
Services Occupations
The most common Services occupations in Hackberry are Food Preparation & Serving (74 | 4.9%), Healthcare Support (44 | 2.9%), Cleaning & Maintenance (43 | 2.8%), Personal Care & Service (10 | 0.7%), and Security & Protection (3 | 0.2%).
Services Occupations by Sex
Within the Services occupations in Hackberry, the most male-oriented occupations are Security & Protection (100.0%), Firefighting & Prevention (100.0%), and Cleaning & Maintenance (100.0%), while the most female-oriented occupations are Healthcare Support (100.0%), Personal Care & Service (100.0%), and Food Preparation & Serving (70.3%).
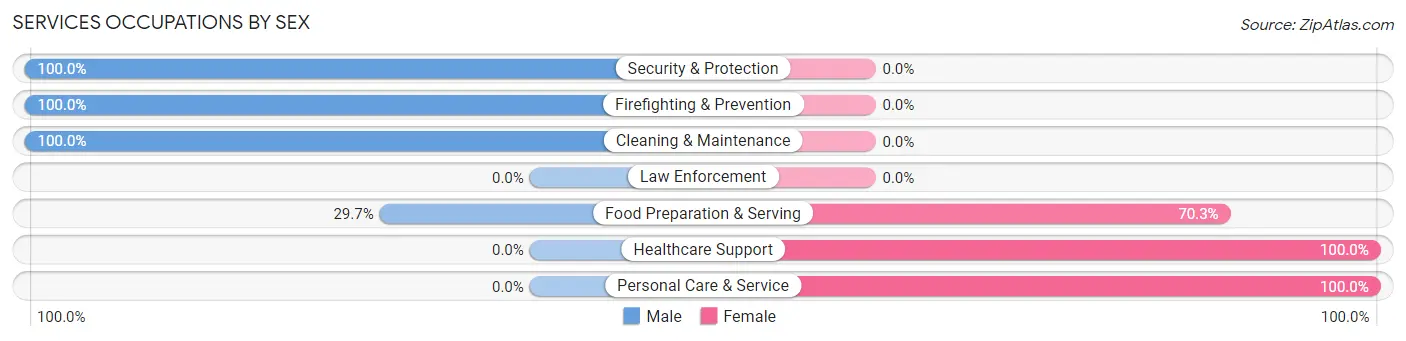
| Occupation | Male | Female |
| Healthcare Support | 0 (0.0%) | 44 (100.0%) |
| Security & Protection | 3 (100.0%) | 0 (0.0%) |
| Firefighting & Prevention | 3 (100.0%) | 0 (0.0%) |
| Law Enforcement | 0 (0.0%) | 0 (0.0%) |
| Food Preparation & Serving | 22 (29.7%) | 52 (70.3%) |
| Cleaning & Maintenance | 43 (100.0%) | 0 (0.0%) |
| Personal Care & Service | 0 (0.0%) | 10 (100.0%) |
| Total (Category) | 68 (39.1%) | 106 (60.9%) |
| Total (Overall) | 751 (49.3%) | 772 (50.7%) |
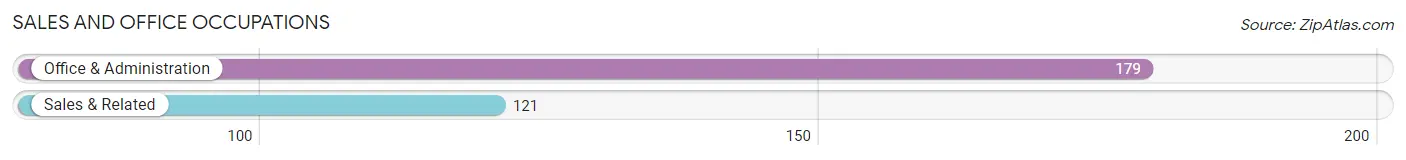
Sales and Office Occupations
The most common Sales and Office occupations in Hackberry are Office & Administration (179 | 11.7%), and Sales & Related (121 | 7.9%).
Sales and Office Occupations by Sex

| Occupation | Male | Female |
| Sales & Related | 57 (47.1%) | 64 (52.9%) |
| Office & Administration | 33 (18.4%) | 146 (81.6%) |
| Total (Category) | 90 (30.0%) | 210 (70.0%) |
| Total (Overall) | 751 (49.3%) | 772 (50.7%) |
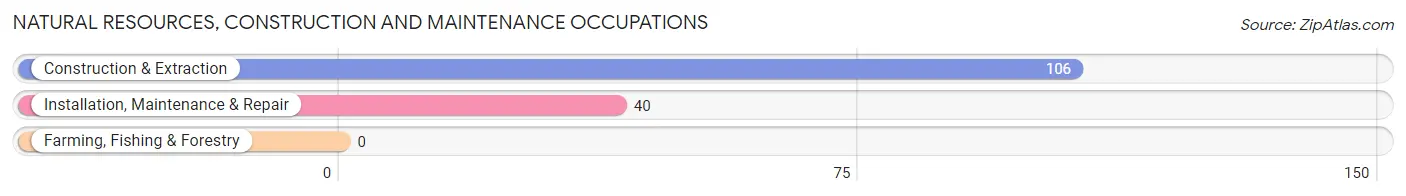
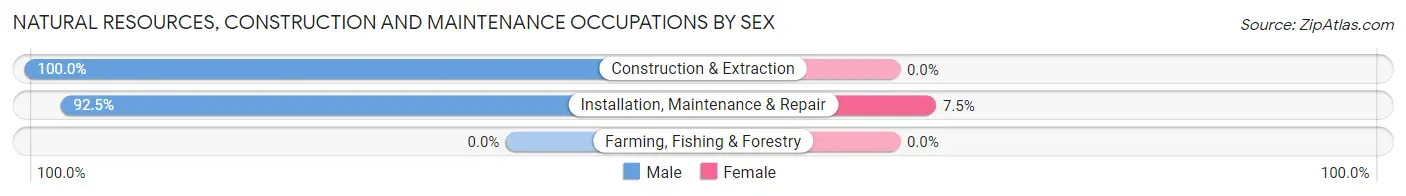
Natural Resources, Construction and Maintenance Occupations
The most common Natural Resources, Construction and Maintenance occupations in Hackberry are Construction & Extraction (106 | 7.0%), and Installation, Maintenance & Repair (40 | 2.6%).
Natural Resources, Construction and Maintenance Occupations by Sex
| Occupation | Male | Female |
| Farming, Fishing & Forestry | 0 (0.0%) | 0 (0.0%) |
| Construction & Extraction | 106 (100.0%) | 0 (0.0%) |
| Installation, Maintenance & Repair | 37 (92.5%) | 3 (7.5%) |
| Total (Category) | 143 (98.0%) | 3 (2.1%) |
| Total (Overall) | 751 (49.3%) | 772 (50.7%) |
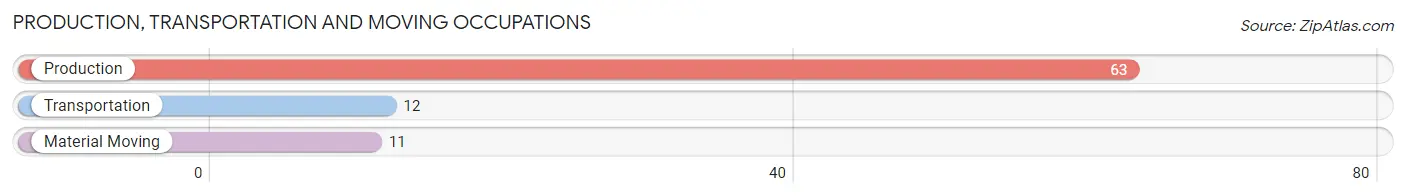
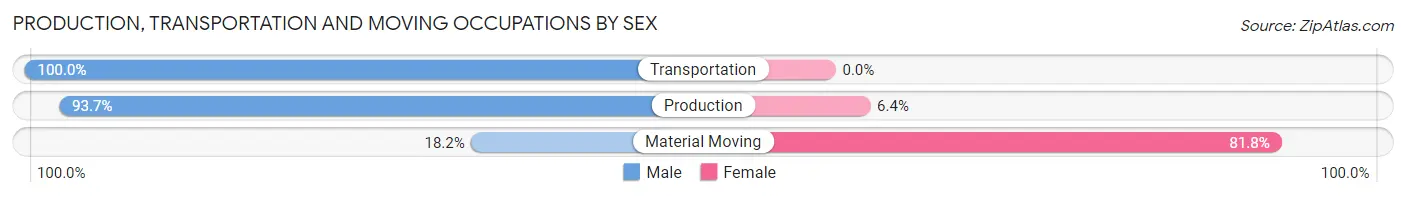
Production, Transportation and Moving Occupations
The most common Production, Transportation and Moving occupations in Hackberry are Production (63 | 4.1%), Transportation (12 | 0.8%), and Material Moving (11 | 0.7%).
Production, Transportation and Moving Occupations by Sex
| Occupation | Male | Female |
| Production | 59 (93.6%) | 4 (6.4%) |
| Transportation | 12 (100.0%) | 0 (0.0%) |
| Material Moving | 2 (18.2%) | 9 (81.8%) |
| Total (Category) | 73 (84.9%) | 13 (15.1%) |
| Total (Overall) | 751 (49.3%) | 772 (50.7%) |
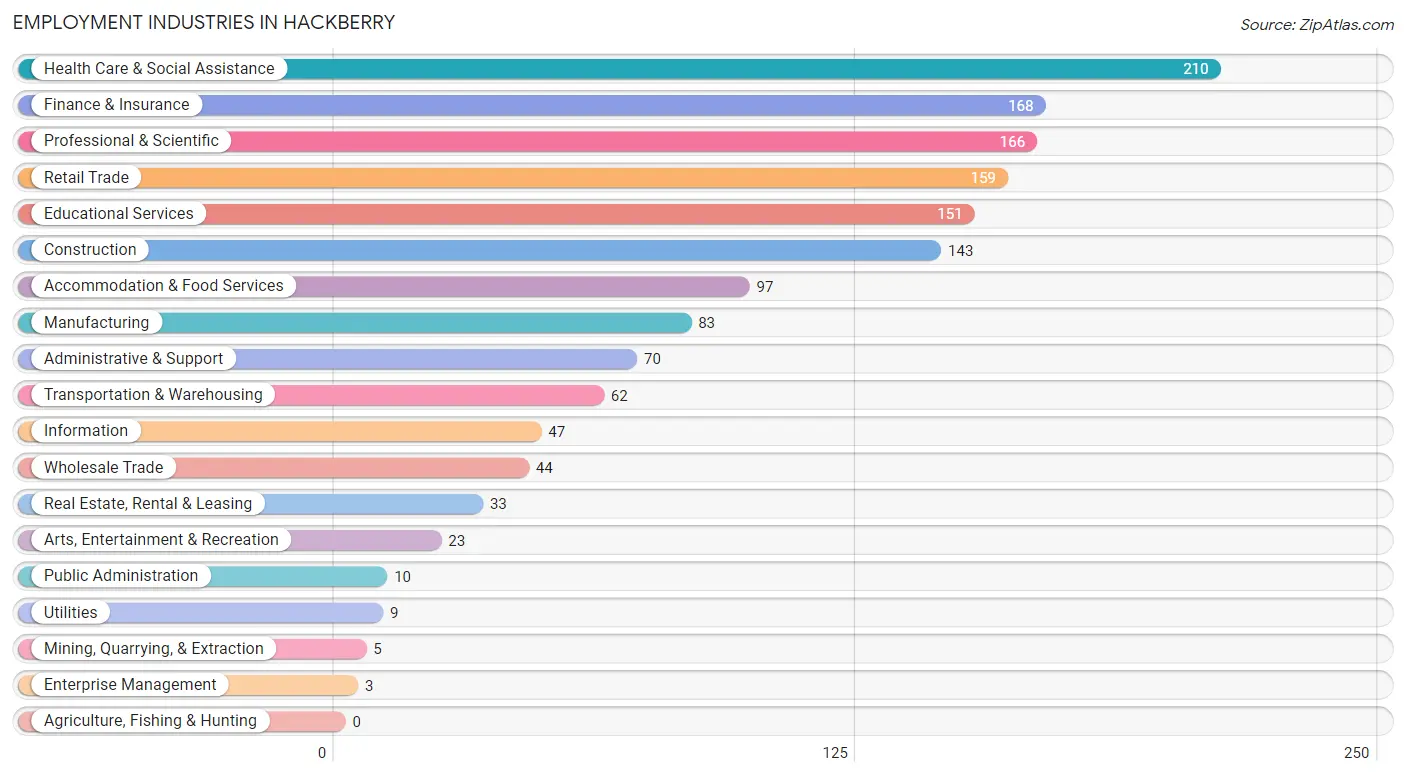
Employment Industries by Sex in Hackberry
Employment Industries in Hackberry
The major employment industries in Hackberry include Health Care & Social Assistance (210 | 13.8%), Finance & Insurance (168 | 11.0%), Professional & Scientific (166 | 10.9%), Retail Trade (159 | 10.4%), and Educational Services (151 | 9.9%).
Employment Industries by Sex in Hackberry
The Hackberry industries that see more men than women are Mining, Quarrying, & Extraction (100.0%), Arts, Entertainment & Recreation (100.0%), and Real Estate, Rental & Leasing (90.9%), whereas the industries that tend to have a higher number of women are Enterprise Management (100.0%), Health Care & Social Assistance (87.6%), and Educational Services (78.1%).
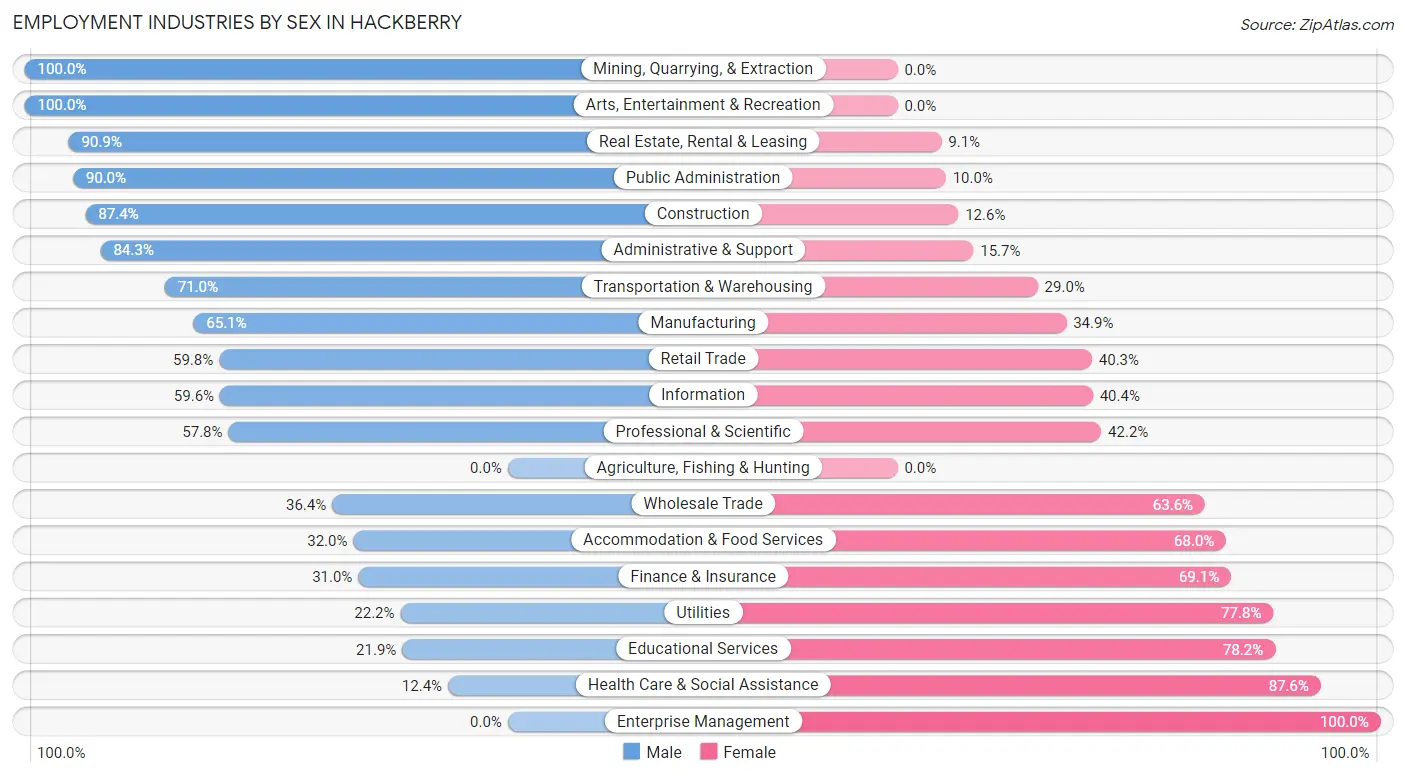
| Industry | Male | Female |
| Agriculture, Fishing & Hunting | 0 (0.0%) | 0 (0.0%) |
| Mining, Quarrying, & Extraction | 5 (100.0%) | 0 (0.0%) |
| Construction | 125 (87.4%) | 18 (12.6%) |
| Manufacturing | 54 (65.1%) | 29 (34.9%) |
| Wholesale Trade | 16 (36.4%) | 28 (63.6%) |
| Retail Trade | 95 (59.8%) | 64 (40.3%) |
| Transportation & Warehousing | 44 (71.0%) | 18 (29.0%) |
| Utilities | 2 (22.2%) | 7 (77.8%) |
| Information | 28 (59.6%) | 19 (40.4%) |
| Finance & Insurance | 52 (30.9%) | 116 (69.1%) |
| Real Estate, Rental & Leasing | 30 (90.9%) | 3 (9.1%) |
| Professional & Scientific | 96 (57.8%) | 70 (42.2%) |
| Enterprise Management | 0 (0.0%) | 3 (100.0%) |
| Administrative & Support | 59 (84.3%) | 11 (15.7%) |
| Educational Services | 33 (21.8%) | 118 (78.1%) |
| Health Care & Social Assistance | 26 (12.4%) | 184 (87.6%) |
| Arts, Entertainment & Recreation | 23 (100.0%) | 0 (0.0%) |
| Accommodation & Food Services | 31 (32.0%) | 66 (68.0%) |
| Public Administration | 9 (90.0%) | 1 (10.0%) |
| Total | 751 (49.3%) | 772 (50.7%) |
Education in Hackberry
School Enrollment in Hackberry
The most common levels of schooling among the 785 students in Hackberry are elementary school (206 | 26.2%), middle school (175 | 22.3%), and nursery / preschool (113 | 14.4%).
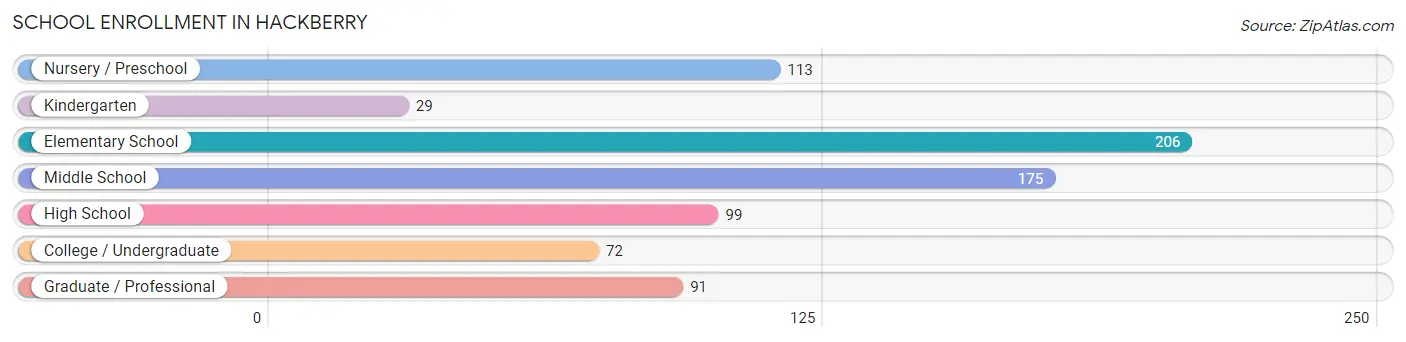
| School Level | # Students | % Students |
| Nursery / Preschool | 113 | 14.4% |
| Kindergarten | 29 | 3.7% |
| Elementary School | 206 | 26.2% |
| Middle School | 175 | 22.3% |
| High School | 99 | 12.6% |
| College / Undergraduate | 72 | 9.2% |
| Graduate / Professional | 91 | 11.6% |
| Total | 785 | 100.0% |
School Enrollment by Age by Funding Source in Hackberry
Out of a total of 785 students who are enrolled in schools in Hackberry, 54 (6.9%) attend a private institution, while the remaining 731 (93.1%) are enrolled in public schools. The age group of 3 to 4 year olds has the highest likelihood of being enrolled in private schools, with 20 (26.7% in the age bracket) enrolled. Conversely, the age group of 10 to 14 year olds has the lowest likelihood of being enrolled in a private school, with 257 (100.0% in the age bracket) attending a public institution.
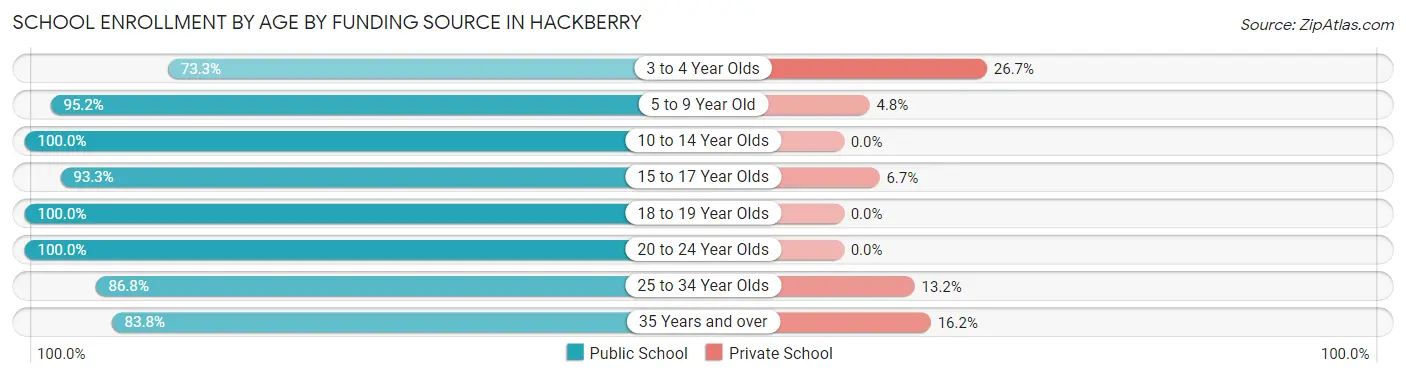
| Age Bracket | Public School | Private School |
| 3 to 4 Year Olds | 55 (73.3%) | 20 (26.7%) |
| 5 to 9 Year Old | 217 (95.2%) | 11 (4.8%) |
| 10 to 14 Year Olds | 257 (100.0%) | 0 (0.0%) |
| 15 to 17 Year Olds | 56 (93.3%) | 4 (6.7%) |
| 18 to 19 Year Olds | 18 (100.0%) | 0 (0.0%) |
| 20 to 24 Year Olds | 20 (100.0%) | 0 (0.0%) |
| 25 to 34 Year Olds | 46 (86.8%) | 7 (13.2%) |
| 35 Years and over | 62 (83.8%) | 12 (16.2%) |
| Total | 731 (93.1%) | 54 (6.9%) |
Educational Attainment by Field of Study in Hackberry
Business (235 | 23.6%), arts & humanities (109 | 11.0%), social sciences (94 | 9.5%), education (83 | 8.3%), and engineering (76 | 7.6%) are the most common fields of study among 995 individuals in Hackberry who have obtained a bachelor's degree or higher.
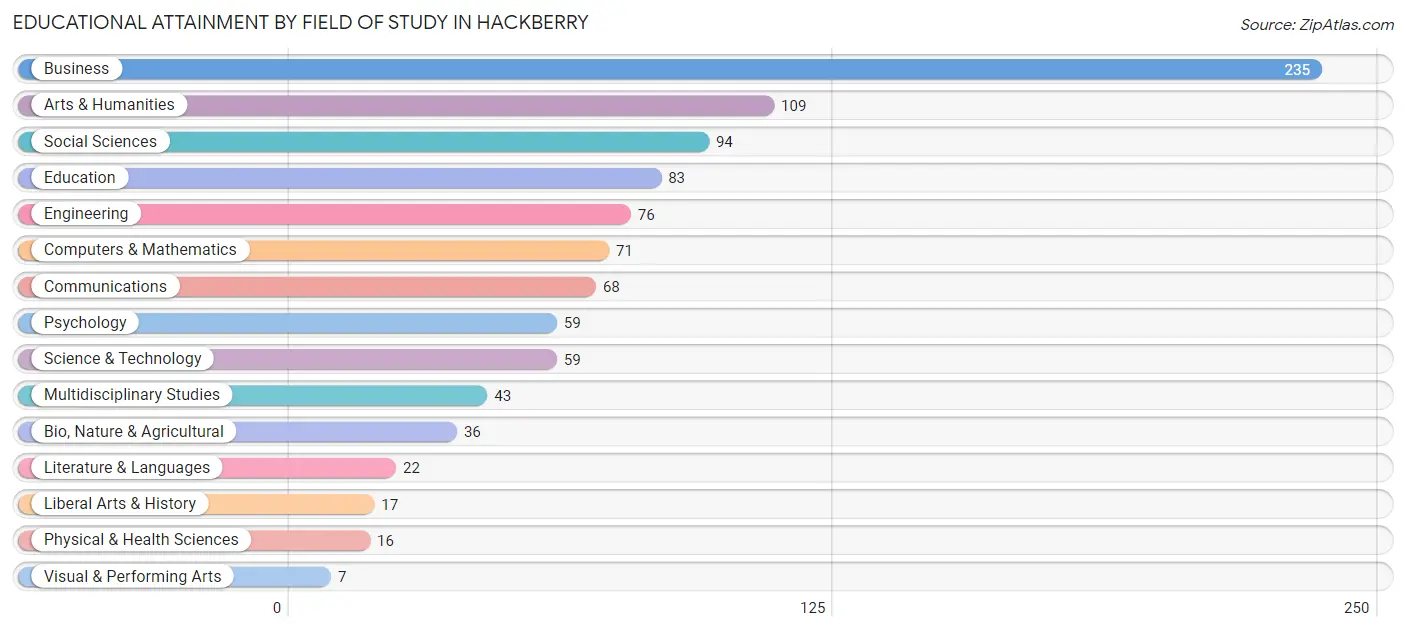
| Field of Study | # Graduates | % Graduates |
| Computers & Mathematics | 71 | 7.1% |
| Bio, Nature & Agricultural | 36 | 3.6% |
| Physical & Health Sciences | 16 | 1.6% |
| Psychology | 59 | 5.9% |
| Social Sciences | 94 | 9.5% |
| Engineering | 76 | 7.6% |
| Multidisciplinary Studies | 43 | 4.3% |
| Science & Technology | 59 | 5.9% |
| Business | 235 | 23.6% |
| Education | 83 | 8.3% |
| Literature & Languages | 22 | 2.2% |
| Liberal Arts & History | 17 | 1.7% |
| Visual & Performing Arts | 7 | 0.7% |
| Communications | 68 | 6.8% |
| Arts & Humanities | 109 | 11.0% |
| Total | 995 | 100.0% |
Transportation & Commute in Hackberry
Vehicle Availability by Sex in Hackberry
The most prevalent vehicle ownership categories in Hackberry are males with 2 vehicles (456, accounting for 60.1%) and females with 2 vehicles (403, making up 62.0%).
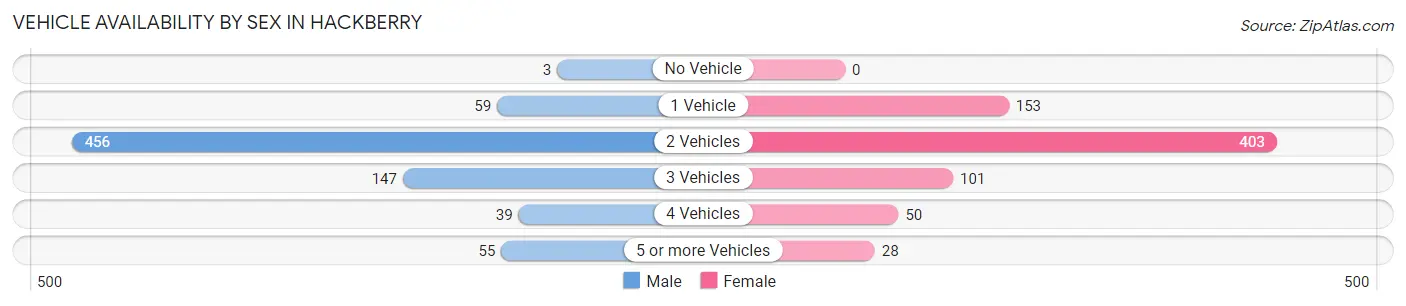
| Vehicles Available | Male | Female |
| No Vehicle | 3 (0.4%) | 0 (0.0%) |
| 1 Vehicle | 59 (7.8%) | 153 (20.8%) |
| 2 Vehicles | 456 (60.1%) | 403 (54.8%) |
| 3 Vehicles | 147 (19.4%) | 101 (13.7%) |
| 4 Vehicles | 39 (5.1%) | 50 (6.8%) |
| 5 or more Vehicles | 55 (7.2%) | 28 (3.8%) |
| Total | 759 (100.0%) | 735 (100.0%) |
Commute Time in Hackberry
The most frequently occuring commute durations in Hackberry are 45 to 59 minutes (274 commuters, 21.4%), 40 to 44 minutes (184 commuters, 14.4%), and 30 to 34 minutes (177 commuters, 13.9%).
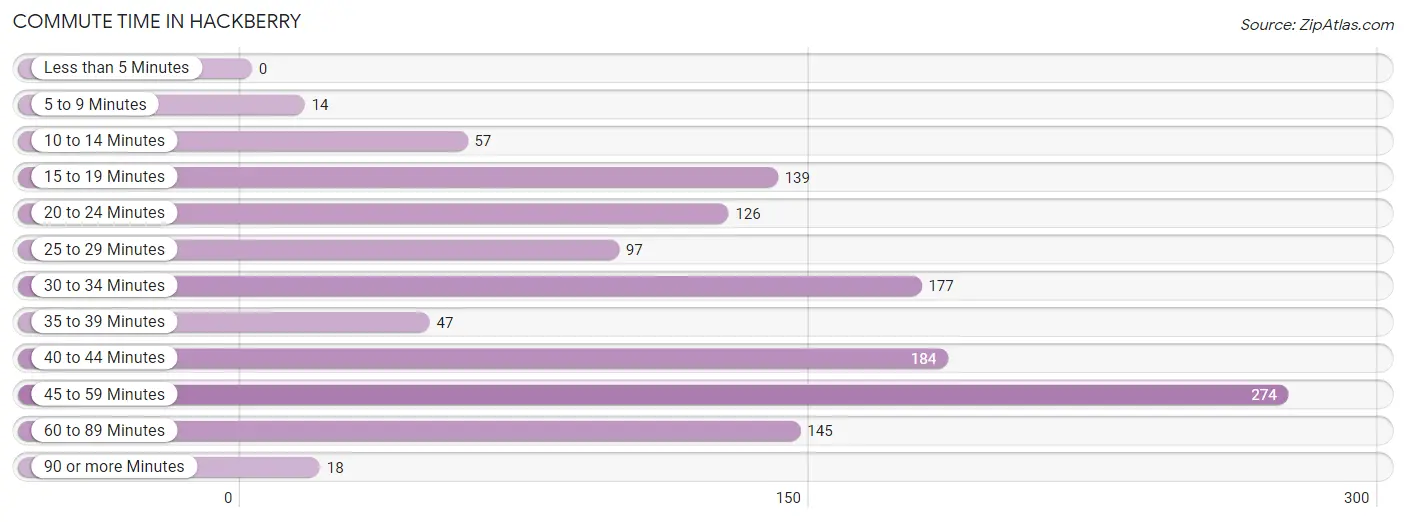
| Commute Time | # Commuters | % Commuters |
| Less than 5 Minutes | 0 | 0.0% |
| 5 to 9 Minutes | 14 | 1.1% |
| 10 to 14 Minutes | 57 | 4.5% |
| 15 to 19 Minutes | 139 | 10.9% |
| 20 to 24 Minutes | 126 | 9.9% |
| 25 to 29 Minutes | 97 | 7.6% |
| 30 to 34 Minutes | 177 | 13.9% |
| 35 to 39 Minutes | 47 | 3.7% |
| 40 to 44 Minutes | 184 | 14.4% |
| 45 to 59 Minutes | 274 | 21.4% |
| 60 to 89 Minutes | 145 | 11.4% |
| 90 or more Minutes | 18 | 1.4% |
Commute Time by Sex in Hackberry
The most common commute times in Hackberry are 40 to 44 minutes (140 commuters, 21.7%) for males and 45 to 59 minutes (146 commuters, 23.0%) for females.
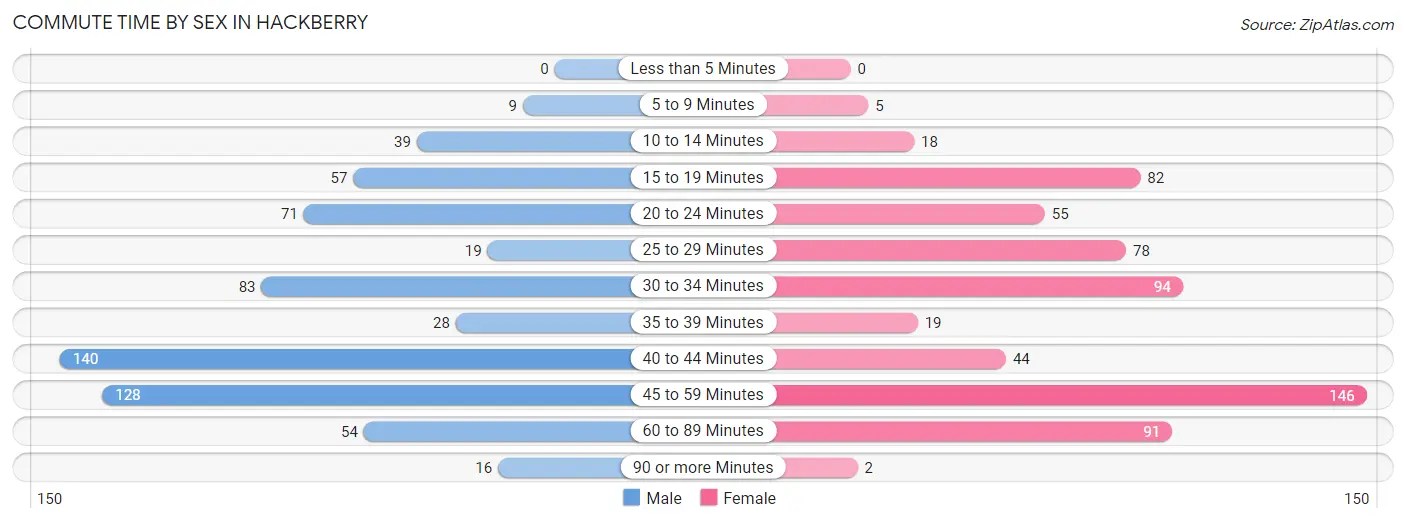
| Commute Time | Male | Female |
| Less than 5 Minutes | 0 (0.0%) | 0 (0.0%) |
| 5 to 9 Minutes | 9 (1.4%) | 5 (0.8%) |
| 10 to 14 Minutes | 39 (6.1%) | 18 (2.8%) |
| 15 to 19 Minutes | 57 (8.8%) | 82 (12.9%) |
| 20 to 24 Minutes | 71 (11.0%) | 55 (8.7%) |
| 25 to 29 Minutes | 19 (2.9%) | 78 (12.3%) |
| 30 to 34 Minutes | 83 (12.9%) | 94 (14.8%) |
| 35 to 39 Minutes | 28 (4.3%) | 19 (3.0%) |
| 40 to 44 Minutes | 140 (21.7%) | 44 (6.9%) |
| 45 to 59 Minutes | 128 (19.9%) | 146 (23.0%) |
| 60 to 89 Minutes | 54 (8.4%) | 91 (14.3%) |
| 90 or more Minutes | 16 (2.5%) | 2 (0.3%) |
Time of Departure to Work by Sex in Hackberry
The most frequent times of departure to work in Hackberry are 7:00 AM to 7:29 AM (211, 32.8%) for males and 7:00 AM to 7:29 AM (127, 20.0%) for females.
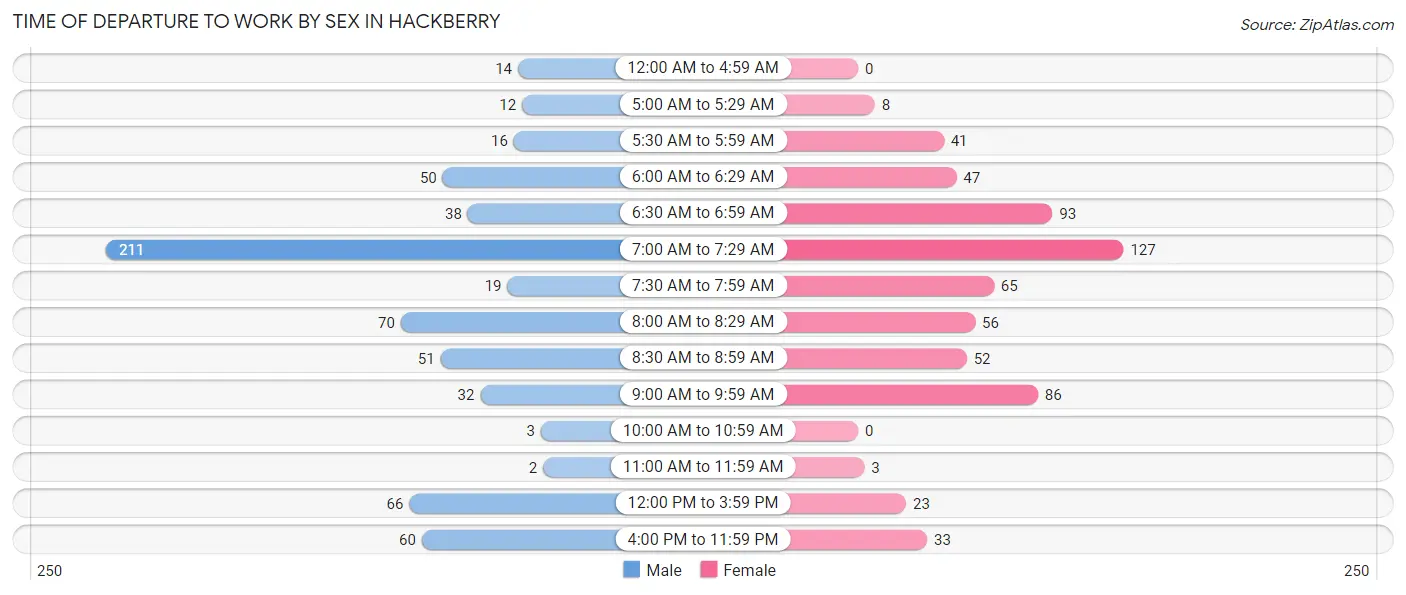
| Time of Departure | Male | Female |
| 12:00 AM to 4:59 AM | 14 (2.2%) | 0 (0.0%) |
| 5:00 AM to 5:29 AM | 12 (1.9%) | 8 (1.3%) |
| 5:30 AM to 5:59 AM | 16 (2.5%) | 41 (6.5%) |
| 6:00 AM to 6:29 AM | 50 (7.8%) | 47 (7.4%) |
| 6:30 AM to 6:59 AM | 38 (5.9%) | 93 (14.7%) |
| 7:00 AM to 7:29 AM | 211 (32.8%) | 127 (20.0%) |
| 7:30 AM to 7:59 AM | 19 (2.9%) | 65 (10.2%) |
| 8:00 AM to 8:29 AM | 70 (10.9%) | 56 (8.8%) |
| 8:30 AM to 8:59 AM | 51 (7.9%) | 52 (8.2%) |
| 9:00 AM to 9:59 AM | 32 (5.0%) | 86 (13.6%) |
| 10:00 AM to 10:59 AM | 3 (0.5%) | 0 (0.0%) |
| 11:00 AM to 11:59 AM | 2 (0.3%) | 3 (0.5%) |
| 12:00 PM to 3:59 PM | 66 (10.2%) | 23 (3.6%) |
| 4:00 PM to 11:59 PM | 60 (9.3%) | 33 (5.2%) |
| Total | 644 (100.0%) | 634 (100.0%) |
Housing Occupancy in Hackberry
Occupancy by Ownership in Hackberry
Of the total 962 dwellings in Hackberry, owner-occupied units account for 761 (79.1%), while renter-occupied units make up 201 (20.9%).
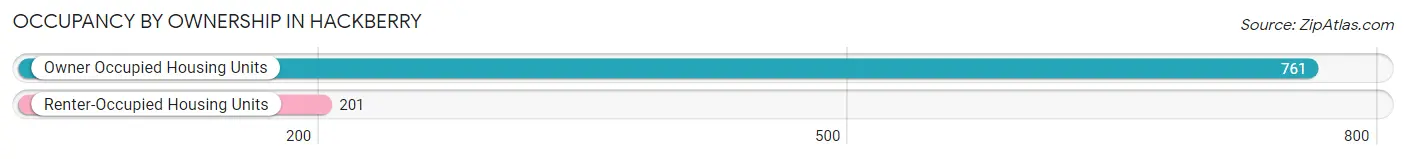
| Occupancy | # Housing Units | % Housing Units |
| Owner Occupied Housing Units | 761 | 79.1% |
| Renter-Occupied Housing Units | 201 | 20.9% |
| Total Occupied Housing Units | 962 | 100.0% |
Occupancy by Household Size in Hackberry
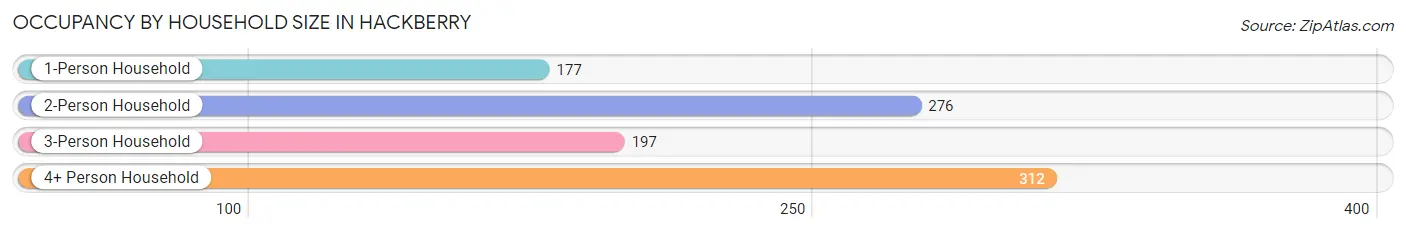
| Household Size | # Housing Units | % Housing Units |
| 1-Person Household | 177 | 18.4% |
| 2-Person Household | 276 | 28.7% |
| 3-Person Household | 197 | 20.5% |
| 4+ Person Household | 312 | 32.4% |
| Total Housing Units | 962 | 100.0% |
Occupancy by Ownership by Household Size in Hackberry
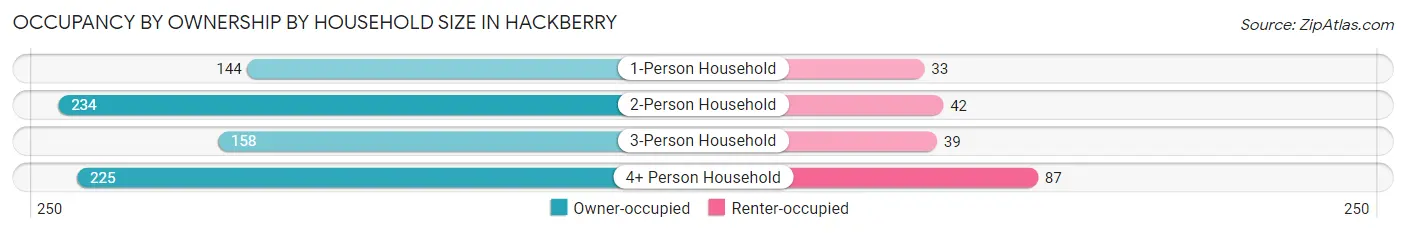
| Household Size | Owner-occupied | Renter-occupied |
| 1-Person Household | 144 (81.4%) | 33 (18.6%) |
| 2-Person Household | 234 (84.8%) | 42 (15.2%) |
| 3-Person Household | 158 (80.2%) | 39 (19.8%) |
| 4+ Person Household | 225 (72.1%) | 87 (27.9%) |
| Total Housing Units | 761 (79.1%) | 201 (20.9%) |
Occupancy by Educational Attainment in Hackberry
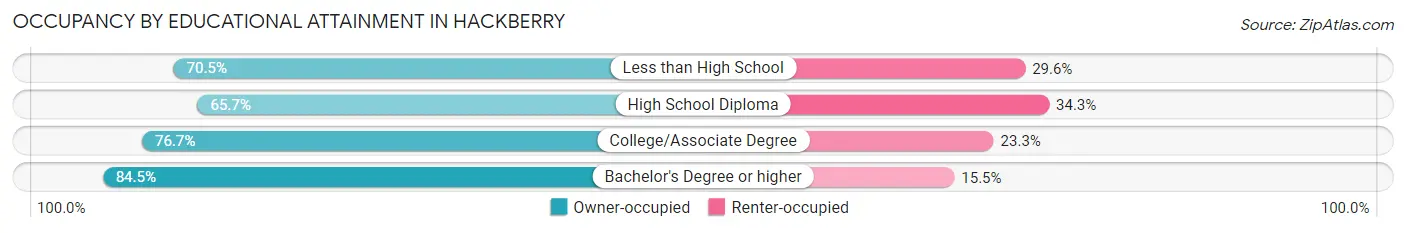
| Household Size | Owner-occupied | Renter-occupied |
| Less than High School | 31 (70.5%) | 13 (29.5%) |
| High School Diploma | 92 (65.7%) | 48 (34.3%) |
| College/Associate Degree | 191 (76.7%) | 58 (23.3%) |
| Bachelor's Degree or higher | 447 (84.5%) | 82 (15.5%) |
Occupancy by Age of Householder in Hackberry
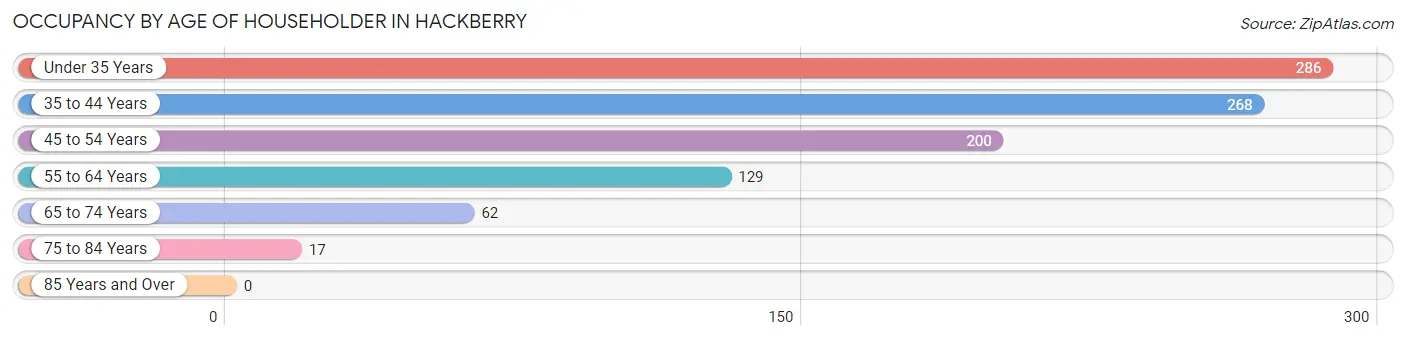
| Age Bracket | # Households | % Households |
| Under 35 Years | 286 | 29.7% |
| 35 to 44 Years | 268 | 27.9% |
| 45 to 54 Years | 200 | 20.8% |
| 55 to 64 Years | 129 | 13.4% |
| 65 to 74 Years | 62 | 6.4% |
| 75 to 84 Years | 17 | 1.8% |
| 85 Years and Over | 0 | 0.0% |
| Total | 962 | 100.0% |
Housing Finances in Hackberry
Median Income by Occupancy in Hackberry
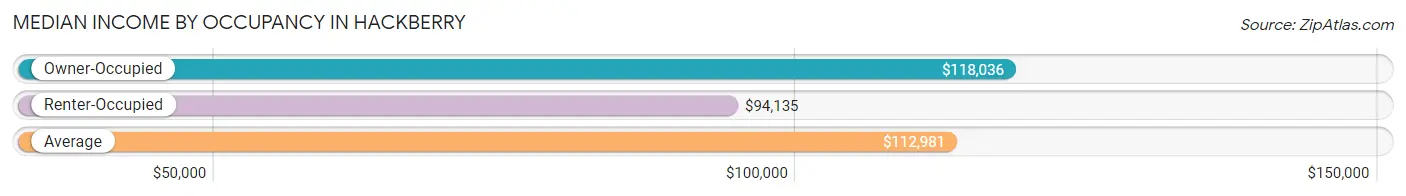
| Occupancy Type | # Households | Median Income |
| Owner-Occupied | 761 (79.1%) | $118,036 |
| Renter-Occupied | 201 (20.9%) | $94,135 |
| Average | 962 (100.0%) | $112,981 |
Occupancy by Householder Income Bracket in Hackberry
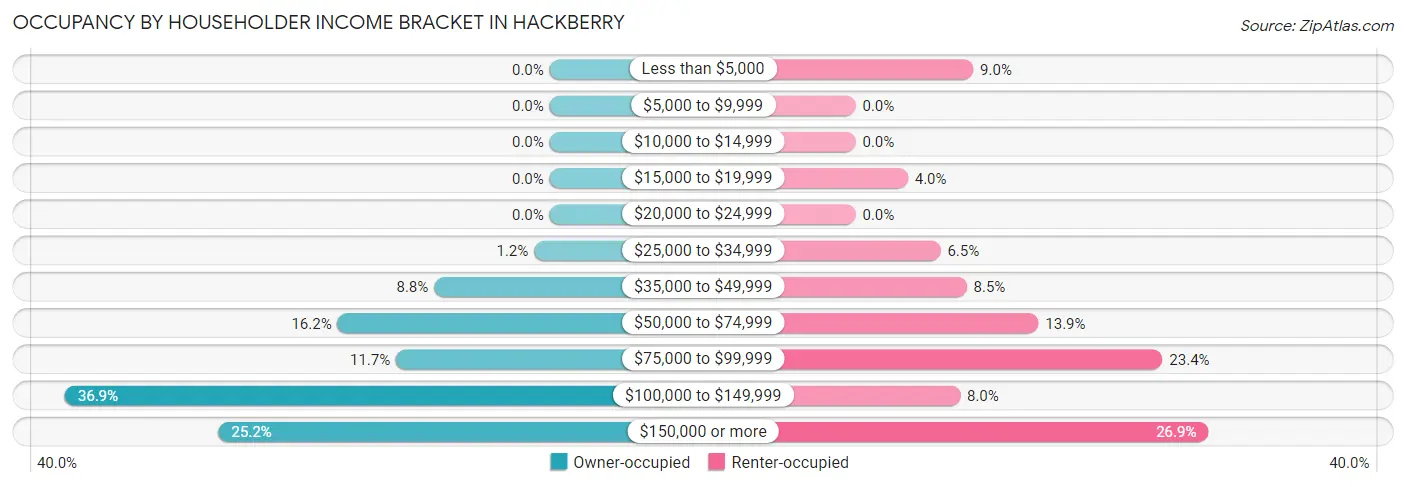
| Income Bracket | Owner-occupied | Renter-occupied |
| Less than $5,000 | 0 (0.0%) | 18 (9.0%) |
| $5,000 to $9,999 | 0 (0.0%) | 0 (0.0%) |
| $10,000 to $14,999 | 0 (0.0%) | 0 (0.0%) |
| $15,000 to $19,999 | 0 (0.0%) | 8 (4.0%) |
| $20,000 to $24,999 | 0 (0.0%) | 0 (0.0%) |
| $25,000 to $34,999 | 9 (1.2%) | 13 (6.5%) |
| $35,000 to $49,999 | 67 (8.8%) | 17 (8.5%) |
| $50,000 to $74,999 | 123 (16.2%) | 28 (13.9%) |
| $75,000 to $99,999 | 89 (11.7%) | 47 (23.4%) |
| $100,000 to $149,999 | 281 (36.9%) | 16 (8.0%) |
| $150,000 or more | 192 (25.2%) | 54 (26.9%) |
| Total | 761 (100.0%) | 201 (100.0%) |
Monthly Housing Cost Tiers in Hackberry
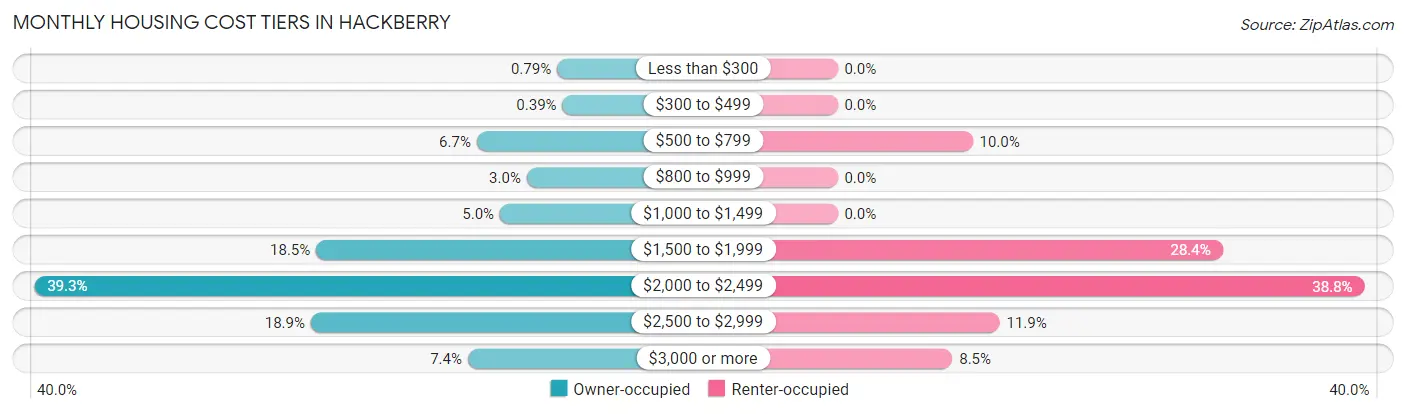
| Monthly Cost | Owner-occupied | Renter-occupied |
| Less than $300 | 6 (0.8%) | 0 (0.0%) |
| $300 to $499 | 3 (0.4%) | 0 (0.0%) |
| $500 to $799 | 51 (6.7%) | 20 (10.0%) |
| $800 to $999 | 23 (3.0%) | 0 (0.0%) |
| $1,000 to $1,499 | 38 (5.0%) | 0 (0.0%) |
| $1,500 to $1,999 | 141 (18.5%) | 57 (28.4%) |
| $2,000 to $2,499 | 299 (39.3%) | 78 (38.8%) |
| $2,500 to $2,999 | 144 (18.9%) | 24 (11.9%) |
| $3,000 or more | 56 (7.4%) | 17 (8.5%) |
| Total | 761 (100.0%) | 201 (100.0%) |
Physical Housing Characteristics in Hackberry
Housing Structures in Hackberry
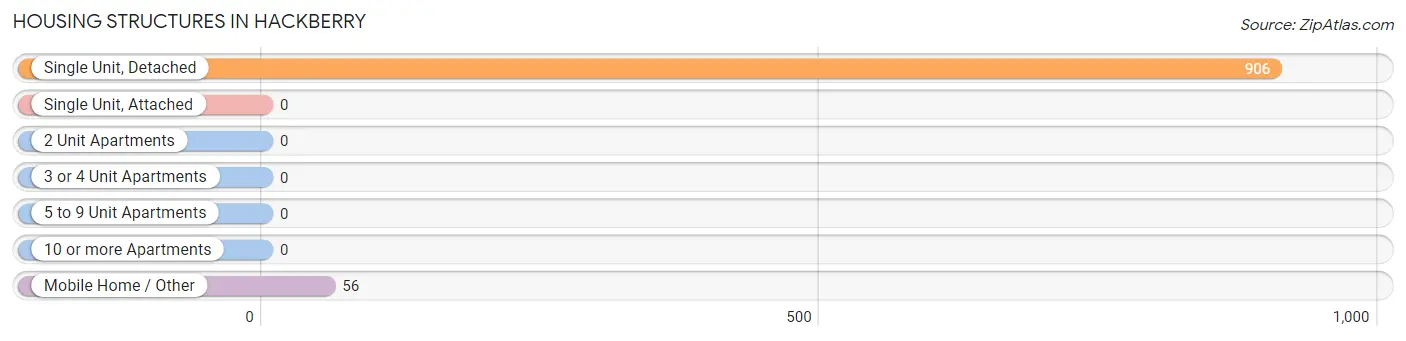
| Structure Type | # Housing Units | % Housing Units |
| Single Unit, Detached | 906 | 94.2% |
| Single Unit, Attached | 0 | 0.0% |
| 2 Unit Apartments | 0 | 0.0% |
| 3 or 4 Unit Apartments | 0 | 0.0% |
| 5 to 9 Unit Apartments | 0 | 0.0% |
| 10 or more Apartments | 0 | 0.0% |
| Mobile Home / Other | 56 | 5.8% |
| Total | 962 | 100.0% |
Housing Structures by Occupancy in Hackberry
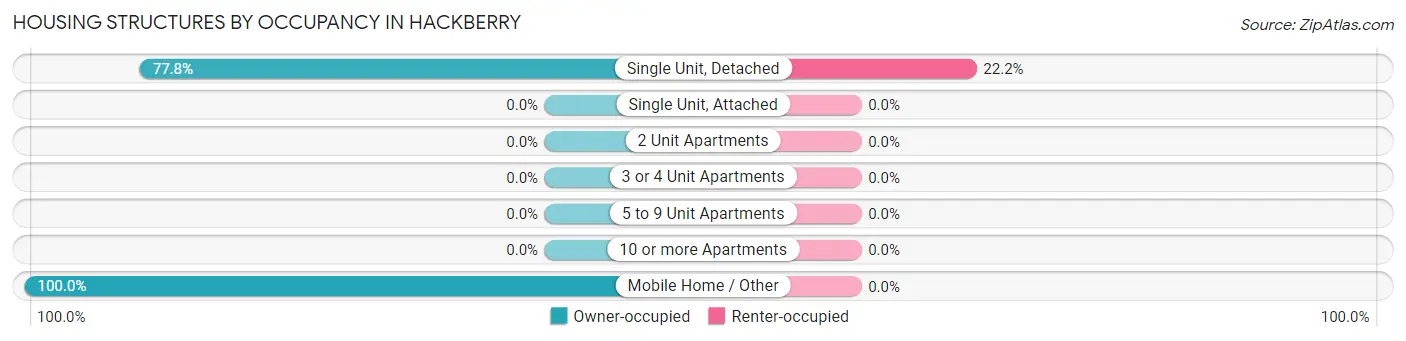
| Structure Type | Owner-occupied | Renter-occupied |
| Single Unit, Detached | 705 (77.8%) | 201 (22.2%) |
| Single Unit, Attached | 0 (0.0%) | 0 (0.0%) |
| 2 Unit Apartments | 0 (0.0%) | 0 (0.0%) |
| 3 or 4 Unit Apartments | 0 (0.0%) | 0 (0.0%) |
| 5 to 9 Unit Apartments | 0 (0.0%) | 0 (0.0%) |
| 10 or more Apartments | 0 (0.0%) | 0 (0.0%) |
| Mobile Home / Other | 56 (100.0%) | 0 (0.0%) |
| Total | 761 (79.1%) | 201 (20.9%) |
Housing Structures by Number of Rooms in Hackberry
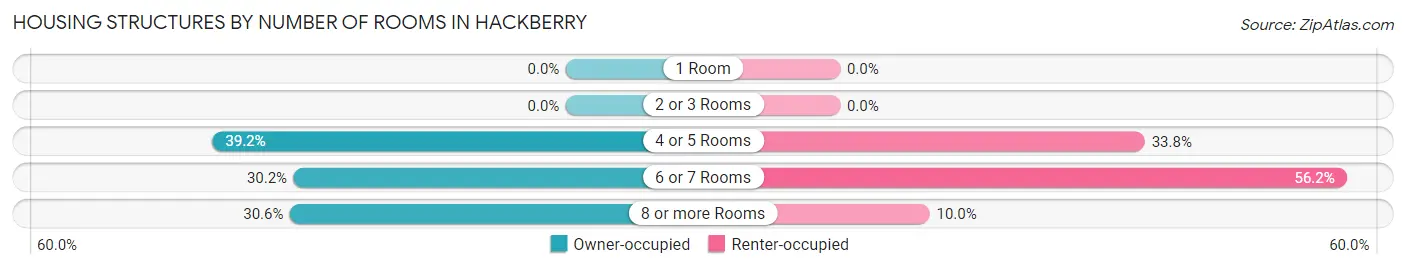
| Number of Rooms | Owner-occupied | Renter-occupied |
| 1 Room | 0 (0.0%) | 0 (0.0%) |
| 2 or 3 Rooms | 0 (0.0%) | 0 (0.0%) |
| 4 or 5 Rooms | 298 (39.2%) | 68 (33.8%) |
| 6 or 7 Rooms | 230 (30.2%) | 113 (56.2%) |
| 8 or more Rooms | 233 (30.6%) | 20 (10.0%) |
| Total | 761 (100.0%) | 201 (100.0%) |
Housing Structure by Heating Type in Hackberry
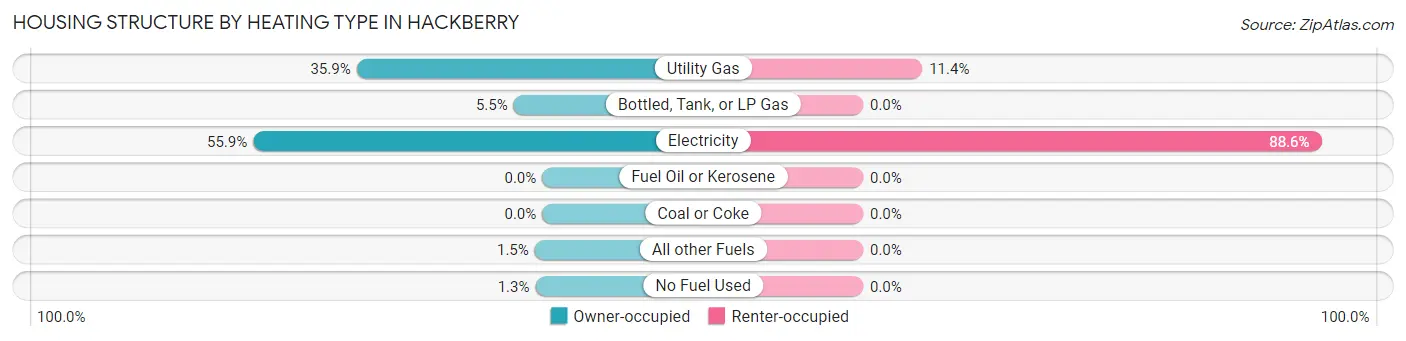
| Heating Type | Owner-occupied | Renter-occupied |
| Utility Gas | 273 (35.9%) | 23 (11.4%) |
| Bottled, Tank, or LP Gas | 42 (5.5%) | 0 (0.0%) |
| Electricity | 425 (55.8%) | 178 (88.6%) |
| Fuel Oil or Kerosene | 0 (0.0%) | 0 (0.0%) |
| Coal or Coke | 0 (0.0%) | 0 (0.0%) |
| All other Fuels | 11 (1.5%) | 0 (0.0%) |
| No Fuel Used | 10 (1.3%) | 0 (0.0%) |
| Total | 761 (100.0%) | 201 (100.0%) |
Household Vehicle Usage in Hackberry
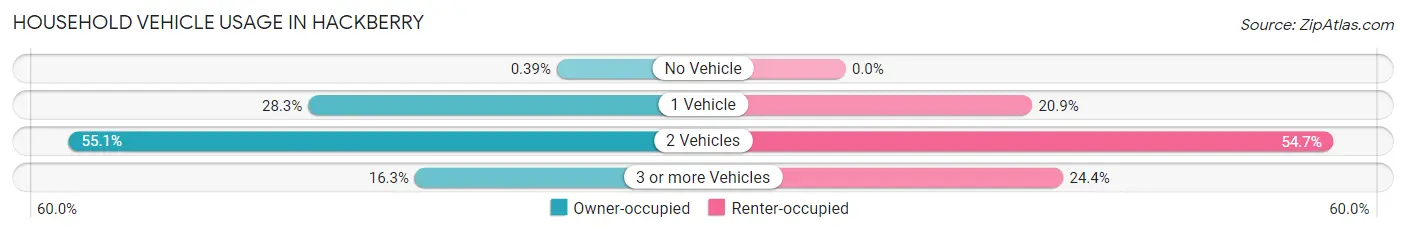
| Vehicles per Household | Owner-occupied | Renter-occupied |
| No Vehicle | 3 (0.4%) | 0 (0.0%) |
| 1 Vehicle | 215 (28.2%) | 42 (20.9%) |
| 2 Vehicles | 419 (55.1%) | 110 (54.7%) |
| 3 or more Vehicles | 124 (16.3%) | 49 (24.4%) |
| Total | 761 (100.0%) | 201 (100.0%) |
Real Estate & Mortgages in Hackberry
Real Estate and Mortgage Overview in Hackberry
| Characteristic | Without Mortgage | With Mortgage |
| Housing Units | 94 | 667 |
| Median Property Value | $275,000 | $348,400 |
| Median Household Income | $68,750 | $175 |
| Monthly Housing Costs | $686 | $56 |
| Real Estate Taxes | $4,333 | $12 |
Property Value by Mortgage Status in Hackberry
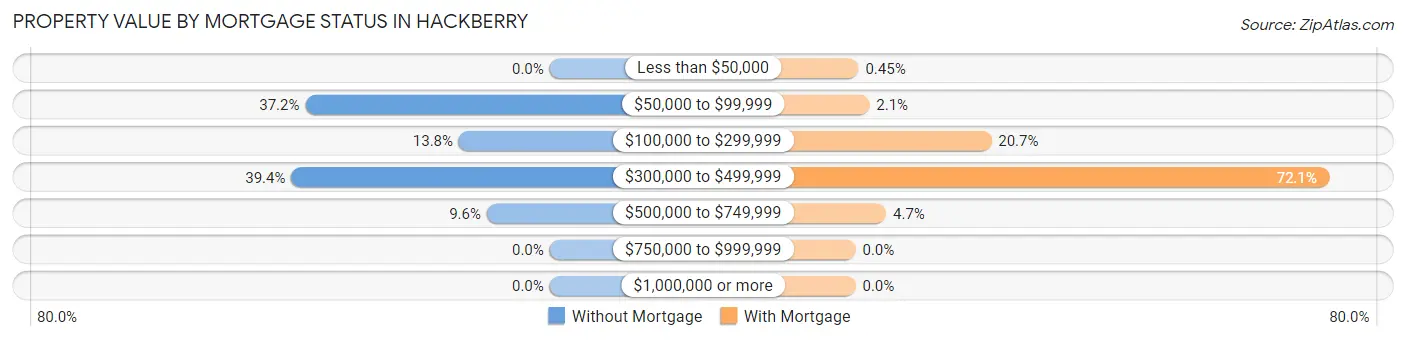
| Property Value | Without Mortgage | With Mortgage |
| Less than $50,000 | 0 (0.0%) | 3 (0.4%) |
| $50,000 to $99,999 | 35 (37.2%) | 14 (2.1%) |
| $100,000 to $299,999 | 13 (13.8%) | 138 (20.7%) |
| $300,000 to $499,999 | 37 (39.4%) | 481 (72.1%) |
| $500,000 to $749,999 | 9 (9.6%) | 31 (4.6%) |
| $750,000 to $999,999 | 0 (0.0%) | 0 (0.0%) |
| $1,000,000 or more | 0 (0.0%) | 0 (0.0%) |
| Total | 94 (100.0%) | 667 (100.0%) |
Household Income by Mortgage Status in Hackberry
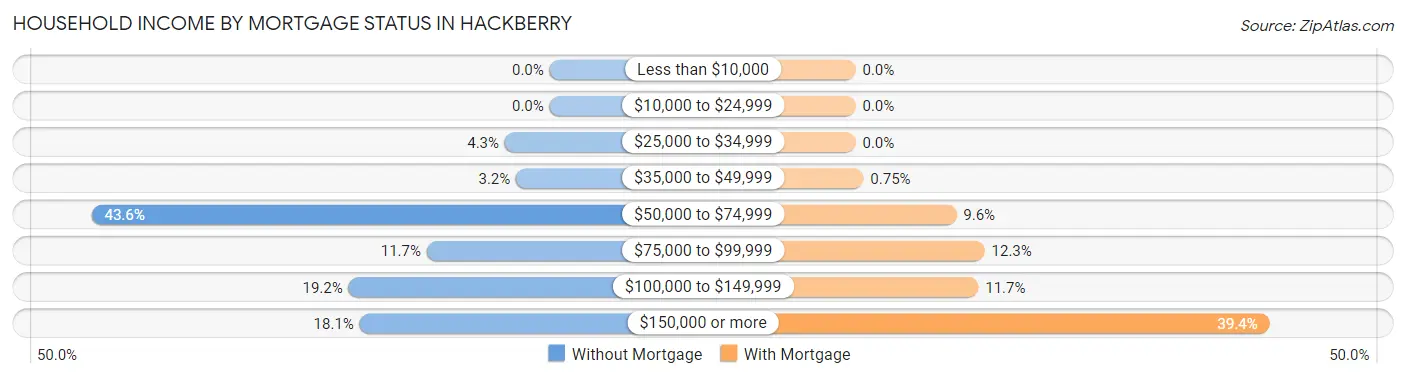
| Household Income | Without Mortgage | With Mortgage |
| Less than $10,000 | 0 (0.0%) | 0 (0.0%) |
| $10,000 to $24,999 | 0 (0.0%) | 0 (0.0%) |
| $25,000 to $34,999 | 4 (4.3%) | 0 (0.0%) |
| $35,000 to $49,999 | 3 (3.2%) | 5 (0.7%) |
| $50,000 to $74,999 | 41 (43.6%) | 64 (9.6%) |
| $75,000 to $99,999 | 11 (11.7%) | 82 (12.3%) |
| $100,000 to $149,999 | 18 (19.2%) | 78 (11.7%) |
| $150,000 or more | 17 (18.1%) | 263 (39.4%) |
| Total | 94 (100.0%) | 667 (100.0%) |
Property Value to Household Income Ratio in Hackberry
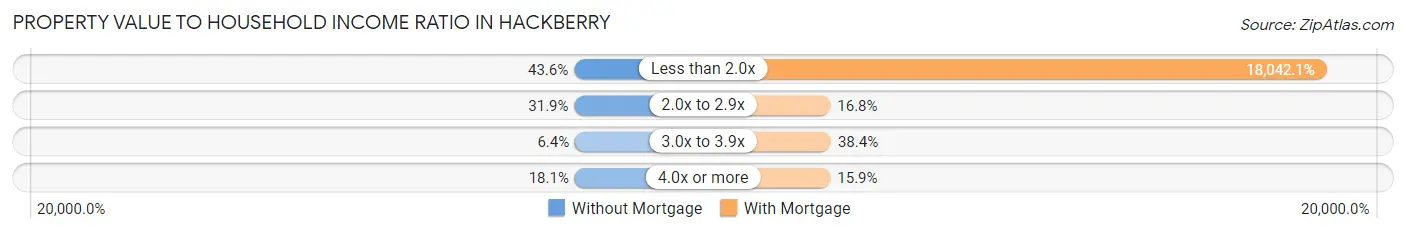
| Value-to-Income Ratio | Without Mortgage | With Mortgage |
| Less than 2.0x | 41 (43.6%) | 120,341 (18,042.1%) |
| 2.0x to 2.9x | 30 (31.9%) | 112 (16.8%) |
| 3.0x to 3.9x | 6 (6.4%) | 256 (38.4%) |
| 4.0x or more | 17 (18.1%) | 106 (15.9%) |
| Total | 94 (100.0%) | 667 (100.0%) |
Real Estate Taxes by Mortgage Status in Hackberry

| Property Taxes | Without Mortgage | With Mortgage |
| Less than $800 | 7 (7.4%) | 0 (0.0%) |
| $800 to $1,499 | 2 (2.1%) | 3 (0.4%) |
| $800 to $1,499 | 85 (90.4%) | 16 (2.4%) |
| Total | 94 (100.0%) | 667 (100.0%) |
Health & Disability in Hackberry
Health Insurance Coverage by Age in Hackberry
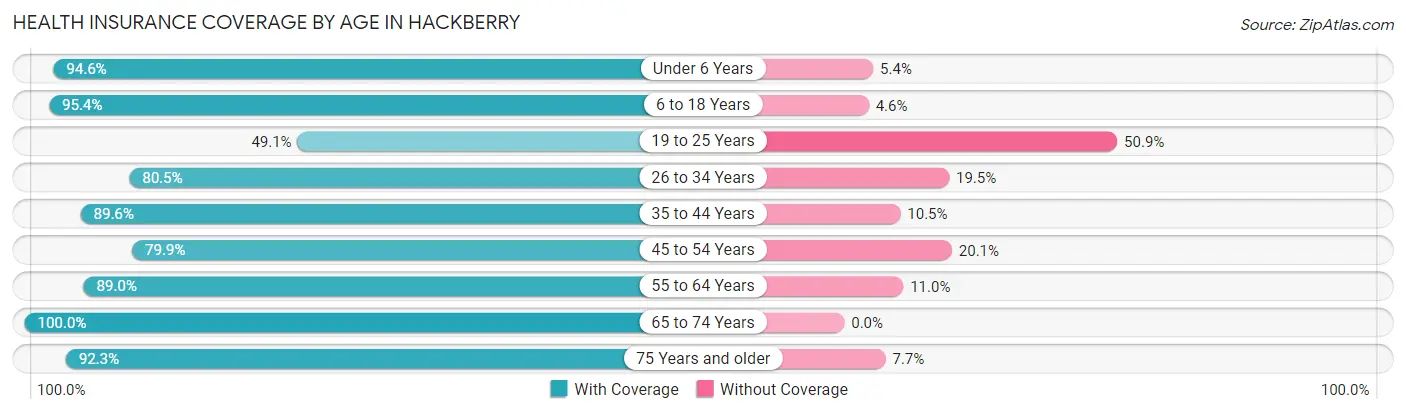
| Age Bracket | With Coverage | Without Coverage |
| Under 6 Years | 369 (94.6%) | 21 (5.4%) |
| 6 to 18 Years | 502 (95.4%) | 24 (4.6%) |
| 19 to 25 Years | 56 (49.1%) | 58 (50.9%) |
| 26 to 34 Years | 412 (80.5%) | 100 (19.5%) |
| 35 to 44 Years | 497 (89.5%) | 58 (10.4%) |
| 45 to 54 Years | 283 (79.9%) | 71 (20.1%) |
| 55 to 64 Years | 170 (89.0%) | 21 (11.0%) |
| 65 to 74 Years | 134 (100.0%) | 0 (0.0%) |
| 75 Years and older | 72 (92.3%) | 6 (7.7%) |
| Total | 2,495 (87.4%) | 359 (12.6%) |
Health Insurance Coverage by Citizenship Status in Hackberry
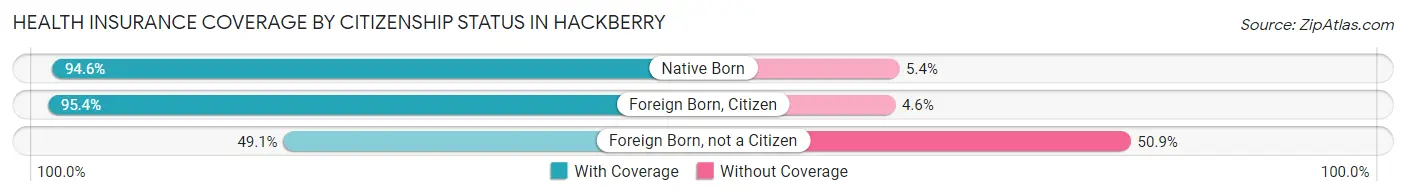
| Citizenship Status | With Coverage | Without Coverage |
| Native Born | 369 (94.6%) | 21 (5.4%) |
| Foreign Born, Citizen | 502 (95.4%) | 24 (4.6%) |
| Foreign Born, not a Citizen | 56 (49.1%) | 58 (50.9%) |
Health Insurance Coverage by Household Income in Hackberry
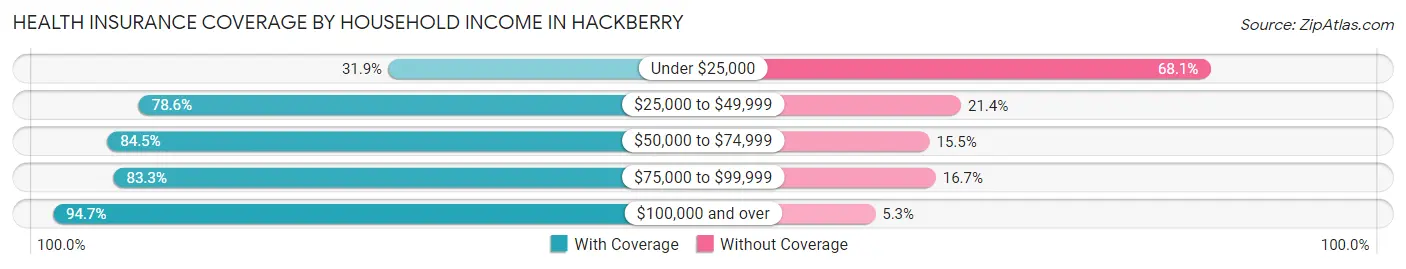
| Household Income | With Coverage | Without Coverage |
| Under $25,000 | 38 (31.9%) | 81 (68.1%) |
| $25,000 to $49,999 | 202 (78.6%) | 55 (21.4%) |
| $50,000 to $74,999 | 414 (84.5%) | 76 (15.5%) |
| $75,000 to $99,999 | 300 (83.3%) | 60 (16.7%) |
| $100,000 and over | 1,541 (94.7%) | 87 (5.3%) |
Public vs Private Health Insurance Coverage by Age in Hackberry
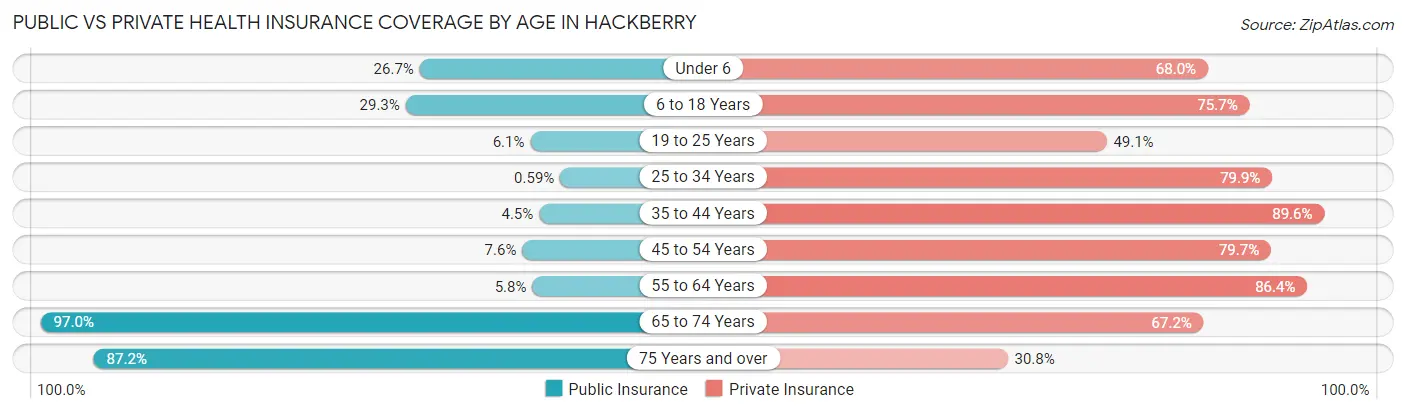
| Age Bracket | Public Insurance | Private Insurance |
| Under 6 | 104 (26.7%) | 265 (67.9%) |
| 6 to 18 Years | 154 (29.3%) | 398 (75.7%) |
| 19 to 25 Years | 7 (6.1%) | 56 (49.1%) |
| 25 to 34 Years | 3 (0.6%) | 409 (79.9%) |
| 35 to 44 Years | 25 (4.5%) | 497 (89.5%) |
| 45 to 54 Years | 27 (7.6%) | 282 (79.7%) |
| 55 to 64 Years | 11 (5.8%) | 165 (86.4%) |
| 65 to 74 Years | 130 (97.0%) | 90 (67.2%) |
| 75 Years and over | 68 (87.2%) | 24 (30.8%) |
| Total | 529 (18.5%) | 2,186 (76.6%) |
Disability Status by Sex by Age in Hackberry
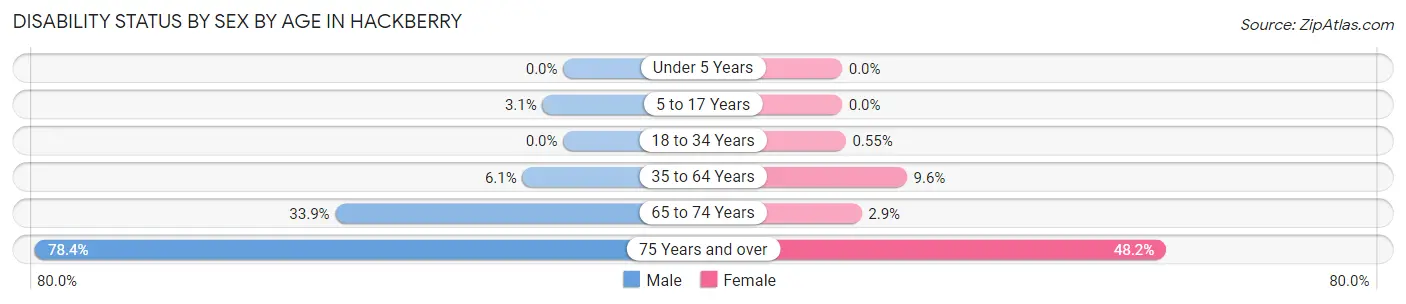
| Age Bracket | Male | Female |
| Under 5 Years | 0 (0.0%) | 0 (0.0%) |
| 5 to 17 Years | 10 (3.1%) | 0 (0.0%) |
| 18 to 34 Years | 0 (0.0%) | 2 (0.5%) |
| 35 to 64 Years | 32 (6.1%) | 55 (9.6%) |
| 65 to 74 Years | 22 (33.9%) | 2 (2.9%) |
| 75 Years and over | 40 (78.4%) | 13 (48.1%) |
Disability Class by Sex by Age in Hackberry
Disability Class: Hearing Difficulty
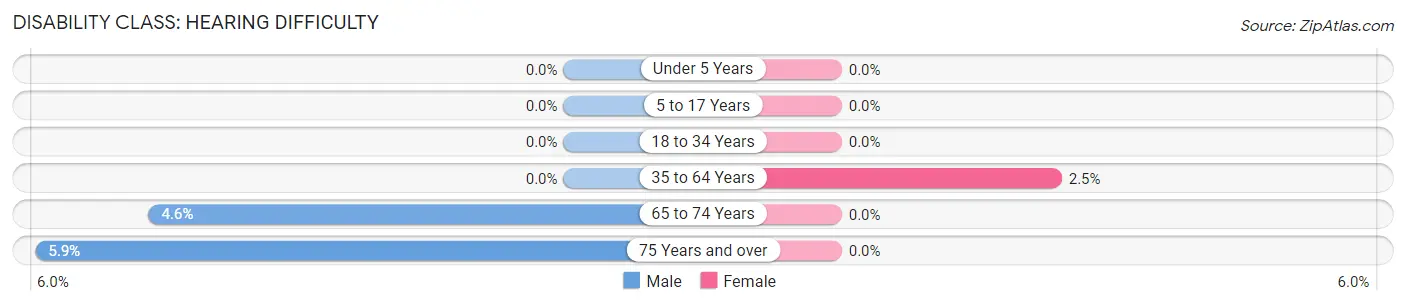
| Age Bracket | Male | Female |
| Under 5 Years | 0 (0.0%) | 0 (0.0%) |
| 5 to 17 Years | 0 (0.0%) | 0 (0.0%) |
| 18 to 34 Years | 0 (0.0%) | 0 (0.0%) |
| 35 to 64 Years | 0 (0.0%) | 14 (2.5%) |
| 65 to 74 Years | 3 (4.6%) | 0 (0.0%) |
| 75 Years and over | 3 (5.9%) | 0 (0.0%) |
Disability Class: Vision Difficulty
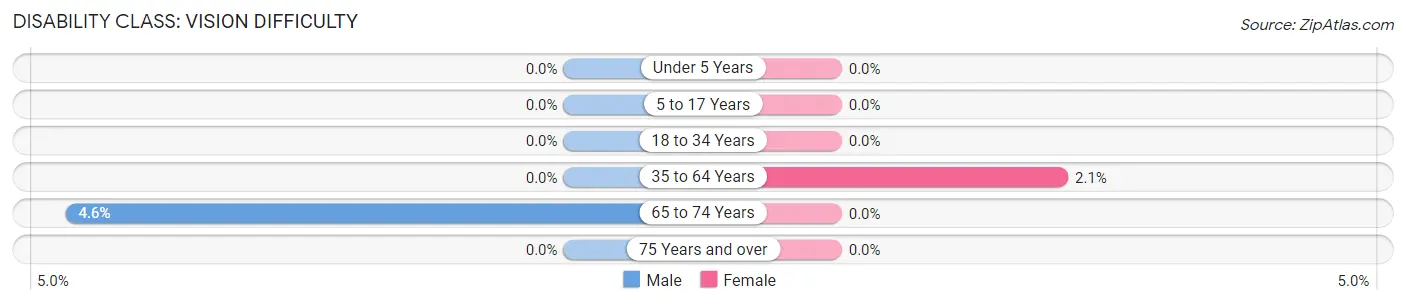
| Age Bracket | Male | Female |
| Under 5 Years | 0 (0.0%) | 0 (0.0%) |
| 5 to 17 Years | 0 (0.0%) | 0 (0.0%) |
| 18 to 34 Years | 0 (0.0%) | 0 (0.0%) |
| 35 to 64 Years | 0 (0.0%) | 12 (2.1%) |
| 65 to 74 Years | 3 (4.6%) | 0 (0.0%) |
| 75 Years and over | 0 (0.0%) | 0 (0.0%) |
Disability Class: Cognitive Difficulty
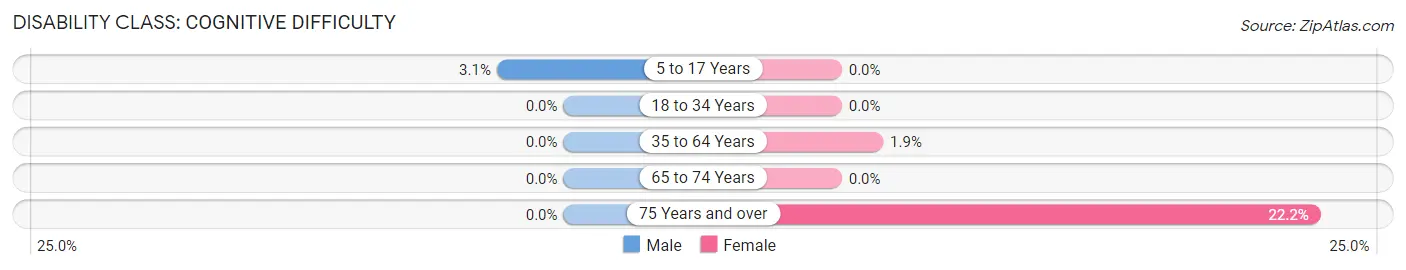
| Age Bracket | Male | Female |
| 5 to 17 Years | 10 (3.1%) | 0 (0.0%) |
| 18 to 34 Years | 0 (0.0%) | 0 (0.0%) |
| 35 to 64 Years | 0 (0.0%) | 11 (1.9%) |
| 65 to 74 Years | 0 (0.0%) | 0 (0.0%) |
| 75 Years and over | 0 (0.0%) | 6 (22.2%) |
Disability Class: Ambulatory Difficulty
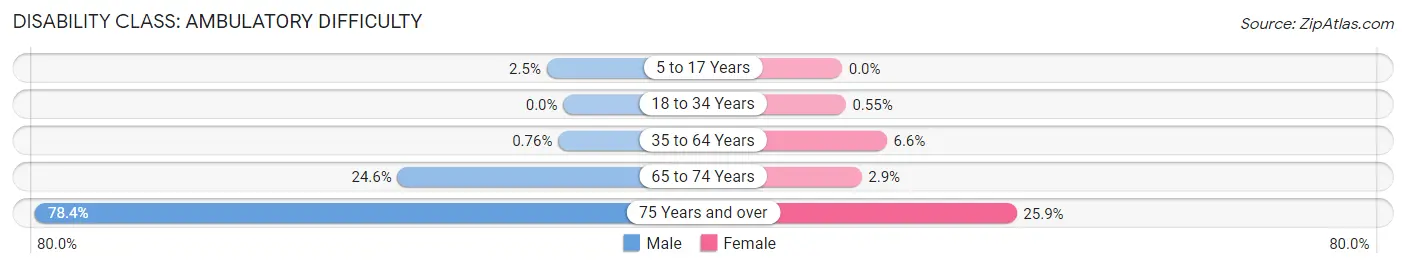
| Age Bracket | Male | Female |
| 5 to 17 Years | 8 (2.5%) | 0 (0.0%) |
| 18 to 34 Years | 0 (0.0%) | 2 (0.5%) |
| 35 to 64 Years | 4 (0.8%) | 38 (6.6%) |
| 65 to 74 Years | 16 (24.6%) | 2 (2.9%) |
| 75 Years and over | 40 (78.4%) | 7 (25.9%) |
Disability Class: Self-Care Difficulty
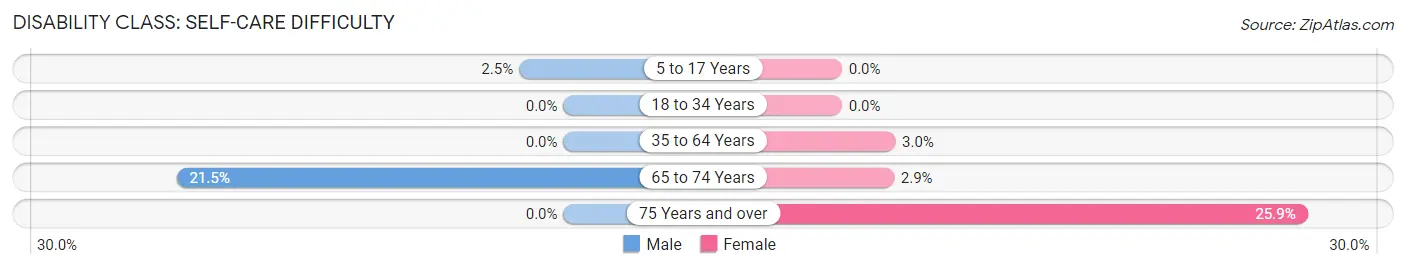
| Age Bracket | Male | Female |
| 5 to 17 Years | 8 (2.5%) | 0 (0.0%) |
| 18 to 34 Years | 0 (0.0%) | 0 (0.0%) |
| 35 to 64 Years | 0 (0.0%) | 17 (3.0%) |
| 65 to 74 Years | 14 (21.5%) | 2 (2.9%) |
| 75 Years and over | 0 (0.0%) | 7 (25.9%) |
Technology Access in Hackberry
Computing Device Access in Hackberry
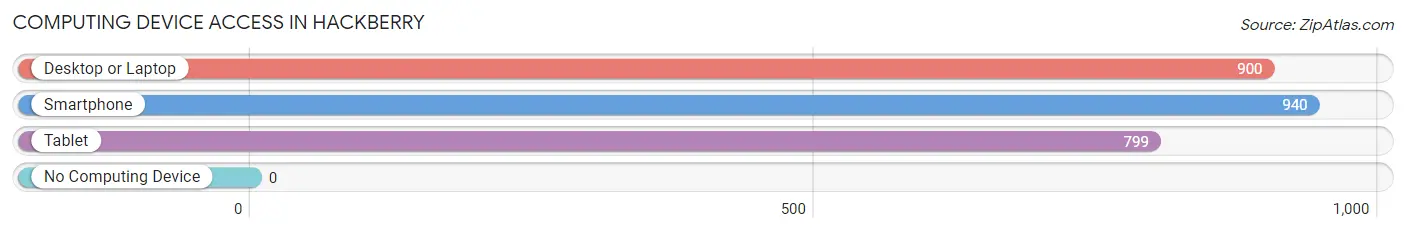
| Device Type | # Households | % Households |
| Desktop or Laptop | 900 | 93.6% |
| Smartphone | 940 | 97.7% |
| Tablet | 799 | 83.1% |
| No Computing Device | 0 | 0.0% |
| Total | 962 | 100.0% |
Internet Access in Hackberry
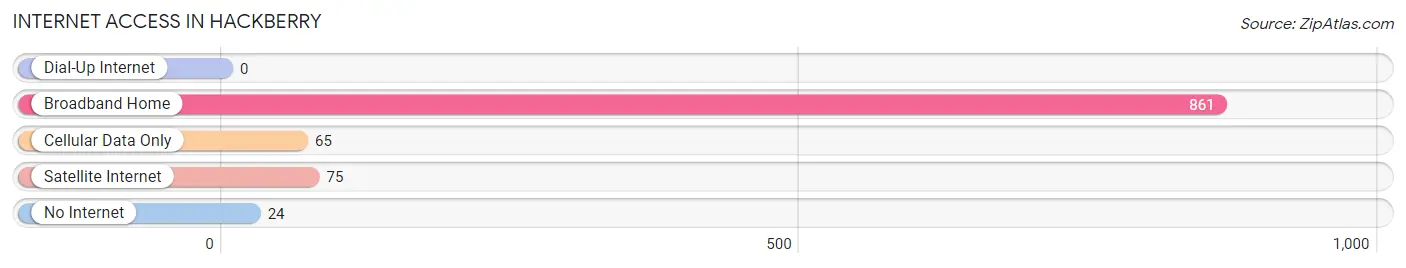
| Internet Type | # Households | % Households |
| Dial-Up Internet | 0 | 0.0% |
| Broadband Home | 861 | 89.5% |
| Cellular Data Only | 65 | 6.8% |
| Satellite Internet | 75 | 7.8% |
| No Internet | 24 | 2.5% |
| Total | 962 | 100.0% |
Hackberry Summary
History
The small town of Hackberry, Texas is located in the southeastern corner of Cameron County, near the Gulf of Mexico. It is a small, rural community with a population of just over 1,000 people. The town was founded in the late 1800s by a group of settlers from the nearby town of Brownsville. The settlers were looking for a place to settle and start a new life, and they found it in Hackberry.
The town was named after the hackberry tree, which is native to the area. The settlers used the wood from the trees to build their homes and other structures. The town grew slowly but steadily over the years, and by the early 1900s, it had become a thriving community.
The town was home to a variety of businesses, including a general store, a blacksmith shop, a cotton gin, and a post office. The town also had a school, a church, and a few other small businesses.
In the early 1900s, the town was also home to a large number of Mexican immigrants, who had come to the area to work in the cotton fields. The town was a melting pot of cultures, and the residents of Hackberry were known for their hospitality and friendliness.
The town continued to grow and prosper until the Great Depression hit in the 1930s. The town was hit hard by the economic downturn, and many of the businesses closed their doors. The population of the town declined, and the town was left in a state of disrepair.
In the 1950s, the town began to experience a resurgence. The economy began to improve, and the population began to grow again. The town was revitalized, and new businesses began to open. The town also began to attract tourists, who were drawn to the area’s natural beauty and its proximity to the Gulf of Mexico.
Today, Hackberry is a small, rural community with a population of just over 1,000 people. The town is still home to a variety of businesses, including a general store, a post office, and a few other small businesses. The town is also home to a few tourist attractions, including a museum and a nature preserve.
Geography
Hackberry is located in the southeastern corner of Cameron County, near the Gulf of Mexico. The town is situated on the banks of the Rio Grande River, which forms the border between the United States and Mexico. The town is surrounded by a variety of natural features, including wetlands, marshes, and woodlands.
The town is located in a humid subtropical climate zone, which means that it experiences hot, humid summers and mild winters. The average temperature in the summer is around 90 degrees Fahrenheit, and the average temperature in the winter is around 60 degrees Fahrenheit.
The town is located near a variety of natural attractions, including the Laguna Madre Nature Preserve, the Padre Island National Seashore, and the South Padre Island Birding and Nature Center. The town is also located near a variety of recreational activities, including fishing, boating, and bird watching.
Economy
The economy of Hackberry is largely based on tourism and agriculture. The town is home to a variety of tourist attractions, including a museum and a nature preserve. The town is also home to a variety of agricultural businesses, including cotton farms, cattle ranches, and vegetable farms.
The town is also home to a variety of small businesses, including a general store, a post office, and a few other small businesses. The town is also home to a few restaurants and bars.
Demographics
As of the 2010 census, the population of Hackberry was 1,072. The town is predominantly Hispanic, with a population that is 97.3% Hispanic. The median household income in the town is $25,000, and the median age is 33. The town has a poverty rate of 28.3%.
Conclusion
Hackberry, Texas is a small, rural community located in the southeastern corner of Cameron County, near the Gulf of Mexico. The town was founded in the late 1800s by a group of settlers from the nearby town of Brownsville. The town has a population of just over 1,000 people, and the economy is largely based on tourism and agriculture. The town is predominantly Hispanic, with a population that is 97.3% Hispanic. The town has a median household income of $25,000, and the median age is 33. The town has a poverty rate of 28.3%.
Common Questions
What is Per Capita Income in Hackberry?
Per Capita income in Hackberry is $42,105.
What is the Median Family Income in Hackberry?
Median Family Income in Hackberry is $116,875.
What is the Median Household income in Hackberry?
Median Household Income in Hackberry is $112,981.
What is Income or Wage Gap in Hackberry?
Income or Wage Gap in Hackberry is 14.8%.
Women in Hackberry earn 85.2 cents for every dollar earned by a man.
What is Inequality or Gini Index in Hackberry?
Inequality or Gini Index in Hackberry is 0.32.
What is the Total Population of Hackberry?
Total Population of Hackberry is 2,862.
What is the Total Male Population of Hackberry?
Total Male Population of Hackberry is 1,393.
What is the Total Female Population of Hackberry?
Total Female Population of Hackberry is 1,469.
What is the Ratio of Males per 100 Females in Hackberry?
There are 94.83 Males per 100 Females in Hackberry.
What is the Ratio of Females per 100 Males in Hackberry?
There are 105.46 Females per 100 Males in Hackberry.
What is the Median Population Age in Hackberry?
Median Population Age in Hackberry is 32.7 Years.
What is the Average Family Size in Hackberry
Average Family Size in Hackberry is 3.4 People.
What is the Average Household Size in Hackberry
Average Household Size in Hackberry is 3.0 People.
How Large is the Labor Force in Hackberry?
There are 1,574 People in the Labor Forcein in Hackberry.
What is the Percentage of People in the Labor Force in Hackberry?
78.6% of People are in the Labor Force in Hackberry.
What is the Unemployment Rate in Hackberry?
Unemployment Rate in Hackberry is 2.8%.