Aleut vs Puget Sound Salish Married-Couple Family Poverty
COMPARE
Aleut
Puget Sound Salish
Married-Couple Family Poverty
Married-Couple Family Poverty Comparison
Aleuts
Puget Sound Salish
4.7%
MARRIED-COUPLE FAMILY POVERTY
97.0/ 100
METRIC RATING
105th/ 347
METRIC RANK
4.9%
MARRIED-COUPLE FAMILY POVERTY
90.4/ 100
METRIC RATING
132nd/ 347
METRIC RANK
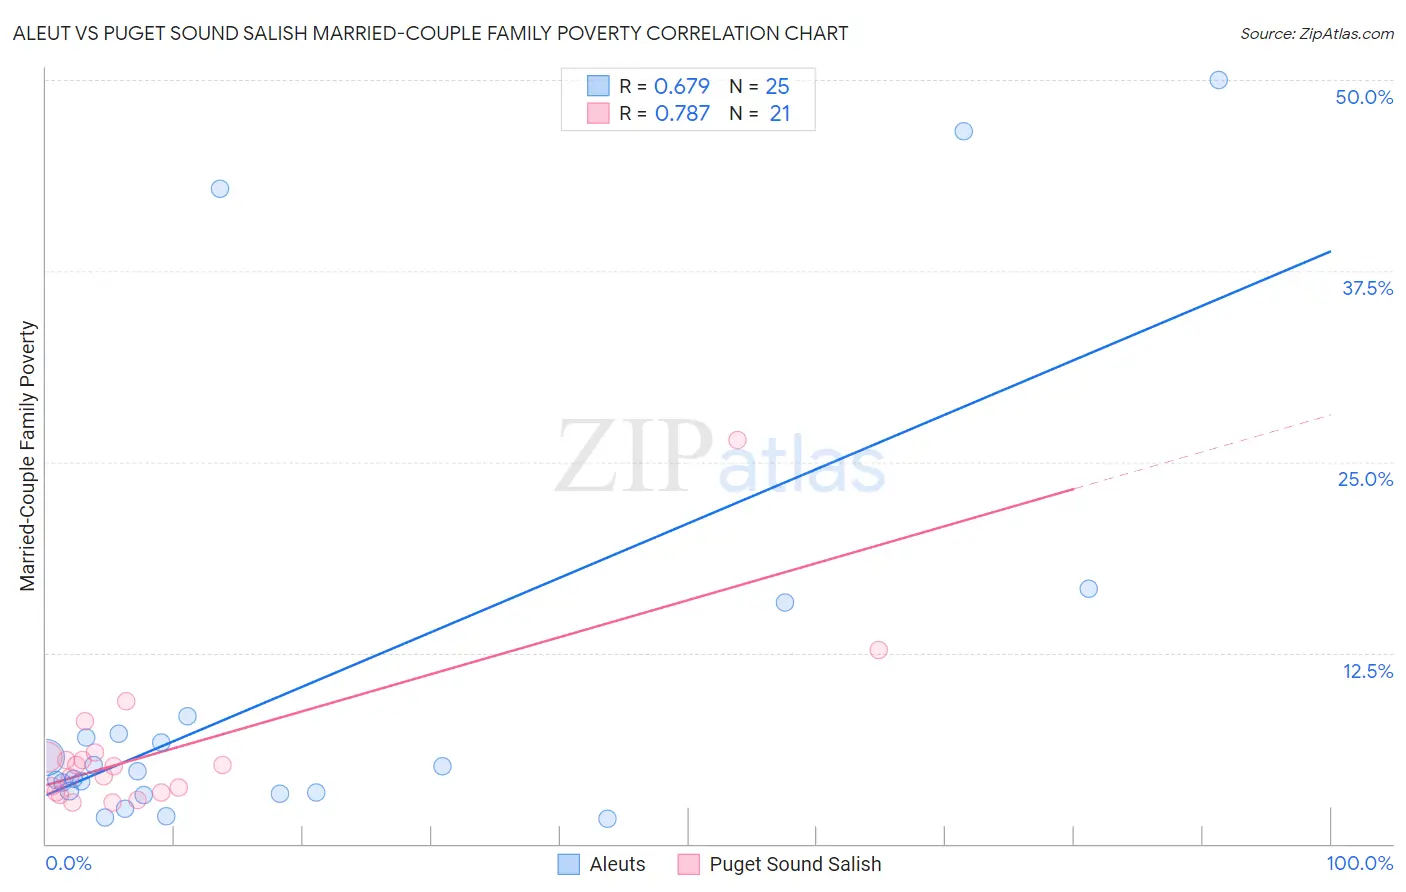
Aleut vs Puget Sound Salish Married-Couple Family Poverty Correlation Chart
The statistical analysis conducted on geographies consisting of 61,581,889 people shows a significant positive correlation between the proportion of Aleuts and poverty level among married-couple families in the United States with a correlation coefficient (R) of 0.679 and weighted average of 4.7%. Similarly, the statistical analysis conducted on geographies consisting of 46,044,429 people shows a strong positive correlation between the proportion of Puget Sound Salish and poverty level among married-couple families in the United States with a correlation coefficient (R) of 0.787 and weighted average of 4.9%, a difference of 4.0%.
Married-Couple Family Poverty Correlation Summary
| Measurement | Aleut | Puget Sound Salish |
| Minimum | 1.6% | 2.7% |
| Maximum | 50.0% | 26.4% |
| Range | 48.4% | 23.8% |
| Mean | 10.4% | 6.1% |
| Median | 4.8% | 5.1% |
| Interquartile 25% (IQ1) | 3.3% | 3.4% |
| Interquartile 75% (IQ3) | 7.8% | 5.8% |
| Interquartile Range (IQR) | 4.5% | 2.5% |
| Standard Deviation (Sample) | 14.1% | 5.2% |
| Standard Deviation (Population) | 13.9% | 5.1% |
Similar Demographics by Married-Couple Family Poverty
Demographics Similar to Aleuts by Married-Couple Family Poverty
In terms of married-couple family poverty, the demographic groups most similar to Aleuts are Immigrants from Moldova (4.7%, a difference of 0.070%), Immigrants from France (4.7%, a difference of 0.15%), Immigrants from Germany (4.7%, a difference of 0.16%), Immigrants from Romania (4.7%, a difference of 0.41%), and Laotian (4.7%, a difference of 0.43%).
| Demographics | Rating | Rank | Married-Couple Family Poverty |
| Native Hawaiians | 98.0 /100 | #98 | Exceptional 4.6% |
| Immigrants | Europe | 97.9 /100 | #99 | Exceptional 4.6% |
| Immigrants | Western Europe | 97.9 /100 | #100 | Exceptional 4.6% |
| Yugoslavians | 97.8 /100 | #101 | Exceptional 4.6% |
| Asians | 97.6 /100 | #102 | Exceptional 4.7% |
| Immigrants | Romania | 97.3 /100 | #103 | Exceptional 4.7% |
| Immigrants | Moldova | 97.1 /100 | #104 | Exceptional 4.7% |
| Aleuts | 97.0 /100 | #105 | Exceptional 4.7% |
| Immigrants | France | 96.9 /100 | #106 | Exceptional 4.7% |
| Immigrants | Germany | 96.8 /100 | #107 | Exceptional 4.7% |
| Laotians | 96.6 /100 | #108 | Exceptional 4.7% |
| Immigrants | Hong Kong | 96.4 /100 | #109 | Exceptional 4.7% |
| Immigrants | Bolivia | 96.2 /100 | #110 | Exceptional 4.7% |
| Pakistanis | 96.2 /100 | #111 | Exceptional 4.7% |
| Tongans | 95.9 /100 | #112 | Exceptional 4.7% |
Demographics Similar to Puget Sound Salish by Married-Couple Family Poverty
In terms of married-couple family poverty, the demographic groups most similar to Puget Sound Salish are Immigrants from Eastern Europe (4.9%, a difference of 0.010%), Immigrants from Kenya (4.9%, a difference of 0.070%), Soviet Union (4.9%, a difference of 0.080%), Samoan (4.9%, a difference of 0.080%), and Immigrants from Pakistan (4.9%, a difference of 0.090%).
| Demographics | Rating | Rank | Married-Couple Family Poverty |
| Immigrants | Bosnia and Herzegovina | 92.5 /100 | #125 | Exceptional 4.8% |
| Immigrants | Asia | 92.3 /100 | #126 | Exceptional 4.8% |
| Egyptians | 92.0 /100 | #127 | Exceptional 4.8% |
| Palestinians | 91.2 /100 | #128 | Exceptional 4.9% |
| Immigrants | Pakistan | 90.7 /100 | #129 | Exceptional 4.9% |
| Soviet Union | 90.7 /100 | #130 | Exceptional 4.9% |
| Immigrants | Eastern Europe | 90.5 /100 | #131 | Exceptional 4.9% |
| Puget Sound Salish | 90.4 /100 | #132 | Exceptional 4.9% |
| Immigrants | Kenya | 90.2 /100 | #133 | Exceptional 4.9% |
| Samoans | 90.2 /100 | #134 | Exceptional 4.9% |
| Assyrians/Chaldeans/Syriacs | 89.4 /100 | #135 | Excellent 4.9% |
| Immigrants | Hungary | 88.7 /100 | #136 | Excellent 4.9% |
| Guamanians/Chamorros | 86.5 /100 | #137 | Excellent 4.9% |
| Chileans | 86.0 /100 | #138 | Excellent 4.9% |
| German Russians | 85.1 /100 | #139 | Excellent 5.0% |