Aleut Self-Care Disability
COMPARE
Aleut
Select to Compare
Self-Care Disability
Aleut Self-Care Disability
2.8%
SELF-CARE DISABILITY
0.0/ 100
METRIC RATING
306th/ 347
METRIC RANK
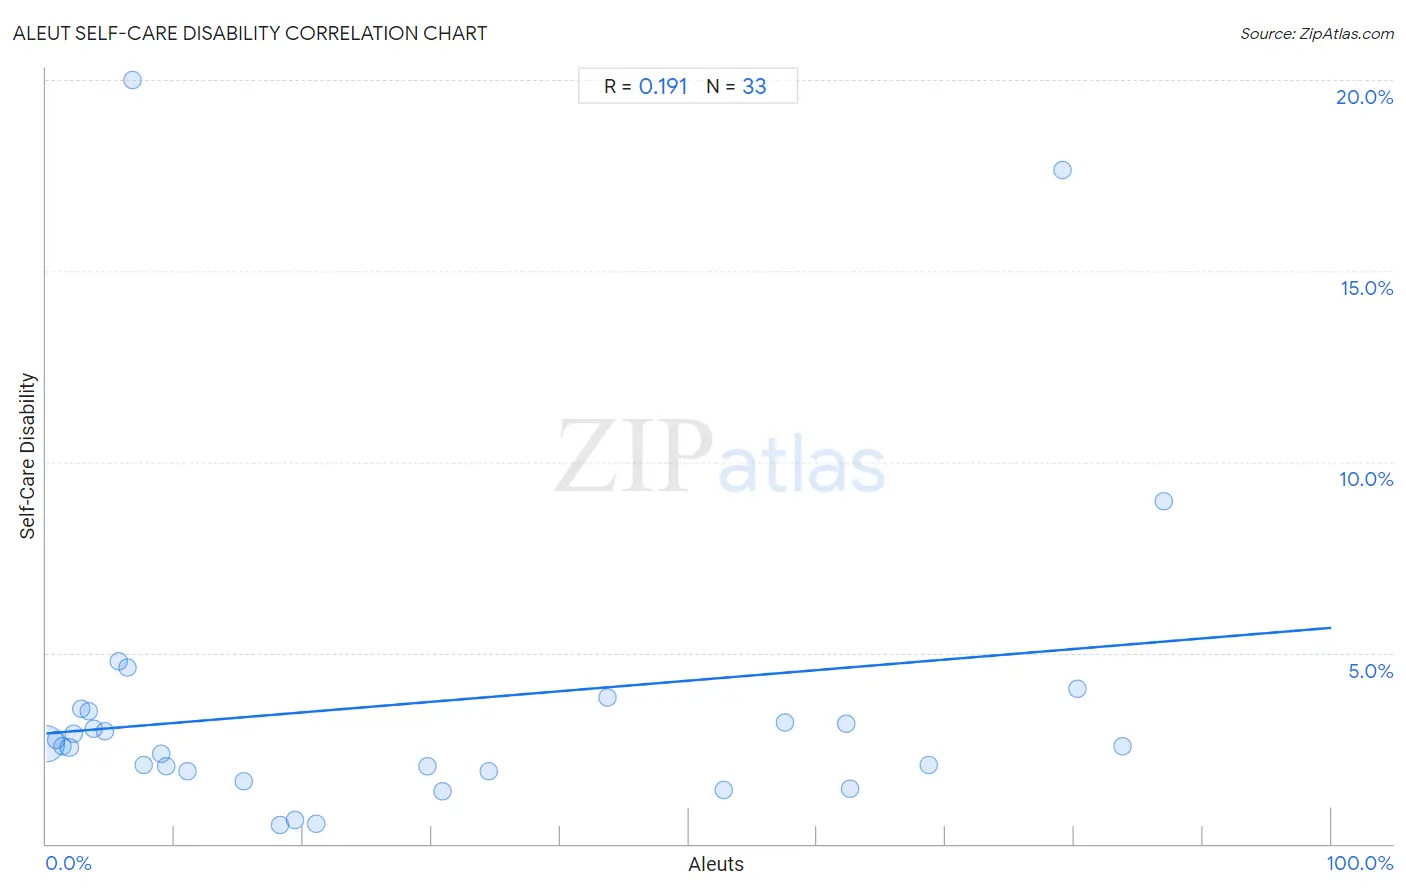
Aleut Self-Care Disability Correlation Chart
The statistical analysis conducted on geographies consisting of 61,744,406 people shows a poor positive correlation between the proportion of Aleuts and percentage of population with self-care disability in the United States with a correlation coefficient (R) of 0.191 and weighted average of 2.8%. On average, for every 1% (one percent) increase in Aleuts within a typical geography, there is an increase of 0.028% in percentage of population with self-care disability.
It is essential to understand that the correlation between the percentage of Aleuts and percentage of population with self-care disability does not imply a direct cause-and-effect relationship. It remains uncertain whether the presence of Aleuts influences an upward or downward trend in the level of percentage of population with self-care disability within an area, or if Aleuts simply ended up residing in those areas with higher or lower levels of percentage of population with self-care disability due to other factors.
Demographics Similar to Aleuts by Self-Care Disability
In terms of self-care disability, the demographic groups most similar to Aleuts are Native/Alaskan (2.8%, a difference of 0.070%), Immigrants from Grenada (2.8%, a difference of 0.37%), Immigrants from West Indies (2.8%, a difference of 0.40%), Cree (2.8%, a difference of 0.45%), and Bangladeshi (2.8%, a difference of 0.52%).
| Demographics | Rating | Rank | Self-Care Disability |
| Immigrants from Guyana | 0.0 /100 | #299 | Tragic 2.8% |
| Immigrants from Fiji | 0.0 /100 | #300 | Tragic 2.8% |
| Pima | 0.0 /100 | #301 | Tragic 2.8% |
| Immigrants from St. Vincent and the Grenadines | 0.0 /100 | #302 | Tragic 2.8% |
| Immigrants from Belize | 0.0 /100 | #303 | Tragic 2.8% |
| Cree | 0.0 /100 | #304 | Tragic 2.8% |
| Immigrants from West Indies | 0.0 /100 | #305 | Tragic 2.8% |
| Aleuts | 0.0 /100 | #306 | Tragic 2.8% |
| Natives/Alaskans | 0.0 /100 | #307 | Tragic 2.8% |
| Immigrants from Grenada | 0.0 /100 | #308 | Tragic 2.8% |
| Bangladeshis | 0.0 /100 | #309 | Tragic 2.8% |
| British West Indians | 0.0 /100 | #310 | Tragic 2.8% |
| Puget Sound Salish | 0.0 /100 | #311 | Tragic 2.8% |
| Immigrants from Caribbean | 0.0 /100 | #312 | Tragic 2.8% |
| Spanish Americans | 0.0 /100 | #313 | Tragic 2.8% |
Aleut Self-Care Disability Correlation Summary
| Measurement | Aleut Data | Self-Care Disability Data |
| Minimum | 0.022% | 0.50% |
| Maximum | 87.0% | 20.0% |
| Range | 86.9% | 19.5% |
| Mean | 27.9% | 3.7% |
| Median | 15.3% | 2.6% |
| Interquartile 25% (IQ1) | 4.1% | 1.9% |
| Interquartile 75% (IQ3) | 55.1% | 3.5% |
| Interquartile Range (IQR) | 50.9% | 1.6% |
| Standard Deviation (Sample) | 29.0% | 4.2% |
| Standard Deviation (Population) | 28.6% | 4.1% |
Correlation Details
| Aleut Percentile | Sample Size | Self-Care Disability |
[ 0.0% - 0.5% ] 0.022% | 60,511,936 | 2.6% |
[ 0.5% - 1.0% ] 0.74% | 351,198 | 2.7% |
[ 1.0% - 1.5% ] 1.22% | 188,758 | 2.6% |
[ 1.5% - 2.0% ] 1.80% | 471,697 | 2.5% |
[ 2.0% - 2.5% ] 2.12% | 88,796 | 2.9% |
[ 2.5% - 3.0% ] 2.72% | 46,791 | 3.5% |
[ 3.0% - 3.5% ] 3.27% | 13,165 | 3.5% |
[ 3.5% - 4.0% ] 3.68% | 19,419 | 3.0% |
[ 4.5% - 5.0% ] 4.59% | 12,620 | 3.0% |
[ 5.5% - 6.0% ] 5.66% | 2,879 | 4.8% |
[ 6.0% - 6.5% ] 6.33% | 964 | 4.6% |
[ 6.5% - 7.0% ] 6.67% | 90 | 20.0% |
[ 7.5% - 8.0% ] 7.61% | 10,351 | 2.1% |
[ 8.5% - 9.0% ] 8.98% | 401 | 2.3% |
[ 9.0% - 9.5% ] 9.38% | 12,618 | 2.0% |
[ 11.0% - 11.5% ] 11.00% | 209 | 1.9% |
[ 15.0% - 15.5% ] 15.32% | 496 | 1.6% |
[ 18.0% - 18.5% ] 18.19% | 3,617 | 0.50% |
[ 19.0% - 19.5% ] 19.32% | 383 | 0.61% |
[ 21.0% - 21.5% ] 21.05% | 836 | 0.51% |
[ 29.5% - 30.0% ] 29.65% | 452 | 2.0% |
[ 30.5% - 31.0% ] 30.80% | 237 | 1.4% |
[ 34.0% - 34.5% ] 34.47% | 235 | 1.9% |
[ 43.5% - 44.0% ] 43.69% | 2,344 | 3.8% |
[ 52.5% - 53.0% ] 52.71% | 2,216 | 1.4% |
[ 57.0% - 57.5% ] 57.45% | 94 | 3.2% |
[ 62.0% - 62.5% ] 62.24% | 98 | 3.2% |
[ 62.5% - 63.0% ] 62.58% | 310 | 1.4% |
[ 68.5% - 69.0% ] 68.70% | 115 | 2.1% |
[ 79.0% - 79.5% ] 79.08% | 698 | 17.6% |
[ 80.0% - 80.5% ] 80.23% | 172 | 4.1% |
[ 83.5% - 84.0% ] 83.80% | 142 | 2.6% |
[ 86.5% - 87.0% ] 86.96% | 69 | 9.0% |