Aleut Married-couple Households
COMPARE
Aleut
Select to Compare
Married-couple Households
Aleut Married-couple Households
45.6%
MARRIED-COUPLE HOUSEHOLDS
12.5/ 100
METRIC RATING
204th/ 347
METRIC RANK
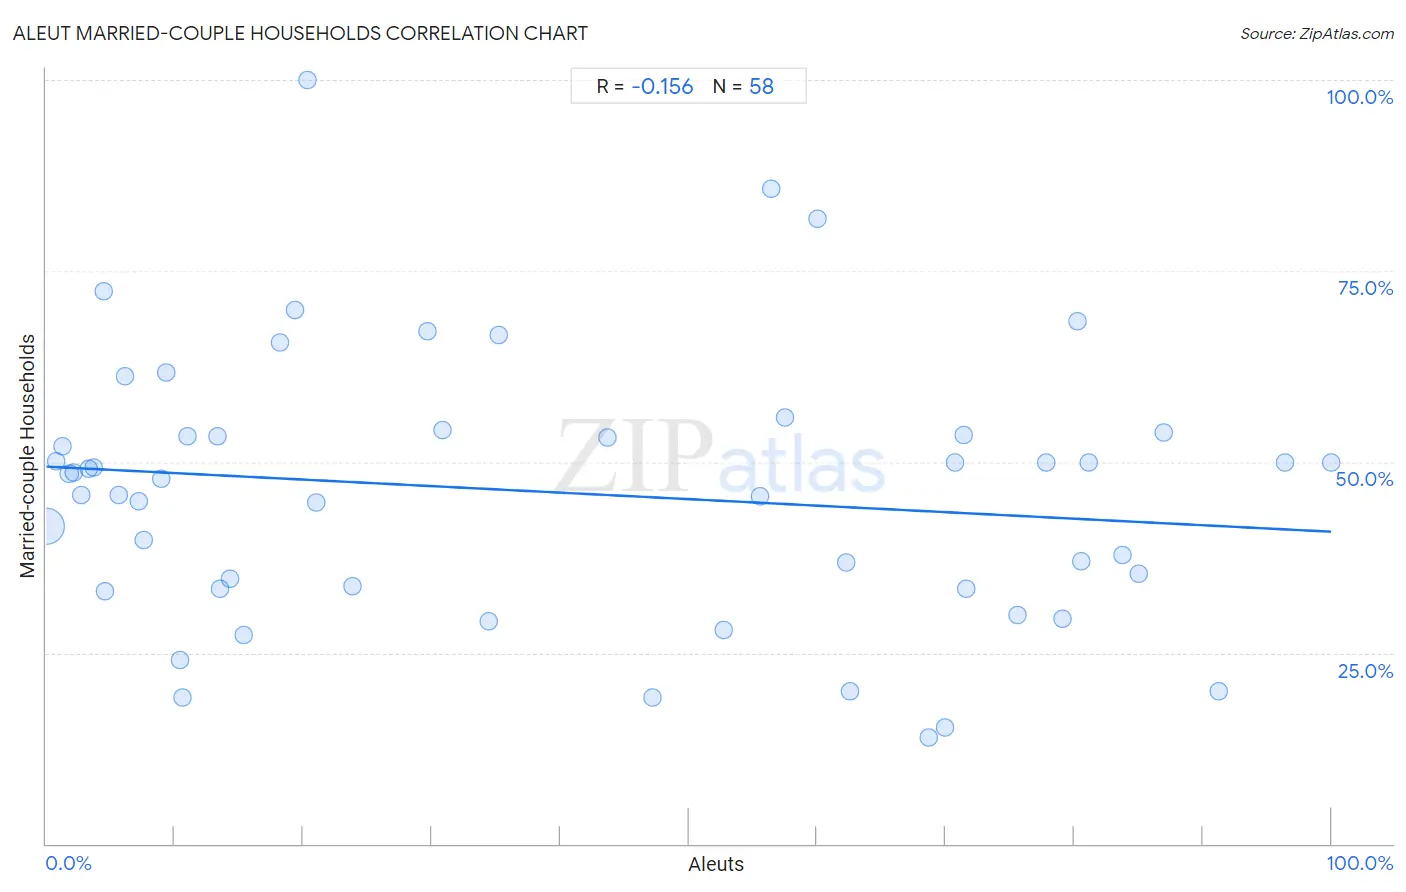
Aleut Married-couple Households Correlation Chart
The statistical analysis conducted on geographies consisting of 61,773,976 people shows a poor negative correlation between the proportion of Aleuts and percentage of married-couple family households in the United States with a correlation coefficient (R) of -0.156 and weighted average of 45.6%. On average, for every 1% (one percent) increase in Aleuts within a typical geography, there is a decrease of 0.085% in percentage of married-couple family households.
It is essential to understand that the correlation between the percentage of Aleuts and percentage of married-couple family households does not imply a direct cause-and-effect relationship. It remains uncertain whether the presence of Aleuts influences an upward or downward trend in the level of percentage of married-couple family households within an area, or if Aleuts simply ended up residing in those areas with higher or lower levels of percentage of married-couple family households due to other factors.
Demographics Similar to Aleuts by Married-couple Households
In terms of married-couple households, the demographic groups most similar to Aleuts are Alaska Native (45.6%, a difference of 0.050%), Nepalese (45.6%, a difference of 0.050%), Immigrants from Central America (45.7%, a difference of 0.14%), Uruguayan (45.5%, a difference of 0.20%), and Immigrants from Serbia (45.7%, a difference of 0.22%).
| Demographics | Rating | Rank | Married-couple Households |
| Cambodians | 21.3 /100 | #197 | Fair 45.9% |
| Ottawa | 19.4 /100 | #198 | Poor 45.8% |
| Carpatho Rusyns | 15.7 /100 | #199 | Poor 45.7% |
| Potawatomi | 15.6 /100 | #200 | Poor 45.7% |
| Immigrants from Serbia | 15.2 /100 | #201 | Poor 45.7% |
| Immigrants from Central America | 14.2 /100 | #202 | Poor 45.7% |
| Alaska Natives | 13.0 /100 | #203 | Poor 45.6% |
| Aleuts | 12.5 /100 | #204 | Poor 45.6% |
| Nepalese | 11.9 /100 | #205 | Poor 45.6% |
| Uruguayans | 10.4 /100 | #206 | Poor 45.5% |
| Immigrants from France | 8.8 /100 | #207 | Tragic 45.4% |
| Hispanics or Latinos | 8.7 /100 | #208 | Tragic 45.4% |
| Immigrants from Uzbekistan | 8.4 /100 | #209 | Tragic 45.4% |
| Cubans | 7.7 /100 | #210 | Tragic 45.4% |
| Immigrants from Spain | 7.3 /100 | #211 | Tragic 45.3% |
Aleut Married-couple Households Correlation Summary
| Measurement | Aleut Data | Married-couple Households Data |
| Minimum | 0.022% | 14.0% |
| Maximum | 100.0% | 100.0% |
| Range | 100.0% | 86.0% |
| Mean | 38.9% | 46.1% |
| Median | 30.2% | 48.2% |
| Interquartile 25% (IQ1) | 9.0% | 33.3% |
| Interquartile 75% (IQ3) | 70.7% | 53.6% |
| Interquartile Range (IQR) | 61.7% | 20.2% |
| Standard Deviation (Sample) | 32.3% | 17.7% |
| Standard Deviation (Population) | 32.1% | 17.5% |
Correlation Details
| Aleut Percentile | Sample Size | Married-couple Households |
[ 0.0% - 0.5% ] 0.022% | 60,514,895 | 41.6% |
[ 0.5% - 1.0% ] 0.74% | 356,244 | 50.1% |
[ 1.0% - 1.5% ] 1.22% | 191,674 | 52.1% |
[ 1.5% - 2.0% ] 1.80% | 473,489 | 48.5% |
[ 2.0% - 2.5% ] 2.12% | 89,226 | 48.7% |
[ 2.5% - 3.0% ] 2.72% | 48,906 | 45.7% |
[ 3.0% - 3.5% ] 3.27% | 15,547 | 49.1% |
[ 3.5% - 4.0% ] 3.68% | 19,419 | 49.3% |
[ 4.0% - 4.5% ] 4.43% | 361 | 72.3% |
[ 4.5% - 5.0% ] 4.59% | 15,235 | 33.0% |
[ 5.5% - 6.0% ] 5.66% | 2,879 | 45.6% |
[ 6.0% - 6.5% ] 6.17% | 3,580 | 61.2% |
[ 7.0% - 7.5% ] 7.17% | 963 | 44.9% |
[ 7.5% - 8.0% ] 7.61% | 10,351 | 39.7% |
[ 8.5% - 9.0% ] 8.98% | 401 | 47.9% |
[ 9.0% - 9.5% ] 9.38% | 12,618 | 61.8% |
[ 10.0% - 10.5% ] 10.43% | 1,822 | 24.1% |
[ 10.5% - 11.0% ] 10.62% | 226 | 19.1% |
[ 11.0% - 11.5% ] 11.00% | 209 | 53.3% |
[ 13.0% - 13.5% ] 13.29% | 143 | 53.3% |
[ 13.5% - 14.0% ] 13.51% | 37 | 33.3% |
[ 14.0% - 14.5% ] 14.35% | 230 | 34.7% |
[ 15.0% - 15.5% ] 15.32% | 496 | 27.3% |
[ 18.0% - 18.5% ] 18.16% | 4,680 | 65.7% |
[ 19.0% - 19.5% ] 19.32% | 383 | 69.8% |
[ 20.0% - 20.5% ] 20.33% | 123 | 100.0% |
[ 21.0% - 21.5% ] 21.05% | 836 | 44.7% |
[ 23.5% - 24.0% ] 23.87% | 243 | 33.6% |
[ 29.5% - 30.0% ] 29.65% | 452 | 67.1% |
[ 30.5% - 31.0% ] 30.80% | 237 | 54.1% |
[ 34.0% - 34.5% ] 34.47% | 235 | 29.1% |
[ 35.0% - 35.5% ] 35.19% | 108 | 66.7% |
[ 43.5% - 44.0% ] 43.69% | 2,344 | 53.2% |
[ 47.0% - 47.5% ] 47.17% | 106 | 19.2% |
[ 52.5% - 53.0% ] 52.71% | 2,216 | 27.9% |
[ 55.5% - 56.0% ] 55.56% | 54 | 45.5% |
[ 56.0% - 56.5% ] 56.41% | 78 | 85.7% |
[ 57.0% - 57.5% ] 57.45% | 94 | 55.9% |
[ 60.0% - 60.5% ] 60.00% | 60 | 81.8% |
[ 62.0% - 62.5% ] 62.24% | 98 | 36.8% |
[ 62.5% - 63.0% ] 62.58% | 310 | 20.0% |
[ 68.5% - 69.0% ] 68.70% | 115 | 14.0% |
[ 69.5% - 70.0% ] 69.90% | 206 | 15.2% |
[ 70.5% - 71.0% ] 70.69% | 58 | 50.0% |
[ 71.0% - 71.5% ] 71.43% | 126 | 53.6% |
[ 71.5% - 72.0% ] 71.58% | 95 | 33.3% |
[ 75.5% - 76.0% ] 75.56% | 90 | 30.0% |
[ 77.5% - 78.0% ] 77.78% | 9 | 50.0% |
[ 79.0% - 79.5% ] 79.08% | 698 | 29.5% |
[ 80.0% - 80.5% ] 80.23% | 172 | 68.4% |
[ 80.5% - 81.0% ] 80.56% | 144 | 37.0% |
[ 81.0% - 81.5% ] 81.18% | 170 | 50.0% |
[ 83.5% - 84.0% ] 83.80% | 142 | 37.8% |
[ 85.0% - 85.5% ] 85.00% | 80 | 35.3% |
[ 86.5% - 87.0% ] 86.96% | 69 | 53.8% |
[ 91.0% - 91.5% ] 91.23% | 114 | 20.0% |
[ 96.0% - 96.5% ] 96.43% | 56 | 50.0% |
[ 99.5% - 100.0% ] 100.00% | 24 | 50.0% |