Aleut Disability Age 5 to 17

COMPARE

Aleut
Race
Ancestry
AfghanAfricanAlaska NativeAlaskan AthabascanAlbanianAleutAlsatianAmericanApacheArabArapahoArgentineanArmenianAssyrian/Chaldean/SyriacAustralianAustrianBahamianBangladeshiBarbadianBasqueBelgianBelizeanBermudanBhutaneseBlackfeetBolivianBrazilianBritishBritish West IndianBulgarianBurmeseCajunCambodianCanadianCape VerdeanCarpatho RusynCelticCentral AmericanCentral American IndianCherokeeCheyenneChickasawChileanChineseChippewaChoctawColombianColvilleComancheCosta RicanCreeCreekCroatianCrowCubanCypriotCzechCzechoslovakianDanishDelawareDominicanDutchDutch West IndianEastern EuropeanEcuadorianEgyptianEnglishEstonianEthiopianEuropeanFijianFilipinoFinnishFrenchFrench American IndianFrench CanadianGermanGerman RussianGhanaianGreekGuamanian/ChamorroGuatemalanGuyaneseHaitianHmongHonduranHopiHoumaHungarianIcelanderIndian (Asian)IndonesianInupiatIranianIraqiIrishIroquoisIsraeliItalianJamaicanJapaneseJordanianKenyanKiowaKoreanLaotianLatvianLebaneseLiberianLithuanianLumbeeLuxembourgerMacedonianMalaysianMalteseMarshalleseMenomineeMexicanMexican American IndianMongolianMoroccanNative HawaiianNavajoNepaleseNew ZealanderNicaraguanNigerianNorthern EuropeanNorwegianOkinawanOsageOttawaPaiutePakistaniPalestinianPanamanianParaguayanPennsylvania GermanPeruvianPimaPolishPortuguesePotawatomiPuebloPuerto RicanPuget Sound SalishRomanianRussianSalvadoranSamoanScandinavianScotch-IrishScottishSeminoleSenegaleseSerbianShoshoneSierra LeoneanSiouxSlavicSlovakSloveneSomaliSouth AfricanSouth AmericanSouth American IndianSoviet UnionSpaniardSpanishSpanish AmericanSpanish American IndianSri LankanSubsaharan AfricanSudaneseSwedishSwissSyrianTaiwaneseThaiTlingit-HaidaTohono O'OdhamTonganTrinidadian and TobagonianTsimshianTurkishU.S. Virgin IslanderUgandanUkrainianUruguayanUteVenezuelanVietnameseWelshWest IndianYakamaYaquiYugoslavianYumanYup'ikZimbabwean
Immigration
NonimmigrantsImmigrantsAfghanistanAfricaAlbaniaArgentinaArmeniaAsiaAustraliaAustriaBahamasBangladeshBarbadosBelarusBelgiumBelizeBoliviaBosnia and HerzegovinaBrazilBulgariaBurma/MyanmarCabo VerdeCambodiaCameroonCanadaCaribbeanCentral AmericaChileChinaColombiaCongoCosta RicaCroatiaCubaCzechoslovakiaDenmarkDominicaDominican RepublicEastern AfricaEastern AsiaEastern EuropeEcuadorEgyptEl SalvadorEnglandEritreaEthiopiaEuropeFijiFranceGermanyGhanaGreeceGrenadaGuatemalaGuyanaHaitiHondurasHong KongHungaryIndiaIndonesiaIranIraqIrelandIsraelItalyJamaicaJapanJordanKazakhstanKenyaKoreaKuwaitLaosLatin AmericaLatviaLebanonLiberiaLithuaniaMalaysiaMexicoMicronesiaMiddle AfricaMoldovaMoroccoNepalNetherlandsNicaraguaNigeriaNorth AmericaNorth MacedoniaNorthern AfricaNorthern EuropeNorwayOceaniaPakistanPanamaPeruPhilippinesPolandPortugalRomaniaRussiaSaudi ArabiaScotlandSenegalSerbiaSierra LeoneSingaporeSomaliaSouth AfricaSouth AmericaSouth Central AsiaSouth Eastern AsiaSouthern EuropeSpainSri LankaSt. Vincent and the GrenadinesSudanSwedenSwitzerlandSyriaTaiwanThailandTrinidad and TobagoTurkeyUgandaUkraineUruguayUzbekistanVenezuelaVietnamWest IndiesWestern AfricaWestern AsiaWestern EuropeYemenZaireZimbabweAzores
Select to Compare
Race
Ancestry
AfghanAfricanAlaska NativeAlaskan AthabascanAlbanianAlsatianAmericanApacheArabArapahoArgentineanArmenianAssyrian/Chaldean/SyriacAustralianAustrianBahamianBangladeshiBarbadianBasqueBelgianBelizeanBermudanBhutaneseBlackfeetBolivianBrazilianBritishBritish West IndianBulgarianBurmeseCajunCambodianCanadianCape VerdeanCarpatho RusynCelticCentral AmericanCentral American IndianCherokeeCheyenneChickasawChileanChineseChippewaChoctawColombianColvilleComancheCosta RicanCreeCreekCroatianCrowCubanCypriotCzechCzechoslovakianDanishDelawareDominicanDutchDutch West IndianEastern EuropeanEcuadorianEgyptianEnglishEstonianEthiopianEuropeanFijianFilipinoFinnishFrenchFrench American IndianFrench CanadianGermanGerman RussianGhanaianGreekGuamanian/ChamorroGuatemalanGuyaneseHaitianHmongHonduranHopiHoumaHungarianIcelanderIndian (Asian)IndonesianInupiatIranianIraqiIrishIroquoisIsraeliItalianJamaicanJapaneseJordanianKenyanKiowaKoreanLaotianLatvianLebaneseLiberianLithuanianLumbeeLuxembourgerMacedonianMalaysianMalteseMarshalleseMenomineeMexicanMexican American IndianMongolianMoroccanNative HawaiianNavajoNepaleseNew ZealanderNicaraguanNigerianNorthern EuropeanNorwegianOkinawanOsageOttawaPaiutePakistaniPalestinianPanamanianParaguayanPennsylvania GermanPeruvianPimaPolishPortuguesePotawatomiPuebloPuerto RicanPuget Sound SalishRomanianRussianSalvadoranSamoanScandinavianScotch-IrishScottishSeminoleSenegaleseSerbianShoshoneSierra LeoneanSiouxSlavicSlovakSloveneSomaliSouth AfricanSouth AmericanSouth American IndianSoviet UnionSpaniardSpanishSpanish AmericanSpanish American IndianSri LankanSubsaharan AfricanSudaneseSwedishSwissSyrianTaiwaneseThaiTlingit-HaidaTohono O'OdhamTonganTrinidadian and TobagonianTsimshianTurkishU.S. Virgin IslanderUgandanUkrainianUruguayanUteVenezuelanVietnameseWelshWest IndianYakamaYaquiYugoslavianYumanYup'ikZimbabwean
Immigration
NonimmigrantsImmigrantsAfghanistanAfricaAlbaniaArgentinaArmeniaAsiaAustraliaAustriaBahamasBangladeshBarbadosBelarusBelgiumBelizeBoliviaBosnia and HerzegovinaBrazilBulgariaBurma/MyanmarCabo VerdeCambodiaCameroonCanadaCaribbeanCentral AmericaChileChinaColombiaCongoCosta RicaCroatiaCubaCzechoslovakiaDenmarkDominicaDominican RepublicEastern AfricaEastern AsiaEastern EuropeEcuadorEgyptEl SalvadorEnglandEritreaEthiopiaEuropeFijiFranceGermanyGhanaGreeceGrenadaGuatemalaGuyanaHaitiHondurasHong KongHungaryIndiaIndonesiaIranIraqIrelandIsraelItalyJamaicaJapanJordanKazakhstanKenyaKoreaKuwaitLaosLatin AmericaLatviaLebanonLiberiaLithuaniaMalaysiaMexicoMicronesiaMiddle AfricaMoldovaMoroccoNepalNetherlandsNicaraguaNigeriaNorth AmericaNorth MacedoniaNorthern AfricaNorthern EuropeNorwayOceaniaPakistanPanamaPeruPhilippinesPolandPortugalRomaniaRussiaSaudi ArabiaScotlandSenegalSerbiaSierra LeoneSingaporeSomaliaSouth AfricaSouth AmericaSouth Central AsiaSouth Eastern AsiaSouthern EuropeSpainSri LankaSt. Vincent and the GrenadinesSudanSwedenSwitzerlandSyriaTaiwanThailandTrinidad and TobagoTurkeyUgandaUkraineUruguayUzbekistanVenezuelaVietnamWest IndiesWestern AfricaWestern AsiaWestern EuropeYemenZaireZimbabweAzores
Disability Age 5 to 17
Income
Poverty
Unemployment
Labor Participation
Family Structure
Vehicle Availability
Education Level
Disability

Aleut Disability Age 5 to 17
Exceptional

5.3%
DISABILITY | AGE 5 TO 17
97.8/ 100
METRIC RATING
113th/ 347
METRIC RANK

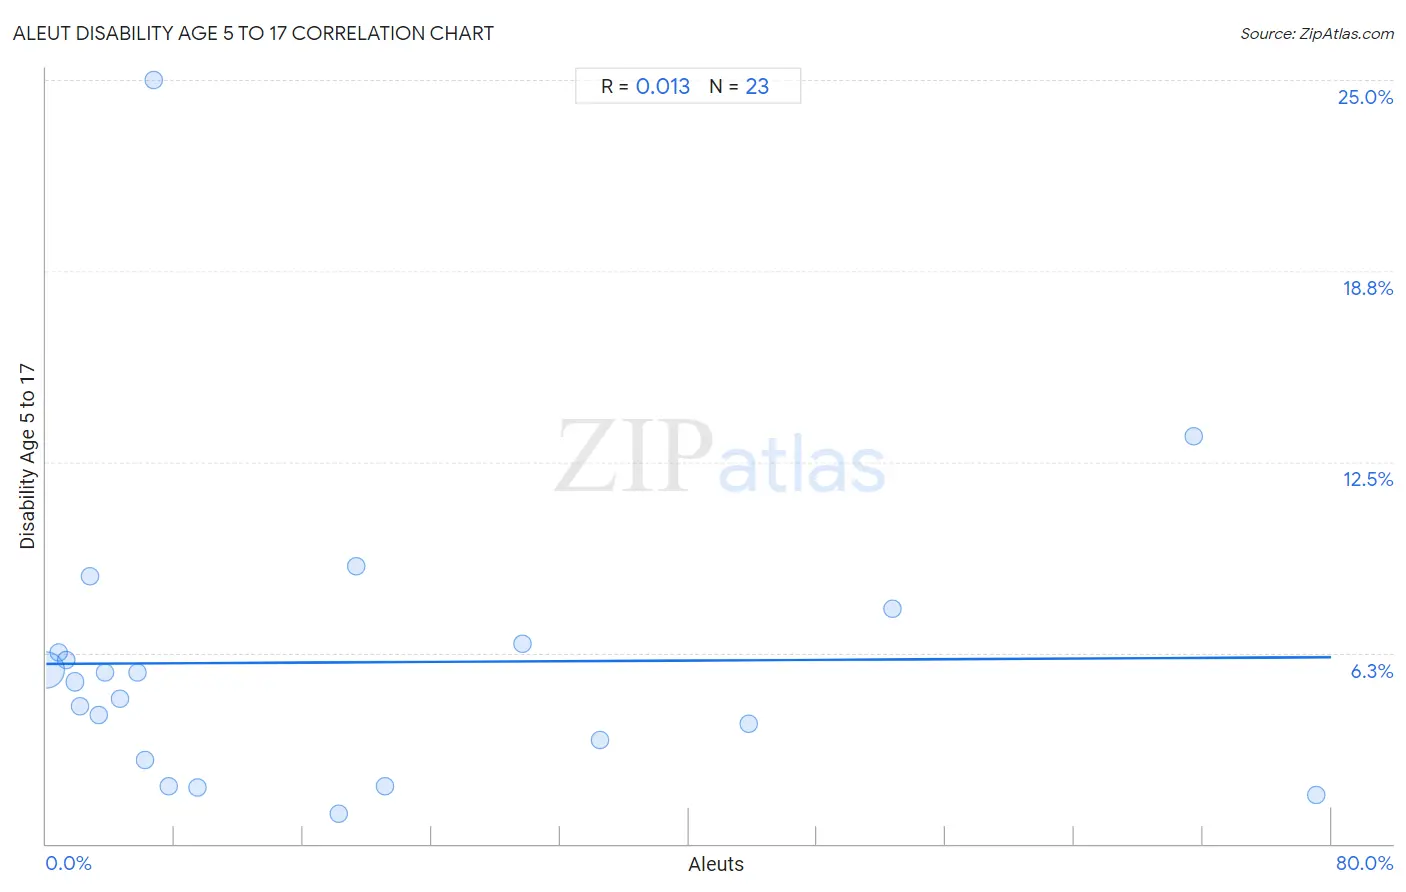
Aleut Disability Age 5 to 17 Correlation Chart

The statistical analysis conducted on geographies consisting of 61,654,039 people shows no correlation between the proportion of Aleuts and percentage of population with a disability between the ages 5 and 17 in the United States with a correlation coefficient (R) of 0.013 and weighted average of 5.3%. On average, for every 1% (one percent) increase in Aleuts within a typical geography, there is an increase of 0.0028% in percentage of population with a disability between the ages 5 and 17.
Aleut Disability Age 5 to 17
It is essential to understand that the correlation between the percentage of Aleuts and percentage of population with a disability between the ages 5 and 17 does not imply a direct cause-and-effect relationship. It remains uncertain whether the presence of Aleuts influences an upward or downward trend in the level of percentage of population with a disability between the ages 5 and 17 within an area, or if Aleuts simply ended up residing in those areas with higher or lower levels of percentage of population with a disability between the ages 5 and 17 due to other factors.

Demographics Similar to Aleuts by Disability Age 5 to 17

In terms of disability age 5 to 17, the demographic groups most similar to Aleuts are Immigrants from Northern Europe (5.3%, a difference of 0.020%), Immigrants from Latvia (5.3%, a difference of 0.040%), Cuban (5.3%, a difference of 0.040%), Ethiopian (5.3%, a difference of 0.060%), and Immigrants from Eritrea (5.3%, a difference of 0.10%).
DemographicsRating | RankDisability Age 5 to 17
Immigrants from Yemen
98.2
/100
|
#106
Exceptional
5.3%
Russians
98.2
/100
|
#107
Exceptional
5.3%
Immigrants from South Africa
98.1
/100
|
#108
Exceptional
5.3%
Immigrants from Northern Africa
98.1
/100
|
#109
Exceptional
5.3%
Immigrants from Eritrea
98.0
/100
|
#110
Exceptional
5.3%
Ethiopians
97.9
/100
|
#111
Exceptional
5.3%
Immigrants from Latvia
97.9
/100
|
#112
Exceptional
5.3%
Aleuts
97.8
/100
|
#113
Exceptional
5.3%
Immigrants from Northern Europe
97.8
/100
|
#114
Exceptional
5.3%
Cubans
97.8
/100
|
#115
Exceptional
5.3%
Cypriots
97.7
/100
|
#116
Exceptional
5.3%
Immigrants from Afghanistan
97.4
/100
|
#117
Exceptional
5.3%
South Americans
97.1
/100
|
#118
Exceptional
5.4%
Immigrants from South America
97.1
/100
|
#119
Exceptional
5.4%
Immigrants
97.0
/100
|
#120
Exceptional
5.4%

Aleut Disability Age 5 to 17 Correlation Summary

MeasurementAleut DataDisability Age 5 to 17 Data
Minimum0.022%0.99%
Maximum79.1%25.0%
Range79.1%24.0%
Mean18.5%5.9%
Median6.7%5.3%
Interquartile 25% (IQ1)2.7%2.7%
Interquartile 75% (IQ3)29.6%6.6%
Interquartile Range (IQR)26.9%3.8%
Standard Deviation (Sample)23.1%5.0%
Standard Deviation (Population)22.6%4.9%

Correlation Details

Aleut PercentileSample SizeDisability Age 5 to 17
[
0.0%
-
0.5%
]
0.022%
60,444,1615.7%
[
0.5%
-
1.0%
]
0.74%
342,3906.2%
[
1.0%
-
1.5%
]
1.23%
180,6616.0%
[
1.5%
-
2.0%
]
1.80%
471,0165.3%
[
2.0%
-
2.5%
]
2.12%
84,7824.5%
[
2.5%
-
3.0%
]
2.72%
45,3748.7%
[
3.0%
-
3.5%
]
3.29%
12,3244.2%
[
3.5%
-
4.0%
]
3.68%
19,0935.6%
[
4.5%
-
5.0%
]
4.59%
15,1274.8%
[
5.5%
-
6.0%
]
5.65%
2,7775.6%
[
6.0%
-
6.5%
]
6.12%
2,6162.7%
[
6.5%
-
7.0%
]
6.67%
9025.0%
[
7.5%
-
8.0%
]
7.61%
10,3511.9%
[
9.0%
-
9.5%
]
9.38%
12,6181.9%
[
18.0%
-
18.5%
]
18.19%
3,6170.99%
[
19.0%
-
19.5%
]
19.32%
3839.1%
[
21.0%
-
21.5%
]
21.05%
8361.9%
[
29.5%
-
30.0%
]
29.65%
4526.6%
[
34.0%
-
34.5%
]
34.47%
2353.4%
[
43.5%
-
44.0%
]
43.70%
2,0963.9%
[
52.5%
-
53.0%
]
52.71%
2,2167.7%
[
71.0%
-
71.5%
]
71.43%
12613.3%
[
79.0%
-
79.5%
]
79.08%
6981.6%