Aleut Wage/Income Gap

COMPARE

Aleut
Race
Ancestry
AfghanAfricanAlaska NativeAlaskan AthabascanAlbanianAleutAlsatianAmericanApacheArabArapahoArgentineanArmenianAssyrian/Chaldean/SyriacAustralianAustrianBahamianBangladeshiBarbadianBasqueBelgianBelizeanBermudanBhutaneseBlackfeetBolivianBrazilianBritishBritish West IndianBulgarianBurmeseCajunCambodianCanadianCape VerdeanCarpatho RusynCelticCentral AmericanCentral American IndianCherokeeCheyenneChickasawChileanChineseChippewaChoctawColombianColvilleComancheCosta RicanCreeCreekCroatianCrowCubanCypriotCzechCzechoslovakianDanishDelawareDominicanDutchDutch West IndianEastern EuropeanEcuadorianEgyptianEnglishEstonianEthiopianEuropeanFijianFilipinoFinnishFrenchFrench American IndianFrench CanadianGermanGerman RussianGhanaianGreekGuamanian/ChamorroGuatemalanGuyaneseHaitianHmongHonduranHopiHoumaHungarianIcelanderIndian (Asian)IndonesianInupiatIranianIraqiIrishIroquoisIsraeliItalianJamaicanJapaneseJordanianKenyanKiowaKoreanLaotianLatvianLebaneseLiberianLithuanianLumbeeLuxembourgerMacedonianMalaysianMalteseMarshalleseMenomineeMexicanMexican American IndianMongolianMoroccanNative HawaiianNavajoNepaleseNew ZealanderNicaraguanNigerianNorthern EuropeanNorwegianOkinawanOsageOttawaPaiutePakistaniPalestinianPanamanianParaguayanPennsylvania GermanPeruvianPimaPolishPortuguesePotawatomiPuebloPuerto RicanPuget Sound SalishRomanianRussianSalvadoranSamoanScandinavianScotch-IrishScottishSeminoleSenegaleseSerbianShoshoneSierra LeoneanSiouxSlavicSlovakSloveneSomaliSouth AfricanSouth AmericanSouth American IndianSoviet UnionSpaniardSpanishSpanish AmericanSpanish American IndianSri LankanSubsaharan AfricanSudaneseSwedishSwissSyrianTaiwaneseThaiTlingit-HaidaTohono O'OdhamTonganTrinidadian and TobagonianTsimshianTurkishU.S. Virgin IslanderUgandanUkrainianUruguayanUteVenezuelanVietnameseWelshWest IndianYakamaYaquiYugoslavianYumanYup'ikZimbabwean
Immigration
NonimmigrantsImmigrantsAfghanistanAfricaAlbaniaArgentinaArmeniaAsiaAustraliaAustriaBahamasBangladeshBarbadosBelarusBelgiumBelizeBoliviaBosnia and HerzegovinaBrazilBulgariaBurma/MyanmarCabo VerdeCambodiaCameroonCanadaCaribbeanCentral AmericaChileChinaColombiaCongoCosta RicaCroatiaCubaCzechoslovakiaDenmarkDominicaDominican RepublicEastern AfricaEastern AsiaEastern EuropeEcuadorEgyptEl SalvadorEnglandEritreaEthiopiaEuropeFijiFranceGermanyGhanaGreeceGrenadaGuatemalaGuyanaHaitiHondurasHong KongHungaryIndiaIndonesiaIranIraqIrelandIsraelItalyJamaicaJapanJordanKazakhstanKenyaKoreaKuwaitLaosLatin AmericaLatviaLebanonLiberiaLithuaniaMalaysiaMexicoMicronesiaMiddle AfricaMoldovaMoroccoNepalNetherlandsNicaraguaNigeriaNorth AmericaNorth MacedoniaNorthern AfricaNorthern EuropeNorwayOceaniaPakistanPanamaPeruPhilippinesPolandPortugalRomaniaRussiaSaudi ArabiaScotlandSenegalSerbiaSierra LeoneSingaporeSomaliaSouth AfricaSouth AmericaSouth Central AsiaSouth Eastern AsiaSouthern EuropeSpainSri LankaSt. Vincent and the GrenadinesSudanSwedenSwitzerlandSyriaTaiwanThailandTrinidad and TobagoTurkeyUgandaUkraineUruguayUzbekistanVenezuelaVietnamWest IndiesWestern AfricaWestern AsiaWestern EuropeYemenZaireZimbabweAzores
Select to Compare
Race
Ancestry
AfghanAfricanAlaska NativeAlaskan AthabascanAlbanianAlsatianAmericanApacheArabArapahoArgentineanArmenianAssyrian/Chaldean/SyriacAustralianAustrianBahamianBangladeshiBarbadianBasqueBelgianBelizeanBermudanBhutaneseBlackfeetBolivianBrazilianBritishBritish West IndianBulgarianBurmeseCajunCambodianCanadianCape VerdeanCarpatho RusynCelticCentral AmericanCentral American IndianCherokeeCheyenneChickasawChileanChineseChippewaChoctawColombianColvilleComancheCosta RicanCreeCreekCroatianCrowCubanCypriotCzechCzechoslovakianDanishDelawareDominicanDutchDutch West IndianEastern EuropeanEcuadorianEgyptianEnglishEstonianEthiopianEuropeanFijianFilipinoFinnishFrenchFrench American IndianFrench CanadianGermanGerman RussianGhanaianGreekGuamanian/ChamorroGuatemalanGuyaneseHaitianHmongHonduranHopiHoumaHungarianIcelanderIndian (Asian)IndonesianInupiatIranianIraqiIrishIroquoisIsraeliItalianJamaicanJapaneseJordanianKenyanKiowaKoreanLaotianLatvianLebaneseLiberianLithuanianLumbeeLuxembourgerMacedonianMalaysianMalteseMarshalleseMenomineeMexicanMexican American IndianMongolianMoroccanNative HawaiianNavajoNepaleseNew ZealanderNicaraguanNigerianNorthern EuropeanNorwegianOkinawanOsageOttawaPaiutePakistaniPalestinianPanamanianParaguayanPennsylvania GermanPeruvianPimaPolishPortuguesePotawatomiPuebloPuerto RicanPuget Sound SalishRomanianRussianSalvadoranSamoanScandinavianScotch-IrishScottishSeminoleSenegaleseSerbianShoshoneSierra LeoneanSiouxSlavicSlovakSloveneSomaliSouth AfricanSouth AmericanSouth American IndianSoviet UnionSpaniardSpanishSpanish AmericanSpanish American IndianSri LankanSubsaharan AfricanSudaneseSwedishSwissSyrianTaiwaneseThaiTlingit-HaidaTohono O'OdhamTonganTrinidadian and TobagonianTsimshianTurkishU.S. Virgin IslanderUgandanUkrainianUruguayanUteVenezuelanVietnameseWelshWest IndianYakamaYaquiYugoslavianYumanYup'ikZimbabwean
Immigration
NonimmigrantsImmigrantsAfghanistanAfricaAlbaniaArgentinaArmeniaAsiaAustraliaAustriaBahamasBangladeshBarbadosBelarusBelgiumBelizeBoliviaBosnia and HerzegovinaBrazilBulgariaBurma/MyanmarCabo VerdeCambodiaCameroonCanadaCaribbeanCentral AmericaChileChinaColombiaCongoCosta RicaCroatiaCubaCzechoslovakiaDenmarkDominicaDominican RepublicEastern AfricaEastern AsiaEastern EuropeEcuadorEgyptEl SalvadorEnglandEritreaEthiopiaEuropeFijiFranceGermanyGhanaGreeceGrenadaGuatemalaGuyanaHaitiHondurasHong KongHungaryIndiaIndonesiaIranIraqIrelandIsraelItalyJamaicaJapanJordanKazakhstanKenyaKoreaKuwaitLaosLatin AmericaLatviaLebanonLiberiaLithuaniaMalaysiaMexicoMicronesiaMiddle AfricaMoldovaMoroccoNepalNetherlandsNicaraguaNigeriaNorth AmericaNorth MacedoniaNorthern AfricaNorthern EuropeNorwayOceaniaPakistanPanamaPeruPhilippinesPolandPortugalRomaniaRussiaSaudi ArabiaScotlandSenegalSerbiaSierra LeoneSingaporeSomaliaSouth AfricaSouth AmericaSouth Central AsiaSouth Eastern AsiaSouthern EuropeSpainSri LankaSt. Vincent and the GrenadinesSudanSwedenSwitzerlandSyriaTaiwanThailandTrinidad and TobagoTurkeyUgandaUkraineUruguayUzbekistanVenezuelaVietnamWest IndiesWestern AfricaWestern AsiaWestern EuropeYemenZaireZimbabweAzores
Wage/Income Gap
Income
Poverty
Unemployment
Labor Participation
Family Structure
Vehicle Availability
Education Level
Disability

Aleut Wage/Income Gap
Exceptional

23.7%
WAGE/INCOME GAP
99.2/ 100
METRIC RATING
99th/ 347
METRIC RANK

Aleut Wage/Income Gap Correlation Chart

The statistical analysis conducted on geographies consisting of 61,745,679 people shows a moderate positive correlation between the proportion of Aleuts and wage/income gap percentage in the United States with a correlation coefficient (R) of 0.423 and weighted average of 23.7%. On average, for every 1% (one percent) increase in Aleuts within a typical geography, there is an increase of 0.28% in wage/income gap percentage.
Aleut Wage/Income Gap
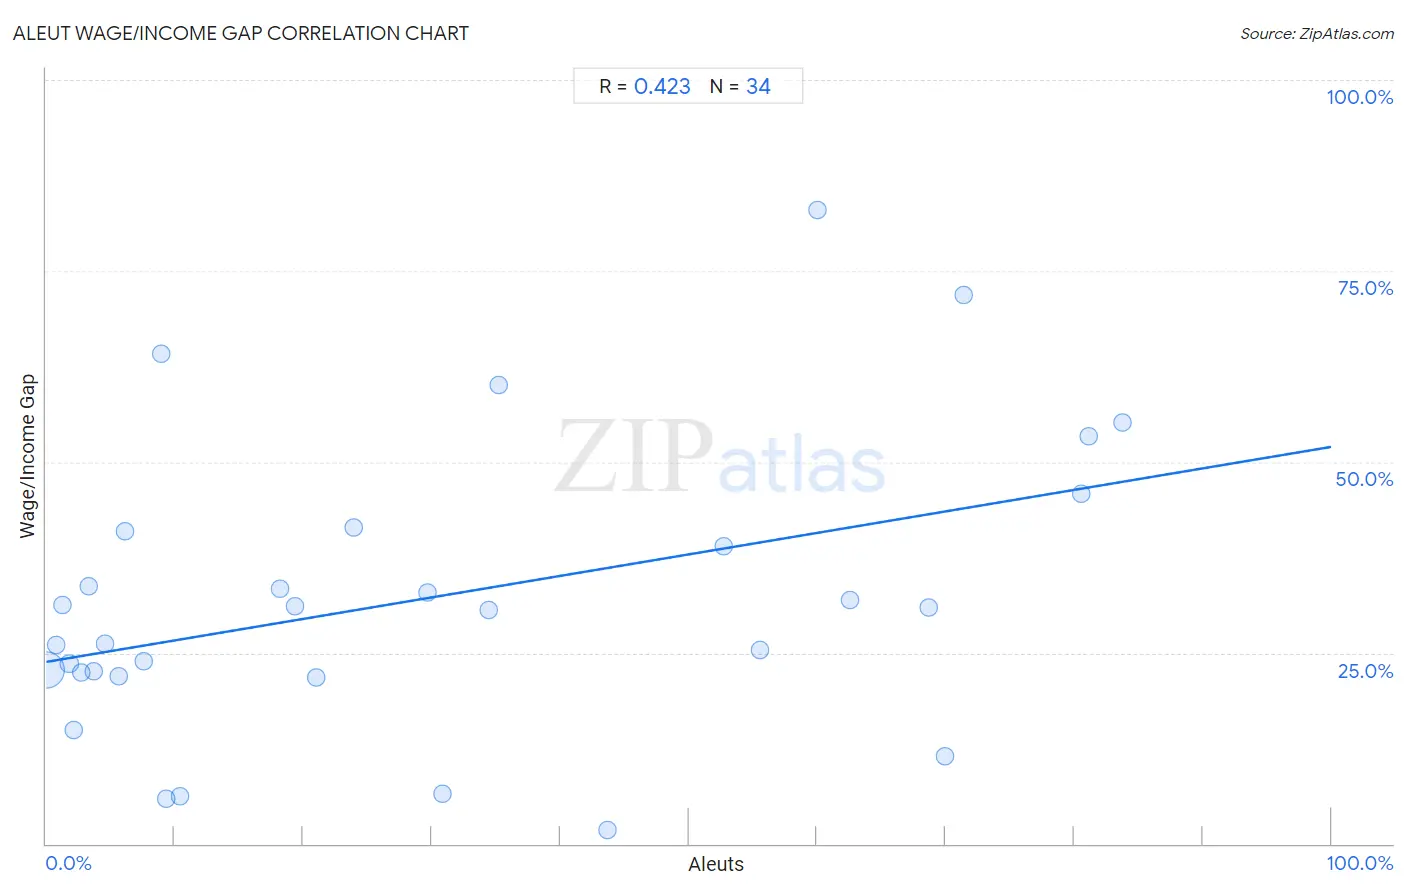
It is essential to understand that the correlation between the percentage of Aleuts and wage/income gap percentage does not imply a direct cause-and-effect relationship. It remains uncertain whether the presence of Aleuts influences an upward or downward trend in the level of wage/income gap percentage within an area, or if Aleuts simply ended up residing in those areas with higher or lower levels of wage/income gap percentage due to other factors.

Demographics Similar to Aleuts by Wage/Income Gap

In terms of wage/income gap, the demographic groups most similar to Aleuts are Yakama (23.7%, a difference of 0.020%), Immigrants from Latin America (23.7%, a difference of 0.070%), Japanese (23.8%, a difference of 0.17%), Immigrants from Laos (23.8%, a difference of 0.32%), and Immigrants from Sudan (23.6%, a difference of 0.47%).
DemographicsRating | RankWage/Income Gap
Immigrants from Honduras
99.5
/100
|
#92
Exceptional
23.5%
Immigrants from Cabo Verde
99.5
/100
|
#93
Exceptional
23.6%
Hondurans
99.5
/100
|
#94
Exceptional
23.6%
Cape Verdeans
99.4
/100
|
#95
Exceptional
23.6%
Kiowa
99.4
/100
|
#96
Exceptional
23.6%
Immigrants from Sudan
99.4
/100
|
#97
Exceptional
23.6%
Immigrants from Latin America
99.2
/100
|
#98
Exceptional
23.7%
Aleuts
99.2
/100
|
#99
Exceptional
23.7%
Yakama
99.2
/100
|
#100
Exceptional
23.7%
Japanese
99.1
/100
|
#101
Exceptional
23.8%
Immigrants from Laos
99.0
/100
|
#102
Exceptional
23.8%
Tsimshian
98.9
/100
|
#103
Exceptional
23.9%
Tlingit-Haida
98.7
/100
|
#104
Exceptional
24.0%
Moroccans
98.6
/100
|
#105
Exceptional
24.0%
Sudanese
98.6
/100
|
#106
Exceptional
24.0%

Aleut Wage/Income Gap Correlation Summary

MeasurementAleut DataWage/Income Gap Data
Minimum0.022%1.9%
Maximum83.8%83.0%
Range83.8%81.1%
Mean29.7%32.2%
Median20.2%30.8%
Interquartile 25% (IQ1)4.6%22.4%
Interquartile 75% (IQ3)55.6%41.0%
Interquartile Range (IQR)51.0%18.6%
Standard Deviation (Sample)28.3%18.9%
Standard Deviation (Population)27.9%18.6%

Correlation Details

Aleut PercentileSample SizeWage/Income Gap
[
0.0%
-
0.5%
]
0.022%
60,516,79522.7%
[
0.5%
-
1.0%
]
0.74%
351,53226.1%
[
1.0%
-
1.5%
]
1.22%
186,34031.3%
[
1.5%
-
2.0%
]
1.80%
470,94323.6%
[
2.0%
-
2.5%
]
2.12%
89,04515.0%
[
2.5%
-
3.0%
]
2.70%
39,71322.4%
[
3.0%
-
3.5%
]
3.26%
13,75833.8%
[
3.5%
-
4.0%
]
3.68%
19,09322.6%
[
4.5%
-
5.0%
]
4.59%
15,23526.1%
[
5.5%
-
6.0%
]
5.64%
1,54321.9%
[
6.0%
-
6.5%
]
6.17%
3,58041.0%
[
7.5%
-
8.0%
]
7.61%
10,35123.8%
[
8.5%
-
9.0%
]
8.98%
40164.1%
[
9.0%
-
9.5%
]
9.38%
12,6186.0%
[
10.0%
-
10.5%
]
10.43%
1,8226.1%
[
18.0%
-
18.5%
]
18.16%
4,68033.4%
[
19.0%
-
19.5%
]
19.32%
38331.1%
[
21.0%
-
21.5%
]
21.05%
83621.8%
[
23.5%
-
24.0%
]
23.91%
9241.4%
[
29.5%
-
30.0%
]
29.65%
45233.0%
[
30.5%
-
31.0%
]
30.80%
2376.5%
[
34.0%
-
34.5%
]
34.47%
23530.6%
[
35.0%
-
35.5%
]
35.19%
10860.0%
[
43.5%
-
44.0%
]
43.69%
2,3441.9%
[
52.5%
-
53.0%
]
52.71%
2,21638.9%
[
55.5%
-
56.0%
]
55.56%
5425.3%
[
60.0%
-
60.5%
]
60.00%
6083.0%
[
62.5%
-
63.0%
]
62.58%
31031.9%
[
68.5%
-
69.0%
]
68.70%
11531.0%
[
69.5%
-
70.0%
]
69.90%
20611.4%
[
71.0%
-
71.5%
]
71.43%
12671.9%
[
80.5%
-
81.0%
]
80.56%
14445.8%
[
81.0%
-
81.5%
]
81.18%
17053.3%
[
83.5%
-
84.0%
]
83.80%
14255.2%