Aleut vs Immigrants from Taiwan Married-Couple Family Poverty

COMPARE

Aleut
Race
Ancestry
AfghanAfricanAlaska NativeAlaskan AthabascanAlbanianAleutAlsatianAmericanApacheArabArapahoArgentineanArmenianAssyrian/Chaldean/SyriacAustralianAustrianBahamianBangladeshiBarbadianBasqueBelgianBelizeanBermudanBhutaneseBlackfeetBolivianBrazilianBritishBritish West IndianBulgarianBurmeseCajunCambodianCanadianCape VerdeanCarpatho RusynCelticCentral AmericanCentral American IndianCherokeeCheyenneChickasawChileanChineseChippewaChoctawColombianColvilleComancheCosta RicanCreeCreekCroatianCrowCubanCypriotCzechCzechoslovakianDanishDelawareDominicanDutchDutch West IndianEastern EuropeanEcuadorianEgyptianEnglishEstonianEthiopianEuropeanFijianFilipinoFinnishFrenchFrench American IndianFrench CanadianGermanGerman RussianGhanaianGreekGuamanian/ChamorroGuatemalanGuyaneseHaitianHmongHonduranHopiHoumaHungarianIcelanderIndian (Asian)IndonesianInupiatIranianIraqiIrishIroquoisIsraeliItalianJamaicanJapaneseJordanianKenyanKiowaKoreanLaotianLatvianLebaneseLiberianLithuanianLumbeeLuxembourgerMacedonianMalaysianMalteseMarshalleseMenomineeMexicanMexican American IndianMongolianMoroccanNative HawaiianNavajoNepaleseNew ZealanderNicaraguanNigerianNorthern EuropeanNorwegianOkinawanOsageOttawaPaiutePakistaniPalestinianPanamanianParaguayanPennsylvania GermanPeruvianPimaPolishPortuguesePotawatomiPuebloPuerto RicanPuget Sound SalishRomanianRussianSalvadoranSamoanScandinavianScotch-IrishScottishSeminoleSenegaleseSerbianShoshoneSierra LeoneanSiouxSlavicSlovakSloveneSomaliSouth AfricanSouth AmericanSouth American IndianSoviet UnionSpaniardSpanishSpanish AmericanSpanish American IndianSri LankanSubsaharan AfricanSudaneseSwedishSwissSyrianTaiwaneseThaiTlingit-HaidaTohono O'OdhamTonganTrinidadian and TobagonianTsimshianTurkishU.S. Virgin IslanderUgandanUkrainianUruguayanUteVenezuelanVietnameseWelshWest IndianYakamaYaquiYugoslavianYumanYup'ikZimbabwean
Immigration
NonimmigrantsImmigrantsAfghanistanAfricaAlbaniaArgentinaArmeniaAsiaAustraliaAustriaBahamasBangladeshBarbadosBelarusBelgiumBelizeBoliviaBosnia and HerzegovinaBrazilBulgariaBurma/MyanmarCabo VerdeCambodiaCameroonCanadaCaribbeanCentral AmericaChileChinaColombiaCongoCosta RicaCroatiaCubaCzechoslovakiaDenmarkDominicaDominican RepublicEastern AfricaEastern AsiaEastern EuropeEcuadorEgyptEl SalvadorEnglandEritreaEthiopiaEuropeFijiFranceGermanyGhanaGreeceGrenadaGuatemalaGuyanaHaitiHondurasHong KongHungaryIndiaIndonesiaIranIraqIrelandIsraelItalyJamaicaJapanJordanKazakhstanKenyaKoreaKuwaitLaosLatin AmericaLatviaLebanonLiberiaLithuaniaMalaysiaMexicoMicronesiaMiddle AfricaMoldovaMoroccoNepalNetherlandsNicaraguaNigeriaNorth AmericaNorth MacedoniaNorthern AfricaNorthern EuropeNorwayOceaniaPakistanPanamaPeruPhilippinesPolandPortugalRomaniaRussiaSaudi ArabiaScotlandSenegalSerbiaSierra LeoneSingaporeSomaliaSouth AfricaSouth AmericaSouth Central AsiaSouth Eastern AsiaSouthern EuropeSpainSri LankaSt. Vincent and the GrenadinesSudanSwedenSwitzerlandSyriaThailandTrinidad and TobagoTurkeyUgandaUkraineUruguayUzbekistanVenezuelaVietnamWest IndiesWestern AfricaWestern AsiaWestern EuropeYemenZaireZimbabweAzores
Immigrants from Taiwan
Race
Ancestry
AfghanAfricanAlaska NativeAlaskan AthabascanAlbanianAlsatianAmericanApacheArabArapahoArgentineanArmenianAssyrian/Chaldean/SyriacAustralianAustrianBahamianBangladeshiBarbadianBasqueBelgianBelizeanBermudanBhutaneseBlackfeetBolivianBrazilianBritishBritish West IndianBulgarianBurmeseCajunCambodianCanadianCape VerdeanCarpatho RusynCelticCentral AmericanCentral American IndianCherokeeCheyenneChickasawChileanChineseChippewaChoctawColombianColvilleComancheCosta RicanCreeCreekCroatianCrowCubanCypriotCzechCzechoslovakianDanishDelawareDominicanDutchDutch West IndianEastern EuropeanEcuadorianEgyptianEnglishEstonianEthiopianEuropeanFijianFilipinoFinnishFrenchFrench American IndianFrench CanadianGermanGerman RussianGhanaianGreekGuamanian/ChamorroGuatemalanGuyaneseHaitianHmongHonduranHopiHoumaHungarianIcelanderIndian (Asian)IndonesianInupiatIranianIraqiIrishIroquoisIsraeliItalianJamaicanJapaneseJordanianKenyanKiowaKoreanLaotianLatvianLebaneseLiberianLithuanianLumbeeLuxembourgerMacedonianMalaysianMalteseMarshalleseMenomineeMexicanMexican American IndianMongolianMoroccanNative HawaiianNavajoNepaleseNew ZealanderNicaraguanNigerianNorthern EuropeanNorwegianOkinawanOsageOttawaPaiutePakistaniPalestinianPanamanianParaguayanPennsylvania GermanPeruvianPimaPolishPortuguesePotawatomiPuebloPuerto RicanPuget Sound SalishRomanianRussianSalvadoranSamoanScandinavianScotch-IrishScottishSeminoleSenegaleseSerbianShoshoneSierra LeoneanSiouxSlavicSlovakSloveneSomaliSouth AfricanSouth AmericanSouth American IndianSoviet UnionSpaniardSpanishSpanish AmericanSpanish American IndianSri LankanSubsaharan AfricanSudaneseSwedishSwissSyrianTaiwaneseThaiTlingit-HaidaTohono O'OdhamTonganTrinidadian and TobagonianTsimshianTurkishU.S. Virgin IslanderUgandanUkrainianUruguayanUteVenezuelanVietnameseWelshWest IndianYakamaYaquiYugoslavianYumanYup'ikZimbabwean
Immigration
NonimmigrantsImmigrantsAfghanistanAfricaAlbaniaArgentinaArmeniaAsiaAustraliaAustriaBahamasBangladeshBarbadosBelarusBelgiumBelizeBoliviaBosnia and HerzegovinaBrazilBulgariaBurma/MyanmarCabo VerdeCambodiaCameroonCanadaCaribbeanCentral AmericaChileChinaColombiaCongoCosta RicaCroatiaCubaCzechoslovakiaDenmarkDominicaDominican RepublicEastern AfricaEastern AsiaEastern EuropeEcuadorEgyptEl SalvadorEnglandEritreaEthiopiaEuropeFijiFranceGermanyGhanaGreeceGrenadaGuatemalaGuyanaHaitiHondurasHong KongHungaryIndiaIndonesiaIranIraqIrelandIsraelItalyJamaicaJapanJordanKazakhstanKenyaKoreaKuwaitLaosLatin AmericaLatviaLebanonLiberiaLithuaniaMalaysiaMexicoMicronesiaMiddle AfricaMoldovaMoroccoNepalNetherlandsNicaraguaNigeriaNorth AmericaNorth MacedoniaNorthern AfricaNorthern EuropeNorwayOceaniaPakistanPanamaPeruPhilippinesPolandPortugalRomaniaRussiaSaudi ArabiaScotlandSenegalSerbiaSierra LeoneSingaporeSomaliaSouth AfricaSouth AmericaSouth Central AsiaSouth Eastern AsiaSouthern EuropeSpainSri LankaSt. Vincent and the GrenadinesSudanSwedenSwitzerlandSyriaTaiwanThailandTrinidad and TobagoTurkeyUgandaUkraineUruguayUzbekistanVenezuelaVietnamWest IndiesWestern AfricaWestern AsiaWestern EuropeYemenZaireZimbabweAzores
Married-Couple Family Poverty
Income
Poverty
Unemployment
Labor Participation
Family Structure
Vehicle Availability
Education Level
Disability

Married-Couple Family Poverty Comparison

Aleuts

Immigrants from Taiwan

Exceptional
Exceptional
4.7%
MARRIED-COUPLE FAMILY POVERTY
97.0/ 100
METRIC RATING
105th/ 347
METRIC RANK
4.1%
MARRIED-COUPLE FAMILY POVERTY
99.9/ 100
METRIC RATING
25th/ 347
METRIC RANK

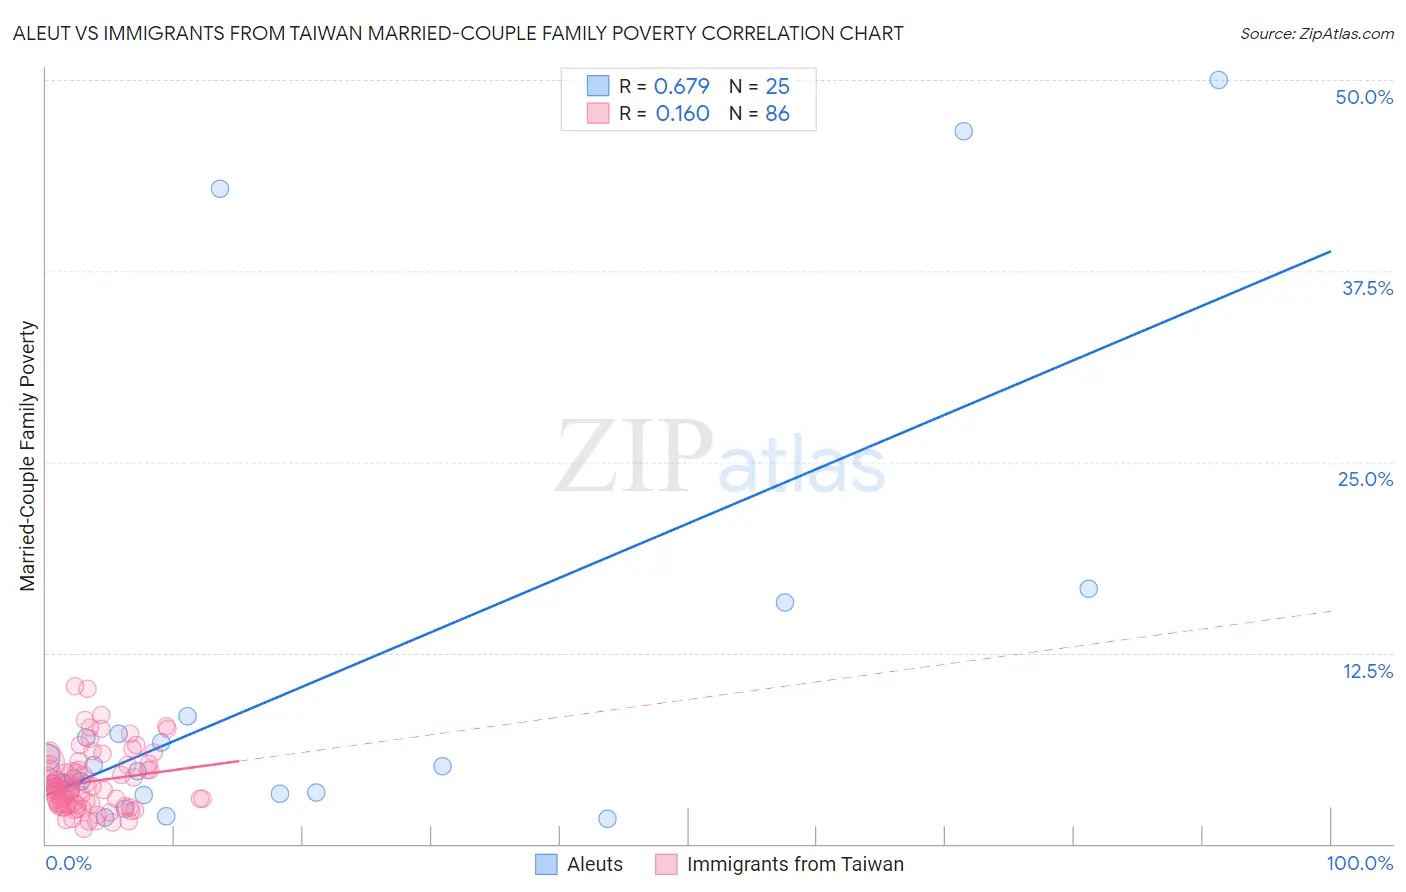
Aleut vs Immigrants from Taiwan Married-Couple Family Poverty Correlation Chart

The statistical analysis conducted on geographies consisting of 61,581,889 people shows a significant positive correlation between the proportion of Aleuts and poverty level among married-couple families in the United States with a correlation coefficient (R) of 0.679 and weighted average of 4.7%. Similarly, the statistical analysis conducted on geographies consisting of 295,998,361 people shows a poor positive correlation between the proportion of Immigrants from Taiwan and poverty level among married-couple families in the United States with a correlation coefficient (R) of 0.160 and weighted average of 4.1%, a difference of 13.6%.
Aleut vs Immigrants from Taiwan Married-Couple Family Poverty

Married-Couple Family Poverty Correlation Summary

MeasurementAleutImmigrants from Taiwan
Minimum1.6%1.0%
Maximum50.0%10.3%
Range48.4%9.3%
Mean10.4%4.1%
Median4.8%3.6%
Interquartile 25% (IQ1)3.3%2.6%
Interquartile 75% (IQ3)7.8%5.1%
Interquartile Range (IQR)4.5%2.5%
Standard Deviation (Sample)14.1%2.0%
Standard Deviation (Population)13.9%2.0%

Similar Demographics by Married-Couple Family Poverty

Demographics Similar to Aleuts by Married-Couple Family Poverty

In terms of married-couple family poverty, the demographic groups most similar to Aleuts are Immigrants from Moldova (4.7%, a difference of 0.070%), Immigrants from France (4.7%, a difference of 0.15%), Immigrants from Germany (4.7%, a difference of 0.16%), Immigrants from Romania (4.7%, a difference of 0.41%), and Laotian (4.7%, a difference of 0.43%).
DemographicsRating | RankMarried-Couple Family Poverty
Native Hawaiians
98.0
/100
|
#98
Exceptional
4.6%
Immigrants | Europe
97.9
/100
|
#99
Exceptional
4.6%
Immigrants | Western Europe
97.9
/100
|
#100
Exceptional
4.6%
Yugoslavians
97.8
/100
|
#101
Exceptional
4.6%
Asians
97.6
/100
|
#102
Exceptional
4.7%
Immigrants | Romania
97.3
/100
|
#103
Exceptional
4.7%
Immigrants | Moldova
97.1
/100
|
#104
Exceptional
4.7%
Aleuts
97.0
/100
|
#105
Exceptional
4.7%
Immigrants | France
96.9
/100
|
#106
Exceptional
4.7%
Immigrants | Germany
96.8
/100
|
#107
Exceptional
4.7%
Laotians
96.6
/100
|
#108
Exceptional
4.7%
Immigrants | Hong Kong
96.4
/100
|
#109
Exceptional
4.7%
Immigrants | Bolivia
96.2
/100
|
#110
Exceptional
4.7%
Pakistanis
96.2
/100
|
#111
Exceptional
4.7%
Tongans
95.9
/100
|
#112
Exceptional
4.7%

Demographics Similar to Immigrants from Taiwan by Married-Couple Family Poverty

In terms of married-couple family poverty, the demographic groups most similar to Immigrants from Taiwan are Cypriot (4.1%, a difference of 0.27%), Danish (4.1%, a difference of 0.38%), Scandinavian (4.1%, a difference of 0.49%), Immigrants from Scotland (4.2%, a difference of 0.53%), and Eastern European (4.1%, a difference of 0.57%).
DemographicsRating | RankMarried-Couple Family Poverty
Italians
100.0
/100
|
#18
Exceptional
4.0%
Immigrants | Ireland
99.9
/100
|
#19
Exceptional
4.1%
Maltese
99.9
/100
|
#20
Exceptional
4.1%
Zimbabweans
99.9
/100
|
#21
Exceptional
4.1%
Immigrants | Singapore
99.9
/100
|
#22
Exceptional
4.1%
Bhutanese
99.9
/100
|
#23
Exceptional
4.1%
Eastern Europeans
99.9
/100
|
#24
Exceptional
4.1%
Immigrants | Taiwan
99.9
/100
|
#25
Exceptional
4.1%
Cypriots
99.9
/100
|
#26
Exceptional
4.1%
Danes
99.9
/100
|
#27
Exceptional
4.1%
Scandinavians
99.9
/100
|
#28
Exceptional
4.1%
Immigrants | Scotland
99.9
/100
|
#29
Exceptional
4.2%
Finns
99.9
/100
|
#30
Exceptional
4.2%
Estonians
99.9
/100
|
#31
Exceptional
4.2%
Greeks
99.9
/100
|
#32
Exceptional
4.2%