Aleut 1 or more Vehicles in Household
COMPARE
Aleut
Select to Compare
1 or more Vehicles in Household
Aleut 1 or more Vehicles in Household
87.5%
1+ VEHICLES AVAILABLE
0.2/ 100
METRIC RATING
272nd/ 347
METRIC RANK
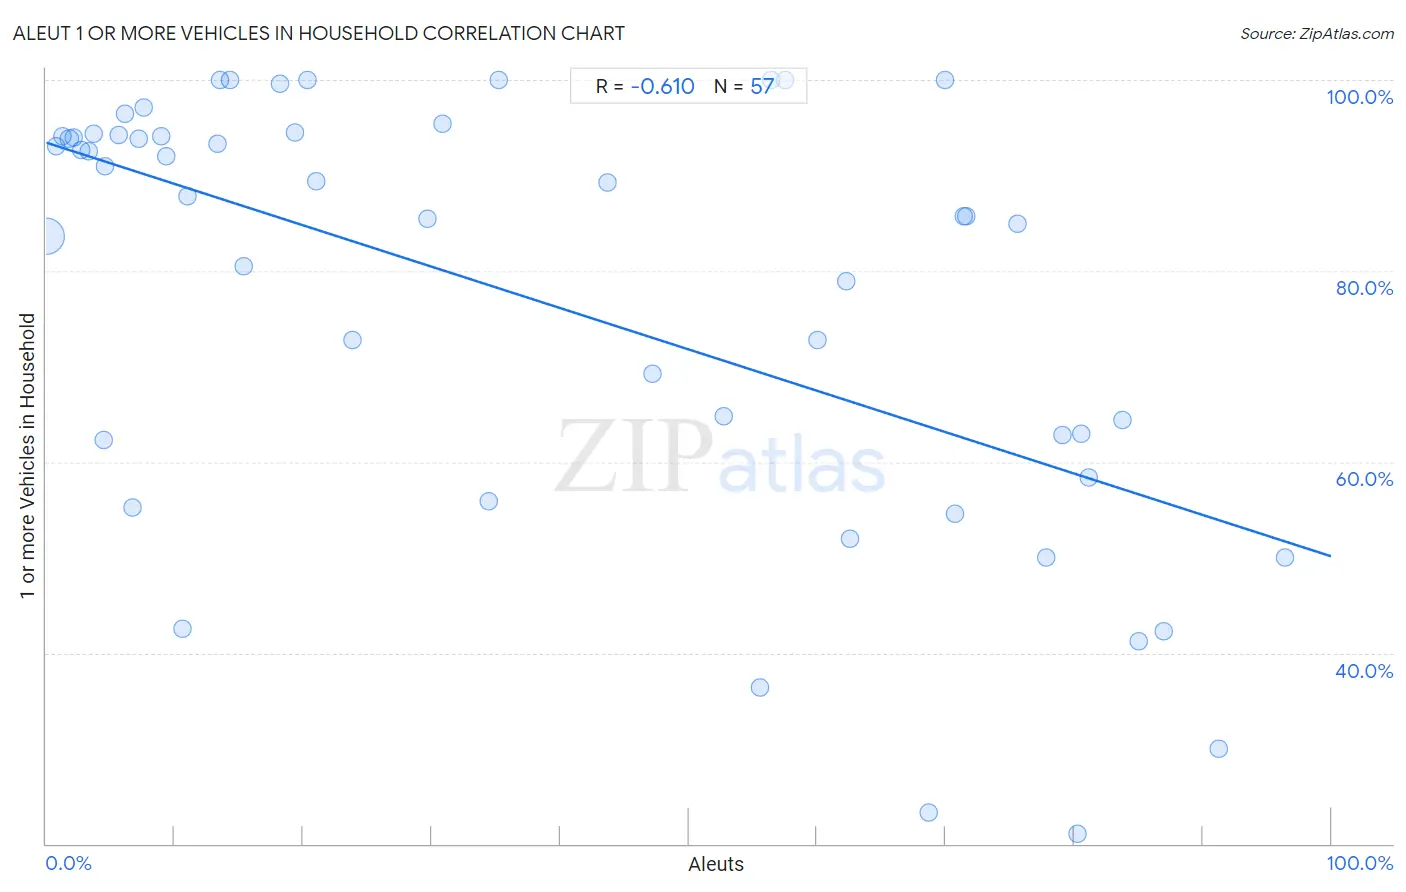
Aleut 1 or more Vehicles in Household Correlation Chart
The statistical analysis conducted on geographies consisting of 61,775,894 people shows a significant negative correlation between the proportion of Aleuts and percentage of households with 1 or more vehicles available in the United States with a correlation coefficient (R) of -0.610 and weighted average of 87.5%. On average, for every 1% (one percent) increase in Aleuts within a typical geography, there is a decrease of 0.43% in percentage of households with 1 or more vehicles available.
It is essential to understand that the correlation between the percentage of Aleuts and percentage of households with 1 or more vehicles available does not imply a direct cause-and-effect relationship. It remains uncertain whether the presence of Aleuts influences an upward or downward trend in the level of percentage of households with 1 or more vehicles available within an area, or if Aleuts simply ended up residing in those areas with higher or lower levels of percentage of households with 1 or more vehicles available due to other factors.
Demographics Similar to Aleuts by 1 or more Vehicles in Household
In terms of 1 or more vehicles in household, the demographic groups most similar to Aleuts are Immigrants from Northern Africa (87.4%, a difference of 0.040%), Bermudan (87.5%, a difference of 0.060%), Panamanian (87.5%, a difference of 0.070%), Immigrants from Africa (87.6%, a difference of 0.080%), and Immigrants from Morocco (87.4%, a difference of 0.080%).
| Demographics | Rating | Rank | 1 or more Vehicles in Household |
| Africans | 0.4 /100 | #265 | Tragic 87.8% |
| Israelis | 0.3 /100 | #266 | Tragic 87.7% |
| Immigrants from Colombia | 0.3 /100 | #267 | Tragic 87.6% |
| Immigrants from Europe | 0.2 /100 | #268 | Tragic 87.6% |
| Immigrants from Africa | 0.2 /100 | #269 | Tragic 87.6% |
| Panamanians | 0.2 /100 | #270 | Tragic 87.5% |
| Bermudans | 0.2 /100 | #271 | Tragic 87.5% |
| Aleuts | 0.2 /100 | #272 | Tragic 87.5% |
| Immigrants from Northern Africa | 0.2 /100 | #273 | Tragic 87.4% |
| Immigrants from Morocco | 0.1 /100 | #274 | Tragic 87.4% |
| Immigrants from Singapore | 0.1 /100 | #275 | Tragic 87.2% |
| Immigrants from France | 0.1 /100 | #276 | Tragic 87.1% |
| Alsatians | 0.1 /100 | #277 | Tragic 87.1% |
| Immigrants from Southern Europe | 0.1 /100 | #278 | Tragic 87.1% |
| Immigrants from Albania | 0.1 /100 | #279 | Tragic 87.1% |
Aleut 1 or more Vehicles in Household Correlation Summary
| Measurement | Aleut Data | 1 or more Vehicles in Household Data |
| Minimum | 0.022% | 21.1% |
| Maximum | 96.4% | 100.0% |
| Range | 96.4% | 78.9% |
| Mean | 37.8% | 77.1% |
| Median | 29.6% | 85.7% |
| Interquartile 25% (IQ1) | 7.4% | 60.3% |
| Interquartile 75% (IQ3) | 70.3% | 94.2% |
| Interquartile Range (IQR) | 62.9% | 33.8% |
| Standard Deviation (Sample) | 31.6% | 22.5% |
| Standard Deviation (Population) | 31.4% | 22.3% |
Correlation Details
| Aleut Percentile | Sample Size | 1 or more Vehicles in Household |
[ 0.0% - 0.5% ] 0.022% | 60,519,373 | 83.6% |
[ 0.5% - 1.0% ] 0.74% | 355,493 | 93.0% |
[ 1.0% - 1.5% ] 1.22% | 191,674 | 94.1% |
[ 1.5% - 2.0% ] 1.80% | 473,436 | 93.9% |
[ 2.0% - 2.5% ] 2.12% | 89,226 | 94.0% |
[ 2.5% - 3.0% ] 2.72% | 48,906 | 92.7% |
[ 3.0% - 3.5% ] 3.27% | 15,547 | 92.6% |
[ 3.5% - 4.0% ] 3.68% | 19,419 | 94.4% |
[ 4.0% - 4.5% ] 4.43% | 361 | 62.3% |
[ 4.5% - 5.0% ] 4.59% | 15,235 | 91.0% |
[ 5.5% - 6.0% ] 5.66% | 2,879 | 94.2% |
[ 6.0% - 6.5% ] 6.17% | 3,580 | 96.5% |
[ 6.5% - 7.0% ] 6.67% | 90 | 55.2% |
[ 7.0% - 7.5% ] 7.17% | 963 | 93.9% |
[ 7.5% - 8.0% ] 7.61% | 10,351 | 97.1% |
[ 8.5% - 9.0% ] 8.98% | 401 | 94.1% |
[ 9.0% - 9.5% ] 9.38% | 12,618 | 92.1% |
[ 10.5% - 11.0% ] 10.62% | 226 | 42.6% |
[ 11.0% - 11.5% ] 11.00% | 209 | 87.8% |
[ 13.0% - 13.5% ] 13.29% | 143 | 93.3% |
[ 13.5% - 14.0% ] 13.51% | 37 | 100.0% |
[ 14.0% - 14.5% ] 14.35% | 230 | 100.0% |
[ 15.0% - 15.5% ] 15.32% | 496 | 80.5% |
[ 18.0% - 18.5% ] 18.16% | 4,680 | 99.6% |
[ 19.0% - 19.5% ] 19.32% | 383 | 94.4% |
[ 20.0% - 20.5% ] 20.33% | 123 | 100.0% |
[ 21.0% - 21.5% ] 21.05% | 836 | 89.4% |
[ 23.5% - 24.0% ] 23.87% | 243 | 72.7% |
[ 29.5% - 30.0% ] 29.65% | 452 | 85.5% |
[ 30.5% - 31.0% ] 30.80% | 237 | 95.4% |
[ 34.0% - 34.5% ] 34.47% | 235 | 55.8% |
[ 35.0% - 35.5% ] 35.19% | 108 | 100.0% |
[ 43.5% - 44.0% ] 43.69% | 2,344 | 89.2% |
[ 47.0% - 47.5% ] 47.17% | 106 | 69.2% |
[ 52.5% - 53.0% ] 52.71% | 2,216 | 64.8% |
[ 55.5% - 56.0% ] 55.56% | 54 | 36.4% |
[ 56.0% - 56.5% ] 56.41% | 78 | 100.0% |
[ 57.0% - 57.5% ] 57.45% | 94 | 100.0% |
[ 60.0% - 60.5% ] 60.00% | 60 | 72.7% |
[ 62.0% - 62.5% ] 62.24% | 98 | 78.9% |
[ 62.5% - 63.0% ] 62.58% | 310 | 52.0% |
[ 68.5% - 69.0% ] 68.70% | 115 | 23.3% |
[ 69.5% - 70.0% ] 69.90% | 206 | 100.0% |
[ 70.5% - 71.0% ] 70.69% | 58 | 54.5% |
[ 71.0% - 71.5% ] 71.43% | 126 | 85.7% |
[ 71.5% - 72.0% ] 71.58% | 95 | 85.7% |
[ 75.5% - 76.0% ] 75.56% | 90 | 85.0% |
[ 77.5% - 78.0% ] 77.78% | 9 | 50.0% |
[ 79.0% - 79.5% ] 79.08% | 698 | 62.8% |
[ 80.0% - 80.5% ] 80.23% | 172 | 21.1% |
[ 80.5% - 81.0% ] 80.56% | 144 | 63.0% |
[ 81.0% - 81.5% ] 81.18% | 170 | 58.3% |
[ 83.5% - 84.0% ] 83.80% | 142 | 64.4% |
[ 85.0% - 85.5% ] 85.00% | 80 | 41.2% |
[ 86.5% - 87.0% ] 86.96% | 69 | 42.3% |
[ 91.0% - 91.5% ] 91.23% | 114 | 30.0% |
[ 96.0% - 96.5% ] 96.43% | 56 | 50.0% |