Aleut 4 or more Vehicles in Household
COMPARE
Aleut
Select to Compare
4 or more Vehicles in Household
Aleut 4 or more Vehicles in Household
6.9%
4+ VEHICLES AVAILABLE
97.0/ 100
METRIC RATING
111th/ 347
METRIC RANK
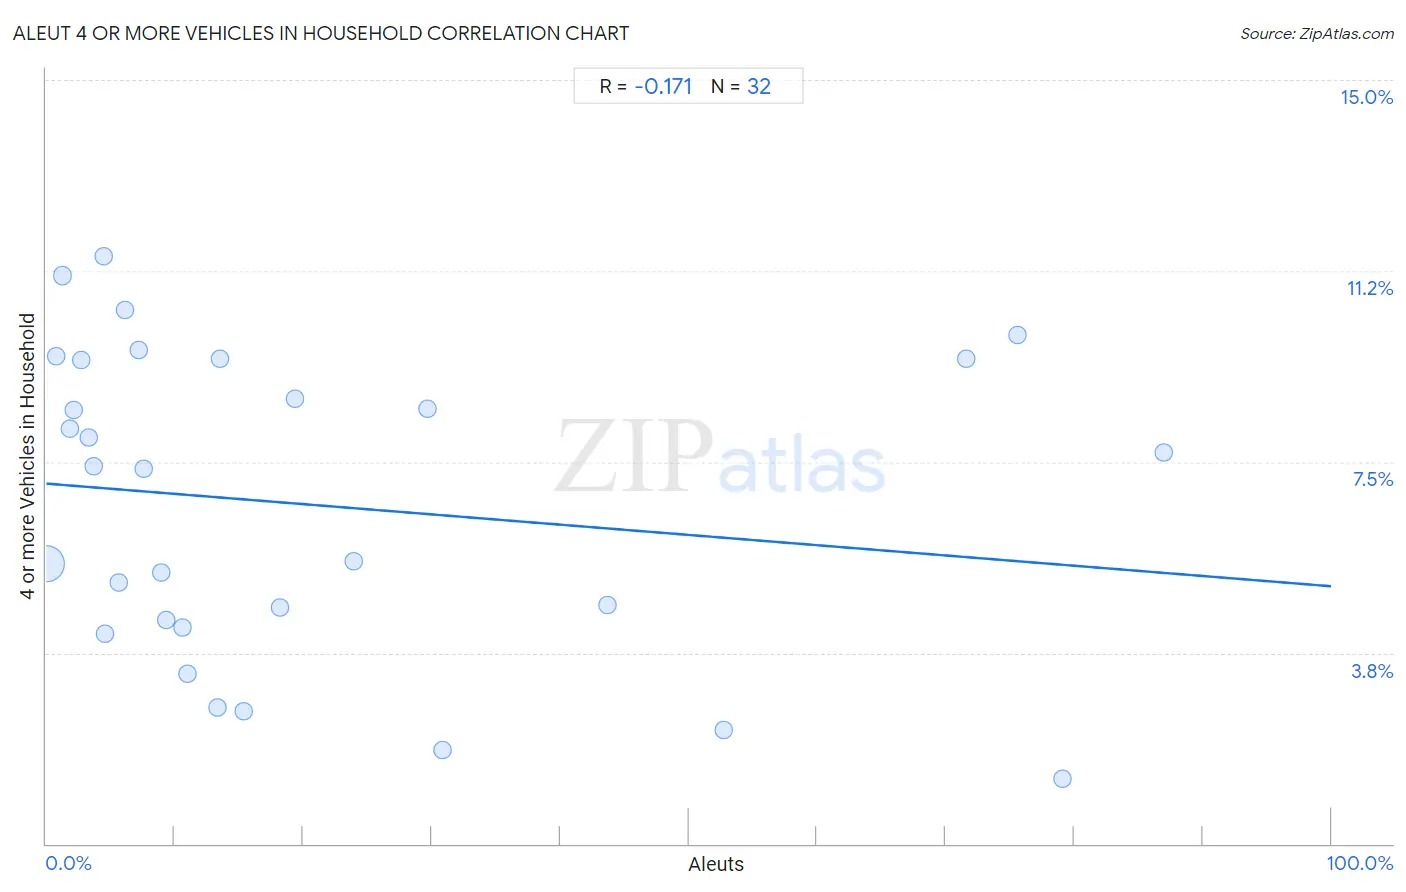
Aleut 4 or more Vehicles in Household Correlation Chart
The statistical analysis conducted on geographies consisting of 61,735,509 people shows a poor negative correlation between the proportion of Aleuts and percentage of households with 4 or more vehicles available in the United States with a correlation coefficient (R) of -0.171 and weighted average of 6.9%. On average, for every 1% (one percent) increase in Aleuts within a typical geography, there is a decrease of 0.020% in percentage of households with 4 or more vehicles available.
It is essential to understand that the correlation between the percentage of Aleuts and percentage of households with 4 or more vehicles available does not imply a direct cause-and-effect relationship. It remains uncertain whether the presence of Aleuts influences an upward or downward trend in the level of percentage of households with 4 or more vehicles available within an area, or if Aleuts simply ended up residing in those areas with higher or lower levels of percentage of households with 4 or more vehicles available due to other factors.
Demographics Similar to Aleuts by 4 or more Vehicles in Household
In terms of 4 or more vehicles in household, the demographic groups most similar to Aleuts are Hopi (6.9%, a difference of 0.010%), Immigrants from Thailand (6.9%, a difference of 0.020%), Canadian (6.9%, a difference of 0.43%), Bolivian (6.8%, a difference of 0.48%), and Filipino (6.9%, a difference of 0.53%).
| Demographics | Rating | Rank | 4 or more Vehicles in Household |
| Hmong | 98.3 /100 | #104 | Exceptional 7.0% |
| German Russians | 98.3 /100 | #105 | Exceptional 7.0% |
| Guatemalans | 98.1 /100 | #106 | Exceptional 7.0% |
| Nicaraguans | 98.0 /100 | #107 | Exceptional 7.0% |
| French | 97.7 /100 | #108 | Exceptional 6.9% |
| Filipinos | 97.6 /100 | #109 | Exceptional 6.9% |
| Immigrants from Thailand | 97.0 /100 | #110 | Exceptional 6.9% |
| Aleuts | 97.0 /100 | #111 | Exceptional 6.9% |
| Hopi | 97.0 /100 | #112 | Exceptional 6.9% |
| Canadians | 96.4 /100 | #113 | Exceptional 6.9% |
| Bolivians | 96.3 /100 | #114 | Exceptional 6.8% |
| Tlingit-Haida | 96.2 /100 | #115 | Exceptional 6.8% |
| Immigrants from Guatemala | 95.8 /100 | #116 | Exceptional 6.8% |
| Burmese | 95.7 /100 | #117 | Exceptional 6.8% |
| French American Indians | 95.7 /100 | #118 | Exceptional 6.8% |
Aleut 4 or more Vehicles in Household Correlation Summary
| Measurement | Aleut Data | 4 or more Vehicles in Household Data |
| Minimum | 0.022% | 1.3% |
| Maximum | 87.0% | 11.5% |
| Range | 86.9% | 10.3% |
| Mean | 20.8% | 6.7% |
| Median | 10.0% | 7.4% |
| Interquartile 25% (IQ1) | 4.1% | 4.3% |
| Interquartile 75% (IQ3) | 26.8% | 9.5% |
| Interquartile Range (IQR) | 22.7% | 5.2% |
| Standard Deviation (Sample) | 25.3% | 3.0% |
| Standard Deviation (Population) | 24.9% | 2.9% |
Correlation Details
| Aleut Percentile | Sample Size | 4 or more Vehicles in Household |
[ 0.0% - 0.5% ] 0.022% | 60,500,099 | 5.5% |
[ 0.5% - 1.0% ] 0.74% | 346,981 | 9.6% |
[ 1.0% - 1.5% ] 1.22% | 187,298 | 11.2% |
[ 1.5% - 2.0% ] 1.80% | 470,472 | 8.1% |
[ 2.0% - 2.5% ] 2.12% | 88,664 | 8.5% |
[ 2.5% - 3.0% ] 2.72% | 48,906 | 9.5% |
[ 3.0% - 3.5% ] 3.27% | 15,481 | 8.0% |
[ 3.5% - 4.0% ] 3.68% | 19,419 | 7.4% |
[ 4.0% - 4.5% ] 4.44% | 45 | 11.5% |
[ 4.5% - 5.0% ] 4.59% | 15,235 | 4.1% |
[ 5.5% - 6.0% ] 5.65% | 2,777 | 5.1% |
[ 6.0% - 6.5% ] 6.17% | 3,580 | 10.5% |
[ 7.0% - 7.5% ] 7.17% | 963 | 9.7% |
[ 7.5% - 8.0% ] 7.61% | 10,351 | 7.4% |
[ 8.5% - 9.0% ] 8.98% | 401 | 5.3% |
[ 9.0% - 9.5% ] 9.38% | 12,618 | 4.4% |
[ 10.5% - 11.0% ] 10.62% | 226 | 4.3% |
[ 11.0% - 11.5% ] 11.00% | 209 | 3.3% |
[ 13.0% - 13.5% ] 13.29% | 143 | 2.7% |
[ 13.5% - 14.0% ] 13.51% | 37 | 9.5% |
[ 15.0% - 15.5% ] 15.32% | 496 | 2.6% |
[ 18.0% - 18.5% ] 18.16% | 4,680 | 4.6% |
[ 19.0% - 19.5% ] 19.32% | 383 | 8.7% |
[ 23.5% - 24.0% ] 23.91% | 92 | 5.6% |
[ 29.5% - 30.0% ] 29.65% | 452 | 8.6% |
[ 30.5% - 31.0% ] 30.80% | 237 | 1.8% |
[ 43.5% - 44.0% ] 43.70% | 2,096 | 4.7% |
[ 52.5% - 53.0% ] 52.71% | 2,216 | 2.2% |
[ 71.5% - 72.0% ] 71.58% | 95 | 9.5% |
[ 75.5% - 76.0% ] 75.56% | 90 | 10.0% |
[ 79.0% - 79.5% ] 79.08% | 698 | 1.3% |
[ 86.5% - 87.0% ] 86.96% | 69 | 7.7% |