Roanoke, VA Map & Demographics
Roanoke Map
Roanoke Overview
$33,206
PER CAPITA INCOME
$66,055
AVG FAMILY INCOME
$51,523
AVG HOUSEHOLD INCOME
13.8%
WAGE / INCOME GAP [ % ]
86.2¢/ $1
WAGE / INCOME GAP [ $ ]
$11,607
FAMILY INCOME DEFICIT
0.50
INEQUALITY / GINI INDEX
99,213
TOTAL POPULATION
46,791
MALE POPULATION
52,422
FEMALE POPULATION
89.26
MALES / 100 FEMALES
112.03
FEMALES / 100 MALES
38.1
MEDIAN AGE
3.1
AVG FAMILY SIZE
2.3
AVG HOUSEHOLD SIZE
50,391
LABOR FORCE [ PEOPLE ]
63.8%
PERCENT IN LABOR FORCE
6.6%
UNEMPLOYMENT RATE
Roanoke Area Codes
Income in Roanoke
Income Overview in Roanoke
Per Capita Income in Roanoke is $33,206, while median incomes of families and households are $66,055 and $51,523 respectively.
| Characteristic | Number | Measure |
| Per Capita Income | 99,213 | $33,206 |
| Median Family Income | 22,067 | $66,055 |
| Mean Family Income | 22,067 | $94,307 |
| Median Household Income | 42,806 | $51,523 |
| Mean Household Income | 42,806 | $73,683 |
| Income Deficit | 22,067 | $11,607 |
| Wage / Income Gap (%) | 99,213 | 13.76% |
| Wage / Income Gap ($) | 99,213 | 86.24¢ per $1 |
| Gini / Inequality Index | 99,213 | 0.50 |
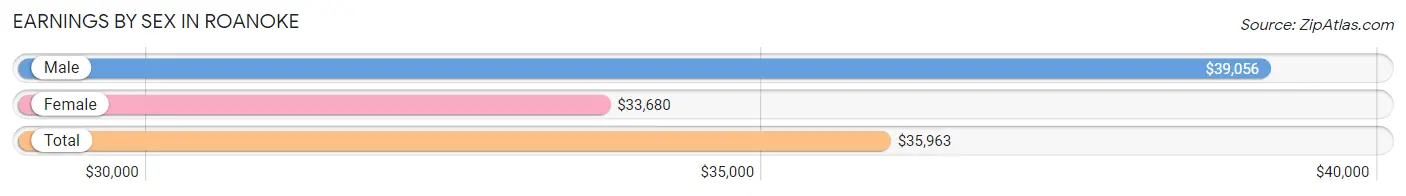
Earnings by Sex in Roanoke
Average Earnings in Roanoke are $35,963, $39,056 for men and $33,680 for women, a difference of 13.8%.
| Sex | Number | Average Earnings |
| Male | 25,516 (49.6%) | $39,056 |
| Female | 25,935 (50.4%) | $33,680 |
| Total | 51,451 (100.0%) | $35,963 |
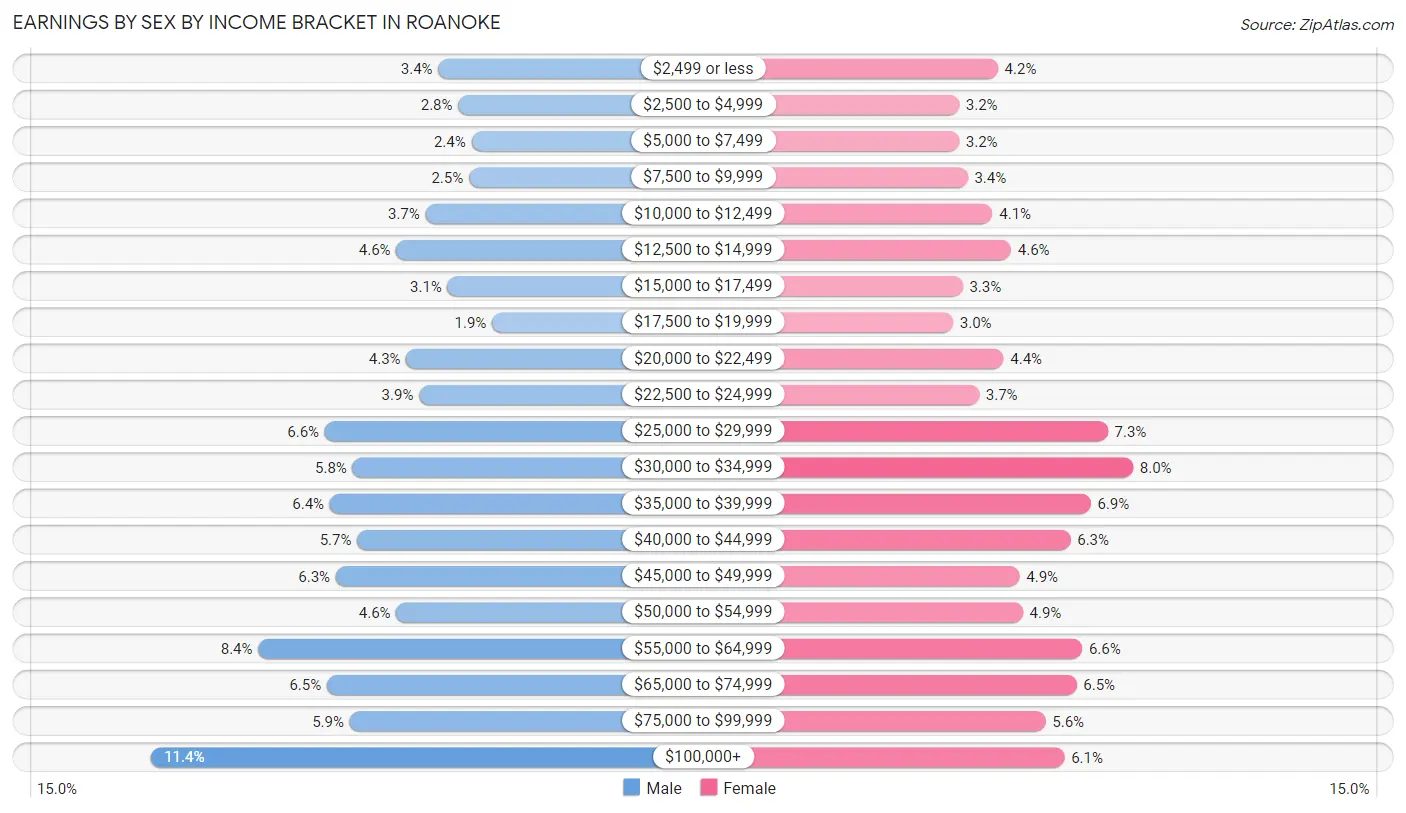
Earnings by Sex by Income Bracket in Roanoke
The most common earnings brackets in Roanoke are $100,000+ for men (2,920 | 11.4%) and $30,000 to $34,999 for women (2,085 | 8.0%).
| Income | Male | Female |
| $2,499 or less | 861 (3.4%) | 1,100 (4.2%) |
| $2,500 to $4,999 | 716 (2.8%) | 816 (3.2%) |
| $5,000 to $7,499 | 622 (2.4%) | 817 (3.2%) |
| $7,500 to $9,999 | 641 (2.5%) | 879 (3.4%) |
| $10,000 to $12,499 | 952 (3.7%) | 1,062 (4.1%) |
| $12,500 to $14,999 | 1,160 (4.5%) | 1,195 (4.6%) |
| $15,000 to $17,499 | 793 (3.1%) | 843 (3.3%) |
| $17,500 to $19,999 | 474 (1.9%) | 772 (3.0%) |
| $20,000 to $22,499 | 1,090 (4.3%) | 1,142 (4.4%) |
| $22,500 to $24,999 | 997 (3.9%) | 961 (3.7%) |
| $25,000 to $29,999 | 1,674 (6.6%) | 1,900 (7.3%) |
| $30,000 to $34,999 | 1,475 (5.8%) | 2,085 (8.0%) |
| $35,000 to $39,999 | 1,638 (6.4%) | 1,777 (6.9%) |
| $40,000 to $44,999 | 1,441 (5.7%) | 1,628 (6.3%) |
| $45,000 to $49,999 | 1,596 (6.2%) | 1,257 (4.9%) |
| $50,000 to $54,999 | 1,161 (4.5%) | 1,282 (4.9%) |
| $55,000 to $64,999 | 2,152 (8.4%) | 1,714 (6.6%) |
| $65,000 to $74,999 | 1,658 (6.5%) | 1,673 (6.5%) |
| $75,000 to $99,999 | 1,495 (5.9%) | 1,447 (5.6%) |
| $100,000+ | 2,920 (11.4%) | 1,585 (6.1%) |
| Total | 25,516 (100.0%) | 25,935 (100.0%) |
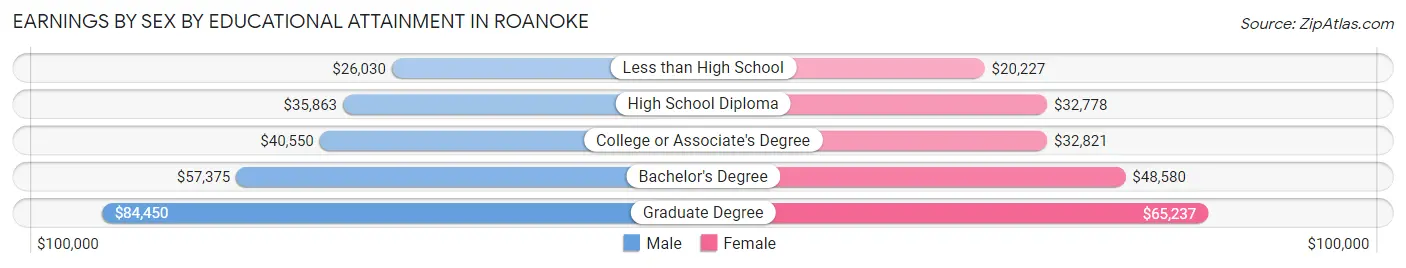
Earnings by Sex by Educational Attainment in Roanoke
Average earnings in Roanoke are $43,473 for men and $36,251 for women, a difference of 16.6%. Men with an educational attainment of graduate degree enjoy the highest average annual earnings of $84,450, while those with less than high school education earn the least with $26,030. Women with an educational attainment of graduate degree earn the most with the average annual earnings of $65,237, while those with less than high school education have the smallest earnings of $20,227.
| Educational Attainment | Male Income | Female Income |
| Less than High School | $26,030 | $20,227 |
| High School Diploma | $35,863 | $32,778 |
| College or Associate's Degree | $40,550 | $32,821 |
| Bachelor's Degree | $57,375 | $48,580 |
| Graduate Degree | $84,450 | $65,237 |
| Total | $43,473 | $36,251 |
Family Income in Roanoke
Family Income Brackets in Roanoke
According to the Roanoke family income data, there are 4,259 families falling into the $50,000 to $74,999 income range, which is the most common income bracket and makes up 19.3% of all families. Conversely, the less than $10,000 income bracket is the least frequent group with only 971 families (4.4%) belonging to this category.
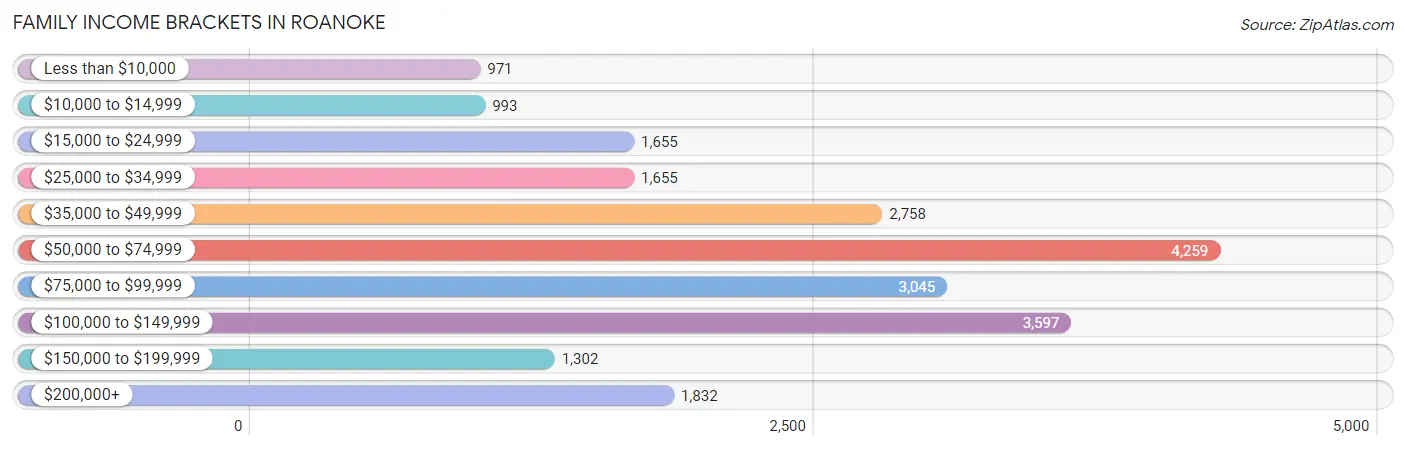
| Income Bracket | # Families | % Families |
| Less than $10,000 | 971 | 4.4% |
| $10,000 to $14,999 | 993 | 4.5% |
| $15,000 to $24,999 | 1,655 | 7.5% |
| $25,000 to $34,999 | 1,655 | 7.5% |
| $35,000 to $49,999 | 2,758 | 12.5% |
| $50,000 to $74,999 | 4,259 | 19.3% |
| $75,000 to $99,999 | 3,045 | 13.8% |
| $100,000 to $149,999 | 3,597 | 16.3% |
| $150,000 to $199,999 | 1,302 | 5.9% |
| $200,000+ | 1,832 | 8.3% |
Family Income by Famaliy Size in Roanoke
5-person families (1,206 | 5.5%) account for the highest median family income in Roanoke with $104,118 per family, while 2-person families (12,141 | 55.0%) have the highest median income of $30,088 per family member.
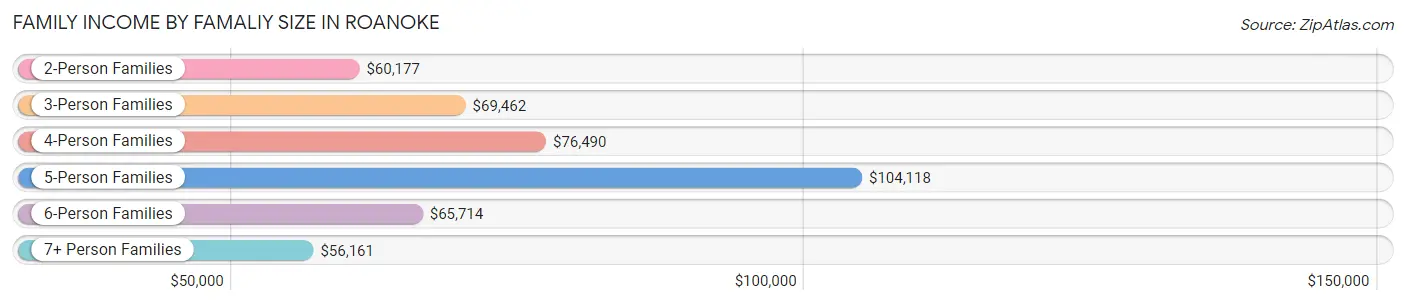
| Income Bracket | # Families | Median Income |
| 2-Person Families | 12,141 (55.0%) | $60,177 |
| 3-Person Families | 4,680 (21.2%) | $69,462 |
| 4-Person Families | 3,188 (14.4%) | $76,490 |
| 5-Person Families | 1,206 (5.5%) | $104,118 |
| 6-Person Families | 486 (2.2%) | $65,714 |
| 7+ Person Families | 366 (1.7%) | $56,161 |
| Total | 22,067 (100.0%) | $66,055 |
Family Income by Number of Earners in Roanoke
The median family income in Roanoke is $66,055, with families comprising 3+ earners (1,749) having the highest median family income of $107,235, while families with no earners (3,430) have the lowest median family income of $33,967, accounting for 7.9% and 15.5% of families, respectively.
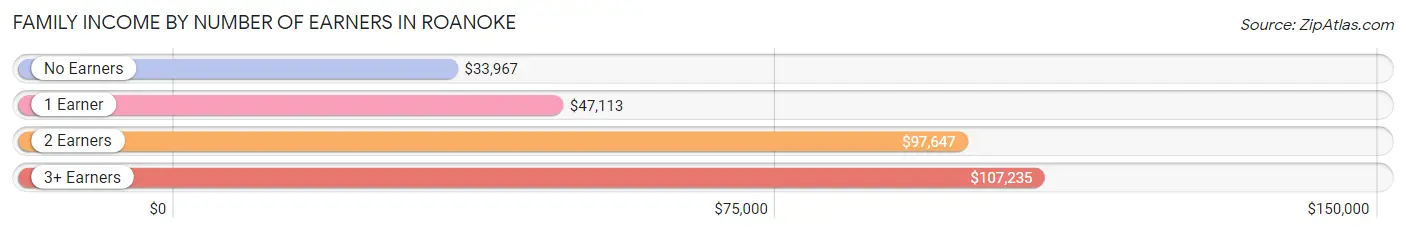
| Number of Earners | # Families | Median Income |
| No Earners | 3,430 (15.5%) | $33,967 |
| 1 Earner | 8,723 (39.5%) | $47,113 |
| 2 Earners | 8,165 (37.0%) | $97,647 |
| 3+ Earners | 1,749 (7.9%) | $107,235 |
| Total | 22,067 (100.0%) | $66,055 |
Household Income in Roanoke
Household Income Brackets in Roanoke
With 7,876 households falling in the category, the $50,000 to $74,999 income range is the most frequent in Roanoke, accounting for 18.4% of all households. In contrast, only 1,798 households (4.2%) fall into the $150,000 to $199,999 income bracket, making it the least populous group.
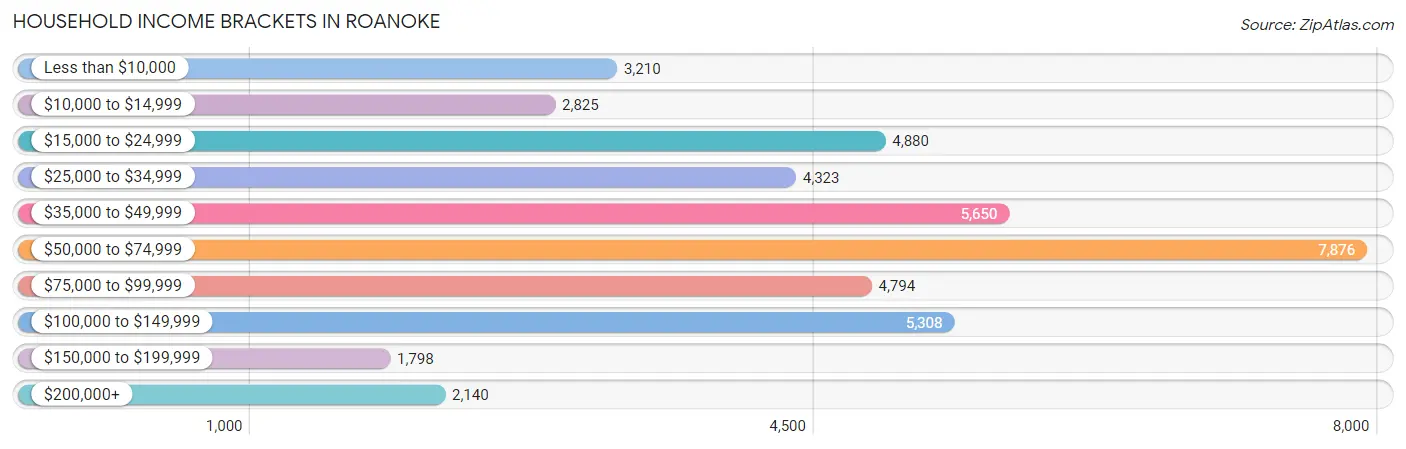
| Income Bracket | # Households | % Households |
| Less than $10,000 | 3,210 | 7.5% |
| $10,000 to $14,999 | 2,825 | 6.6% |
| $15,000 to $24,999 | 4,880 | 11.4% |
| $25,000 to $34,999 | 4,323 | 10.1% |
| $35,000 to $49,999 | 5,650 | 13.2% |
| $50,000 to $74,999 | 7,876 | 18.4% |
| $75,000 to $99,999 | 4,794 | 11.2% |
| $100,000 to $149,999 | 5,308 | 12.4% |
| $150,000 to $199,999 | 1,798 | 4.2% |
| $200,000+ | 2,140 | 5.0% |
Household Income by Householder Age in Roanoke
The median household income in Roanoke is $51,523, with the highest median household income of $60,024 found in the 25 to 44 years age bracket for the primary householder. A total of 14,357 households (33.5%) fall into this category. Meanwhile, the 15 to 24 years age bracket for the primary householder has the lowest median household income of $27,603, with 1,992 households (4.6%) in this group.
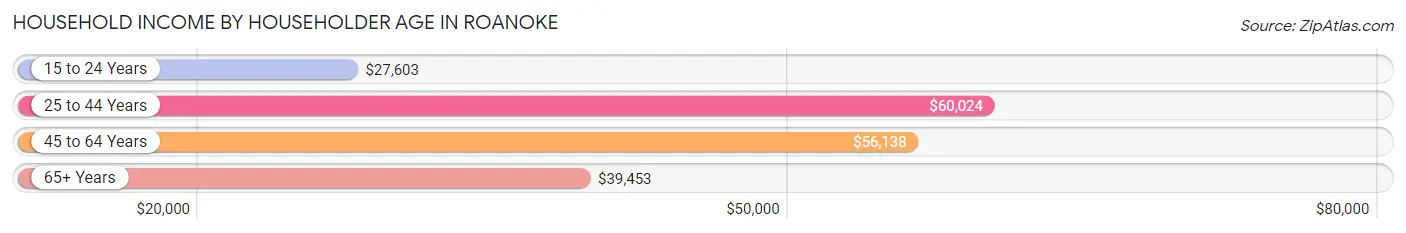
| Income Bracket | # Households | Median Income |
| 15 to 24 Years | 1,992 (4.6%) | $27,603 |
| 25 to 44 Years | 14,357 (33.5%) | $60,024 |
| 45 to 64 Years | 15,321 (35.8%) | $56,138 |
| 65+ Years | 11,136 (26.0%) | $39,453 |
| Total | 42,806 (100.0%) | $51,523 |
Poverty in Roanoke
Income Below Poverty by Sex and Age in Roanoke
With 18.2% poverty level for males and 19.9% for females among the residents of Roanoke, under 5 year old males and 5 year old females are the most vulnerable to poverty, with 1,035 males (35.0%) and 296 females (42.9%) in their respective age groups living below the poverty level.
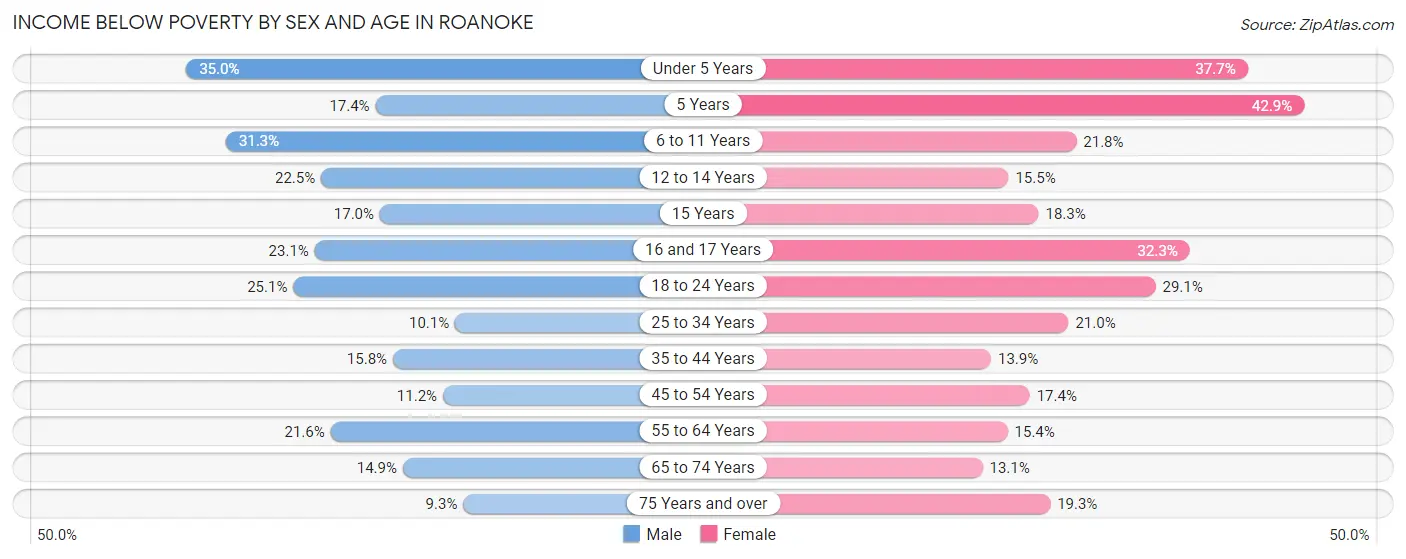
| Age Bracket | Male | Female |
| Under 5 Years | 1,035 (35.0%) | 1,263 (37.7%) |
| 5 Years | 120 (17.4%) | 296 (42.9%) |
| 6 to 11 Years | 961 (31.3%) | 780 (21.8%) |
| 12 to 14 Years | 492 (22.5%) | 280 (15.5%) |
| 15 Years | 126 (17.0%) | 157 (18.3%) |
| 16 and 17 Years | 207 (23.1%) | 287 (32.3%) |
| 18 to 24 Years | 930 (25.1%) | 1,072 (29.1%) |
| 25 to 34 Years | 737 (10.1%) | 1,641 (21.0%) |
| 35 to 44 Years | 941 (15.8%) | 886 (13.9%) |
| 45 to 54 Years | 661 (11.2%) | 1,057 (17.4%) |
| 55 to 64 Years | 1,308 (21.6%) | 1,001 (15.4%) |
| 65 to 74 Years | 652 (14.9%) | 758 (13.1%) |
| 75 Years and over | 194 (9.3%) | 793 (19.3%) |
| Total | 8,364 (18.2%) | 10,271 (19.9%) |
Income Above Poverty by Sex and Age in Roanoke
According to the poverty statistics in Roanoke, males aged 75 years and over and females aged 65 to 74 years are the age groups that are most secure financially, with 90.7% of males and 86.9% of females in these age groups living above the poverty line.
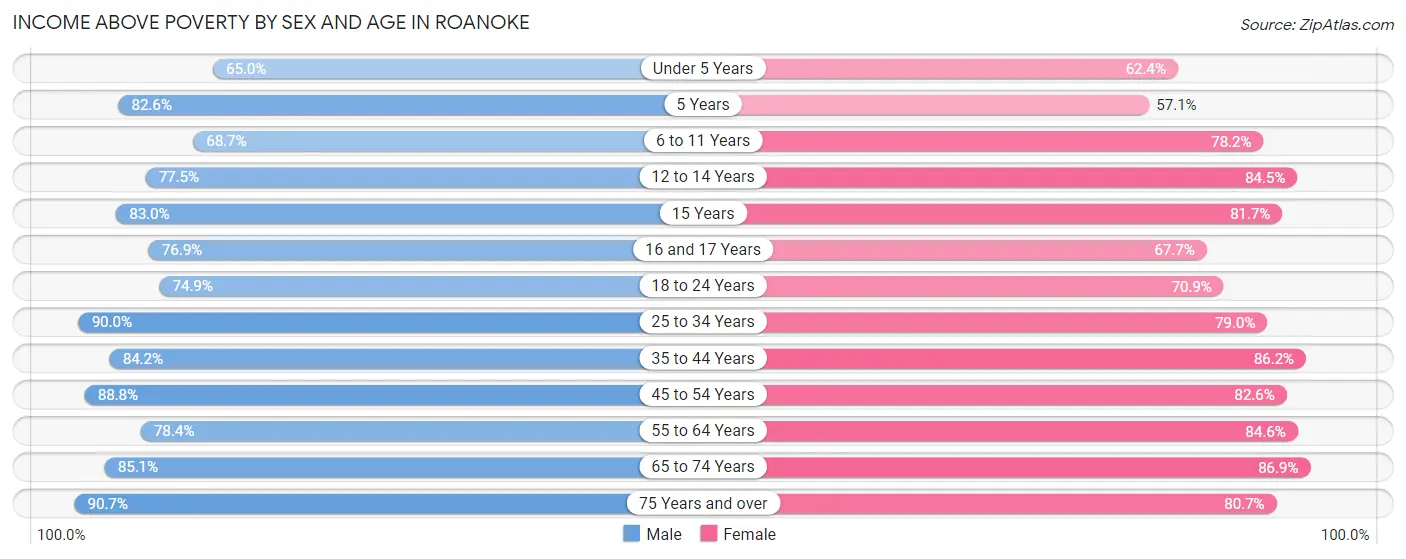
| Age Bracket | Male | Female |
| Under 5 Years | 1,922 (65.0%) | 2,092 (62.4%) |
| 5 Years | 568 (82.6%) | 394 (57.1%) |
| 6 to 11 Years | 2,107 (68.7%) | 2,803 (78.2%) |
| 12 to 14 Years | 1,696 (77.5%) | 1,530 (84.5%) |
| 15 Years | 614 (83.0%) | 703 (81.7%) |
| 16 and 17 Years | 690 (76.9%) | 602 (67.7%) |
| 18 to 24 Years | 2,780 (74.9%) | 2,609 (70.9%) |
| 25 to 34 Years | 6,598 (89.9%) | 6,159 (79.0%) |
| 35 to 44 Years | 5,007 (84.2%) | 5,512 (86.2%) |
| 45 to 54 Years | 5,249 (88.8%) | 5,005 (82.6%) |
| 55 to 64 Years | 4,744 (78.4%) | 5,504 (84.6%) |
| 65 to 74 Years | 3,724 (85.1%) | 5,046 (86.9%) |
| 75 Years and over | 1,895 (90.7%) | 3,308 (80.7%) |
| Total | 37,594 (81.8%) | 41,267 (80.1%) |
Income Below Poverty Among Married-Couple Families in Roanoke
The poverty statistics for married-couple families in Roanoke show that 6.2% or 793 of the total 12,750 families live below the poverty line. Families with 5 or more children have the highest poverty rate of 33.0%, comprising of 33 families. On the other hand, families with no children have the lowest poverty rate of 3.8%, which includes 314 families.
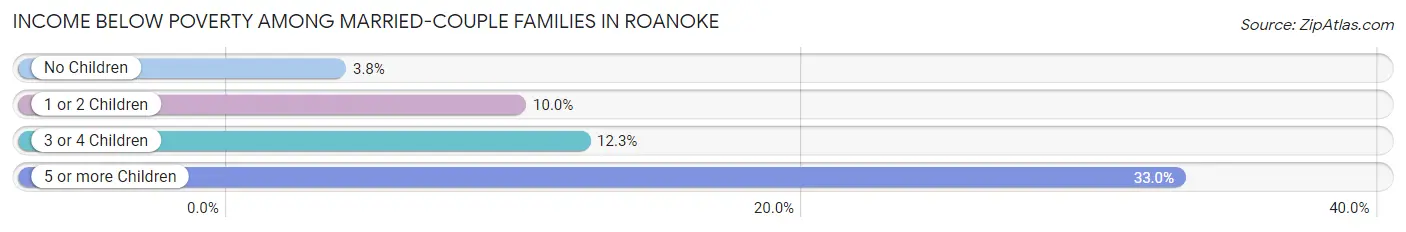
| Children | Above Poverty | Below Poverty |
| No Children | 8,040 (96.2%) | 314 (3.8%) |
| 1 or 2 Children | 3,256 (90.0%) | 363 (10.0%) |
| 3 or 4 Children | 594 (87.7%) | 83 (12.3%) |
| 5 or more Children | 67 (67.0%) | 33 (33.0%) |
| Total | 11,957 (93.8%) | 793 (6.2%) |
Income Below Poverty Among Single-Parent Households in Roanoke
According to the poverty data in Roanoke, 12.5% or 273 single-father households and 26.8% or 1,913 single-mother households are living below the poverty line. Among single-father households, those with 3 or 4 children have the highest poverty rate, with 26 households (28.6%) experiencing poverty. Likewise, among single-mother households, those with 5 or more children have the highest poverty rate, with 132 households (94.3%) falling below the poverty line.
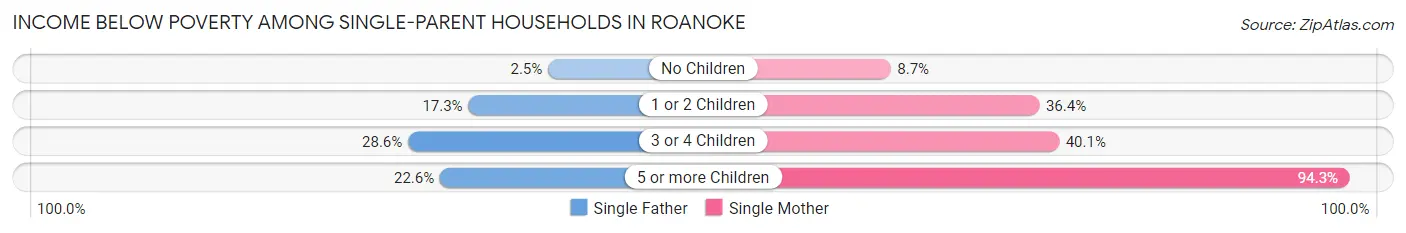
| Children | Single Father | Single Mother |
| No Children | 20 (2.5%) | 252 (8.7%) |
| 1 or 2 Children | 208 (17.3%) | 1,126 (36.4%) |
| 3 or 4 Children | 26 (28.6%) | 403 (40.1%) |
| 5 or more Children | 19 (22.6%) | 132 (94.3%) |
| Total | 273 (12.5%) | 1,913 (26.8%) |
Income Below Poverty Among Married-Couple vs Single-Parent Households in Roanoke
The poverty data for Roanoke shows that 793 of the married-couple family households (6.2%) and 2,186 of the single-parent households (23.5%) are living below the poverty level. Within the married-couple family households, those with 5 or more children have the highest poverty rate, with 33 households (33.0%) falling below the poverty line. Among the single-parent households, those with 5 or more children have the highest poverty rate, with 151 household (67.4%) living below poverty.
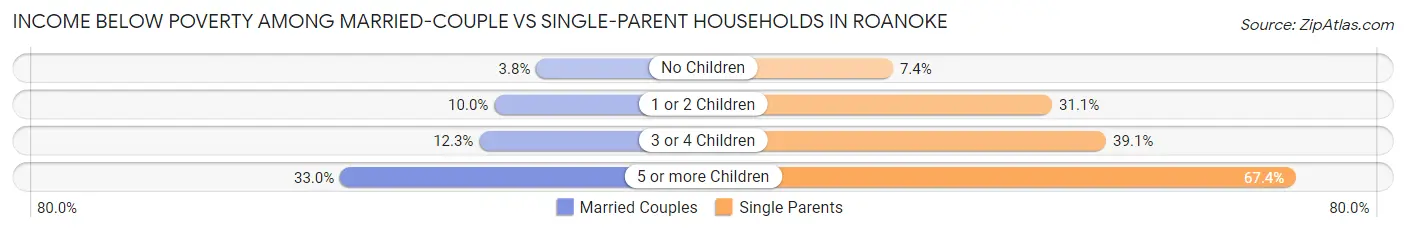
| Children | Married-Couple Families | Single-Parent Households |
| No Children | 314 (3.8%) | 272 (7.3%) |
| 1 or 2 Children | 363 (10.0%) | 1,334 (31.1%) |
| 3 or 4 Children | 83 (12.3%) | 429 (39.1%) |
| 5 or more Children | 33 (33.0%) | 151 (67.4%) |
| Total | 793 (6.2%) | 2,186 (23.5%) |
Race in Roanoke
The most populous races in Roanoke are White / Caucasian (58,589 | 59.1%), Black / African American (29,140 | 29.4%), and Hispanic or Latino (6,838 | 6.9%).
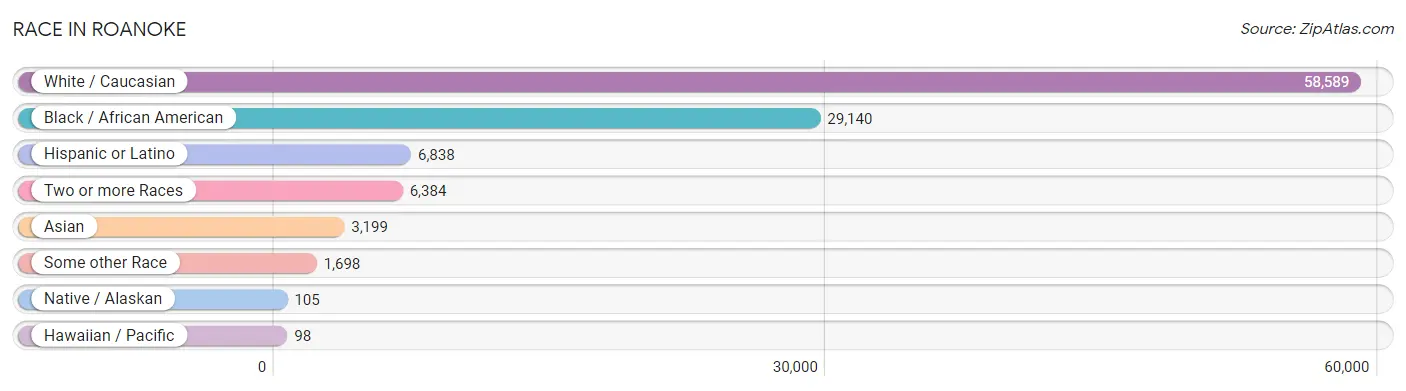
| Race | # Population | % Population |
| Asian | 3,199 | 3.2% |
| Black / African American | 29,140 | 29.4% |
| Hawaiian / Pacific | 98 | 0.1% |
| Hispanic or Latino | 6,838 | 6.9% |
| Native / Alaskan | 105 | 0.1% |
| White / Caucasian | 58,589 | 59.1% |
| Two or more Races | 6,384 | 6.4% |
| Some other Race | 1,698 | 1.7% |
| Total | 99,213 | 100.0% |
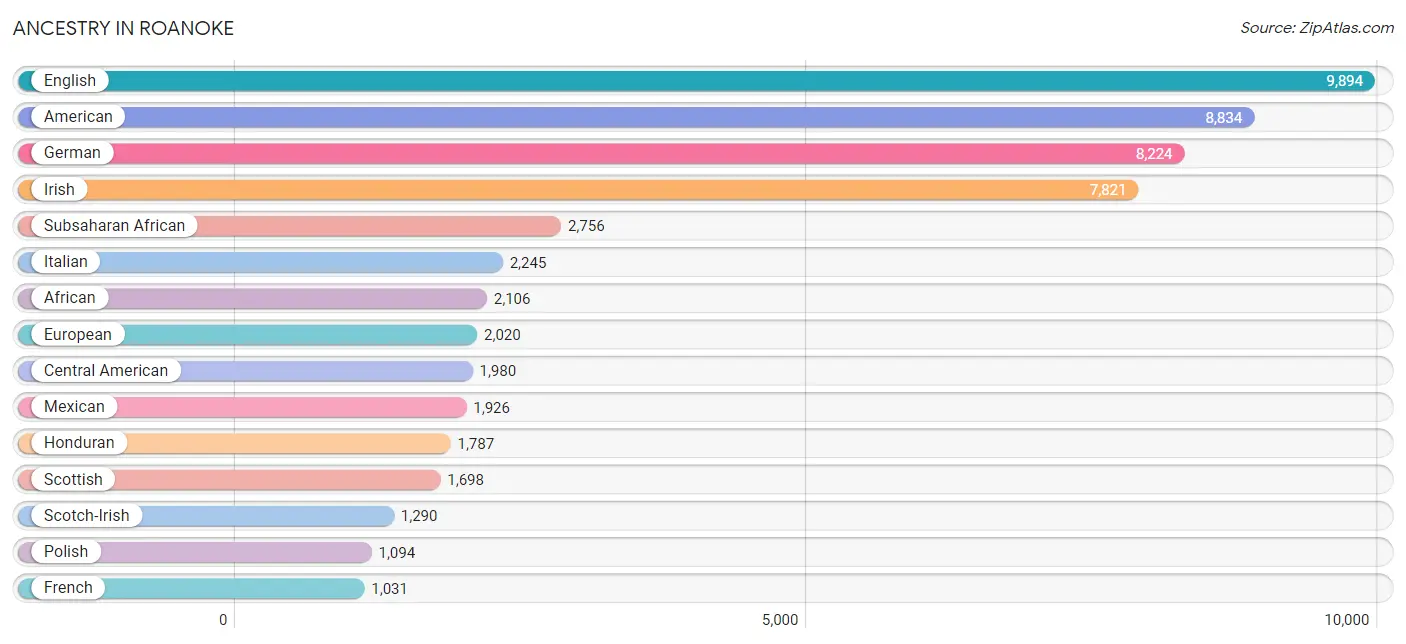
Ancestry in Roanoke
The most populous ancestries reported in Roanoke are English (9,894 | 10.0%), American (8,834 | 8.9%), German (8,224 | 8.3%), Irish (7,821 | 7.9%), and Subsaharan African (2,756 | 2.8%), together accounting for 37.8% of all Roanoke residents.
| Ancestry | # Population | % Population |
| Afghan | 732 | 0.7% |
| African | 2,106 | 2.1% |
| American | 8,834 | 8.9% |
| Arab | 520 | 0.5% |
| Argentinean | 56 | 0.1% |
| Armenian | 44 | 0.0% |
| Australian | 17 | 0.0% |
| Austrian | 123 | 0.1% |
| Belgian | 13 | 0.0% |
| Bermudan | 15 | 0.0% |
| Bhutanese | 442 | 0.4% |
| Blackfeet | 21 | 0.0% |
| Brazilian | 28 | 0.0% |
| British | 507 | 0.5% |
| Burmese | 252 | 0.3% |
| Cajun | 16 | 0.0% |
| Canadian | 117 | 0.1% |
| Celtic | 63 | 0.1% |
| Central American | 1,980 | 2.0% |
| Cherokee | 524 | 0.5% |
| Chilean | 67 | 0.1% |
| Choctaw | 12 | 0.0% |
| Colombian | 251 | 0.3% |
| Costa Rican | 36 | 0.0% |
| Creek | 2 | 0.0% |
| Croatian | 12 | 0.0% |
| Cuban | 573 | 0.6% |
| Czech | 126 | 0.1% |
| Czechoslovakian | 8 | 0.0% |
| Danish | 192 | 0.2% |
| Delaware | 8 | 0.0% |
| Dominican | 301 | 0.3% |
| Dutch | 784 | 0.8% |
| Eastern European | 99 | 0.1% |
| Ecuadorian | 109 | 0.1% |
| Egyptian | 37 | 0.0% |
| English | 9,894 | 10.0% |
| Ethiopian | 42 | 0.0% |
| European | 2,020 | 2.0% |
| Filipino | 13 | 0.0% |
| Finnish | 14 | 0.0% |
| French | 1,031 | 1.0% |
| French Canadian | 224 | 0.2% |
| German | 8,224 | 8.3% |
| Ghanaian | 83 | 0.1% |
| Greek | 145 | 0.2% |
| Guatemalan | 41 | 0.0% |
| Haitian | 124 | 0.1% |
| Honduran | 1,787 | 1.8% |
| Hungarian | 91 | 0.1% |
| Indian (Asian) | 140 | 0.1% |
| Iranian | 10 | 0.0% |
| Iraqi | 68 | 0.1% |
| Irish | 7,821 | 7.9% |
| Iroquois | 23 | 0.0% |
| Israeli | 6 | 0.0% |
| Italian | 2,245 | 2.3% |
| Jamaican | 161 | 0.2% |
| Japanese | 28 | 0.0% |
| Kenyan | 9 | 0.0% |
| Korean | 642 | 0.6% |
| Latvian | 18 | 0.0% |
| Lebanese | 267 | 0.3% |
| Lithuanian | 45 | 0.1% |
| Lumbee | 3 | 0.0% |
| Mexican | 1,926 | 1.9% |
| Moroccan | 2 | 0.0% |
| Native Hawaiian | 76 | 0.1% |
| Nicaraguan | 53 | 0.1% |
| Nigerian | 156 | 0.2% |
| Northern European | 53 | 0.1% |
| Norwegian | 245 | 0.3% |
| Pakistani | 38 | 0.0% |
| Palestinian | 29 | 0.0% |
| Panamanian | 37 | 0.0% |
| Peruvian | 50 | 0.1% |
| Polish | 1,094 | 1.1% |
| Portuguese | 43 | 0.0% |
| Puerto Rican | 834 | 0.8% |
| Romanian | 75 | 0.1% |
| Russian | 359 | 0.4% |
| Salvadoran | 26 | 0.0% |
| Scandinavian | 275 | 0.3% |
| Scotch-Irish | 1,290 | 1.3% |
| Scottish | 1,698 | 1.7% |
| Serbian | 15 | 0.0% |
| Sierra Leonean | 72 | 0.1% |
| Slavic | 14 | 0.0% |
| Slovak | 61 | 0.1% |
| Somali | 65 | 0.1% |
| South African | 30 | 0.0% |
| South American | 695 | 0.7% |
| Spaniard | 111 | 0.1% |
| Spanish | 280 | 0.3% |
| Sri Lankan | 230 | 0.2% |
| Subsaharan African | 2,756 | 2.8% |
| Sudanese | 13 | 0.0% |
| Swedish | 307 | 0.3% |
| Swiss | 106 | 0.1% |
| Syrian | 37 | 0.0% |
| Thai | 301 | 0.3% |
| Turkish | 7 | 0.0% |
| U.S. Virgin Islander | 8 | 0.0% |
| Ukrainian | 39 | 0.0% |
| Venezuelan | 65 | 0.1% |
| Welsh | 493 | 0.5% |
| West Indian | 4 | 0.0% |
| Yakama | 26 | 0.0% |
| Yugoslavian | 45 | 0.1% | View All 109 Rows |
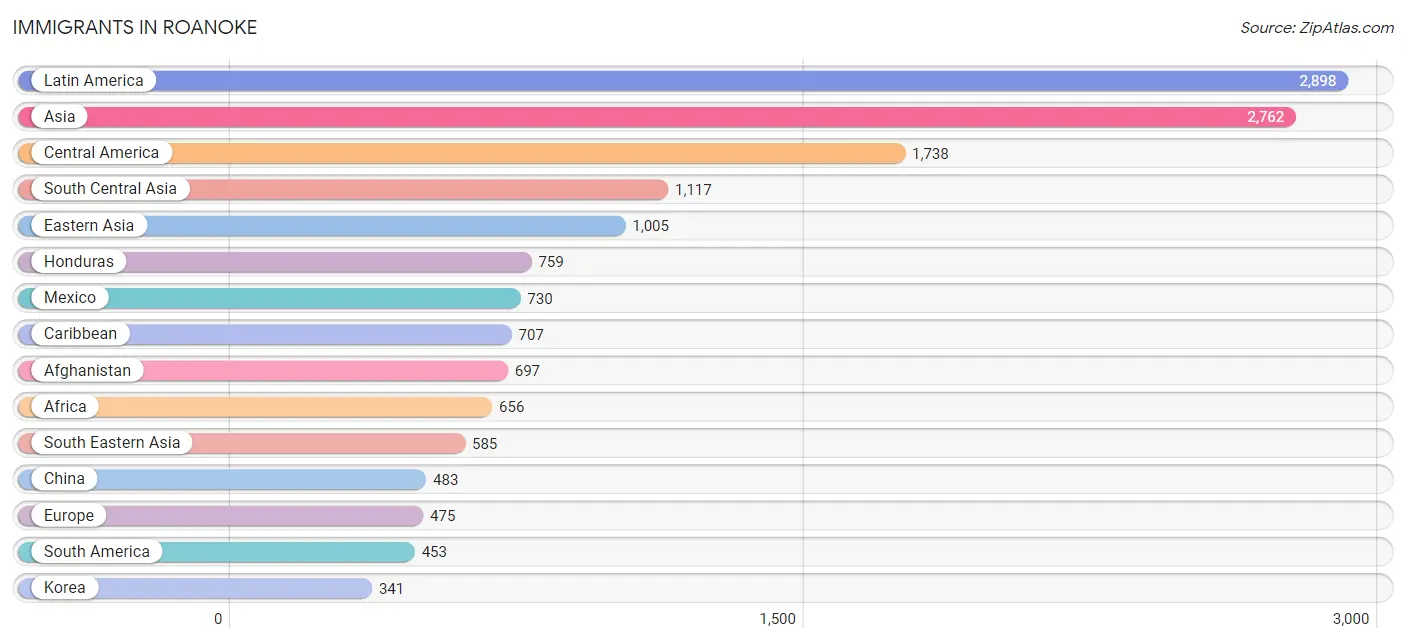
Immigrants in Roanoke
The most numerous immigrant groups reported in Roanoke came from Latin America (2,898 | 2.9%), Asia (2,762 | 2.8%), Central America (1,738 | 1.8%), South Central Asia (1,117 | 1.1%), and Eastern Asia (1,005 | 1.0%), together accounting for 9.6% of all Roanoke residents.
| Immigration Origin | # Population | % Population |
| Afghanistan | 697 | 0.7% |
| Africa | 656 | 0.7% |
| Argentina | 15 | 0.0% |
| Asia | 2,762 | 2.8% |
| Bolivia | 34 | 0.0% |
| Bosnia and Herzegovina | 42 | 0.0% |
| Brazil | 11 | 0.0% |
| Cameroon | 5 | 0.0% |
| Canada | 82 | 0.1% |
| Caribbean | 707 | 0.7% |
| Central America | 1,738 | 1.8% |
| Chile | 29 | 0.0% |
| China | 483 | 0.5% |
| Colombia | 160 | 0.2% |
| Congo | 256 | 0.3% |
| Cuba | 256 | 0.3% |
| Denmark | 23 | 0.0% |
| Dominican Republic | 257 | 0.3% |
| Eastern Africa | 74 | 0.1% |
| Eastern Asia | 1,005 | 1.0% |
| Eastern Europe | 109 | 0.1% |
| Ecuador | 78 | 0.1% |
| El Salvador | 22 | 0.0% |
| England | 31 | 0.0% |
| Ethiopia | 41 | 0.0% |
| Europe | 475 | 0.5% |
| France | 21 | 0.0% |
| Germany | 111 | 0.1% |
| Ghana | 83 | 0.1% |
| Greece | 29 | 0.0% |
| Guatemala | 174 | 0.2% |
| Guyana | 35 | 0.0% |
| Haiti | 124 | 0.1% |
| Honduras | 759 | 0.8% |
| Hong Kong | 26 | 0.0% |
| India | 154 | 0.2% |
| Indonesia | 2 | 0.0% |
| Iran | 71 | 0.1% |
| Iraq | 21 | 0.0% |
| Italy | 27 | 0.0% |
| Jamaica | 56 | 0.1% |
| Japan | 181 | 0.2% |
| Kenya | 17 | 0.0% |
| Korea | 341 | 0.3% |
| Kuwait | 5 | 0.0% |
| Latin America | 2,898 | 2.9% |
| Lebanon | 15 | 0.0% |
| Mexico | 730 | 0.7% |
| Middle Africa | 283 | 0.3% |
| Nepal | 9 | 0.0% |
| Netherlands | 75 | 0.1% |
| Nicaragua | 53 | 0.1% |
| Nigeria | 7 | 0.0% |
| Northern Africa | 25 | 0.0% |
| Northern Europe | 90 | 0.1% |
| Pakistan | 172 | 0.2% |
| Peru | 26 | 0.0% |
| Philippines | 279 | 0.3% |
| Romania | 43 | 0.0% |
| Russia | 18 | 0.0% |
| Sierra Leone | 154 | 0.2% |
| Somalia | 16 | 0.0% |
| South Africa | 30 | 0.0% |
| South America | 453 | 0.5% |
| South Central Asia | 1,117 | 1.1% |
| South Eastern Asia | 585 | 0.6% |
| Southern Europe | 69 | 0.1% |
| Spain | 13 | 0.0% |
| Sudan | 4 | 0.0% |
| Thailand | 38 | 0.0% |
| Trinidad and Tobago | 14 | 0.0% |
| Turkey | 7 | 0.0% |
| Ukraine | 6 | 0.0% |
| Venezuela | 65 | 0.1% |
| Vietnam | 266 | 0.3% |
| Western Africa | 244 | 0.3% |
| Western Asia | 55 | 0.1% |
| Western Europe | 207 | 0.2% |
| Zaire | 22 | 0.0% | View All 79 Rows |
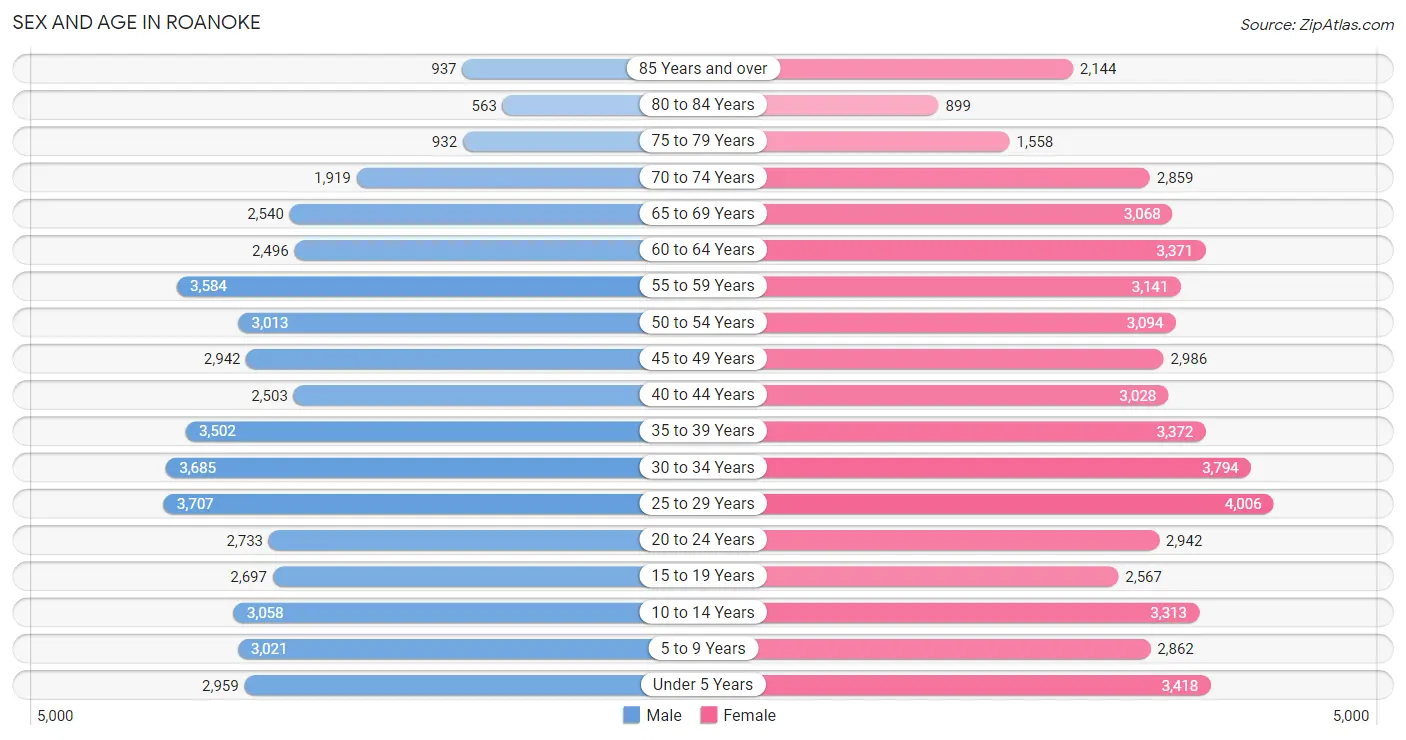
Sex and Age in Roanoke
Sex and Age in Roanoke
The most populous age groups in Roanoke are 25 to 29 Years (3,707 | 7.9%) for men and 25 to 29 Years (4,006 | 7.6%) for women.
| Age Bracket | Male | Female |
| Under 5 Years | 2,959 (6.3%) | 3,418 (6.5%) |
| 5 to 9 Years | 3,021 (6.5%) | 2,862 (5.5%) |
| 10 to 14 Years | 3,058 (6.5%) | 3,313 (6.3%) |
| 15 to 19 Years | 2,697 (5.8%) | 2,567 (4.9%) |
| 20 to 24 Years | 2,733 (5.8%) | 2,942 (5.6%) |
| 25 to 29 Years | 3,707 (7.9%) | 4,006 (7.6%) |
| 30 to 34 Years | 3,685 (7.9%) | 3,794 (7.2%) |
| 35 to 39 Years | 3,502 (7.5%) | 3,372 (6.4%) |
| 40 to 44 Years | 2,503 (5.3%) | 3,028 (5.8%) |
| 45 to 49 Years | 2,942 (6.3%) | 2,986 (5.7%) |
| 50 to 54 Years | 3,013 (6.4%) | 3,094 (5.9%) |
| 55 to 59 Years | 3,584 (7.7%) | 3,141 (6.0%) |
| 60 to 64 Years | 2,496 (5.3%) | 3,371 (6.4%) |
| 65 to 69 Years | 2,540 (5.4%) | 3,068 (5.9%) |
| 70 to 74 Years | 1,919 (4.1%) | 2,859 (5.4%) |
| 75 to 79 Years | 932 (2.0%) | 1,558 (3.0%) |
| 80 to 84 Years | 563 (1.2%) | 899 (1.7%) |
| 85 Years and over | 937 (2.0%) | 2,144 (4.1%) |
| Total | 46,791 (100.0%) | 52,422 (100.0%) |
Families and Households in Roanoke
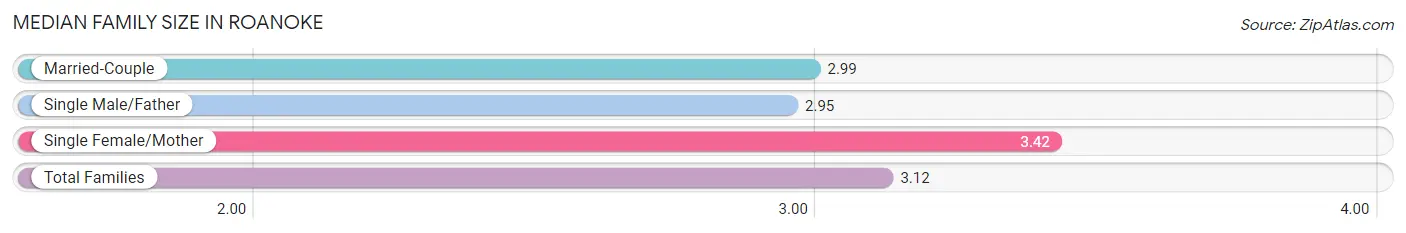
Median Family Size in Roanoke
The median family size in Roanoke is 3.12 persons per family, with single female/mother families (7,140 | 32.4%) accounting for the largest median family size of 3.42 persons per family. On the other hand, single male/father families (2,177 | 9.9%) represent the smallest median family size with 2.95 persons per family.
| Family Type | # Families | Family Size |
| Married-Couple | 12,750 (57.8%) | 2.99 |
| Single Male/Father | 2,177 (9.9%) | 2.95 |
| Single Female/Mother | 7,140 (32.4%) | 3.42 |
| Total Families | 22,067 (100.0%) | 3.12 |
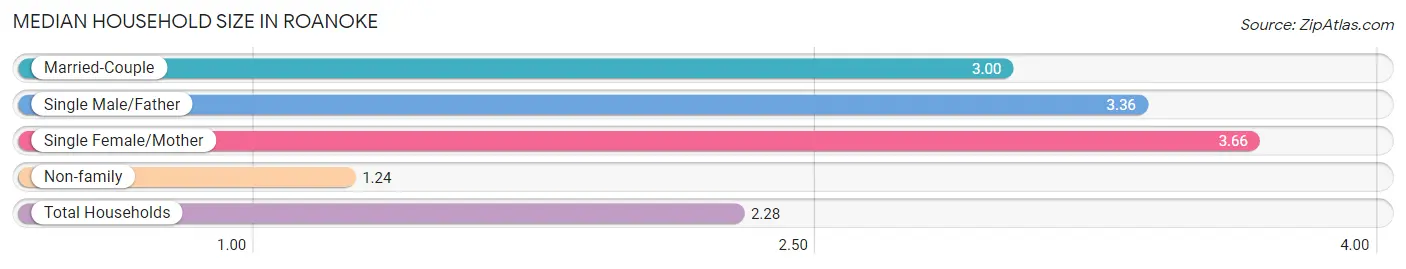
Median Household Size in Roanoke
The median household size in Roanoke is 2.28 persons per household, with single female/mother households (7,140 | 16.7%) accounting for the largest median household size of 3.66 persons per household. non-family households (20,739 | 48.4%) represent the smallest median household size with 1.24 persons per household.
| Household Type | # Households | Household Size |
| Married-Couple | 12,750 (29.8%) | 3.00 |
| Single Male/Father | 2,177 (5.1%) | 3.36 |
| Single Female/Mother | 7,140 (16.7%) | 3.66 |
| Non-family | 20,739 (48.4%) | 1.24 |
| Total Households | 42,806 (100.0%) | 2.28 |
Household Size by Marriage Status in Roanoke
Out of a total of 42,806 households in Roanoke, 22,067 (51.5%) are family households, while 20,739 (48.4%) are nonfamily households. The most numerous type of family households are 2-person households, comprising 11,076, and the most common type of nonfamily households are 1-person households, comprising 16,715.
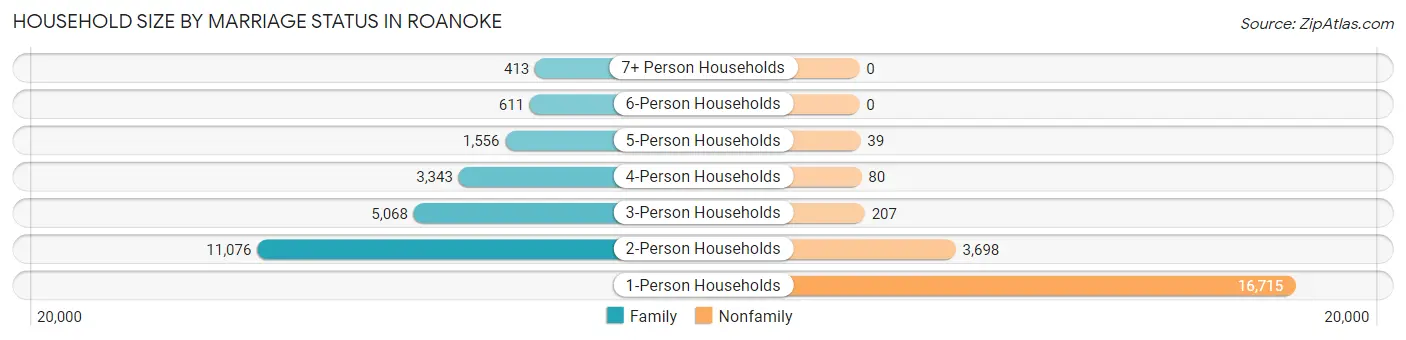
| Household Size | Family Households | Nonfamily Households |
| 1-Person Households | - | 16,715 (39.1%) |
| 2-Person Households | 11,076 (25.9%) | 3,698 (8.6%) |
| 3-Person Households | 5,068 (11.8%) | 207 (0.5%) |
| 4-Person Households | 3,343 (7.8%) | 80 (0.2%) |
| 5-Person Households | 1,556 (3.6%) | 39 (0.1%) |
| 6-Person Households | 611 (1.4%) | 0 (0.0%) |
| 7+ Person Households | 413 (1.0%) | 0 (0.0%) |
| Total | 22,067 (51.5%) | 20,739 (48.4%) |
Female Fertility in Roanoke
Fertility by Age in Roanoke
Average fertility rate in Roanoke is 43.0 births per 1,000 women. Women in the age bracket of 20 to 34 years have the highest fertility rate with 69.0 births per 1,000 women. Women in the age bracket of 20 to 34 years acount for 74.1% of all women with births.
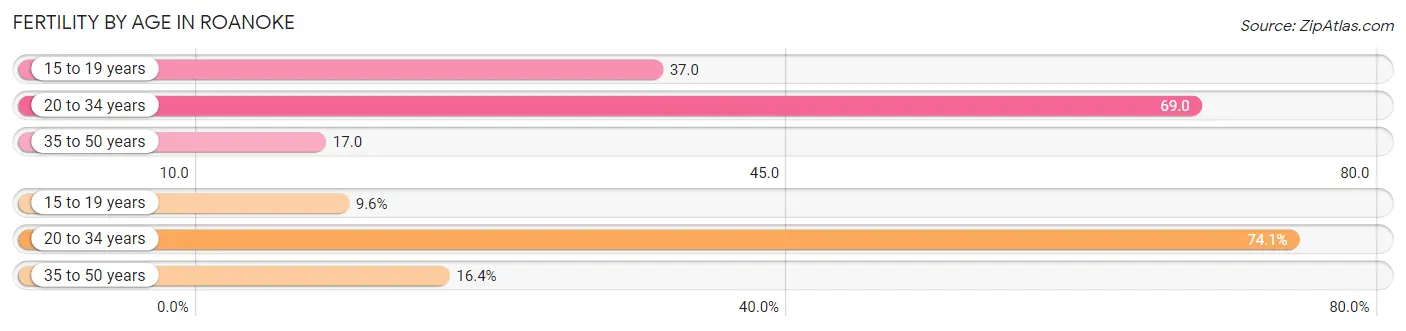
| Age Bracket | Women with Births | Births / 1,000 Women |
| 15 to 19 years | 95 (9.6%) | 37.0 |
| 20 to 34 years | 737 (74.1%) | 69.0 |
| 35 to 50 years | 163 (16.4%) | 17.0 |
| Total | 995 (100.0%) | 43.0 |
Fertility by Age by Marriage Status in Roanoke
50.5% of women with births (995) in Roanoke are married. The highest percentage of unmarried women with births falls into 15 to 19 years age bracket with 100.0% of them unmarried at the time of birth, while the lowest percentage of unmarried women with births belong to 20 to 34 years age bracket with 42.7% of them unmarried.
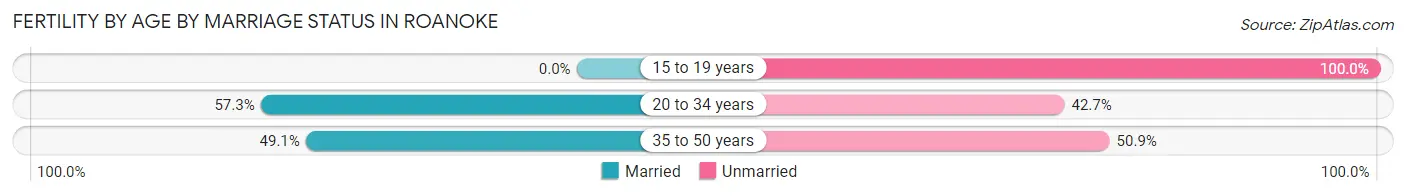
| Age Bracket | Married | Unmarried |
| 15 to 19 years | 0 (0.0%) | 95 (100.0%) |
| 20 to 34 years | 422 (57.3%) | 315 (42.7%) |
| 35 to 50 years | 80 (49.1%) | 83 (50.9%) |
| Total | 502 (50.4%) | 493 (49.5%) |
Fertility by Education in Roanoke
Average fertility rate in Roanoke is 43.0 births per 1,000 women. Women with the education attainment of college or associate's degree have the highest fertility rate of 55.0 births per 1,000 women, while women with the education attainment of bachelor's degree have the lowest fertility at 33.0 births per 1,000 women. Women with the education attainment of college or associate's degree represent 34.8% of all women with births.
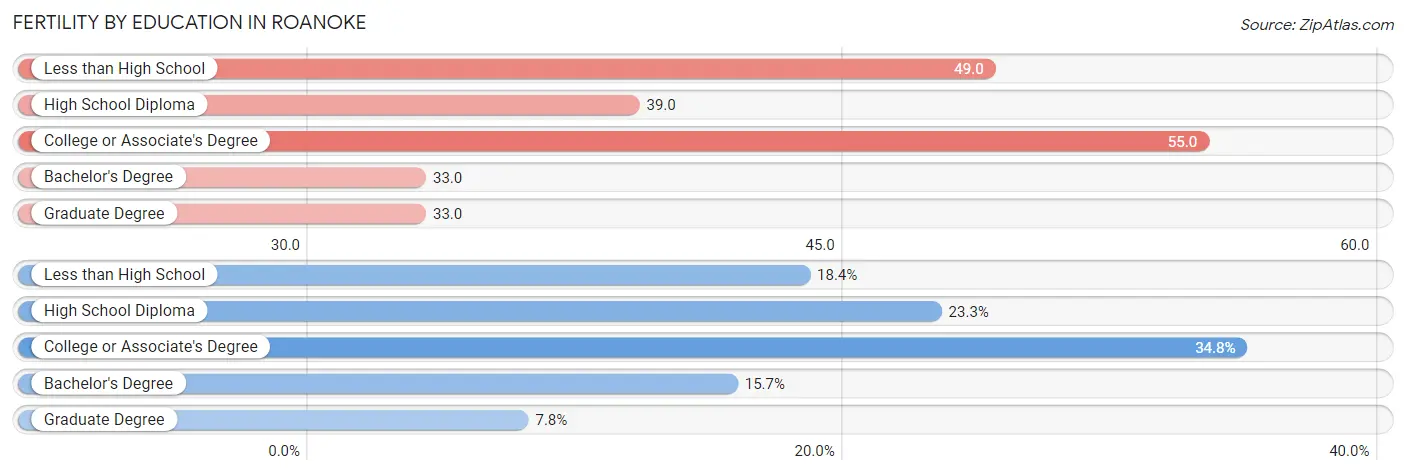
| Educational Attainment | Women with Births | Births / 1,000 Women |
| Less than High School | 183 (18.4%) | 49.0 |
| High School Diploma | 232 (23.3%) | 39.0 |
| College or Associate's Degree | 346 (34.8%) | 55.0 |
| Bachelor's Degree | 156 (15.7%) | 33.0 |
| Graduate Degree | 78 (7.8%) | 33.0 |
| Total | 995 (100.0%) | 43.0 |
Fertility by Education by Marriage Status in Roanoke
49.5% of women with births in Roanoke are unmarried. Women with the educational attainment of graduate degree are most likely to be married with 100.0% of them married at childbirth, while women with the educational attainment of high school diploma are least likely to be married with 77.2% of them unmarried at childbirth.
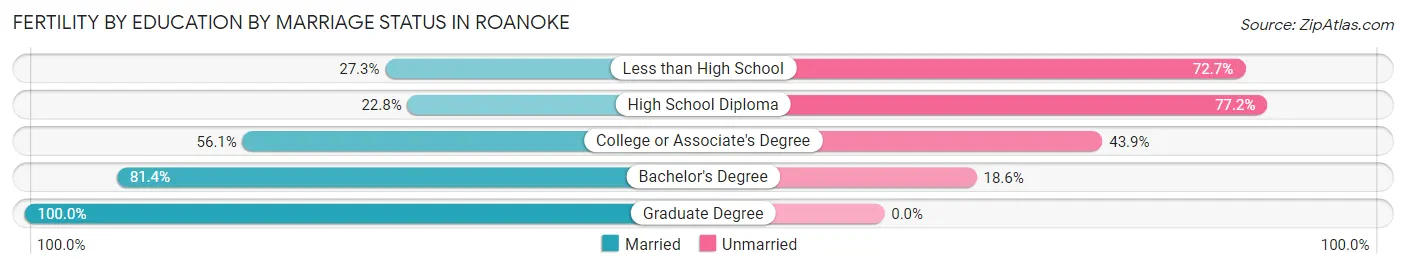
| Educational Attainment | Married | Unmarried |
| Less than High School | 50 (27.3%) | 133 (72.7%) |
| High School Diploma | 53 (22.8%) | 179 (77.2%) |
| College or Associate's Degree | 194 (56.1%) | 152 (43.9%) |
| Bachelor's Degree | 127 (81.4%) | 29 (18.6%) |
| Graduate Degree | 78 (100.0%) | 0 (0.0%) |
| Total | 502 (50.4%) | 493 (49.5%) |
Employment Characteristics in Roanoke
Employment by Class of Employer in Roanoke
Among the 46,368 employed individuals in Roanoke, private company employees (32,087 | 69.2%), not-for-profit organizations (5,547 | 12.0%), and local government employees (2,640 | 5.7%) make up the most common classes of employment.
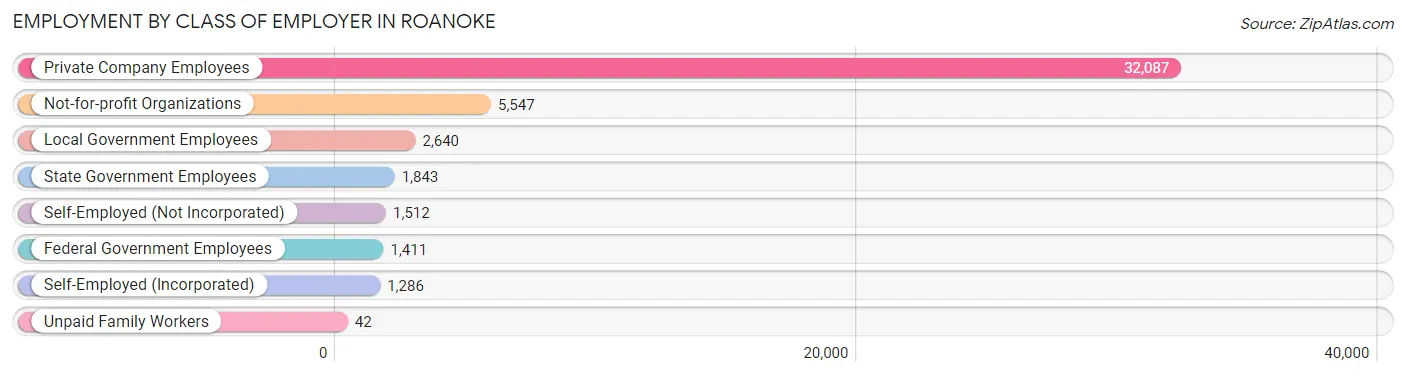
| Employer Class | # Employees | % Employees |
| Private Company Employees | 32,087 | 69.2% |
| Self-Employed (Incorporated) | 1,286 | 2.8% |
| Self-Employed (Not Incorporated) | 1,512 | 3.3% |
| Not-for-profit Organizations | 5,547 | 12.0% |
| Local Government Employees | 2,640 | 5.7% |
| State Government Employees | 1,843 | 4.0% |
| Federal Government Employees | 1,411 | 3.0% |
| Unpaid Family Workers | 42 | 0.1% |
| Total | 46,368 | 100.0% |
Employment Status by Age in Roanoke
According to the labor force statistics for Roanoke, out of the total population over 16 years of age (78,982), 63.8% or 50,391 individuals are in the labor force, with 6.6% or 3,326 of them unemployed. The age group with the highest labor force participation rate is 25 to 29 years, with 90.5% or 6,980 individuals in the labor force. Within the labor force, the 16 to 19 years age range has the highest percentage of unemployed individuals, with 20.9% or 316 of them being unemployed.
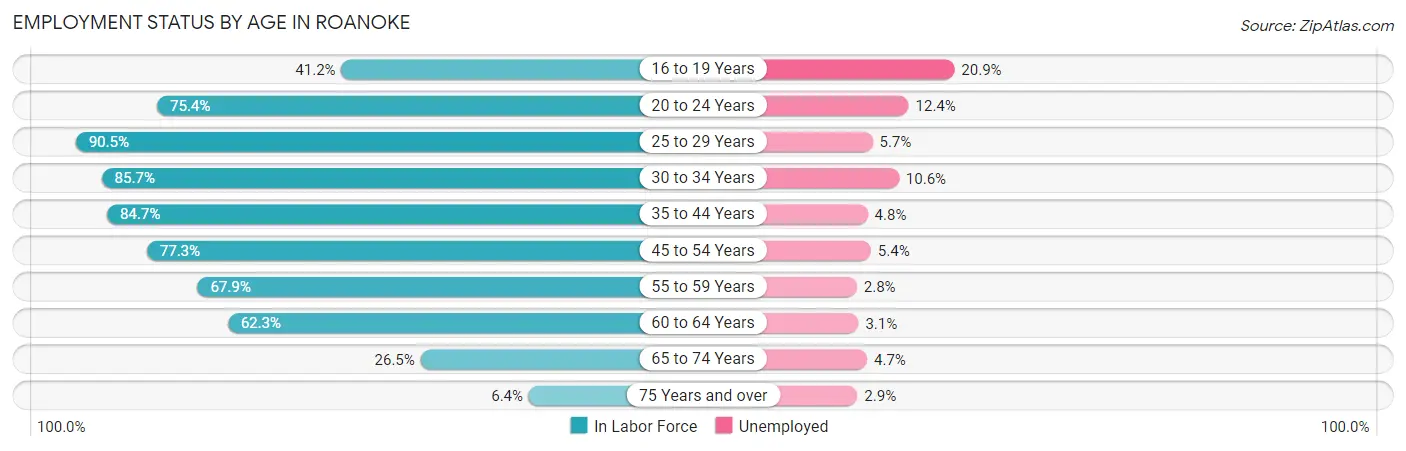
| Age Bracket | In Labor Force | Unemployed |
| 16 to 19 Years | 1,510 (41.2%) | 316 (20.9%) |
| 20 to 24 Years | 4,279 (75.4%) | 531 (12.4%) |
| 25 to 29 Years | 6,980 (90.5%) | 398 (5.7%) |
| 30 to 34 Years | 6,410 (85.7%) | 679 (10.6%) |
| 35 to 44 Years | 10,507 (84.7%) | 504 (4.8%) |
| 45 to 54 Years | 9,303 (77.3%) | 502 (5.4%) |
| 55 to 59 Years | 4,566 (67.9%) | 128 (2.8%) |
| 60 to 64 Years | 3,655 (62.3%) | 113 (3.1%) |
| 65 to 74 Years | 2,752 (26.5%) | 129 (4.7%) |
| 75 Years and over | 450 (6.4%) | 13 (2.9%) |
| Total | 50,391 (63.8%) | 3,326 (6.6%) |
Employment Status by Educational Attainment in Roanoke
According to labor force statistics for Roanoke, 79.3% of individuals (41,414) out of the total population between 25 and 64 years of age (52,224) are in the labor force, with 5.6% or 2,319 of them being unemployed. The group with the highest labor force participation rate are those with the educational attainment of bachelor's degree or higher, with 90.3% or 13,956 individuals in the labor force. Within the labor force, individuals with less than high school education have the highest percentage of unemployment, with 10.7% or 346 of them being unemployed.
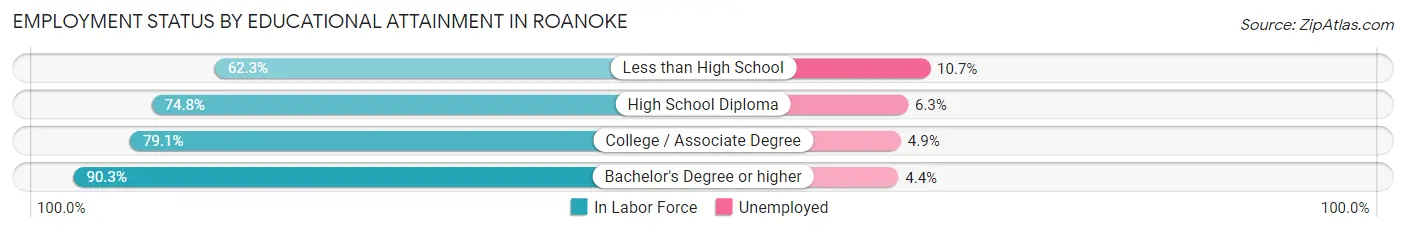
| Educational Attainment | In Labor Force | Unemployed |
| Less than High School | 3,233 (62.3%) | 555 (10.7%) |
| High School Diploma | 13,279 (74.8%) | 1,118 (6.3%) |
| College / Associate Degree | 10,937 (79.1%) | 678 (4.9%) |
| Bachelor's Degree or higher | 13,956 (90.3%) | 680 (4.4%) |
| Total | 41,414 (79.3%) | 2,925 (5.6%) |
Employment Occupations by Sex in Roanoke
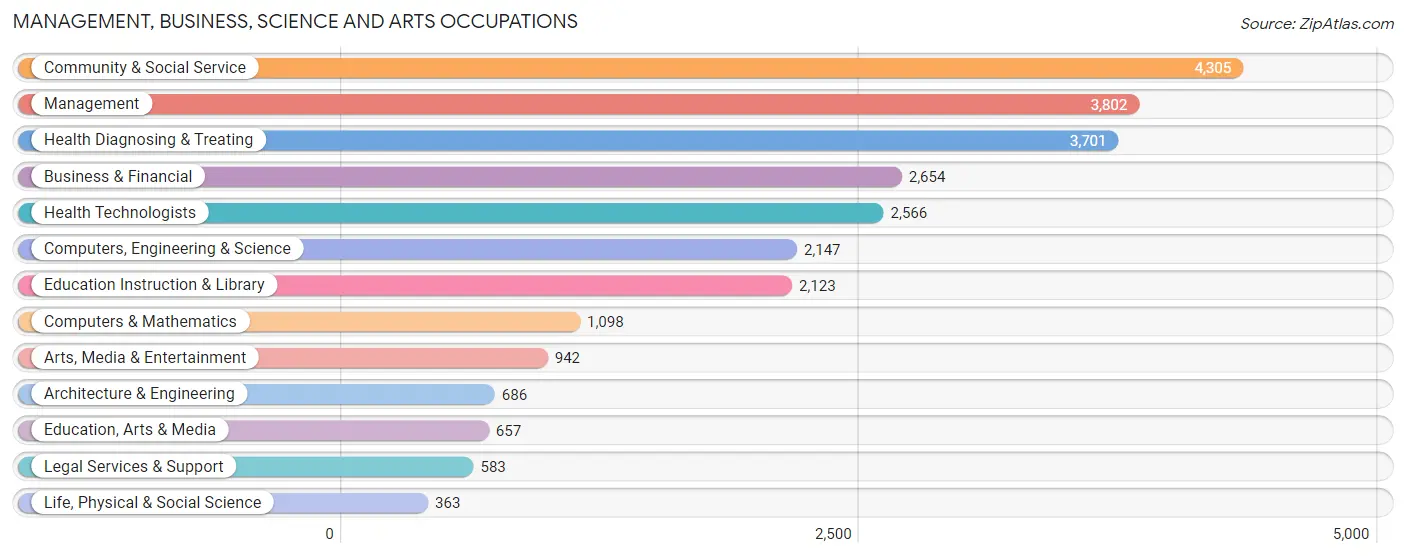
Management, Business, Science and Arts Occupations
The most common Management, Business, Science and Arts occupations in Roanoke are Community & Social Service (4,305 | 9.2%), Management (3,802 | 8.1%), Health Diagnosing & Treating (3,701 | 7.9%), Business & Financial (2,654 | 5.7%), and Health Technologists (2,566 | 5.5%).
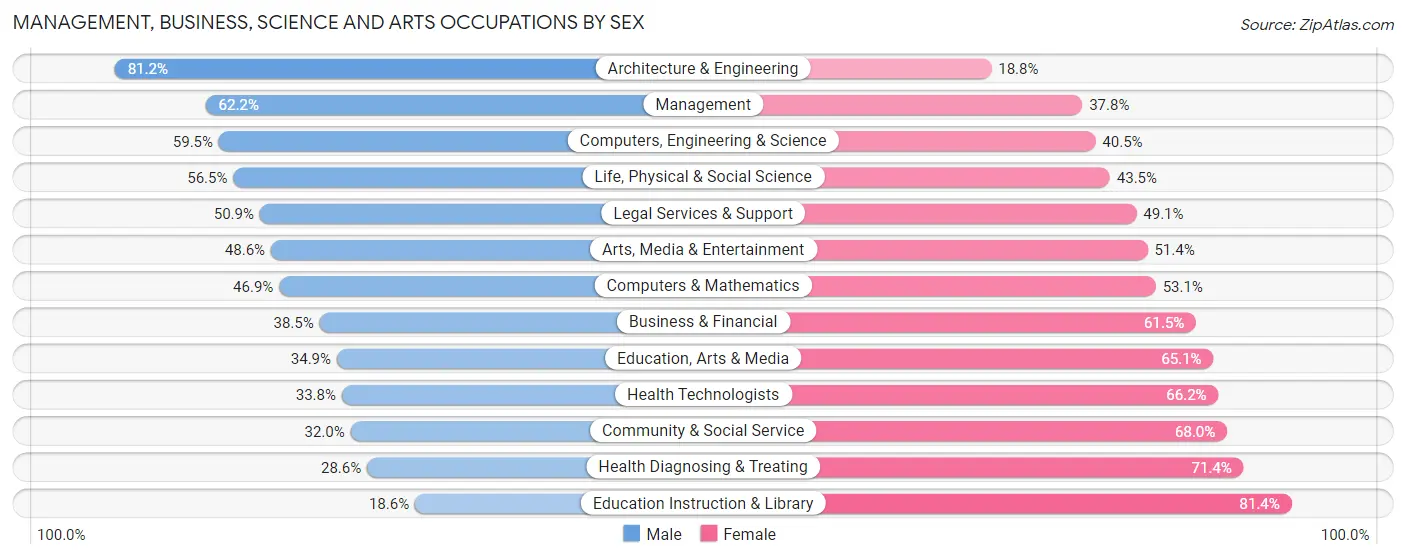
Management, Business, Science and Arts Occupations by Sex
Within the Management, Business, Science and Arts occupations in Roanoke, the most male-oriented occupations are Architecture & Engineering (81.2%), Management (62.2%), and Computers, Engineering & Science (59.5%), while the most female-oriented occupations are Education Instruction & Library (81.4%), Health Diagnosing & Treating (71.4%), and Community & Social Service (68.0%).
| Occupation | Male | Female |
| Management | 2,366 (62.2%) | 1,436 (37.8%) |
| Business & Financial | 1,021 (38.5%) | 1,633 (61.5%) |
| Computers, Engineering & Science | 1,277 (59.5%) | 870 (40.5%) |
| Computers & Mathematics | 515 (46.9%) | 583 (53.1%) |
| Architecture & Engineering | 557 (81.2%) | 129 (18.8%) |
| Life, Physical & Social Science | 205 (56.5%) | 158 (43.5%) |
| Community & Social Service | 1,378 (32.0%) | 2,927 (68.0%) |
| Education, Arts & Media | 229 (34.9%) | 428 (65.1%) |
| Legal Services & Support | 297 (50.9%) | 286 (49.1%) |
| Education Instruction & Library | 394 (18.6%) | 1,729 (81.4%) |
| Arts, Media & Entertainment | 458 (48.6%) | 484 (51.4%) |
| Health Diagnosing & Treating | 1,057 (28.6%) | 2,644 (71.4%) |
| Health Technologists | 868 (33.8%) | 1,698 (66.2%) |
| Total (Category) | 7,099 (42.7%) | 9,510 (57.3%) |
| Total (Overall) | 23,347 (49.7%) | 23,651 (50.3%) |
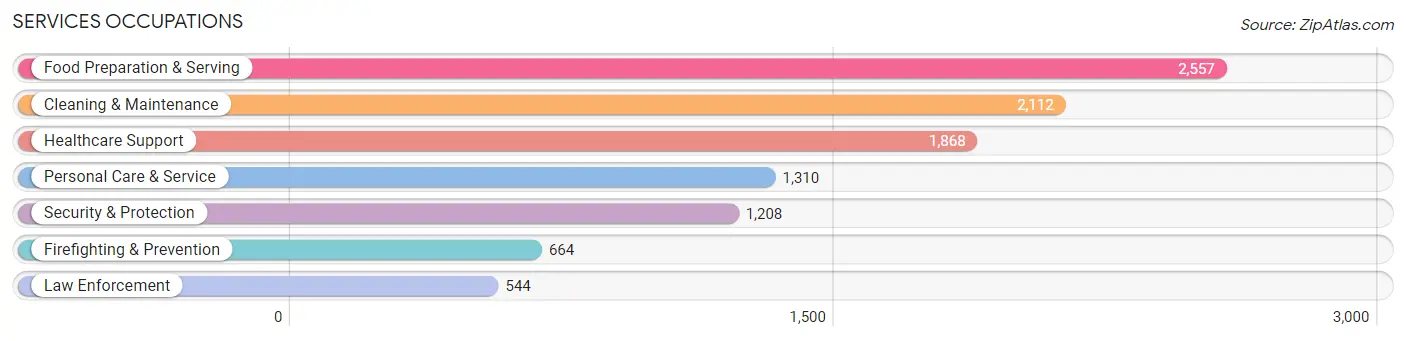
Services Occupations
The most common Services occupations in Roanoke are Food Preparation & Serving (2,557 | 5.4%), Cleaning & Maintenance (2,112 | 4.5%), Healthcare Support (1,868 | 4.0%), Personal Care & Service (1,310 | 2.8%), and Security & Protection (1,208 | 2.6%).
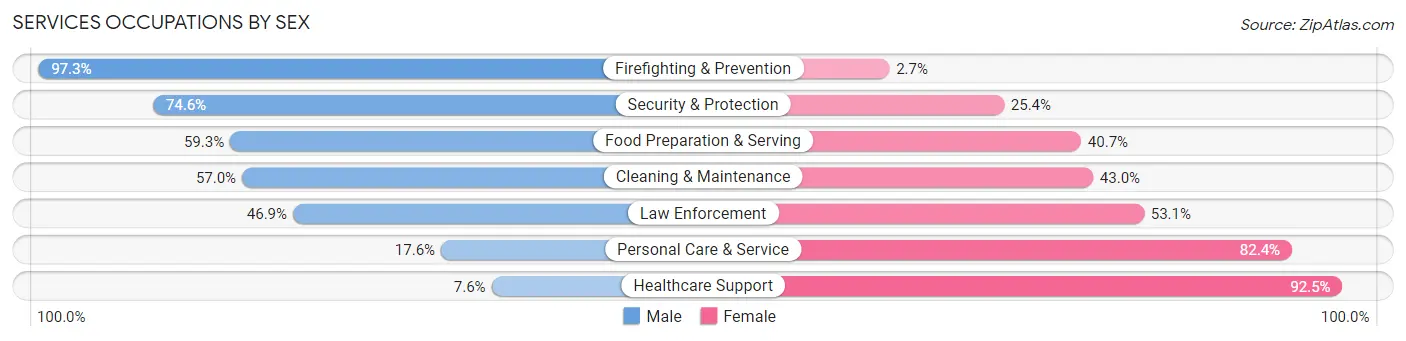
Services Occupations by Sex
Within the Services occupations in Roanoke, the most male-oriented occupations are Firefighting & Prevention (97.3%), Security & Protection (74.6%), and Food Preparation & Serving (59.3%), while the most female-oriented occupations are Healthcare Support (92.4%), Personal Care & Service (82.4%), and Law Enforcement (53.1%).
| Occupation | Male | Female |
| Healthcare Support | 141 (7.5%) | 1,727 (92.4%) |
| Security & Protection | 901 (74.6%) | 307 (25.4%) |
| Firefighting & Prevention | 646 (97.3%) | 18 (2.7%) |
| Law Enforcement | 255 (46.9%) | 289 (53.1%) |
| Food Preparation & Serving | 1,517 (59.3%) | 1,040 (40.7%) |
| Cleaning & Maintenance | 1,203 (57.0%) | 909 (43.0%) |
| Personal Care & Service | 230 (17.6%) | 1,080 (82.4%) |
| Total (Category) | 3,992 (44.1%) | 5,063 (55.9%) |
| Total (Overall) | 23,347 (49.7%) | 23,651 (50.3%) |
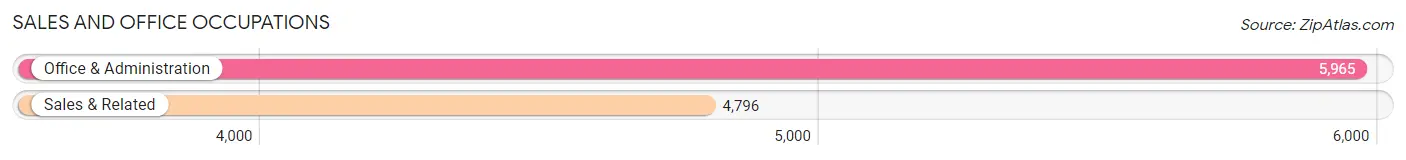
Sales and Office Occupations
The most common Sales and Office occupations in Roanoke are Office & Administration (5,965 | 12.7%), and Sales & Related (4,796 | 10.2%).
Sales and Office Occupations by Sex
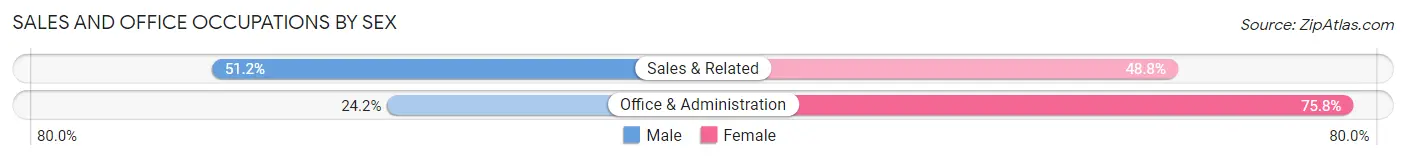
| Occupation | Male | Female |
| Sales & Related | 2,456 (51.2%) | 2,340 (48.8%) |
| Office & Administration | 1,444 (24.2%) | 4,521 (75.8%) |
| Total (Category) | 3,900 (36.2%) | 6,861 (63.8%) |
| Total (Overall) | 23,347 (49.7%) | 23,651 (50.3%) |
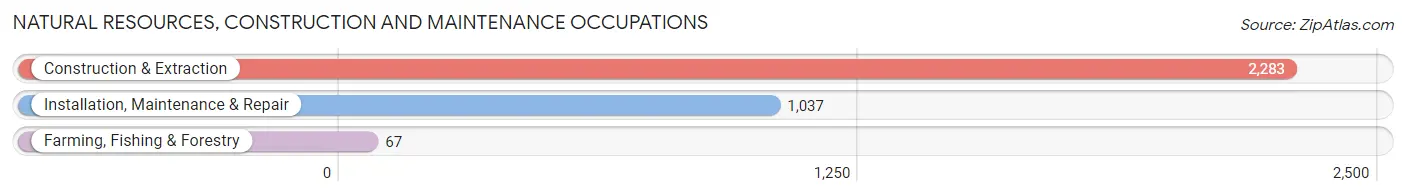
Natural Resources, Construction and Maintenance Occupations
The most common Natural Resources, Construction and Maintenance occupations in Roanoke are Construction & Extraction (2,283 | 4.9%), Installation, Maintenance & Repair (1,037 | 2.2%), and Farming, Fishing & Forestry (67 | 0.1%).
Natural Resources, Construction and Maintenance Occupations by Sex
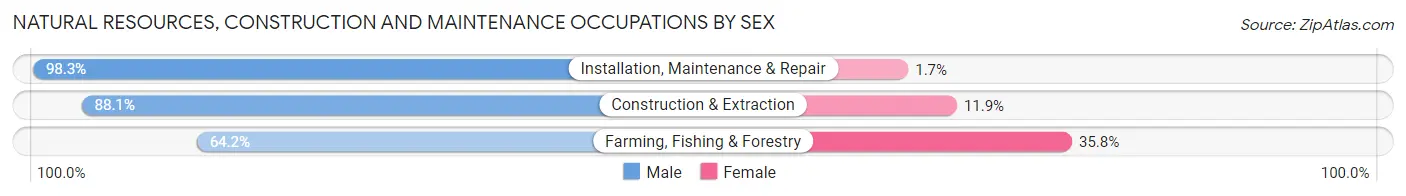
| Occupation | Male | Female |
| Farming, Fishing & Forestry | 43 (64.2%) | 24 (35.8%) |
| Construction & Extraction | 2,012 (88.1%) | 271 (11.9%) |
| Installation, Maintenance & Repair | 1,019 (98.3%) | 18 (1.7%) |
| Total (Category) | 3,074 (90.8%) | 313 (9.2%) |
| Total (Overall) | 23,347 (49.7%) | 23,651 (50.3%) |
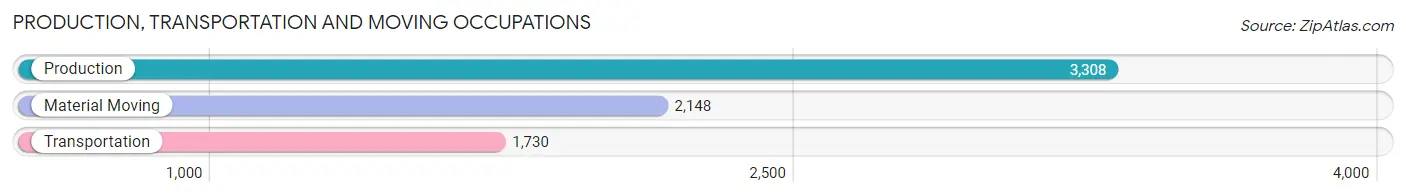
Production, Transportation and Moving Occupations
The most common Production, Transportation and Moving occupations in Roanoke are Production (3,308 | 7.0%), Material Moving (2,148 | 4.6%), and Transportation (1,730 | 3.7%).
Production, Transportation and Moving Occupations by Sex
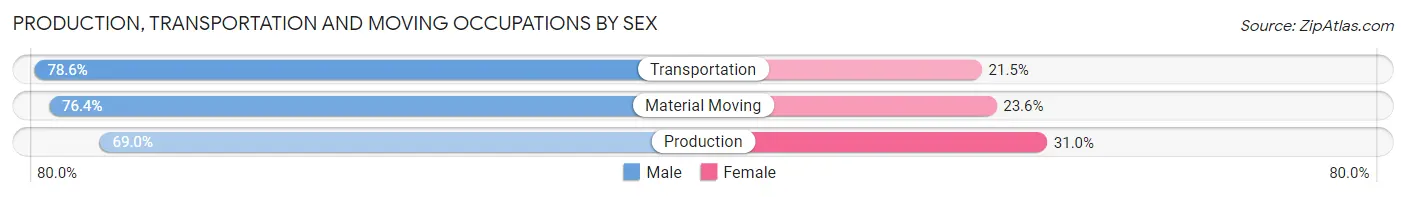
| Occupation | Male | Female |
| Production | 2,282 (69.0%) | 1,026 (31.0%) |
| Transportation | 1,359 (78.5%) | 371 (21.4%) |
| Material Moving | 1,641 (76.4%) | 507 (23.6%) |
| Total (Category) | 5,282 (73.5%) | 1,904 (26.5%) |
| Total (Overall) | 23,347 (49.7%) | 23,651 (50.3%) |
Employment Industries by Sex in Roanoke
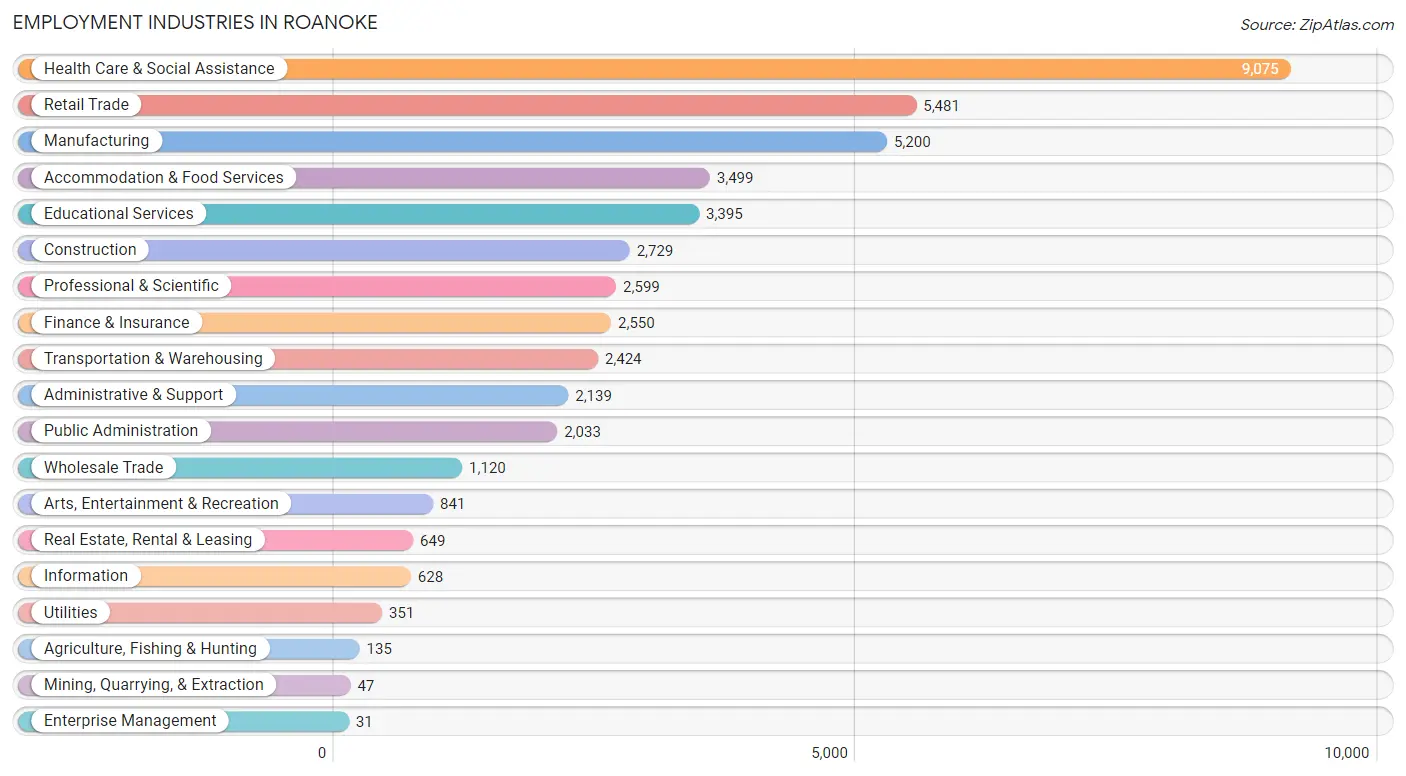
Employment Industries in Roanoke
The major employment industries in Roanoke include Health Care & Social Assistance (9,075 | 19.3%), Retail Trade (5,481 | 11.7%), Manufacturing (5,200 | 11.1%), Accommodation & Food Services (3,499 | 7.4%), and Educational Services (3,395 | 7.2%).
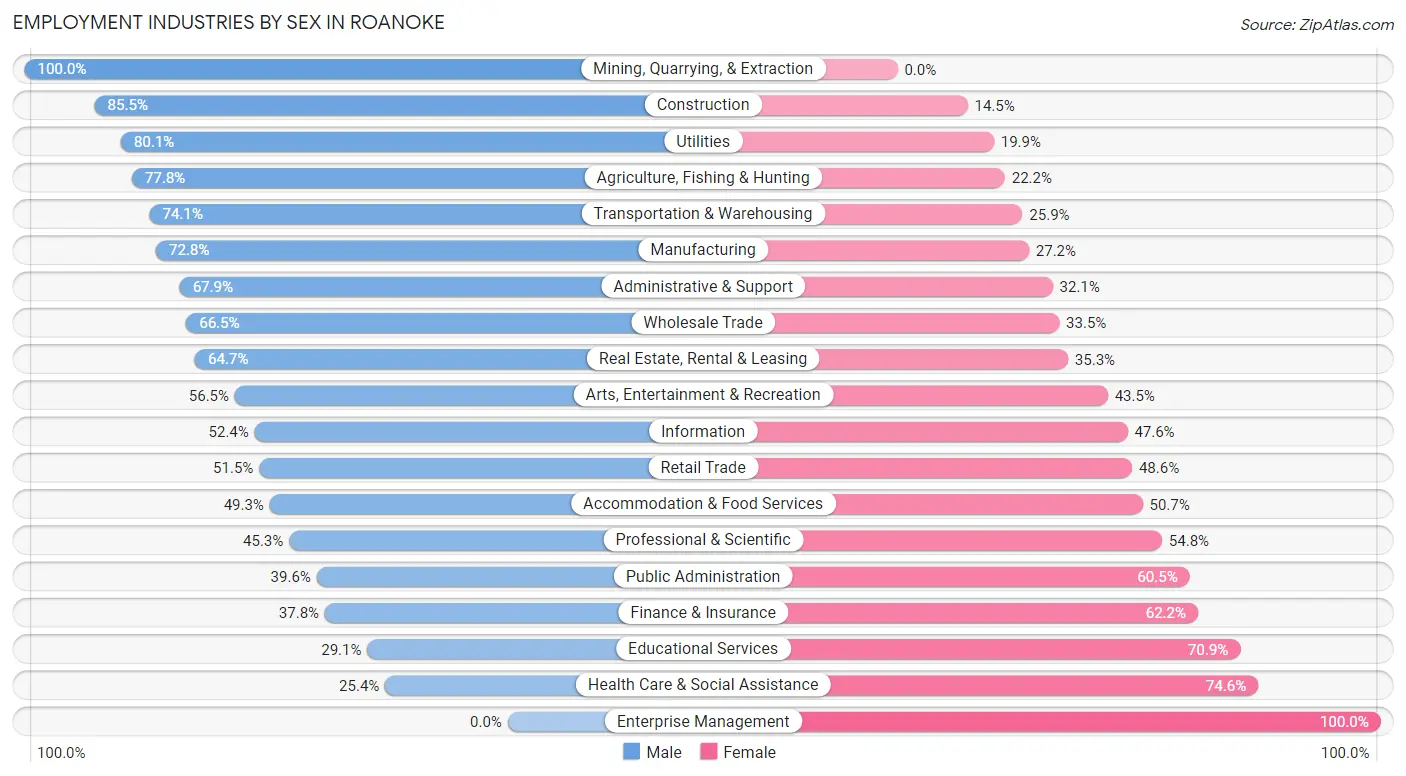
Employment Industries by Sex in Roanoke
The Roanoke industries that see more men than women are Mining, Quarrying, & Extraction (100.0%), Construction (85.5%), and Utilities (80.1%), whereas the industries that tend to have a higher number of women are Enterprise Management (100.0%), Health Care & Social Assistance (74.6%), and Educational Services (70.9%).
| Industry | Male | Female |
| Agriculture, Fishing & Hunting | 105 (77.8%) | 30 (22.2%) |
| Mining, Quarrying, & Extraction | 47 (100.0%) | 0 (0.0%) |
| Construction | 2,333 (85.5%) | 396 (14.5%) |
| Manufacturing | 3,785 (72.8%) | 1,415 (27.2%) |
| Wholesale Trade | 745 (66.5%) | 375 (33.5%) |
| Retail Trade | 2,820 (51.4%) | 2,661 (48.5%) |
| Transportation & Warehousing | 1,797 (74.1%) | 627 (25.9%) |
| Utilities | 281 (80.1%) | 70 (19.9%) |
| Information | 329 (52.4%) | 299 (47.6%) |
| Finance & Insurance | 965 (37.8%) | 1,585 (62.2%) |
| Real Estate, Rental & Leasing | 420 (64.7%) | 229 (35.3%) |
| Professional & Scientific | 1,176 (45.3%) | 1,423 (54.7%) |
| Enterprise Management | 0 (0.0%) | 31 (100.0%) |
| Administrative & Support | 1,452 (67.9%) | 687 (32.1%) |
| Educational Services | 987 (29.1%) | 2,408 (70.9%) |
| Health Care & Social Assistance | 2,302 (25.4%) | 6,773 (74.6%) |
| Arts, Entertainment & Recreation | 475 (56.5%) | 366 (43.5%) |
| Accommodation & Food Services | 1,724 (49.3%) | 1,775 (50.7%) |
| Public Administration | 804 (39.6%) | 1,229 (60.5%) |
| Total | 23,347 (49.7%) | 23,651 (50.3%) |
Education in Roanoke
School Enrollment in Roanoke
The most common levels of schooling among the 20,581 students in Roanoke are middle school (5,373 | 26.1%), high school (4,311 | 20.9%), and elementary school (4,281 | 20.8%).
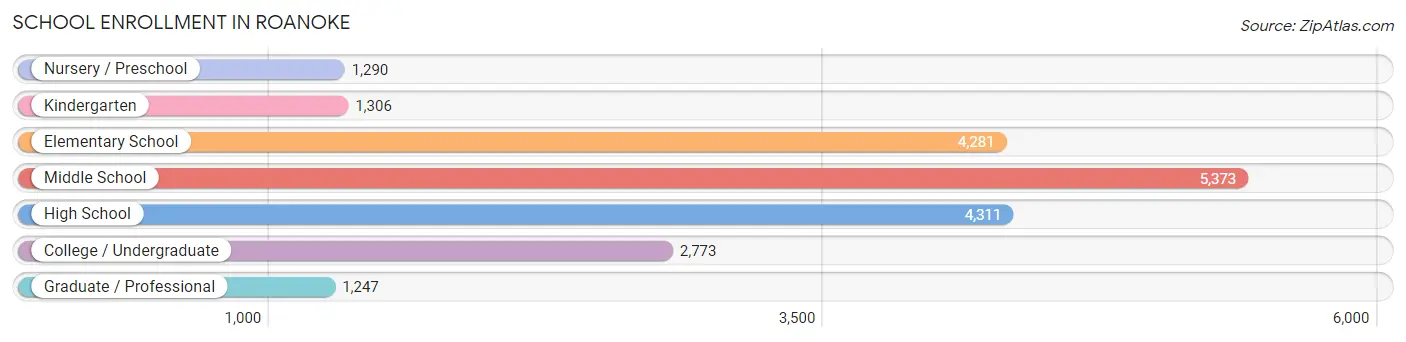
| School Level | # Students | % Students |
| Nursery / Preschool | 1,290 | 6.3% |
| Kindergarten | 1,306 | 6.4% |
| Elementary School | 4,281 | 20.8% |
| Middle School | 5,373 | 26.1% |
| High School | 4,311 | 20.9% |
| College / Undergraduate | 2,773 | 13.5% |
| Graduate / Professional | 1,247 | 6.1% |
| Total | 20,581 | 100.0% |
School Enrollment by Age by Funding Source in Roanoke
Out of a total of 20,581 students who are enrolled in schools in Roanoke, 3,128 (15.2%) attend a private institution, while the remaining 17,453 (84.8%) are enrolled in public schools. The age group of 3 to 4 year olds has the highest likelihood of being enrolled in private schools, with 283 (31.3% in the age bracket) enrolled. Conversely, the age group of 15 to 17 year olds has the lowest likelihood of being enrolled in a private school, with 2,897 (92.0% in the age bracket) attending a public institution.
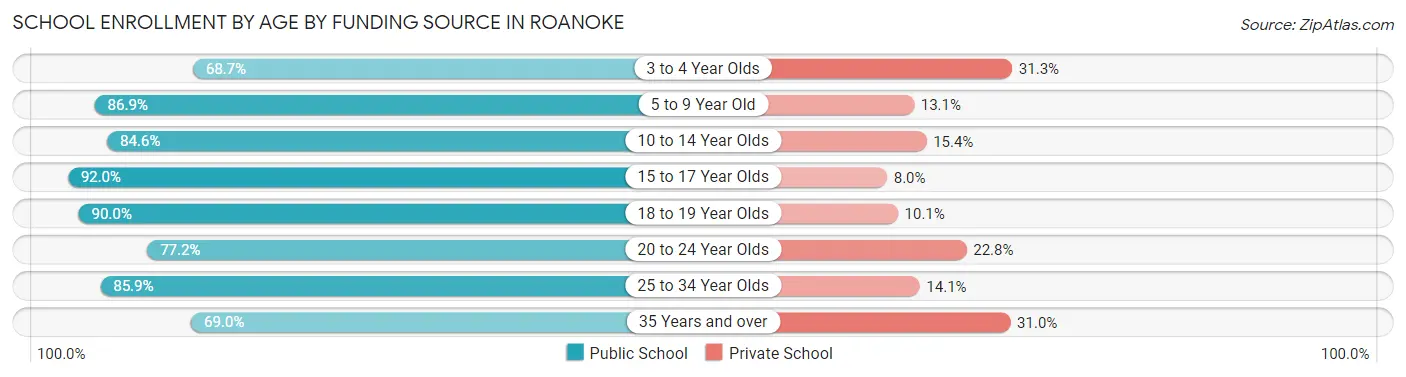
| Age Bracket | Public School | Private School |
| 3 to 4 Year Olds | 620 (68.7%) | 283 (31.3%) |
| 5 to 9 Year Old | 4,860 (86.9%) | 730 (13.1%) |
| 10 to 14 Year Olds | 5,116 (84.6%) | 929 (15.4%) |
| 15 to 17 Year Olds | 2,897 (92.0%) | 253 (8.0%) |
| 18 to 19 Year Olds | 958 (89.9%) | 107 (10.1%) |
| 20 to 24 Year Olds | 1,172 (77.2%) | 347 (22.8%) |
| 25 to 34 Year Olds | 1,230 (85.9%) | 202 (14.1%) |
| 35 Years and over | 605 (69.0%) | 272 (31.0%) |
| Total | 17,453 (84.8%) | 3,128 (15.2%) |
Educational Attainment by Field of Study in Roanoke
Business (3,883 | 18.2%), social sciences (2,279 | 10.7%), education (2,089 | 9.8%), science & technology (1,940 | 9.1%), and liberal arts & history (1,608 | 7.5%) are the most common fields of study among 21,387 individuals in Roanoke who have obtained a bachelor's degree or higher.
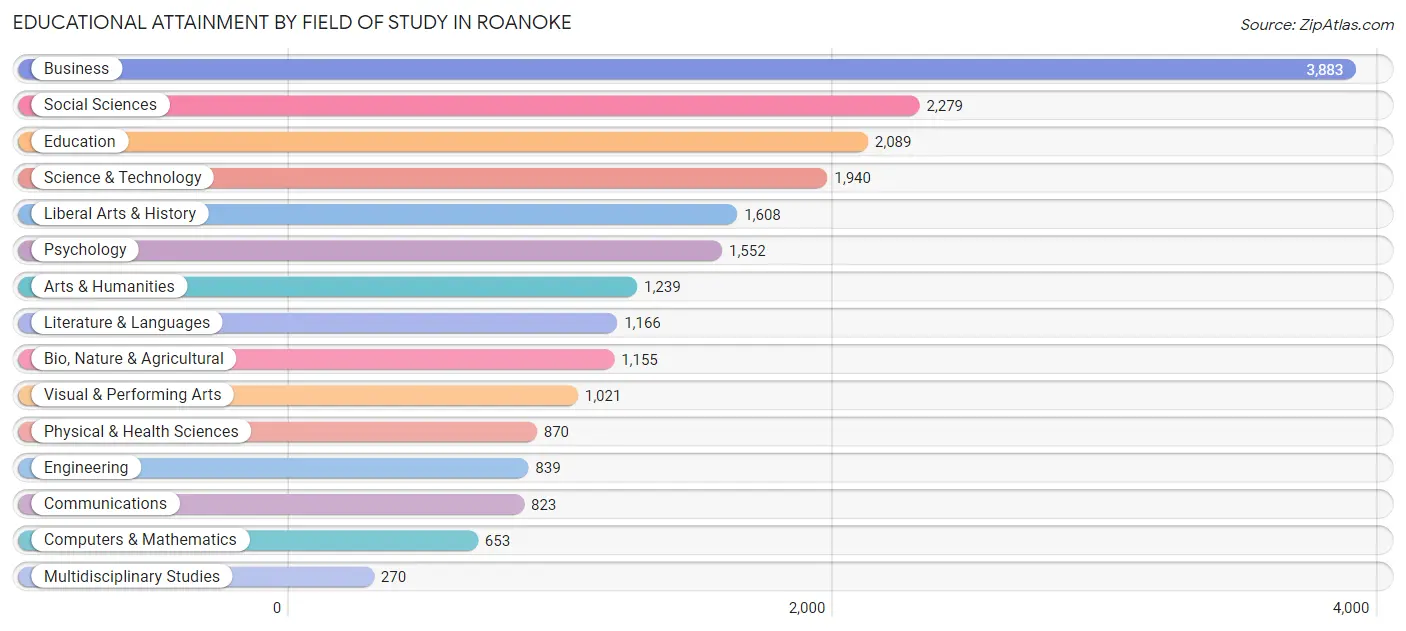
| Field of Study | # Graduates | % Graduates |
| Computers & Mathematics | 653 | 3.0% |
| Bio, Nature & Agricultural | 1,155 | 5.4% |
| Physical & Health Sciences | 870 | 4.1% |
| Psychology | 1,552 | 7.3% |
| Social Sciences | 2,279 | 10.7% |
| Engineering | 839 | 3.9% |
| Multidisciplinary Studies | 270 | 1.3% |
| Science & Technology | 1,940 | 9.1% |
| Business | 3,883 | 18.2% |
| Education | 2,089 | 9.8% |
| Literature & Languages | 1,166 | 5.4% |
| Liberal Arts & History | 1,608 | 7.5% |
| Visual & Performing Arts | 1,021 | 4.8% |
| Communications | 823 | 3.8% |
| Arts & Humanities | 1,239 | 5.8% |
| Total | 21,387 | 100.0% |
Transportation & Commute in Roanoke
Vehicle Availability by Sex in Roanoke
The most prevalent vehicle ownership categories in Roanoke are males with 2 vehicles (9,096, accounting for 39.5%) and females with 2 vehicles (8,554, making up 39.2%).
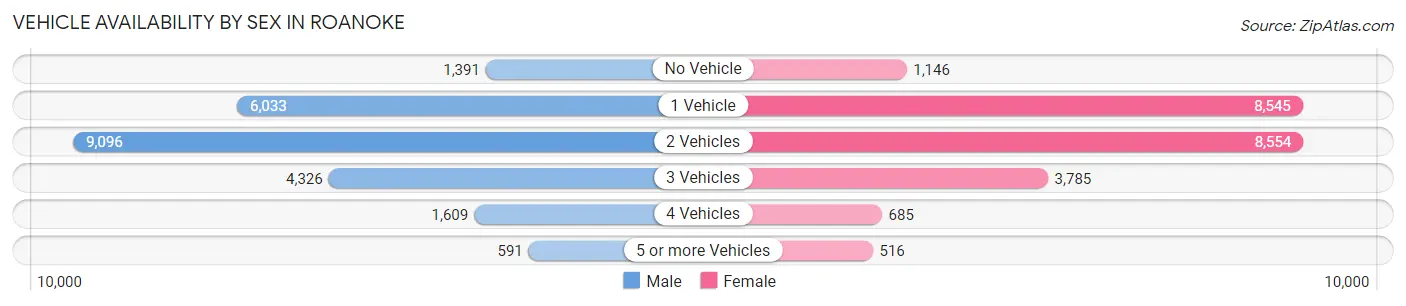
| Vehicles Available | Male | Female |
| No Vehicle | 1,391 (6.0%) | 1,146 (4.9%) |
| 1 Vehicle | 6,033 (26.2%) | 8,545 (36.8%) |
| 2 Vehicles | 9,096 (39.5%) | 8,554 (36.8%) |
| 3 Vehicles | 4,326 (18.8%) | 3,785 (16.3%) |
| 4 Vehicles | 1,609 (7.0%) | 685 (2.9%) |
| 5 or more Vehicles | 591 (2.6%) | 516 (2.2%) |
| Total | 23,046 (100.0%) | 23,231 (100.0%) |
Commute Time in Roanoke
The most frequently occuring commute durations in Roanoke are 15 to 19 minutes (9,682 commuters, 23.1%), 20 to 24 minutes (7,324 commuters, 17.5%), and 30 to 34 minutes (7,241 commuters, 17.3%).
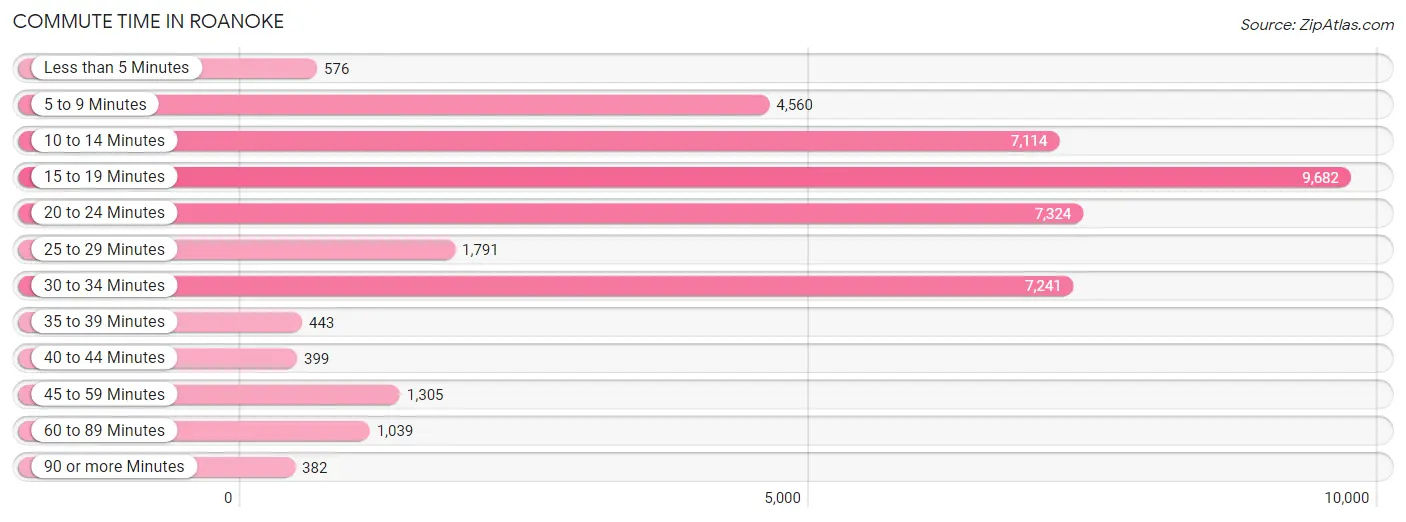
| Commute Time | # Commuters | % Commuters |
| Less than 5 Minutes | 576 | 1.4% |
| 5 to 9 Minutes | 4,560 | 10.9% |
| 10 to 14 Minutes | 7,114 | 17.0% |
| 15 to 19 Minutes | 9,682 | 23.1% |
| 20 to 24 Minutes | 7,324 | 17.5% |
| 25 to 29 Minutes | 1,791 | 4.3% |
| 30 to 34 Minutes | 7,241 | 17.3% |
| 35 to 39 Minutes | 443 | 1.1% |
| 40 to 44 Minutes | 399 | 0.9% |
| 45 to 59 Minutes | 1,305 | 3.1% |
| 60 to 89 Minutes | 1,039 | 2.5% |
| 90 or more Minutes | 382 | 0.9% |
Commute Time by Sex in Roanoke
The most common commute times in Roanoke are 15 to 19 minutes (4,752 commuters, 22.3%) for males and 15 to 19 minutes (4,930 commuters, 24.0%) for females.
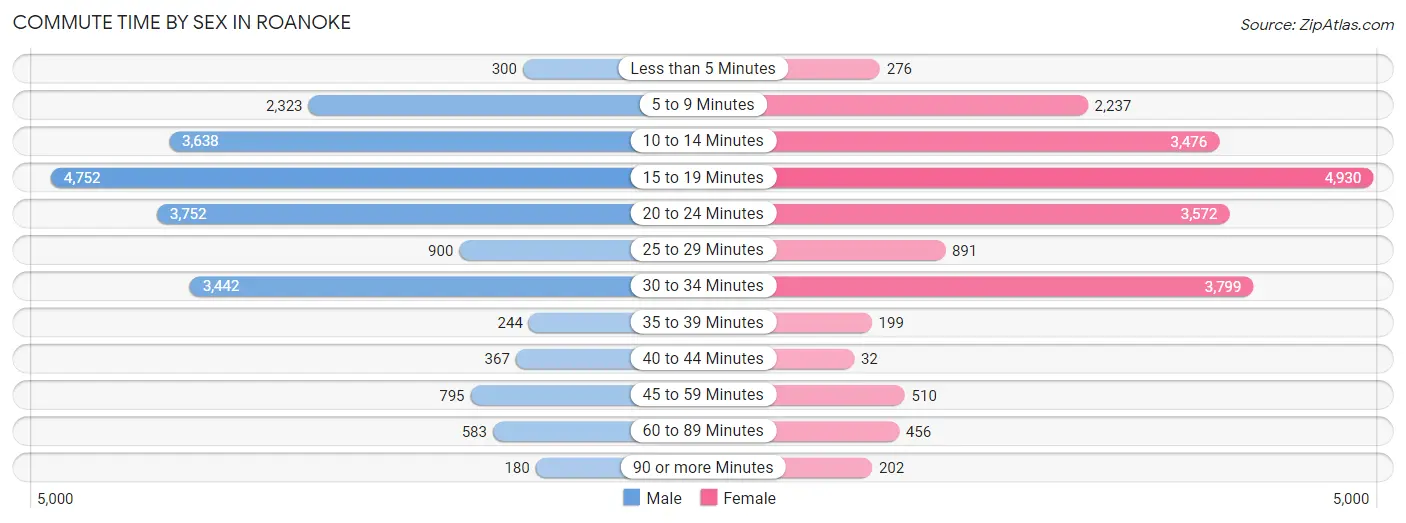
| Commute Time | Male | Female |
| Less than 5 Minutes | 300 (1.4%) | 276 (1.3%) |
| 5 to 9 Minutes | 2,323 (10.9%) | 2,237 (10.9%) |
| 10 to 14 Minutes | 3,638 (17.1%) | 3,476 (16.9%) |
| 15 to 19 Minutes | 4,752 (22.3%) | 4,930 (24.0%) |
| 20 to 24 Minutes | 3,752 (17.6%) | 3,572 (17.4%) |
| 25 to 29 Minutes | 900 (4.2%) | 891 (4.3%) |
| 30 to 34 Minutes | 3,442 (16.2%) | 3,799 (18.5%) |
| 35 to 39 Minutes | 244 (1.1%) | 199 (1.0%) |
| 40 to 44 Minutes | 367 (1.7%) | 32 (0.2%) |
| 45 to 59 Minutes | 795 (3.7%) | 510 (2.5%) |
| 60 to 89 Minutes | 583 (2.7%) | 456 (2.2%) |
| 90 or more Minutes | 180 (0.9%) | 202 (1.0%) |
Time of Departure to Work by Sex in Roanoke
The most frequent times of departure to work in Roanoke are 7:00 AM to 7:29 AM (2,809, 13.2%) for males and 7:30 AM to 7:59 AM (3,267, 15.9%) for females.
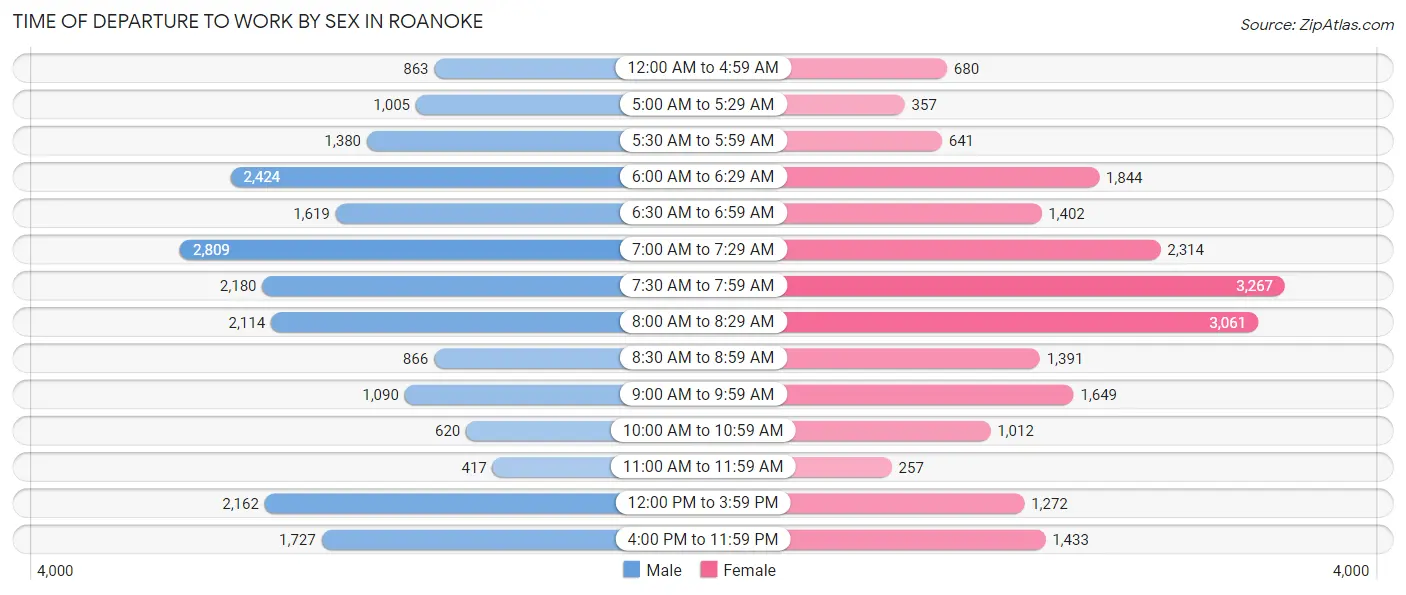
| Time of Departure | Male | Female |
| 12:00 AM to 4:59 AM | 863 (4.1%) | 680 (3.3%) |
| 5:00 AM to 5:29 AM | 1,005 (4.7%) | 357 (1.7%) |
| 5:30 AM to 5:59 AM | 1,380 (6.5%) | 641 (3.1%) |
| 6:00 AM to 6:29 AM | 2,424 (11.4%) | 1,844 (9.0%) |
| 6:30 AM to 6:59 AM | 1,619 (7.6%) | 1,402 (6.8%) |
| 7:00 AM to 7:29 AM | 2,809 (13.2%) | 2,314 (11.2%) |
| 7:30 AM to 7:59 AM | 2,180 (10.2%) | 3,267 (15.9%) |
| 8:00 AM to 8:29 AM | 2,114 (9.9%) | 3,061 (14.9%) |
| 8:30 AM to 8:59 AM | 866 (4.1%) | 1,391 (6.8%) |
| 9:00 AM to 9:59 AM | 1,090 (5.1%) | 1,649 (8.0%) |
| 10:00 AM to 10:59 AM | 620 (2.9%) | 1,012 (4.9%) |
| 11:00 AM to 11:59 AM | 417 (2.0%) | 257 (1.3%) |
| 12:00 PM to 3:59 PM | 2,162 (10.2%) | 1,272 (6.2%) |
| 4:00 PM to 11:59 PM | 1,727 (8.1%) | 1,433 (7.0%) |
| Total | 21,276 (100.0%) | 20,580 (100.0%) |
Housing Occupancy in Roanoke
Occupancy by Ownership in Roanoke
Of the total 42,806 dwellings in Roanoke, owner-occupied units account for 22,308 (52.1%), while renter-occupied units make up 20,498 (47.9%).
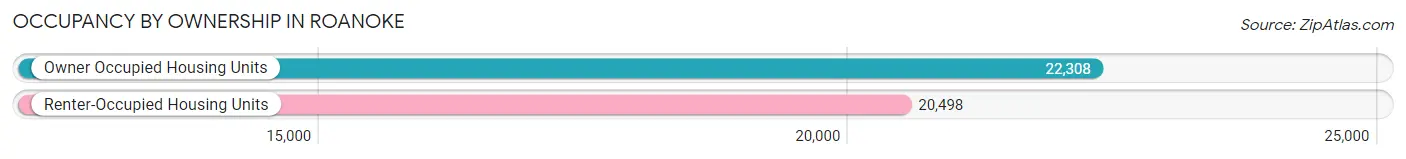
| Occupancy | # Housing Units | % Housing Units |
| Owner Occupied Housing Units | 22,308 | 52.1% |
| Renter-Occupied Housing Units | 20,498 | 47.9% |
| Total Occupied Housing Units | 42,806 | 100.0% |
Occupancy by Household Size in Roanoke
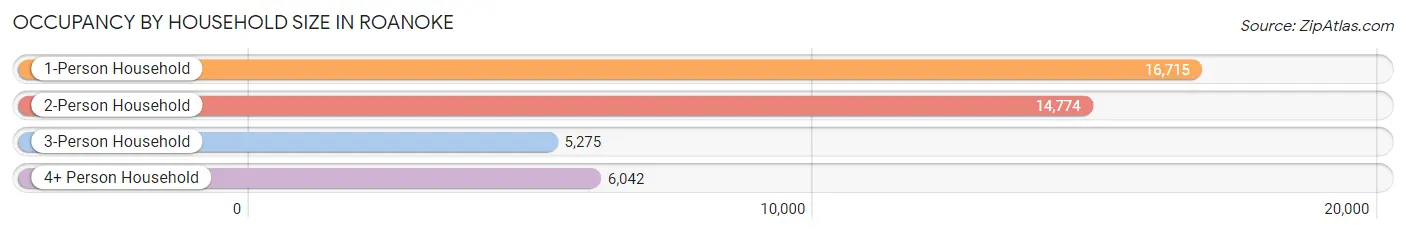
| Household Size | # Housing Units | % Housing Units |
| 1-Person Household | 16,715 | 39.1% |
| 2-Person Household | 14,774 | 34.5% |
| 3-Person Household | 5,275 | 12.3% |
| 4+ Person Household | 6,042 | 14.1% |
| Total Housing Units | 42,806 | 100.0% |
Occupancy by Ownership by Household Size in Roanoke
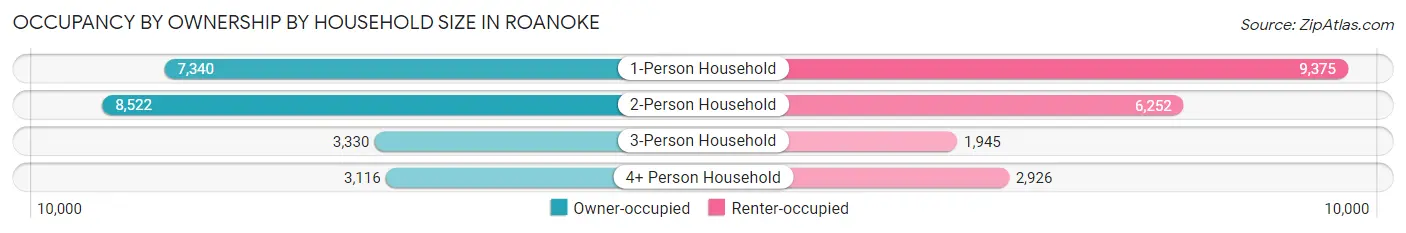
| Household Size | Owner-occupied | Renter-occupied |
| 1-Person Household | 7,340 (43.9%) | 9,375 (56.1%) |
| 2-Person Household | 8,522 (57.7%) | 6,252 (42.3%) |
| 3-Person Household | 3,330 (63.1%) | 1,945 (36.9%) |
| 4+ Person Household | 3,116 (51.6%) | 2,926 (48.4%) |
| Total Housing Units | 22,308 (52.1%) | 20,498 (47.9%) |
Occupancy by Educational Attainment in Roanoke
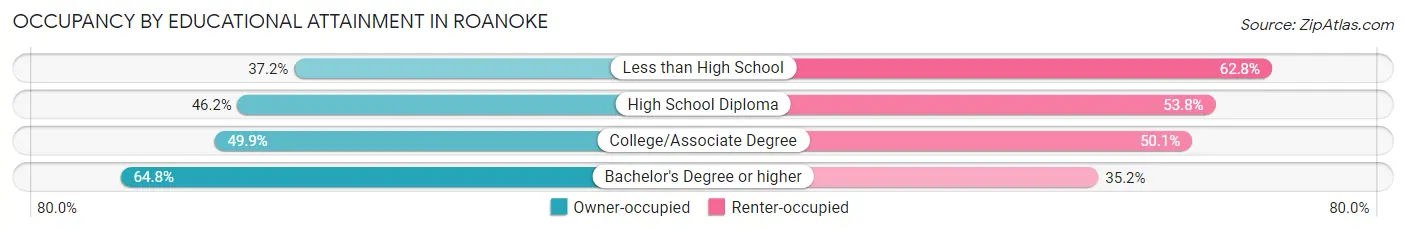
| Household Size | Owner-occupied | Renter-occupied |
| Less than High School | 1,515 (37.2%) | 2,553 (62.8%) |
| High School Diploma | 6,253 (46.2%) | 7,281 (53.8%) |
| College/Associate Degree | 5,977 (49.9%) | 6,005 (50.1%) |
| Bachelor's Degree or higher | 8,563 (64.8%) | 4,659 (35.2%) |
Occupancy by Age of Householder in Roanoke
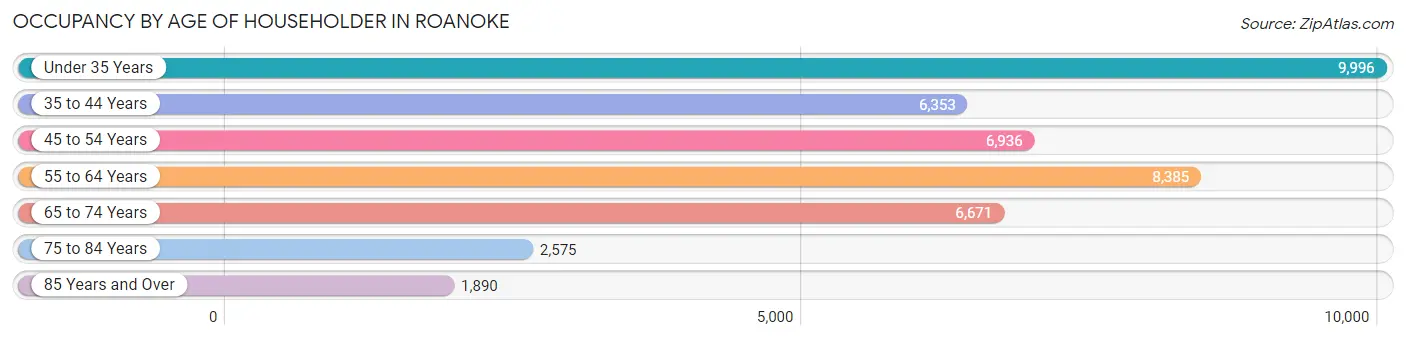
| Age Bracket | # Households | % Households |
| Under 35 Years | 9,996 | 23.4% |
| 35 to 44 Years | 6,353 | 14.8% |
| 45 to 54 Years | 6,936 | 16.2% |
| 55 to 64 Years | 8,385 | 19.6% |
| 65 to 74 Years | 6,671 | 15.6% |
| 75 to 84 Years | 2,575 | 6.0% |
| 85 Years and Over | 1,890 | 4.4% |
| Total | 42,806 | 100.0% |
Housing Finances in Roanoke
Median Income by Occupancy in Roanoke
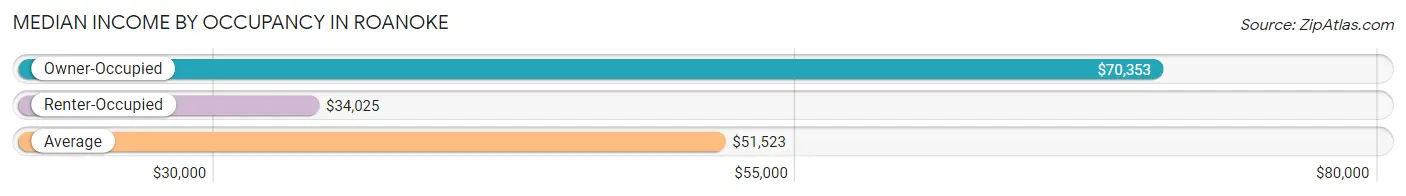
| Occupancy Type | # Households | Median Income |
| Owner-Occupied | 22,308 (52.1%) | $70,353 |
| Renter-Occupied | 20,498 (47.9%) | $34,025 |
| Average | 42,806 (100.0%) | $51,523 |
Occupancy by Householder Income Bracket in Roanoke
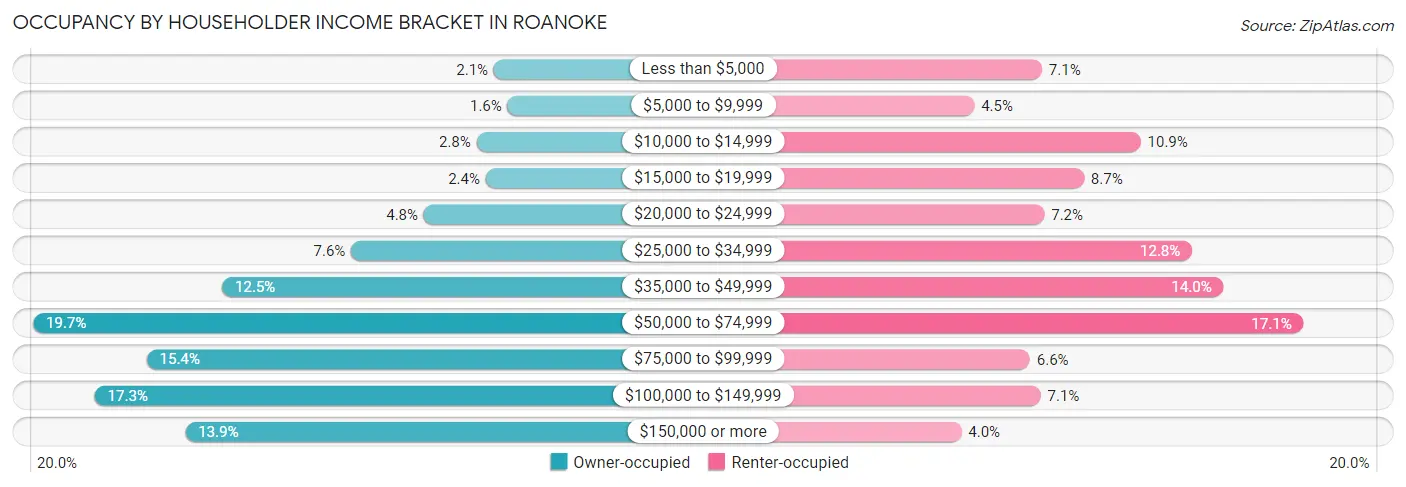
| Income Bracket | Owner-occupied | Renter-occupied |
| Less than $5,000 | 473 (2.1%) | 1,455 (7.1%) |
| $5,000 to $9,999 | 358 (1.6%) | 927 (4.5%) |
| $10,000 to $14,999 | 620 (2.8%) | 2,226 (10.9%) |
| $15,000 to $19,999 | 543 (2.4%) | 1,783 (8.7%) |
| $20,000 to $24,999 | 1,068 (4.8%) | 1,473 (7.2%) |
| $25,000 to $34,999 | 1,686 (7.6%) | 2,628 (12.8%) |
| $35,000 to $49,999 | 2,783 (12.5%) | 2,873 (14.0%) |
| $50,000 to $74,999 | 4,390 (19.7%) | 3,499 (17.1%) |
| $75,000 to $99,999 | 3,425 (15.3%) | 1,362 (6.6%) |
| $100,000 to $149,999 | 3,866 (17.3%) | 1,446 (7.0%) |
| $150,000 or more | 3,096 (13.9%) | 826 (4.0%) |
| Total | 22,308 (100.0%) | 20,498 (100.0%) |
Monthly Housing Cost Tiers in Roanoke
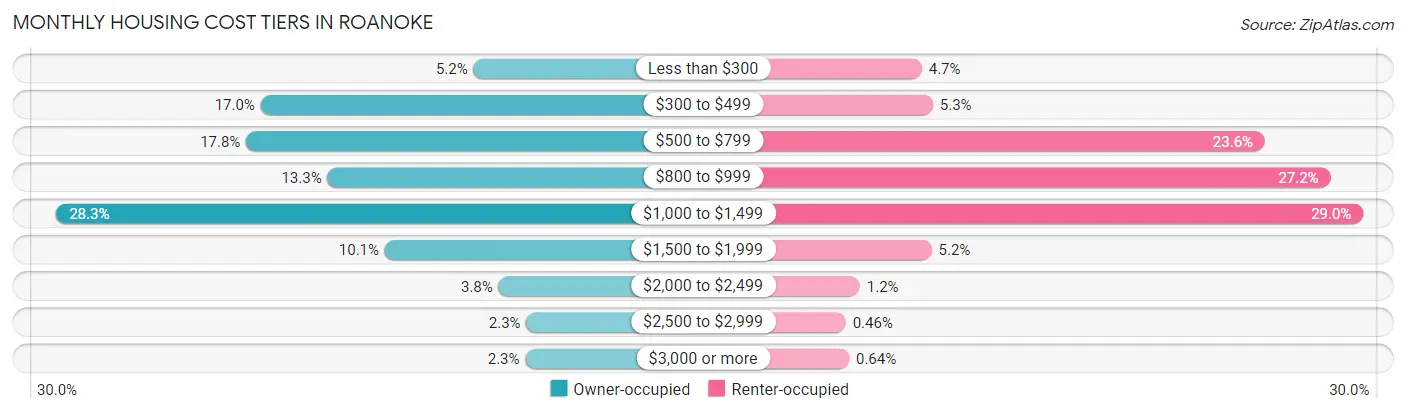
| Monthly Cost | Owner-occupied | Renter-occupied |
| Less than $300 | 1,161 (5.2%) | 955 (4.7%) |
| $300 to $499 | 3,784 (17.0%) | 1,080 (5.3%) |
| $500 to $799 | 3,962 (17.8%) | 4,840 (23.6%) |
| $800 to $999 | 2,960 (13.3%) | 5,582 (27.2%) |
| $1,000 to $1,499 | 6,303 (28.2%) | 5,953 (29.0%) |
| $1,500 to $1,999 | 2,253 (10.1%) | 1,065 (5.2%) |
| $2,000 to $2,499 | 853 (3.8%) | 254 (1.2%) |
| $2,500 to $2,999 | 509 (2.3%) | 94 (0.5%) |
| $3,000 or more | 523 (2.3%) | 132 (0.6%) |
| Total | 22,308 (100.0%) | 20,498 (100.0%) |
Physical Housing Characteristics in Roanoke
Housing Structures in Roanoke
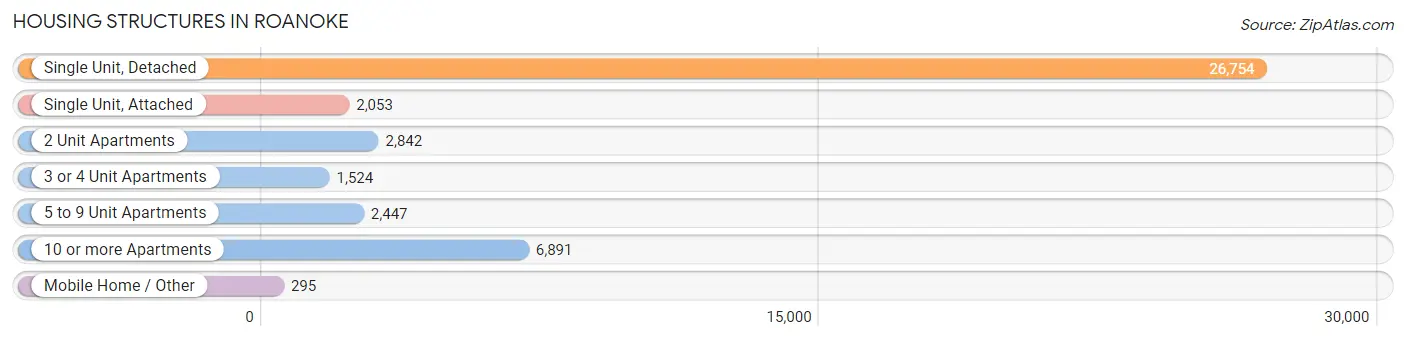
| Structure Type | # Housing Units | % Housing Units |
| Single Unit, Detached | 26,754 | 62.5% |
| Single Unit, Attached | 2,053 | 4.8% |
| 2 Unit Apartments | 2,842 | 6.6% |
| 3 or 4 Unit Apartments | 1,524 | 3.6% |
| 5 to 9 Unit Apartments | 2,447 | 5.7% |
| 10 or more Apartments | 6,891 | 16.1% |
| Mobile Home / Other | 295 | 0.7% |
| Total | 42,806 | 100.0% |
Housing Structures by Occupancy in Roanoke
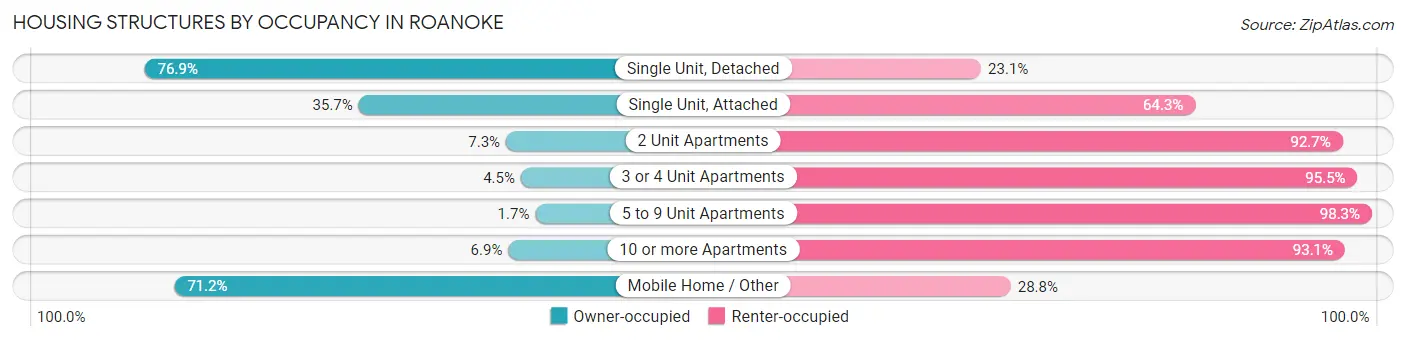
| Structure Type | Owner-occupied | Renter-occupied |
| Single Unit, Detached | 20,574 (76.9%) | 6,180 (23.1%) |
| Single Unit, Attached | 733 (35.7%) | 1,320 (64.3%) |
| 2 Unit Apartments | 208 (7.3%) | 2,634 (92.7%) |
| 3 or 4 Unit Apartments | 68 (4.5%) | 1,456 (95.5%) |
| 5 to 9 Unit Apartments | 41 (1.7%) | 2,406 (98.3%) |
| 10 or more Apartments | 474 (6.9%) | 6,417 (93.1%) |
| Mobile Home / Other | 210 (71.2%) | 85 (28.8%) |
| Total | 22,308 (52.1%) | 20,498 (47.9%) |
Housing Structures by Number of Rooms in Roanoke
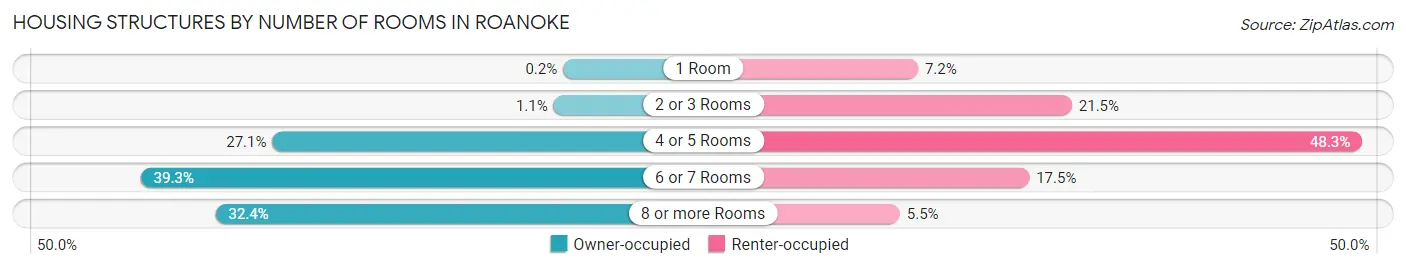
| Number of Rooms | Owner-occupied | Renter-occupied |
| 1 Room | 45 (0.2%) | 1,479 (7.2%) |
| 2 or 3 Rooms | 242 (1.1%) | 4,397 (21.4%) |
| 4 or 5 Rooms | 6,044 (27.1%) | 9,898 (48.3%) |
| 6 or 7 Rooms | 8,761 (39.3%) | 3,589 (17.5%) |
| 8 or more Rooms | 7,216 (32.4%) | 1,135 (5.5%) |
| Total | 22,308 (100.0%) | 20,498 (100.0%) |
Housing Structure by Heating Type in Roanoke
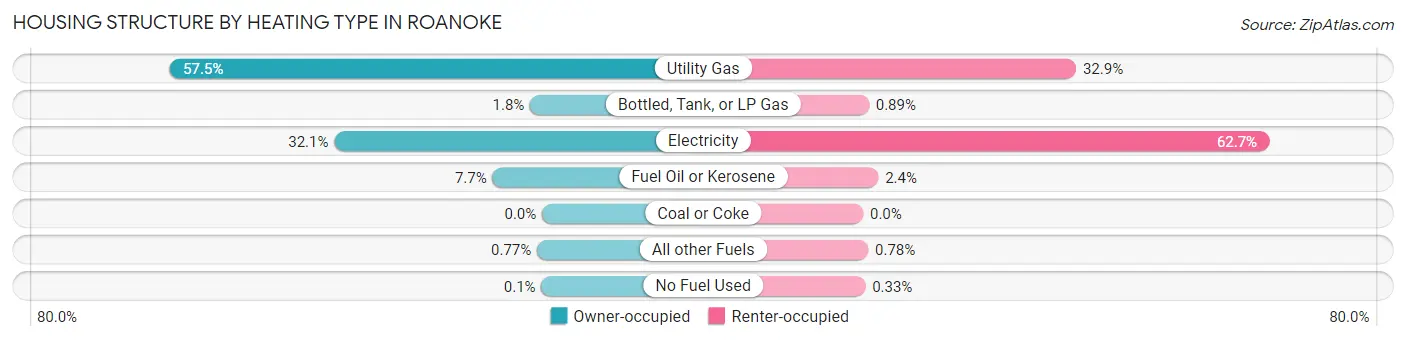
| Heating Type | Owner-occupied | Renter-occupied |
| Utility Gas | 12,832 (57.5%) | 6,747 (32.9%) |
| Bottled, Tank, or LP Gas | 410 (1.8%) | 183 (0.9%) |
| Electricity | 7,165 (32.1%) | 12,860 (62.7%) |
| Fuel Oil or Kerosene | 1,708 (7.7%) | 481 (2.4%) |
| Coal or Coke | 0 (0.0%) | 0 (0.0%) |
| All other Fuels | 171 (0.8%) | 160 (0.8%) |
| No Fuel Used | 22 (0.1%) | 67 (0.3%) |
| Total | 22,308 (100.0%) | 20,498 (100.0%) |
Household Vehicle Usage in Roanoke
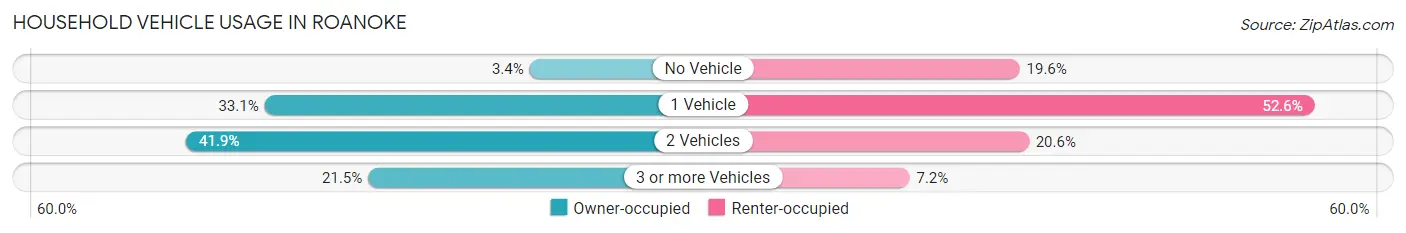
| Vehicles per Household | Owner-occupied | Renter-occupied |
| No Vehicle | 768 (3.4%) | 4,011 (19.6%) |
| 1 Vehicle | 7,391 (33.1%) | 10,782 (52.6%) |
| 2 Vehicles | 9,349 (41.9%) | 4,221 (20.6%) |
| 3 or more Vehicles | 4,800 (21.5%) | 1,484 (7.2%) |
| Total | 22,308 (100.0%) | 20,498 (100.0%) |
Real Estate & Mortgages in Roanoke
Real Estate and Mortgage Overview in Roanoke
| Characteristic | Without Mortgage | With Mortgage |
| Housing Units | 8,008 | 14,300 |
| Median Property Value | $159,500 | $163,500 |
| Median Household Income | $55,199 | $2,100 |
| Monthly Housing Costs | $464 | $523 |
| Real Estate Taxes | $1,639 | $319 |
Property Value by Mortgage Status in Roanoke
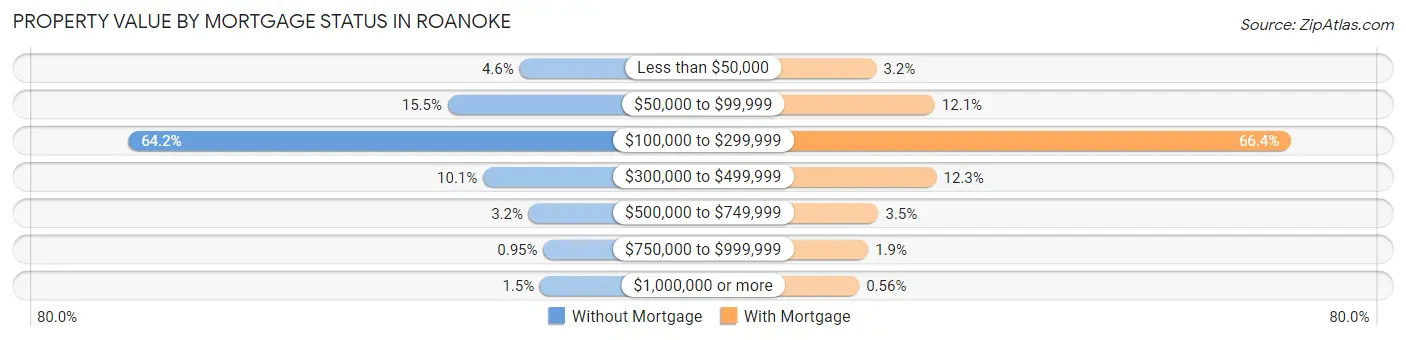
| Property Value | Without Mortgage | With Mortgage |
| Less than $50,000 | 367 (4.6%) | 458 (3.2%) |
| $50,000 to $99,999 | 1,242 (15.5%) | 1,729 (12.1%) |
| $100,000 to $299,999 | 5,141 (64.2%) | 9,492 (66.4%) |
| $300,000 to $499,999 | 811 (10.1%) | 1,764 (12.3%) |
| $500,000 to $749,999 | 254 (3.2%) | 500 (3.5%) |
| $750,000 to $999,999 | 76 (0.9%) | 277 (1.9%) |
| $1,000,000 or more | 117 (1.5%) | 80 (0.6%) |
| Total | 8,008 (100.0%) | 14,300 (100.0%) |
Household Income by Mortgage Status in Roanoke
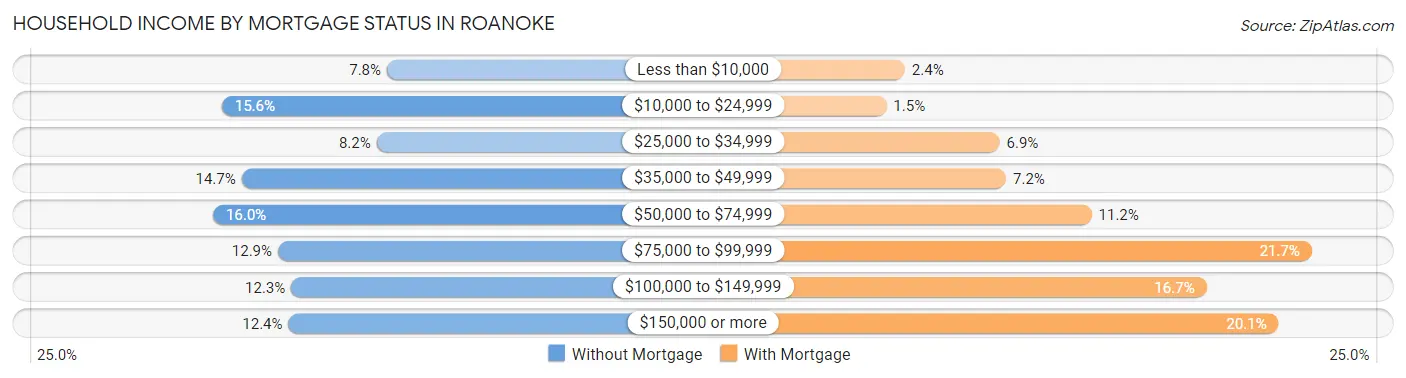
| Household Income | Without Mortgage | With Mortgage |
| Less than $10,000 | 621 (7.7%) | 336 (2.4%) |
| $10,000 to $24,999 | 1,250 (15.6%) | 210 (1.5%) |
| $25,000 to $34,999 | 660 (8.2%) | 981 (6.9%) |
| $35,000 to $49,999 | 1,175 (14.7%) | 1,026 (7.2%) |
| $50,000 to $74,999 | 1,284 (16.0%) | 1,608 (11.2%) |
| $75,000 to $99,999 | 1,036 (12.9%) | 3,106 (21.7%) |
| $100,000 to $149,999 | 986 (12.3%) | 2,389 (16.7%) |
| $150,000 or more | 996 (12.4%) | 2,880 (20.1%) |
| Total | 8,008 (100.0%) | 14,300 (100.0%) |
Property Value to Household Income Ratio in Roanoke
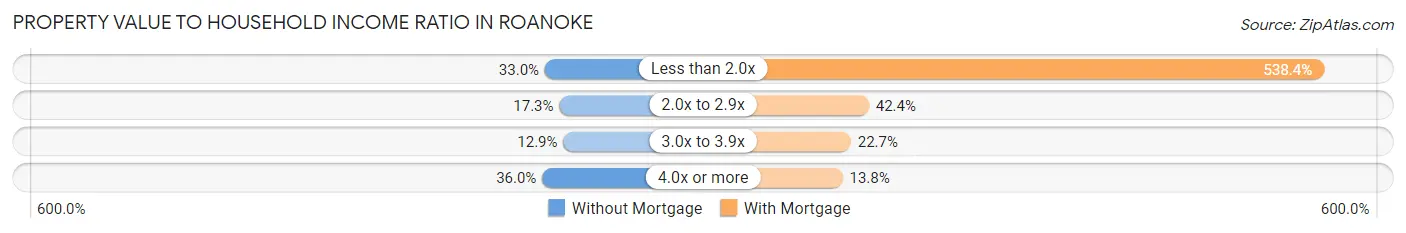
| Value-to-Income Ratio | Without Mortgage | With Mortgage |
| Less than 2.0x | 2,646 (33.0%) | 76,991 (538.4%) |
| 2.0x to 2.9x | 1,386 (17.3%) | 6,058 (42.4%) |
| 3.0x to 3.9x | 1,034 (12.9%) | 3,248 (22.7%) |
| 4.0x or more | 2,882 (36.0%) | 1,968 (13.8%) |
| Total | 8,008 (100.0%) | 14,300 (100.0%) |
Real Estate Taxes by Mortgage Status in Roanoke
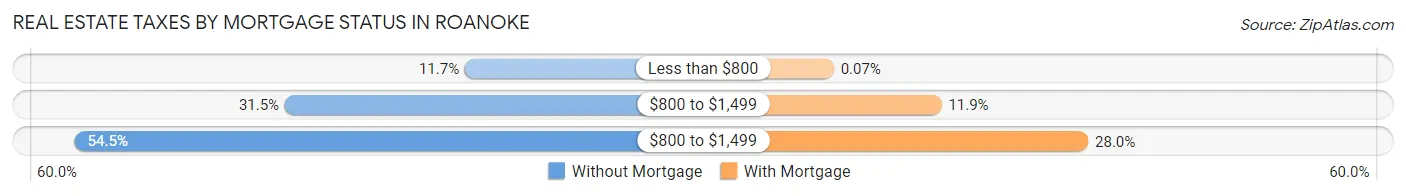
| Property Taxes | Without Mortgage | With Mortgage |
| Less than $800 | 940 (11.7%) | 10 (0.1%) |
| $800 to $1,499 | 2,520 (31.5%) | 1,699 (11.9%) |
| $800 to $1,499 | 4,365 (54.5%) | 3,997 (28.0%) |
| Total | 8,008 (100.0%) | 14,300 (100.0%) |
Health & Disability in Roanoke
Health Insurance Coverage by Age in Roanoke
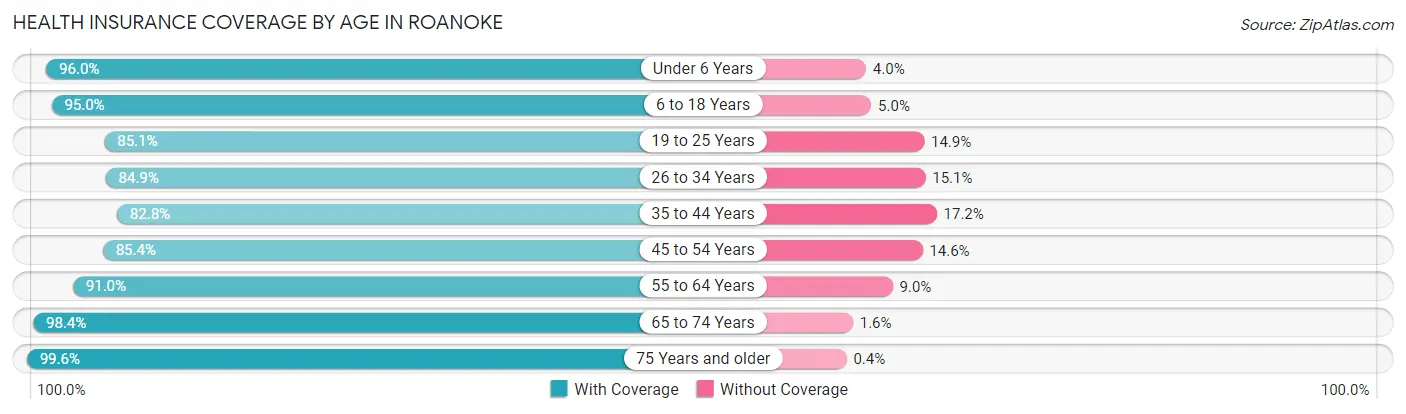
| Age Bracket | With Coverage | Without Coverage |
| Under 6 Years | 7,446 (96.0%) | 313 (4.0%) |
| 6 to 18 Years | 14,462 (95.0%) | 763 (5.0%) |
| 19 to 25 Years | 7,367 (85.1%) | 1,287 (14.9%) |
| 26 to 34 Years | 11,004 (84.9%) | 1,959 (15.1%) |
| 35 to 44 Years | 10,189 (82.8%) | 2,119 (17.2%) |
| 45 to 54 Years | 10,228 (85.4%) | 1,744 (14.6%) |
| 55 to 64 Years | 11,418 (91.0%) | 1,130 (9.0%) |
| 65 to 74 Years | 10,019 (98.4%) | 161 (1.6%) |
| 75 Years and older | 6,165 (99.6%) | 25 (0.4%) |
| Total | 88,298 (90.3%) | 9,501 (9.7%) |
Health Insurance Coverage by Citizenship Status in Roanoke
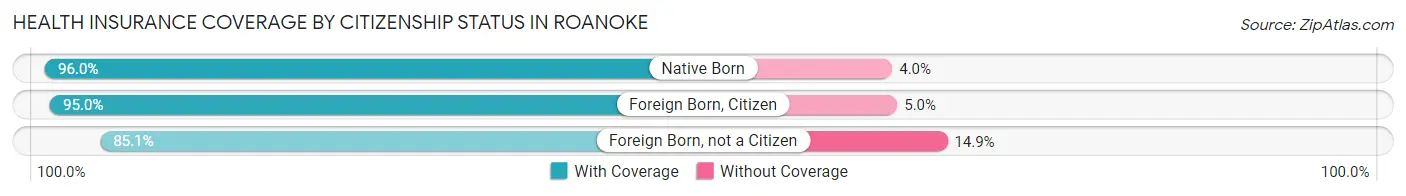
| Citizenship Status | With Coverage | Without Coverage |
| Native Born | 7,446 (96.0%) | 313 (4.0%) |
| Foreign Born, Citizen | 14,462 (95.0%) | 763 (5.0%) |
| Foreign Born, not a Citizen | 7,367 (85.1%) | 1,287 (14.9%) |
Health Insurance Coverage by Household Income in Roanoke
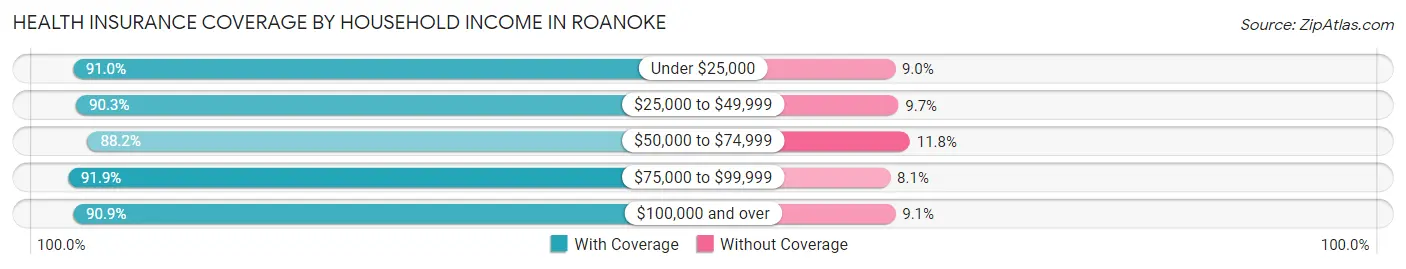
| Household Income | With Coverage | Without Coverage |
| Under $25,000 | 16,807 (91.0%) | 1,668 (9.0%) |
| $25,000 to $49,999 | 17,974 (90.3%) | 1,923 (9.7%) |
| $50,000 to $74,999 | 17,012 (88.2%) | 2,277 (11.8%) |
| $75,000 to $99,999 | 11,073 (91.9%) | 979 (8.1%) |
| $100,000 and over | 25,074 (90.9%) | 2,504 (9.1%) |
Public vs Private Health Insurance Coverage by Age in Roanoke
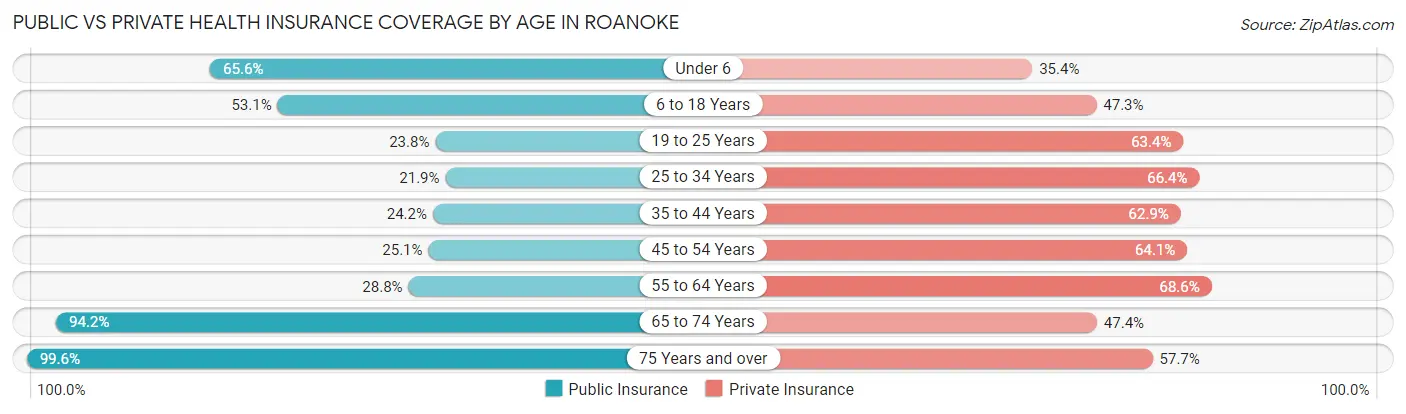
| Age Bracket | Public Insurance | Private Insurance |
| Under 6 | 5,086 (65.5%) | 2,743 (35.3%) |
| 6 to 18 Years | 8,079 (53.1%) | 7,194 (47.2%) |
| 19 to 25 Years | 2,058 (23.8%) | 5,484 (63.4%) |
| 25 to 34 Years | 2,839 (21.9%) | 8,601 (66.3%) |
| 35 to 44 Years | 2,982 (24.2%) | 7,740 (62.9%) |
| 45 to 54 Years | 3,000 (25.1%) | 7,674 (64.1%) |
| 55 to 64 Years | 3,609 (28.8%) | 8,612 (68.6%) |
| 65 to 74 Years | 9,584 (94.2%) | 4,820 (47.3%) |
| 75 Years and over | 6,165 (99.6%) | 3,571 (57.7%) |
| Total | 43,402 (44.4%) | 56,439 (57.7%) |
Disability Status by Sex by Age in Roanoke
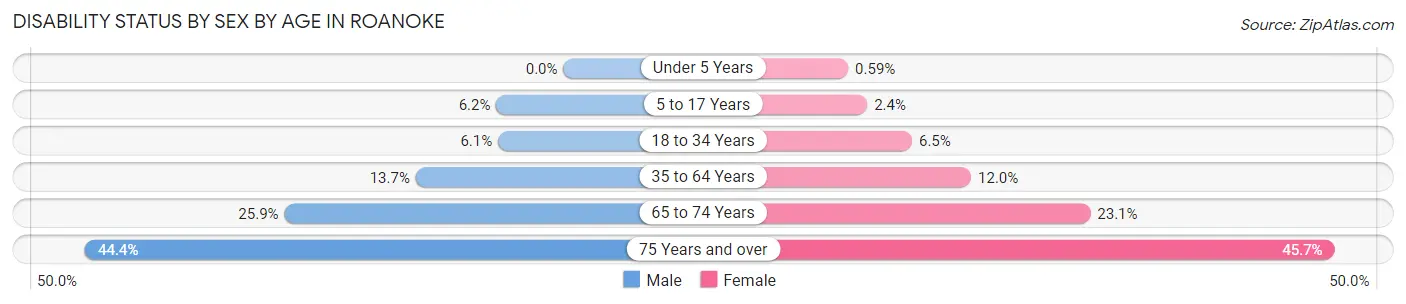
| Age Bracket | Male | Female |
| Under 5 Years | 0 (0.0%) | 20 (0.6%) |
| 5 to 17 Years | 480 (6.2%) | 187 (2.4%) |
| 18 to 34 Years | 670 (6.1%) | 752 (6.5%) |
| 35 to 64 Years | 2,451 (13.7%) | 2,273 (12.0%) |
| 65 to 74 Years | 1,133 (25.9%) | 1,339 (23.1%) |
| 75 Years and over | 927 (44.4%) | 1,875 (45.7%) |
Disability Class by Sex by Age in Roanoke
Disability Class: Hearing Difficulty
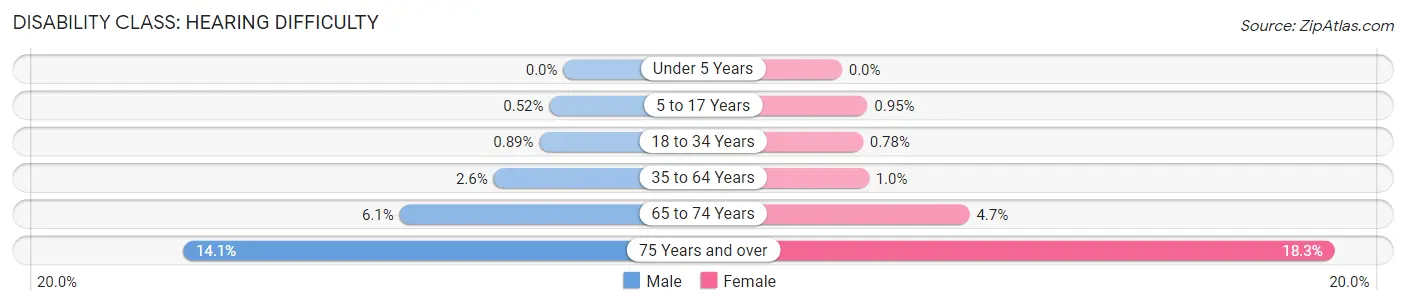
| Age Bracket | Male | Female |
| Under 5 Years | 0 (0.0%) | 0 (0.0%) |
| 5 to 17 Years | 40 (0.5%) | 75 (0.9%) |
| 18 to 34 Years | 98 (0.9%) | 90 (0.8%) |
| 35 to 64 Years | 463 (2.6%) | 190 (1.0%) |
| 65 to 74 Years | 266 (6.1%) | 275 (4.7%) |
| 75 Years and over | 295 (14.1%) | 750 (18.3%) |
Disability Class: Vision Difficulty
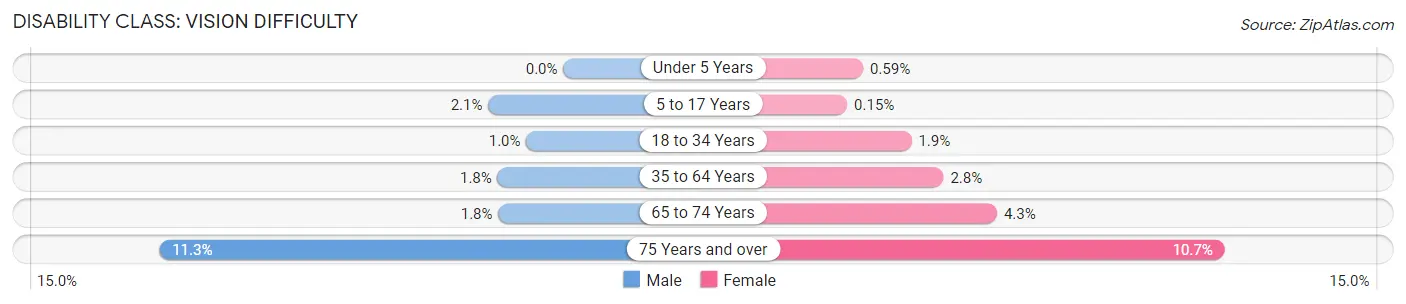
| Age Bracket | Male | Female |
| Under 5 Years | 0 (0.0%) | 20 (0.6%) |
| 5 to 17 Years | 161 (2.1%) | 12 (0.2%) |
| 18 to 34 Years | 114 (1.0%) | 224 (1.9%) |
| 35 to 64 Years | 328 (1.8%) | 535 (2.8%) |
| 65 to 74 Years | 79 (1.8%) | 251 (4.3%) |
| 75 Years and over | 235 (11.3%) | 437 (10.7%) |
Disability Class: Cognitive Difficulty
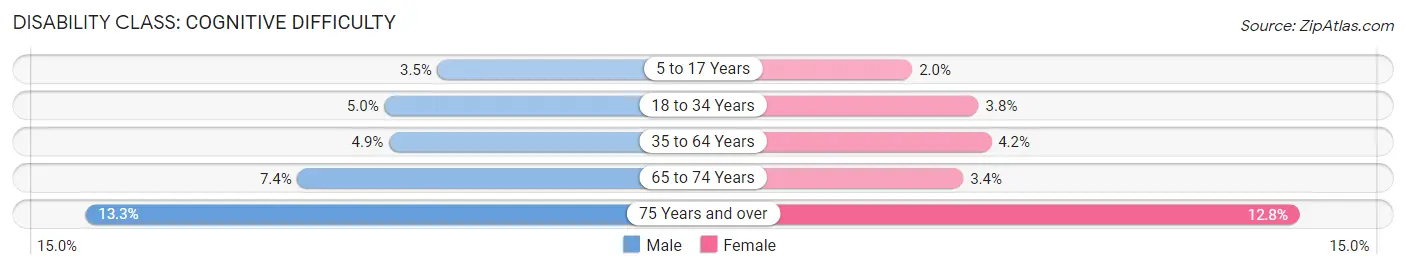
| Age Bracket | Male | Female |
| 5 to 17 Years | 270 (3.5%) | 155 (2.0%) |
| 18 to 34 Years | 551 (5.0%) | 440 (3.8%) |
| 35 to 64 Years | 867 (4.9%) | 787 (4.2%) |
| 65 to 74 Years | 324 (7.4%) | 196 (3.4%) |
| 75 Years and over | 278 (13.3%) | 523 (12.8%) |
Disability Class: Ambulatory Difficulty
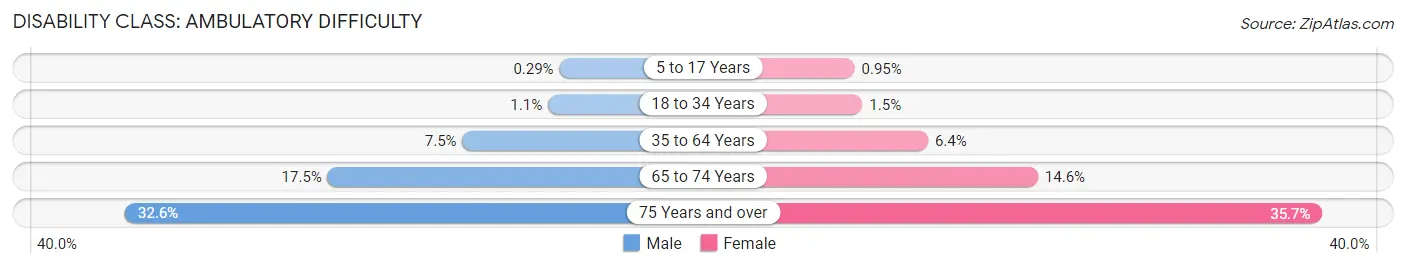
| Age Bracket | Male | Female |
| 5 to 17 Years | 22 (0.3%) | 75 (0.9%) |
| 18 to 34 Years | 126 (1.1%) | 177 (1.5%) |
| 35 to 64 Years | 1,340 (7.5%) | 1,211 (6.4%) |
| 65 to 74 Years | 766 (17.5%) | 845 (14.6%) |
| 75 Years and over | 680 (32.6%) | 1,463 (35.7%) |
Disability Class: Self-Care Difficulty
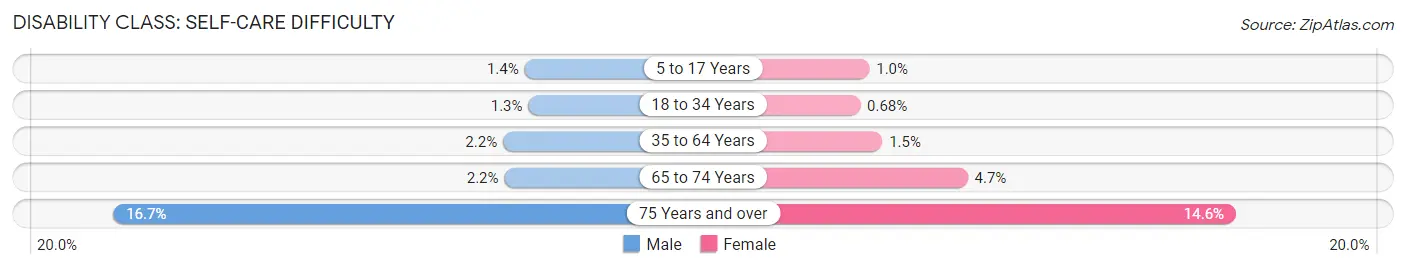
| Age Bracket | Male | Female |
| 5 to 17 Years | 111 (1.4%) | 81 (1.0%) |
| 18 to 34 Years | 144 (1.3%) | 79 (0.7%) |
| 35 to 64 Years | 400 (2.2%) | 284 (1.5%) |
| 65 to 74 Years | 96 (2.2%) | 271 (4.7%) |
| 75 Years and over | 349 (16.7%) | 600 (14.6%) |
Technology Access in Roanoke
Computing Device Access in Roanoke
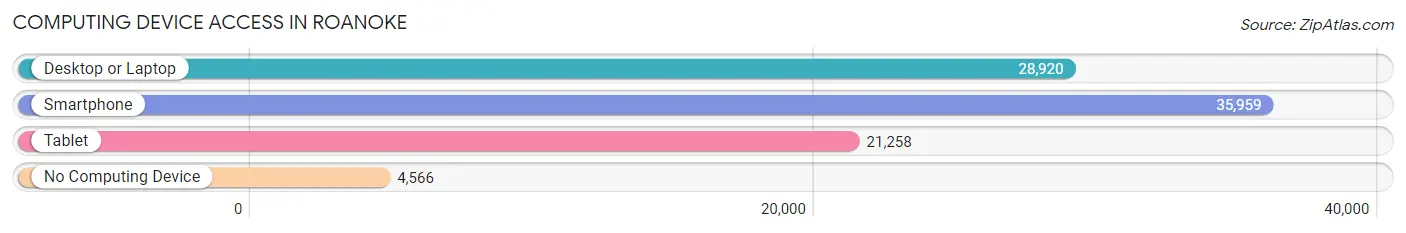
| Device Type | # Households | % Households |
| Desktop or Laptop | 28,920 | 67.6% |
| Smartphone | 35,959 | 84.0% |
| Tablet | 21,258 | 49.7% |
| No Computing Device | 4,566 | 10.7% |
| Total | 42,806 | 100.0% |
Internet Access in Roanoke
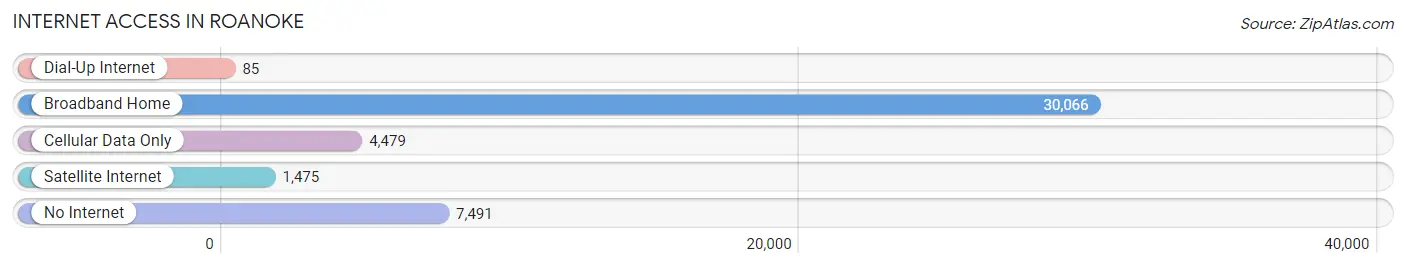
| Internet Type | # Households | % Households |
| Dial-Up Internet | 85 | 0.2% |
| Broadband Home | 30,066 | 70.2% |
| Cellular Data Only | 4,479 | 10.5% |
| Satellite Internet | 1,475 | 3.5% |
| No Internet | 7,491 | 17.5% |
| Total | 42,806 | 100.0% |
Roanoke Summary
Roanoke, Virginia is a city located in the Blue Ridge Mountains of Virginia. It is the largest city in the Roanoke Valley and the tenth largest city in the state. Roanoke is known as the “Star City of the South” and is home to a diverse population of over 97,000 people.
History
The area that is now Roanoke was first settled by Europeans in the late 1700s. The first settlers were German and Scots-Irish immigrants who were attracted to the area by its fertile soil and abundant natural resources. The city was officially founded in 1852 and was named after the Roanoke River, which runs through the city.
In the late 1800s, the city experienced a period of rapid growth due to the arrival of the railroad. This allowed the city to become a major hub for the transportation of goods and people. The city also became a major center for manufacturing and industry.
In the early 1900s, Roanoke was a major center for the textile industry. The city was also home to several large tobacco companies. During this time, the city experienced a period of rapid growth and development.
Geography
Roanoke is located in the Roanoke Valley in the Blue Ridge Mountains of Virginia. The city is situated at the intersection of the Roanoke River and the Blue Ridge Parkway. The city is surrounded by the Blue Ridge Mountains to the east and the Allegheny Mountains to the west.
The city has a total area of 44.3 square miles, of which 42.3 square miles is land and 2.0 square miles is water. The city is located at an elevation of 1,890 feet above sea level.
Economy
Roanoke’s economy is largely based on the service industry. The city is home to several large companies, including Carilion Health System, Norfolk Southern Railway, and Advance Auto Parts. The city is also home to several major universities, including Virginia Tech and Radford University.
The city is also home to several major tourist attractions, including the Roanoke Valley Greenway, the Roanoke River, and the Blue Ridge Parkway. The city is also home to several museums, including the Virginia Museum of Transportation and the O. Winston Link Museum.
Demographics
As of the 2010 census, the population of Roanoke was 97,032. The racial makeup of the city was 73.2% White, 17.3% African American, 0.4% Native American, 2.2% Asian, 0.1% Pacific Islander, 4.2% from other races, and 2.7% from two or more races. Hispanic or Latino of any race were 8.3% of the population.
The median income for a household in the city was $37,837, and the median income for a family was $45,945. The per capita income for the city was $21,945. About 16.2% of families and 19.7% of the population were below the poverty line, including 28.2% of those under age 18 and 11.2% of those age 65 or over.
Roanoke is a diverse city with a rich history and a vibrant economy. The city is home to a variety of industries, universities, and tourist attractions. The city is also home to a diverse population with a wide range of backgrounds and cultures. Roanoke is a great place to live, work, and visit.
Common Questions
What is Per Capita Income in Roanoke?
Per Capita income in Roanoke is $33,206.
What is the Median Family Income in Roanoke?
Median Family Income in Roanoke is $66,055.
What is the Median Household income in Roanoke?
Median Household Income in Roanoke is $51,523.
What is Income or Wage Gap in Roanoke?
Income or Wage Gap in Roanoke is 13.8%.
Women in Roanoke earn 86.2 cents for every dollar earned by a man.
What is Family Income Deficit in Roanoke?
Family Income Deficit in Roanoke is $11,607.
Families that are below poverty line in Roanoke earn $11,607 less on average than the poverty threshold level.
What is Inequality or Gini Index in Roanoke?
Inequality or Gini Index in Roanoke is 0.50.
What is the Total Population of Roanoke?
Total Population of Roanoke is 99,213.
What is the Total Male Population of Roanoke?
Total Male Population of Roanoke is 46,791.
What is the Total Female Population of Roanoke?
Total Female Population of Roanoke is 52,422.
What is the Ratio of Males per 100 Females in Roanoke?
There are 89.26 Males per 100 Females in Roanoke.
What is the Ratio of Females per 100 Males in Roanoke?
There are 112.03 Females per 100 Males in Roanoke.
What is the Median Population Age in Roanoke?
Median Population Age in Roanoke is 38.1 Years.
What is the Average Family Size in Roanoke
Average Family Size in Roanoke is 3.1 People.
What is the Average Household Size in Roanoke
Average Household Size in Roanoke is 2.3 People.
How Large is the Labor Force in Roanoke?
There are 50,391 People in the Labor Forcein in Roanoke.
What is the Percentage of People in the Labor Force in Roanoke?
63.8% of People are in the Labor Force in Roanoke.
What is the Unemployment Rate in Roanoke?
Unemployment Rate in Roanoke is 6.6%.