Travis Ranch, TX Map & Demographics
Travis Ranch Map
Travis Ranch Overview
$29,102
PER CAPITA INCOME
$73,897
AVG FAMILY INCOME
$73,804
AVG HOUSEHOLD INCOME
34.9%
WAGE / INCOME GAP [ % ]
65.1¢/ $1
WAGE / INCOME GAP [ $ ]
0.37
INEQUALITY / GINI INDEX
9,037
TOTAL POPULATION
4,466
MALE POPULATION
4,571
FEMALE POPULATION
97.70
MALES / 100 FEMALES
102.35
FEMALES / 100 MALES
31.5
MEDIAN AGE
3.5
AVG FAMILY SIZE
3.3
AVG HOUSEHOLD SIZE
4,549
LABOR FORCE [ PEOPLE ]
71.7%
PERCENT IN LABOR FORCE
2.6%
UNEMPLOYMENT RATE
Income in Travis Ranch
Income Overview in Travis Ranch
Per Capita Income in Travis Ranch is $29,102, while median incomes of families and households are $73,897 and $73,804 respectively.
| Characteristic | Number | Measure |
| Per Capita Income | 9,037 | $29,102 |
| Median Family Income | 2,396 | $73,897 |
| Mean Family Income | 2,396 | $93,230 |
| Median Household Income | 2,730 | $73,804 |
| Mean Household Income | 2,730 | $93,725 |
| Income Deficit | 2,396 | $0 |
| Wage / Income Gap (%) | 9,037 | 34.88% |
| Wage / Income Gap ($) | 9,037 | 65.12¢ per $1 |
| Gini / Inequality Index | 9,037 | 0.37 |
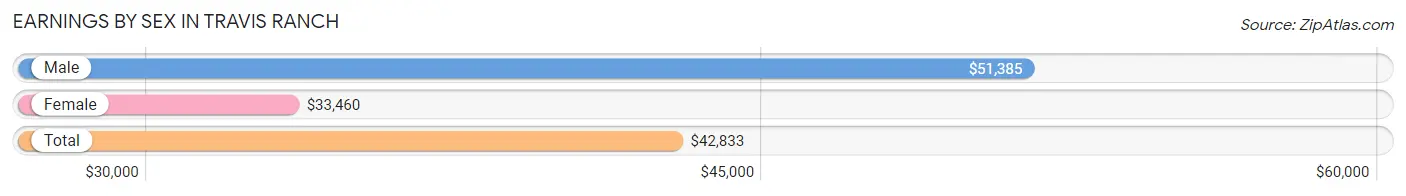
Earnings by Sex in Travis Ranch
Average Earnings in Travis Ranch are $42,833, $51,385 for men and $33,460 for women, a difference of 34.9%.
| Sex | Number | Average Earnings |
| Male | 2,522 (51.3%) | $51,385 |
| Female | 2,389 (48.6%) | $33,460 |
| Total | 4,911 (100.0%) | $42,833 |
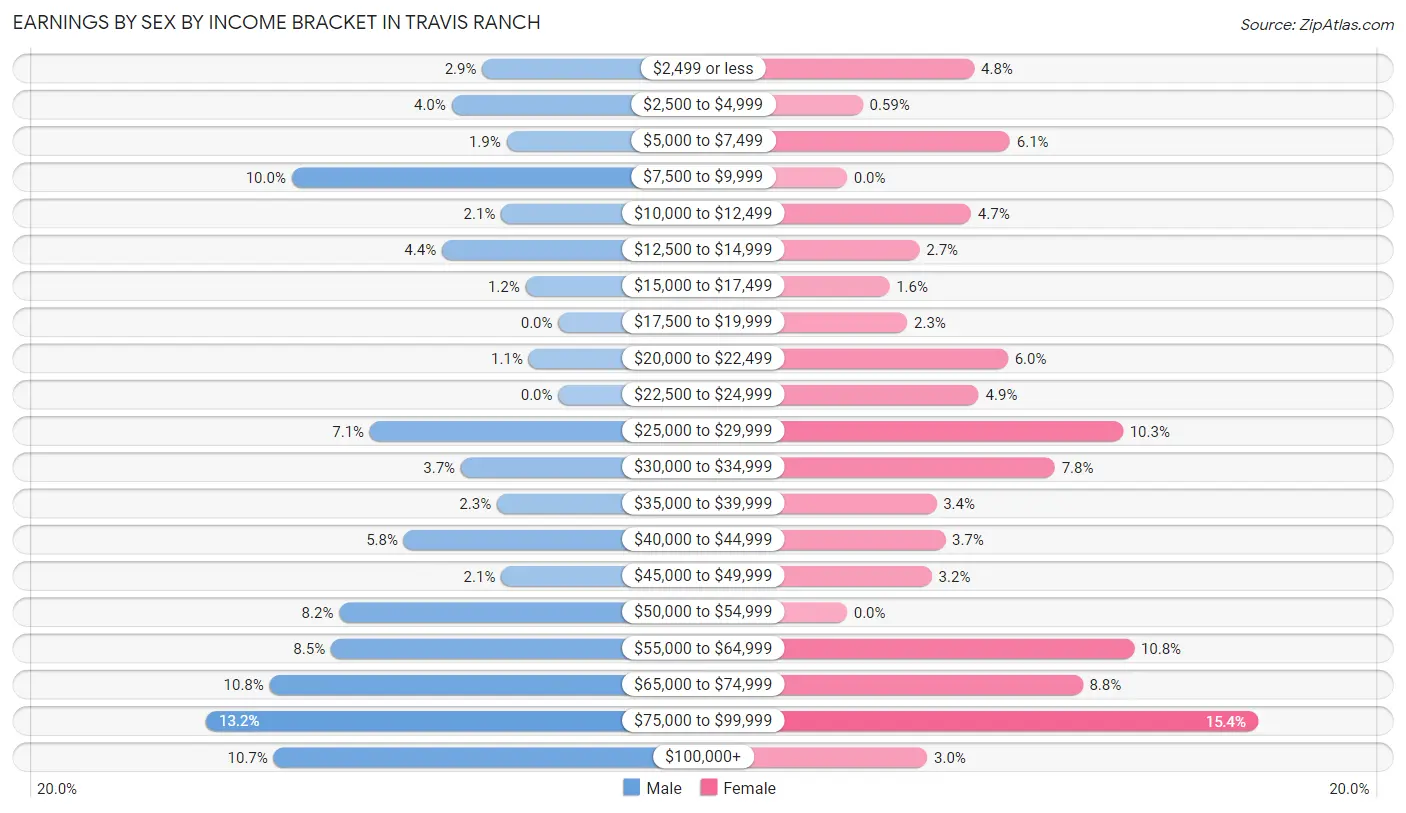
Earnings by Sex by Income Bracket in Travis Ranch
The most common earnings brackets in Travis Ranch are $75,000 to $99,999 for men (333 | 13.2%) and $75,000 to $99,999 for women (368 | 15.4%).
| Income | Male | Female |
| $2,499 or less | 72 (2.9%) | 114 (4.8%) |
| $2,500 to $4,999 | 101 (4.0%) | 14 (0.6%) |
| $5,000 to $7,499 | 49 (1.9%) | 146 (6.1%) |
| $7,500 to $9,999 | 252 (10.0%) | 0 (0.0%) |
| $10,000 to $12,499 | 54 (2.1%) | 111 (4.6%) |
| $12,500 to $14,999 | 110 (4.4%) | 65 (2.7%) |
| $15,000 to $17,499 | 31 (1.2%) | 38 (1.6%) |
| $17,500 to $19,999 | 0 (0.0%) | 54 (2.3%) |
| $20,000 to $22,499 | 28 (1.1%) | 144 (6.0%) |
| $22,500 to $24,999 | 0 (0.0%) | 118 (4.9%) |
| $25,000 to $29,999 | 178 (7.1%) | 247 (10.3%) |
| $30,000 to $34,999 | 92 (3.6%) | 186 (7.8%) |
| $35,000 to $39,999 | 58 (2.3%) | 80 (3.4%) |
| $40,000 to $44,999 | 146 (5.8%) | 88 (3.7%) |
| $45,000 to $49,999 | 54 (2.1%) | 76 (3.2%) |
| $50,000 to $54,999 | 207 (8.2%) | 0 (0.0%) |
| $55,000 to $64,999 | 215 (8.5%) | 257 (10.8%) |
| $65,000 to $74,999 | 273 (10.8%) | 211 (8.8%) |
| $75,000 to $99,999 | 333 (13.2%) | 368 (15.4%) |
| $100,000+ | 269 (10.7%) | 72 (3.0%) |
| Total | 2,522 (100.0%) | 2,389 (100.0%) |
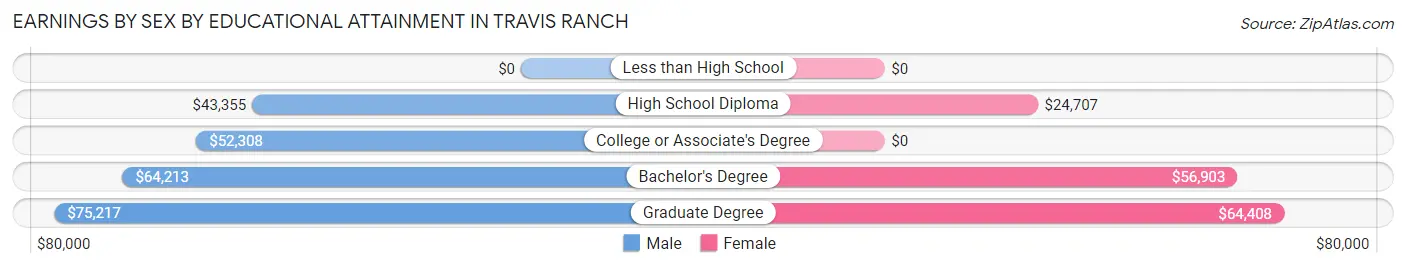
Earnings by Sex by Educational Attainment in Travis Ranch
Average earnings in Travis Ranch are $53,548 for men and $40,444 for women, a difference of 24.5%. Men with an educational attainment of graduate degree enjoy the highest average annual earnings of $75,217, while those with high school diploma education earn the least with $43,355. Women with an educational attainment of graduate degree earn the most with the average annual earnings of $64,408, while those with high school diploma education have the smallest earnings of $24,707.
| Educational Attainment | Male Income | Female Income |
| Less than High School | - | - |
| High School Diploma | $43,355 | $24,707 |
| College or Associate's Degree | $52,308 | $0 |
| Bachelor's Degree | $64,213 | $56,903 |
| Graduate Degree | $75,217 | $64,408 |
| Total | $53,548 | $40,444 |
Family Income in Travis Ranch
Family Income Brackets in Travis Ranch
According to the Travis Ranch family income data, there are 745 families falling into the $50,000 to $74,999 income range, which is the most common income bracket and makes up 31.1% of all families.
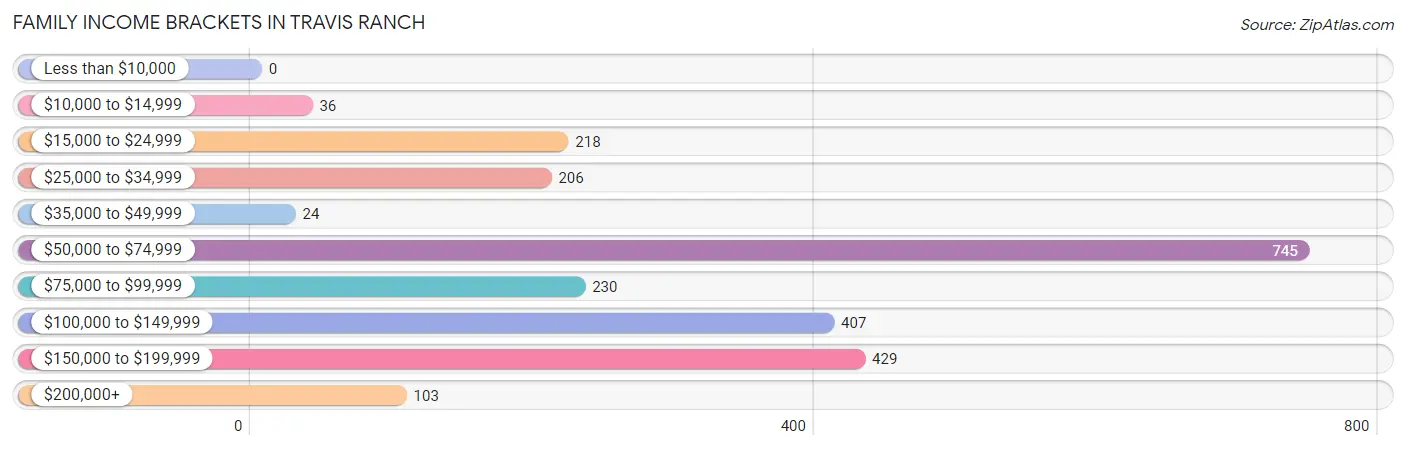
| Income Bracket | # Families | % Families |
| Less than $10,000 | 0 | 0.0% |
| $10,000 to $14,999 | 36 | 1.5% |
| $15,000 to $24,999 | 218 | 9.1% |
| $25,000 to $34,999 | 206 | 8.6% |
| $35,000 to $49,999 | 24 | 1.0% |
| $50,000 to $74,999 | 745 | 31.1% |
| $75,000 to $99,999 | 230 | 9.6% |
| $100,000 to $149,999 | 407 | 17.0% |
| $150,000 to $199,999 | 429 | 17.9% |
| $200,000+ | 103 | 4.3% |
Family Income by Famaliy Size in Travis Ranch
7+ person families (139 | 5.8%) account for the highest median family income in Travis Ranch with $170,721 per family, while 2-person families (614 | 25.6%) have the highest median income of $33,734 per family member.
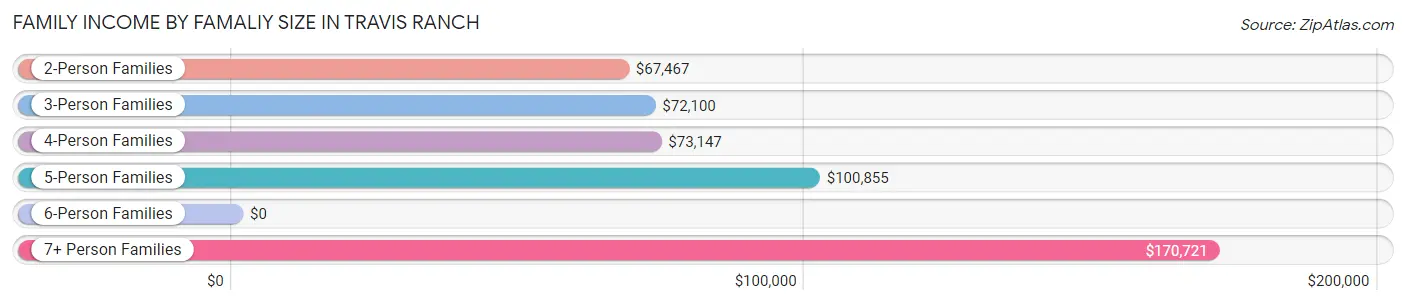
| Income Bracket | # Families | Median Income |
| 2-Person Families | 614 (25.6%) | $67,467 |
| 3-Person Families | 374 (15.6%) | $72,100 |
| 4-Person Families | 869 (36.3%) | $73,147 |
| 5-Person Families | 137 (5.7%) | $100,855 |
| 6-Person Families | 263 (11.0%) | $0 |
| 7+ Person Families | 139 (5.8%) | $170,721 |
| Total | 2,396 (100.0%) | $73,897 |
Family Income by Number of Earners in Travis Ranch
The median family income in Travis Ranch is $73,897, with families comprising 3+ earners (460) having the highest median family income of $142,888, while families with no earners (177) have the lowest median family income of $19,015, accounting for 19.2% and 7.4% of families, respectively.
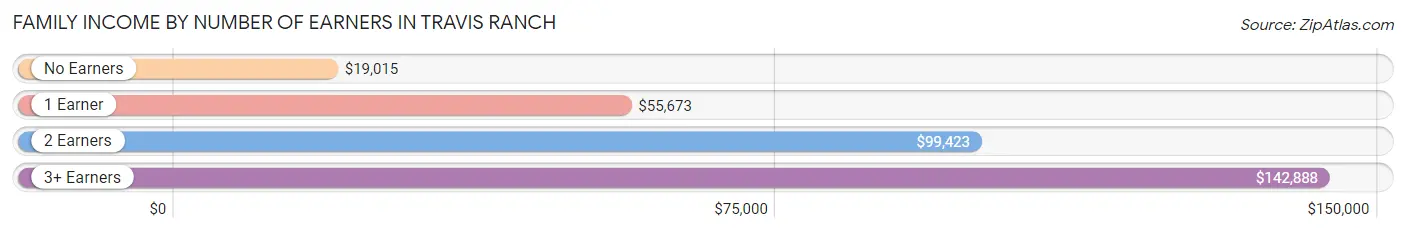
| Number of Earners | # Families | Median Income |
| No Earners | 177 (7.4%) | $19,015 |
| 1 Earner | 651 (27.2%) | $55,673 |
| 2 Earners | 1,108 (46.2%) | $99,423 |
| 3+ Earners | 460 (19.2%) | $142,888 |
| Total | 2,396 (100.0%) | $73,897 |
Household Income in Travis Ranch
Household Income Brackets in Travis Ranch
With 762 households falling in the category, the $50,000 to $74,999 income range is the most frequent in Travis Ranch, accounting for 27.9% of all households. In contrast, only 38 households (1.4%) fall into the $10,000 to $14,999 income bracket, making it the least populous group.
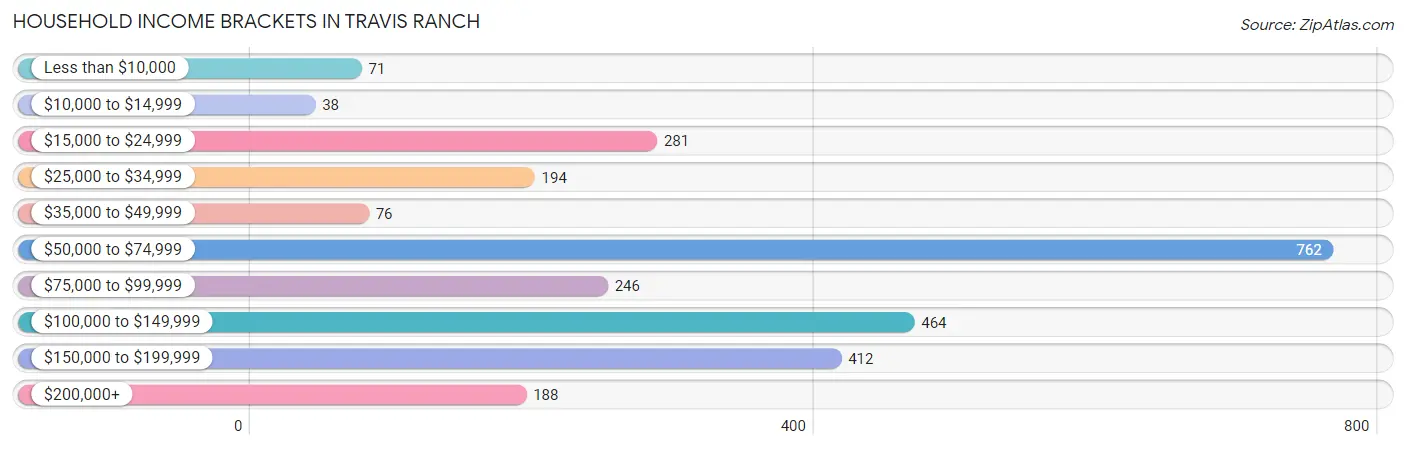
| Income Bracket | # Households | % Households |
| Less than $10,000 | 71 | 2.6% |
| $10,000 to $14,999 | 38 | 1.4% |
| $15,000 to $24,999 | 281 | 10.3% |
| $25,000 to $34,999 | 194 | 7.1% |
| $35,000 to $49,999 | 76 | 2.8% |
| $50,000 to $74,999 | 762 | 27.9% |
| $75,000 to $99,999 | 246 | 9.0% |
| $100,000 to $149,999 | 464 | 17.0% |
| $150,000 to $199,999 | 412 | 15.1% |
| $200,000+ | 188 | 6.9% |
Household Income by Householder Age in Travis Ranch
The median household income in Travis Ranch is $73,804, with the highest median household income of $85,467 found in the 45 to 64 years age bracket for the primary householder. A total of 875 households (32.1%) fall into this category.
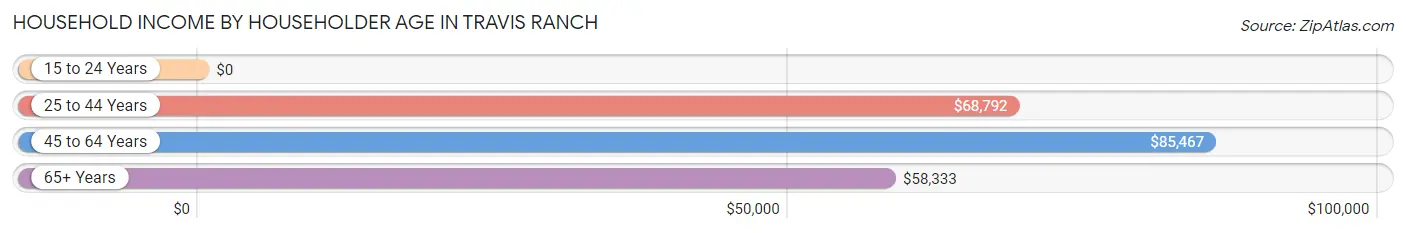
| Income Bracket | # Households | Median Income |
| 15 to 24 Years | 0 (0.0%) | $0 |
| 25 to 44 Years | 1,661 (60.8%) | $68,792 |
| 45 to 64 Years | 875 (32.1%) | $85,467 |
| 65+ Years | 194 (7.1%) | $58,333 |
| Total | 2,730 (100.0%) | $73,804 |
Poverty in Travis Ranch
Income Below Poverty by Sex and Age in Travis Ranch
With 5.4% poverty level for males and 11.0% for females among the residents of Travis Ranch, 75 year old and over males and 15 year old females are the most vulnerable to poverty, with 50 males (50.5%) and 50 females (100.0%) in their respective age groups living below the poverty level.
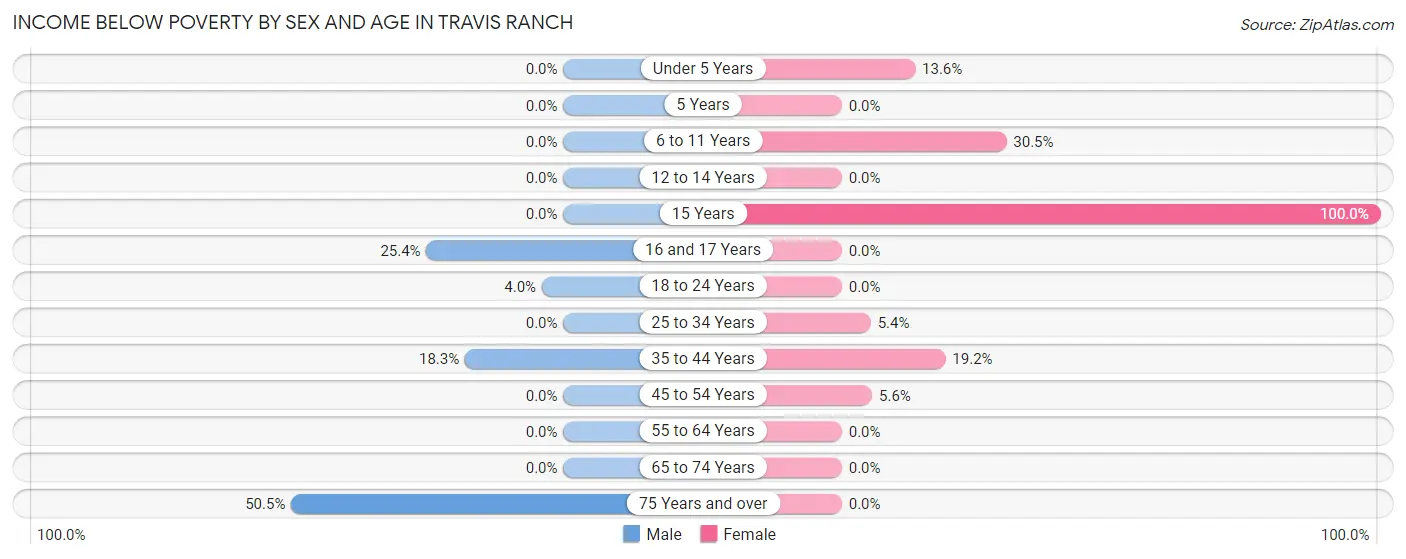
| Age Bracket | Male | Female |
| Under 5 Years | 0 (0.0%) | 60 (13.6%) |
| 5 Years | 0 (0.0%) | 0 (0.0%) |
| 6 to 11 Years | 0 (0.0%) | 135 (30.5%) |
| 12 to 14 Years | 0 (0.0%) | 0 (0.0%) |
| 15 Years | 0 (0.0%) | 50 (100.0%) |
| 16 and 17 Years | 47 (25.4%) | 0 (0.0%) |
| 18 to 24 Years | 15 (4.0%) | 0 (0.0%) |
| 25 to 34 Years | 0 (0.0%) | 39 (5.4%) |
| 35 to 44 Years | 129 (18.2%) | 181 (19.2%) |
| 45 to 54 Years | 0 (0.0%) | 36 (5.6%) |
| 55 to 64 Years | 0 (0.0%) | 0 (0.0%) |
| 65 to 74 Years | 0 (0.0%) | 0 (0.0%) |
| 75 Years and over | 50 (50.5%) | 0 (0.0%) |
| Total | 241 (5.4%) | 501 (11.0%) |
Income Above Poverty by Sex and Age in Travis Ranch
According to the poverty statistics in Travis Ranch, males aged under 5 years and females aged 5 years are the age groups that are most secure financially, with 100.0% of males and 100.0% of females in these age groups living above the poverty line.
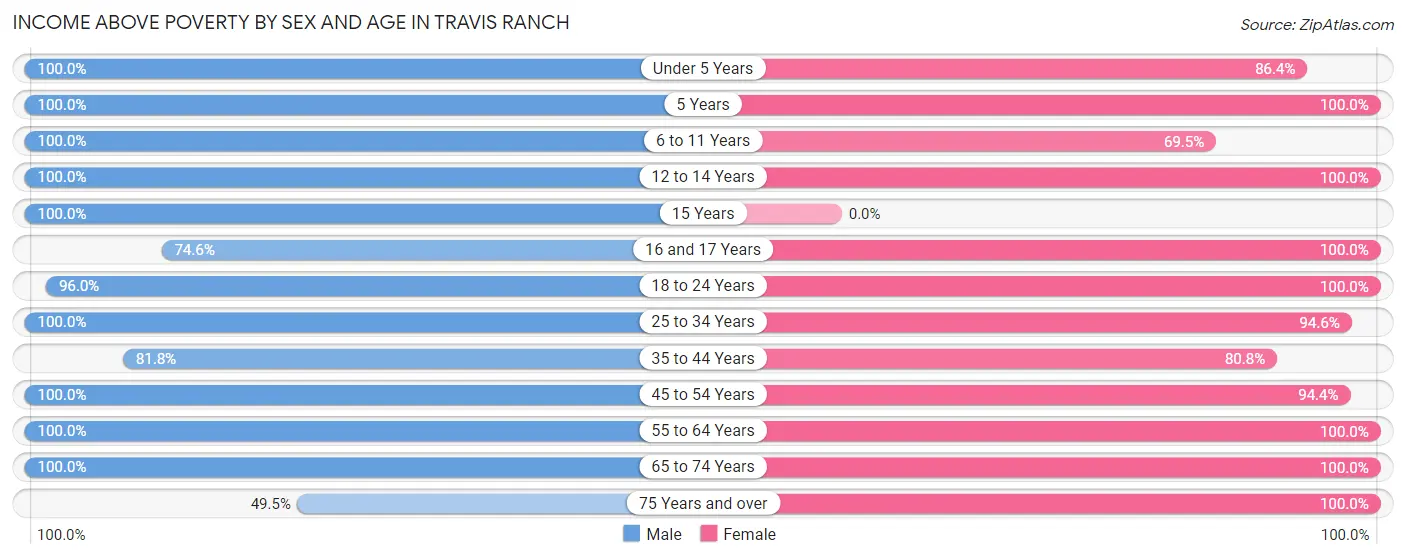
| Age Bracket | Male | Female |
| Under 5 Years | 261 (100.0%) | 381 (86.4%) |
| 5 Years | 68 (100.0%) | 11 (100.0%) |
| 6 to 11 Years | 781 (100.0%) | 307 (69.5%) |
| 12 to 14 Years | 271 (100.0%) | 237 (100.0%) |
| 15 Years | 80 (100.0%) | 0 (0.0%) |
| 16 and 17 Years | 138 (74.6%) | 174 (100.0%) |
| 18 to 24 Years | 363 (96.0%) | 342 (100.0%) |
| 25 to 34 Years | 881 (100.0%) | 687 (94.6%) |
| 35 to 44 Years | 578 (81.8%) | 760 (80.8%) |
| 45 to 54 Years | 189 (100.0%) | 605 (94.4%) |
| 55 to 64 Years | 454 (100.0%) | 280 (100.0%) |
| 65 to 74 Years | 71 (100.0%) | 205 (100.0%) |
| 75 Years and over | 49 (49.5%) | 71 (100.0%) |
| Total | 4,184 (94.6%) | 4,060 (89.0%) |
Income Below Poverty Among Married-Couple Families in Travis Ranch
The poverty statistics for married-couple families in Travis Ranch show that 6.5% or 109 of the total 1,676 families live below the poverty line. Families with 1 or 2 children have the highest poverty rate of 13.0%, comprising of 109 families. On the other hand, families with no children have the lowest poverty rate of 0.0%, which includes 0 families.
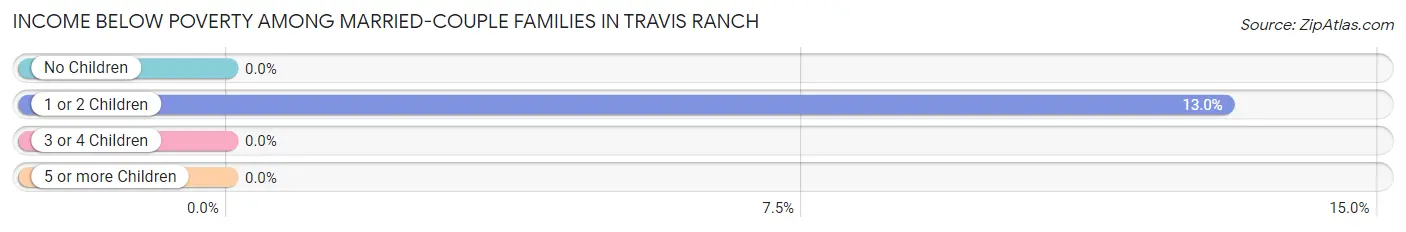
| Children | Above Poverty | Below Poverty |
| No Children | 499 (100.0%) | 0 (0.0%) |
| 1 or 2 Children | 729 (87.0%) | 109 (13.0%) |
| 3 or 4 Children | 339 (100.0%) | 0 (0.0%) |
| 5 or more Children | 0 (0.0%) | 0 (0.0%) |
| Total | 1,567 (93.5%) | 109 (6.5%) |
Income Below Poverty Among Single-Parent Households in Travis Ranch
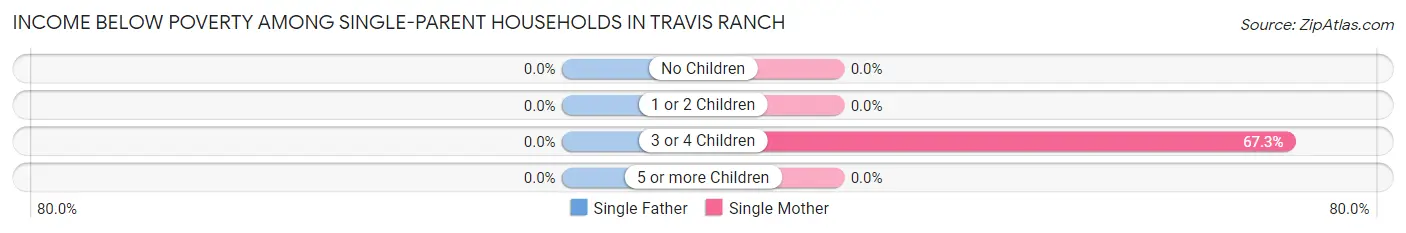
| Children | Single Father | Single Mother |
| No Children | 0 (0.0%) | 0 (0.0%) |
| 1 or 2 Children | 0 (0.0%) | 0 (0.0%) |
| 3 or 4 Children | 0 (0.0%) | 146 (67.3%) |
| 5 or more Children | 0 (0.0%) | 0 (0.0%) |
| Total | 0 (0.0%) | 146 (20.8%) |
Income Below Poverty Among Married-Couple vs Single-Parent Households in Travis Ranch
The poverty data for Travis Ranch shows that 109 of the married-couple family households (6.5%) and 146 of the single-parent households (20.3%) are living below the poverty level. Within the married-couple family households, those with 1 or 2 children have the highest poverty rate, with 109 households (13.0%) falling below the poverty line. Among the single-parent households, those with 3 or 4 children have the highest poverty rate, with 146 household (67.3%) living below poverty.
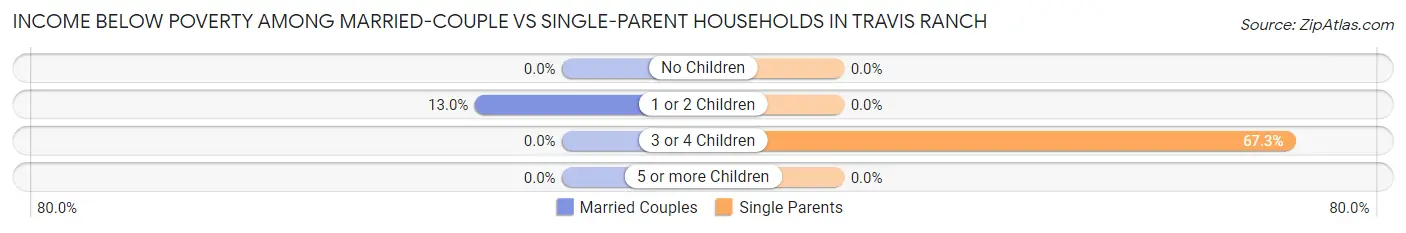
| Children | Married-Couple Families | Single-Parent Households |
| No Children | 0 (0.0%) | 0 (0.0%) |
| 1 or 2 Children | 109 (13.0%) | 0 (0.0%) |
| 3 or 4 Children | 0 (0.0%) | 146 (67.3%) |
| 5 or more Children | 0 (0.0%) | 0 (0.0%) |
| Total | 109 (6.5%) | 146 (20.3%) |
Race in Travis Ranch
The most populous races in Travis Ranch are White / Caucasian (3,467 | 38.4%), Black / African American (2,887 | 32.0%), and Hispanic or Latino (2,159 | 23.9%).
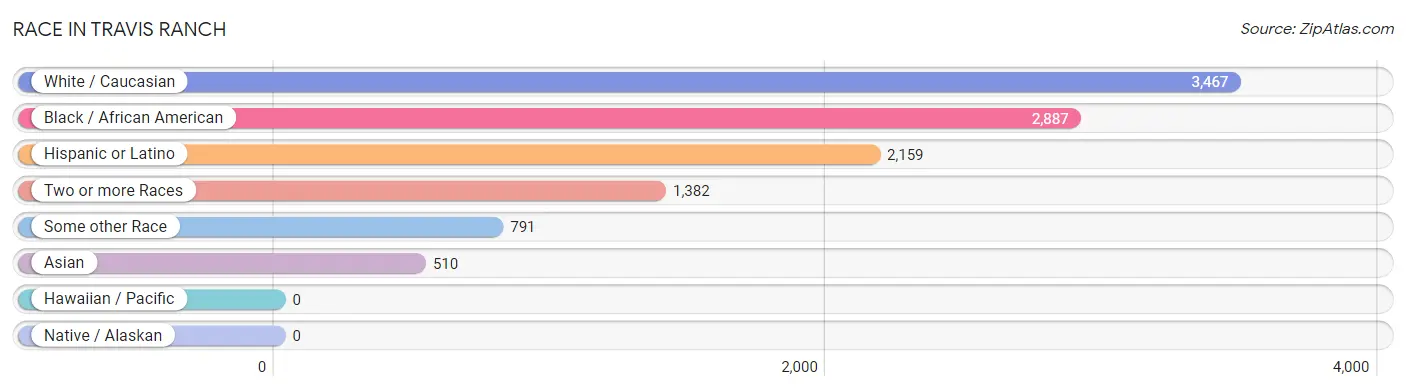
| Race | # Population | % Population |
| Asian | 510 | 5.6% |
| Black / African American | 2,887 | 32.0% |
| Hawaiian / Pacific | 0 | 0.0% |
| Hispanic or Latino | 2,159 | 23.9% |
| Native / Alaskan | 0 | 0.0% |
| White / Caucasian | 3,467 | 38.4% |
| Two or more Races | 1,382 | 15.3% |
| Some other Race | 791 | 8.7% |
| Total | 9,037 | 100.0% |
Ancestry in Travis Ranch
The most populous ancestries reported in Travis Ranch are Mexican (2,016 | 22.3%), Irish (862 | 9.5%), American (702 | 7.8%), German (681 | 7.5%), and Subsaharan African (621 | 6.9%), together accounting for 54.0% of all Travis Ranch residents.
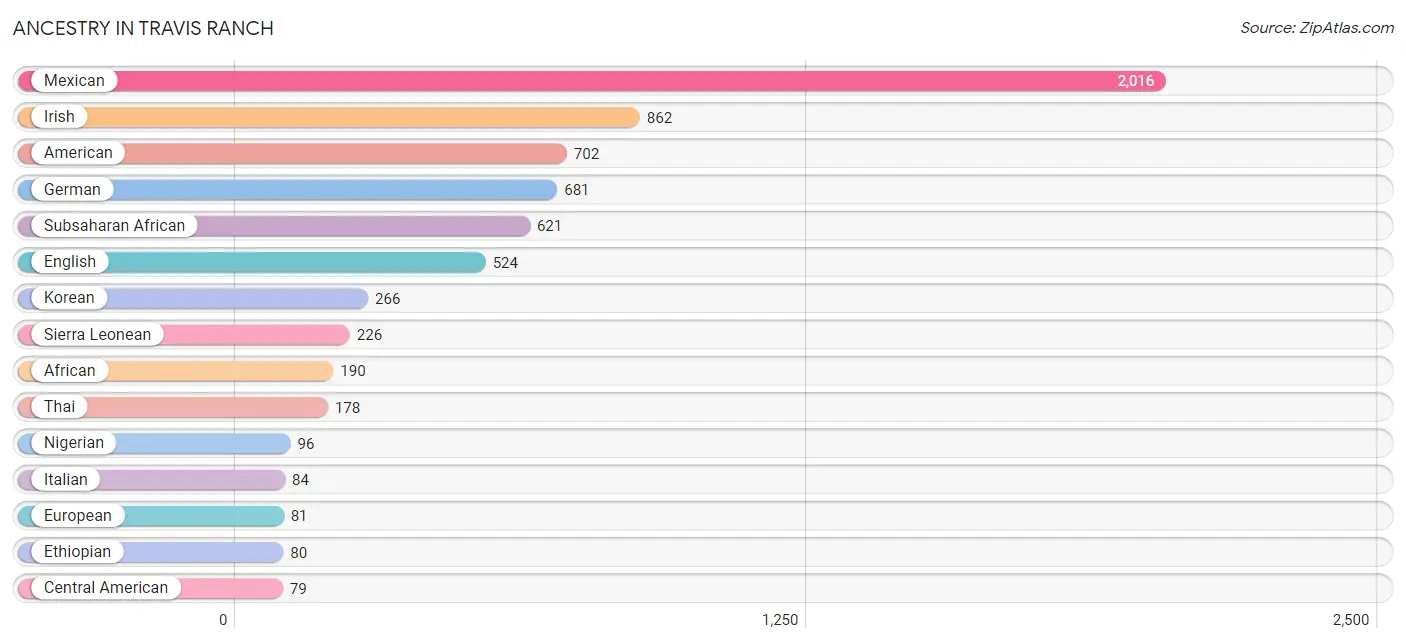
| Ancestry | # Population | % Population |
| African | 190 | 2.1% |
| American | 702 | 7.8% |
| Arab | 9 | 0.1% |
| Burmese | 76 | 0.8% |
| Central American | 79 | 0.9% |
| Dutch | 17 | 0.2% |
| English | 524 | 5.8% |
| Ethiopian | 80 | 0.9% |
| European | 81 | 0.9% |
| French | 58 | 0.6% |
| French Canadian | 23 | 0.3% |
| German | 681 | 7.5% |
| Honduran | 19 | 0.2% |
| Iraqi | 9 | 0.1% |
| Irish | 862 | 9.5% |
| Italian | 84 | 0.9% |
| Kenyan | 29 | 0.3% |
| Korean | 266 | 2.9% |
| Mexican | 2,016 | 22.3% |
| Nigerian | 96 | 1.1% |
| Norwegian | 46 | 0.5% |
| Polish | 33 | 0.4% |
| Puerto Rican | 64 | 0.7% |
| Salvadoran | 60 | 0.7% |
| Scotch-Irish | 36 | 0.4% |
| Scottish | 48 | 0.5% |
| Sierra Leonean | 226 | 2.5% |
| Subsaharan African | 621 | 6.9% |
| Thai | 178 | 2.0% |
| Yaqui | 12 | 0.1% | View All 30 Rows |
Immigrants in Travis Ranch
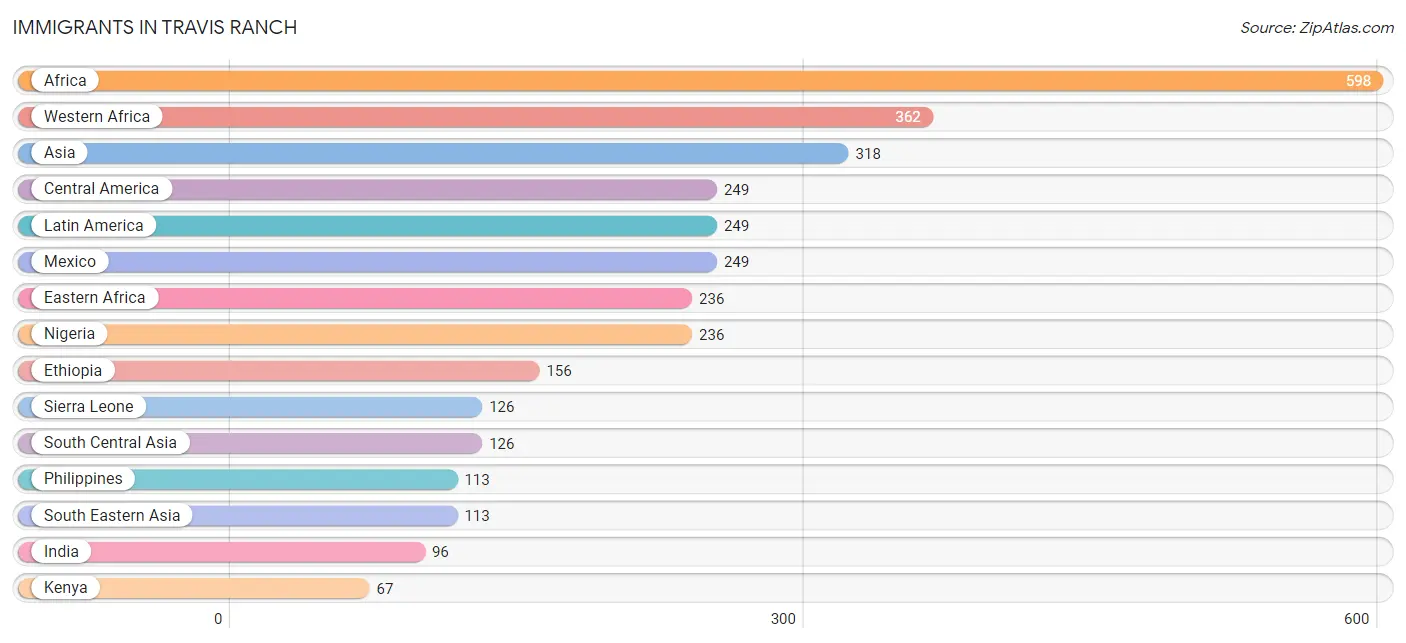
The most numerous immigrant groups reported in Travis Ranch came from Africa (598 | 6.6%), Western Africa (362 | 4.0%), Asia (318 | 3.5%), Central America (249 | 2.8%), and Latin America (249 | 2.8%), together accounting for 19.7% of all Travis Ranch residents.
| Immigration Origin | # Population | % Population |
| Africa | 598 | 6.6% |
| Asia | 318 | 3.5% |
| Central America | 249 | 2.8% |
| Eastern Africa | 236 | 2.6% |
| Eastern Asia | 30 | 0.3% |
| Eritrea | 13 | 0.1% |
| Ethiopia | 156 | 1.7% |
| India | 96 | 1.1% |
| Iraq | 9 | 0.1% |
| Jordan | 20 | 0.2% |
| Kenya | 67 | 0.7% |
| Korea | 30 | 0.3% |
| Latin America | 249 | 2.8% |
| Mexico | 249 | 2.8% |
| Nigeria | 236 | 2.6% |
| Pakistan | 30 | 0.3% |
| Philippines | 113 | 1.3% |
| Saudi Arabia | 20 | 0.2% |
| Sierra Leone | 126 | 1.4% |
| South Central Asia | 126 | 1.4% |
| South Eastern Asia | 113 | 1.3% |
| Western Africa | 362 | 4.0% |
| Western Asia | 49 | 0.5% | View All 23 Rows |
Sex and Age in Travis Ranch
Sex and Age in Travis Ranch
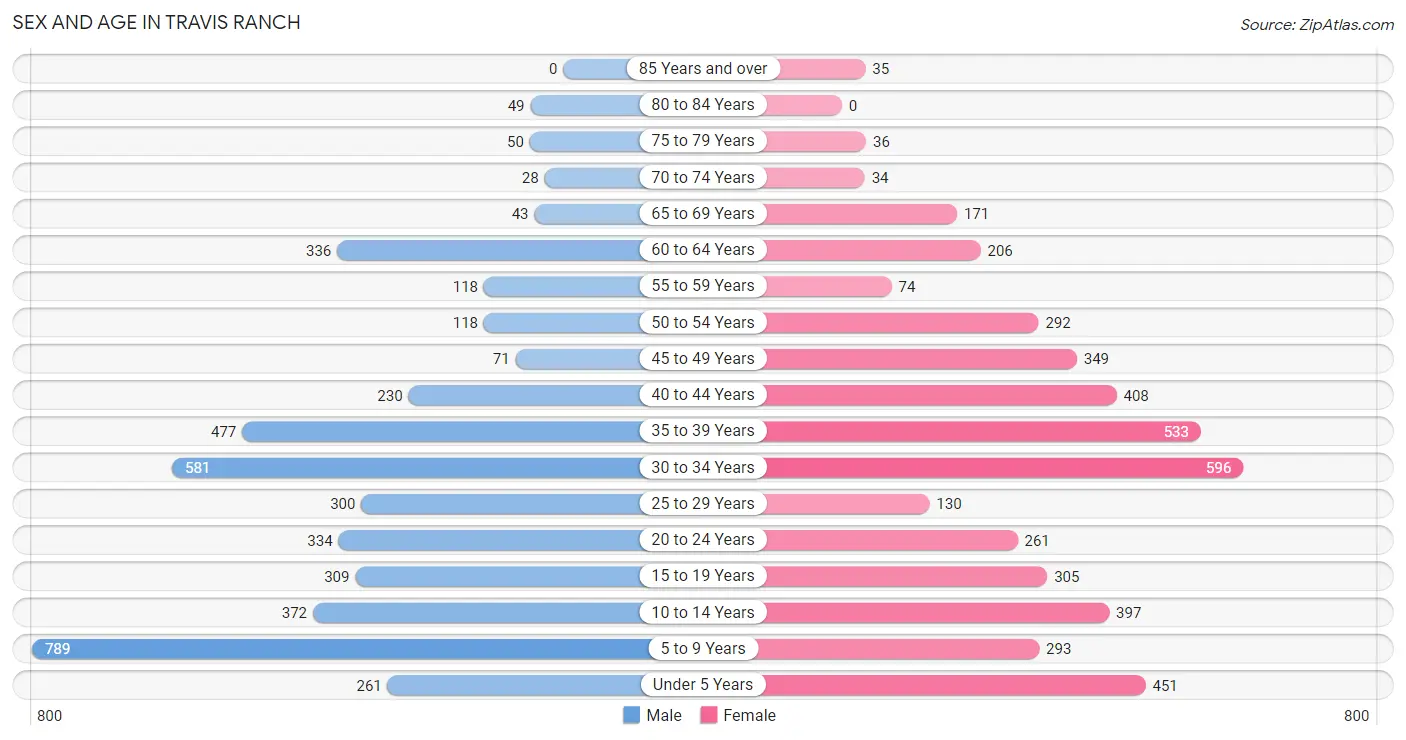
The most populous age groups in Travis Ranch are 5 to 9 Years (789 | 17.7%) for men and 30 to 34 Years (596 | 13.0%) for women.
| Age Bracket | Male | Female |
| Under 5 Years | 261 (5.8%) | 451 (9.9%) |
| 5 to 9 Years | 789 (17.7%) | 293 (6.4%) |
| 10 to 14 Years | 372 (8.3%) | 397 (8.7%) |
| 15 to 19 Years | 309 (6.9%) | 305 (6.7%) |
| 20 to 24 Years | 334 (7.5%) | 261 (5.7%) |
| 25 to 29 Years | 300 (6.7%) | 130 (2.8%) |
| 30 to 34 Years | 581 (13.0%) | 596 (13.0%) |
| 35 to 39 Years | 477 (10.7%) | 533 (11.7%) |
| 40 to 44 Years | 230 (5.1%) | 408 (8.9%) |
| 45 to 49 Years | 71 (1.6%) | 349 (7.6%) |
| 50 to 54 Years | 118 (2.6%) | 292 (6.4%) |
| 55 to 59 Years | 118 (2.6%) | 74 (1.6%) |
| 60 to 64 Years | 336 (7.5%) | 206 (4.5%) |
| 65 to 69 Years | 43 (1.0%) | 171 (3.7%) |
| 70 to 74 Years | 28 (0.6%) | 34 (0.7%) |
| 75 to 79 Years | 50 (1.1%) | 36 (0.8%) |
| 80 to 84 Years | 49 (1.1%) | 0 (0.0%) |
| 85 Years and over | 0 (0.0%) | 35 (0.8%) |
| Total | 4,466 (100.0%) | 4,571 (100.0%) |
Families and Households in Travis Ranch
Median Family Size in Travis Ranch
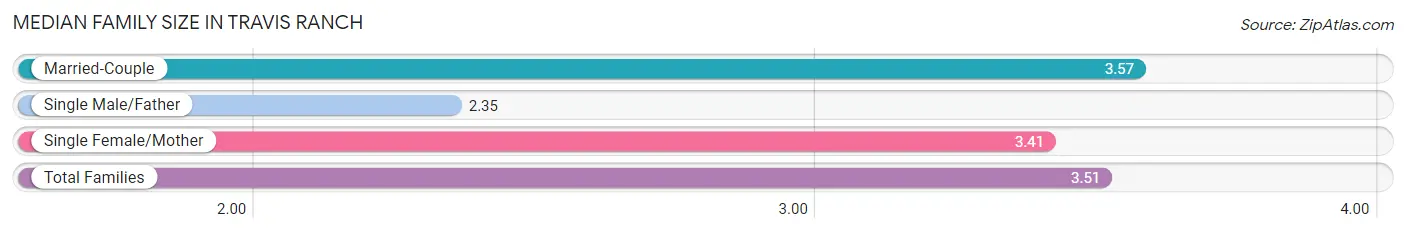
The median family size in Travis Ranch is 3.51 persons per family, with married-couple families (1,676 | 70.0%) accounting for the largest median family size of 3.57 persons per family. On the other hand, single male/father families (17 | 0.7%) represent the smallest median family size with 2.35 persons per family.
| Family Type | # Families | Family Size |
| Married-Couple | 1,676 (70.0%) | 3.57 |
| Single Male/Father | 17 (0.7%) | 2.35 |
| Single Female/Mother | 703 (29.3%) | 3.41 |
| Total Families | 2,396 (100.0%) | 3.51 |
Median Household Size in Travis Ranch
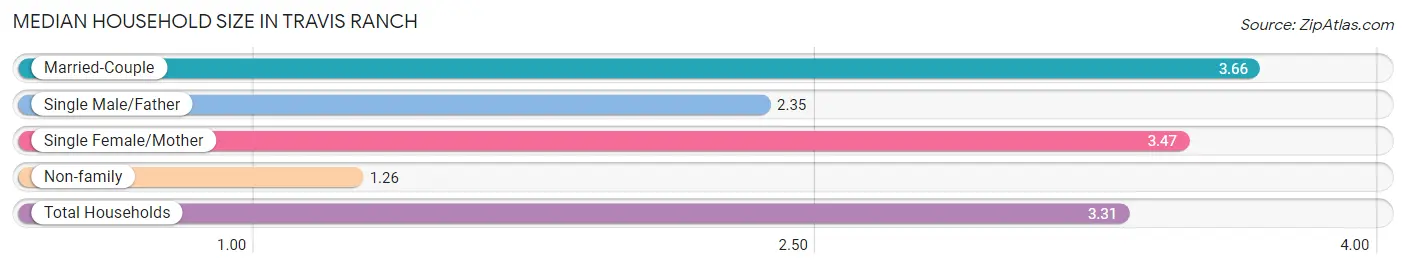
The median household size in Travis Ranch is 3.31 persons per household, with married-couple households (1,676 | 61.4%) accounting for the largest median household size of 3.66 persons per household. non-family households (334 | 12.2%) represent the smallest median household size with 1.26 persons per household.
| Household Type | # Households | Household Size |
| Married-Couple | 1,676 (61.4%) | 3.66 |
| Single Male/Father | 17 (0.6%) | 2.35 |
| Single Female/Mother | 703 (25.8%) | 3.47 |
| Non-family | 334 (12.2%) | 1.26 |
| Total Households | 2,730 (100.0%) | 3.31 |
Household Size by Marriage Status in Travis Ranch
Out of a total of 2,730 households in Travis Ranch, 2,396 (87.8%) are family households, while 334 (12.2%) are nonfamily households. The most numerous type of family households are 4-person households, comprising 819, and the most common type of nonfamily households are 1-person households, comprising 248.
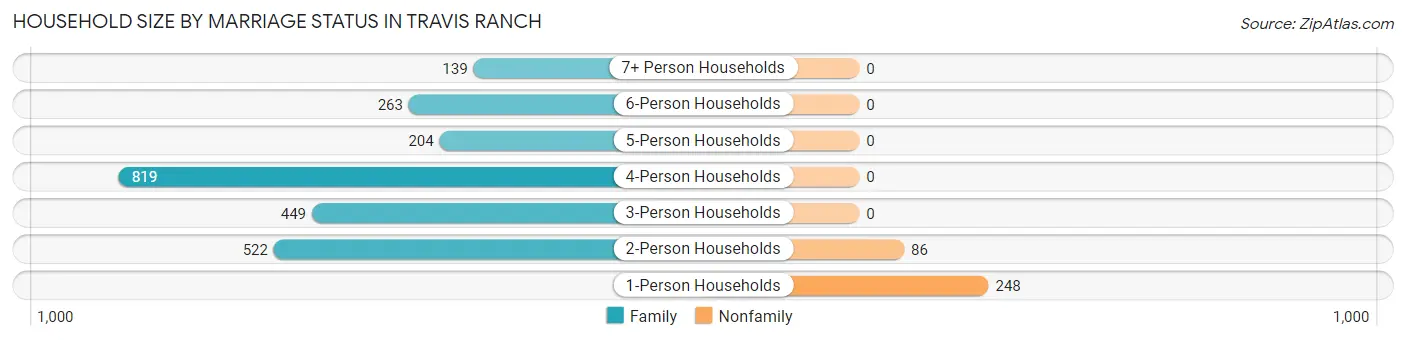
| Household Size | Family Households | Nonfamily Households |
| 1-Person Households | - | 248 (9.1%) |
| 2-Person Households | 522 (19.1%) | 86 (3.2%) |
| 3-Person Households | 449 (16.5%) | 0 (0.0%) |
| 4-Person Households | 819 (30.0%) | 0 (0.0%) |
| 5-Person Households | 204 (7.5%) | 0 (0.0%) |
| 6-Person Households | 263 (9.6%) | 0 (0.0%) |
| 7+ Person Households | 139 (5.1%) | 0 (0.0%) |
| Total | 2,396 (87.8%) | 334 (12.2%) |
Female Fertility in Travis Ranch
Fertility by Age in Travis Ranch
Average fertility rate in Travis Ranch is 85.0 births per 1,000 women. Women in the age bracket of 20 to 34 years have the highest fertility rate with 133.0 births per 1,000 women. Women in the age bracket of 20 to 34 years acount for 59.0% of all women with births.
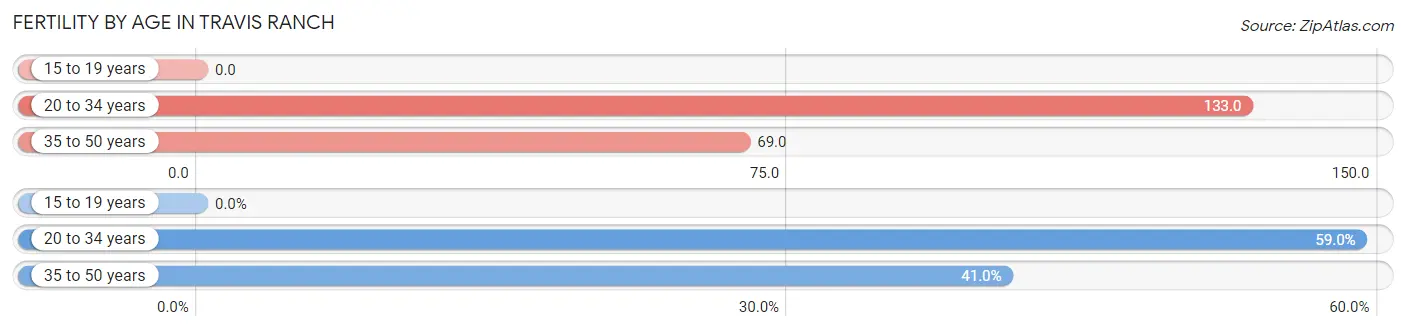
| Age Bracket | Women with Births | Births / 1,000 Women |
| 15 to 19 years | 0 (0.0%) | 0.0 |
| 20 to 34 years | 131 (59.0%) | 133.0 |
| 35 to 50 years | 91 (41.0%) | 69.0 |
| Total | 222 (100.0%) | 85.0 |
Fertility by Age by Marriage Status in Travis Ranch
87.4% of women with births (222) in Travis Ranch are married. The highest percentage of unmarried women with births falls into 20 to 34 years age bracket with 21.4% of them unmarried at the time of birth, while the lowest percentage of unmarried women with births belong to 35 to 50 years age bracket with 0.0% of them unmarried.
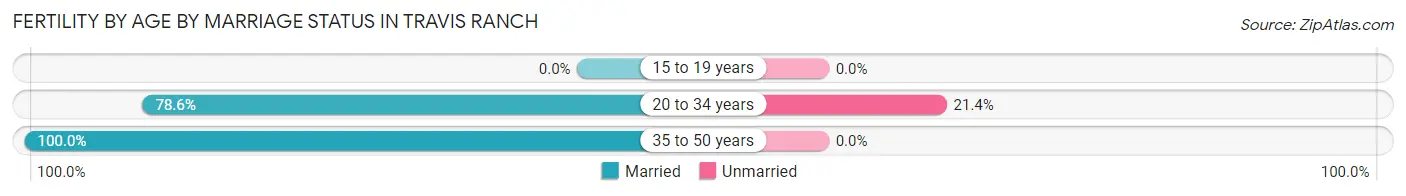
| Age Bracket | Married | Unmarried |
| 15 to 19 years | 0 (0.0%) | 0 (0.0%) |
| 20 to 34 years | 103 (78.6%) | 28 (21.4%) |
| 35 to 50 years | 91 (100.0%) | 0 (0.0%) |
| Total | 194 (87.4%) | 28 (12.6%) |
Fertility by Education in Travis Ranch
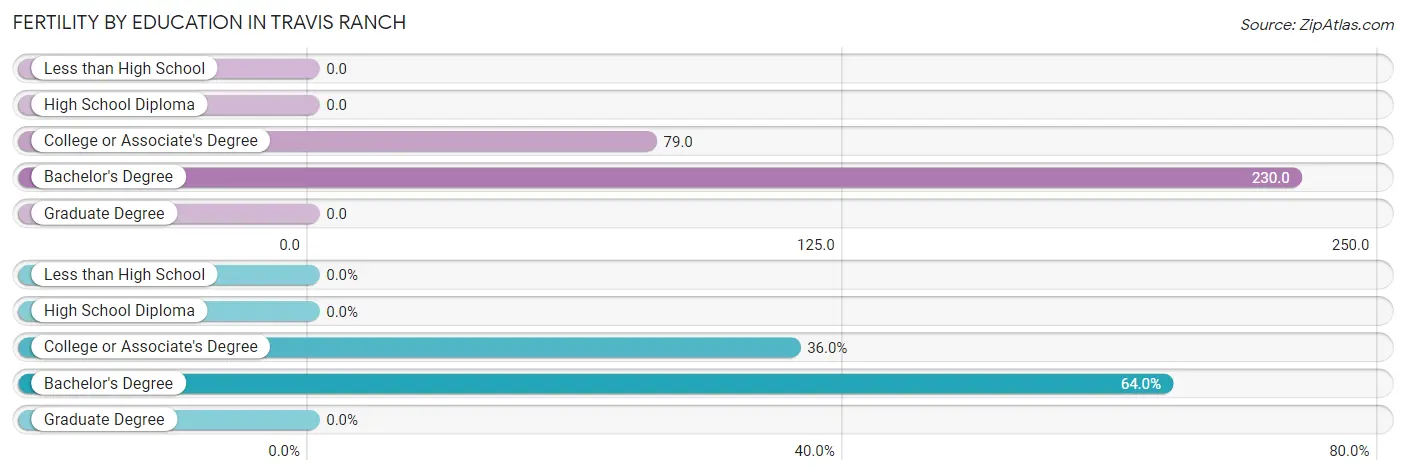
| Educational Attainment | Women with Births | Births / 1,000 Women |
| Less than High School | 0 (0.0%) | 0.0 |
| High School Diploma | 0 (0.0%) | 0.0 |
| College or Associate's Degree | 80 (36.0%) | 79.0 |
| Bachelor's Degree | 142 (64.0%) | 230.0 |
| Graduate Degree | 0 (0.0%) | 0.0 |
| Total | 222 (100.0%) | 85.0 |
Fertility by Education by Marriage Status in Travis Ranch
12.6% of women with births in Travis Ranch are unmarried. Women with the educational attainment of bachelor's degree are most likely to be married with 100.0% of them married at childbirth, while women with the educational attainment of college or associate's degree are least likely to be married with 35.0% of them unmarried at childbirth.
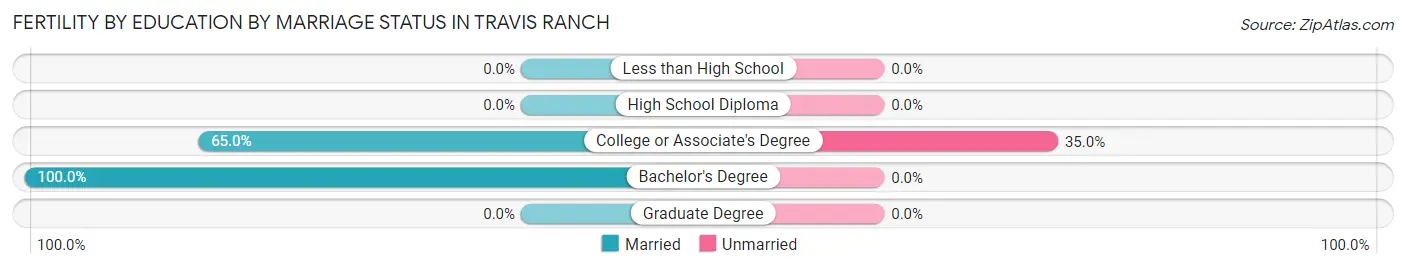
| Educational Attainment | Married | Unmarried |
| Less than High School | 0 (0.0%) | 0 (0.0%) |
| High School Diploma | 0 (0.0%) | 0 (0.0%) |
| College or Associate's Degree | 52 (65.0%) | 28 (35.0%) |
| Bachelor's Degree | 142 (100.0%) | 0 (0.0%) |
| Graduate Degree | 0 (0.0%) | 0 (0.0%) |
| Total | 194 (87.4%) | 28 (12.6%) |
Employment Characteristics in Travis Ranch
Employment by Class of Employer in Travis Ranch
Among the 4,299 employed individuals in Travis Ranch, private company employees (2,857 | 66.5%), not-for-profit organizations (477 | 11.1%), and federal government employees (271 | 6.3%) make up the most common classes of employment.
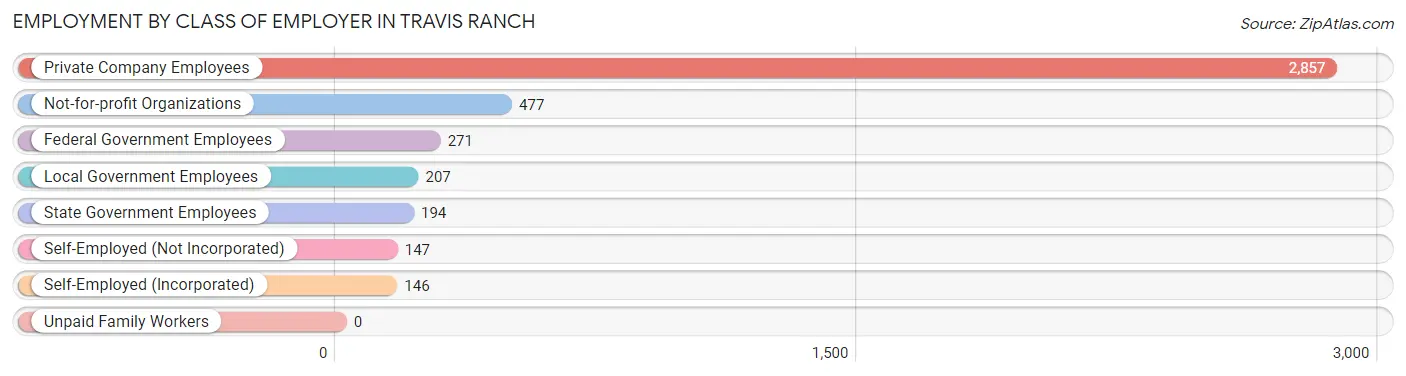
| Employer Class | # Employees | % Employees |
| Private Company Employees | 2,857 | 66.5% |
| Self-Employed (Incorporated) | 146 | 3.4% |
| Self-Employed (Not Incorporated) | 147 | 3.4% |
| Not-for-profit Organizations | 477 | 11.1% |
| Local Government Employees | 207 | 4.8% |
| State Government Employees | 194 | 4.5% |
| Federal Government Employees | 271 | 6.3% |
| Unpaid Family Workers | 0 | 0.0% |
| Total | 4,299 | 100.0% |
Employment Status by Age in Travis Ranch
According to the labor force statistics for Travis Ranch, out of the total population over 16 years of age (6,344), 71.7% or 4,549 individuals are in the labor force, with 2.6% or 118 of them unemployed. The age group with the highest labor force participation rate is 25 to 29 years, with 100.0% or 430 individuals in the labor force. Within the labor force, the 20 to 24 years age range has the highest percentage of unemployed individuals, with 6.3% or 28 of them being unemployed.
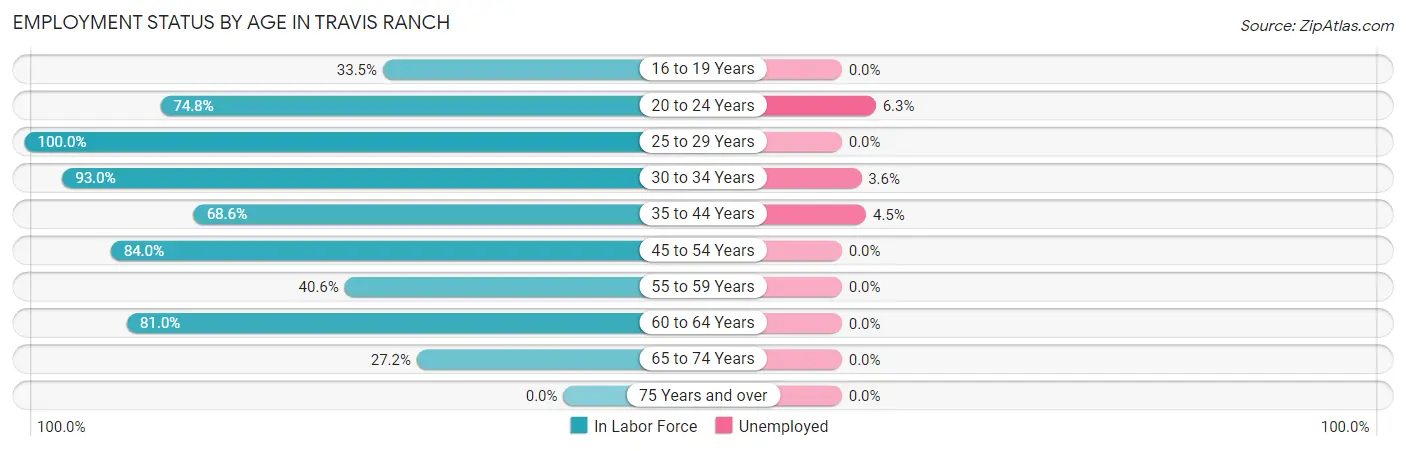
| Age Bracket | In Labor Force | Unemployed |
| 16 to 19 Years | 162 (33.5%) | 0 (0.0%) |
| 20 to 24 Years | 445 (74.8%) | 28 (6.3%) |
| 25 to 29 Years | 430 (100.0%) | 0 (0.0%) |
| 30 to 34 Years | 1,095 (93.0%) | 39 (3.6%) |
| 35 to 44 Years | 1,131 (68.6%) | 51 (4.5%) |
| 45 to 54 Years | 697 (84.0%) | 0 (0.0%) |
| 55 to 59 Years | 78 (40.6%) | 0 (0.0%) |
| 60 to 64 Years | 439 (81.0%) | 0 (0.0%) |
| 65 to 74 Years | 75 (27.2%) | 0 (0.0%) |
| 75 Years and over | 0 (0.0%) | 0 (0.0%) |
| Total | 4,549 (71.7%) | 118 (2.6%) |
Employment Status by Educational Attainment in Travis Ranch
According to labor force statistics for Travis Ranch, 80.3% of individuals (3,870) out of the total population between 25 and 64 years of age (4,819) are in the labor force, with 2.3% or 89 of them being unemployed. The group with the highest labor force participation rate are those with the educational attainment of high school diploma, with 94.0% or 772 individuals in the labor force. Within the labor force, individuals with college / associate degree education have the highest percentage of unemployment, with 3.5% or 61 of them being unemployed.
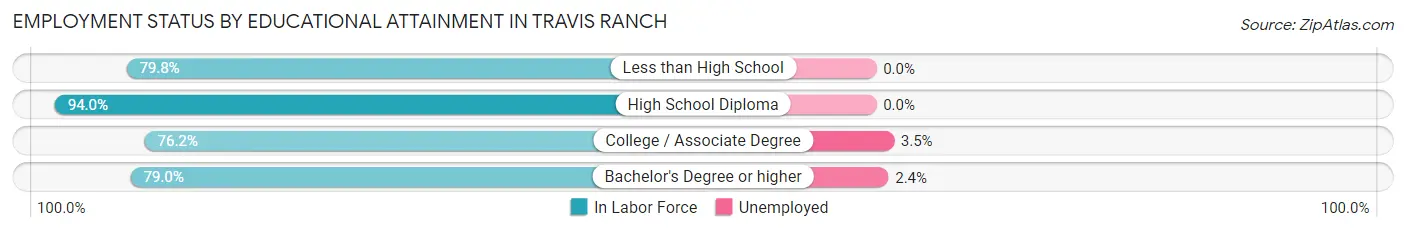
| Educational Attainment | In Labor Force | Unemployed |
| Less than High School | 138 (79.8%) | 0 (0.0%) |
| High School Diploma | 772 (94.0%) | 0 (0.0%) |
| College / Associate Degree | 1,733 (76.2%) | 80 (3.5%) |
| Bachelor's Degree or higher | 1,225 (79.0%) | 37 (2.4%) |
| Total | 3,870 (80.3%) | 111 (2.3%) |
Employment Occupations by Sex in Travis Ranch
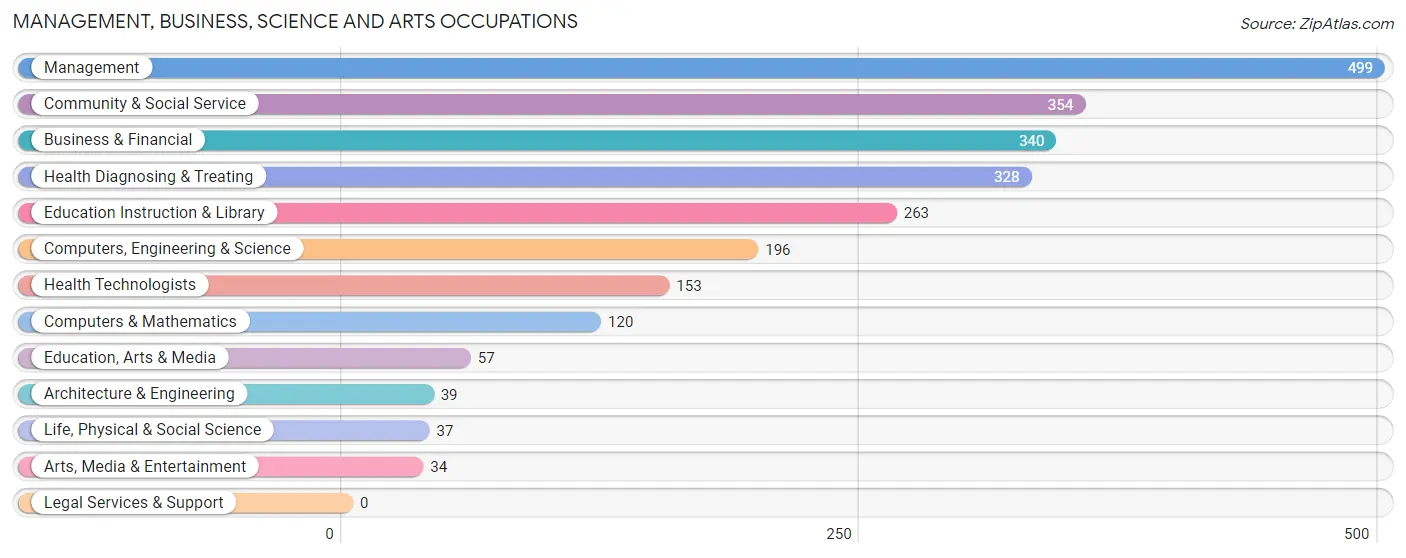
Management, Business, Science and Arts Occupations
The most common Management, Business, Science and Arts occupations in Travis Ranch are Management (499 | 11.3%), Community & Social Service (354 | 8.0%), Business & Financial (340 | 7.7%), Health Diagnosing & Treating (328 | 7.4%), and Education Instruction & Library (263 | 5.9%).
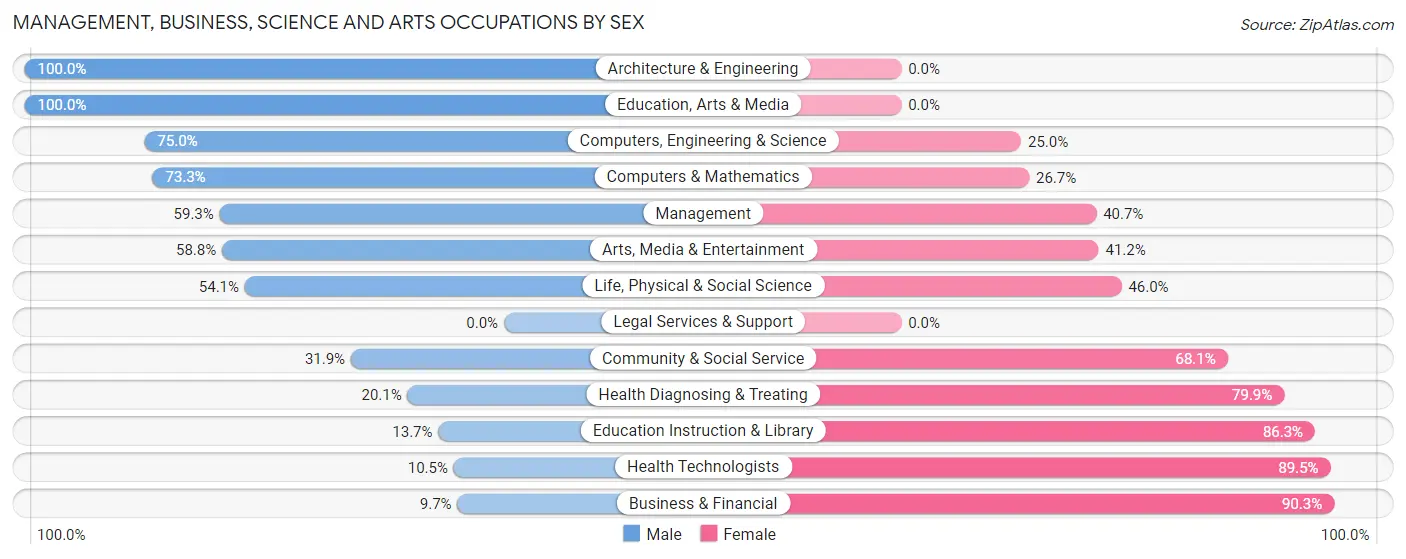
Management, Business, Science and Arts Occupations by Sex
Within the Management, Business, Science and Arts occupations in Travis Ranch, the most male-oriented occupations are Architecture & Engineering (100.0%), Education, Arts & Media (100.0%), and Computers, Engineering & Science (75.0%), while the most female-oriented occupations are Business & Financial (90.3%), Health Technologists (89.5%), and Education Instruction & Library (86.3%).
| Occupation | Male | Female |
| Management | 296 (59.3%) | 203 (40.7%) |
| Business & Financial | 33 (9.7%) | 307 (90.3%) |
| Computers, Engineering & Science | 147 (75.0%) | 49 (25.0%) |
| Computers & Mathematics | 88 (73.3%) | 32 (26.7%) |
| Architecture & Engineering | 39 (100.0%) | 0 (0.0%) |
| Life, Physical & Social Science | 20 (54.0%) | 17 (46.0%) |
| Community & Social Service | 113 (31.9%) | 241 (68.1%) |
| Education, Arts & Media | 57 (100.0%) | 0 (0.0%) |
| Legal Services & Support | 0 (0.0%) | 0 (0.0%) |
| Education Instruction & Library | 36 (13.7%) | 227 (86.3%) |
| Arts, Media & Entertainment | 20 (58.8%) | 14 (41.2%) |
| Health Diagnosing & Treating | 66 (20.1%) | 262 (79.9%) |
| Health Technologists | 16 (10.5%) | 137 (89.5%) |
| Total (Category) | 655 (38.2%) | 1,062 (61.9%) |
| Total (Overall) | 2,380 (53.7%) | 2,053 (46.3%) |
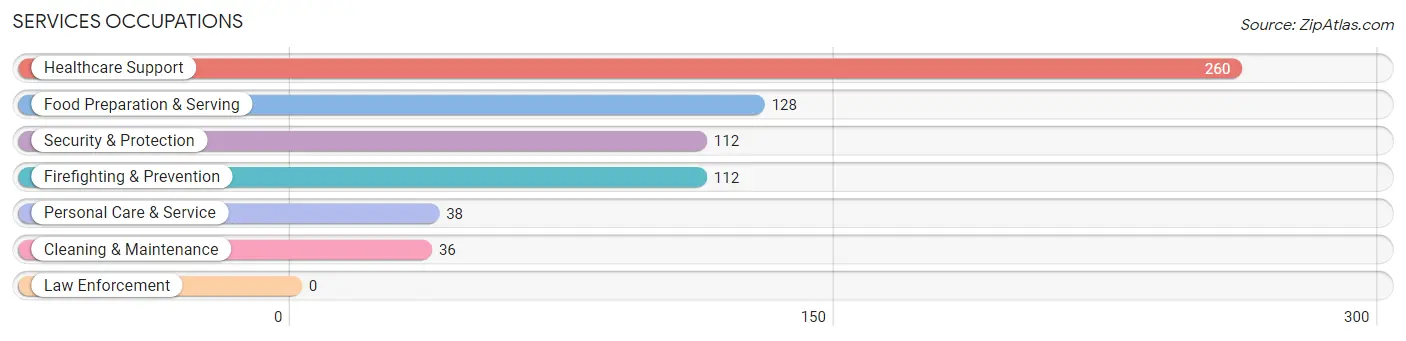
Services Occupations
The most common Services occupations in Travis Ranch are Healthcare Support (260 | 5.9%), Food Preparation & Serving (128 | 2.9%), Security & Protection (112 | 2.5%), Firefighting & Prevention (112 | 2.5%), and Personal Care & Service (38 | 0.9%).
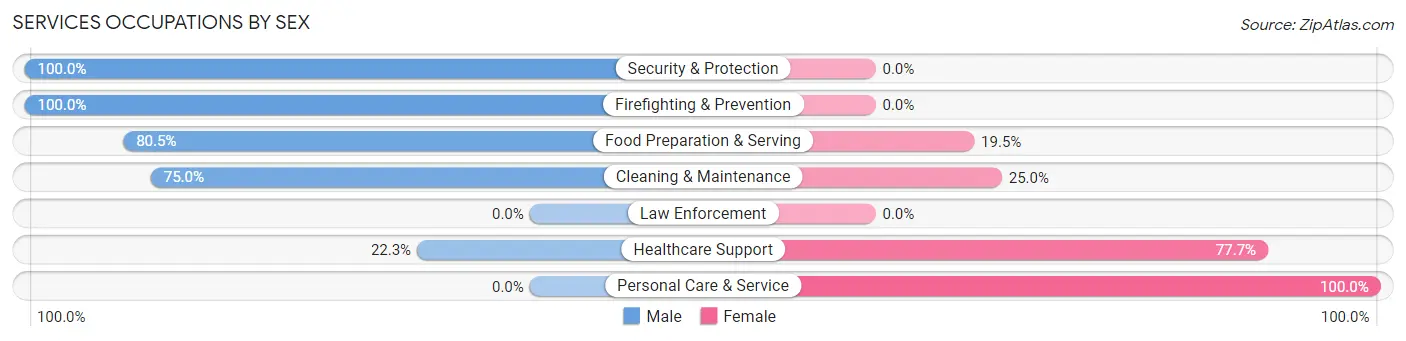
Services Occupations by Sex
Within the Services occupations in Travis Ranch, the most male-oriented occupations are Security & Protection (100.0%), Firefighting & Prevention (100.0%), and Food Preparation & Serving (80.5%), while the most female-oriented occupations are Personal Care & Service (100.0%), Healthcare Support (77.7%), and Cleaning & Maintenance (25.0%).
| Occupation | Male | Female |
| Healthcare Support | 58 (22.3%) | 202 (77.7%) |
| Security & Protection | 112 (100.0%) | 0 (0.0%) |
| Firefighting & Prevention | 112 (100.0%) | 0 (0.0%) |
| Law Enforcement | 0 (0.0%) | 0 (0.0%) |
| Food Preparation & Serving | 103 (80.5%) | 25 (19.5%) |
| Cleaning & Maintenance | 27 (75.0%) | 9 (25.0%) |
| Personal Care & Service | 0 (0.0%) | 38 (100.0%) |
| Total (Category) | 300 (52.3%) | 274 (47.7%) |
| Total (Overall) | 2,380 (53.7%) | 2,053 (46.3%) |
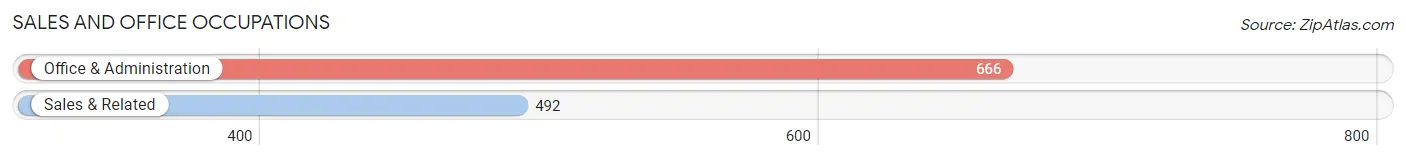
Sales and Office Occupations
The most common Sales and Office occupations in Travis Ranch are Office & Administration (666 | 15.0%), and Sales & Related (492 | 11.1%).
Sales and Office Occupations by Sex
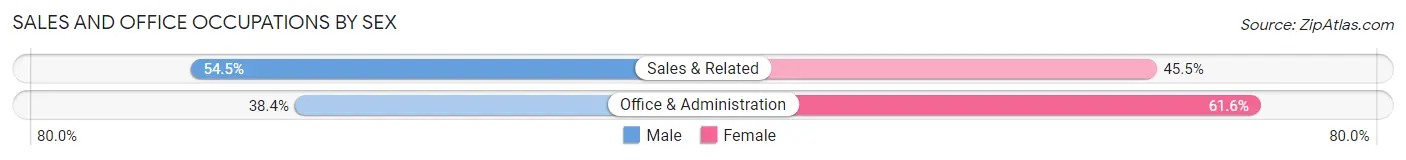
| Occupation | Male | Female |
| Sales & Related | 268 (54.5%) | 224 (45.5%) |
| Office & Administration | 256 (38.4%) | 410 (61.6%) |
| Total (Category) | 524 (45.3%) | 634 (54.7%) |
| Total (Overall) | 2,380 (53.7%) | 2,053 (46.3%) |
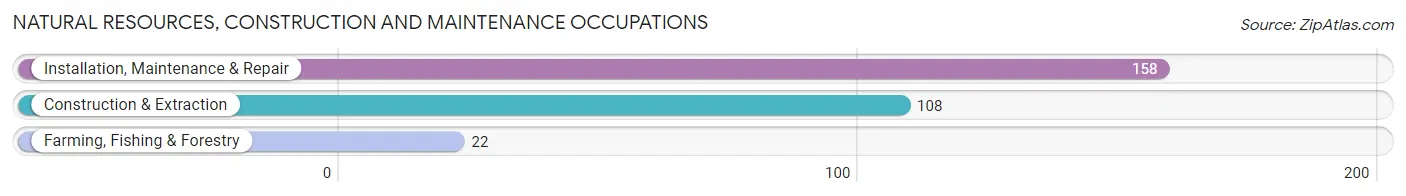
Natural Resources, Construction and Maintenance Occupations
The most common Natural Resources, Construction and Maintenance occupations in Travis Ranch are Installation, Maintenance & Repair (158 | 3.6%), Construction & Extraction (108 | 2.4%), and Farming, Fishing & Forestry (22 | 0.5%).
Natural Resources, Construction and Maintenance Occupations by Sex
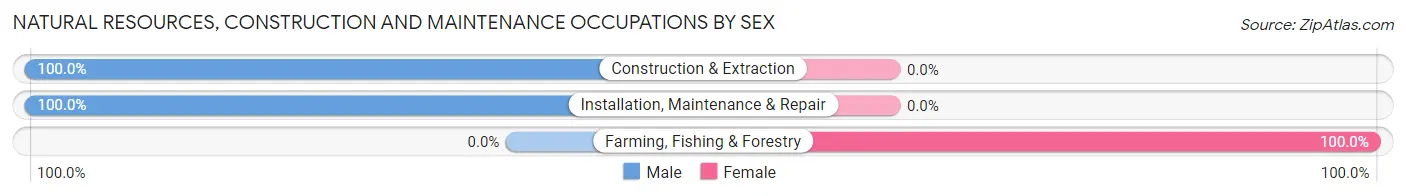
| Occupation | Male | Female |
| Farming, Fishing & Forestry | 0 (0.0%) | 22 (100.0%) |
| Construction & Extraction | 108 (100.0%) | 0 (0.0%) |
| Installation, Maintenance & Repair | 158 (100.0%) | 0 (0.0%) |
| Total (Category) | 266 (92.4%) | 22 (7.6%) |
| Total (Overall) | 2,380 (53.7%) | 2,053 (46.3%) |
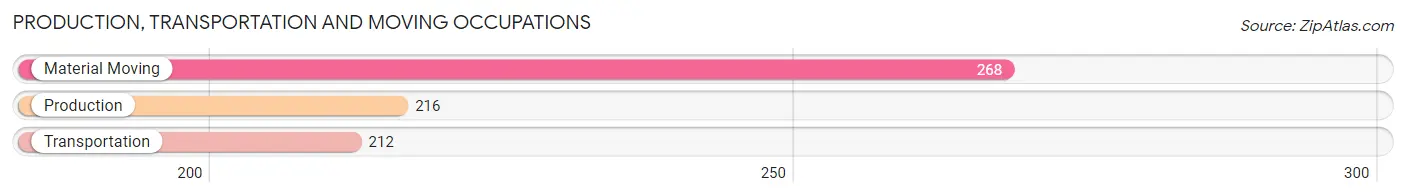
Production, Transportation and Moving Occupations
The most common Production, Transportation and Moving occupations in Travis Ranch are Material Moving (268 | 6.0%), Production (216 | 4.9%), and Transportation (212 | 4.8%).
Production, Transportation and Moving Occupations by Sex
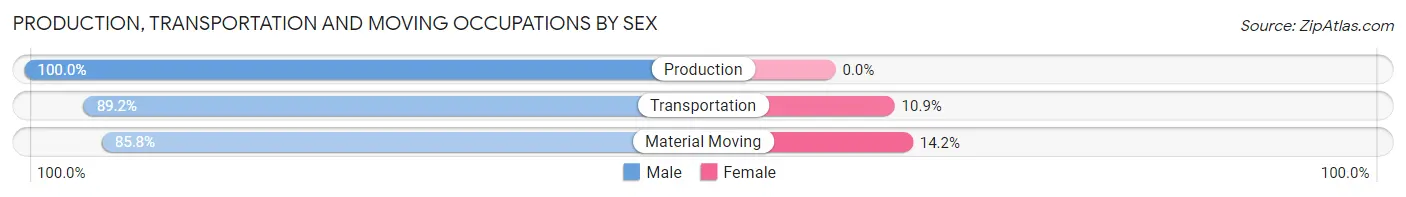
| Occupation | Male | Female |
| Production | 216 (100.0%) | 0 (0.0%) |
| Transportation | 189 (89.1%) | 23 (10.8%) |
| Material Moving | 230 (85.8%) | 38 (14.2%) |
| Total (Category) | 635 (91.2%) | 61 (8.8%) |
| Total (Overall) | 2,380 (53.7%) | 2,053 (46.3%) |
Employment Industries by Sex in Travis Ranch
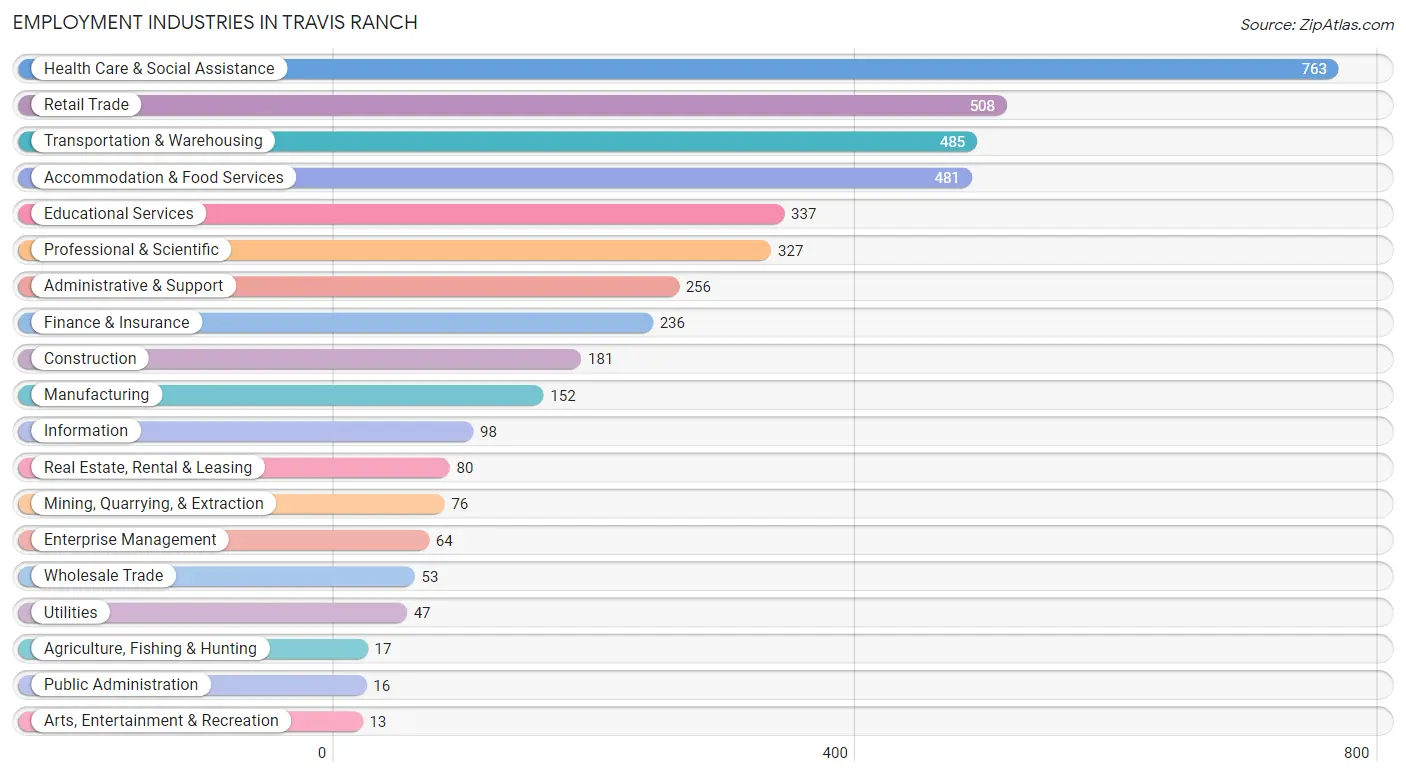
Employment Industries in Travis Ranch
The major employment industries in Travis Ranch include Health Care & Social Assistance (763 | 17.2%), Retail Trade (508 | 11.5%), Transportation & Warehousing (485 | 10.9%), Accommodation & Food Services (481 | 10.8%), and Educational Services (337 | 7.6%).
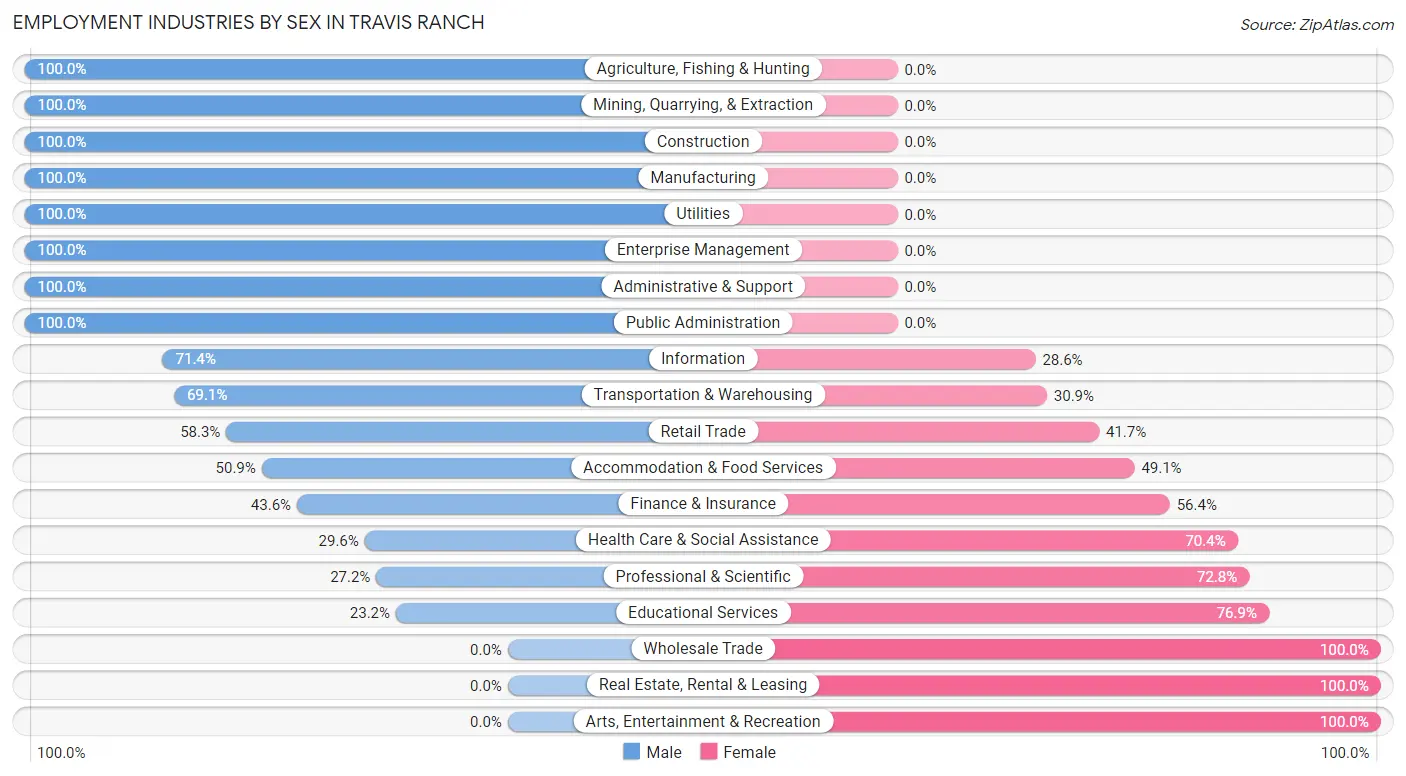
Employment Industries by Sex in Travis Ranch
The Travis Ranch industries that see more men than women are Agriculture, Fishing & Hunting (100.0%), Mining, Quarrying, & Extraction (100.0%), and Construction (100.0%), whereas the industries that tend to have a higher number of women are Wholesale Trade (100.0%), Real Estate, Rental & Leasing (100.0%), and Arts, Entertainment & Recreation (100.0%).
| Industry | Male | Female |
| Agriculture, Fishing & Hunting | 17 (100.0%) | 0 (0.0%) |
| Mining, Quarrying, & Extraction | 76 (100.0%) | 0 (0.0%) |
| Construction | 181 (100.0%) | 0 (0.0%) |
| Manufacturing | 152 (100.0%) | 0 (0.0%) |
| Wholesale Trade | 0 (0.0%) | 53 (100.0%) |
| Retail Trade | 296 (58.3%) | 212 (41.7%) |
| Transportation & Warehousing | 335 (69.1%) | 150 (30.9%) |
| Utilities | 47 (100.0%) | 0 (0.0%) |
| Information | 70 (71.4%) | 28 (28.6%) |
| Finance & Insurance | 103 (43.6%) | 133 (56.4%) |
| Real Estate, Rental & Leasing | 0 (0.0%) | 80 (100.0%) |
| Professional & Scientific | 89 (27.2%) | 238 (72.8%) |
| Enterprise Management | 64 (100.0%) | 0 (0.0%) |
| Administrative & Support | 256 (100.0%) | 0 (0.0%) |
| Educational Services | 78 (23.2%) | 259 (76.8%) |
| Health Care & Social Assistance | 226 (29.6%) | 537 (70.4%) |
| Arts, Entertainment & Recreation | 0 (0.0%) | 13 (100.0%) |
| Accommodation & Food Services | 245 (50.9%) | 236 (49.1%) |
| Public Administration | 16 (100.0%) | 0 (0.0%) |
| Total | 2,380 (53.7%) | 2,053 (46.3%) |
Education in Travis Ranch
School Enrollment in Travis Ranch
The most common levels of schooling among the 3,438 students in Travis Ranch are elementary school (852 | 24.8%), high school (691 | 20.1%), and middle school (570 | 16.6%).
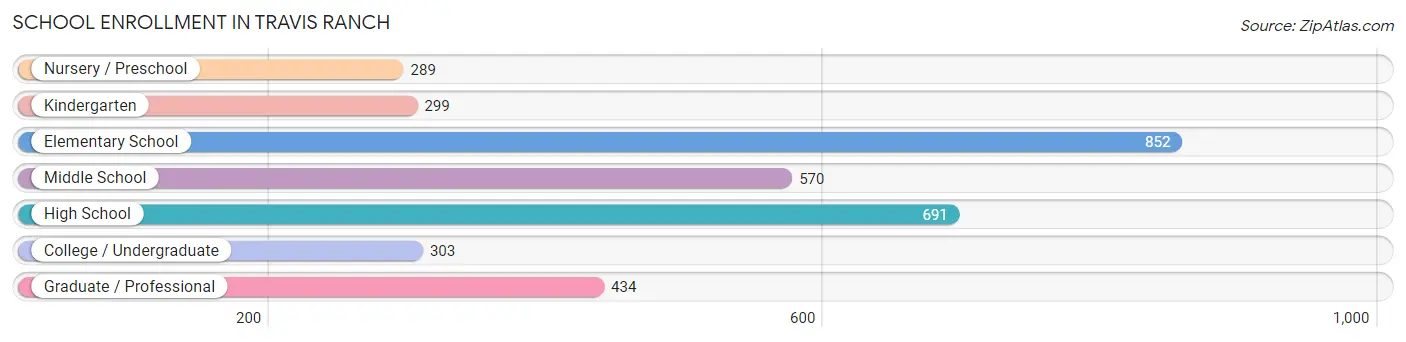
| School Level | # Students | % Students |
| Nursery / Preschool | 289 | 8.4% |
| Kindergarten | 299 | 8.7% |
| Elementary School | 852 | 24.8% |
| Middle School | 570 | 16.6% |
| High School | 691 | 20.1% |
| College / Undergraduate | 303 | 8.8% |
| Graduate / Professional | 434 | 12.6% |
| Total | 3,438 | 100.0% |
School Enrollment by Age by Funding Source in Travis Ranch
Out of a total of 3,438 students who are enrolled in schools in Travis Ranch, 712 (20.7%) attend a private institution, while the remaining 2,726 (79.3%) are enrolled in public schools. The age group of 3 to 4 year olds has the highest likelihood of being enrolled in private schools, with 270 (88.5% in the age bracket) enrolled. Conversely, the age group of 18 to 19 year olds has the lowest likelihood of being enrolled in a private school, with 97 (100.0% in the age bracket) attending a public institution.
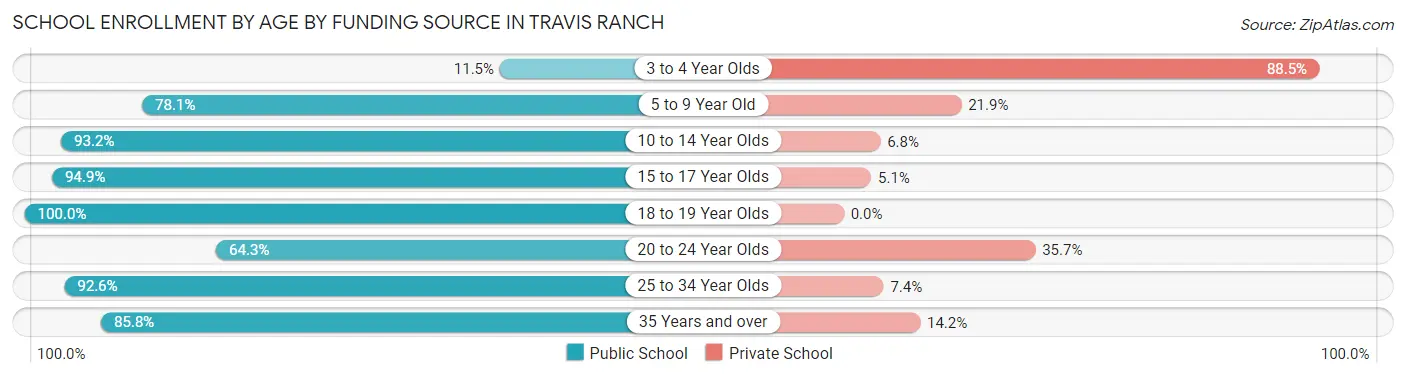
| Age Bracket | Public School | Private School |
| 3 to 4 Year Olds | 35 (11.5%) | 270 (88.5%) |
| 5 to 9 Year Old | 845 (78.1%) | 237 (21.9%) |
| 10 to 14 Year Olds | 698 (93.2%) | 51 (6.8%) |
| 15 to 17 Year Olds | 464 (94.9%) | 25 (5.1%) |
| 18 to 19 Year Olds | 97 (100.0%) | 0 (0.0%) |
| 20 to 24 Year Olds | 128 (64.3%) | 71 (35.7%) |
| 25 to 34 Year Olds | 225 (92.6%) | 18 (7.4%) |
| 35 Years and over | 235 (85.8%) | 39 (14.2%) |
| Total | 2,726 (79.3%) | 712 (20.7%) |
Educational Attainment by Field of Study in Travis Ranch
Business (312 | 17.9%), communications (237 | 13.6%), science & technology (224 | 12.9%), psychology (173 | 9.9%), and social sciences (142 | 8.2%) are the most common fields of study among 1,741 individuals in Travis Ranch who have obtained a bachelor's degree or higher.
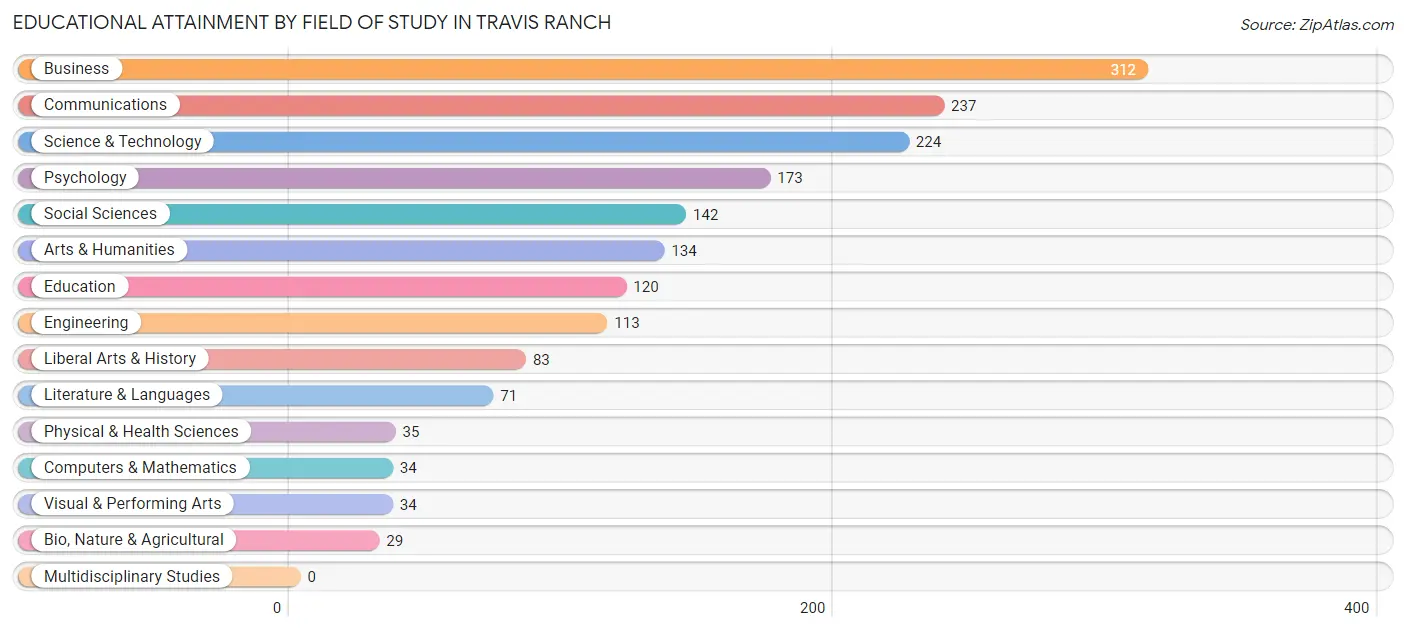
| Field of Study | # Graduates | % Graduates |
| Computers & Mathematics | 34 | 1.9% |
| Bio, Nature & Agricultural | 29 | 1.7% |
| Physical & Health Sciences | 35 | 2.0% |
| Psychology | 173 | 9.9% |
| Social Sciences | 142 | 8.2% |
| Engineering | 113 | 6.5% |
| Multidisciplinary Studies | 0 | 0.0% |
| Science & Technology | 224 | 12.9% |
| Business | 312 | 17.9% |
| Education | 120 | 6.9% |
| Literature & Languages | 71 | 4.1% |
| Liberal Arts & History | 83 | 4.8% |
| Visual & Performing Arts | 34 | 1.9% |
| Communications | 237 | 13.6% |
| Arts & Humanities | 134 | 7.7% |
| Total | 1,741 | 100.0% |
Transportation & Commute in Travis Ranch
Vehicle Availability by Sex in Travis Ranch
The most prevalent vehicle ownership categories in Travis Ranch are males with 3 vehicles (958, accounting for 41.5%) and females with 3 vehicles (749, making up 48.1%).
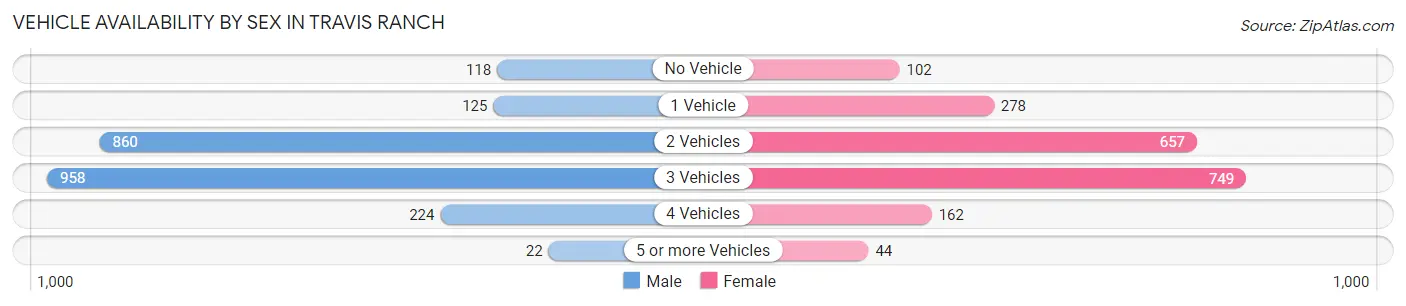
| Vehicles Available | Male | Female |
| No Vehicle | 118 (5.1%) | 102 (5.1%) |
| 1 Vehicle | 125 (5.4%) | 278 (14.0%) |
| 2 Vehicles | 860 (37.3%) | 657 (33.0%) |
| 3 Vehicles | 958 (41.5%) | 749 (37.6%) |
| 4 Vehicles | 224 (9.7%) | 162 (8.1%) |
| 5 or more Vehicles | 22 (0.9%) | 44 (2.2%) |
| Total | 2,307 (100.0%) | 1,992 (100.0%) |
Commute Time in Travis Ranch
The most frequently occuring commute durations in Travis Ranch are 45 to 59 minutes (612 commuters, 16.8%), 30 to 34 minutes (601 commuters, 16.5%), and 60 to 89 minutes (566 commuters, 15.5%).
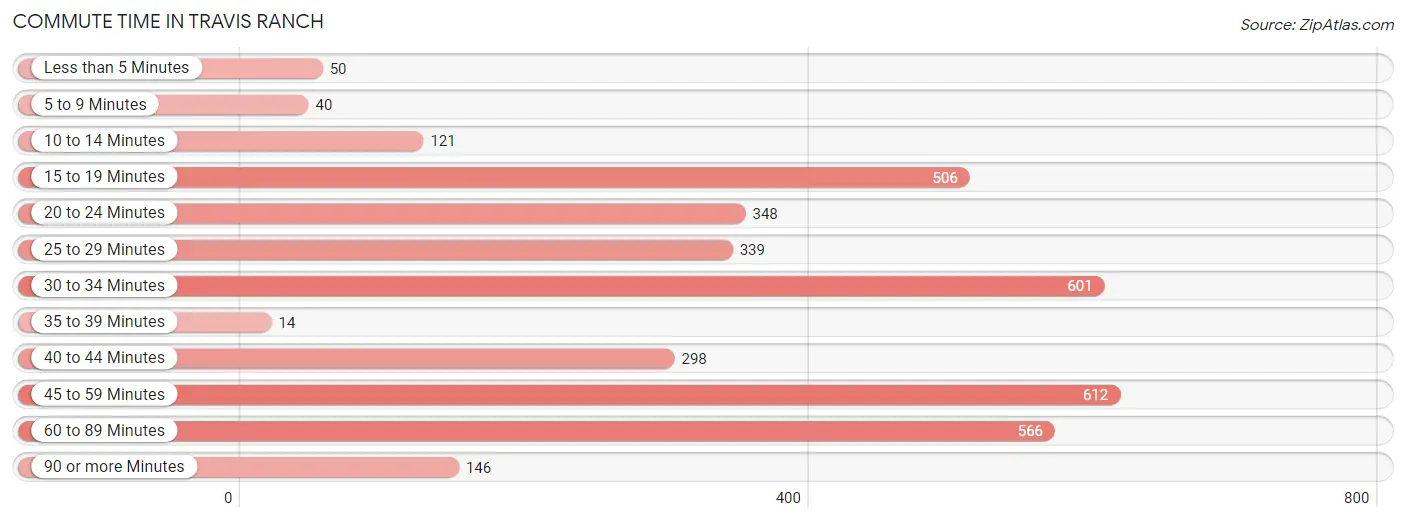
| Commute Time | # Commuters | % Commuters |
| Less than 5 Minutes | 50 | 1.4% |
| 5 to 9 Minutes | 40 | 1.1% |
| 10 to 14 Minutes | 121 | 3.3% |
| 15 to 19 Minutes | 506 | 13.9% |
| 20 to 24 Minutes | 348 | 9.6% |
| 25 to 29 Minutes | 339 | 9.3% |
| 30 to 34 Minutes | 601 | 16.5% |
| 35 to 39 Minutes | 14 | 0.4% |
| 40 to 44 Minutes | 298 | 8.2% |
| 45 to 59 Minutes | 612 | 16.8% |
| 60 to 89 Minutes | 566 | 15.5% |
| 90 or more Minutes | 146 | 4.0% |
Commute Time by Sex in Travis Ranch
The most common commute times in Travis Ranch are 30 to 34 minutes (371 commuters, 19.3%) for males and 45 to 59 minutes (346 commuters, 20.2%) for females.
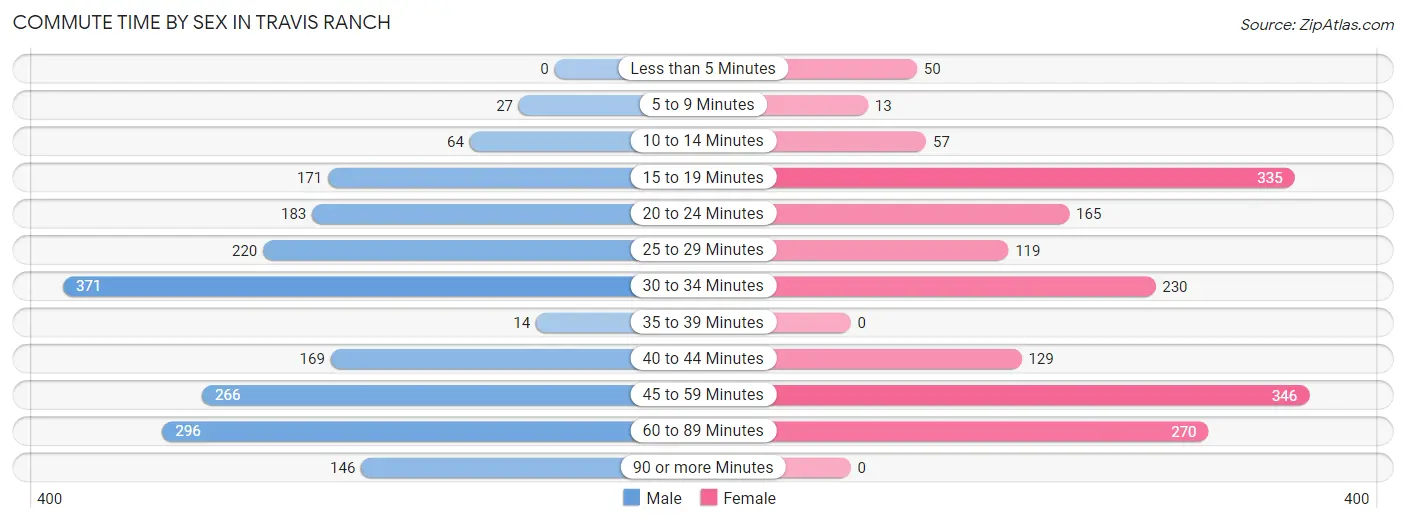
| Commute Time | Male | Female |
| Less than 5 Minutes | 0 (0.0%) | 50 (2.9%) |
| 5 to 9 Minutes | 27 (1.4%) | 13 (0.8%) |
| 10 to 14 Minutes | 64 (3.3%) | 57 (3.3%) |
| 15 to 19 Minutes | 171 (8.9%) | 335 (19.5%) |
| 20 to 24 Minutes | 183 (9.5%) | 165 (9.6%) |
| 25 to 29 Minutes | 220 (11.4%) | 119 (6.9%) |
| 30 to 34 Minutes | 371 (19.3%) | 230 (13.4%) |
| 35 to 39 Minutes | 14 (0.7%) | 0 (0.0%) |
| 40 to 44 Minutes | 169 (8.8%) | 129 (7.5%) |
| 45 to 59 Minutes | 266 (13.8%) | 346 (20.2%) |
| 60 to 89 Minutes | 296 (15.4%) | 270 (15.8%) |
| 90 or more Minutes | 146 (7.6%) | 0 (0.0%) |
Time of Departure to Work by Sex in Travis Ranch
The most frequent times of departure to work in Travis Ranch are 12:00 PM to 3:59 PM (296, 15.4%) for males and 6:30 AM to 6:59 AM (486, 28.3%) for females.
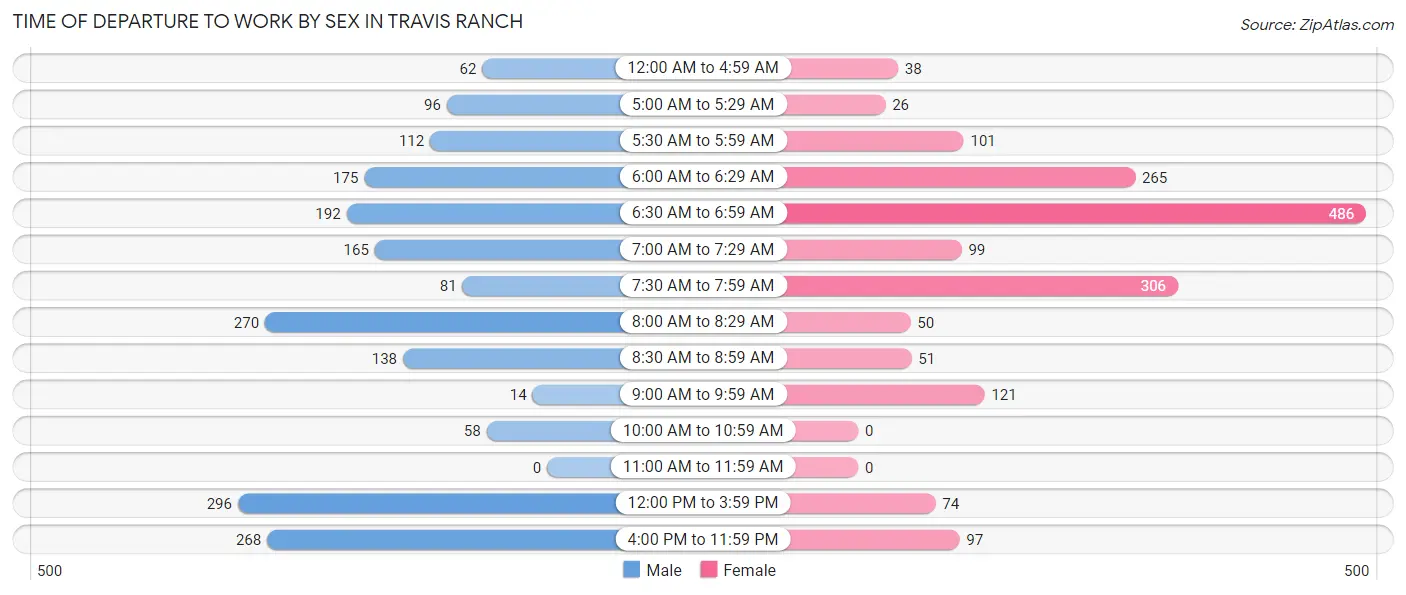
| Time of Departure | Male | Female |
| 12:00 AM to 4:59 AM | 62 (3.2%) | 38 (2.2%) |
| 5:00 AM to 5:29 AM | 96 (5.0%) | 26 (1.5%) |
| 5:30 AM to 5:59 AM | 112 (5.8%) | 101 (5.9%) |
| 6:00 AM to 6:29 AM | 175 (9.1%) | 265 (15.5%) |
| 6:30 AM to 6:59 AM | 192 (10.0%) | 486 (28.3%) |
| 7:00 AM to 7:29 AM | 165 (8.6%) | 99 (5.8%) |
| 7:30 AM to 7:59 AM | 81 (4.2%) | 306 (17.8%) |
| 8:00 AM to 8:29 AM | 270 (14.0%) | 50 (2.9%) |
| 8:30 AM to 8:59 AM | 138 (7.2%) | 51 (3.0%) |
| 9:00 AM to 9:59 AM | 14 (0.7%) | 121 (7.1%) |
| 10:00 AM to 10:59 AM | 58 (3.0%) | 0 (0.0%) |
| 11:00 AM to 11:59 AM | 0 (0.0%) | 0 (0.0%) |
| 12:00 PM to 3:59 PM | 296 (15.4%) | 74 (4.3%) |
| 4:00 PM to 11:59 PM | 268 (13.9%) | 97 (5.7%) |
| Total | 1,927 (100.0%) | 1,714 (100.0%) |
Housing Occupancy in Travis Ranch
Occupancy by Ownership in Travis Ranch
Of the total 2,730 dwellings in Travis Ranch, owner-occupied units account for 2,407 (88.2%), while renter-occupied units make up 323 (11.8%).
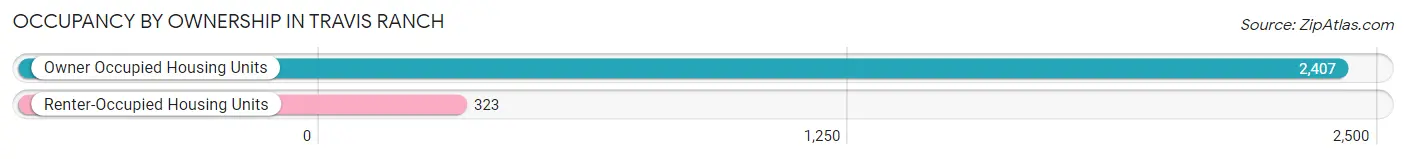
| Occupancy | # Housing Units | % Housing Units |
| Owner Occupied Housing Units | 2,407 | 88.2% |
| Renter-Occupied Housing Units | 323 | 11.8% |
| Total Occupied Housing Units | 2,730 | 100.0% |
Occupancy by Household Size in Travis Ranch
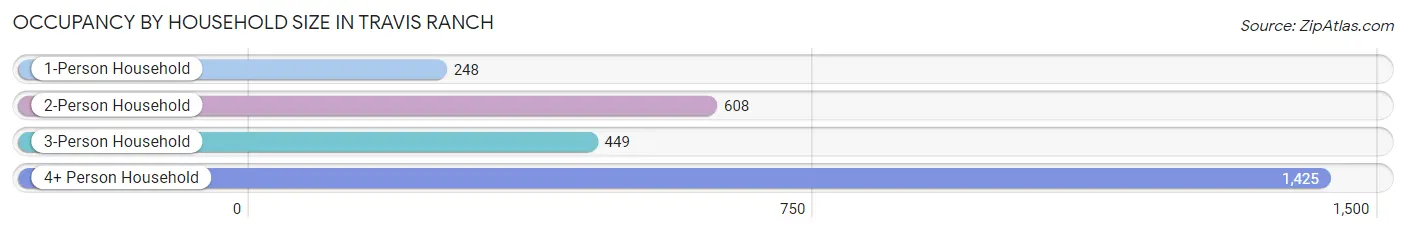
| Household Size | # Housing Units | % Housing Units |
| 1-Person Household | 248 | 9.1% |
| 2-Person Household | 608 | 22.3% |
| 3-Person Household | 449 | 16.5% |
| 4+ Person Household | 1,425 | 52.2% |
| Total Housing Units | 2,730 | 100.0% |
Occupancy by Ownership by Household Size in Travis Ranch
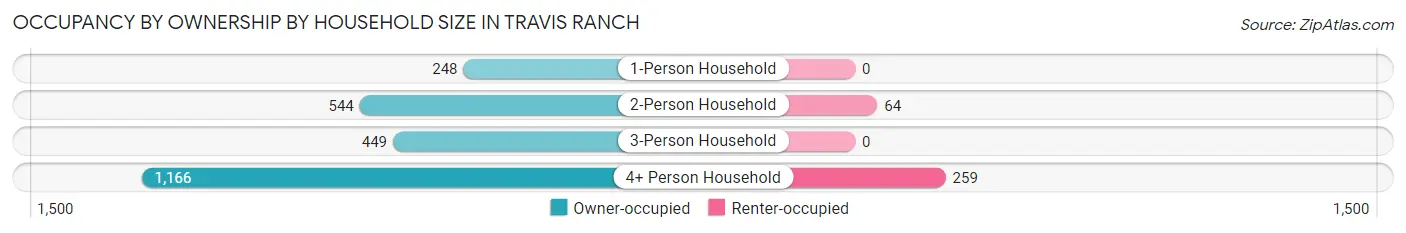
| Household Size | Owner-occupied | Renter-occupied |
| 1-Person Household | 248 (100.0%) | 0 (0.0%) |
| 2-Person Household | 544 (89.5%) | 64 (10.5%) |
| 3-Person Household | 449 (100.0%) | 0 (0.0%) |
| 4+ Person Household | 1,166 (81.8%) | 259 (18.2%) |
| Total Housing Units | 2,407 (88.2%) | 323 (11.8%) |
Occupancy by Educational Attainment in Travis Ranch
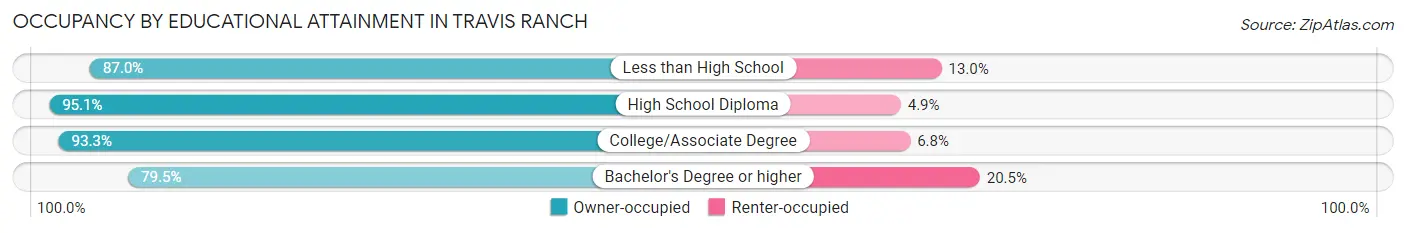
| Household Size | Owner-occupied | Renter-occupied |
| Less than High School | 94 (87.0%) | 14 (13.0%) |
| High School Diploma | 351 (95.1%) | 18 (4.9%) |
| College/Associate Degree | 1,161 (93.2%) | 84 (6.8%) |
| Bachelor's Degree or higher | 801 (79.5%) | 207 (20.5%) |
Occupancy by Age of Householder in Travis Ranch
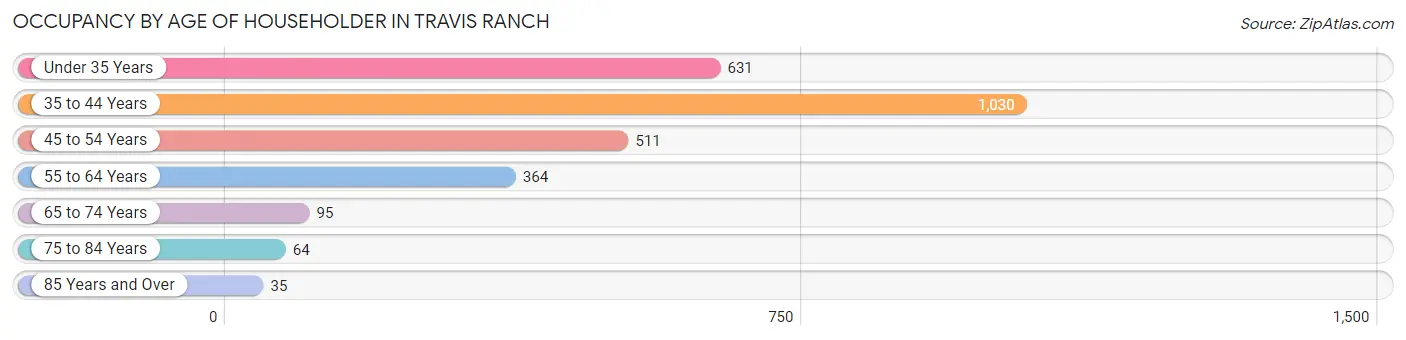
| Age Bracket | # Households | % Households |
| Under 35 Years | 631 | 23.1% |
| 35 to 44 Years | 1,030 | 37.7% |
| 45 to 54 Years | 511 | 18.7% |
| 55 to 64 Years | 364 | 13.3% |
| 65 to 74 Years | 95 | 3.5% |
| 75 to 84 Years | 64 | 2.3% |
| 85 Years and Over | 35 | 1.3% |
| Total | 2,730 | 100.0% |
Housing Finances in Travis Ranch
Median Income by Occupancy in Travis Ranch
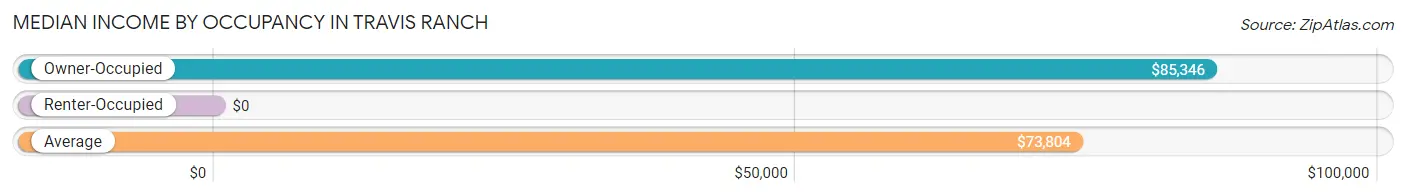
| Occupancy Type | # Households | Median Income |
| Owner-Occupied | 2,407 (88.2%) | $85,346 |
| Renter-Occupied | 323 (11.8%) | $0 |
| Average | 2,730 (100.0%) | $73,804 |
Occupancy by Householder Income Bracket in Travis Ranch

| Income Bracket | Owner-occupied | Renter-occupied |
| Less than $5,000 | 50 (2.1%) | 0 (0.0%) |
| $5,000 to $9,999 | 20 (0.8%) | 0 (0.0%) |
| $10,000 to $14,999 | 37 (1.5%) | 0 (0.0%) |
| $15,000 to $19,999 | 85 (3.5%) | 146 (45.2%) |
| $20,000 to $24,999 | 49 (2.0%) | 0 (0.0%) |
| $25,000 to $34,999 | 195 (8.1%) | 0 (0.0%) |
| $35,000 to $49,999 | 63 (2.6%) | 14 (4.3%) |
| $50,000 to $74,999 | 659 (27.4%) | 102 (31.6%) |
| $75,000 to $99,999 | 247 (10.3%) | 0 (0.0%) |
| $100,000 to $149,999 | 463 (19.2%) | 0 (0.0%) |
| $150,000 or more | 539 (22.4%) | 61 (18.9%) |
| Total | 2,407 (100.0%) | 323 (100.0%) |
Monthly Housing Cost Tiers in Travis Ranch
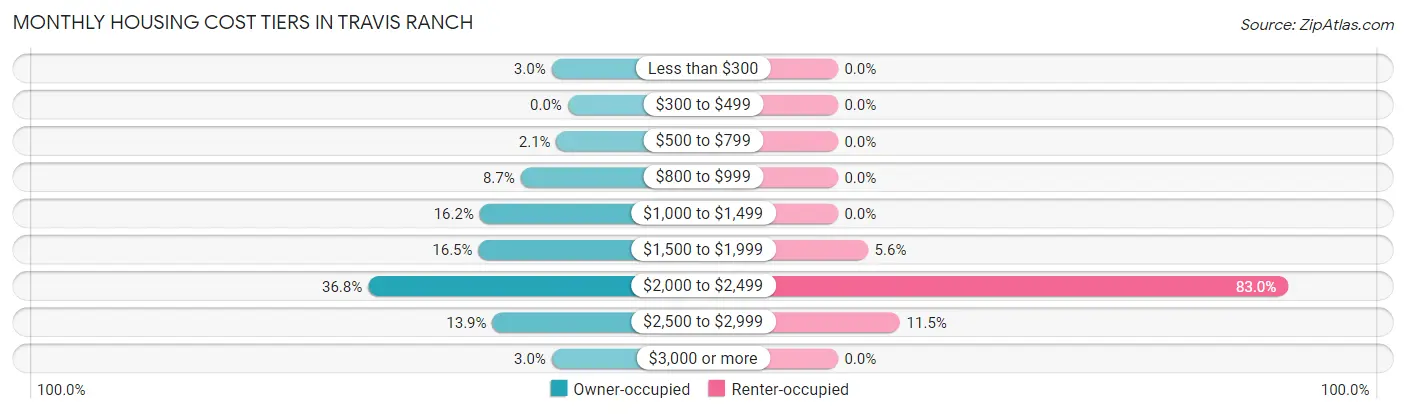
| Monthly Cost | Owner-occupied | Renter-occupied |
| Less than $300 | 72 (3.0%) | 0 (0.0%) |
| $300 to $499 | 0 (0.0%) | 0 (0.0%) |
| $500 to $799 | 50 (2.1%) | 0 (0.0%) |
| $800 to $999 | 209 (8.7%) | 0 (0.0%) |
| $1,000 to $1,499 | 390 (16.2%) | 0 (0.0%) |
| $1,500 to $1,999 | 396 (16.5%) | 18 (5.6%) |
| $2,000 to $2,499 | 885 (36.8%) | 268 (83.0%) |
| $2,500 to $2,999 | 334 (13.9%) | 37 (11.5%) |
| $3,000 or more | 71 (2.9%) | 0 (0.0%) |
| Total | 2,407 (100.0%) | 323 (100.0%) |
Physical Housing Characteristics in Travis Ranch
Housing Structures in Travis Ranch
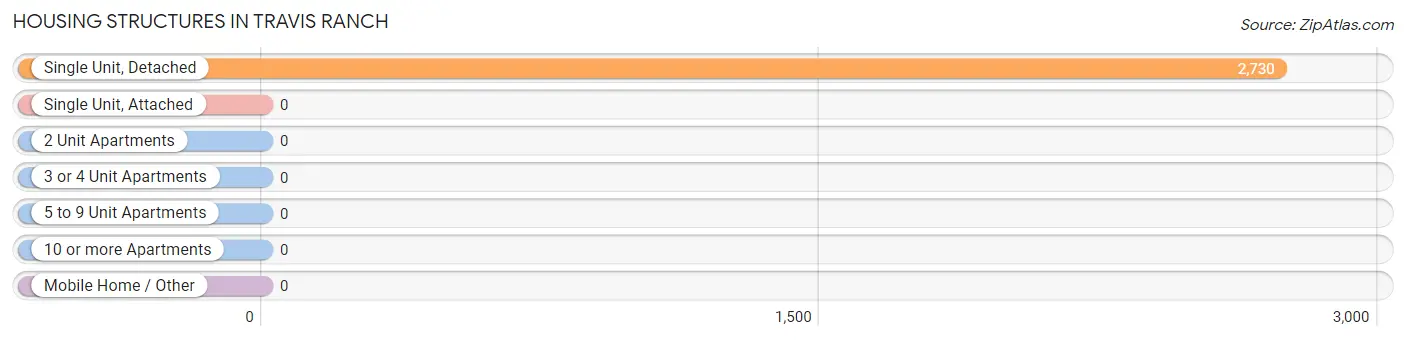
| Structure Type | # Housing Units | % Housing Units |
| Single Unit, Detached | 2,730 | 100.0% |
| Single Unit, Attached | 0 | 0.0% |
| 2 Unit Apartments | 0 | 0.0% |
| 3 or 4 Unit Apartments | 0 | 0.0% |
| 5 to 9 Unit Apartments | 0 | 0.0% |
| 10 or more Apartments | 0 | 0.0% |
| Mobile Home / Other | 0 | 0.0% |
| Total | 2,730 | 100.0% |
Housing Structures by Occupancy in Travis Ranch
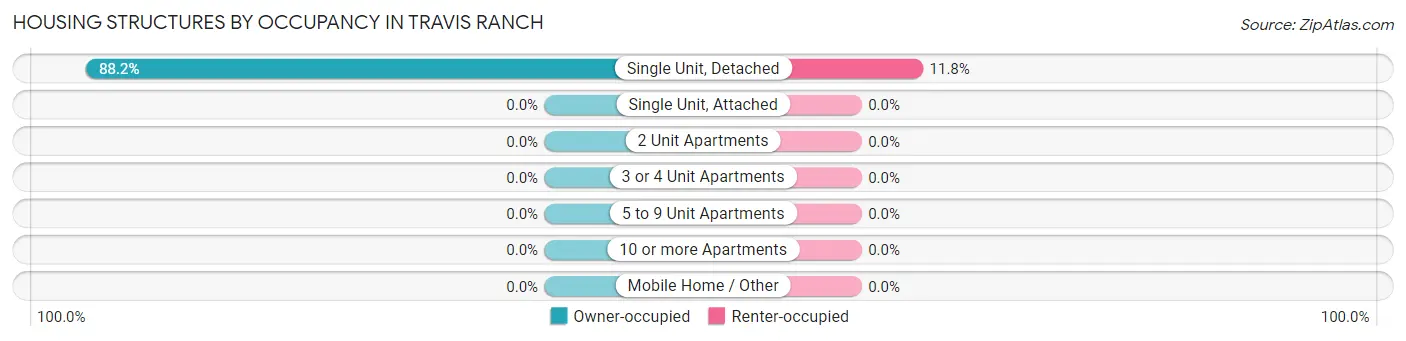
| Structure Type | Owner-occupied | Renter-occupied |
| Single Unit, Detached | 2,407 (88.2%) | 323 (11.8%) |
| Single Unit, Attached | 0 (0.0%) | 0 (0.0%) |
| 2 Unit Apartments | 0 (0.0%) | 0 (0.0%) |
| 3 or 4 Unit Apartments | 0 (0.0%) | 0 (0.0%) |
| 5 to 9 Unit Apartments | 0 (0.0%) | 0 (0.0%) |
| 10 or more Apartments | 0 (0.0%) | 0 (0.0%) |
| Mobile Home / Other | 0 (0.0%) | 0 (0.0%) |
| Total | 2,407 (88.2%) | 323 (11.8%) |
Housing Structures by Number of Rooms in Travis Ranch
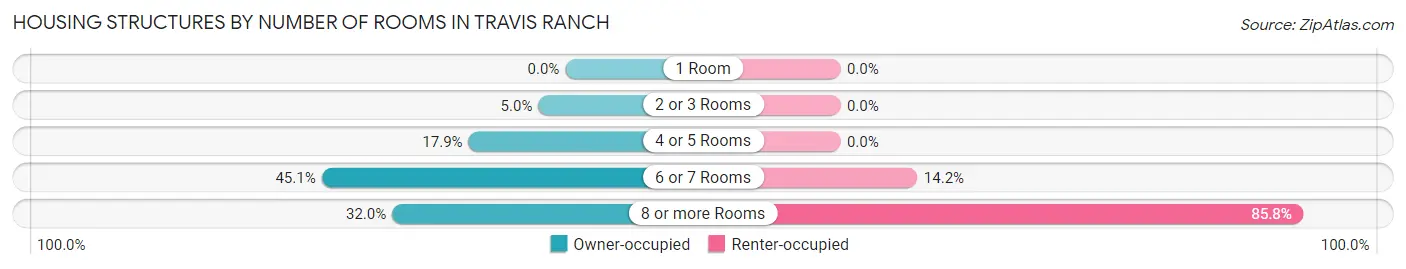
| Number of Rooms | Owner-occupied | Renter-occupied |
| 1 Room | 0 (0.0%) | 0 (0.0%) |
| 2 or 3 Rooms | 120 (5.0%) | 0 (0.0%) |
| 4 or 5 Rooms | 431 (17.9%) | 0 (0.0%) |
| 6 or 7 Rooms | 1,085 (45.1%) | 46 (14.2%) |
| 8 or more Rooms | 771 (32.0%) | 277 (85.8%) |
| Total | 2,407 (100.0%) | 323 (100.0%) |
Housing Structure by Heating Type in Travis Ranch
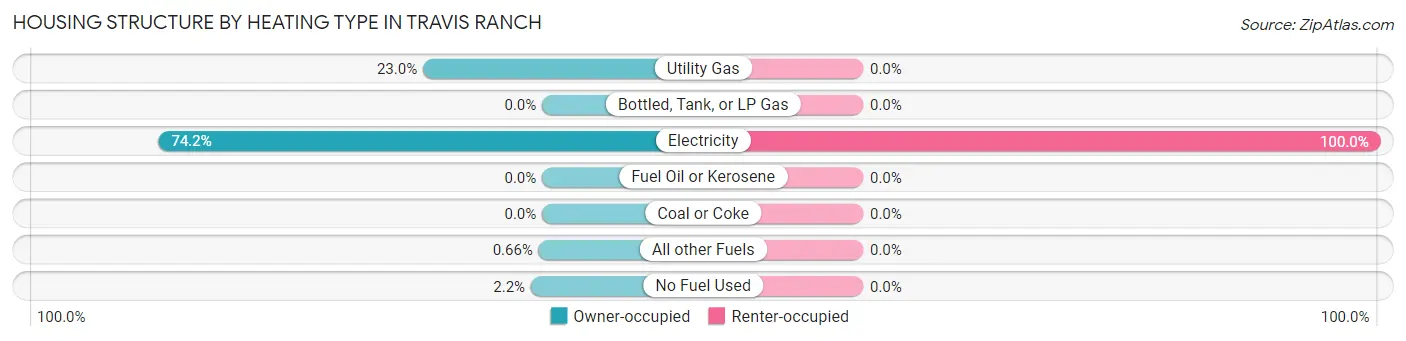
| Heating Type | Owner-occupied | Renter-occupied |
| Utility Gas | 554 (23.0%) | 0 (0.0%) |
| Bottled, Tank, or LP Gas | 0 (0.0%) | 0 (0.0%) |
| Electricity | 1,785 (74.2%) | 323 (100.0%) |
| Fuel Oil or Kerosene | 0 (0.0%) | 0 (0.0%) |
| Coal or Coke | 0 (0.0%) | 0 (0.0%) |
| All other Fuels | 16 (0.7%) | 0 (0.0%) |
| No Fuel Used | 52 (2.2%) | 0 (0.0%) |
| Total | 2,407 (100.0%) | 323 (100.0%) |
Household Vehicle Usage in Travis Ranch
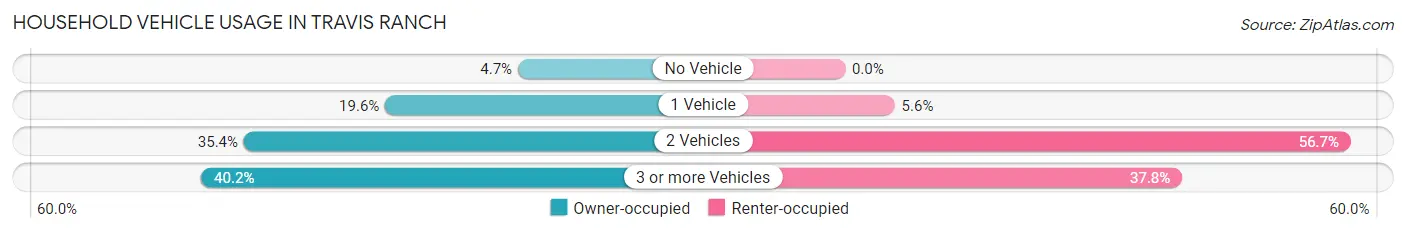
| Vehicles per Household | Owner-occupied | Renter-occupied |
| No Vehicle | 114 (4.7%) | 0 (0.0%) |
| 1 Vehicle | 472 (19.6%) | 18 (5.6%) |
| 2 Vehicles | 853 (35.4%) | 183 (56.7%) |
| 3 or more Vehicles | 968 (40.2%) | 122 (37.8%) |
| Total | 2,407 (100.0%) | 323 (100.0%) |
Real Estate & Mortgages in Travis Ranch
Real Estate and Mortgage Overview in Travis Ranch
| Characteristic | Without Mortgage | With Mortgage |
| Housing Units | 585 | 1,822 |
| Median Property Value | $326,400 | $290,000 |
| Median Household Income | $62,246 | $454 |
| Monthly Housing Costs | $1,025 | $71 |
| Real Estate Taxes | $6,879 | $68 |
Property Value by Mortgage Status in Travis Ranch
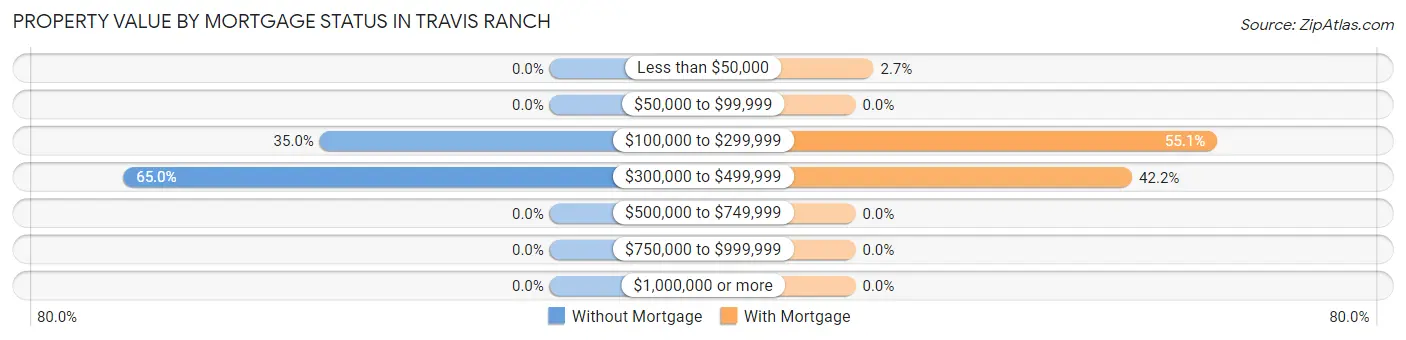
| Property Value | Without Mortgage | With Mortgage |
| Less than $50,000 | 0 (0.0%) | 50 (2.7%) |
| $50,000 to $99,999 | 0 (0.0%) | 0 (0.0%) |
| $100,000 to $299,999 | 205 (35.0%) | 1,004 (55.1%) |
| $300,000 to $499,999 | 380 (65.0%) | 768 (42.1%) |
| $500,000 to $749,999 | 0 (0.0%) | 0 (0.0%) |
| $750,000 to $999,999 | 0 (0.0%) | 0 (0.0%) |
| $1,000,000 or more | 0 (0.0%) | 0 (0.0%) |
| Total | 585 (100.0%) | 1,822 (100.0%) |
Household Income by Mortgage Status in Travis Ranch
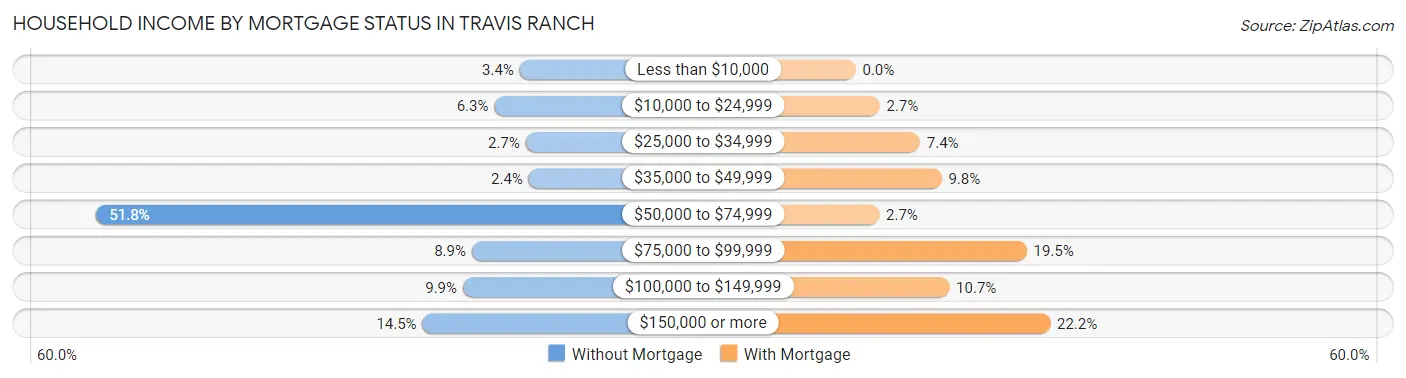
| Household Income | Without Mortgage | With Mortgage |
| Less than $10,000 | 20 (3.4%) | 0 (0.0%) |
| $10,000 to $24,999 | 37 (6.3%) | 50 (2.7%) |
| $25,000 to $34,999 | 16 (2.7%) | 134 (7.3%) |
| $35,000 to $49,999 | 14 (2.4%) | 179 (9.8%) |
| $50,000 to $74,999 | 303 (51.8%) | 49 (2.7%) |
| $75,000 to $99,999 | 52 (8.9%) | 356 (19.5%) |
| $100,000 to $149,999 | 58 (9.9%) | 195 (10.7%) |
| $150,000 or more | 85 (14.5%) | 405 (22.2%) |
| Total | 585 (100.0%) | 1,822 (100.0%) |
Property Value to Household Income Ratio in Travis Ranch
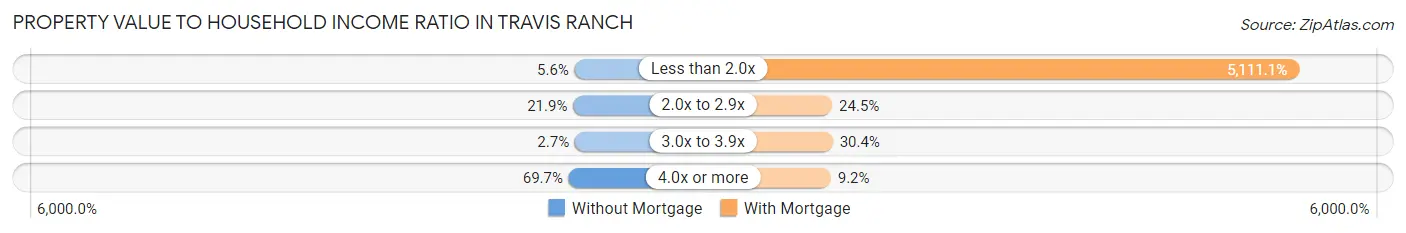
| Value-to-Income Ratio | Without Mortgage | With Mortgage |
| Less than 2.0x | 33 (5.6%) | 93,125 (5,111.1%) |
| 2.0x to 2.9x | 128 (21.9%) | 446 (24.5%) |
| 3.0x to 3.9x | 16 (2.7%) | 553 (30.3%) |
| 4.0x or more | 408 (69.7%) | 167 (9.2%) |
| Total | 585 (100.0%) | 1,822 (100.0%) |
Real Estate Taxes by Mortgage Status in Travis Ranch
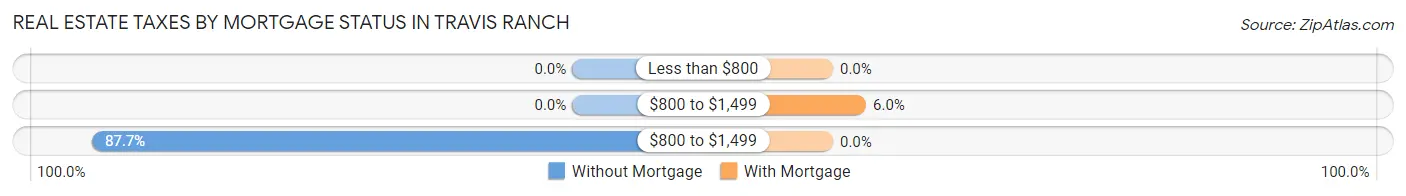
| Property Taxes | Without Mortgage | With Mortgage |
| Less than $800 | 0 (0.0%) | 0 (0.0%) |
| $800 to $1,499 | 0 (0.0%) | 110 (6.0%) |
| $800 to $1,499 | 513 (87.7%) | 0 (0.0%) |
| Total | 585 (100.0%) | 1,822 (100.0%) |
Health & Disability in Travis Ranch
Health Insurance Coverage by Age in Travis Ranch
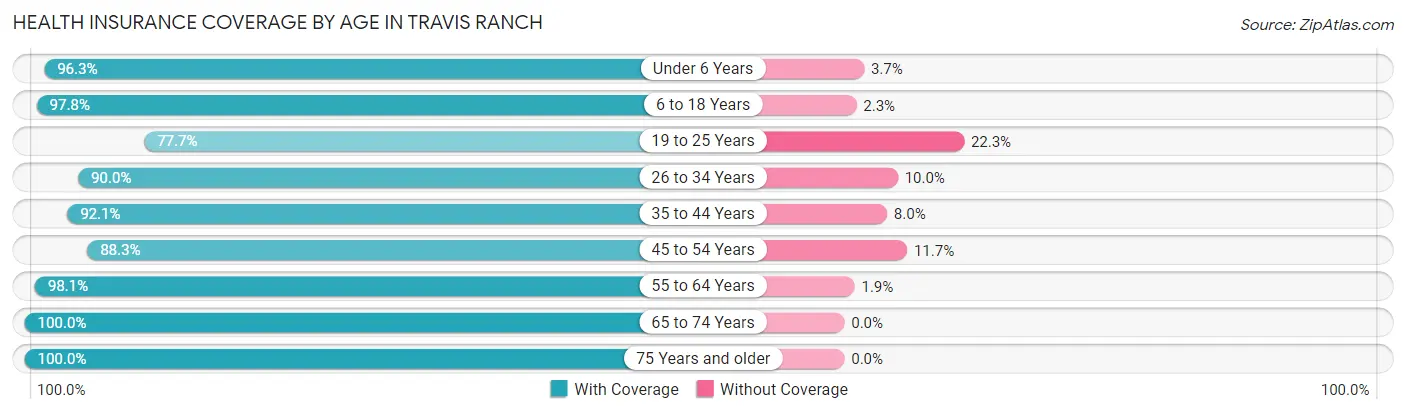
| Age Bracket | With Coverage | Without Coverage |
| Under 6 Years | 762 (96.3%) | 29 (3.7%) |
| 6 to 18 Years | 2,305 (97.8%) | 53 (2.2%) |
| 19 to 25 Years | 484 (77.7%) | 139 (22.3%) |
| 26 to 34 Years | 1,447 (90.0%) | 160 (10.0%) |
| 35 to 44 Years | 1,517 (92.0%) | 131 (8.0%) |
| 45 to 54 Years | 733 (88.3%) | 97 (11.7%) |
| 55 to 64 Years | 720 (98.1%) | 14 (1.9%) |
| 65 to 74 Years | 276 (100.0%) | 0 (0.0%) |
| 75 Years and older | 170 (100.0%) | 0 (0.0%) |
| Total | 8,414 (93.1%) | 623 (6.9%) |
Health Insurance Coverage by Citizenship Status in Travis Ranch
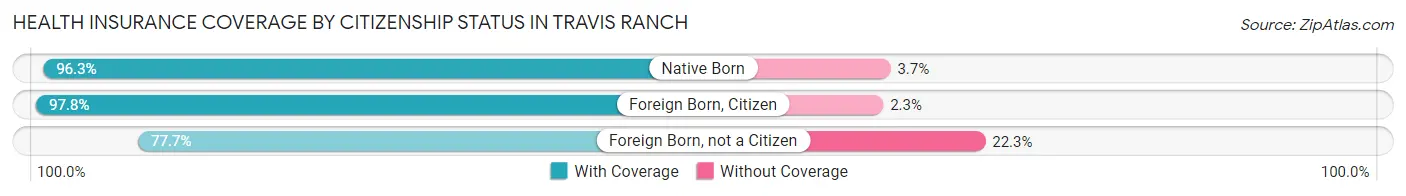
| Citizenship Status | With Coverage | Without Coverage |
| Native Born | 762 (96.3%) | 29 (3.7%) |
| Foreign Born, Citizen | 2,305 (97.8%) | 53 (2.2%) |
| Foreign Born, not a Citizen | 484 (77.7%) | 139 (22.3%) |
Health Insurance Coverage by Household Income in Travis Ranch
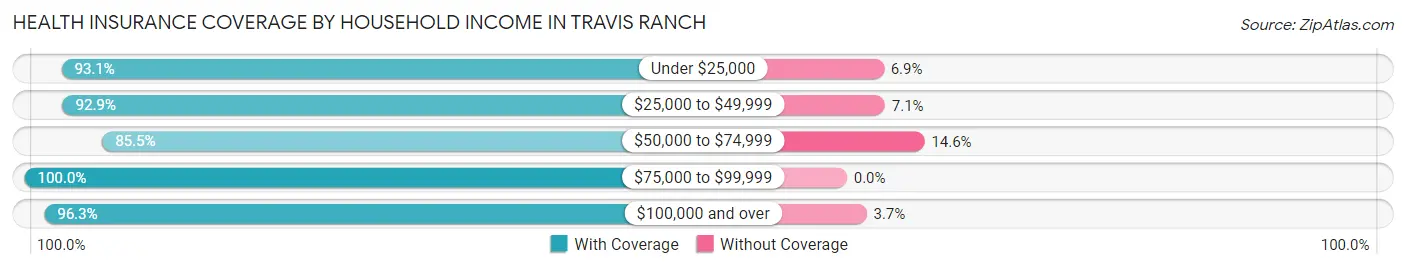
| Household Income | With Coverage | Without Coverage |
| Under $25,000 | 701 (93.1%) | 52 (6.9%) |
| $25,000 to $49,999 | 690 (92.9%) | 53 (7.1%) |
| $50,000 to $74,999 | 2,091 (85.5%) | 356 (14.5%) |
| $75,000 to $99,999 | 717 (100.0%) | 0 (0.0%) |
| $100,000 and over | 4,215 (96.3%) | 162 (3.7%) |
Public vs Private Health Insurance Coverage by Age in Travis Ranch
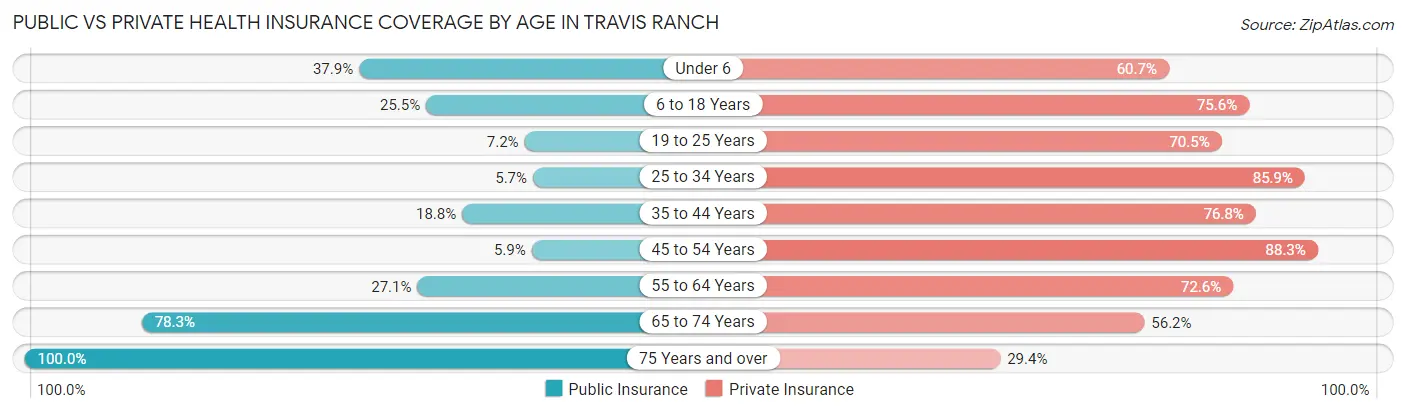
| Age Bracket | Public Insurance | Private Insurance |
| Under 6 | 300 (37.9%) | 480 (60.7%) |
| 6 to 18 Years | 601 (25.5%) | 1,782 (75.6%) |
| 19 to 25 Years | 45 (7.2%) | 439 (70.5%) |
| 25 to 34 Years | 91 (5.7%) | 1,381 (85.9%) |
| 35 to 44 Years | 310 (18.8%) | 1,266 (76.8%) |
| 45 to 54 Years | 49 (5.9%) | 733 (88.3%) |
| 55 to 64 Years | 199 (27.1%) | 533 (72.6%) |
| 65 to 74 Years | 216 (78.3%) | 155 (56.2%) |
| 75 Years and over | 170 (100.0%) | 50 (29.4%) |
| Total | 1,981 (21.9%) | 6,819 (75.5%) |
Disability Status by Sex by Age in Travis Ranch
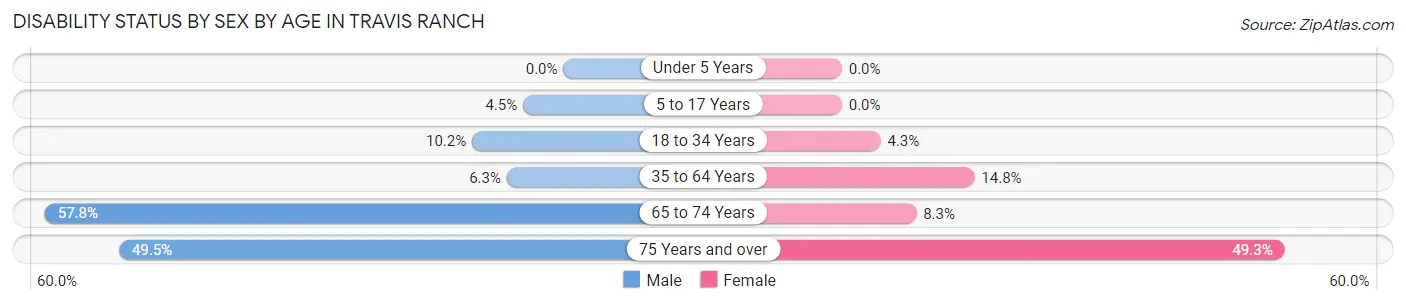
| Age Bracket | Male | Female |
| Under 5 Years | 0 (0.0%) | 0 (0.0%) |
| 5 to 17 Years | 64 (4.5%) | 0 (0.0%) |
| 18 to 34 Years | 128 (10.2%) | 46 (4.3%) |
| 35 to 64 Years | 85 (6.3%) | 275 (14.8%) |
| 65 to 74 Years | 41 (57.8%) | 17 (8.3%) |
| 75 Years and over | 49 (49.5%) | 35 (49.3%) |
Disability Class by Sex by Age in Travis Ranch
Disability Class: Hearing Difficulty
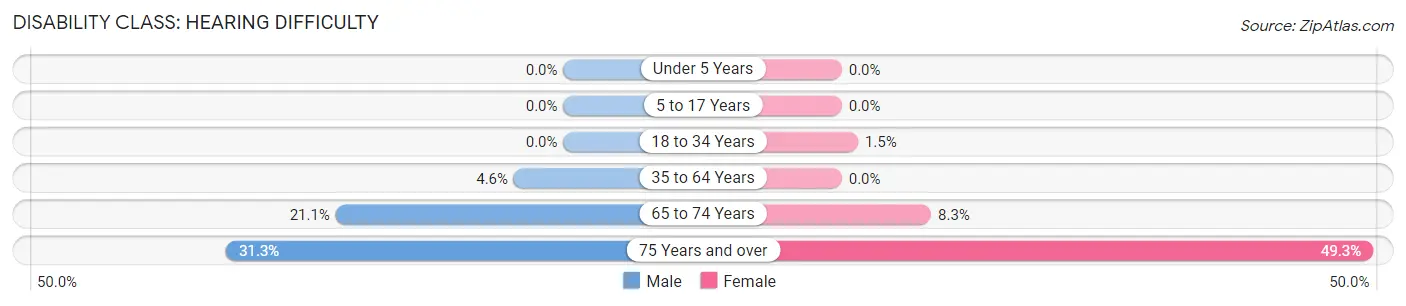
| Age Bracket | Male | Female |
| Under 5 Years | 0 (0.0%) | 0 (0.0%) |
| 5 to 17 Years | 0 (0.0%) | 0 (0.0%) |
| 18 to 34 Years | 0 (0.0%) | 16 (1.5%) |
| 35 to 64 Years | 62 (4.6%) | 0 (0.0%) |
| 65 to 74 Years | 15 (21.1%) | 17 (8.3%) |
| 75 Years and over | 31 (31.3%) | 35 (49.3%) |
Disability Class: Vision Difficulty
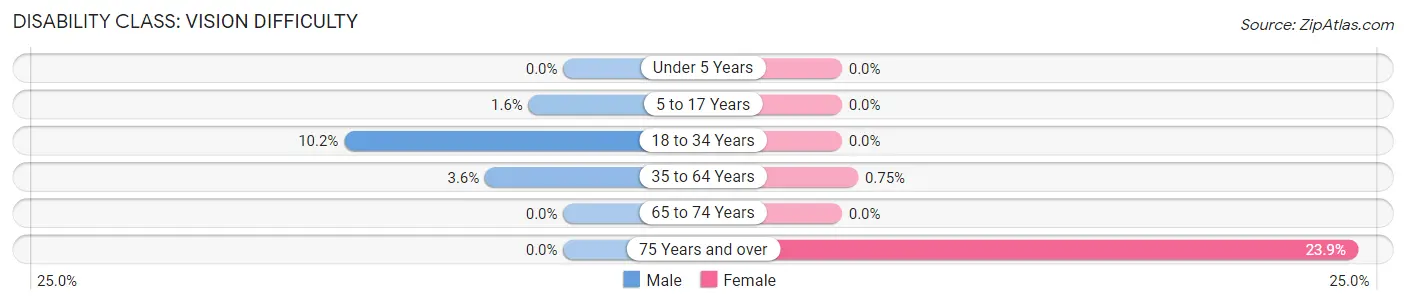
| Age Bracket | Male | Female |
| Under 5 Years | 0 (0.0%) | 0 (0.0%) |
| 5 to 17 Years | 23 (1.6%) | 0 (0.0%) |
| 18 to 34 Years | 128 (10.2%) | 0 (0.0%) |
| 35 to 64 Years | 49 (3.6%) | 14 (0.7%) |
| 65 to 74 Years | 0 (0.0%) | 0 (0.0%) |
| 75 Years and over | 0 (0.0%) | 17 (23.9%) |
Disability Class: Cognitive Difficulty
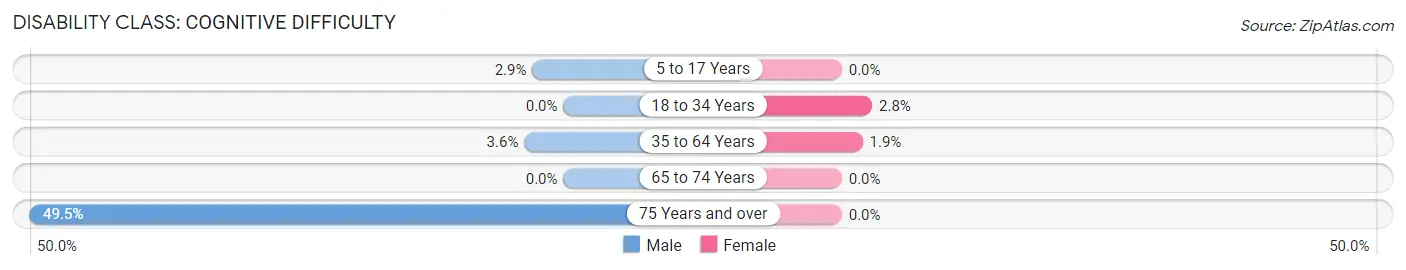
| Age Bracket | Male | Female |
| 5 to 17 Years | 41 (2.9%) | 0 (0.0%) |
| 18 to 34 Years | 0 (0.0%) | 30 (2.8%) |
| 35 to 64 Years | 49 (3.6%) | 36 (1.9%) |
| 65 to 74 Years | 0 (0.0%) | 0 (0.0%) |
| 75 Years and over | 49 (49.5%) | 0 (0.0%) |
Disability Class: Ambulatory Difficulty
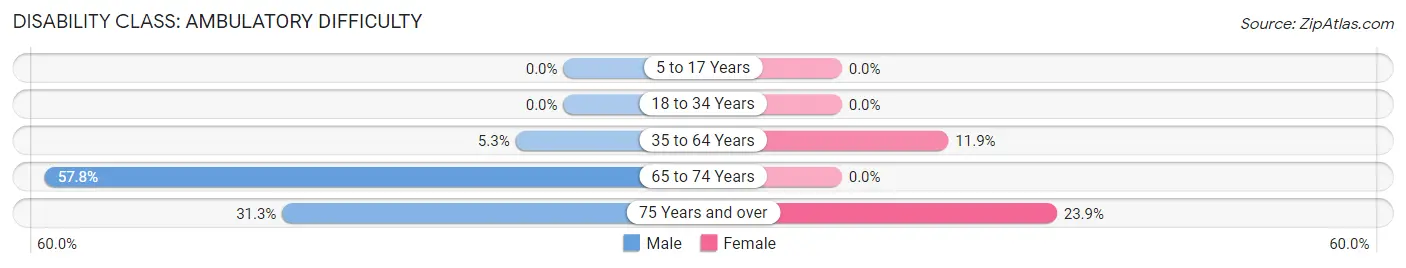
| Age Bracket | Male | Female |
| 5 to 17 Years | 0 (0.0%) | 0 (0.0%) |
| 18 to 34 Years | 0 (0.0%) | 0 (0.0%) |
| 35 to 64 Years | 72 (5.3%) | 221 (11.9%) |
| 65 to 74 Years | 41 (57.8%) | 0 (0.0%) |
| 75 Years and over | 31 (31.3%) | 17 (23.9%) |
Disability Class: Self-Care Difficulty
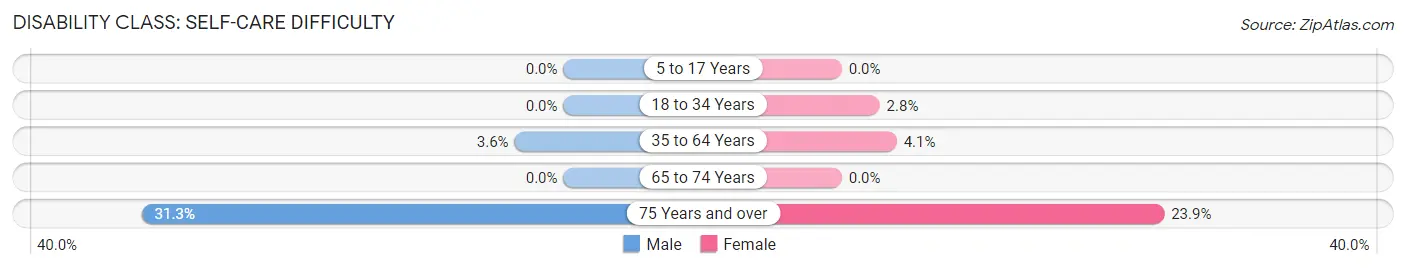
| Age Bracket | Male | Female |
| 5 to 17 Years | 0 (0.0%) | 0 (0.0%) |
| 18 to 34 Years | 0 (0.0%) | 30 (2.8%) |
| 35 to 64 Years | 49 (3.6%) | 76 (4.1%) |
| 65 to 74 Years | 0 (0.0%) | 0 (0.0%) |
| 75 Years and over | 31 (31.3%) | 17 (23.9%) |
Technology Access in Travis Ranch
Computing Device Access in Travis Ranch
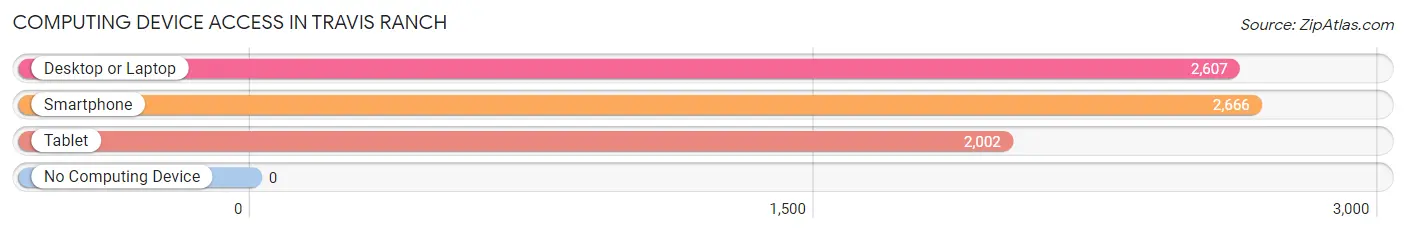
| Device Type | # Households | % Households |
| Desktop or Laptop | 2,607 | 95.5% |
| Smartphone | 2,666 | 97.7% |
| Tablet | 2,002 | 73.3% |
| No Computing Device | 0 | 0.0% |
| Total | 2,730 | 100.0% |
Internet Access in Travis Ranch
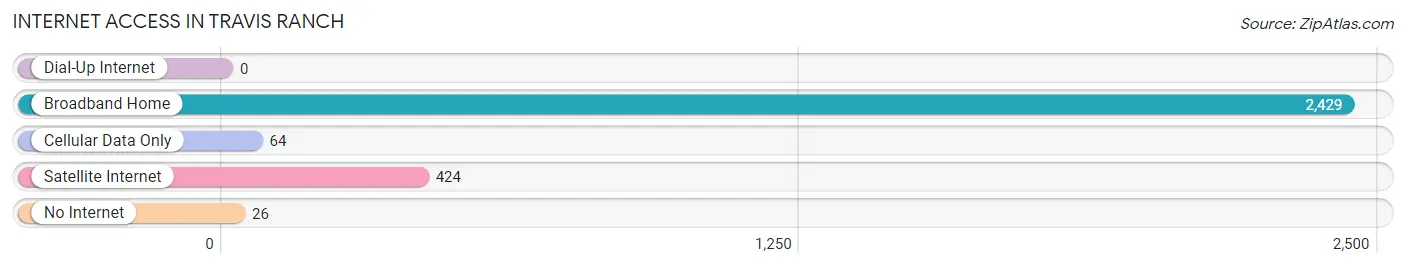
| Internet Type | # Households | % Households |
| Dial-Up Internet | 0 | 0.0% |
| Broadband Home | 2,429 | 89.0% |
| Cellular Data Only | 64 | 2.3% |
| Satellite Internet | 424 | 15.5% |
| No Internet | 26 | 0.9% |
| Total | 2,730 | 100.0% |
Travis Ranch Summary
Travis Ranch is a small unincorporated community located in the state of Texas, in the United States. It is situated in the western part of the state, in the county of Travis. The community is located about 25 miles northwest of Austin, the state capital.
History
Travis Ranch was first settled in the late 1800s by a group of settlers from the nearby town of Round Rock. The settlers were looking for a place to start a new life and found the area to be ideal for farming and ranching. The area was originally known as "Travis Ranch" and was named after the first settler, William Travis.
The community grew slowly over the years, but it was not until the early 1900s that it began to really take off. At this time, the area was becoming increasingly popular with ranchers and farmers, and the population began to grow. By the mid-1900s, the population had grown to over 500 people.
The community continued to grow throughout the 20th century, and by the year 2000, the population had grown to over 1,000 people. The community is still largely rural, but it has seen some growth in recent years due to its proximity to Austin.
Geography
Travis Ranch is located in the western part of the state of Texas, in the county of Travis. The community is situated about 25 miles northwest of Austin, the state capital. The area is mostly rural, with rolling hills and open fields. The terrain is mostly flat, with some areas of rolling hills.
The climate in the area is generally mild, with hot summers and mild winters. The average temperature in the summer is around 90 degrees Fahrenheit, while the average temperature in the winter is around 50 degrees Fahrenheit.
Economy
The economy of Travis Ranch is largely based on agriculture and ranching. The area is home to many farms and ranches, which produce a variety of crops and livestock. The area is also home to several small businesses, including restaurants, stores, and other services.
The area is also home to several large employers, including the University of Texas at Austin, Dell, and the Austin-Bergstrom International Airport. These employers provide jobs for many of the residents of Travis Ranch.
Demographics
As of the year 2000, the population of Travis Ranch was 1,072 people. The population is mostly white, with a small percentage of African Americans, Hispanics, and other ethnicities. The median household income in the area is around $50,000, and the median home value is around $150,000.
The area is home to several churches, including the First Baptist Church of Travis Ranch, the Church of Jesus Christ of Latter-day Saints, and the Travis Ranch United Methodist Church. The area is also home to several schools, including the Travis Ranch Elementary School and the Travis Ranch High School.
Conclusion
Travis Ranch is a small unincorporated community located in the western part of the state of Texas, in the county of Travis. The community was first settled in the late 1800s and has grown steadily over the years. The area is mostly rural, with rolling hills and open fields. The economy of the area is largely based on agriculture and ranching, and the population is mostly white. The area is home to several churches, schools, and businesses, and is a popular destination for those looking to escape the hustle and bustle of the city.
Common Questions
What is Per Capita Income in Travis Ranch?
Per Capita income in Travis Ranch is $29,102.
What is the Median Family Income in Travis Ranch?
Median Family Income in Travis Ranch is $73,897.
What is the Median Household income in Travis Ranch?
Median Household Income in Travis Ranch is $73,804.
What is Income or Wage Gap in Travis Ranch?
Income or Wage Gap in Travis Ranch is 34.9%.
Women in Travis Ranch earn 65.1 cents for every dollar earned by a man.
What is Inequality or Gini Index in Travis Ranch?
Inequality or Gini Index in Travis Ranch is 0.37.
What is the Total Population of Travis Ranch?
Total Population of Travis Ranch is 9,037.
What is the Total Male Population of Travis Ranch?
Total Male Population of Travis Ranch is 4,466.
What is the Total Female Population of Travis Ranch?
Total Female Population of Travis Ranch is 4,571.
What is the Ratio of Males per 100 Females in Travis Ranch?
There are 97.70 Males per 100 Females in Travis Ranch.
What is the Ratio of Females per 100 Males in Travis Ranch?
There are 102.35 Females per 100 Males in Travis Ranch.
What is the Median Population Age in Travis Ranch?
Median Population Age in Travis Ranch is 31.5 Years.
What is the Average Family Size in Travis Ranch
Average Family Size in Travis Ranch is 3.5 People.
What is the Average Household Size in Travis Ranch
Average Household Size in Travis Ranch is 3.3 People.
How Large is the Labor Force in Travis Ranch?
There are 4,549 People in the Labor Forcein in Travis Ranch.
What is the Percentage of People in the Labor Force in Travis Ranch?
71.7% of People are in the Labor Force in Travis Ranch.
What is the Unemployment Rate in Travis Ranch?
Unemployment Rate in Travis Ranch is 2.6%.