Morrisville, NC Map & Demographics
Morrisville Map
Morrisville Overview
$51,699
PER CAPITA INCOME
$135,942
AVG FAMILY INCOME
$114,075
AVG HOUSEHOLD INCOME
36.5%
WAGE / INCOME GAP [ % ]
63.5¢/ $1
WAGE / INCOME GAP [ $ ]
$10,563
FAMILY INCOME DEFICIT
0.37
INEQUALITY / GINI INDEX
29,756
TOTAL POPULATION
15,049
MALE POPULATION
14,707
FEMALE POPULATION
102.33
MALES / 100 FEMALES
97.73
FEMALES / 100 MALES
34.3
MEDIAN AGE
3.3
AVG FAMILY SIZE
2.7
AVG HOUSEHOLD SIZE
17,604
LABOR FORCE [ PEOPLE ]
74.6%
PERCENT IN LABOR FORCE
3.6%
UNEMPLOYMENT RATE
Morrisville Zip Codes
Morrisville Area Codes
Income in Morrisville
Income Overview in Morrisville
Per Capita Income in Morrisville is $51,699, while median incomes of families and households are $135,942 and $114,075 respectively.
| Characteristic | Number | Measure |
| Per Capita Income | 29,756 | $51,699 |
| Median Family Income | 7,472 | $135,942 |
| Mean Family Income | 7,472 | $152,249 |
| Median Household Income | 11,151 | $114,075 |
| Mean Household Income | 11,151 | $133,786 |
| Income Deficit | 7,472 | $10,563 |
| Wage / Income Gap (%) | 29,756 | 36.50% |
| Wage / Income Gap ($) | 29,756 | 63.50¢ per $1 |
| Gini / Inequality Index | 29,756 | 0.37 |
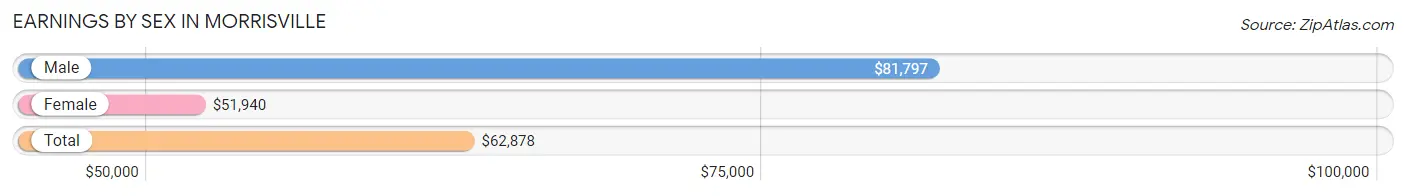
Earnings by Sex in Morrisville
Average Earnings in Morrisville are $62,878, $81,797 for men and $51,940 for women, a difference of 36.5%.
| Sex | Number | Average Earnings |
| Male | 10,121 (56.4%) | $81,797 |
| Female | 7,834 (43.6%) | $51,940 |
| Total | 17,955 (100.0%) | $62,878 |
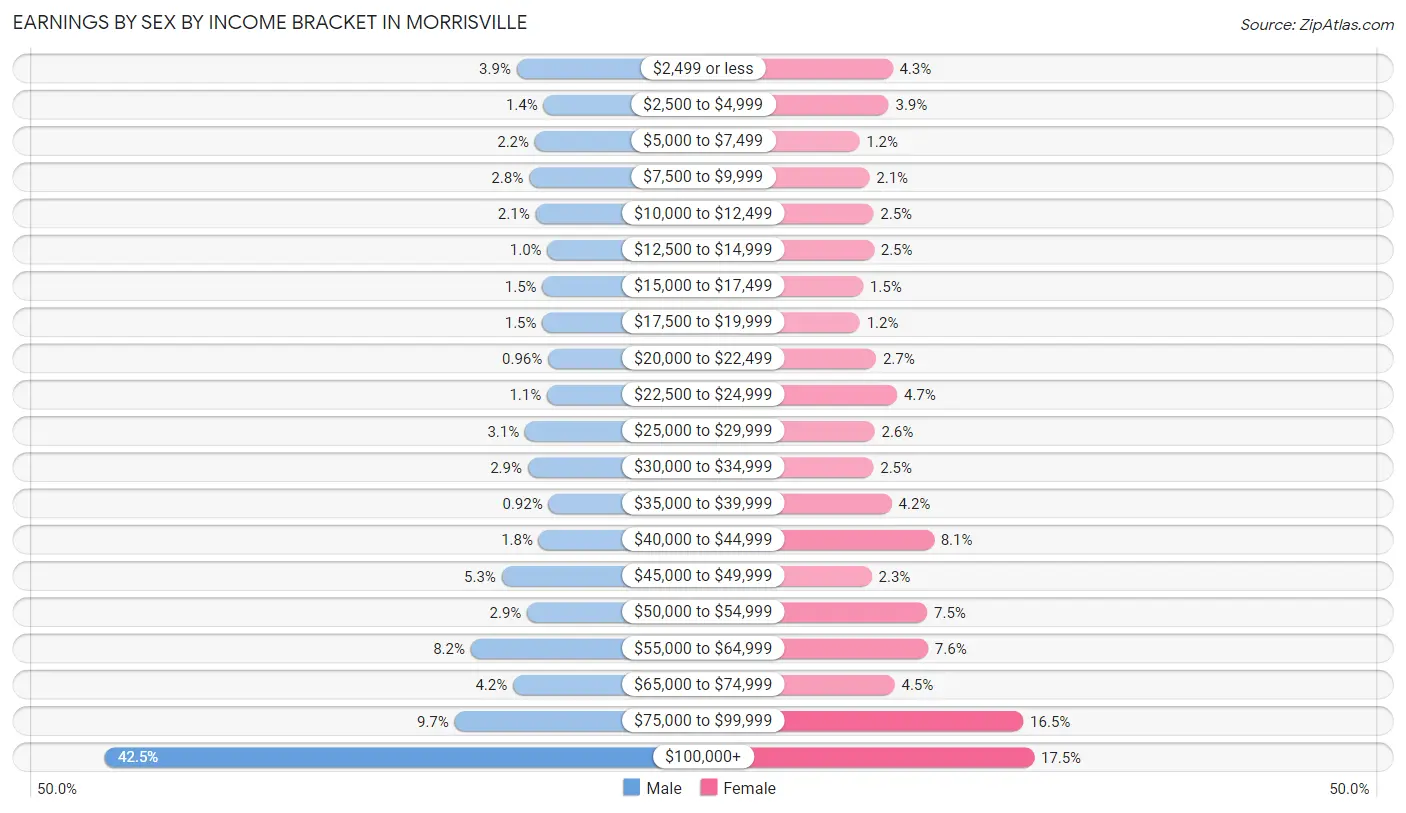
Earnings by Sex by Income Bracket in Morrisville
The most common earnings brackets in Morrisville are $100,000+ for men (4,298 | 42.5%) and $100,000+ for women (1,373 | 17.5%).
| Income | Male | Female |
| $2,499 or less | 395 (3.9%) | 335 (4.3%) |
| $2,500 to $4,999 | 141 (1.4%) | 306 (3.9%) |
| $5,000 to $7,499 | 223 (2.2%) | 92 (1.2%) |
| $7,500 to $9,999 | 278 (2.8%) | 165 (2.1%) |
| $10,000 to $12,499 | 217 (2.1%) | 195 (2.5%) |
| $12,500 to $14,999 | 103 (1.0%) | 198 (2.5%) |
| $15,000 to $17,499 | 151 (1.5%) | 118 (1.5%) |
| $17,500 to $19,999 | 152 (1.5%) | 95 (1.2%) |
| $20,000 to $22,499 | 97 (1.0%) | 214 (2.7%) |
| $22,500 to $24,999 | 107 (1.1%) | 368 (4.7%) |
| $25,000 to $29,999 | 316 (3.1%) | 204 (2.6%) |
| $30,000 to $34,999 | 289 (2.9%) | 194 (2.5%) |
| $35,000 to $39,999 | 93 (0.9%) | 329 (4.2%) |
| $40,000 to $44,999 | 185 (1.8%) | 638 (8.1%) |
| $45,000 to $49,999 | 537 (5.3%) | 182 (2.3%) |
| $50,000 to $54,999 | 296 (2.9%) | 589 (7.5%) |
| $55,000 to $64,999 | 830 (8.2%) | 595 (7.6%) |
| $65,000 to $74,999 | 429 (4.2%) | 350 (4.5%) |
| $75,000 to $99,999 | 984 (9.7%) | 1,294 (16.5%) |
| $100,000+ | 4,298 (42.5%) | 1,373 (17.5%) |
| Total | 10,121 (100.0%) | 7,834 (100.0%) |
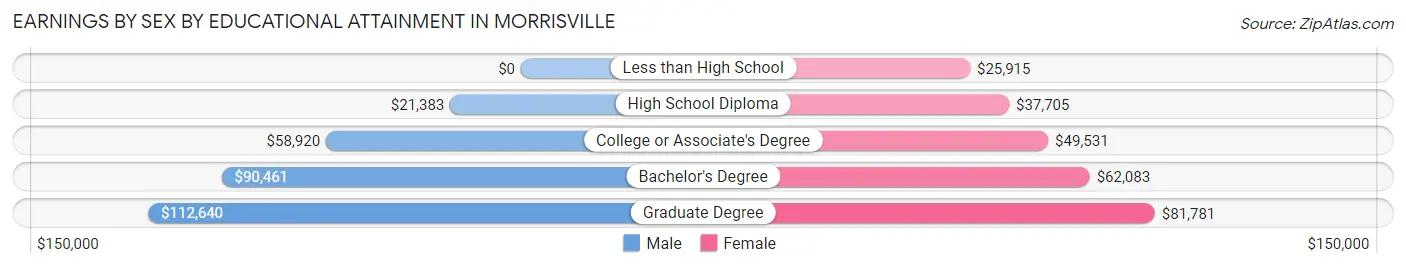
Earnings by Sex by Educational Attainment in Morrisville
Average earnings in Morrisville are $93,400 for men and $57,933 for women, a difference of 38.0%. Men with an educational attainment of graduate degree enjoy the highest average annual earnings of $112,640, while those with high school diploma education earn the least with $21,383. Women with an educational attainment of graduate degree earn the most with the average annual earnings of $81,781, while those with less than high school education have the smallest earnings of $25,915.
| Educational Attainment | Male Income | Female Income |
| Less than High School | - | - |
| High School Diploma | $21,383 | $37,705 |
| College or Associate's Degree | $58,920 | $49,531 |
| Bachelor's Degree | $90,461 | $62,083 |
| Graduate Degree | $112,640 | $81,781 |
| Total | $93,400 | $57,933 |
Family Income in Morrisville
Family Income Brackets in Morrisville
According to the Morrisville family income data, there are 2,032 families falling into the $100,000 to $149,999 income range, which is the most common income bracket and makes up 27.2% of all families. Conversely, the $10,000 to $14,999 income bracket is the least frequent group with only 82 families (1.1%) belonging to this category.
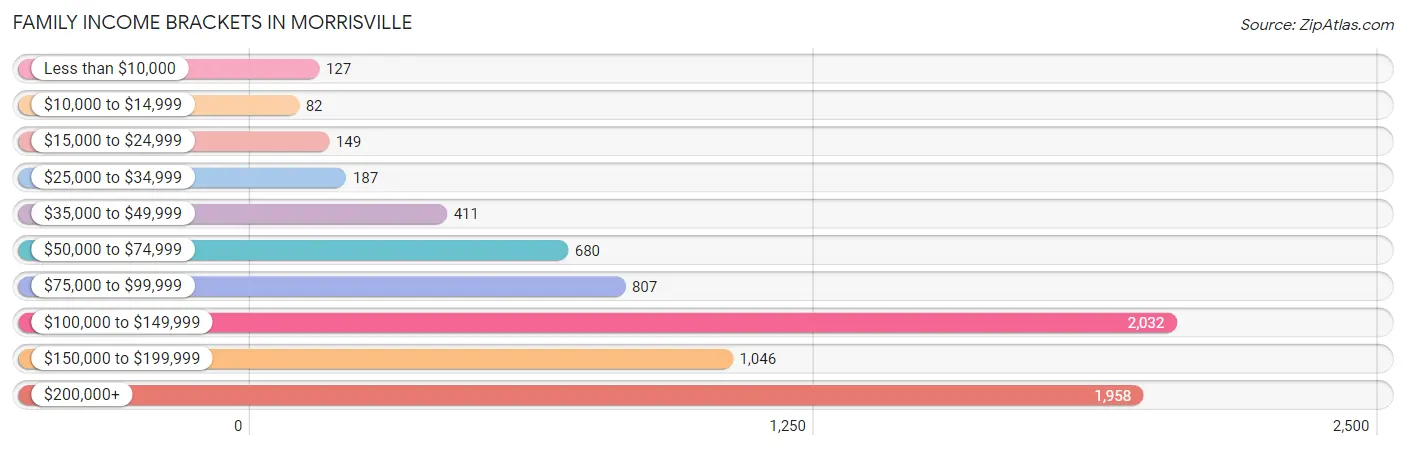
| Income Bracket | # Families | % Families |
| Less than $10,000 | 127 | 1.7% |
| $10,000 to $14,999 | 82 | 1.1% |
| $15,000 to $24,999 | 149 | 2.0% |
| $25,000 to $34,999 | 187 | 2.5% |
| $35,000 to $49,999 | 411 | 5.5% |
| $50,000 to $74,999 | 680 | 9.1% |
| $75,000 to $99,999 | 807 | 10.8% |
| $100,000 to $149,999 | 2,032 | 27.2% |
| $150,000 to $199,999 | 1,046 | 14.0% |
| $200,000+ | 1,958 | 26.2% |
Family Income by Famaliy Size in Morrisville
7+ person families (50 | 0.7%) account for the highest median family income in Morrisville with $250,001 per family, while 2-person families (2,818 | 37.7%) have the highest median income of $56,037 per family member.
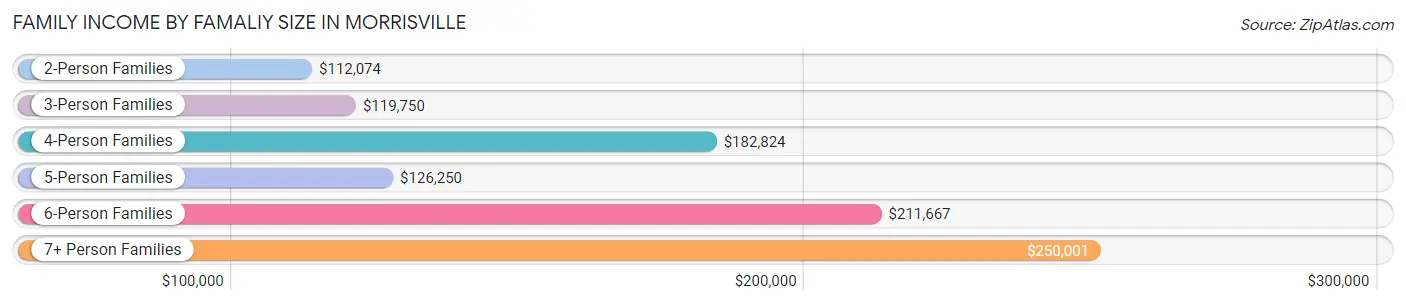
| Income Bracket | # Families | Median Income |
| 2-Person Families | 2,818 (37.7%) | $112,074 |
| 3-Person Families | 1,734 (23.2%) | $119,750 |
| 4-Person Families | 2,003 (26.8%) | $182,824 |
| 5-Person Families | 635 (8.5%) | $126,250 |
| 6-Person Families | 232 (3.1%) | $211,667 |
| 7+ Person Families | 50 (0.7%) | $250,001 |
| Total | 7,472 (100.0%) | $135,942 |
Family Income by Number of Earners in Morrisville
The median family income in Morrisville is $135,942, with families comprising 3+ earners (919) having the highest median family income of $206,902, while families with no earners (409) have the lowest median family income of $41,286, accounting for 12.3% and 5.5% of families, respectively.
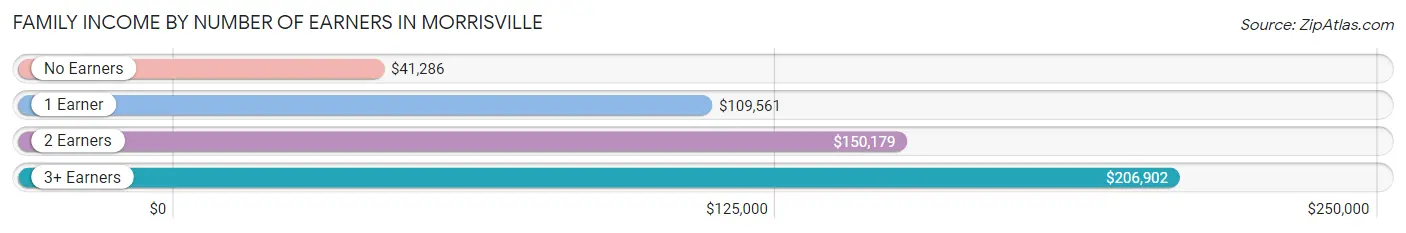
| Number of Earners | # Families | Median Income |
| No Earners | 409 (5.5%) | $41,286 |
| 1 Earner | 2,308 (30.9%) | $109,561 |
| 2 Earners | 3,836 (51.3%) | $150,179 |
| 3+ Earners | 919 (12.3%) | $206,902 |
| Total | 7,472 (100.0%) | $135,942 |
Household Income in Morrisville
Household Income Brackets in Morrisville
With 3,334 households falling in the category, the $100,000 to $149,999 income range is the most frequent in Morrisville, accounting for 29.9% of all households. In contrast, only 145 households (1.3%) fall into the $10,000 to $14,999 income bracket, making it the least populous group.
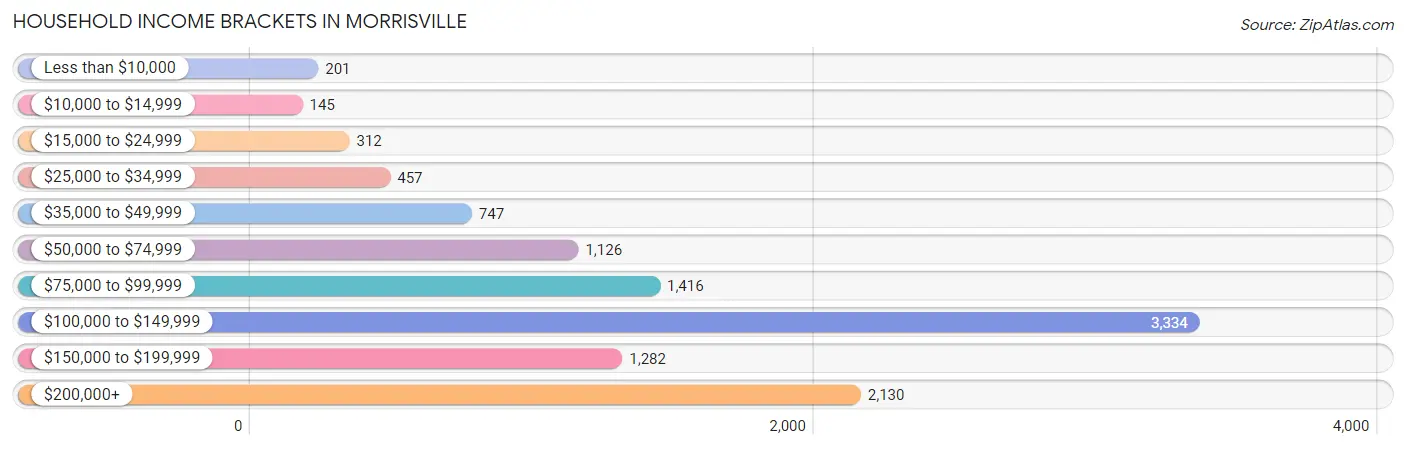
| Income Bracket | # Households | % Households |
| Less than $10,000 | 201 | 1.8% |
| $10,000 to $14,999 | 145 | 1.3% |
| $15,000 to $24,999 | 312 | 2.8% |
| $25,000 to $34,999 | 457 | 4.1% |
| $35,000 to $49,999 | 747 | 6.7% |
| $50,000 to $74,999 | 1,126 | 10.1% |
| $75,000 to $99,999 | 1,416 | 12.7% |
| $100,000 to $149,999 | 3,334 | 29.9% |
| $150,000 to $199,999 | 1,282 | 11.5% |
| $200,000+ | 2,130 | 19.1% |
Household Income by Householder Age in Morrisville
The median household income in Morrisville is $114,075, with the highest median household income of $124,038 found in the 45 to 64 years age bracket for the primary householder. A total of 4,188 households (37.6%) fall into this category. Meanwhile, the 65+ years age bracket for the primary householder has the lowest median household income of $52,321, with 880 households (7.9%) in this group.
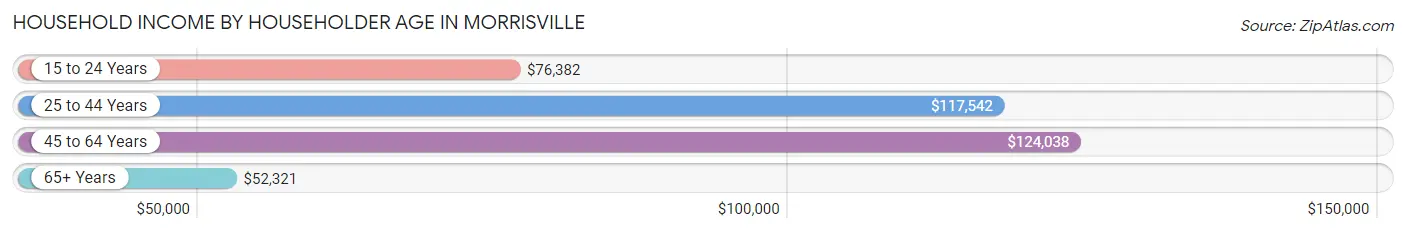
| Income Bracket | # Households | Median Income |
| 15 to 24 Years | 517 (4.6%) | $76,382 |
| 25 to 44 Years | 5,566 (49.9%) | $117,542 |
| 45 to 64 Years | 4,188 (37.6%) | $124,038 |
| 65+ Years | 880 (7.9%) | $52,321 |
| Total | 11,151 (100.0%) | $114,075 |
Poverty in Morrisville
Income Below Poverty by Sex and Age in Morrisville
With 4.2% poverty level for males and 7.5% for females among the residents of Morrisville, 18 to 24 year old males and 5 year old females are the most vulnerable to poverty, with 153 males (14.1%) and 65 females (33.9%) in their respective age groups living below the poverty level.
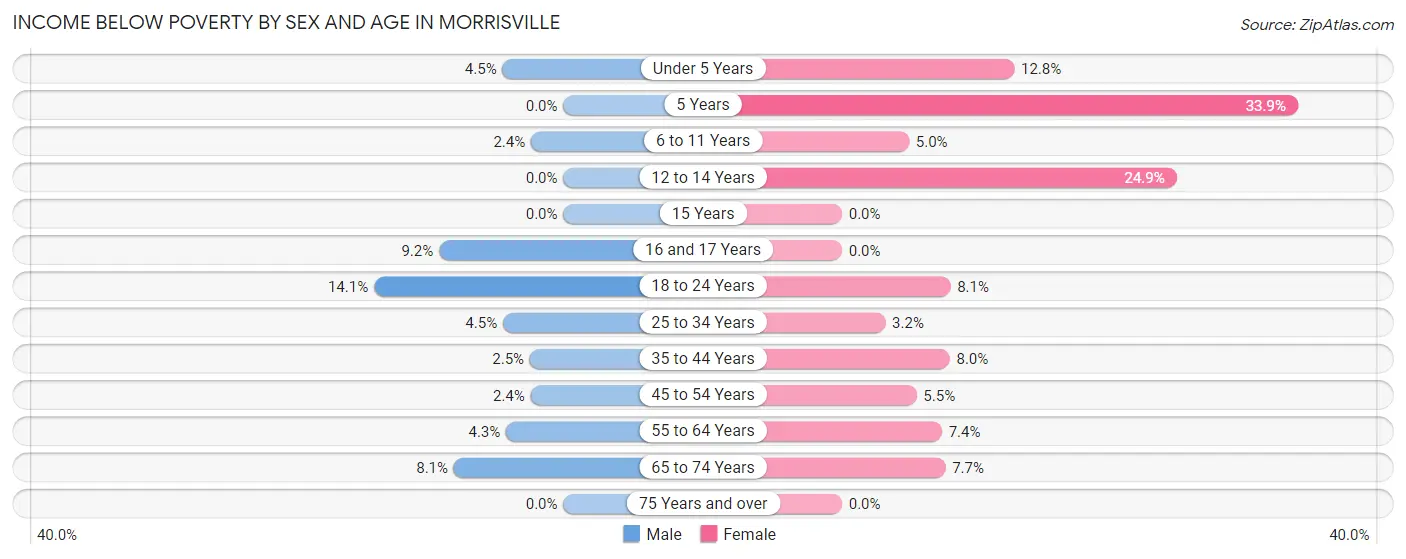
| Age Bracket | Male | Female |
| Under 5 Years | 36 (4.5%) | 128 (12.8%) |
| 5 Years | 0 (0.0%) | 65 (33.9%) |
| 6 to 11 Years | 29 (2.4%) | 54 (5.0%) |
| 12 to 14 Years | 0 (0.0%) | 165 (24.8%) |
| 15 Years | 0 (0.0%) | 0 (0.0%) |
| 16 and 17 Years | 37 (9.2%) | 0 (0.0%) |
| 18 to 24 Years | 153 (14.1%) | 118 (8.1%) |
| 25 to 34 Years | 142 (4.5%) | 90 (3.2%) |
| 35 to 44 Years | 69 (2.5%) | 214 (8.0%) |
| 45 to 54 Years | 50 (2.4%) | 107 (5.5%) |
| 55 to 64 Years | 65 (4.3%) | 104 (7.4%) |
| 65 to 74 Years | 44 (8.1%) | 52 (7.7%) |
| 75 Years and over | 0 (0.0%) | 0 (0.0%) |
| Total | 625 (4.2%) | 1,097 (7.5%) |
Income Above Poverty by Sex and Age in Morrisville
According to the poverty statistics in Morrisville, males aged 5 years and females aged 15 years are the age groups that are most secure financially, with 100.0% of males and 100.0% of females in these age groups living above the poverty line.
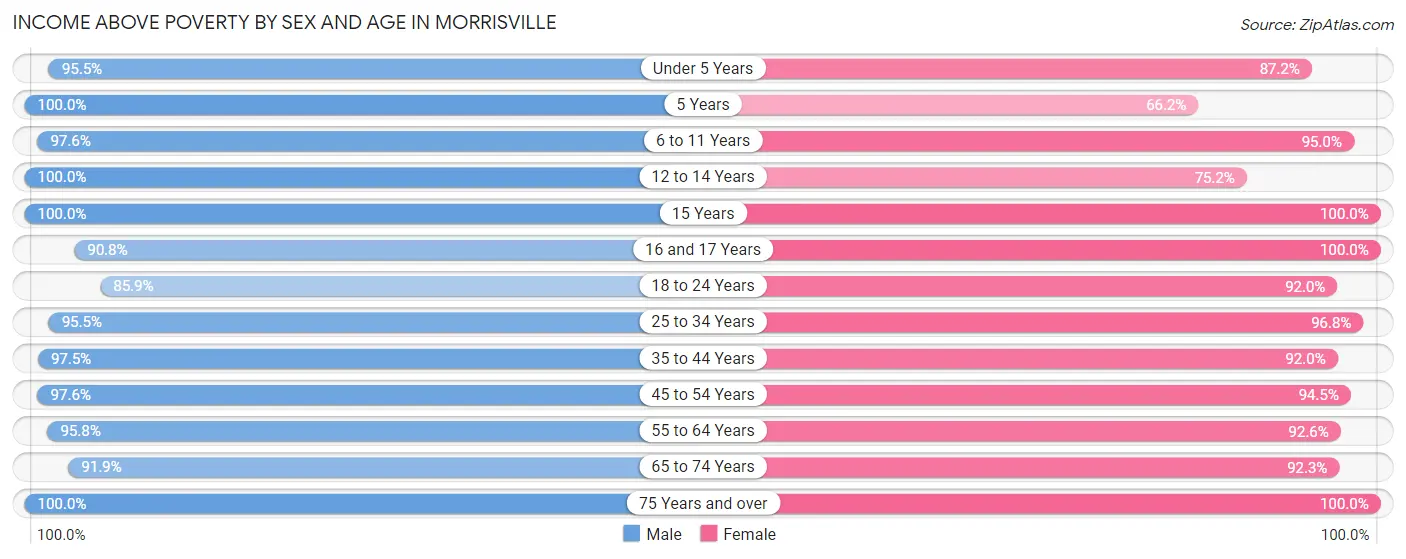
| Age Bracket | Male | Female |
| Under 5 Years | 761 (95.5%) | 873 (87.2%) |
| 5 Years | 193 (100.0%) | 127 (66.1%) |
| 6 to 11 Years | 1,181 (97.6%) | 1,031 (95.0%) |
| 12 to 14 Years | 603 (100.0%) | 499 (75.1%) |
| 15 Years | 204 (100.0%) | 141 (100.0%) |
| 16 and 17 Years | 364 (90.8%) | 324 (100.0%) |
| 18 to 24 Years | 935 (85.9%) | 1,347 (91.9%) |
| 25 to 34 Years | 3,031 (95.5%) | 2,705 (96.8%) |
| 35 to 44 Years | 2,712 (97.5%) | 2,462 (92.0%) |
| 45 to 54 Years | 2,009 (97.6%) | 1,824 (94.5%) |
| 55 to 64 Years | 1,465 (95.8%) | 1,298 (92.6%) |
| 65 to 74 Years | 497 (91.9%) | 625 (92.3%) |
| 75 Years and over | 418 (100.0%) | 337 (100.0%) |
| Total | 14,373 (95.8%) | 13,593 (92.5%) |
Income Below Poverty Among Married-Couple Families in Morrisville
The poverty statistics for married-couple families in Morrisville show that 1.8% or 111 of the total 6,168 families live below the poverty line. Families with 3 or 4 children have the highest poverty rate of 3.4%, comprising of 15 families. On the other hand, families with no children have the lowest poverty rate of 1.4%, which includes 36 families.
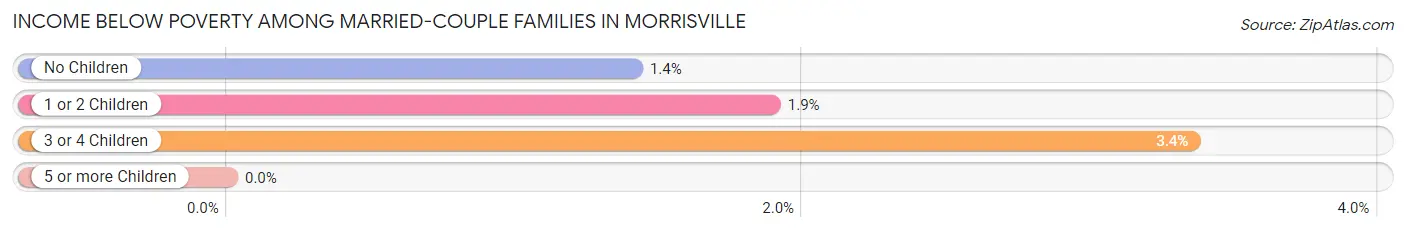
| Children | Above Poverty | Below Poverty |
| No Children | 2,512 (98.6%) | 36 (1.4%) |
| 1 or 2 Children | 3,112 (98.1%) | 60 (1.9%) |
| 3 or 4 Children | 433 (96.7%) | 15 (3.4%) |
| 5 or more Children | 0 (0.0%) | 0 (0.0%) |
| Total | 6,057 (98.2%) | 111 (1.8%) |
Income Below Poverty Among Single-Parent Households in Morrisville
According to the poverty data in Morrisville, 11.6% or 42 single-father households and 17.6% or 166 single-mother households are living below the poverty line. Among single-father households, those with 3 or 4 children have the highest poverty rate, with 15 households (100.0%) experiencing poverty. Likewise, among single-mother households, those with 3 or 4 children have the highest poverty rate, with 47 households (75.8%) falling below the poverty line.
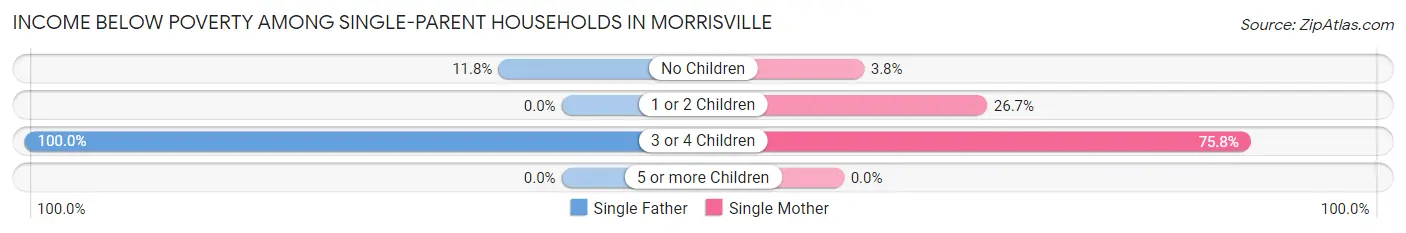
| Children | Single Father | Single Mother |
| No Children | 27 (11.8%) | 19 (3.7%) |
| 1 or 2 Children | 0 (0.0%) | 100 (26.7%) |
| 3 or 4 Children | 15 (100.0%) | 47 (75.8%) |
| 5 or more Children | 0 (0.0%) | 0 (0.0%) |
| Total | 42 (11.6%) | 166 (17.6%) |
Income Below Poverty Among Married-Couple vs Single-Parent Households in Morrisville
The poverty data for Morrisville shows that 111 of the married-couple family households (1.8%) and 208 of the single-parent households (16.0%) are living below the poverty level. Within the married-couple family households, those with 3 or 4 children have the highest poverty rate, with 15 households (3.4%) falling below the poverty line. Among the single-parent households, those with 3 or 4 children have the highest poverty rate, with 62 household (80.5%) living below poverty.
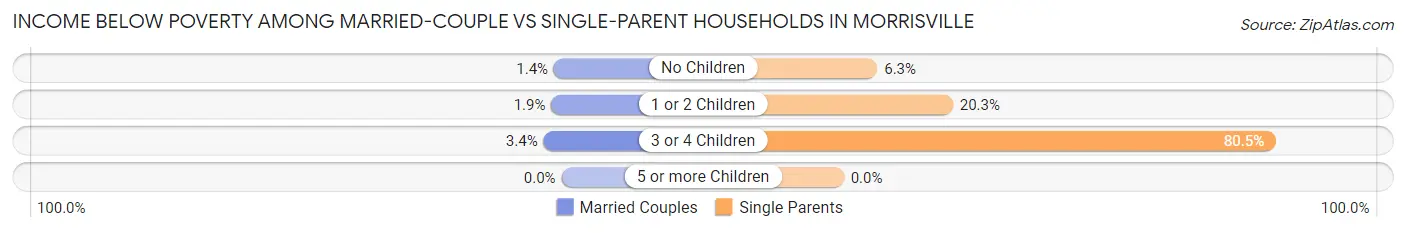
| Children | Married-Couple Families | Single-Parent Households |
| No Children | 36 (1.4%) | 46 (6.3%) |
| 1 or 2 Children | 60 (1.9%) | 100 (20.3%) |
| 3 or 4 Children | 15 (3.4%) | 62 (80.5%) |
| 5 or more Children | 0 (0.0%) | 0 (0.0%) |
| Total | 111 (1.8%) | 208 (16.0%) |
Race in Morrisville
The most populous races in Morrisville are Asian (12,665 | 42.6%), White / Caucasian (11,396 | 38.3%), and Black / African American (3,435 | 11.5%).
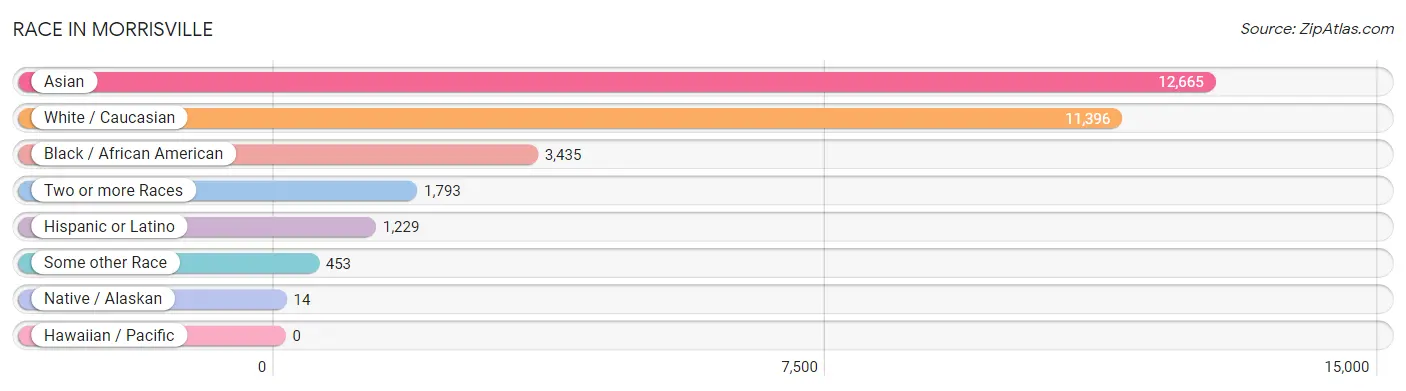
| Race | # Population | % Population |
| Asian | 12,665 | 42.6% |
| Black / African American | 3,435 | 11.5% |
| Hawaiian / Pacific | 0 | 0.0% |
| Hispanic or Latino | 1,229 | 4.1% |
| Native / Alaskan | 14 | 0.1% |
| White / Caucasian | 11,396 | 38.3% |
| Two or more Races | 1,793 | 6.0% |
| Some other Race | 453 | 1.5% |
| Total | 29,756 | 100.0% |
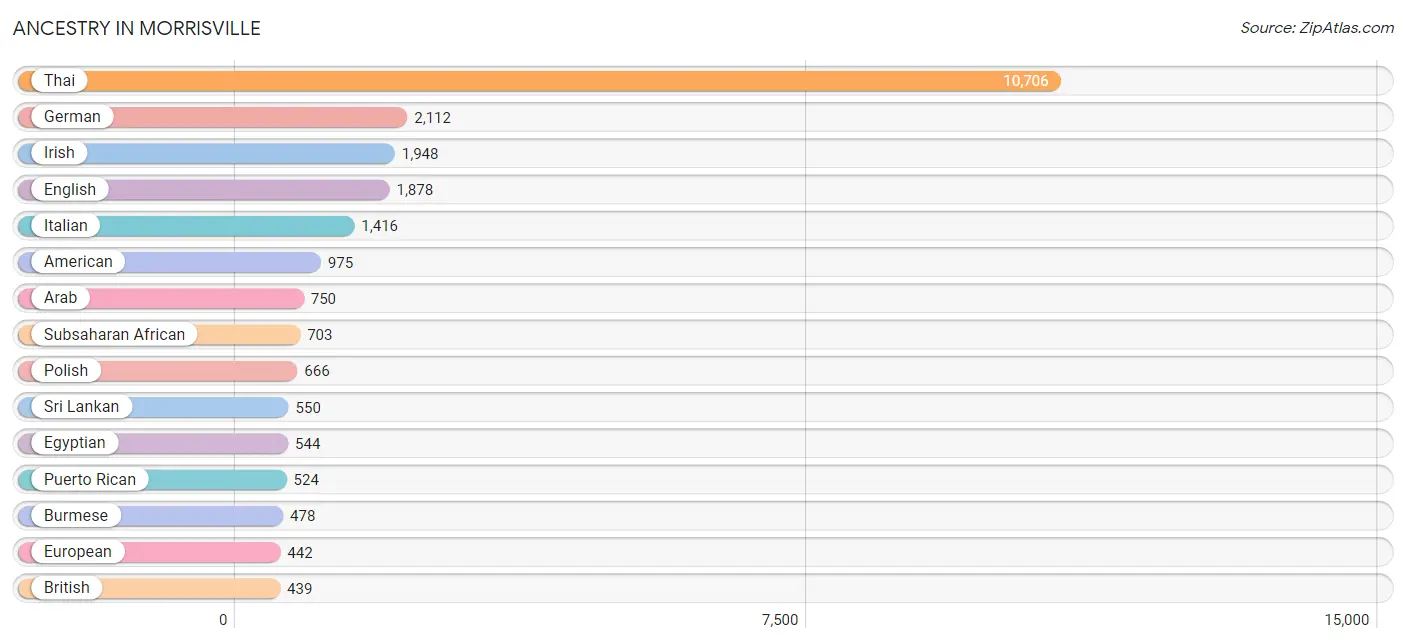
Ancestry in Morrisville
The most populous ancestries reported in Morrisville are Thai (10,706 | 36.0%), German (2,112 | 7.1%), Irish (1,948 | 6.6%), English (1,878 | 6.3%), and Italian (1,416 | 4.8%), together accounting for 60.7% of all Morrisville residents.
| Ancestry | # Population | % Population |
| African | 57 | 0.2% |
| American | 975 | 3.3% |
| Arab | 750 | 2.5% |
| Armenian | 19 | 0.1% |
| Austrian | 50 | 0.2% |
| Bhutanese | 222 | 0.7% |
| British | 439 | 1.5% |
| British West Indian | 59 | 0.2% |
| Bulgarian | 91 | 0.3% |
| Burmese | 478 | 1.6% |
| Cajun | 10 | 0.0% |
| Canadian | 11 | 0.0% |
| Cape Verdean | 26 | 0.1% |
| Central American | 66 | 0.2% |
| Colombian | 28 | 0.1% |
| Creek | 4 | 0.0% |
| Cuban | 55 | 0.2% |
| Czech | 33 | 0.1% |
| Czechoslovakian | 85 | 0.3% |
| Delaware | 5 | 0.0% |
| Dominican | 69 | 0.2% |
| Dutch | 155 | 0.5% |
| Eastern European | 53 | 0.2% |
| Ecuadorian | 54 | 0.2% |
| Egyptian | 544 | 1.8% |
| English | 1,878 | 6.3% |
| Ethiopian | 21 | 0.1% |
| European | 442 | 1.5% |
| Filipino | 127 | 0.4% |
| Finnish | 39 | 0.1% |
| French | 311 | 1.1% |
| French Canadian | 73 | 0.3% |
| German | 2,112 | 7.1% |
| Greek | 43 | 0.1% |
| Guyanese | 25 | 0.1% |
| Haitian | 19 | 0.1% |
| Hungarian | 117 | 0.4% |
| Indian (Asian) | 417 | 1.4% |
| Iranian | 36 | 0.1% |
| Iraqi | 73 | 0.3% |
| Irish | 1,948 | 6.6% |
| Italian | 1,416 | 4.8% |
| Jamaican | 206 | 0.7% |
| Korean | 190 | 0.6% |
| Laotian | 21 | 0.1% |
| Latvian | 10 | 0.0% |
| Lebanese | 74 | 0.3% |
| Liberian | 152 | 0.5% |
| Lumbee | 9 | 0.0% |
| Mexican | 119 | 0.4% |
| Mongolian | 40 | 0.1% |
| Moroccan | 64 | 0.2% |
| Native Hawaiian | 5 | 0.0% |
| Nigerian | 137 | 0.5% |
| Norwegian | 164 | 0.5% |
| Pakistani | 71 | 0.2% |
| Panamanian | 25 | 0.1% |
| Peruvian | 9 | 0.0% |
| Polish | 666 | 2.2% |
| Portuguese | 28 | 0.1% |
| Puerto Rican | 524 | 1.8% |
| Romanian | 85 | 0.3% |
| Russian | 243 | 0.8% |
| Salvadoran | 41 | 0.1% |
| Scandinavian | 16 | 0.1% |
| Scotch-Irish | 260 | 0.9% |
| Scottish | 309 | 1.0% |
| Sierra Leonean | 312 | 1.1% |
| Slavic | 15 | 0.1% |
| Slovak | 17 | 0.1% |
| Somali | 100 | 0.3% |
| South American | 129 | 0.4% |
| Spaniard | 199 | 0.7% |
| Sri Lankan | 550 | 1.8% |
| Subsaharan African | 703 | 2.4% |
| Swedish | 197 | 0.7% |
| Swiss | 66 | 0.2% |
| Syrian | 17 | 0.1% |
| Thai | 10,706 | 36.0% |
| Turkish | 81 | 0.3% |
| Ukrainian | 33 | 0.1% |
| Venezuelan | 38 | 0.1% |
| Vietnamese | 77 | 0.3% |
| Welsh | 288 | 1.0% |
| West Indian | 59 | 0.2% |
| Yugoslavian | 26 | 0.1% |
| Zimbabwean | 8 | 0.0% | View All 87 Rows |
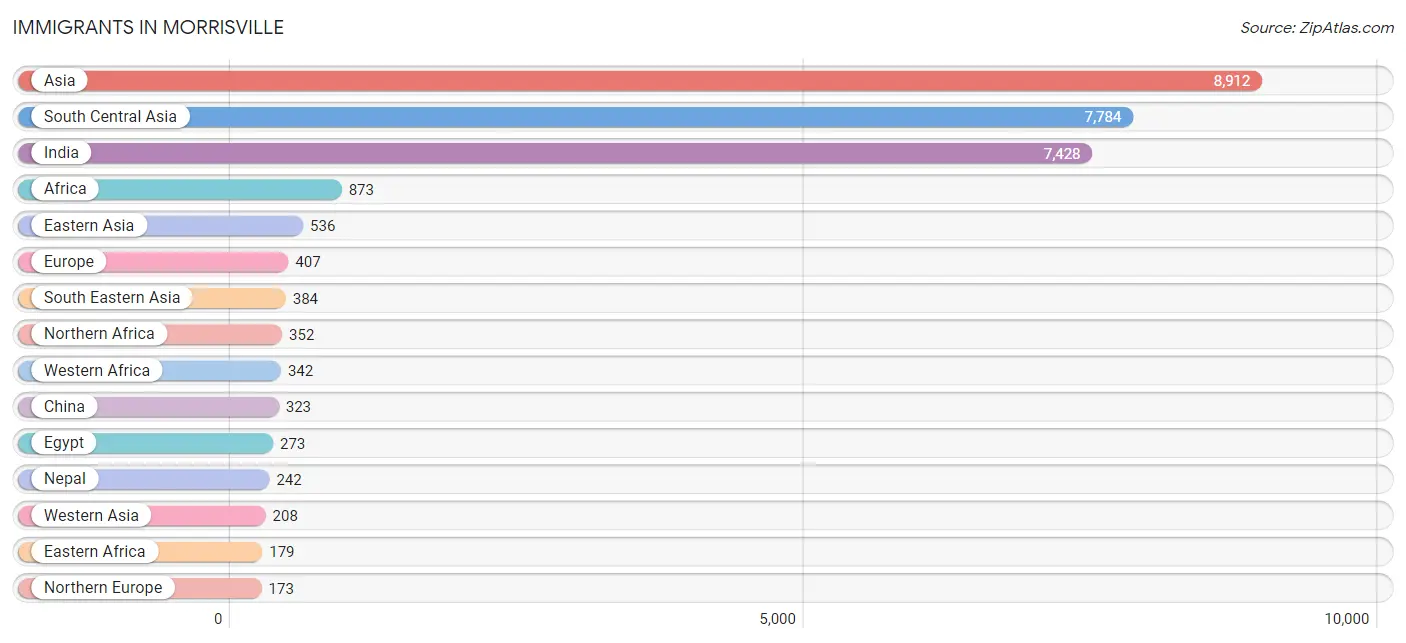
Immigrants in Morrisville
The most numerous immigrant groups reported in Morrisville came from Asia (8,912 | 29.9%), South Central Asia (7,784 | 26.2%), India (7,428 | 25.0%), Africa (873 | 2.9%), and Eastern Asia (536 | 1.8%), together accounting for 85.8% of all Morrisville residents.
| Immigration Origin | # Population | % Population |
| Africa | 873 | 2.9% |
| Asia | 8,912 | 29.9% |
| Bangladesh | 77 | 0.3% |
| Cambodia | 29 | 0.1% |
| Canada | 48 | 0.2% |
| Caribbean | 36 | 0.1% |
| Central America | 82 | 0.3% |
| China | 323 | 1.1% |
| Dominica | 31 | 0.1% |
| Dominican Republic | 5 | 0.0% |
| Eastern Africa | 179 | 0.6% |
| Eastern Asia | 536 | 1.8% |
| Eastern Europe | 140 | 0.5% |
| Ecuador | 11 | 0.0% |
| Egypt | 273 | 0.9% |
| England | 112 | 0.4% |
| Europe | 407 | 1.4% |
| Germany | 11 | 0.0% |
| Greece | 12 | 0.0% |
| Hong Kong | 20 | 0.1% |
| India | 7,428 | 25.0% |
| Indonesia | 21 | 0.1% |
| Iran | 17 | 0.1% |
| Iraq | 69 | 0.2% |
| Italy | 59 | 0.2% |
| Japan | 134 | 0.4% |
| Kenya | 9 | 0.0% |
| Korea | 79 | 0.3% |
| Latin America | 167 | 0.6% |
| Liberia | 120 | 0.4% |
| Malaysia | 45 | 0.2% |
| Mexico | 32 | 0.1% |
| Morocco | 29 | 0.1% |
| Nepal | 242 | 0.8% |
| Nigeria | 53 | 0.2% |
| Northern Africa | 352 | 1.2% |
| Northern Europe | 173 | 0.6% |
| Panama | 50 | 0.2% |
| Philippines | 94 | 0.3% |
| Poland | 17 | 0.1% |
| Russia | 123 | 0.4% |
| Sierra Leone | 169 | 0.6% |
| Somalia | 114 | 0.4% |
| South America | 49 | 0.2% |
| South Central Asia | 7,784 | 26.2% |
| South Eastern Asia | 384 | 1.3% |
| Southern Europe | 71 | 0.2% |
| Sri Lanka | 20 | 0.1% |
| Sudan | 50 | 0.2% |
| Switzerland | 12 | 0.0% |
| Taiwan | 90 | 0.3% |
| Thailand | 23 | 0.1% |
| Turkey | 63 | 0.2% |
| Venezuela | 38 | 0.1% |
| Vietnam | 172 | 0.6% |
| Western Africa | 342 | 1.1% |
| Western Asia | 208 | 0.7% |
| Western Europe | 23 | 0.1% |
| Zimbabwe | 8 | 0.0% | View All 59 Rows |
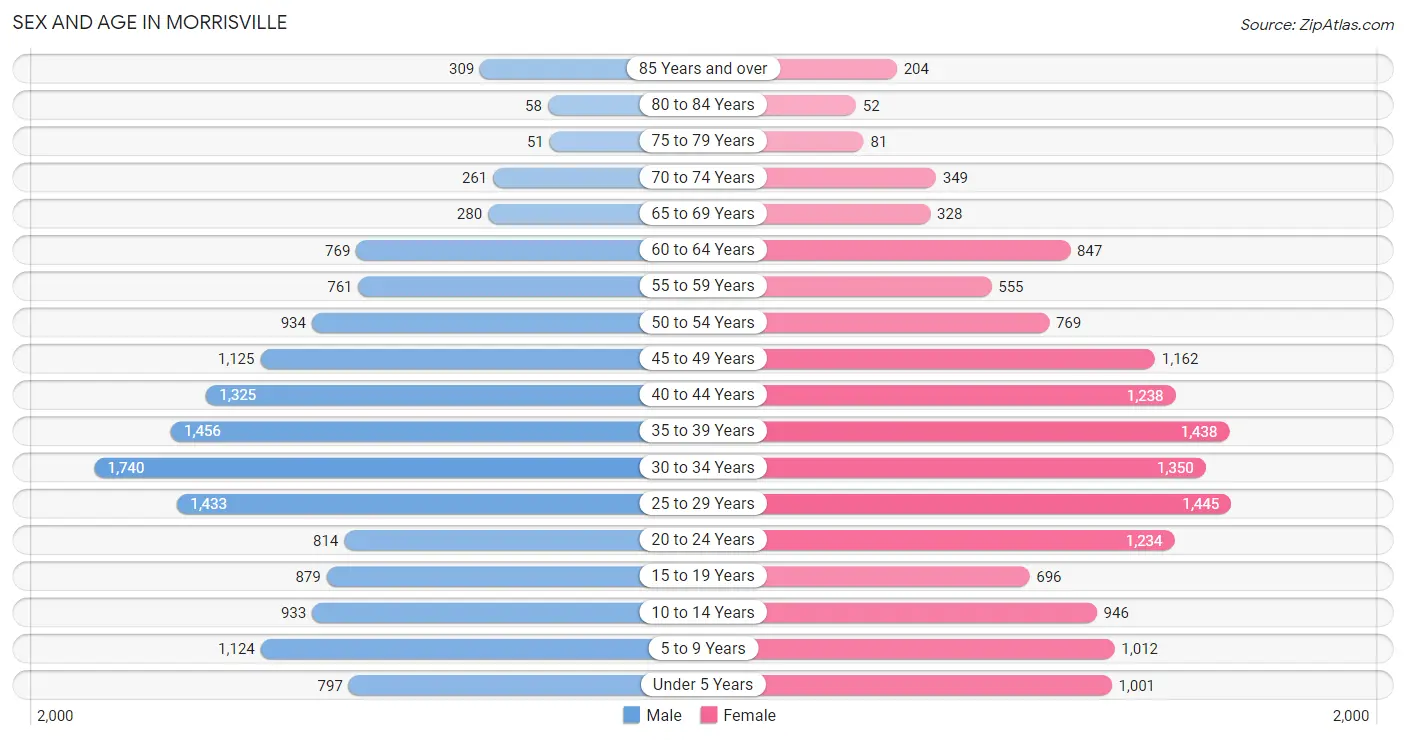
Sex and Age in Morrisville
Sex and Age in Morrisville
The most populous age groups in Morrisville are 30 to 34 Years (1,740 | 11.6%) for men and 25 to 29 Years (1,445 | 9.8%) for women.
| Age Bracket | Male | Female |
| Under 5 Years | 797 (5.3%) | 1,001 (6.8%) |
| 5 to 9 Years | 1,124 (7.5%) | 1,012 (6.9%) |
| 10 to 14 Years | 933 (6.2%) | 946 (6.4%) |
| 15 to 19 Years | 879 (5.8%) | 696 (4.7%) |
| 20 to 24 Years | 814 (5.4%) | 1,234 (8.4%) |
| 25 to 29 Years | 1,433 (9.5%) | 1,445 (9.8%) |
| 30 to 34 Years | 1,740 (11.6%) | 1,350 (9.2%) |
| 35 to 39 Years | 1,456 (9.7%) | 1,438 (9.8%) |
| 40 to 44 Years | 1,325 (8.8%) | 1,238 (8.4%) |
| 45 to 49 Years | 1,125 (7.5%) | 1,162 (7.9%) |
| 50 to 54 Years | 934 (6.2%) | 769 (5.2%) |
| 55 to 59 Years | 761 (5.1%) | 555 (3.8%) |
| 60 to 64 Years | 769 (5.1%) | 847 (5.8%) |
| 65 to 69 Years | 280 (1.9%) | 328 (2.2%) |
| 70 to 74 Years | 261 (1.7%) | 349 (2.4%) |
| 75 to 79 Years | 51 (0.3%) | 81 (0.5%) |
| 80 to 84 Years | 58 (0.4%) | 52 (0.4%) |
| 85 Years and over | 309 (2.1%) | 204 (1.4%) |
| Total | 15,049 (100.0%) | 14,707 (100.0%) |
Families and Households in Morrisville
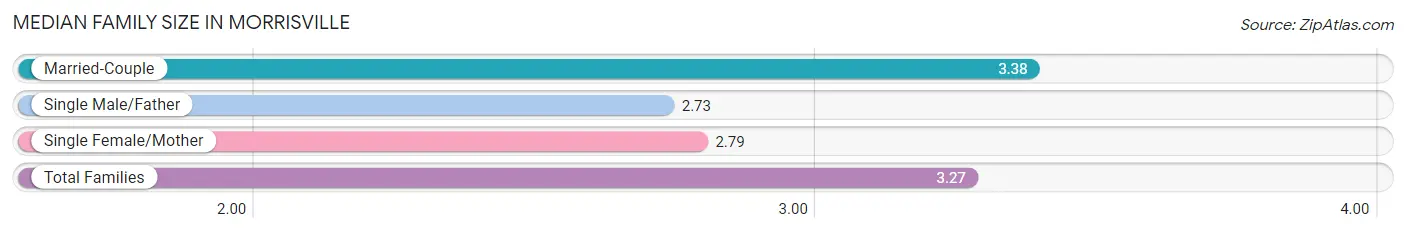
Median Family Size in Morrisville
The median family size in Morrisville is 3.27 persons per family, with married-couple families (6,168 | 82.6%) accounting for the largest median family size of 3.38 persons per family. On the other hand, single male/father families (361 | 4.8%) represent the smallest median family size with 2.73 persons per family.
| Family Type | # Families | Family Size |
| Married-Couple | 6,168 (82.6%) | 3.38 |
| Single Male/Father | 361 (4.8%) | 2.73 |
| Single Female/Mother | 943 (12.6%) | 2.79 |
| Total Families | 7,472 (100.0%) | 3.27 |
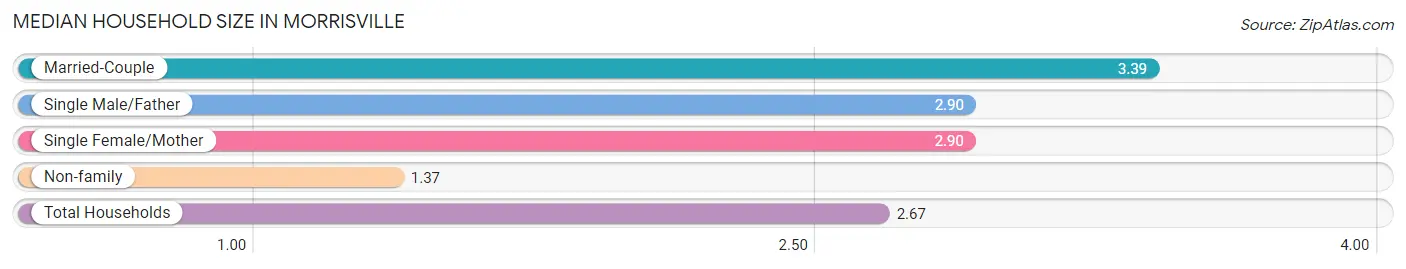
Median Household Size in Morrisville
The median household size in Morrisville is 2.67 persons per household, with married-couple households (6,168 | 55.3%) accounting for the largest median household size of 3.39 persons per household. non-family households (3,679 | 33.0%) represent the smallest median household size with 1.37 persons per household.
| Household Type | # Households | Household Size |
| Married-Couple | 6,168 (55.3%) | 3.39 |
| Single Male/Father | 361 (3.2%) | 2.90 |
| Single Female/Mother | 943 (8.5%) | 2.90 |
| Non-family | 3,679 (33.0%) | 1.37 |
| Total Households | 11,151 (100.0%) | 2.67 |
Household Size by Marriage Status in Morrisville
Out of a total of 11,151 households in Morrisville, 7,472 (67.0%) are family households, while 3,679 (33.0%) are nonfamily households. The most numerous type of family households are 2-person households, comprising 2,758, and the most common type of nonfamily households are 1-person households, comprising 2,756.
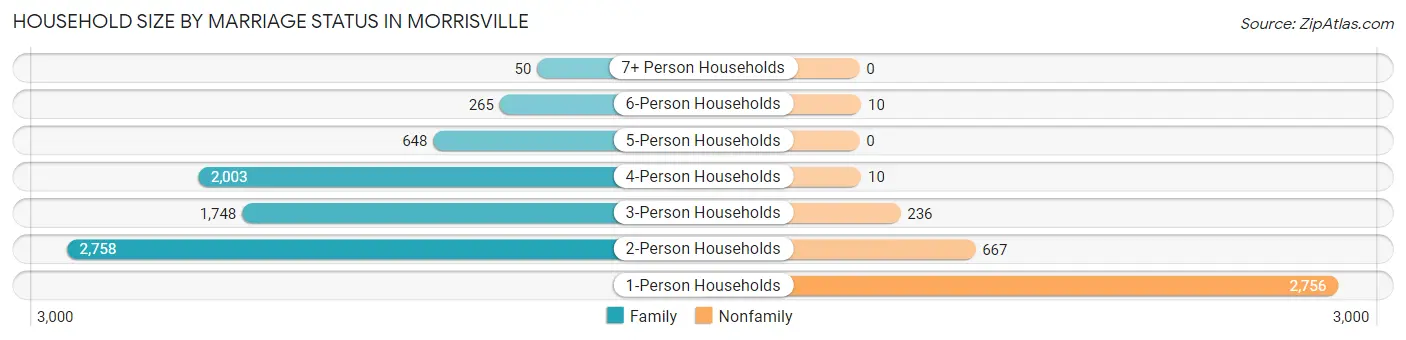
| Household Size | Family Households | Nonfamily Households |
| 1-Person Households | - | 2,756 (24.7%) |
| 2-Person Households | 2,758 (24.7%) | 667 (6.0%) |
| 3-Person Households | 1,748 (15.7%) | 236 (2.1%) |
| 4-Person Households | 2,003 (18.0%) | 10 (0.1%) |
| 5-Person Households | 648 (5.8%) | 0 (0.0%) |
| 6-Person Households | 265 (2.4%) | 10 (0.1%) |
| 7+ Person Households | 50 (0.4%) | 0 (0.0%) |
| Total | 7,472 (67.0%) | 3,679 (33.0%) |
Female Fertility in Morrisville
Fertility by Age in Morrisville
Average fertility rate in Morrisville is 33.0 births per 1,000 women. Women in the age bracket of 35 to 50 years have the highest fertility rate with 37.0 births per 1,000 women. Women in the age bracket of 35 to 50 years acount for 51.9% of all women with births.
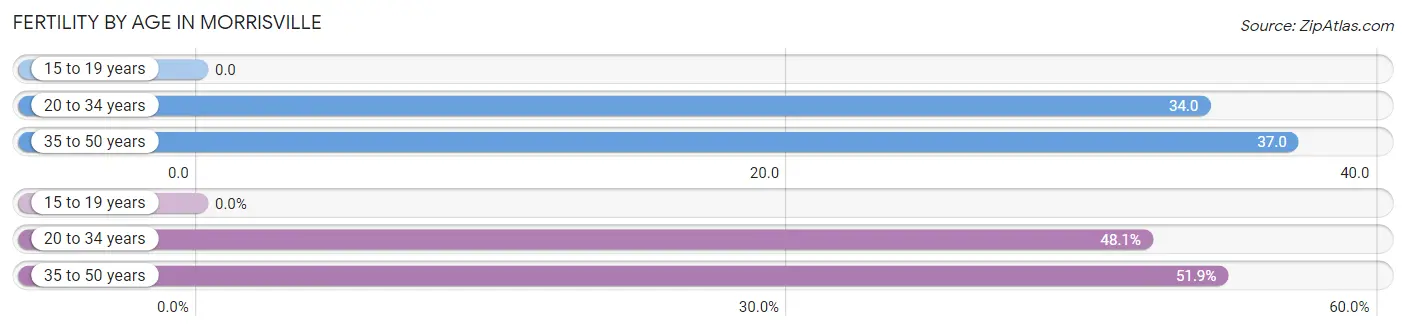
| Age Bracket | Women with Births | Births / 1,000 Women |
| 15 to 19 years | 0 (0.0%) | 0.0 |
| 20 to 34 years | 138 (48.1%) | 34.0 |
| 35 to 50 years | 149 (51.9%) | 37.0 |
| Total | 287 (100.0%) | 33.0 |
Fertility by Age by Marriage Status in Morrisville
93.4% of women with births (287) in Morrisville are married. The highest percentage of unmarried women with births falls into 20 to 34 years age bracket with 13.8% of them unmarried at the time of birth, while the lowest percentage of unmarried women with births belong to 35 to 50 years age bracket with 0.0% of them unmarried.
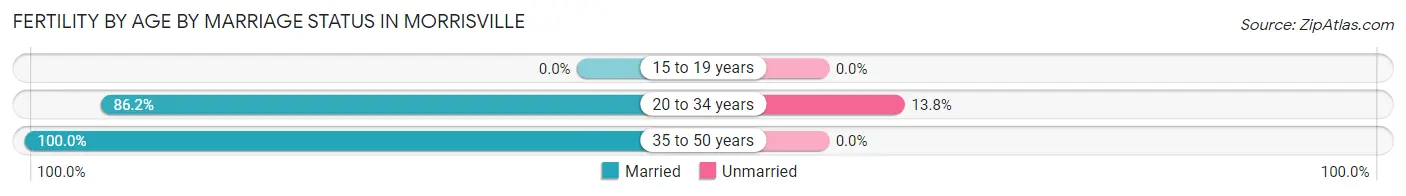
| Age Bracket | Married | Unmarried |
| 15 to 19 years | 0 (0.0%) | 0 (0.0%) |
| 20 to 34 years | 119 (86.2%) | 19 (13.8%) |
| 35 to 50 years | 149 (100.0%) | 0 (0.0%) |
| Total | 268 (93.4%) | 19 (6.6%) |
Fertility by Education in Morrisville
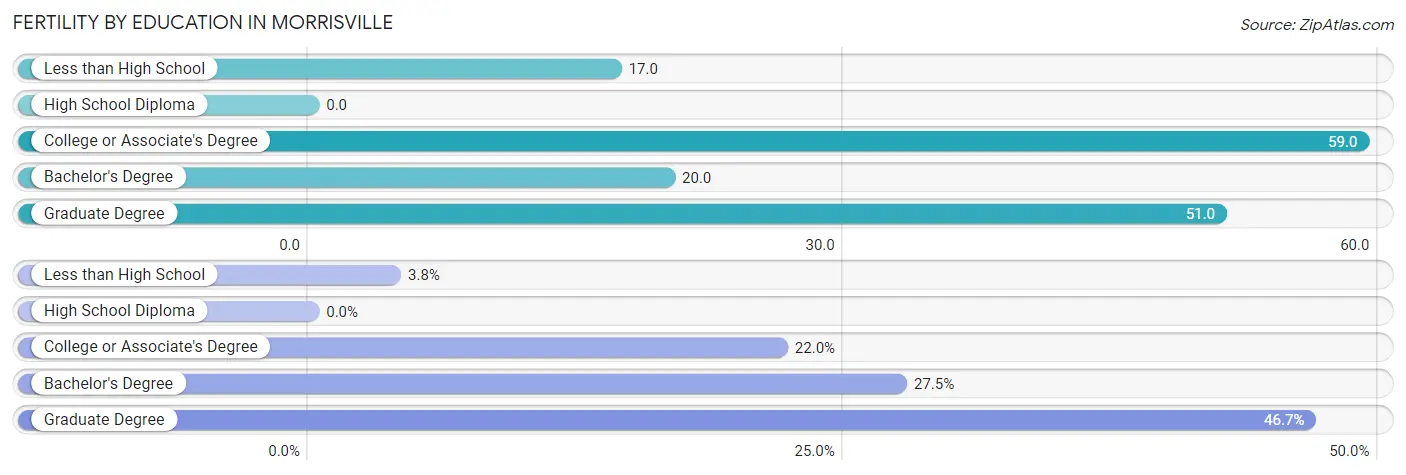
| Educational Attainment | Women with Births | Births / 1,000 Women |
| Less than High School | 11 (3.8%) | 17.0 |
| High School Diploma | 0 (0.0%) | 0.0 |
| College or Associate's Degree | 63 (22.0%) | 59.0 |
| Bachelor's Degree | 79 (27.5%) | 20.0 |
| Graduate Degree | 134 (46.7%) | 51.0 |
| Total | 287 (100.0%) | 33.0 |
Fertility by Education by Marriage Status in Morrisville
6.6% of women with births in Morrisville are unmarried. Women with the educational attainment of less than high school are most likely to be married with 100.0% of them married at childbirth, while women with the educational attainment of bachelor's degree are least likely to be married with 24.0% of them unmarried at childbirth.
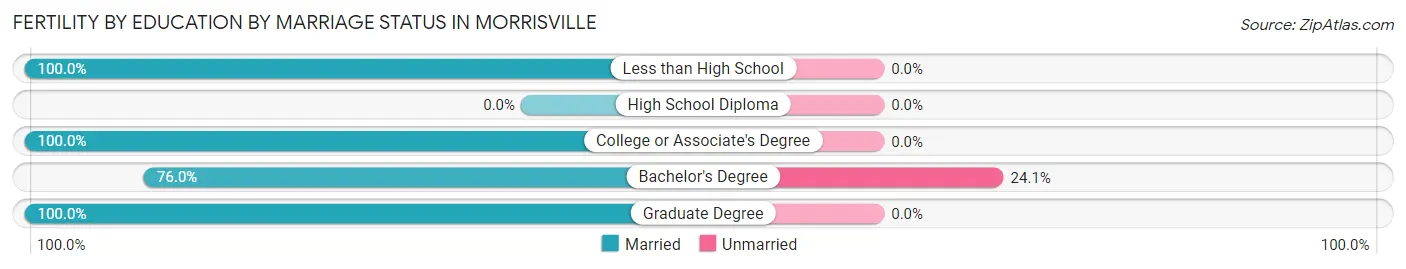
| Educational Attainment | Married | Unmarried |
| Less than High School | 11 (100.0%) | 0 (0.0%) |
| High School Diploma | 0 (0.0%) | 0 (0.0%) |
| College or Associate's Degree | 63 (100.0%) | 0 (0.0%) |
| Bachelor's Degree | 60 (75.9%) | 19 (24.0%) |
| Graduate Degree | 134 (100.0%) | 0 (0.0%) |
| Total | 268 (93.4%) | 19 (6.6%) |
Employment Characteristics in Morrisville
Employment by Class of Employer in Morrisville
Among the 16,379 employed individuals in Morrisville, private company employees (12,519 | 76.4%), not-for-profit organizations (1,216 | 7.4%), and state government employees (835 | 5.1%) make up the most common classes of employment.
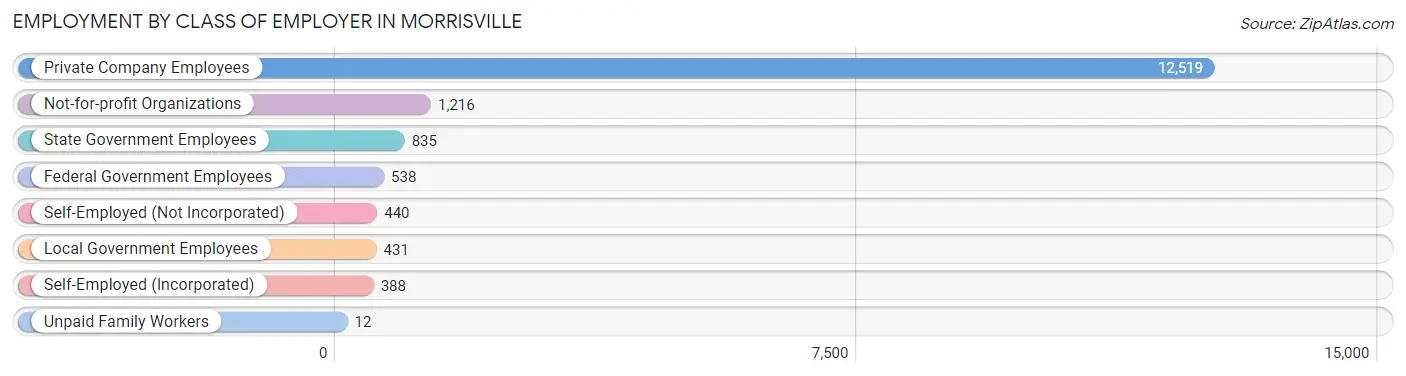
| Employer Class | # Employees | % Employees |
| Private Company Employees | 12,519 | 76.4% |
| Self-Employed (Incorporated) | 388 | 2.4% |
| Self-Employed (Not Incorporated) | 440 | 2.7% |
| Not-for-profit Organizations | 1,216 | 7.4% |
| Local Government Employees | 431 | 2.6% |
| State Government Employees | 835 | 5.1% |
| Federal Government Employees | 538 | 3.3% |
| Unpaid Family Workers | 12 | 0.1% |
| Total | 16,379 | 100.0% |
Employment Status by Age in Morrisville
According to the labor force statistics for Morrisville, out of the total population over 16 years of age (23,598), 74.6% or 17,604 individuals are in the labor force, with 3.6% or 634 of them unemployed. The age group with the highest labor force participation rate is 30 to 34 years, with 89.2% or 2,756 individuals in the labor force. Within the labor force, the 55 to 59 years age range has the highest percentage of unemployed individuals, with 10.6% or 116 of them being unemployed.
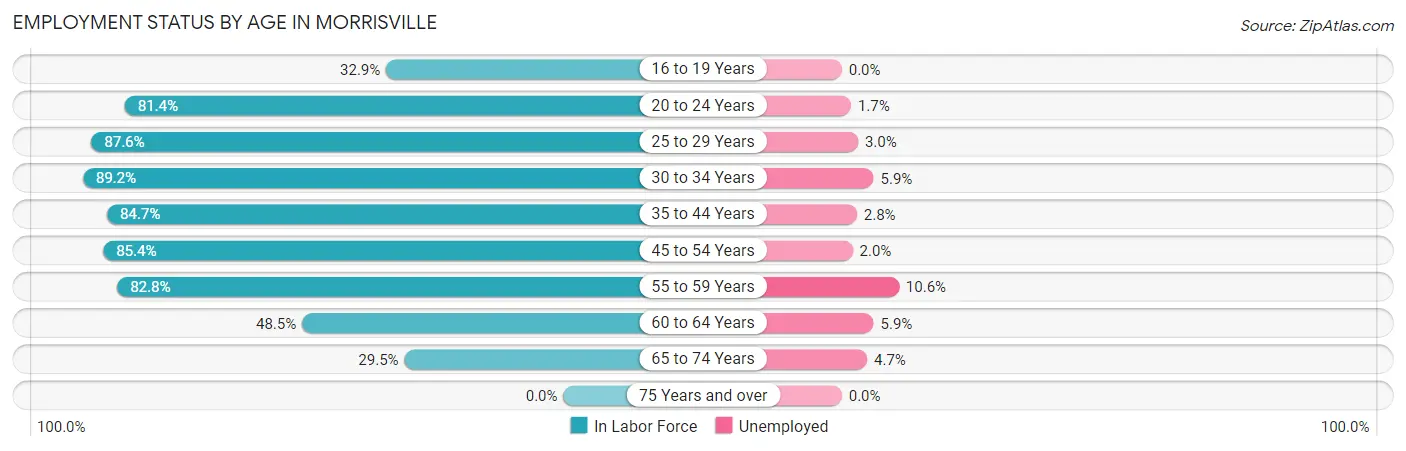
| Age Bracket | In Labor Force | Unemployed |
| 16 to 19 Years | 405 (32.9%) | 0 (0.0%) |
| 20 to 24 Years | 1,667 (81.4%) | 28 (1.7%) |
| 25 to 29 Years | 2,521 (87.6%) | 76 (3.0%) |
| 30 to 34 Years | 2,756 (89.2%) | 163 (5.9%) |
| 35 to 44 Years | 4,622 (84.7%) | 129 (2.8%) |
| 45 to 54 Years | 3,407 (85.4%) | 68 (2.0%) |
| 55 to 59 Years | 1,090 (82.8%) | 116 (10.6%) |
| 60 to 64 Years | 784 (48.5%) | 46 (5.9%) |
| 65 to 74 Years | 359 (29.5%) | 17 (4.7%) |
| 75 Years and over | 0 (0.0%) | 0 (0.0%) |
| Total | 17,604 (74.6%) | 634 (3.6%) |
Employment Status by Educational Attainment in Morrisville
According to labor force statistics for Morrisville, 82.7% of individuals (15,173) out of the total population between 25 and 64 years of age (18,347) are in the labor force, with 3.9% or 592 of them being unemployed. The group with the highest labor force participation rate are those with the educational attainment of bachelor's degree or higher, with 84.4% or 12,079 individuals in the labor force. Within the labor force, individuals with less than high school education have the highest percentage of unemployment, with 32.7% or 99 of them being unemployed.
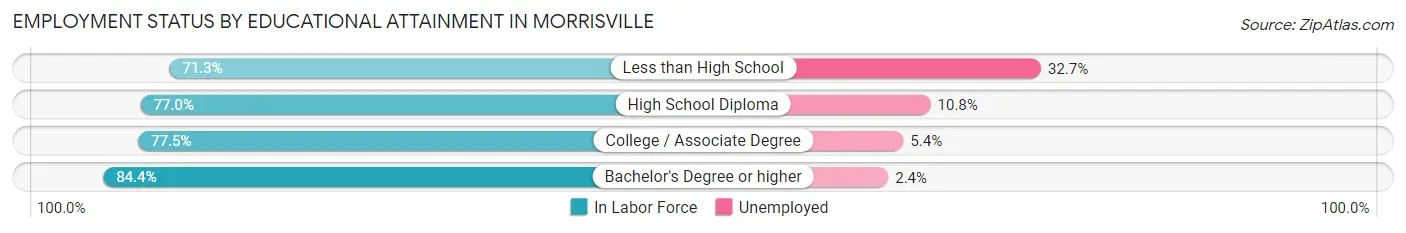
| Educational Attainment | In Labor Force | Unemployed |
| Less than High School | 303 (71.3%) | 139 (32.7%) |
| High School Diploma | 997 (77.0%) | 140 (10.8%) |
| College / Associate Degree | 1,794 (77.5%) | 125 (5.4%) |
| Bachelor's Degree or higher | 12,079 (84.4%) | 343 (2.4%) |
| Total | 15,173 (82.7%) | 716 (3.9%) |
Employment Occupations by Sex in Morrisville
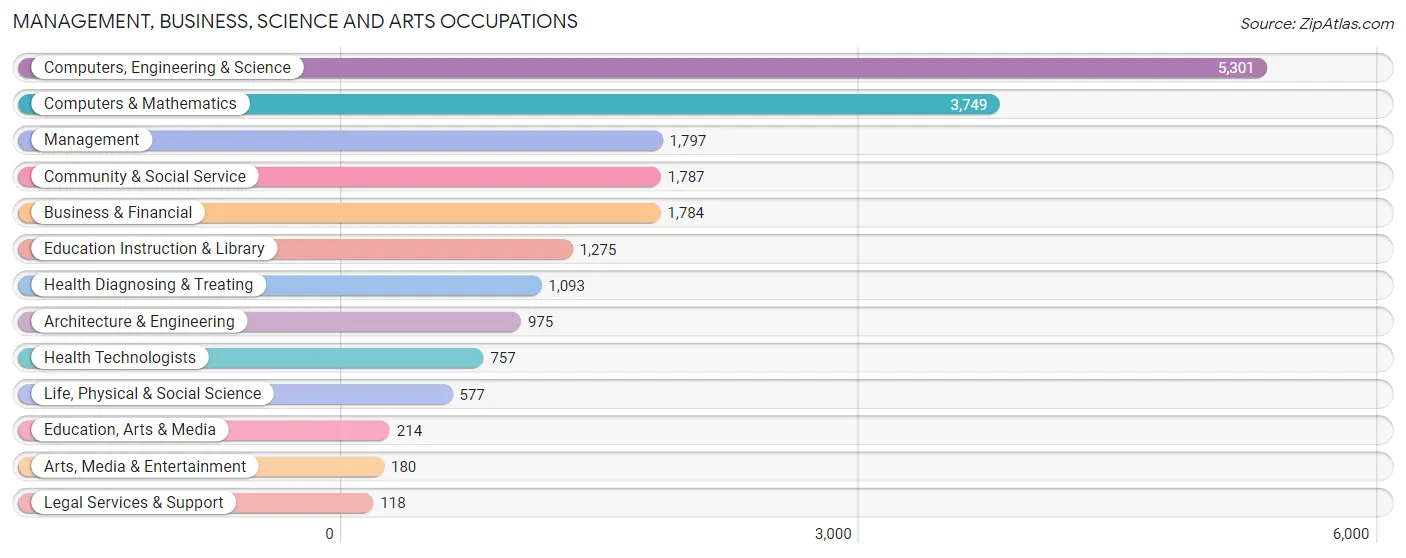
Management, Business, Science and Arts Occupations
The most common Management, Business, Science and Arts occupations in Morrisville are Computers, Engineering & Science (5,301 | 31.3%), Computers & Mathematics (3,749 | 22.2%), Management (1,797 | 10.6%), Community & Social Service (1,787 | 10.6%), and Business & Financial (1,784 | 10.5%).
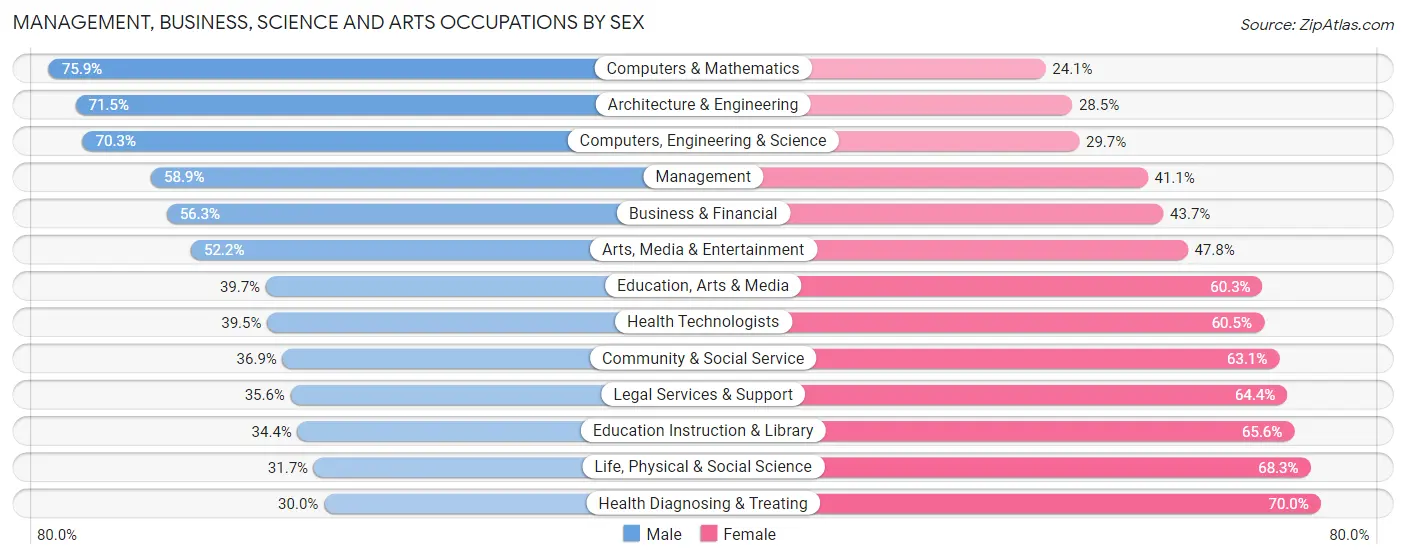
Management, Business, Science and Arts Occupations by Sex
Within the Management, Business, Science and Arts occupations in Morrisville, the most male-oriented occupations are Computers & Mathematics (75.9%), Architecture & Engineering (71.5%), and Computers, Engineering & Science (70.3%), while the most female-oriented occupations are Health Diagnosing & Treating (70.0%), Life, Physical & Social Science (68.3%), and Education Instruction & Library (65.6%).
| Occupation | Male | Female |
| Management | 1,058 (58.9%) | 739 (41.1%) |
| Business & Financial | 1,004 (56.3%) | 780 (43.7%) |
| Computers, Engineering & Science | 3,727 (70.3%) | 1,574 (29.7%) |
| Computers & Mathematics | 2,847 (75.9%) | 902 (24.1%) |
| Architecture & Engineering | 697 (71.5%) | 278 (28.5%) |
| Life, Physical & Social Science | 183 (31.7%) | 394 (68.3%) |
| Community & Social Service | 660 (36.9%) | 1,127 (63.1%) |
| Education, Arts & Media | 85 (39.7%) | 129 (60.3%) |
| Legal Services & Support | 42 (35.6%) | 76 (64.4%) |
| Education Instruction & Library | 439 (34.4%) | 836 (65.6%) |
| Arts, Media & Entertainment | 94 (52.2%) | 86 (47.8%) |
| Health Diagnosing & Treating | 328 (30.0%) | 765 (70.0%) |
| Health Technologists | 299 (39.5%) | 458 (60.5%) |
| Total (Category) | 6,777 (57.6%) | 4,985 (42.4%) |
| Total (Overall) | 9,629 (56.9%) | 7,293 (43.1%) |
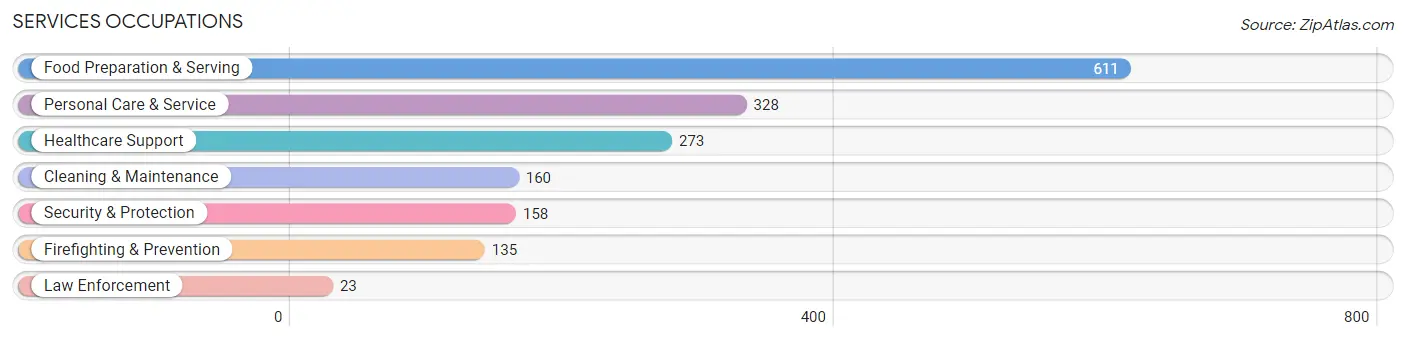
Services Occupations
The most common Services occupations in Morrisville are Food Preparation & Serving (611 | 3.6%), Personal Care & Service (328 | 1.9%), Healthcare Support (273 | 1.6%), Cleaning & Maintenance (160 | 0.9%), and Security & Protection (158 | 0.9%).
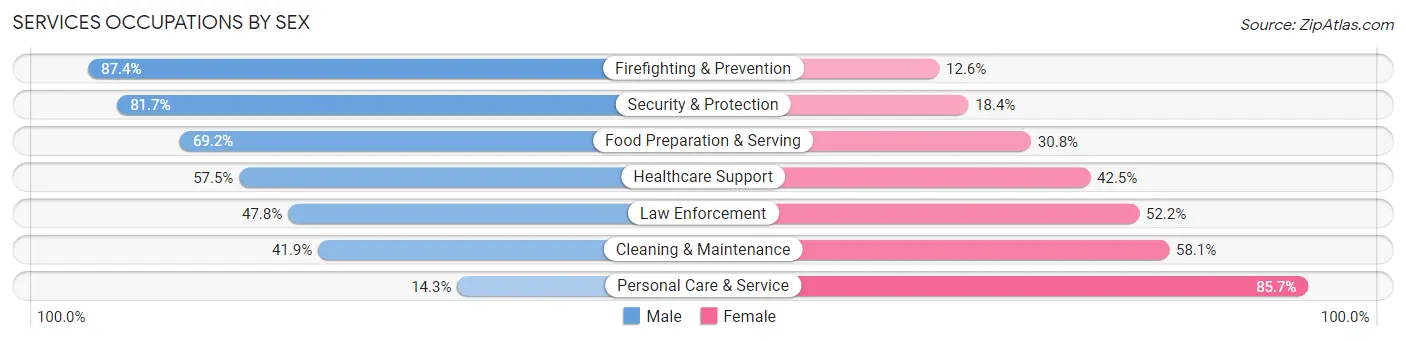
Services Occupations by Sex
Within the Services occupations in Morrisville, the most male-oriented occupations are Firefighting & Prevention (87.4%), Security & Protection (81.7%), and Food Preparation & Serving (69.2%), while the most female-oriented occupations are Personal Care & Service (85.7%), Cleaning & Maintenance (58.1%), and Law Enforcement (52.2%).
| Occupation | Male | Female |
| Healthcare Support | 157 (57.5%) | 116 (42.5%) |
| Security & Protection | 129 (81.7%) | 29 (18.3%) |
| Firefighting & Prevention | 118 (87.4%) | 17 (12.6%) |
| Law Enforcement | 11 (47.8%) | 12 (52.2%) |
| Food Preparation & Serving | 423 (69.2%) | 188 (30.8%) |
| Cleaning & Maintenance | 67 (41.9%) | 93 (58.1%) |
| Personal Care & Service | 47 (14.3%) | 281 (85.7%) |
| Total (Category) | 823 (53.8%) | 707 (46.2%) |
| Total (Overall) | 9,629 (56.9%) | 7,293 (43.1%) |
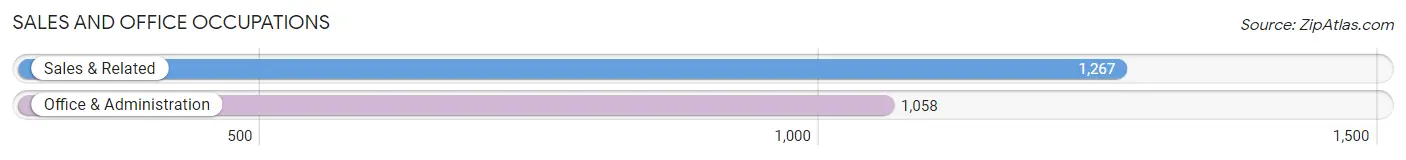
Sales and Office Occupations
The most common Sales and Office occupations in Morrisville are Sales & Related (1,267 | 7.5%), and Office & Administration (1,058 | 6.2%).
Sales and Office Occupations by Sex
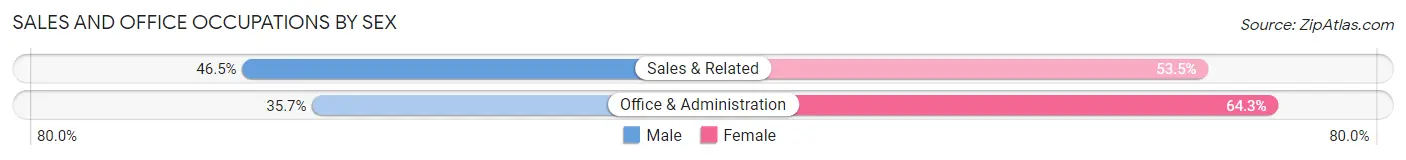
| Occupation | Male | Female |
| Sales & Related | 589 (46.5%) | 678 (53.5%) |
| Office & Administration | 378 (35.7%) | 680 (64.3%) |
| Total (Category) | 967 (41.6%) | 1,358 (58.4%) |
| Total (Overall) | 9,629 (56.9%) | 7,293 (43.1%) |
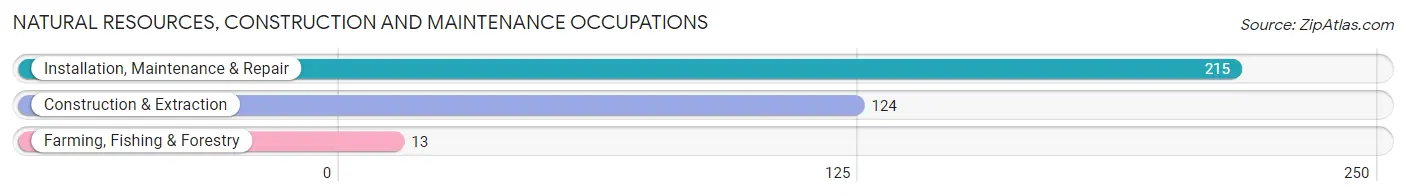
Natural Resources, Construction and Maintenance Occupations
The most common Natural Resources, Construction and Maintenance occupations in Morrisville are Installation, Maintenance & Repair (215 | 1.3%), Construction & Extraction (124 | 0.7%), and Farming, Fishing & Forestry (13 | 0.1%).
Natural Resources, Construction and Maintenance Occupations by Sex
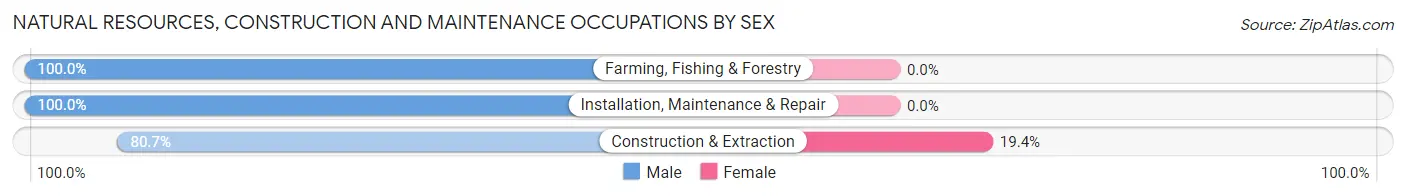
| Occupation | Male | Female |
| Farming, Fishing & Forestry | 13 (100.0%) | 0 (0.0%) |
| Construction & Extraction | 100 (80.6%) | 24 (19.4%) |
| Installation, Maintenance & Repair | 215 (100.0%) | 0 (0.0%) |
| Total (Category) | 328 (93.2%) | 24 (6.8%) |
| Total (Overall) | 9,629 (56.9%) | 7,293 (43.1%) |
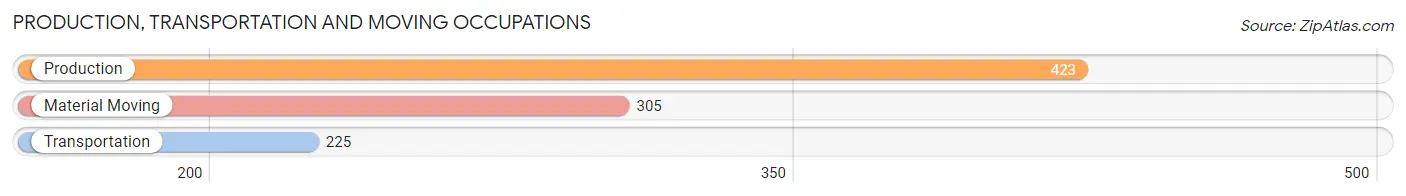
Production, Transportation and Moving Occupations
The most common Production, Transportation and Moving occupations in Morrisville are Production (423 | 2.5%), Material Moving (305 | 1.8%), and Transportation (225 | 1.3%).
Production, Transportation and Moving Occupations by Sex
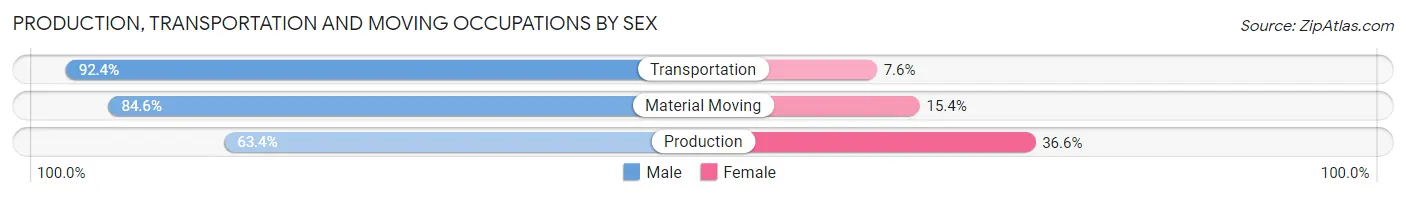
| Occupation | Male | Female |
| Production | 268 (63.4%) | 155 (36.6%) |
| Transportation | 208 (92.4%) | 17 (7.6%) |
| Material Moving | 258 (84.6%) | 47 (15.4%) |
| Total (Category) | 734 (77.0%) | 219 (23.0%) |
| Total (Overall) | 9,629 (56.9%) | 7,293 (43.1%) |
Employment Industries by Sex in Morrisville
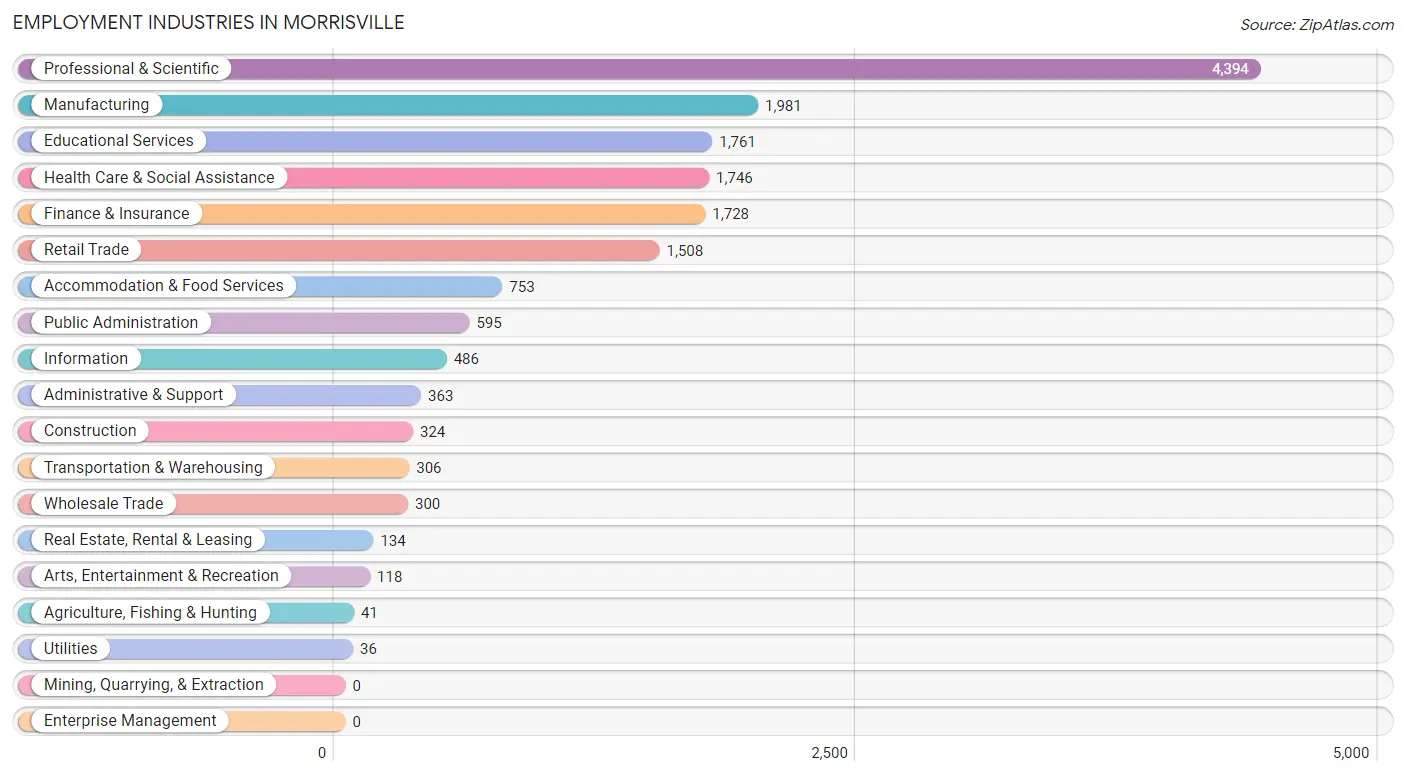
Employment Industries in Morrisville
The major employment industries in Morrisville include Professional & Scientific (4,394 | 26.0%), Manufacturing (1,981 | 11.7%), Educational Services (1,761 | 10.4%), Health Care & Social Assistance (1,746 | 10.3%), and Finance & Insurance (1,728 | 10.2%).
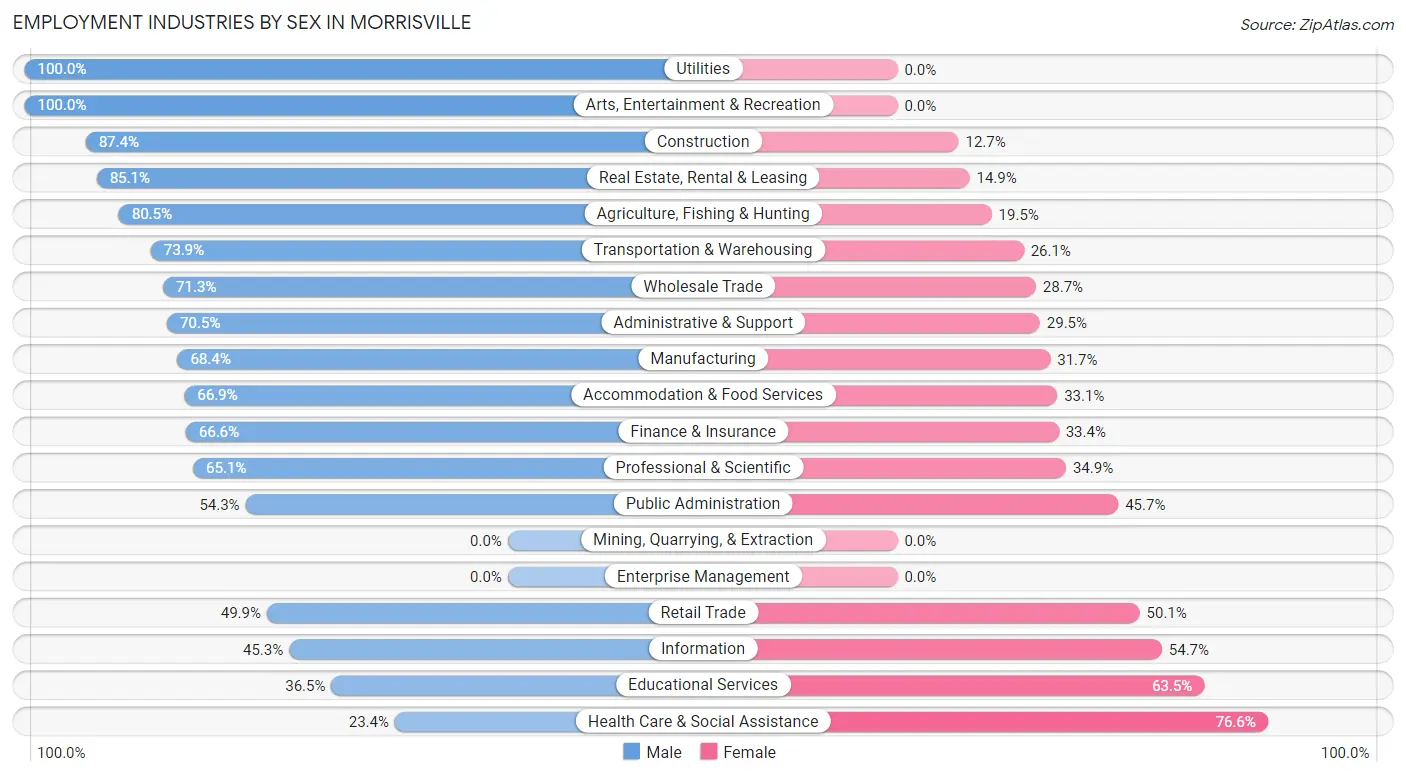
Employment Industries by Sex in Morrisville
The Morrisville industries that see more men than women are Utilities (100.0%), Arts, Entertainment & Recreation (100.0%), and Construction (87.4%), whereas the industries that tend to have a higher number of women are Health Care & Social Assistance (76.6%), Educational Services (63.5%), and Information (54.7%).
| Industry | Male | Female |
| Agriculture, Fishing & Hunting | 33 (80.5%) | 8 (19.5%) |
| Mining, Quarrying, & Extraction | 0 (0.0%) | 0 (0.0%) |
| Construction | 283 (87.4%) | 41 (12.7%) |
| Manufacturing | 1,354 (68.3%) | 627 (31.7%) |
| Wholesale Trade | 214 (71.3%) | 86 (28.7%) |
| Retail Trade | 752 (49.9%) | 756 (50.1%) |
| Transportation & Warehousing | 226 (73.9%) | 80 (26.1%) |
| Utilities | 36 (100.0%) | 0 (0.0%) |
| Information | 220 (45.3%) | 266 (54.7%) |
| Finance & Insurance | 1,151 (66.6%) | 577 (33.4%) |
| Real Estate, Rental & Leasing | 114 (85.1%) | 20 (14.9%) |
| Professional & Scientific | 2,861 (65.1%) | 1,533 (34.9%) |
| Enterprise Management | 0 (0.0%) | 0 (0.0%) |
| Administrative & Support | 256 (70.5%) | 107 (29.5%) |
| Educational Services | 643 (36.5%) | 1,118 (63.5%) |
| Health Care & Social Assistance | 408 (23.4%) | 1,338 (76.6%) |
| Arts, Entertainment & Recreation | 118 (100.0%) | 0 (0.0%) |
| Accommodation & Food Services | 504 (66.9%) | 249 (33.1%) |
| Public Administration | 323 (54.3%) | 272 (45.7%) |
| Total | 9,629 (56.9%) | 7,293 (43.1%) |
Education in Morrisville
School Enrollment in Morrisville
The most common levels of schooling among the 7,651 students in Morrisville are elementary school (1,713 | 22.4%), middle school (1,458 | 19.1%), and high school (1,432 | 18.7%).
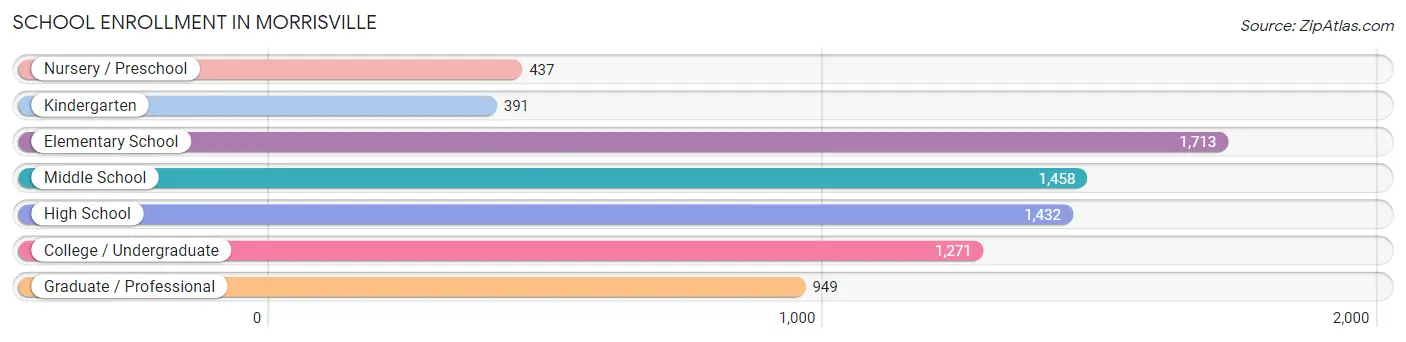
| School Level | # Students | % Students |
| Nursery / Preschool | 437 | 5.7% |
| Kindergarten | 391 | 5.1% |
| Elementary School | 1,713 | 22.4% |
| Middle School | 1,458 | 19.1% |
| High School | 1,432 | 18.7% |
| College / Undergraduate | 1,271 | 16.6% |
| Graduate / Professional | 949 | 12.4% |
| Total | 7,651 | 100.0% |
School Enrollment by Age by Funding Source in Morrisville
Out of a total of 7,651 students who are enrolled in schools in Morrisville, 1,048 (13.7%) attend a private institution, while the remaining 6,603 (86.3%) are enrolled in public schools. The age group of 3 to 4 year olds has the highest likelihood of being enrolled in private schools, with 224 (67.9% in the age bracket) enrolled. Conversely, the age group of 10 to 14 year olds has the lowest likelihood of being enrolled in a private school, with 1,728 (94.3% in the age bracket) attending a public institution.
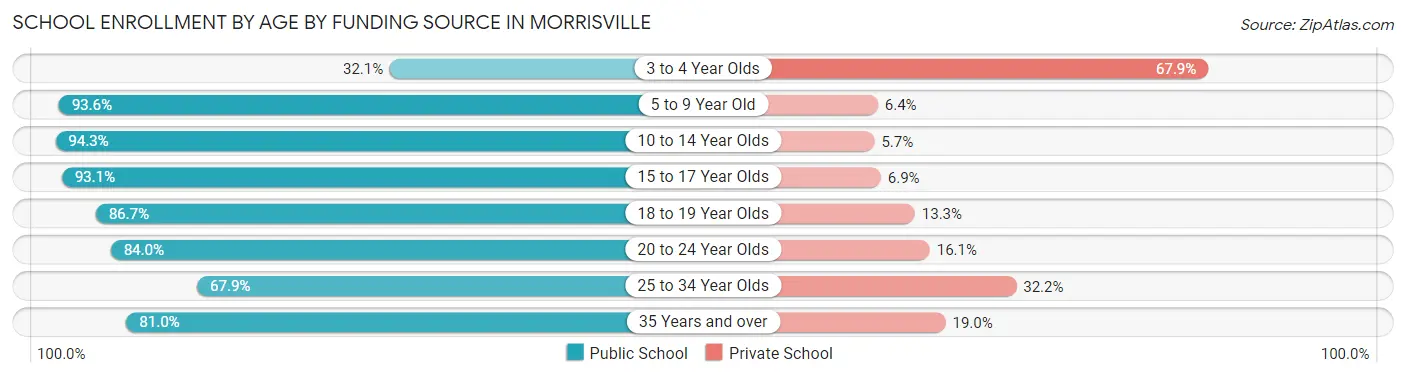
| Age Bracket | Public School | Private School |
| 3 to 4 Year Olds | 106 (32.1%) | 224 (67.9%) |
| 5 to 9 Year Old | 1,930 (93.6%) | 131 (6.4%) |
| 10 to 14 Year Olds | 1,728 (94.3%) | 105 (5.7%) |
| 15 to 17 Year Olds | 996 (93.1%) | 74 (6.9%) |
| 18 to 19 Year Olds | 412 (86.7%) | 63 (13.3%) |
| 20 to 24 Year Olds | 659 (84.0%) | 126 (16.1%) |
| 25 to 34 Year Olds | 612 (67.8%) | 290 (32.2%) |
| 35 Years and over | 158 (81.0%) | 37 (19.0%) |
| Total | 6,603 (86.3%) | 1,048 (13.7%) |
Educational Attainment by Field of Study in Morrisville
Engineering (2,735 | 17.0%), business (2,726 | 16.9%), computers & mathematics (2,331 | 14.4%), science & technology (1,789 | 11.1%), and bio, nature & agricultural (1,285 | 8.0%) are the most common fields of study among 16,139 individuals in Morrisville who have obtained a bachelor's degree or higher.
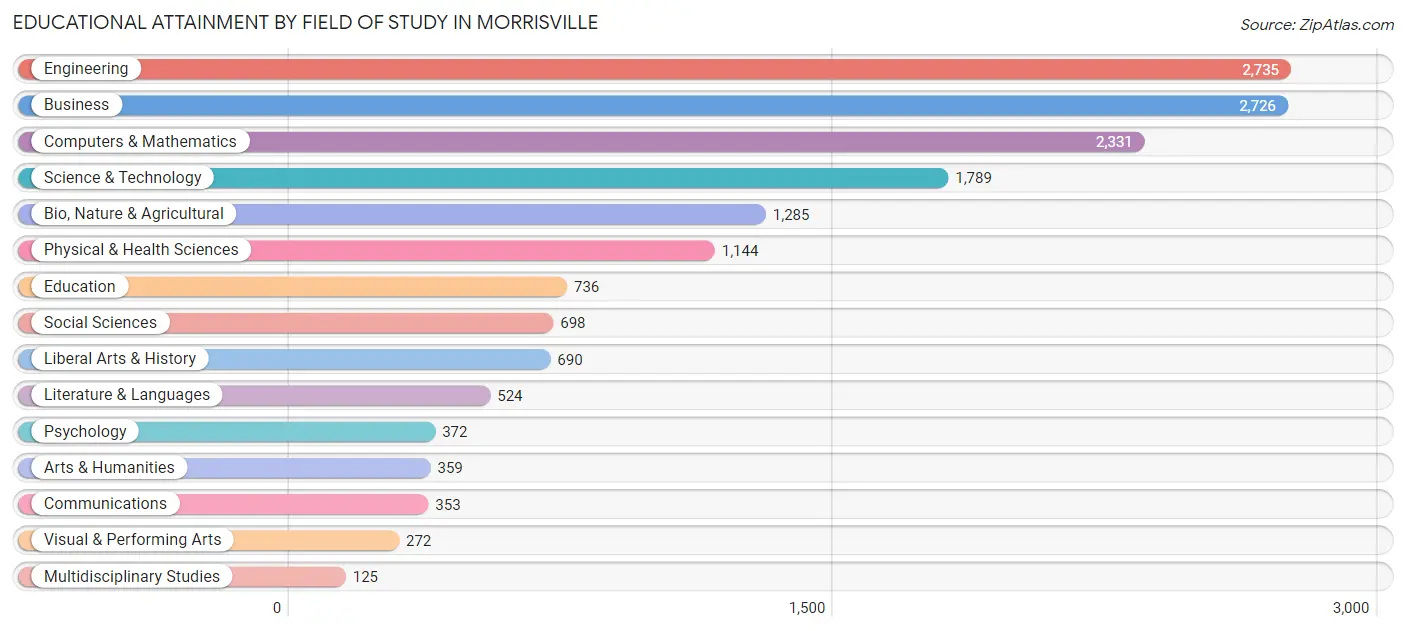
| Field of Study | # Graduates | % Graduates |
| Computers & Mathematics | 2,331 | 14.4% |
| Bio, Nature & Agricultural | 1,285 | 8.0% |
| Physical & Health Sciences | 1,144 | 7.1% |
| Psychology | 372 | 2.3% |
| Social Sciences | 698 | 4.3% |
| Engineering | 2,735 | 17.0% |
| Multidisciplinary Studies | 125 | 0.8% |
| Science & Technology | 1,789 | 11.1% |
| Business | 2,726 | 16.9% |
| Education | 736 | 4.6% |
| Literature & Languages | 524 | 3.3% |
| Liberal Arts & History | 690 | 4.3% |
| Visual & Performing Arts | 272 | 1.7% |
| Communications | 353 | 2.2% |
| Arts & Humanities | 359 | 2.2% |
| Total | 16,139 | 100.0% |
Transportation & Commute in Morrisville
Vehicle Availability by Sex in Morrisville
The most prevalent vehicle ownership categories in Morrisville are males with 2 vehicles (4,333, accounting for 46.3%) and females with 2 vehicles (3,071, making up 61.7%).
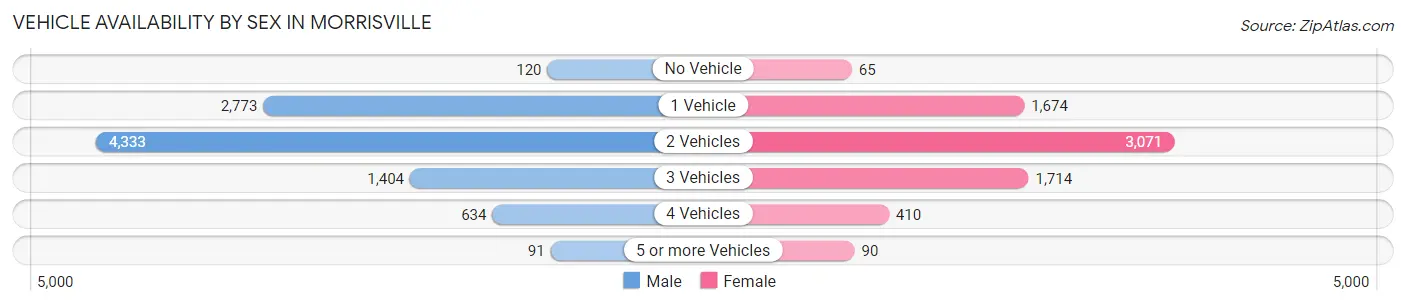
| Vehicles Available | Male | Female |
| No Vehicle | 120 (1.3%) | 65 (0.9%) |
| 1 Vehicle | 2,773 (29.6%) | 1,674 (23.8%) |
| 2 Vehicles | 4,333 (46.3%) | 3,071 (43.7%) |
| 3 Vehicles | 1,404 (15.0%) | 1,714 (24.4%) |
| 4 Vehicles | 634 (6.8%) | 410 (5.8%) |
| 5 or more Vehicles | 91 (1.0%) | 90 (1.3%) |
| Total | 9,355 (100.0%) | 7,024 (100.0%) |
Commute Time in Morrisville
The most frequently occuring commute durations in Morrisville are 15 to 19 minutes (2,782 commuters, 23.5%), 10 to 14 minutes (2,068 commuters, 17.5%), and 20 to 24 minutes (1,945 commuters, 16.4%).
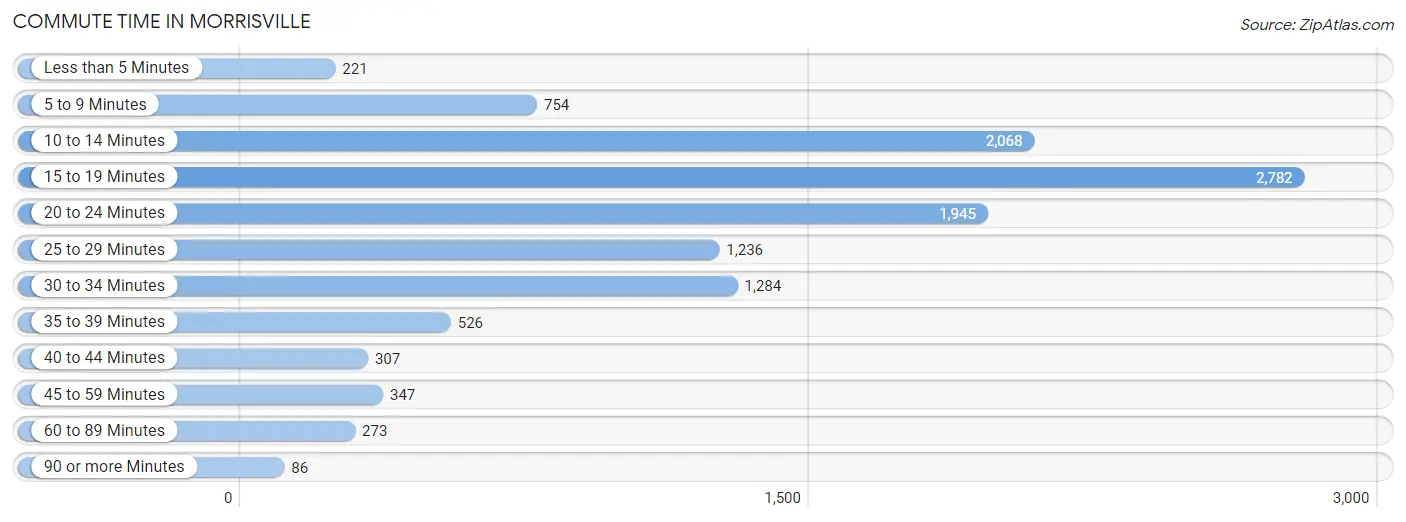
| Commute Time | # Commuters | % Commuters |
| Less than 5 Minutes | 221 | 1.9% |
| 5 to 9 Minutes | 754 | 6.4% |
| 10 to 14 Minutes | 2,068 | 17.5% |
| 15 to 19 Minutes | 2,782 | 23.5% |
| 20 to 24 Minutes | 1,945 | 16.4% |
| 25 to 29 Minutes | 1,236 | 10.4% |
| 30 to 34 Minutes | 1,284 | 10.8% |
| 35 to 39 Minutes | 526 | 4.4% |
| 40 to 44 Minutes | 307 | 2.6% |
| 45 to 59 Minutes | 347 | 2.9% |
| 60 to 89 Minutes | 273 | 2.3% |
| 90 or more Minutes | 86 | 0.7% |
Commute Time by Sex in Morrisville
The most common commute times in Morrisville are 15 to 19 minutes (1,687 commuters, 24.4%) for males and 15 to 19 minutes (1,095 commuters, 22.3%) for females.
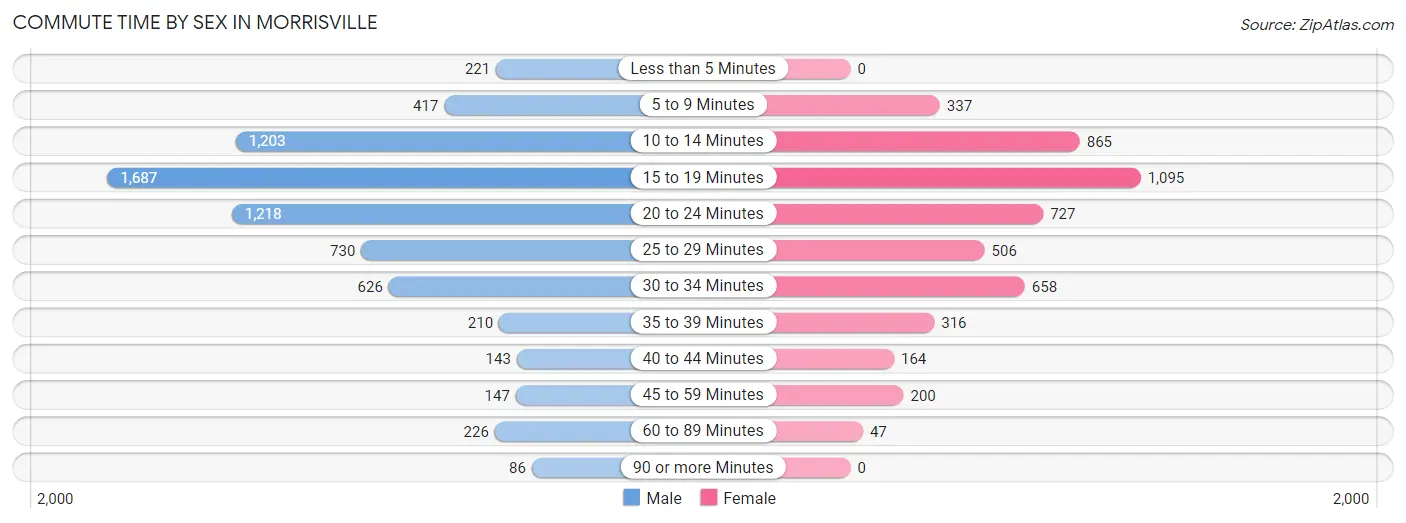
| Commute Time | Male | Female |
| Less than 5 Minutes | 221 (3.2%) | 0 (0.0%) |
| 5 to 9 Minutes | 417 (6.0%) | 337 (6.9%) |
| 10 to 14 Minutes | 1,203 (17.4%) | 865 (17.6%) |
| 15 to 19 Minutes | 1,687 (24.4%) | 1,095 (22.3%) |
| 20 to 24 Minutes | 1,218 (17.6%) | 727 (14.8%) |
| 25 to 29 Minutes | 730 (10.6%) | 506 (10.3%) |
| 30 to 34 Minutes | 626 (9.0%) | 658 (13.4%) |
| 35 to 39 Minutes | 210 (3.0%) | 316 (6.4%) |
| 40 to 44 Minutes | 143 (2.1%) | 164 (3.3%) |
| 45 to 59 Minutes | 147 (2.1%) | 200 (4.1%) |
| 60 to 89 Minutes | 226 (3.3%) | 47 (1.0%) |
| 90 or more Minutes | 86 (1.2%) | 0 (0.0%) |
Time of Departure to Work by Sex in Morrisville
The most frequent times of departure to work in Morrisville are 8:00 AM to 8:29 AM (1,190, 17.2%) for males and 7:30 AM to 7:59 AM (803, 16.3%) for females.
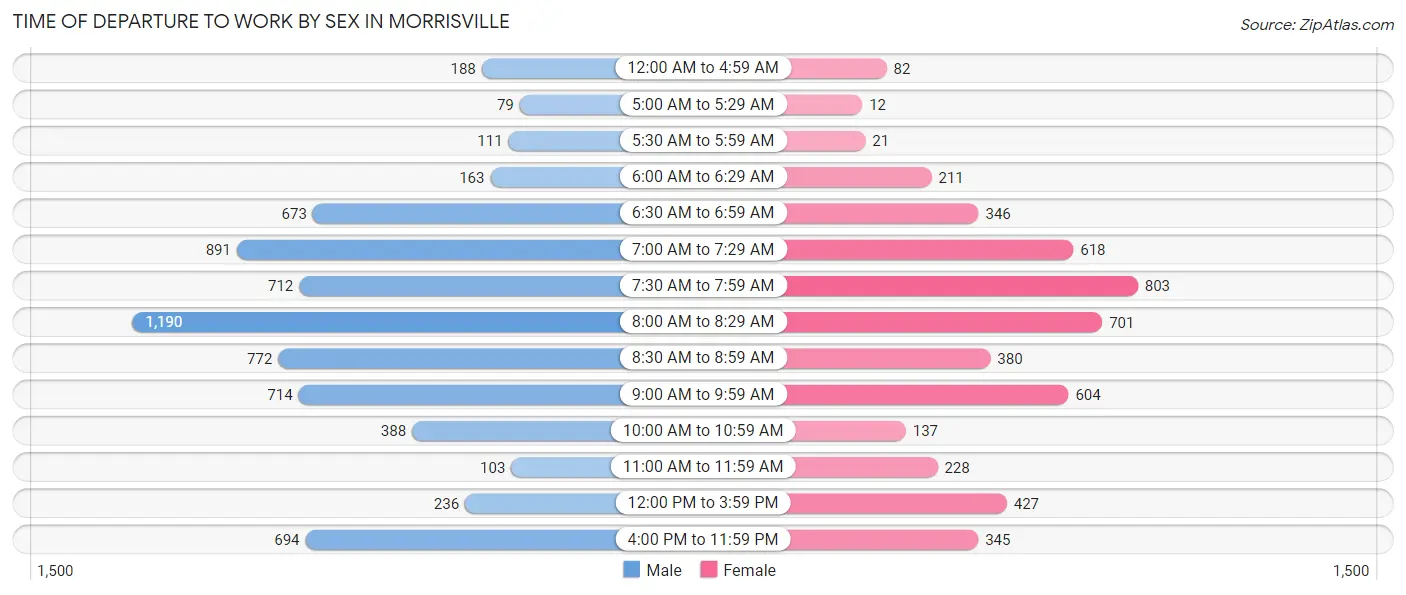
| Time of Departure | Male | Female |
| 12:00 AM to 4:59 AM | 188 (2.7%) | 82 (1.7%) |
| 5:00 AM to 5:29 AM | 79 (1.1%) | 12 (0.2%) |
| 5:30 AM to 5:59 AM | 111 (1.6%) | 21 (0.4%) |
| 6:00 AM to 6:29 AM | 163 (2.4%) | 211 (4.3%) |
| 6:30 AM to 6:59 AM | 673 (9.7%) | 346 (7.0%) |
| 7:00 AM to 7:29 AM | 891 (12.9%) | 618 (12.6%) |
| 7:30 AM to 7:59 AM | 712 (10.3%) | 803 (16.3%) |
| 8:00 AM to 8:29 AM | 1,190 (17.2%) | 701 (14.3%) |
| 8:30 AM to 8:59 AM | 772 (11.2%) | 380 (7.7%) |
| 9:00 AM to 9:59 AM | 714 (10.3%) | 604 (12.3%) |
| 10:00 AM to 10:59 AM | 388 (5.6%) | 137 (2.8%) |
| 11:00 AM to 11:59 AM | 103 (1.5%) | 228 (4.6%) |
| 12:00 PM to 3:59 PM | 236 (3.4%) | 427 (8.7%) |
| 4:00 PM to 11:59 PM | 694 (10.0%) | 345 (7.0%) |
| Total | 6,914 (100.0%) | 4,915 (100.0%) |
Housing Occupancy in Morrisville
Occupancy by Ownership in Morrisville
Of the total 11,151 dwellings in Morrisville, owner-occupied units account for 5,625 (50.4%), while renter-occupied units make up 5,526 (49.6%).
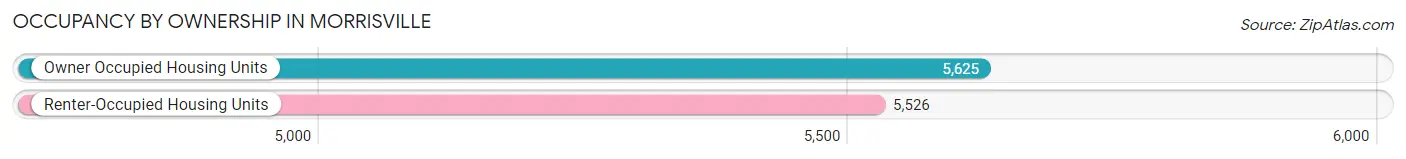
| Occupancy | # Housing Units | % Housing Units |
| Owner Occupied Housing Units | 5,625 | 50.4% |
| Renter-Occupied Housing Units | 5,526 | 49.6% |
| Total Occupied Housing Units | 11,151 | 100.0% |
Occupancy by Household Size in Morrisville
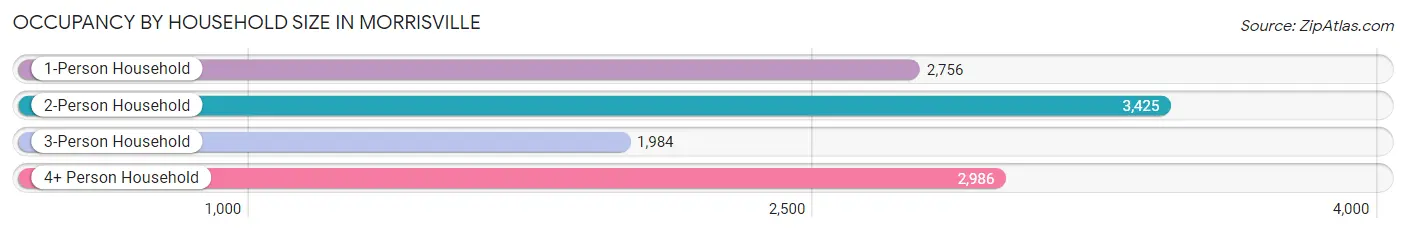
| Household Size | # Housing Units | % Housing Units |
| 1-Person Household | 2,756 | 24.7% |
| 2-Person Household | 3,425 | 30.7% |
| 3-Person Household | 1,984 | 17.8% |
| 4+ Person Household | 2,986 | 26.8% |
| Total Housing Units | 11,151 | 100.0% |
Occupancy by Ownership by Household Size in Morrisville
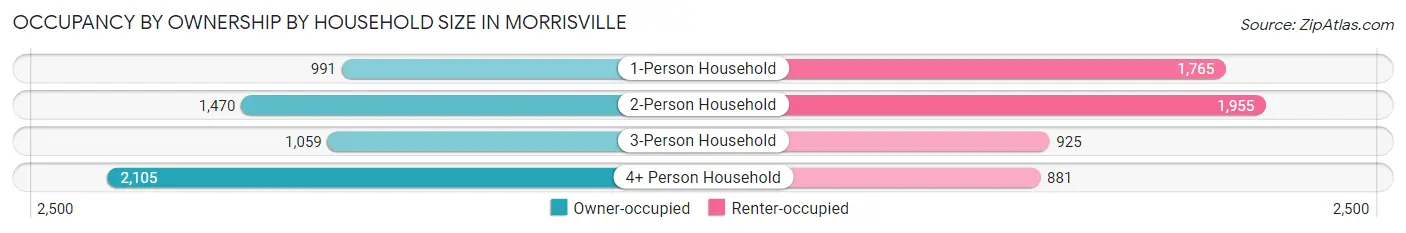
| Household Size | Owner-occupied | Renter-occupied |
| 1-Person Household | 991 (36.0%) | 1,765 (64.0%) |
| 2-Person Household | 1,470 (42.9%) | 1,955 (57.1%) |
| 3-Person Household | 1,059 (53.4%) | 925 (46.6%) |
| 4+ Person Household | 2,105 (70.5%) | 881 (29.5%) |
| Total Housing Units | 5,625 (50.4%) | 5,526 (49.6%) |
Occupancy by Educational Attainment in Morrisville
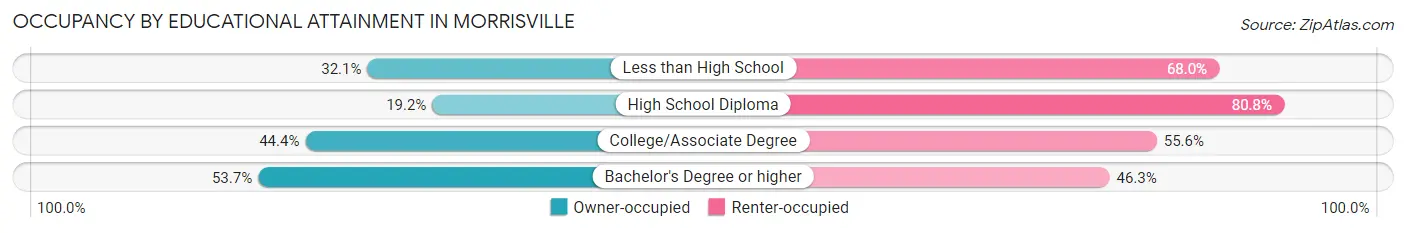
| Household Size | Owner-occupied | Renter-occupied |
| Less than High School | 25 (32.1%) | 53 (67.9%) |
| High School Diploma | 104 (19.2%) | 438 (80.8%) |
| College/Associate Degree | 767 (44.4%) | 962 (55.6%) |
| Bachelor's Degree or higher | 4,729 (53.7%) | 4,073 (46.3%) |
Occupancy by Age of Householder in Morrisville
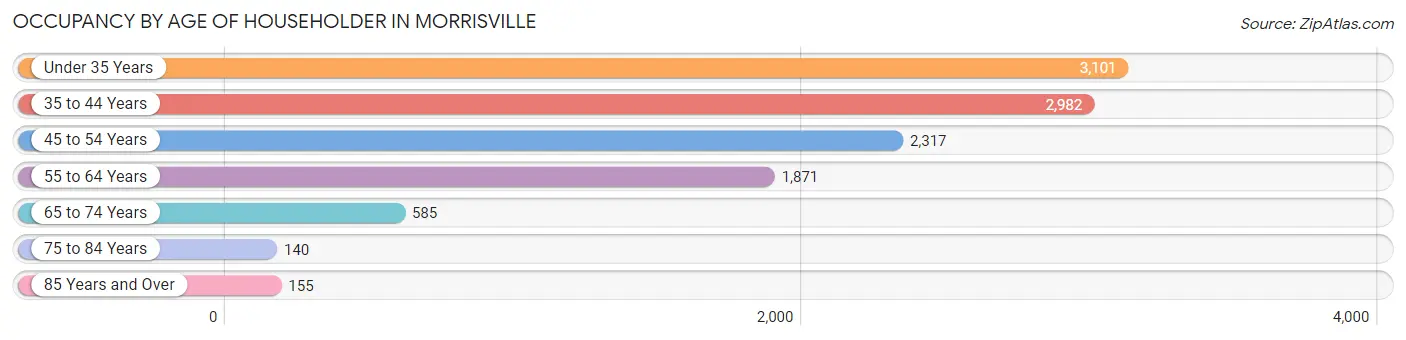
| Age Bracket | # Households | % Households |
| Under 35 Years | 3,101 | 27.8% |
| 35 to 44 Years | 2,982 | 26.7% |
| 45 to 54 Years | 2,317 | 20.8% |
| 55 to 64 Years | 1,871 | 16.8% |
| 65 to 74 Years | 585 | 5.2% |
| 75 to 84 Years | 140 | 1.3% |
| 85 Years and Over | 155 | 1.4% |
| Total | 11,151 | 100.0% |
Housing Finances in Morrisville
Median Income by Occupancy in Morrisville
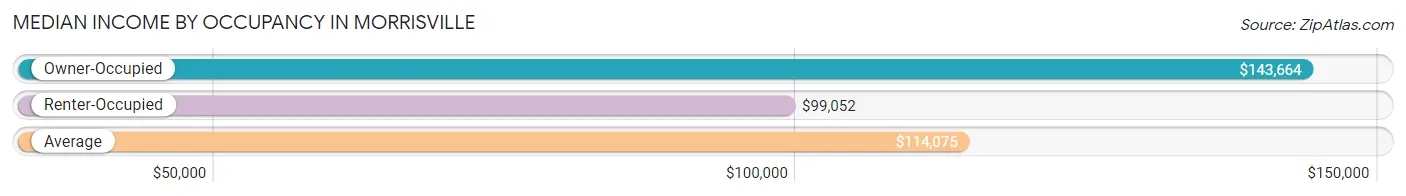
| Occupancy Type | # Households | Median Income |
| Owner-Occupied | 5,625 (50.4%) | $143,664 |
| Renter-Occupied | 5,526 (49.6%) | $99,052 |
| Average | 11,151 (100.0%) | $114,075 |
Occupancy by Householder Income Bracket in Morrisville
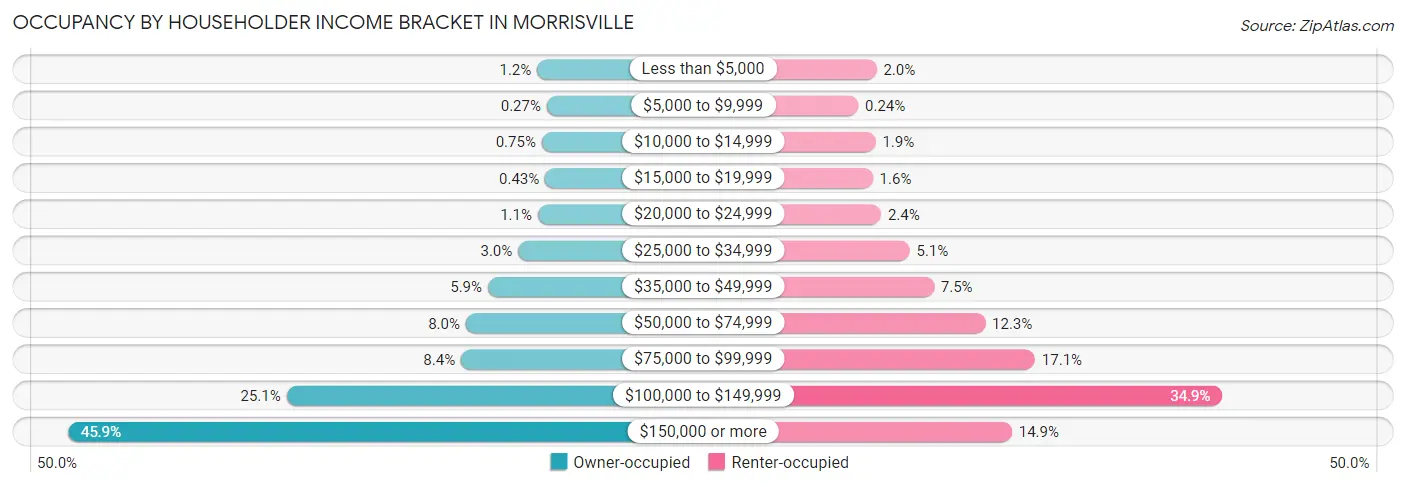
| Income Bracket | Owner-occupied | Renter-occupied |
| Less than $5,000 | 67 (1.2%) | 110 (2.0%) |
| $5,000 to $9,999 | 15 (0.3%) | 13 (0.2%) |
| $10,000 to $14,999 | 42 (0.7%) | 105 (1.9%) |
| $15,000 to $19,999 | 24 (0.4%) | 90 (1.6%) |
| $20,000 to $24,999 | 63 (1.1%) | 134 (2.4%) |
| $25,000 to $34,999 | 169 (3.0%) | 284 (5.1%) |
| $35,000 to $49,999 | 331 (5.9%) | 412 (7.5%) |
| $50,000 to $74,999 | 449 (8.0%) | 682 (12.3%) |
| $75,000 to $99,999 | 475 (8.4%) | 944 (17.1%) |
| $100,000 to $149,999 | 1,409 (25.1%) | 1,930 (34.9%) |
| $150,000 or more | 2,581 (45.9%) | 822 (14.9%) |
| Total | 5,625 (100.0%) | 5,526 (100.0%) |
Monthly Housing Cost Tiers in Morrisville
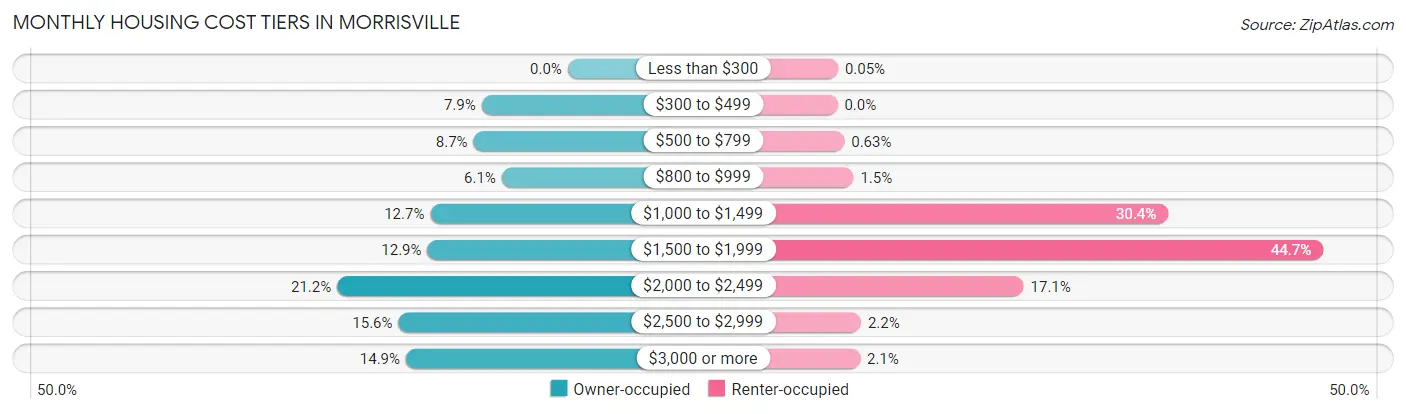
| Monthly Cost | Owner-occupied | Renter-occupied |
| Less than $300 | 0 (0.0%) | 3 (0.1%) |
| $300 to $499 | 446 (7.9%) | 0 (0.0%) |
| $500 to $799 | 488 (8.7%) | 35 (0.6%) |
| $800 to $999 | 342 (6.1%) | 82 (1.5%) |
| $1,000 to $1,499 | 712 (12.7%) | 1,682 (30.4%) |
| $1,500 to $1,999 | 727 (12.9%) | 2,470 (44.7%) |
| $2,000 to $2,499 | 1,195 (21.2%) | 947 (17.1%) |
| $2,500 to $2,999 | 877 (15.6%) | 120 (2.2%) |
| $3,000 or more | 838 (14.9%) | 115 (2.1%) |
| Total | 5,625 (100.0%) | 5,526 (100.0%) |
Physical Housing Characteristics in Morrisville
Housing Structures in Morrisville
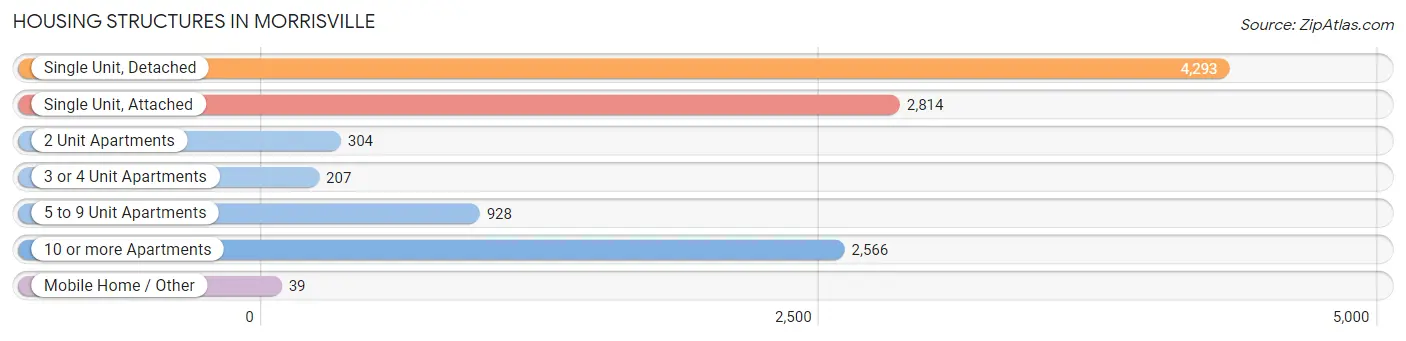
| Structure Type | # Housing Units | % Housing Units |
| Single Unit, Detached | 4,293 | 38.5% |
| Single Unit, Attached | 2,814 | 25.2% |
| 2 Unit Apartments | 304 | 2.7% |
| 3 or 4 Unit Apartments | 207 | 1.9% |
| 5 to 9 Unit Apartments | 928 | 8.3% |
| 10 or more Apartments | 2,566 | 23.0% |
| Mobile Home / Other | 39 | 0.4% |
| Total | 11,151 | 100.0% |
Housing Structures by Occupancy in Morrisville
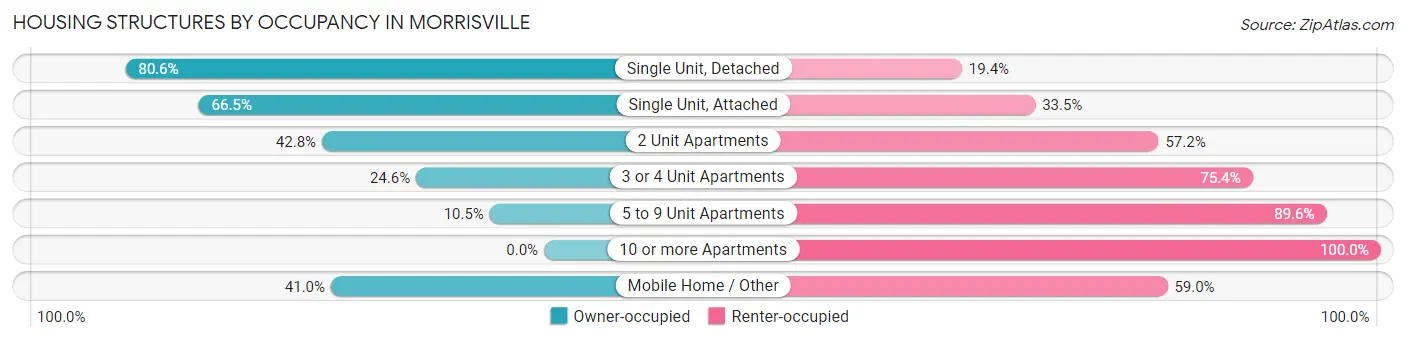
| Structure Type | Owner-occupied | Renter-occupied |
| Single Unit, Detached | 3,460 (80.6%) | 833 (19.4%) |
| Single Unit, Attached | 1,871 (66.5%) | 943 (33.5%) |
| 2 Unit Apartments | 130 (42.8%) | 174 (57.2%) |
| 3 or 4 Unit Apartments | 51 (24.6%) | 156 (75.4%) |
| 5 to 9 Unit Apartments | 97 (10.4%) | 831 (89.5%) |
| 10 or more Apartments | 0 (0.0%) | 2,566 (100.0%) |
| Mobile Home / Other | 16 (41.0%) | 23 (59.0%) |
| Total | 5,625 (50.4%) | 5,526 (49.6%) |
Housing Structures by Number of Rooms in Morrisville
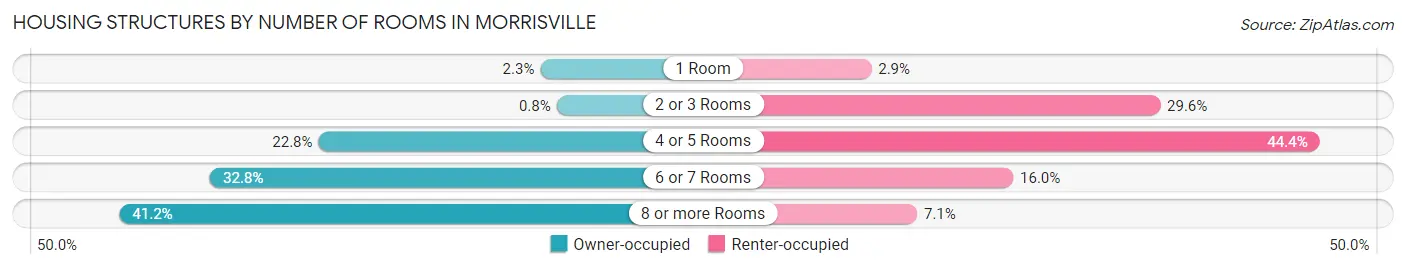
| Number of Rooms | Owner-occupied | Renter-occupied |
| 1 Room | 130 (2.3%) | 160 (2.9%) |
| 2 or 3 Rooms | 45 (0.8%) | 1,636 (29.6%) |
| 4 or 5 Rooms | 1,284 (22.8%) | 2,451 (44.4%) |
| 6 or 7 Rooms | 1,847 (32.8%) | 885 (16.0%) |
| 8 or more Rooms | 2,319 (41.2%) | 394 (7.1%) |
| Total | 5,625 (100.0%) | 5,526 (100.0%) |
Housing Structure by Heating Type in Morrisville
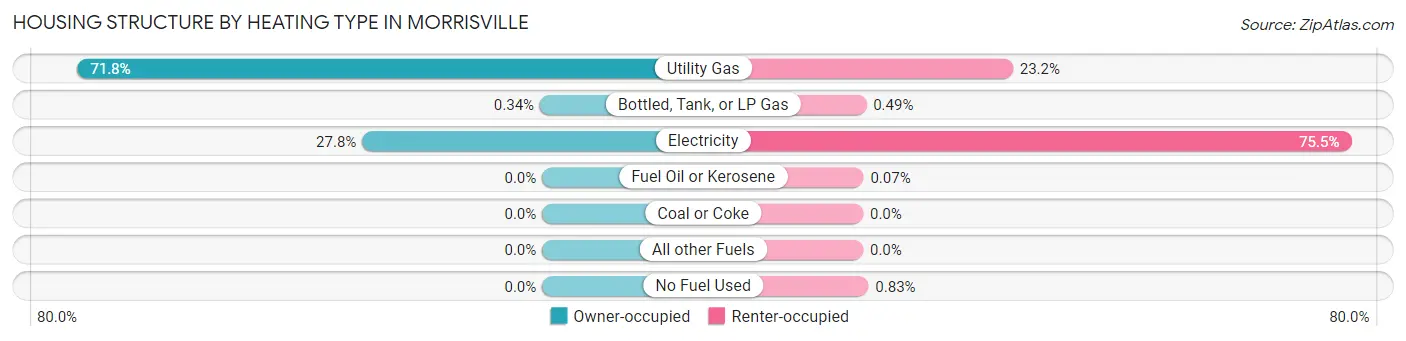
| Heating Type | Owner-occupied | Renter-occupied |
| Utility Gas | 4,041 (71.8%) | 1,279 (23.2%) |
| Bottled, Tank, or LP Gas | 19 (0.3%) | 27 (0.5%) |
| Electricity | 1,565 (27.8%) | 4,170 (75.5%) |
| Fuel Oil or Kerosene | 0 (0.0%) | 4 (0.1%) |
| Coal or Coke | 0 (0.0%) | 0 (0.0%) |
| All other Fuels | 0 (0.0%) | 0 (0.0%) |
| No Fuel Used | 0 (0.0%) | 46 (0.8%) |
| Total | 5,625 (100.0%) | 5,526 (100.0%) |
Household Vehicle Usage in Morrisville
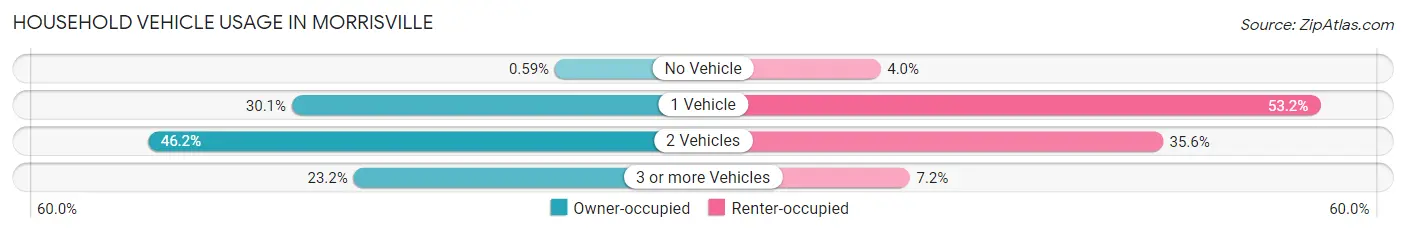
| Vehicles per Household | Owner-occupied | Renter-occupied |
| No Vehicle | 33 (0.6%) | 219 (4.0%) |
| 1 Vehicle | 1,691 (30.1%) | 2,941 (53.2%) |
| 2 Vehicles | 2,599 (46.2%) | 1,966 (35.6%) |
| 3 or more Vehicles | 1,302 (23.2%) | 400 (7.2%) |
| Total | 5,625 (100.0%) | 5,526 (100.0%) |
Real Estate & Mortgages in Morrisville
Real Estate and Mortgage Overview in Morrisville
| Characteristic | Without Mortgage | With Mortgage |
| Housing Units | 1,257 | 4,368 |
| Median Property Value | $371,700 | $436,900 |
| Median Household Income | $111,409 | $2,253 |
| Monthly Housing Costs | $629 | $838 |
| Real Estate Taxes | $3,305 | $0 |
Property Value by Mortgage Status in Morrisville
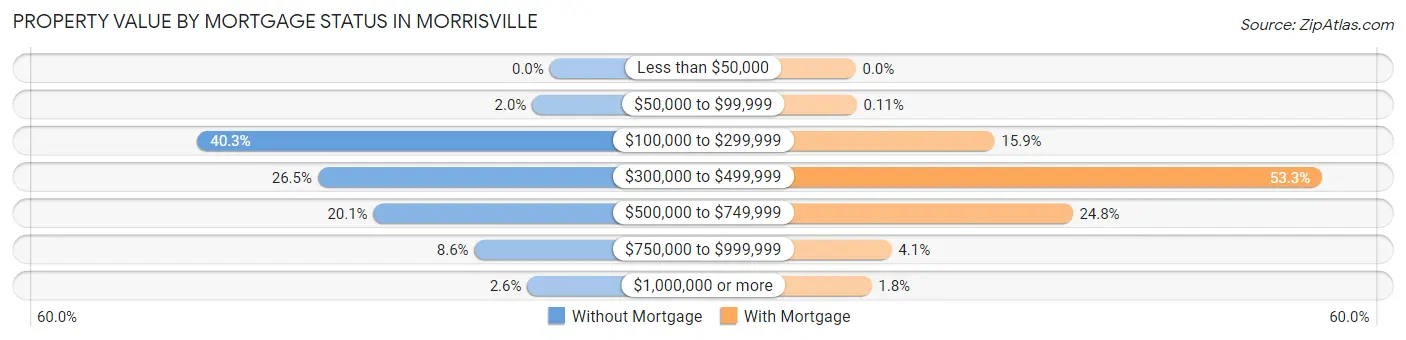
| Property Value | Without Mortgage | With Mortgage |
| Less than $50,000 | 0 (0.0%) | 0 (0.0%) |
| $50,000 to $99,999 | 25 (2.0%) | 5 (0.1%) |
| $100,000 to $299,999 | 506 (40.3%) | 693 (15.9%) |
| $300,000 to $499,999 | 333 (26.5%) | 2,329 (53.3%) |
| $500,000 to $749,999 | 253 (20.1%) | 1,083 (24.8%) |
| $750,000 to $999,999 | 108 (8.6%) | 179 (4.1%) |
| $1,000,000 or more | 32 (2.5%) | 79 (1.8%) |
| Total | 1,257 (100.0%) | 4,368 (100.0%) |
Household Income by Mortgage Status in Morrisville
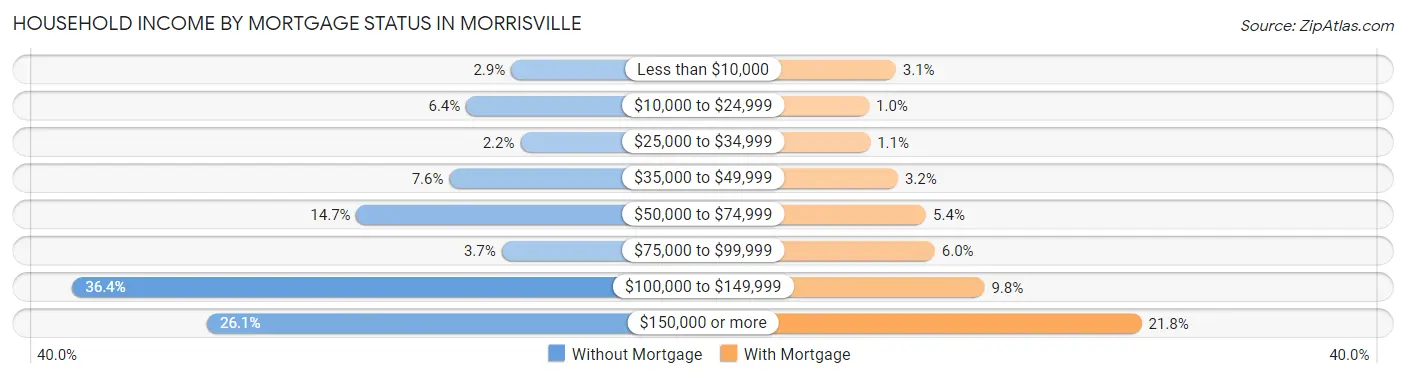
| Household Income | Without Mortgage | With Mortgage |
| Less than $10,000 | 37 (2.9%) | 134 (3.1%) |
| $10,000 to $24,999 | 80 (6.4%) | 45 (1.0%) |
| $25,000 to $34,999 | 28 (2.2%) | 49 (1.1%) |
| $35,000 to $49,999 | 96 (7.6%) | 141 (3.2%) |
| $50,000 to $74,999 | 185 (14.7%) | 235 (5.4%) |
| $75,000 to $99,999 | 46 (3.7%) | 264 (6.0%) |
| $100,000 to $149,999 | 457 (36.4%) | 429 (9.8%) |
| $150,000 or more | 328 (26.1%) | 952 (21.8%) |
| Total | 1,257 (100.0%) | 4,368 (100.0%) |
Property Value to Household Income Ratio in Morrisville
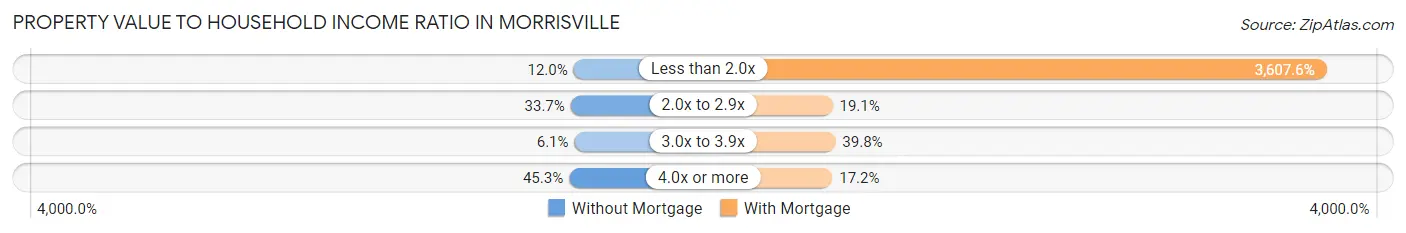
| Value-to-Income Ratio | Without Mortgage | With Mortgage |
| Less than 2.0x | 151 (12.0%) | 157,581 (3,607.6%) |
| 2.0x to 2.9x | 423 (33.7%) | 836 (19.1%) |
| 3.0x to 3.9x | 77 (6.1%) | 1,739 (39.8%) |
| 4.0x or more | 569 (45.3%) | 750 (17.2%) |
| Total | 1,257 (100.0%) | 4,368 (100.0%) |
Real Estate Taxes by Mortgage Status in Morrisville
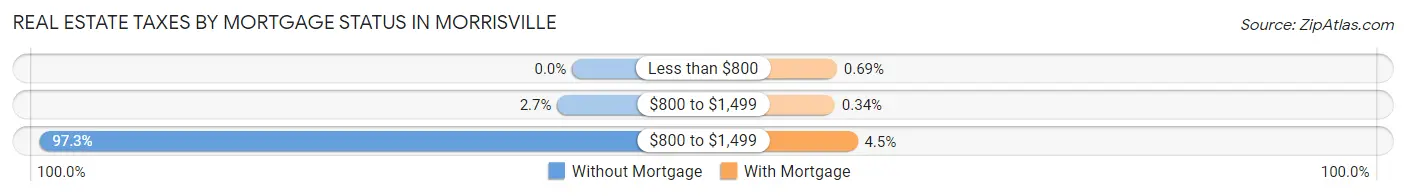
| Property Taxes | Without Mortgage | With Mortgage |
| Less than $800 | 0 (0.0%) | 30 (0.7%) |
| $800 to $1,499 | 34 (2.7%) | 15 (0.3%) |
| $800 to $1,499 | 1,223 (97.3%) | 195 (4.5%) |
| Total | 1,257 (100.0%) | 4,368 (100.0%) |
Health & Disability in Morrisville
Health Insurance Coverage by Age in Morrisville
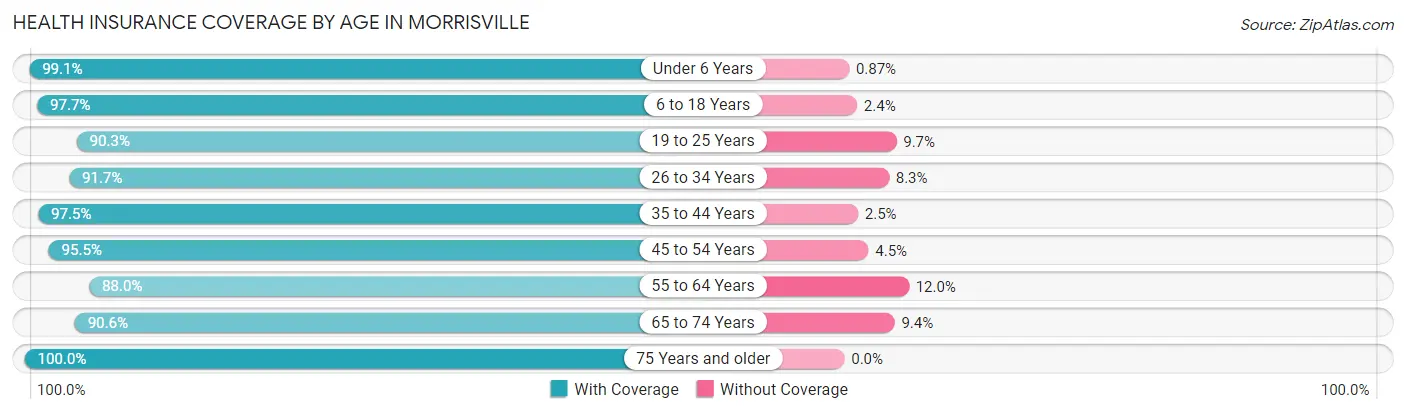
| Age Bracket | With Coverage | Without Coverage |
| Under 6 Years | 2,173 (99.1%) | 19 (0.9%) |
| 6 to 18 Years | 4,853 (97.7%) | 117 (2.4%) |
| 19 to 25 Years | 2,571 (90.3%) | 276 (9.7%) |
| 26 to 34 Years | 4,902 (91.7%) | 443 (8.3%) |
| 35 to 44 Years | 5,319 (97.5%) | 138 (2.5%) |
| 45 to 54 Years | 3,811 (95.5%) | 179 (4.5%) |
| 55 to 64 Years | 2,580 (88.0%) | 352 (12.0%) |
| 65 to 74 Years | 1,104 (90.6%) | 114 (9.4%) |
| 75 Years and older | 755 (100.0%) | 0 (0.0%) |
| Total | 28,068 (94.5%) | 1,638 (5.5%) |
Health Insurance Coverage by Citizenship Status in Morrisville
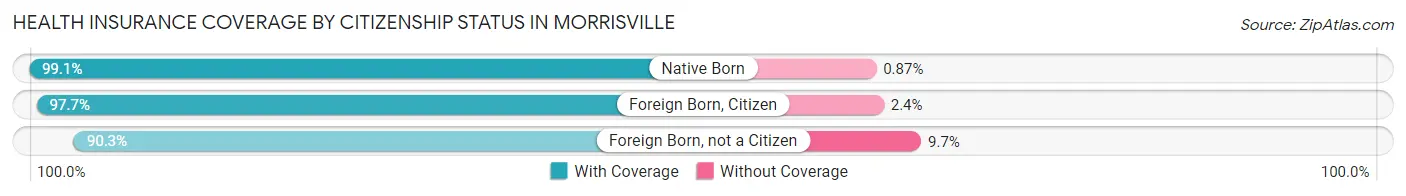
| Citizenship Status | With Coverage | Without Coverage |
| Native Born | 2,173 (99.1%) | 19 (0.9%) |
| Foreign Born, Citizen | 4,853 (97.7%) | 117 (2.4%) |
| Foreign Born, not a Citizen | 2,571 (90.3%) | 276 (9.7%) |
Health Insurance Coverage by Household Income in Morrisville
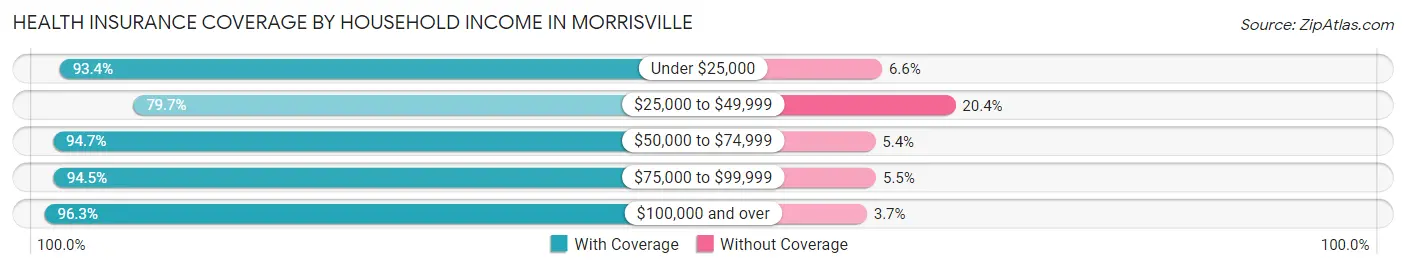
| Household Income | With Coverage | Without Coverage |
| Under $25,000 | 1,219 (93.4%) | 86 (6.6%) |
| $25,000 to $49,999 | 1,867 (79.6%) | 477 (20.3%) |
| $50,000 to $74,999 | 2,600 (94.7%) | 147 (5.3%) |
| $75,000 to $99,999 | 3,105 (94.5%) | 180 (5.5%) |
| $100,000 and over | 19,261 (96.3%) | 748 (3.7%) |
Public vs Private Health Insurance Coverage by Age in Morrisville
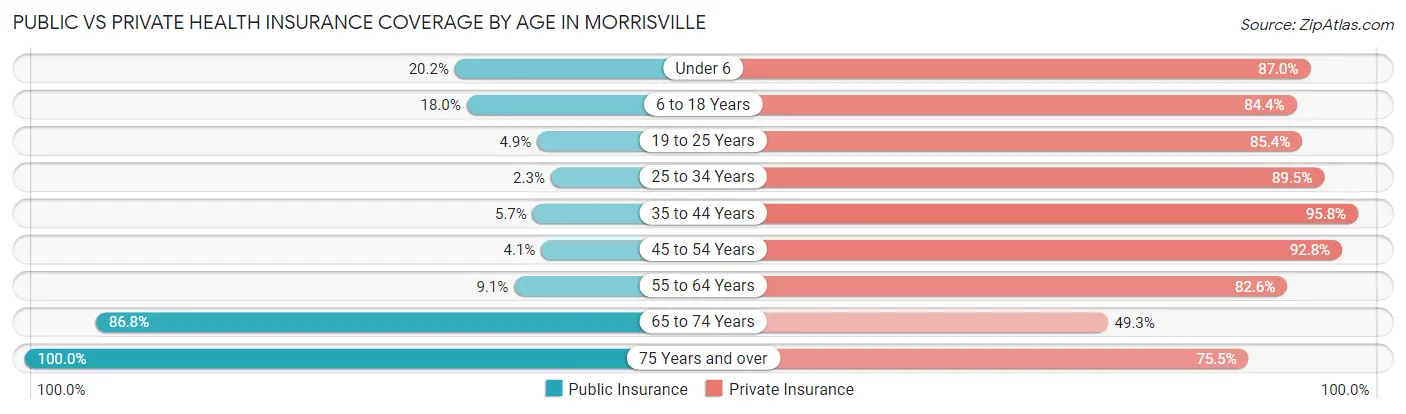
| Age Bracket | Public Insurance | Private Insurance |
| Under 6 | 442 (20.2%) | 1,906 (87.0%) |
| 6 to 18 Years | 893 (18.0%) | 4,193 (84.4%) |
| 19 to 25 Years | 139 (4.9%) | 2,432 (85.4%) |
| 25 to 34 Years | 125 (2.3%) | 4,785 (89.5%) |
| 35 to 44 Years | 311 (5.7%) | 5,228 (95.8%) |
| 45 to 54 Years | 164 (4.1%) | 3,704 (92.8%) |
| 55 to 64 Years | 268 (9.1%) | 2,423 (82.6%) |
| 65 to 74 Years | 1,057 (86.8%) | 601 (49.3%) |
| 75 Years and over | 755 (100.0%) | 570 (75.5%) |
| Total | 4,154 (14.0%) | 25,842 (87.0%) |
Disability Status by Sex by Age in Morrisville
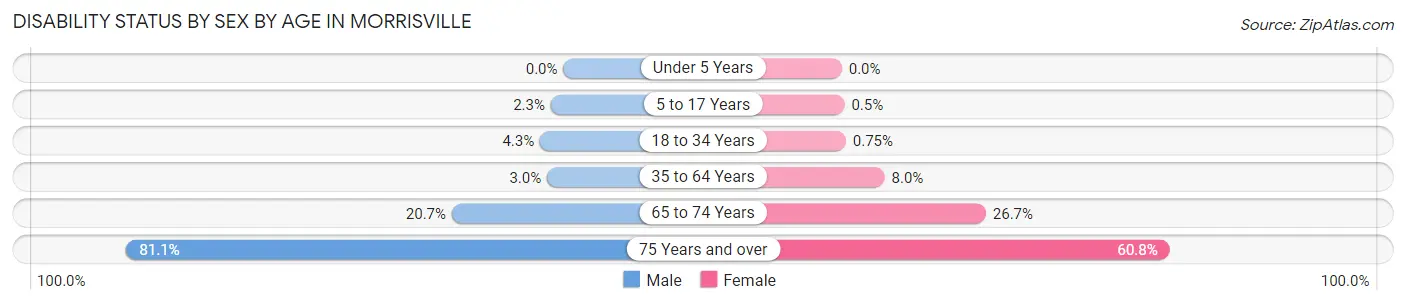
| Age Bracket | Male | Female |
| Under 5 Years | 0 (0.0%) | 0 (0.0%) |
| 5 to 17 Years | 62 (2.3%) | 12 (0.5%) |
| 18 to 34 Years | 182 (4.3%) | 32 (0.7%) |
| 35 to 64 Years | 193 (3.0%) | 478 (8.0%) |
| 65 to 74 Years | 112 (20.7%) | 181 (26.7%) |
| 75 Years and over | 339 (81.1%) | 205 (60.8%) |
Disability Class by Sex by Age in Morrisville
Disability Class: Hearing Difficulty
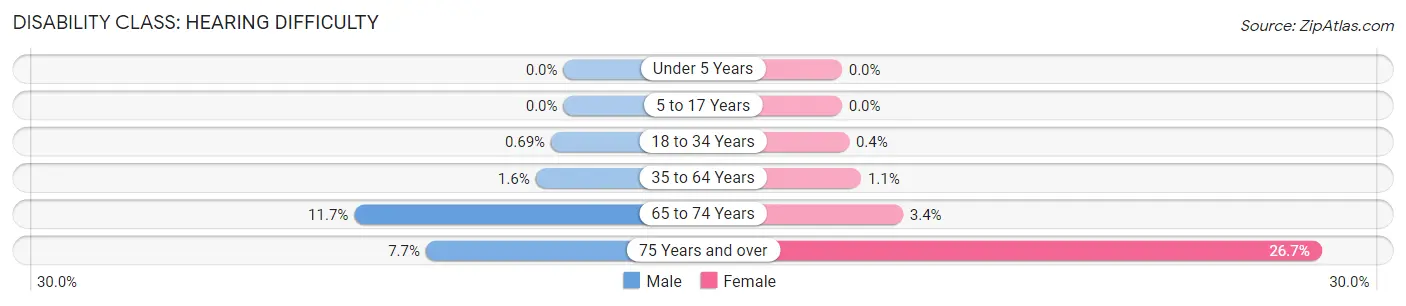
| Age Bracket | Male | Female |
| Under 5 Years | 0 (0.0%) | 0 (0.0%) |
| 5 to 17 Years | 0 (0.0%) | 0 (0.0%) |
| 18 to 34 Years | 29 (0.7%) | 17 (0.4%) |
| 35 to 64 Years | 99 (1.5%) | 64 (1.1%) |
| 65 to 74 Years | 63 (11.7%) | 23 (3.4%) |
| 75 Years and over | 32 (7.7%) | 90 (26.7%) |
Disability Class: Vision Difficulty
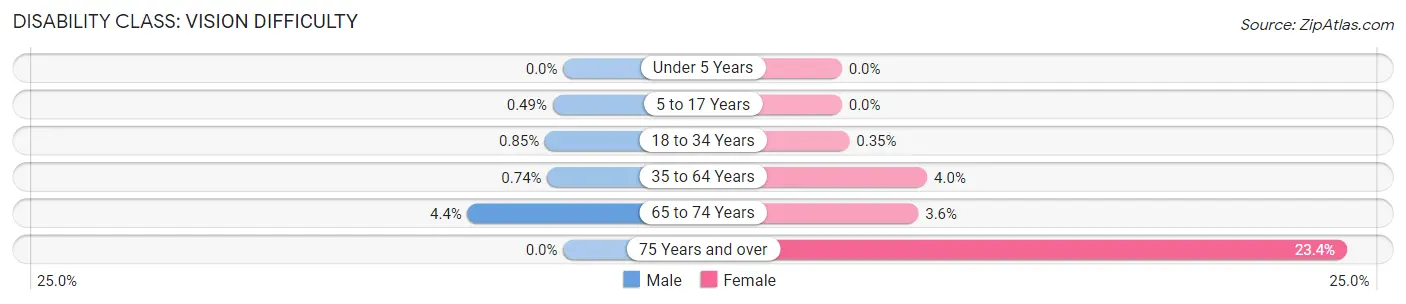
| Age Bracket | Male | Female |
| Under 5 Years | 0 (0.0%) | 0 (0.0%) |
| 5 to 17 Years | 13 (0.5%) | 0 (0.0%) |
| 18 to 34 Years | 36 (0.9%) | 15 (0.4%) |
| 35 to 64 Years | 47 (0.7%) | 238 (4.0%) |
| 65 to 74 Years | 24 (4.4%) | 24 (3.5%) |
| 75 Years and over | 0 (0.0%) | 79 (23.4%) |
Disability Class: Cognitive Difficulty
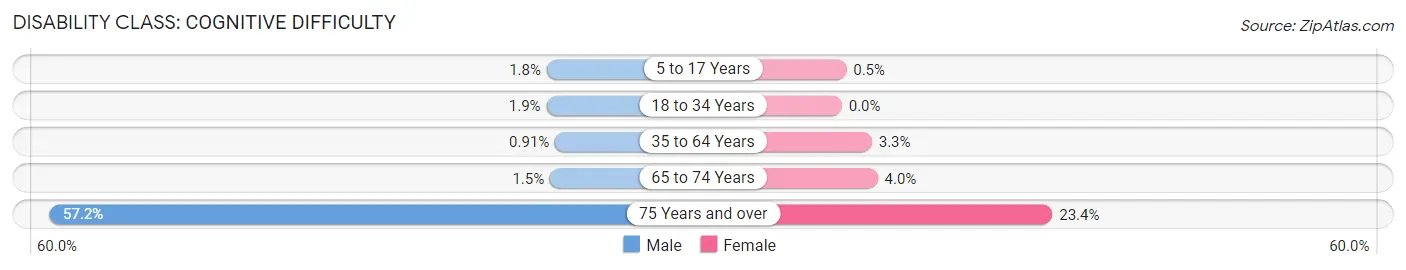
| Age Bracket | Male | Female |
| 5 to 17 Years | 49 (1.8%) | 12 (0.5%) |
| 18 to 34 Years | 79 (1.9%) | 0 (0.0%) |
| 35 to 64 Years | 58 (0.9%) | 201 (3.3%) |
| 65 to 74 Years | 8 (1.5%) | 27 (4.0%) |
| 75 Years and over | 239 (57.2%) | 79 (23.4%) |
Disability Class: Ambulatory Difficulty
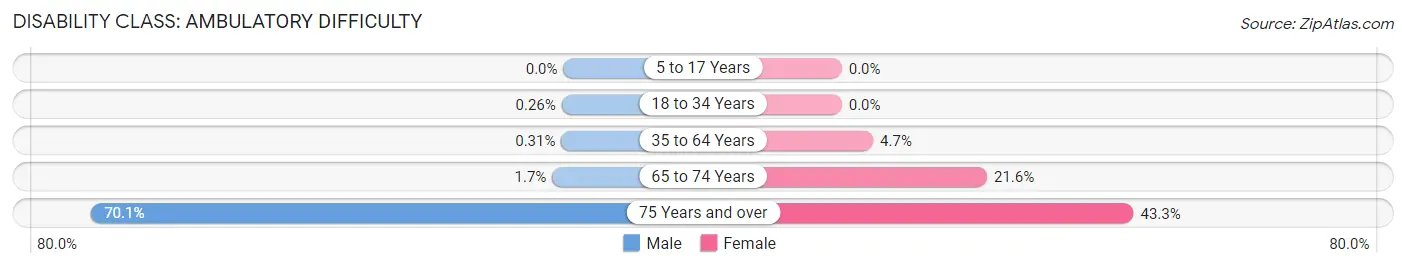
| Age Bracket | Male | Female |
| 5 to 17 Years | 0 (0.0%) | 0 (0.0%) |
| 18 to 34 Years | 11 (0.3%) | 0 (0.0%) |
| 35 to 64 Years | 20 (0.3%) | 280 (4.7%) |
| 65 to 74 Years | 9 (1.7%) | 146 (21.6%) |
| 75 Years and over | 293 (70.1%) | 146 (43.3%) |
Disability Class: Self-Care Difficulty
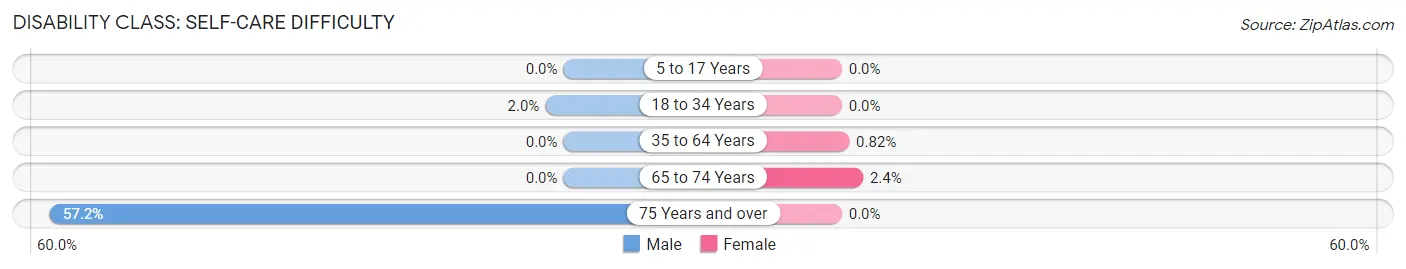
| Age Bracket | Male | Female |
| 5 to 17 Years | 0 (0.0%) | 0 (0.0%) |
| 18 to 34 Years | 85 (2.0%) | 0 (0.0%) |
| 35 to 64 Years | 0 (0.0%) | 49 (0.8%) |
| 65 to 74 Years | 0 (0.0%) | 16 (2.4%) |
| 75 Years and over | 239 (57.2%) | 0 (0.0%) |
Technology Access in Morrisville
Computing Device Access in Morrisville
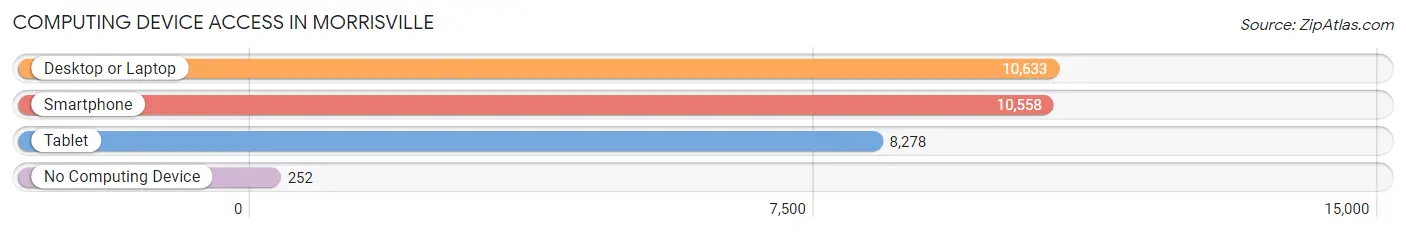
| Device Type | # Households | % Households |
| Desktop or Laptop | 10,633 | 95.4% |
| Smartphone | 10,558 | 94.7% |
| Tablet | 8,278 | 74.2% |
| No Computing Device | 252 | 2.3% |
| Total | 11,151 | 100.0% |
Internet Access in Morrisville
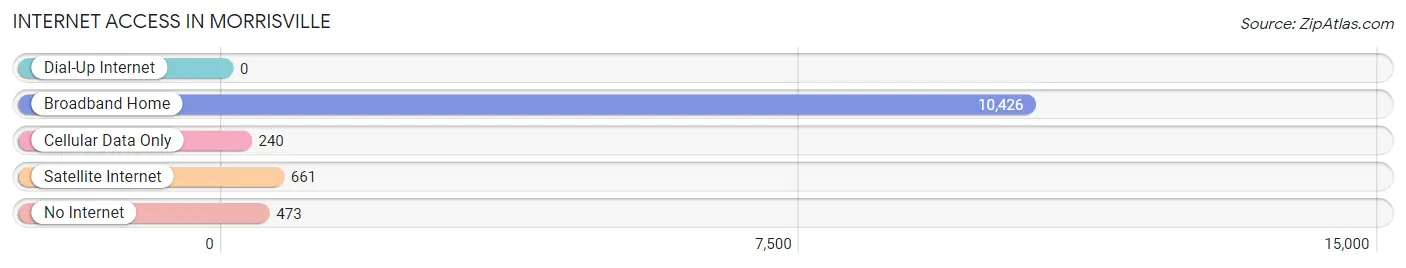
| Internet Type | # Households | % Households |
| Dial-Up Internet | 0 | 0.0% |
| Broadband Home | 10,426 | 93.5% |
| Cellular Data Only | 240 | 2.1% |
| Satellite Internet | 661 | 5.9% |
| No Internet | 473 | 4.2% |
| Total | 11,151 | 100.0% |
Morrisville Summary
Morrisville, North Carolina is a town located in Wake County, North Carolina. It is part of the Research Triangle metropolitan area and is located just west of Raleigh, the state capital. The town has a population of approximately 22,000 people and is home to a variety of businesses, including technology, pharmaceutical, and biotechnology companies.
History
Morrisville was first settled in the late 1700s by a group of Quakers from Pennsylvania. The town was named after Jeremiah Morris, a Quaker who owned a large tract of land in the area. The town was officially incorporated in 1875 and was primarily an agricultural community until the 1950s. In the 1950s, the town began to experience rapid growth due to its proximity to Raleigh and the Research Triangle Park. The town has continued to grow and develop since then, and today it is home to a variety of businesses and industries.
Geography
Morrisville is located in Wake County, North Carolina. It is situated just west of Raleigh, the state capital, and is part of the Research Triangle metropolitan area. The town is located at the intersection of Interstate 40 and US Highway 64, and is just minutes away from Raleigh-Durham International Airport. The town covers an area of approximately 10 square miles and is bordered by Cary to the north, Apex to the east, and Raleigh to the south and west.
Economy
Morrisville is home to a variety of businesses and industries, including technology, pharmaceutical, and biotechnology companies. The town is also home to a number of corporate headquarters, including Lenovo, GlaxoSmithKline, and Red Hat. The town is also home to a number of retail stores, restaurants, and other businesses.
Demographics
As of the 2010 census, the population of Morrisville was 22,032. The racial makeup of the town was 68.2% White, 15.2% African American, 0.4% Native American, 8.7% Asian, 0.1% Pacific Islander, and 4.3% from other races. The median household income was $71,945, and the median family income was $81,945. The town has a large population of immigrants, with approximately 20% of the population being foreign-born.
Conclusion
Morrisville, North Carolina is a town located in Wake County, North Carolina. It is part of the Research Triangle metropolitan area and is located just west of Raleigh, the state capital. The town has a population of approximately 22,000 people and is home to a variety of businesses, including technology, pharmaceutical, and biotechnology companies. The town has a diverse population and a strong economy, and is a great place to live and work.
Common Questions
What is Per Capita Income in Morrisville?
Per Capita income in Morrisville is $51,699.
What is the Median Family Income in Morrisville?
Median Family Income in Morrisville is $135,942.
What is the Median Household income in Morrisville?
Median Household Income in Morrisville is $114,075.
What is Income or Wage Gap in Morrisville?
Income or Wage Gap in Morrisville is 36.5%.
Women in Morrisville earn 63.5 cents for every dollar earned by a man.
What is Family Income Deficit in Morrisville?
Family Income Deficit in Morrisville is $10,563.
Families that are below poverty line in Morrisville earn $10,563 less on average than the poverty threshold level.
What is Inequality or Gini Index in Morrisville?
Inequality or Gini Index in Morrisville is 0.37.
What is the Total Population of Morrisville?
Total Population of Morrisville is 29,756.
What is the Total Male Population of Morrisville?
Total Male Population of Morrisville is 15,049.
What is the Total Female Population of Morrisville?
Total Female Population of Morrisville is 14,707.
What is the Ratio of Males per 100 Females in Morrisville?
There are 102.33 Males per 100 Females in Morrisville.
What is the Ratio of Females per 100 Males in Morrisville?
There are 97.73 Females per 100 Males in Morrisville.
What is the Median Population Age in Morrisville?
Median Population Age in Morrisville is 34.3 Years.
What is the Average Family Size in Morrisville
Average Family Size in Morrisville is 3.3 People.
What is the Average Household Size in Morrisville
Average Household Size in Morrisville is 2.7 People.
How Large is the Labor Force in Morrisville?
There are 17,604 People in the Labor Forcein in Morrisville.
What is the Percentage of People in the Labor Force in Morrisville?
74.6% of People are in the Labor Force in Morrisville.
What is the Unemployment Rate in Morrisville?
Unemployment Rate in Morrisville is 3.6%.