Beltsville, MD Map & Demographics
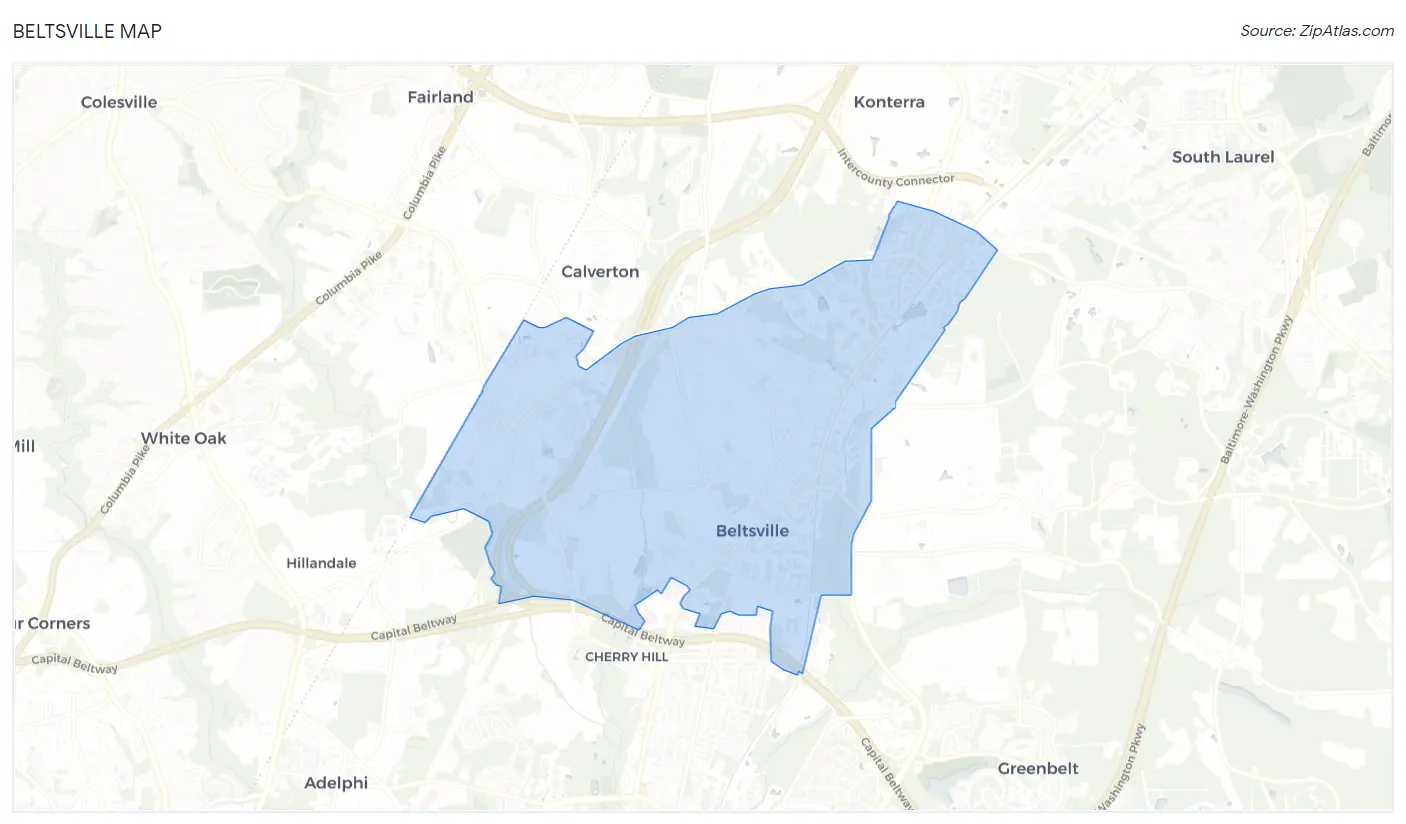
Beltsville Map
Beltsville Overview
$37,444
PER CAPITA INCOME
$107,500
AVG FAMILY INCOME
$96,745
AVG HOUSEHOLD INCOME
23.6%
WAGE / INCOME GAP [ % ]
76.4¢/ $1
WAGE / INCOME GAP [ $ ]
$12,530
FAMILY INCOME DEFICIT
0.36
INEQUALITY / GINI INDEX
19,704
TOTAL POPULATION
9,340
MALE POPULATION
10,364
FEMALE POPULATION
90.12
MALES / 100 FEMALES
110.96
FEMALES / 100 MALES
38.8
MEDIAN AGE
4.0
AVG FAMILY SIZE
3.1
AVG HOUSEHOLD SIZE
9,814
LABOR FORCE [ PEOPLE ]
65.1%
PERCENT IN LABOR FORCE
7.9%
UNEMPLOYMENT RATE
Beltsville Zip Codes
Income in Beltsville
Income Overview in Beltsville
Per Capita Income in Beltsville is $37,444, while median incomes of families and households are $107,500 and $96,745 respectively.
| Characteristic | Number | Measure |
| Per Capita Income | 19,704 | $37,444 |
| Median Family Income | 4,032 | $107,500 |
| Mean Family Income | 4,032 | $117,418 |
| Median Household Income | 6,277 | $96,745 |
| Mean Household Income | 6,277 | $110,778 |
| Income Deficit | 4,032 | $12,530 |
| Wage / Income Gap (%) | 19,704 | 23.62% |
| Wage / Income Gap ($) | 19,704 | 76.38¢ per $1 |
| Gini / Inequality Index | 19,704 | 0.36 |
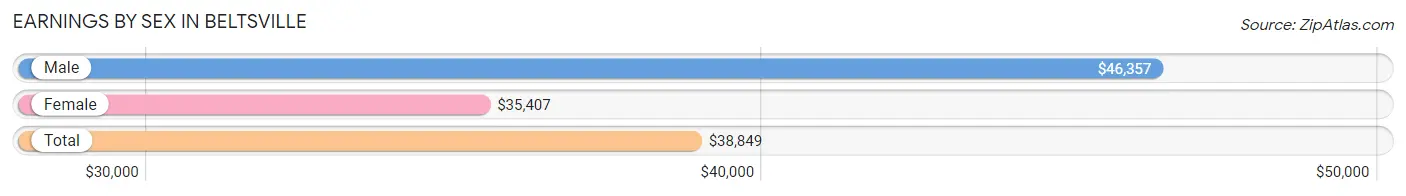
Earnings by Sex in Beltsville
Average Earnings in Beltsville are $38,849, $46,357 for men and $35,407 for women, a difference of 23.6%.
| Sex | Number | Average Earnings |
| Male | 4,861 (49.1%) | $46,357 |
| Female | 5,032 (50.9%) | $35,407 |
| Total | 9,893 (100.0%) | $38,849 |
Earnings by Sex by Income Bracket in Beltsville
The most common earnings brackets in Beltsville are $75,000 to $99,999 for men (649 | 13.4%) and $75,000 to $99,999 for women (500 | 9.9%).
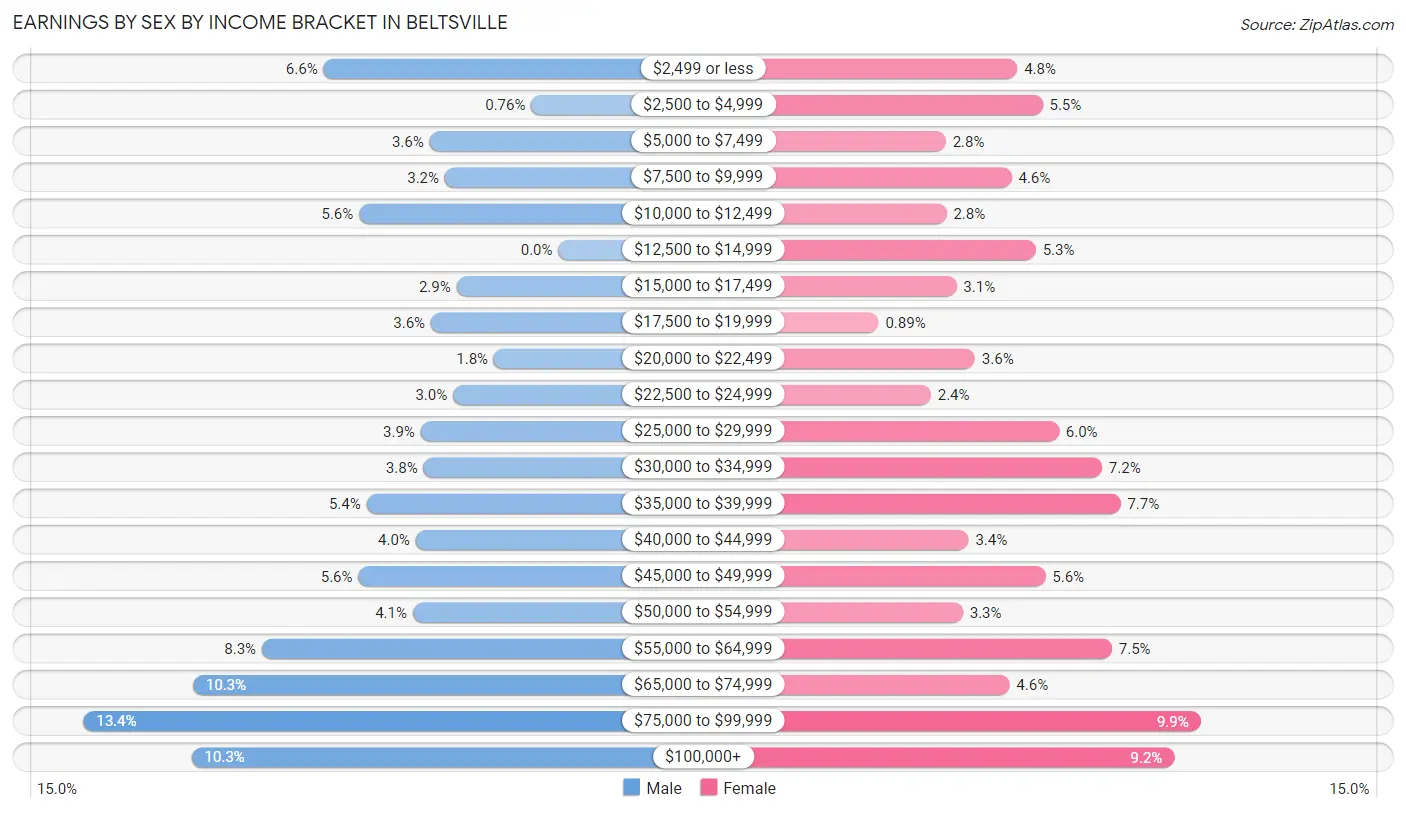
| Income | Male | Female |
| $2,499 or less | 321 (6.6%) | 241 (4.8%) |
| $2,500 to $4,999 | 37 (0.8%) | 277 (5.5%) |
| $5,000 to $7,499 | 176 (3.6%) | 140 (2.8%) |
| $7,500 to $9,999 | 155 (3.2%) | 233 (4.6%) |
| $10,000 to $12,499 | 272 (5.6%) | 141 (2.8%) |
| $12,500 to $14,999 | 0 (0.0%) | 267 (5.3%) |
| $15,000 to $17,499 | 139 (2.9%) | 155 (3.1%) |
| $17,500 to $19,999 | 174 (3.6%) | 45 (0.9%) |
| $20,000 to $22,499 | 88 (1.8%) | 181 (3.6%) |
| $22,500 to $24,999 | 144 (3.0%) | 119 (2.4%) |
| $25,000 to $29,999 | 188 (3.9%) | 300 (6.0%) |
| $30,000 to $34,999 | 184 (3.8%) | 361 (7.2%) |
| $35,000 to $39,999 | 262 (5.4%) | 387 (7.7%) |
| $40,000 to $44,999 | 195 (4.0%) | 172 (3.4%) |
| $45,000 to $49,999 | 273 (5.6%) | 281 (5.6%) |
| $50,000 to $54,999 | 199 (4.1%) | 164 (3.3%) |
| $55,000 to $64,999 | 405 (8.3%) | 375 (7.4%) |
| $65,000 to $74,999 | 499 (10.3%) | 230 (4.6%) |
| $75,000 to $99,999 | 649 (13.4%) | 500 (9.9%) |
| $100,000+ | 501 (10.3%) | 463 (9.2%) |
| Total | 4,861 (100.0%) | 5,032 (100.0%) |
Earnings by Sex by Educational Attainment in Beltsville
Average earnings in Beltsville are $54,193 for men and $37,245 for women, a difference of 31.3%. Men with an educational attainment of graduate degree enjoy the highest average annual earnings of $81,500, while those with bachelor's degree education earn the least with $44,615. Women with an educational attainment of graduate degree earn the most with the average annual earnings of $70,833, while those with less than high school education have the smallest earnings of $22,927.
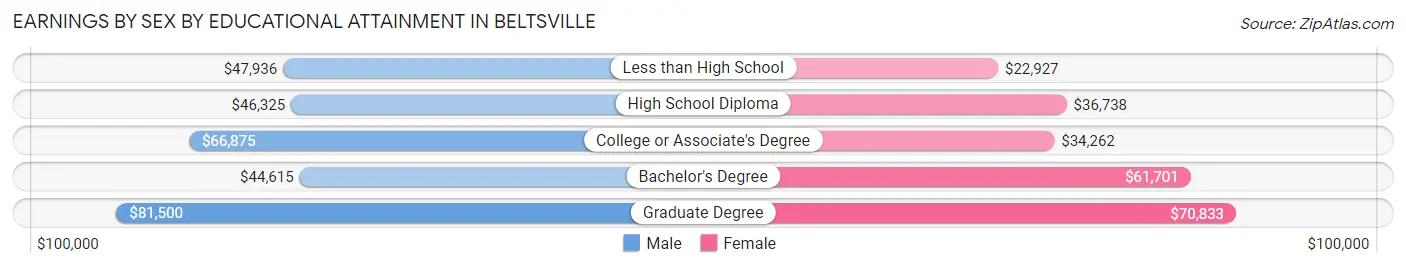
| Educational Attainment | Male Income | Female Income |
| Less than High School | $47,936 | $22,927 |
| High School Diploma | $46,325 | $36,738 |
| College or Associate's Degree | $66,875 | $34,262 |
| Bachelor's Degree | $44,615 | $61,701 |
| Graduate Degree | $81,500 | $70,833 |
| Total | $54,193 | $37,245 |
Family Income in Beltsville
Family Income Brackets in Beltsville
According to the Beltsville family income data, there are 887 families falling into the $100,000 to $149,999 income range, which is the most common income bracket and makes up 22.0% of all families.
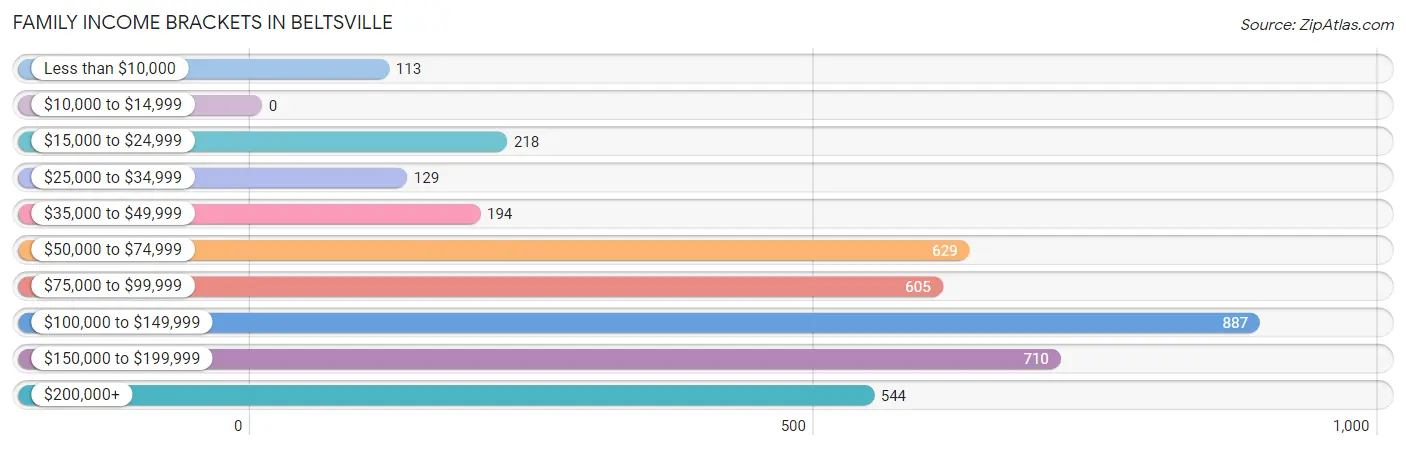
| Income Bracket | # Families | % Families |
| Less than $10,000 | 113 | 2.8% |
| $10,000 to $14,999 | 0 | 0.0% |
| $15,000 to $24,999 | 218 | 5.4% |
| $25,000 to $34,999 | 129 | 3.2% |
| $35,000 to $49,999 | 194 | 4.8% |
| $50,000 to $74,999 | 629 | 15.6% |
| $75,000 to $99,999 | 605 | 15.0% |
| $100,000 to $149,999 | 887 | 22.0% |
| $150,000 to $199,999 | 710 | 17.6% |
| $200,000+ | 544 | 13.5% |
Family Income by Famaliy Size in Beltsville
6-person families (182 | 4.5%) account for the highest median family income in Beltsville with $205,543 per family, while 2-person families (1,480 | 36.7%) have the highest median income of $45,162 per family member.
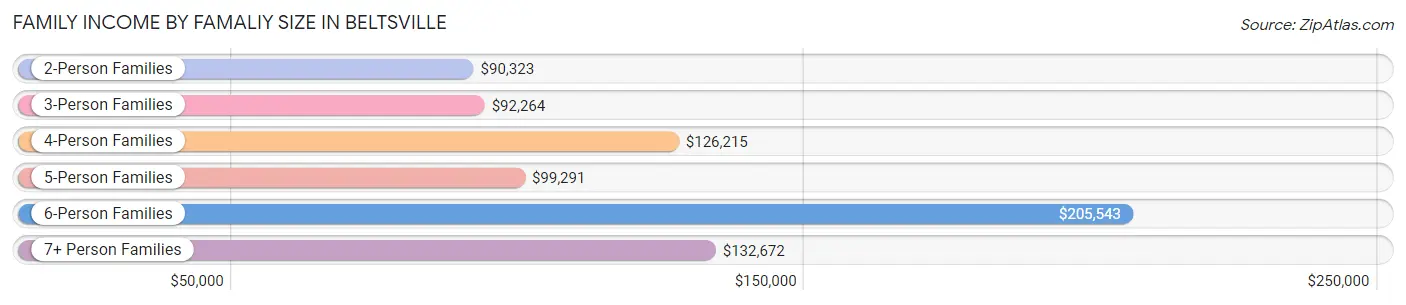
| Income Bracket | # Families | Median Income |
| 2-Person Families | 1,480 (36.7%) | $90,323 |
| 3-Person Families | 818 (20.3%) | $92,264 |
| 4-Person Families | 637 (15.8%) | $126,215 |
| 5-Person Families | 525 (13.0%) | $99,291 |
| 6-Person Families | 182 (4.5%) | $205,543 |
| 7+ Person Families | 390 (9.7%) | $132,672 |
| Total | 4,032 (100.0%) | $107,500 |
Family Income by Number of Earners in Beltsville
The median family income in Beltsville is $107,500, with families comprising 3+ earners (1,046) having the highest median family income of $133,017, while families with 1 earner (806) have the lowest median family income of $56,250, accounting for 25.9% and 20.0% of families, respectively.
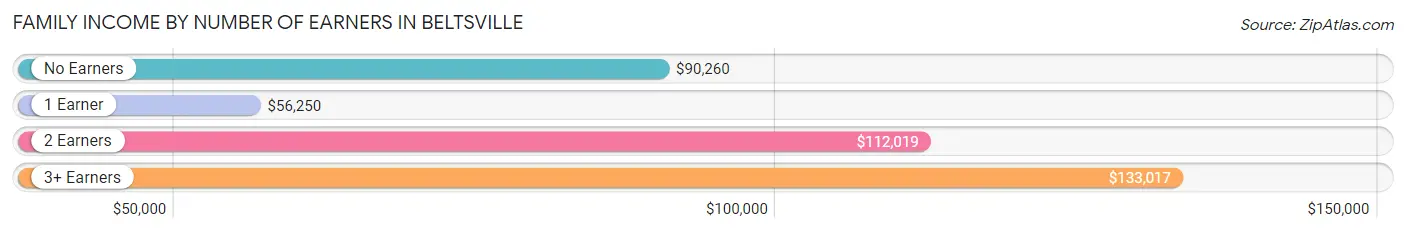
| Number of Earners | # Families | Median Income |
| No Earners | 449 (11.1%) | $90,260 |
| 1 Earner | 806 (20.0%) | $56,250 |
| 2 Earners | 1,731 (42.9%) | $112,019 |
| 3+ Earners | 1,046 (25.9%) | $133,017 |
| Total | 4,032 (100.0%) | $107,500 |
Household Income in Beltsville
Household Income Brackets in Beltsville
With 1,419 households falling in the category, the $100,000 to $149,999 income range is the most frequent in Beltsville, accounting for 22.6% of all households. In contrast, only 13 households (0.2%) fall into the $10,000 to $14,999 income bracket, making it the least populous group.
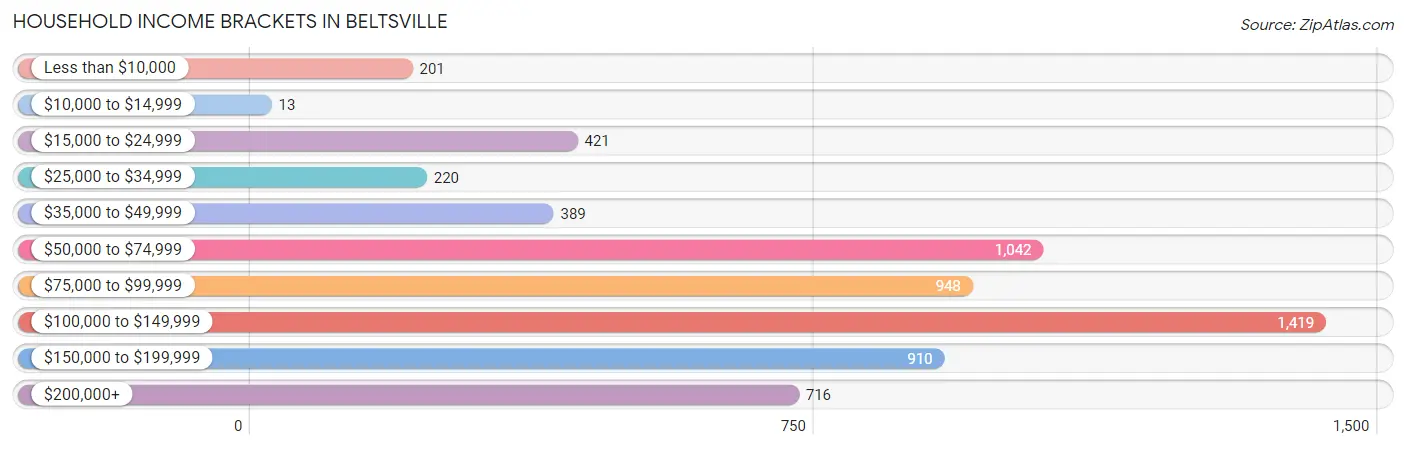
| Income Bracket | # Households | % Households |
| Less than $10,000 | 201 | 3.2% |
| $10,000 to $14,999 | 13 | 0.2% |
| $15,000 to $24,999 | 421 | 6.7% |
| $25,000 to $34,999 | 220 | 3.5% |
| $35,000 to $49,999 | 389 | 6.2% |
| $50,000 to $74,999 | 1,042 | 16.6% |
| $75,000 to $99,999 | 948 | 15.1% |
| $100,000 to $149,999 | 1,419 | 22.6% |
| $150,000 to $199,999 | 910 | 14.5% |
| $200,000+ | 716 | 11.4% |
Household Income by Householder Age in Beltsville
The median household income in Beltsville is $96,745, with the highest median household income of $107,883 found in the 45 to 64 years age bracket for the primary householder. A total of 2,125 households (33.9%) fall into this category. Meanwhile, the 25 to 44 years age bracket for the primary householder has the lowest median household income of $91,576, with 1,668 households (26.6%) in this group.
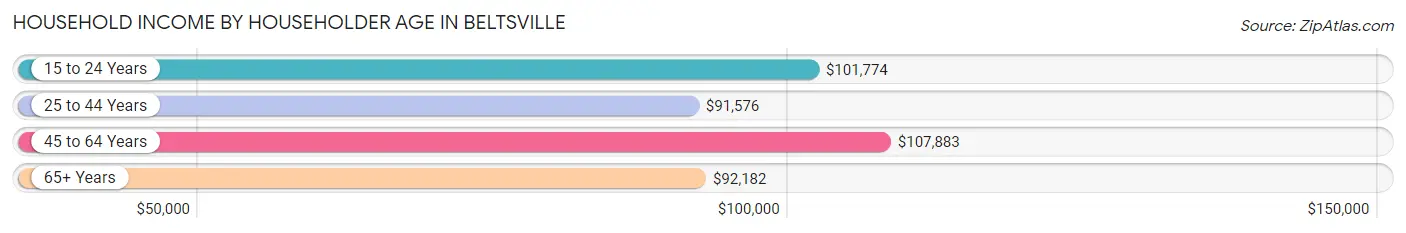
| Income Bracket | # Households | Median Income |
| 15 to 24 Years | 92 (1.5%) | $101,774 |
| 25 to 44 Years | 1,668 (26.6%) | $91,576 |
| 45 to 64 Years | 2,125 (33.9%) | $107,883 |
| 65+ Years | 2,392 (38.1%) | $92,182 |
| Total | 6,277 (100.0%) | $96,745 |
Poverty in Beltsville
Income Below Poverty by Sex and Age in Beltsville
With 11.7% poverty level for males and 9.1% for females among the residents of Beltsville, 12 to 14 year old males and 15 year old females are the most vulnerable to poverty, with 72 males (28.2%) and 64 females (38.8%) in their respective age groups living below the poverty level.
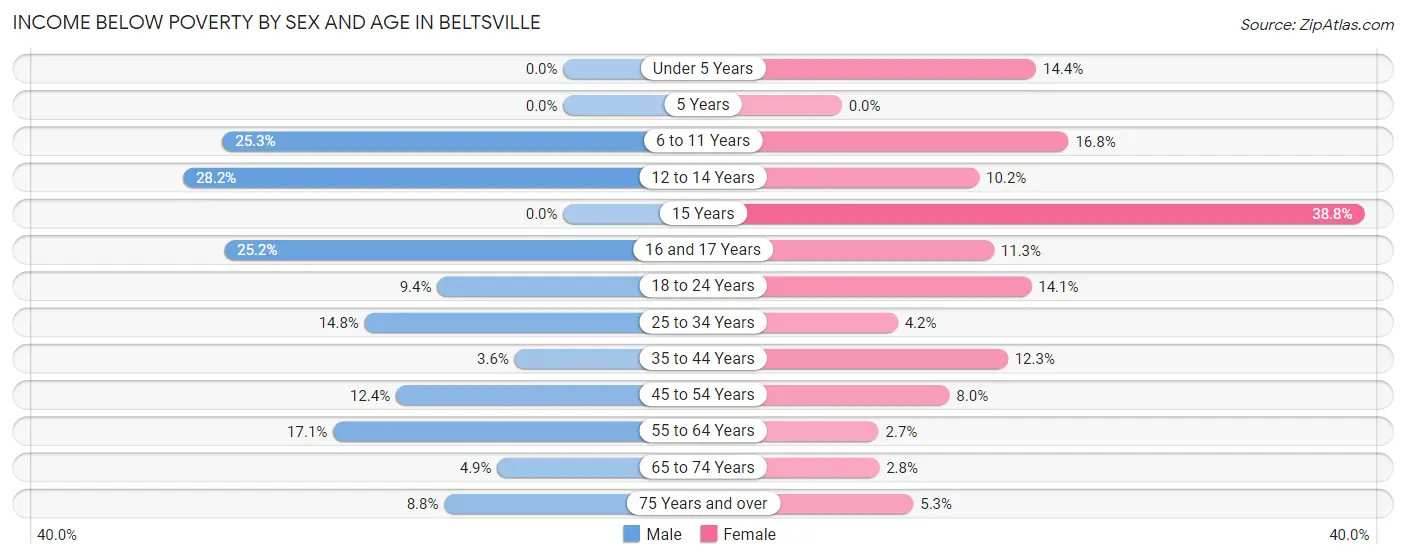
| Age Bracket | Male | Female |
| Under 5 Years | 0 (0.0%) | 91 (14.4%) |
| 5 Years | 0 (0.0%) | 0 (0.0%) |
| 6 to 11 Years | 279 (25.3%) | 139 (16.8%) |
| 12 to 14 Years | 72 (28.2%) | 41 (10.2%) |
| 15 Years | 0 (0.0%) | 64 (38.8%) |
| 16 and 17 Years | 68 (25.2%) | 36 (11.3%) |
| 18 to 24 Years | 81 (9.4%) | 113 (14.1%) |
| 25 to 34 Years | 167 (14.7%) | 38 (4.2%) |
| 35 to 44 Years | 43 (3.6%) | 180 (12.3%) |
| 45 to 54 Years | 132 (12.4%) | 97 (8.0%) |
| 55 to 64 Years | 136 (17.1%) | 26 (2.7%) |
| 65 to 74 Years | 36 (4.9%) | 24 (2.8%) |
| 75 Years and over | 68 (8.8%) | 80 (5.3%) |
| Total | 1,082 (11.7%) | 929 (9.1%) |
Income Above Poverty by Sex and Age in Beltsville
According to the poverty statistics in Beltsville, males aged under 5 years and females aged 5 years are the age groups that are most secure financially, with 100.0% of males and 100.0% of females in these age groups living above the poverty line.
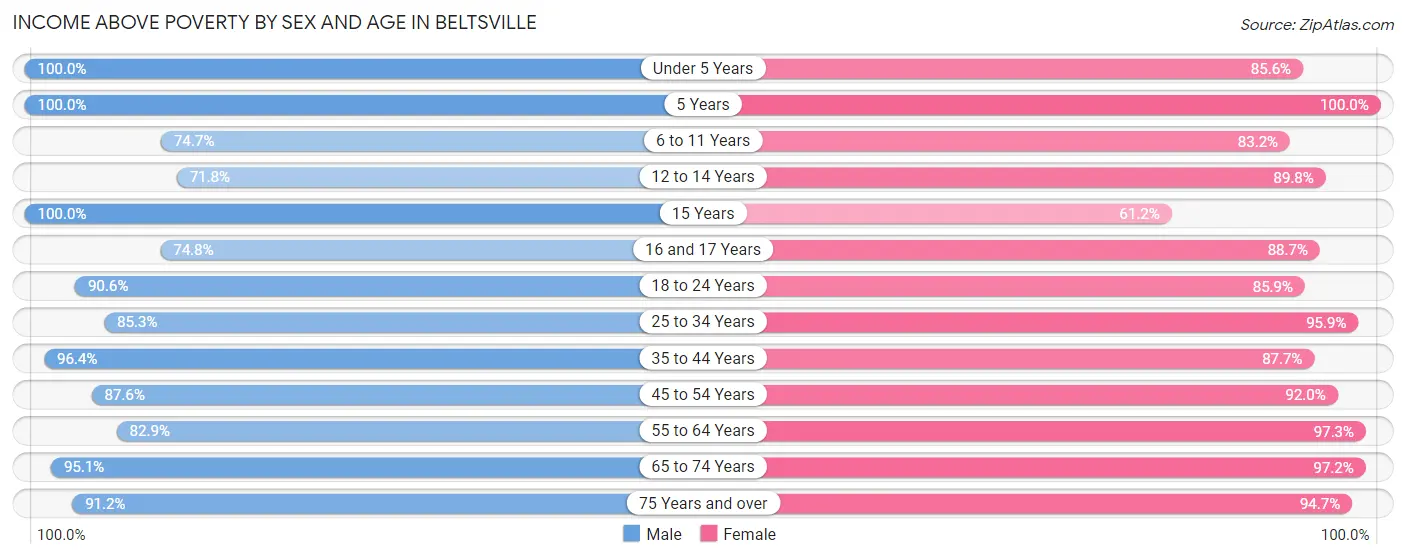
| Age Bracket | Male | Female |
| Under 5 Years | 867 (100.0%) | 540 (85.6%) |
| 5 Years | 54 (100.0%) | 117 (100.0%) |
| 6 to 11 Years | 823 (74.7%) | 687 (83.2%) |
| 12 to 14 Years | 183 (71.8%) | 361 (89.8%) |
| 15 Years | 145 (100.0%) | 101 (61.2%) |
| 16 and 17 Years | 202 (74.8%) | 283 (88.7%) |
| 18 to 24 Years | 784 (90.6%) | 690 (85.9%) |
| 25 to 34 Years | 965 (85.3%) | 878 (95.9%) |
| 35 to 44 Years | 1,148 (96.4%) | 1,281 (87.7%) |
| 45 to 54 Years | 931 (87.6%) | 1,117 (92.0%) |
| 55 to 64 Years | 660 (82.9%) | 928 (97.3%) |
| 65 to 74 Years | 698 (95.1%) | 839 (97.2%) |
| 75 Years and over | 701 (91.2%) | 1,427 (94.7%) |
| Total | 8,161 (88.3%) | 9,249 (90.9%) |
Income Below Poverty Among Married-Couple Families in Beltsville
The poverty statistics for married-couple families in Beltsville show that 5.0% or 139 of the total 2,784 families live below the poverty line. Families with 3 or 4 children have the highest poverty rate of 21.8%, comprising of 97 families. On the other hand, families with 5 or more children have the lowest poverty rate of 0.0%, which includes 0 families.
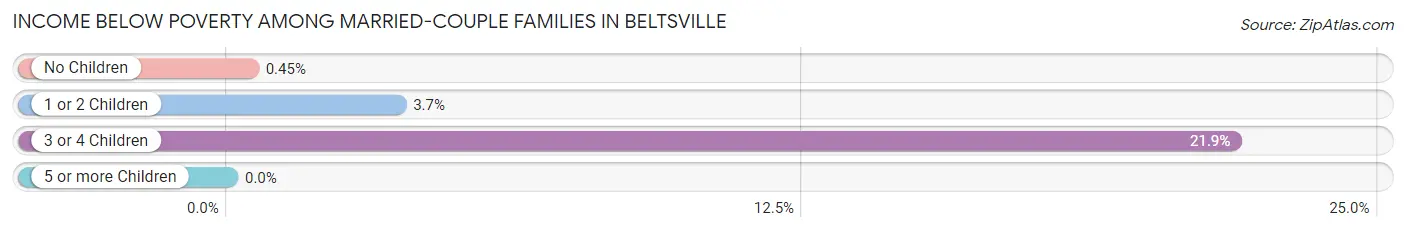
| Children | Above Poverty | Below Poverty |
| No Children | 1,316 (99.6%) | 6 (0.4%) |
| 1 or 2 Children | 948 (96.3%) | 36 (3.7%) |
| 3 or 4 Children | 347 (78.1%) | 97 (21.8%) |
| 5 or more Children | 34 (100.0%) | 0 (0.0%) |
| Total | 2,645 (95.0%) | 139 (5.0%) |
Income Below Poverty Among Single-Parent Households in Beltsville
According to the poverty data in Beltsville, 20.5% or 79 single-father households and 10.1% or 87 single-mother households are living below the poverty line. Among single-father households, those with 3 or 4 children have the highest poverty rate, with 28 households (40.6%) experiencing poverty. Likewise, among single-mother households, those with 3 or 4 children have the highest poverty rate, with 47 households (74.6%) falling below the poverty line.
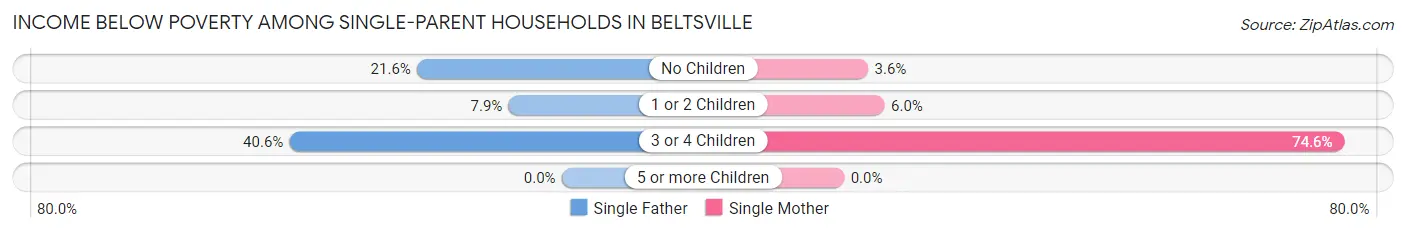
| Children | Single Father | Single Mother |
| No Children | 41 (21.6%) | 12 (3.6%) |
| 1 or 2 Children | 10 (7.9%) | 28 (6.0%) |
| 3 or 4 Children | 28 (40.6%) | 47 (74.6%) |
| 5 or more Children | 0 (0.0%) | 0 (0.0%) |
| Total | 79 (20.5%) | 87 (10.1%) |
Income Below Poverty Among Married-Couple vs Single-Parent Households in Beltsville
The poverty data for Beltsville shows that 139 of the married-couple family households (5.0%) and 166 of the single-parent households (13.3%) are living below the poverty level. Within the married-couple family households, those with 3 or 4 children have the highest poverty rate, with 97 households (21.8%) falling below the poverty line. Among the single-parent households, those with 3 or 4 children have the highest poverty rate, with 75 household (56.8%) living below poverty.
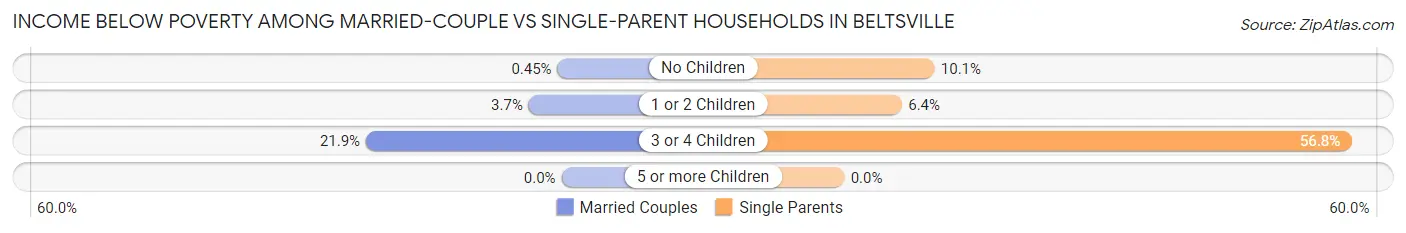
| Children | Married-Couple Families | Single-Parent Households |
| No Children | 6 (0.4%) | 53 (10.1%) |
| 1 or 2 Children | 36 (3.7%) | 38 (6.4%) |
| 3 or 4 Children | 97 (21.8%) | 75 (56.8%) |
| 5 or more Children | 0 (0.0%) | 0 (0.0%) |
| Total | 139 (5.0%) | 166 (13.3%) |
Race in Beltsville
The most populous races in Beltsville are Hispanic or Latino (8,655 | 43.9%), Some other Race (6,508 | 33.0%), and Black / African American (5,891 | 29.9%).
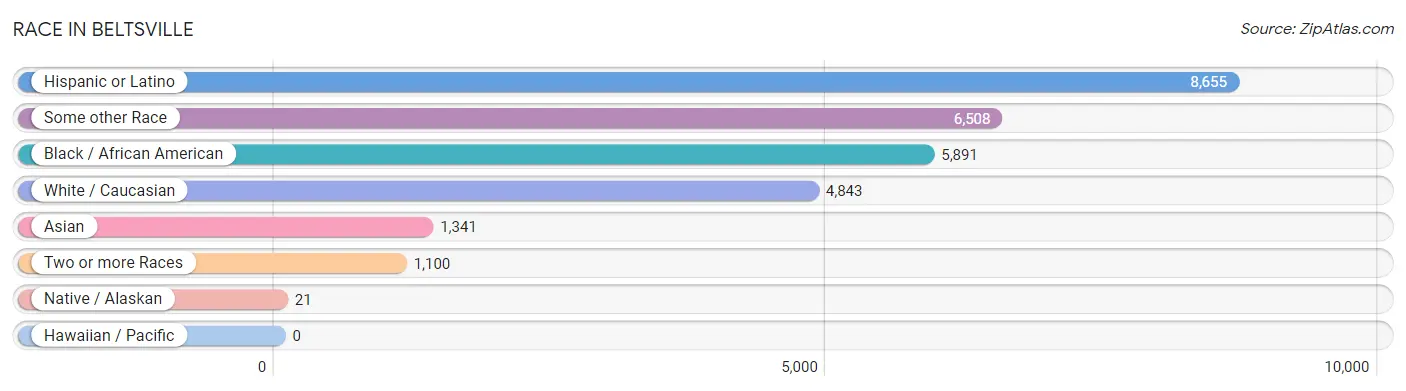
| Race | # Population | % Population |
| Asian | 1,341 | 6.8% |
| Black / African American | 5,891 | 29.9% |
| Hawaiian / Pacific | 0 | 0.0% |
| Hispanic or Latino | 8,655 | 43.9% |
| Native / Alaskan | 21 | 0.1% |
| White / Caucasian | 4,843 | 24.6% |
| Two or more Races | 1,100 | 5.6% |
| Some other Race | 6,508 | 33.0% |
| Total | 19,704 | 100.0% |
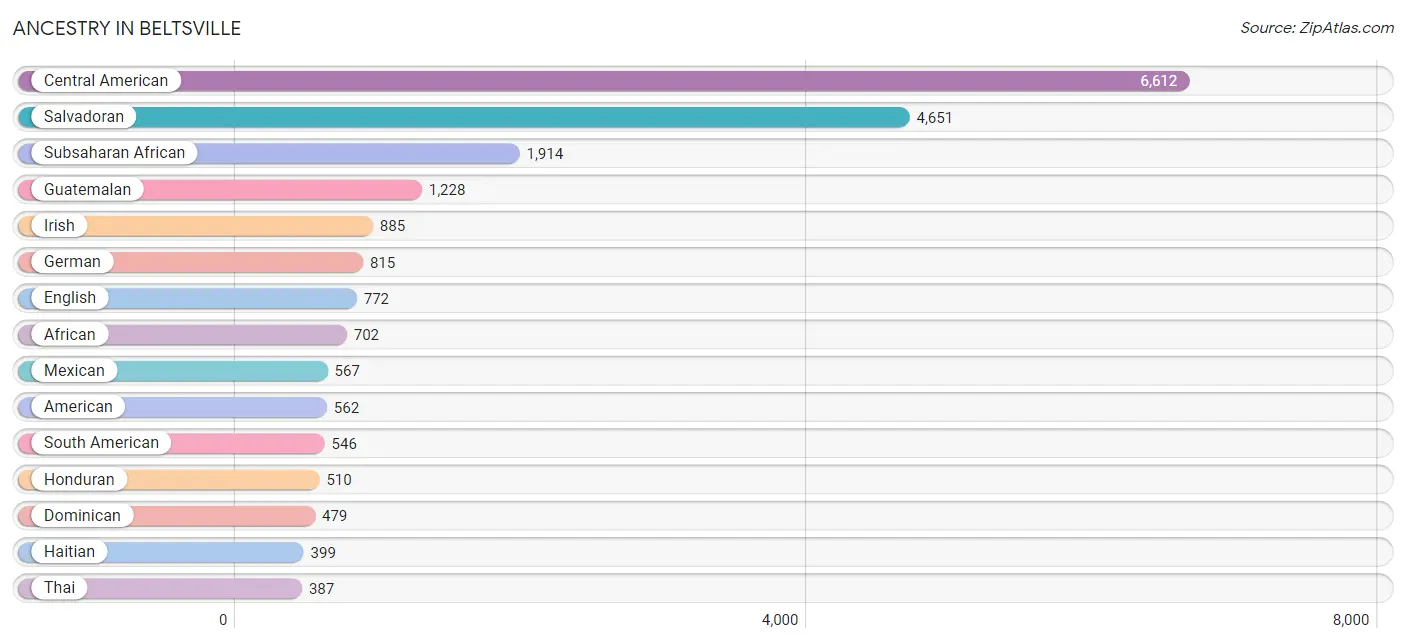
Ancestry in Beltsville
The most populous ancestries reported in Beltsville are Central American (6,612 | 33.6%), Salvadoran (4,651 | 23.6%), Subsaharan African (1,914 | 9.7%), Guatemalan (1,228 | 6.2%), and Irish (885 | 4.5%), together accounting for 77.6% of all Beltsville residents.
| Ancestry | # Population | % Population |
| African | 702 | 3.6% |
| American | 562 | 2.9% |
| Arab | 48 | 0.2% |
| Argentinean | 29 | 0.2% |
| Armenian | 38 | 0.2% |
| Austrian | 18 | 0.1% |
| Belgian | 6 | 0.0% |
| Bermudan | 84 | 0.4% |
| Bhutanese | 27 | 0.1% |
| Brazilian | 57 | 0.3% |
| British | 9 | 0.1% |
| British West Indian | 90 | 0.5% |
| Bulgarian | 22 | 0.1% |
| Burmese | 80 | 0.4% |
| Canadian | 35 | 0.2% |
| Central American | 6,612 | 33.6% |
| Central American Indian | 33 | 0.2% |
| Cherokee | 29 | 0.2% |
| Chilean | 32 | 0.2% |
| Colombian | 264 | 1.3% |
| Cuban | 2 | 0.0% |
| Czech | 11 | 0.1% |
| Danish | 25 | 0.1% |
| Dominican | 479 | 2.4% |
| Dutch | 59 | 0.3% |
| Eastern European | 74 | 0.4% |
| Egyptian | 14 | 0.1% |
| English | 772 | 3.9% |
| Ethiopian | 188 | 0.9% |
| European | 155 | 0.8% |
| Filipino | 50 | 0.3% |
| Finnish | 19 | 0.1% |
| French | 32 | 0.2% |
| German | 815 | 4.1% |
| Ghanaian | 112 | 0.6% |
| Greek | 11 | 0.1% |
| Guatemalan | 1,228 | 6.2% |
| Guyanese | 95 | 0.5% |
| Haitian | 399 | 2.0% |
| Honduran | 510 | 2.6% |
| Hungarian | 6 | 0.0% |
| Icelander | 13 | 0.1% |
| Indian (Asian) | 185 | 0.9% |
| Irish | 885 | 4.5% |
| Italian | 324 | 1.6% |
| Jamaican | 202 | 1.0% |
| Japanese | 209 | 1.1% |
| Jordanian | 26 | 0.1% |
| Korean | 345 | 1.8% |
| Laotian | 7 | 0.0% |
| Latvian | 28 | 0.1% |
| Liberian | 19 | 0.1% |
| Lithuanian | 15 | 0.1% |
| Mexican | 567 | 2.9% |
| Nicaraguan | 223 | 1.1% |
| Nigerian | 229 | 1.2% |
| Northern European | 17 | 0.1% |
| Norwegian | 14 | 0.1% |
| Pennsylvania German | 58 | 0.3% |
| Peruvian | 138 | 0.7% |
| Polish | 235 | 1.2% |
| Puerto Rican | 243 | 1.2% |
| Romanian | 14 | 0.1% |
| Russian | 148 | 0.7% |
| Salvadoran | 4,651 | 23.6% |
| Scotch-Irish | 125 | 0.6% |
| Scottish | 243 | 1.2% |
| Sierra Leonean | 56 | 0.3% |
| Slovak | 40 | 0.2% |
| Slovene | 15 | 0.1% |
| South American | 546 | 2.8% |
| Spaniard | 74 | 0.4% |
| Sri Lankan | 131 | 0.7% |
| Subsaharan African | 1,914 | 9.7% |
| Swedish | 52 | 0.3% |
| Swiss | 19 | 0.1% |
| Thai | 387 | 2.0% |
| Trinidadian and Tobagonian | 137 | 0.7% |
| Ugandan | 10 | 0.1% |
| Ukrainian | 69 | 0.4% |
| Venezuelan | 83 | 0.4% |
| Vietnamese | 63 | 0.3% |
| Welsh | 33 | 0.2% |
| West Indian | 27 | 0.1% | View All 84 Rows |
Immigrants in Beltsville
The most numerous immigrant groups reported in Beltsville came from Latin America (4,862 | 24.7%), Central America (3,632 | 18.4%), El Salvador (2,023 | 10.3%), Africa (1,679 | 8.5%), and Asia (1,105 | 5.6%), together accounting for 67.5% of all Beltsville residents.
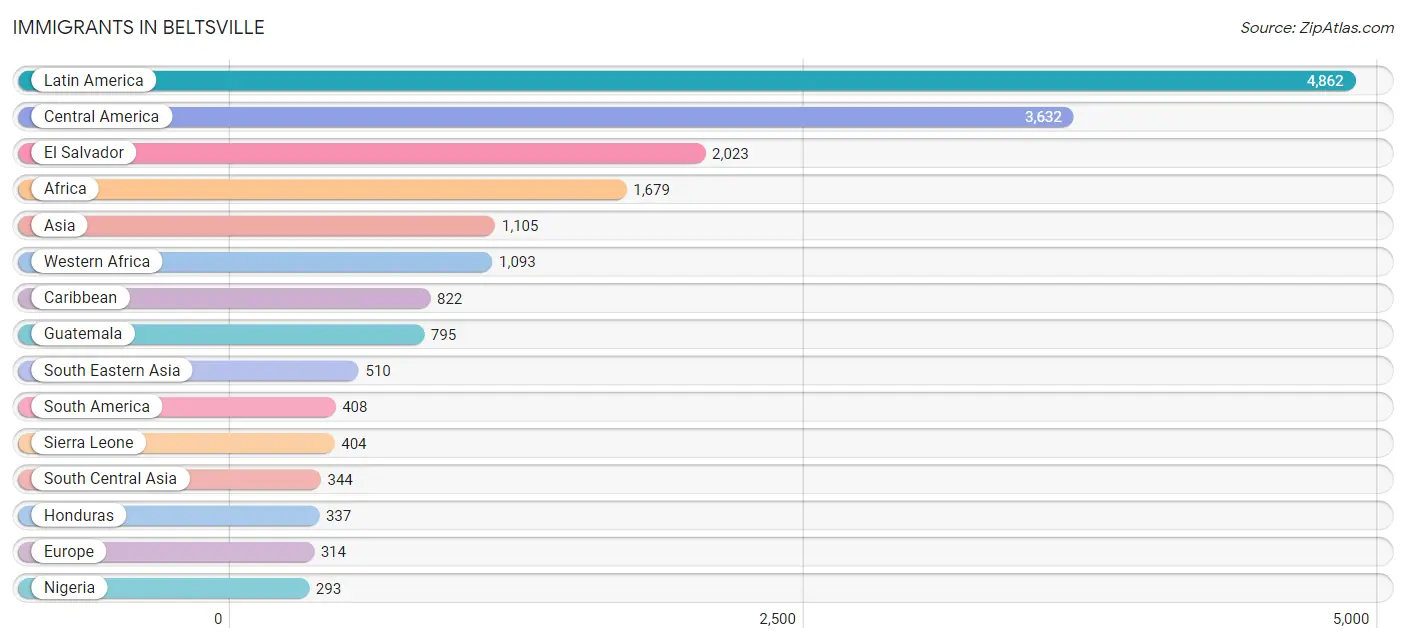
| Immigration Origin | # Population | % Population |
| Africa | 1,679 | 8.5% |
| Argentina | 29 | 0.2% |
| Asia | 1,105 | 5.6% |
| Austria | 12 | 0.1% |
| Bangladesh | 96 | 0.5% |
| Belgium | 6 | 0.0% |
| Brazil | 57 | 0.3% |
| Bulgaria | 31 | 0.2% |
| Cambodia | 121 | 0.6% |
| Cameroon | 242 | 1.2% |
| Canada | 11 | 0.1% |
| Caribbean | 822 | 4.2% |
| Central America | 3,632 | 18.4% |
| Chile | 32 | 0.2% |
| China | 171 | 0.9% |
| Colombia | 86 | 0.4% |
| Czechoslovakia | 26 | 0.1% |
| Dominican Republic | 253 | 1.3% |
| Eastern Africa | 280 | 1.4% |
| Eastern Asia | 234 | 1.2% |
| Eastern Europe | 109 | 0.5% |
| Egypt | 14 | 0.1% |
| El Salvador | 2,023 | 10.3% |
| Eritrea | 27 | 0.1% |
| Ethiopia | 194 | 1.0% |
| Europe | 314 | 1.6% |
| France | 37 | 0.2% |
| Germany | 31 | 0.2% |
| Ghana | 135 | 0.7% |
| Grenada | 18 | 0.1% |
| Guatemala | 795 | 4.0% |
| Guyana | 102 | 0.5% |
| Haiti | 243 | 1.2% |
| Honduras | 337 | 1.7% |
| Hong Kong | 14 | 0.1% |
| India | 202 | 1.0% |
| Indonesia | 7 | 0.0% |
| Iraq | 8 | 0.0% |
| Ireland | 19 | 0.1% |
| Italy | 81 | 0.4% |
| Jamaica | 201 | 1.0% |
| Japan | 18 | 0.1% |
| Kenya | 13 | 0.1% |
| Korea | 45 | 0.2% |
| Latin America | 4,862 | 24.7% |
| Liberia | 19 | 0.1% |
| Mexico | 263 | 1.3% |
| Middle Africa | 242 | 1.2% |
| Nicaragua | 214 | 1.1% |
| Nigeria | 293 | 1.5% |
| Northern Africa | 14 | 0.1% |
| Northern Europe | 33 | 0.2% |
| Pakistan | 46 | 0.2% |
| Peru | 93 | 0.5% |
| Philippines | 216 | 1.1% |
| Poland | 12 | 0.1% |
| Russia | 24 | 0.1% |
| Senegal | 112 | 0.6% |
| Sierra Leone | 404 | 2.1% |
| South America | 408 | 2.1% |
| South Central Asia | 344 | 1.8% |
| South Eastern Asia | 510 | 2.6% |
| Southern Europe | 81 | 0.4% |
| Switzerland | 5 | 0.0% |
| Taiwan | 25 | 0.1% |
| Trinidad and Tobago | 86 | 0.4% |
| Uganda | 10 | 0.1% |
| Vietnam | 89 | 0.4% |
| Western Africa | 1,093 | 5.6% |
| Western Asia | 17 | 0.1% |
| Western Europe | 91 | 0.5% | View All 71 Rows |
Sex and Age in Beltsville
Sex and Age in Beltsville
The most populous age groups in Beltsville are 5 to 9 Years (965 | 10.3%) for men and 85 Years and over (848 | 8.2%) for women.
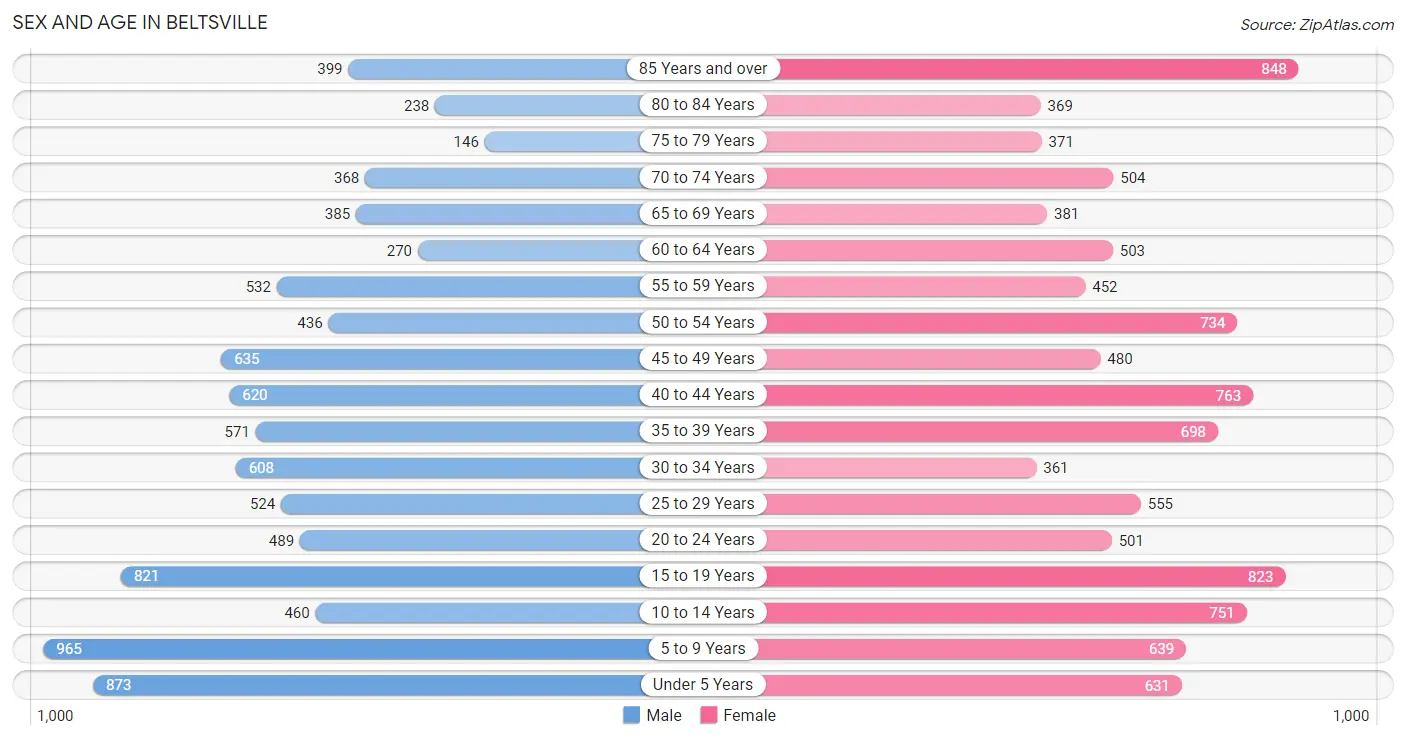
| Age Bracket | Male | Female |
| Under 5 Years | 873 (9.3%) | 631 (6.1%) |
| 5 to 9 Years | 965 (10.3%) | 639 (6.2%) |
| 10 to 14 Years | 460 (4.9%) | 751 (7.2%) |
| 15 to 19 Years | 821 (8.8%) | 823 (7.9%) |
| 20 to 24 Years | 489 (5.2%) | 501 (4.8%) |
| 25 to 29 Years | 524 (5.6%) | 555 (5.4%) |
| 30 to 34 Years | 608 (6.5%) | 361 (3.5%) |
| 35 to 39 Years | 571 (6.1%) | 698 (6.7%) |
| 40 to 44 Years | 620 (6.6%) | 763 (7.4%) |
| 45 to 49 Years | 635 (6.8%) | 480 (4.6%) |
| 50 to 54 Years | 436 (4.7%) | 734 (7.1%) |
| 55 to 59 Years | 532 (5.7%) | 452 (4.4%) |
| 60 to 64 Years | 270 (2.9%) | 503 (4.9%) |
| 65 to 69 Years | 385 (4.1%) | 381 (3.7%) |
| 70 to 74 Years | 368 (3.9%) | 504 (4.9%) |
| 75 to 79 Years | 146 (1.6%) | 371 (3.6%) |
| 80 to 84 Years | 238 (2.5%) | 369 (3.6%) |
| 85 Years and over | 399 (4.3%) | 848 (8.2%) |
| Total | 9,340 (100.0%) | 10,364 (100.0%) |
Families and Households in Beltsville
Median Family Size in Beltsville
The median family size in Beltsville is 3.97 persons per family, with married-couple families (2,784 | 69.1%) accounting for the largest median family size of 4.03 persons per family. On the other hand, single male/father families (385 | 9.6%) represent the smallest median family size with 3.81 persons per family.
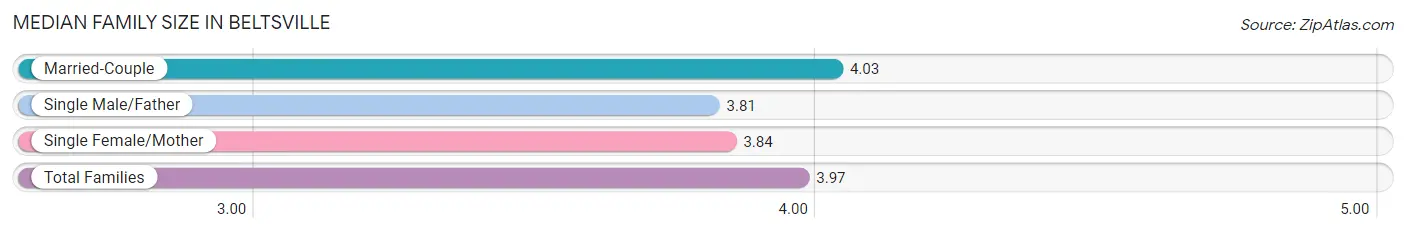
| Family Type | # Families | Family Size |
| Married-Couple | 2,784 (69.1%) | 4.03 |
| Single Male/Father | 385 (9.6%) | 3.81 |
| Single Female/Mother | 863 (21.4%) | 3.84 |
| Total Families | 4,032 (100.0%) | 3.97 |
Median Household Size in Beltsville
The median household size in Beltsville is 3.09 persons per household, with single male/father households (385 | 6.1%) accounting for the largest median household size of 4.31 persons per household. non-family households (2,245 | 35.8%) represent the smallest median household size with 1.22 persons per household.
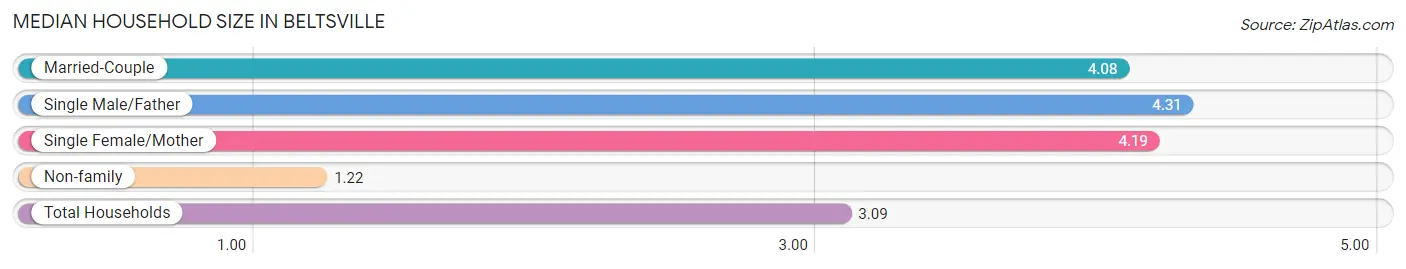
| Household Type | # Households | Household Size |
| Married-Couple | 2,784 (44.4%) | 4.08 |
| Single Male/Father | 385 (6.1%) | 4.31 |
| Single Female/Mother | 863 (13.8%) | 4.19 |
| Non-family | 2,245 (35.8%) | 1.22 |
| Total Households | 6,277 (100.0%) | 3.09 |
Household Size by Marriage Status in Beltsville
Out of a total of 6,277 households in Beltsville, 4,032 (64.2%) are family households, while 2,245 (35.8%) are nonfamily households. The most numerous type of family households are 2-person households, comprising 1,351, and the most common type of nonfamily households are 1-person households, comprising 1,955.
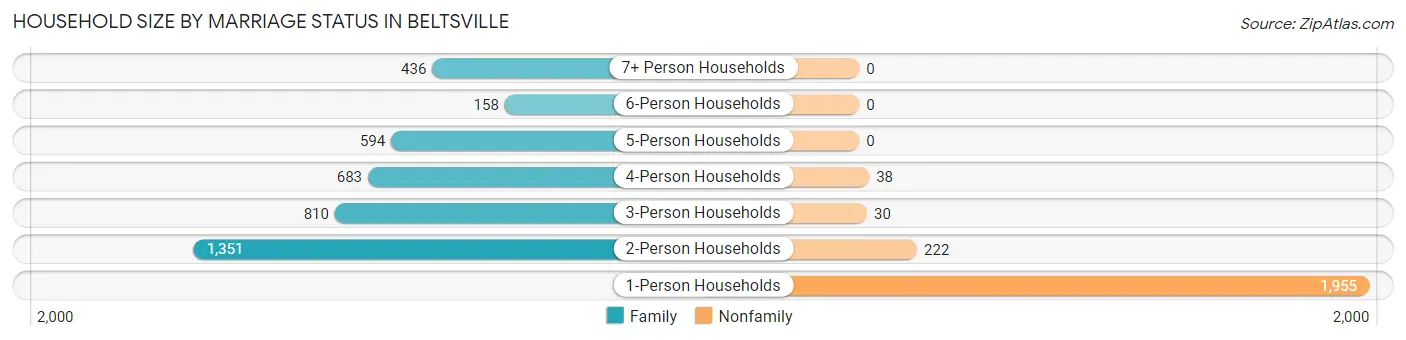
| Household Size | Family Households | Nonfamily Households |
| 1-Person Households | - | 1,955 (31.1%) |
| 2-Person Households | 1,351 (21.5%) | 222 (3.5%) |
| 3-Person Households | 810 (12.9%) | 30 (0.5%) |
| 4-Person Households | 683 (10.9%) | 38 (0.6%) |
| 5-Person Households | 594 (9.5%) | 0 (0.0%) |
| 6-Person Households | 158 (2.5%) | 0 (0.0%) |
| 7+ Person Households | 436 (7.0%) | 0 (0.0%) |
| Total | 4,032 (64.2%) | 2,245 (35.8%) |
Female Fertility in Beltsville
Fertility by Age in Beltsville
Average fertility rate in Beltsville is 60.0 births per 1,000 women. Women in the age bracket of 20 to 34 years have the highest fertility rate with 118.0 births per 1,000 women. Women in the age bracket of 20 to 34 years acount for 64.5% of all women with births.
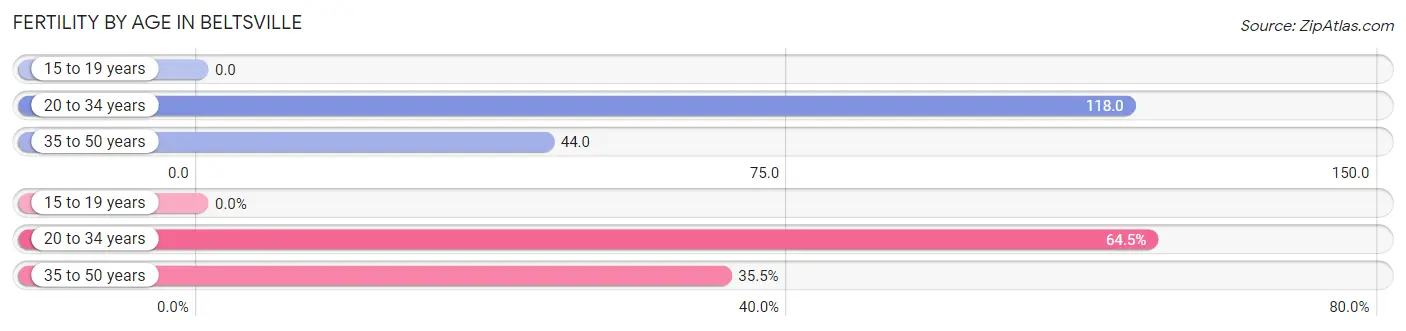
| Age Bracket | Women with Births | Births / 1,000 Women |
| 15 to 19 years | 0 (0.0%) | 0.0 |
| 20 to 34 years | 167 (64.5%) | 118.0 |
| 35 to 50 years | 92 (35.5%) | 44.0 |
| Total | 259 (100.0%) | 60.0 |
Fertility by Age by Marriage Status in Beltsville
69.9% of women with births (259) in Beltsville are married. The highest percentage of unmarried women with births falls into 35 to 50 years age bracket with 39.1% of them unmarried at the time of birth, while the lowest percentage of unmarried women with births belong to 20 to 34 years age bracket with 25.1% of them unmarried.
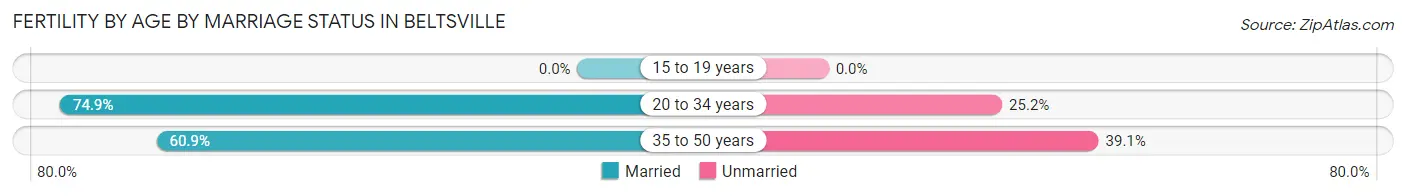
| Age Bracket | Married | Unmarried |
| 15 to 19 years | 0 (0.0%) | 0 (0.0%) |
| 20 to 34 years | 125 (74.9%) | 42 (25.2%) |
| 35 to 50 years | 56 (60.9%) | 36 (39.1%) |
| Total | 181 (69.9%) | 78 (30.1%) |
Fertility by Education in Beltsville
Average fertility rate in Beltsville is 60.0 births per 1,000 women. Women with the education attainment of graduate degree have the highest fertility rate of 78.0 births per 1,000 women, while women with the education attainment of high school diploma have the lowest fertility at 13.0 births per 1,000 women. Women with the education attainment of college or associate's degree represent 33.6% of all women with births.
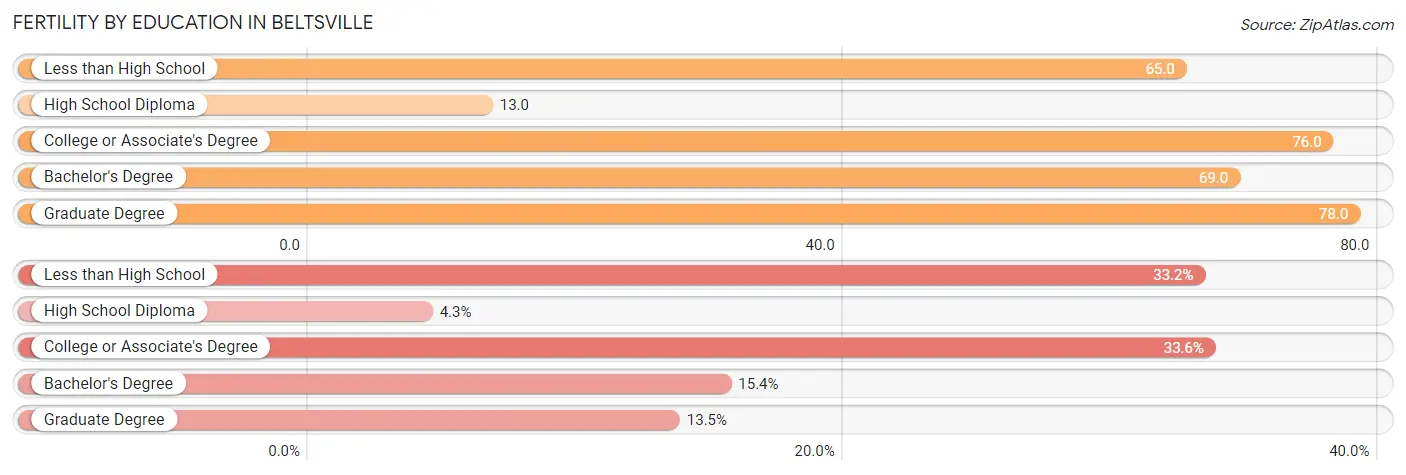
| Educational Attainment | Women with Births | Births / 1,000 Women |
| Less than High School | 86 (33.2%) | 65.0 |
| High School Diploma | 11 (4.3%) | 13.0 |
| College or Associate's Degree | 87 (33.6%) | 76.0 |
| Bachelor's Degree | 40 (15.4%) | 69.0 |
| Graduate Degree | 35 (13.5%) | 78.0 |
| Total | 259 (100.0%) | 60.0 |
Fertility by Education by Marriage Status in Beltsville
30.1% of women with births in Beltsville are unmarried. Women with the educational attainment of high school diploma are most likely to be married with 100.0% of them married at childbirth, while women with the educational attainment of less than high school are least likely to be married with 55.8% of them unmarried at childbirth.
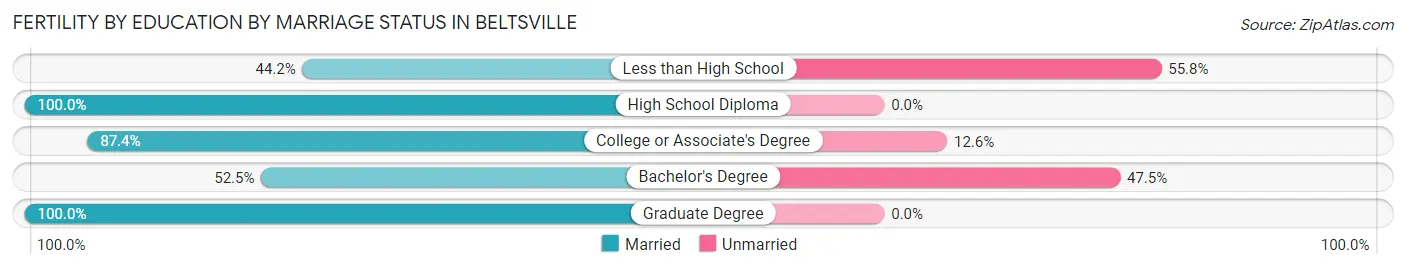
| Educational Attainment | Married | Unmarried |
| Less than High School | 38 (44.2%) | 48 (55.8%) |
| High School Diploma | 11 (100.0%) | 0 (0.0%) |
| College or Associate's Degree | 76 (87.4%) | 11 (12.6%) |
| Bachelor's Degree | 21 (52.5%) | 19 (47.5%) |
| Graduate Degree | 35 (100.0%) | 0 (0.0%) |
| Total | 181 (69.9%) | 78 (30.1%) |
Employment Characteristics in Beltsville
Employment by Class of Employer in Beltsville
Among the 8,795 employed individuals in Beltsville, private company employees (5,550 | 63.1%), not-for-profit organizations (905 | 10.3%), and self-employed (not incorporated) (652 | 7.4%) make up the most common classes of employment.
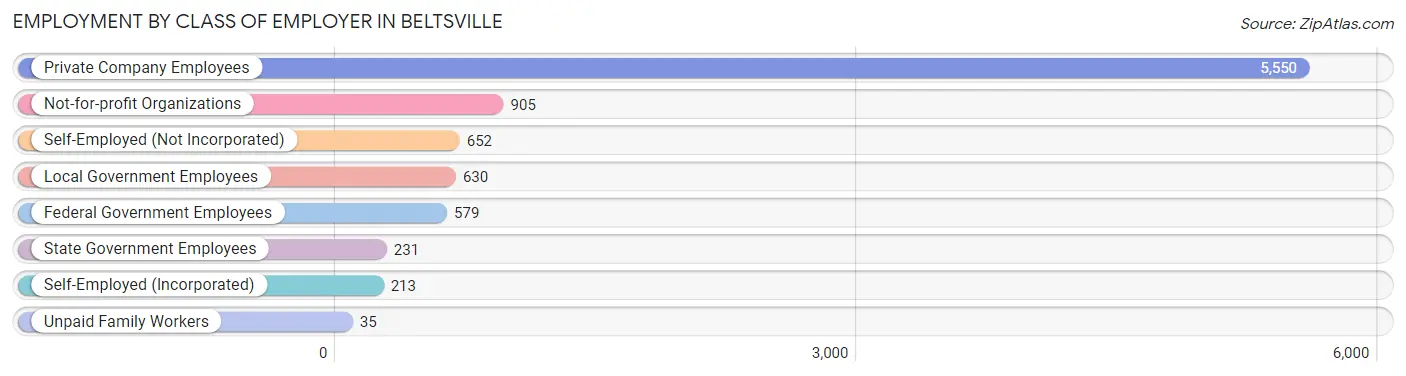
| Employer Class | # Employees | % Employees |
| Private Company Employees | 5,550 | 63.1% |
| Self-Employed (Incorporated) | 213 | 2.4% |
| Self-Employed (Not Incorporated) | 652 | 7.4% |
| Not-for-profit Organizations | 905 | 10.3% |
| Local Government Employees | 630 | 7.2% |
| State Government Employees | 231 | 2.6% |
| Federal Government Employees | 579 | 6.6% |
| Unpaid Family Workers | 35 | 0.4% |
| Total | 8,795 | 100.0% |
Employment Status by Age in Beltsville
According to the labor force statistics for Beltsville, out of the total population over 16 years of age (15,075), 65.1% or 9,814 individuals are in the labor force, with 7.9% or 775 of them unemployed. The age group with the highest labor force participation rate is 25 to 29 years, with 95.1% or 1,026 individuals in the labor force. Within the labor force, the 20 to 24 years age range has the highest percentage of unemployed individuals, with 14.7% or 104 of them being unemployed.
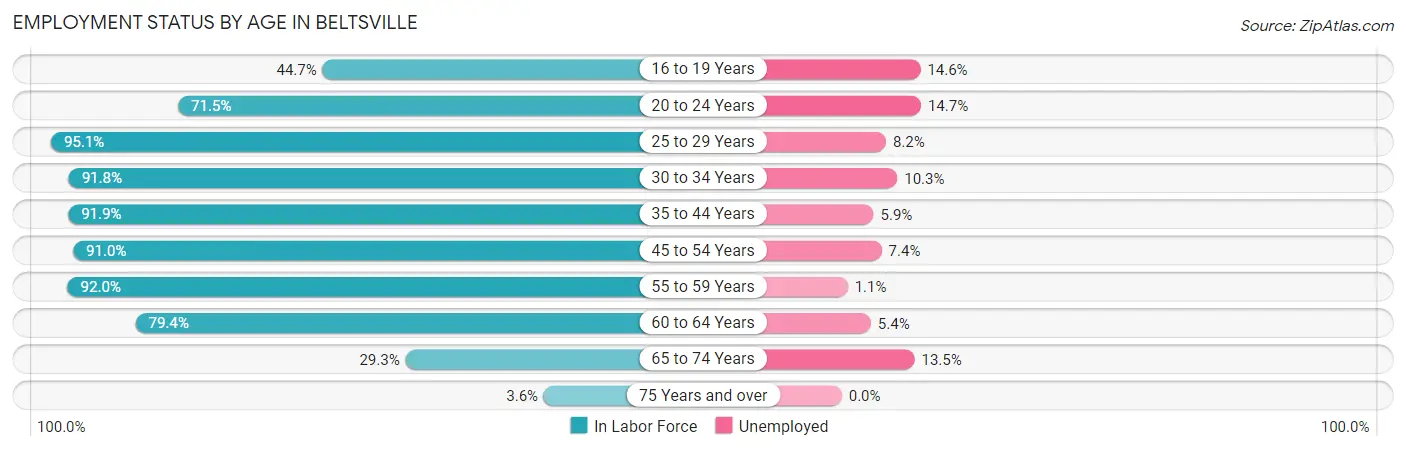
| Age Bracket | In Labor Force | Unemployed |
| 16 to 19 Years | 596 (44.7%) | 87 (14.6%) |
| 20 to 24 Years | 708 (71.5%) | 104 (14.7%) |
| 25 to 29 Years | 1,026 (95.1%) | 84 (8.2%) |
| 30 to 34 Years | 890 (91.8%) | 92 (10.3%) |
| 35 to 44 Years | 2,437 (91.9%) | 144 (5.9%) |
| 45 to 54 Years | 2,079 (91.0%) | 154 (7.4%) |
| 55 to 59 Years | 905 (92.0%) | 10 (1.1%) |
| 60 to 64 Years | 614 (79.4%) | 33 (5.4%) |
| 65 to 74 Years | 480 (29.3%) | 65 (13.5%) |
| 75 Years and over | 85 (3.6%) | 0 (0.0%) |
| Total | 9,814 (65.1%) | 775 (7.9%) |
Employment Status by Educational Attainment in Beltsville
According to labor force statistics for Beltsville, 91.0% of individuals (7,955) out of the total population between 25 and 64 years of age (8,742) are in the labor force, with 6.5% or 517 of them being unemployed. The group with the highest labor force participation rate are those with the educational attainment of bachelor's degree or higher, with 95.0% or 2,221 individuals in the labor force. Within the labor force, individuals with high school diploma education have the highest percentage of unemployment, with 13.4% or 272 of them being unemployed.
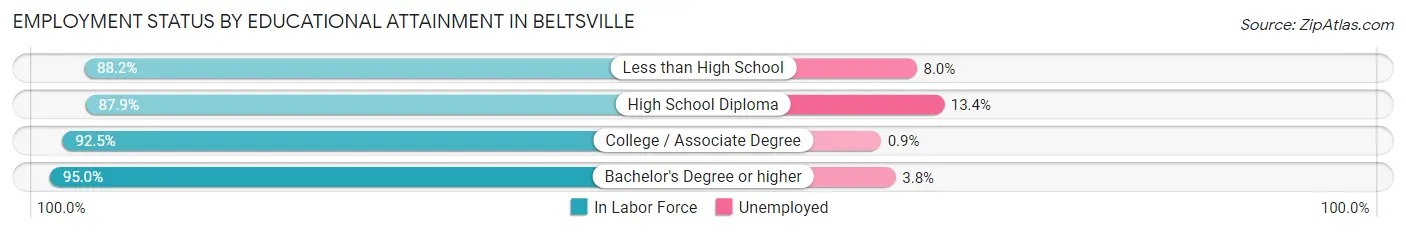
| Educational Attainment | In Labor Force | Unemployed |
| Less than High School | 1,765 (88.2%) | 160 (8.0%) |
| High School Diploma | 2,030 (87.9%) | 310 (13.4%) |
| College / Associate Degree | 1,936 (92.5%) | 19 (0.9%) |
| Bachelor's Degree or higher | 2,221 (95.0%) | 89 (3.8%) |
| Total | 7,955 (91.0%) | 568 (6.5%) |
Employment Occupations by Sex in Beltsville
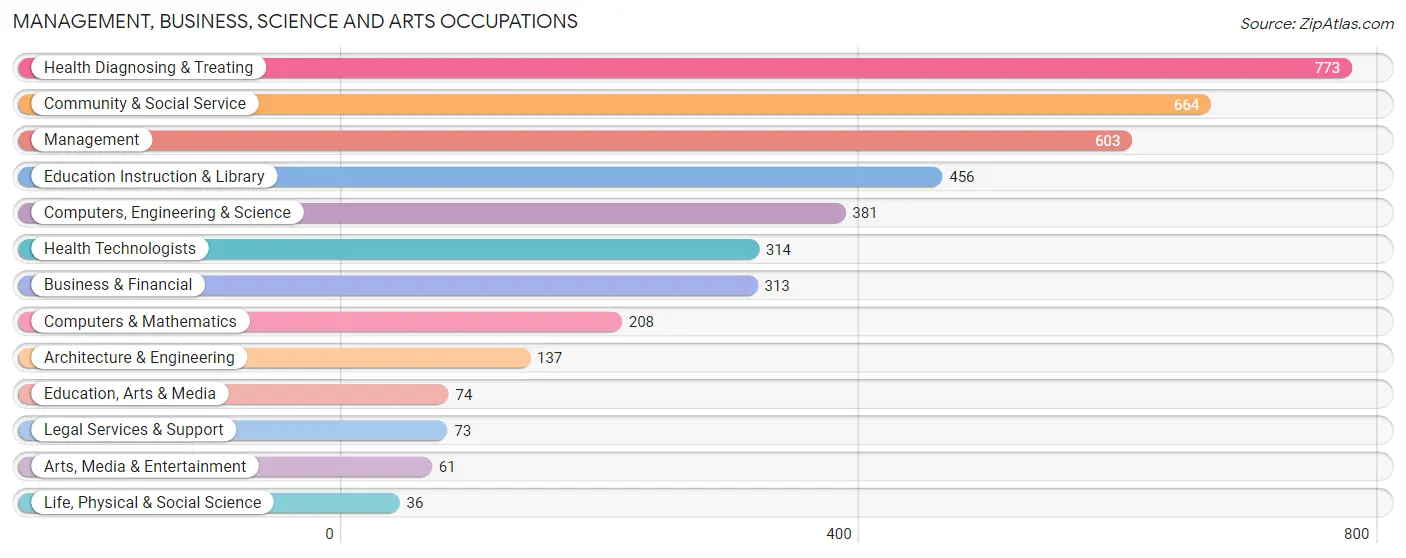
Management, Business, Science and Arts Occupations
The most common Management, Business, Science and Arts occupations in Beltsville are Health Diagnosing & Treating (773 | 8.6%), Community & Social Service (664 | 7.3%), Management (603 | 6.7%), Education Instruction & Library (456 | 5.1%), and Computers, Engineering & Science (381 | 4.2%).
Management, Business, Science and Arts Occupations by Sex
Within the Management, Business, Science and Arts occupations in Beltsville, the most male-oriented occupations are Architecture & Engineering (84.7%), Education, Arts & Media (75.7%), and Computers & Mathematics (69.2%), while the most female-oriented occupations are Life, Physical & Social Science (100.0%), Health Technologists (95.2%), and Health Diagnosing & Treating (89.0%).
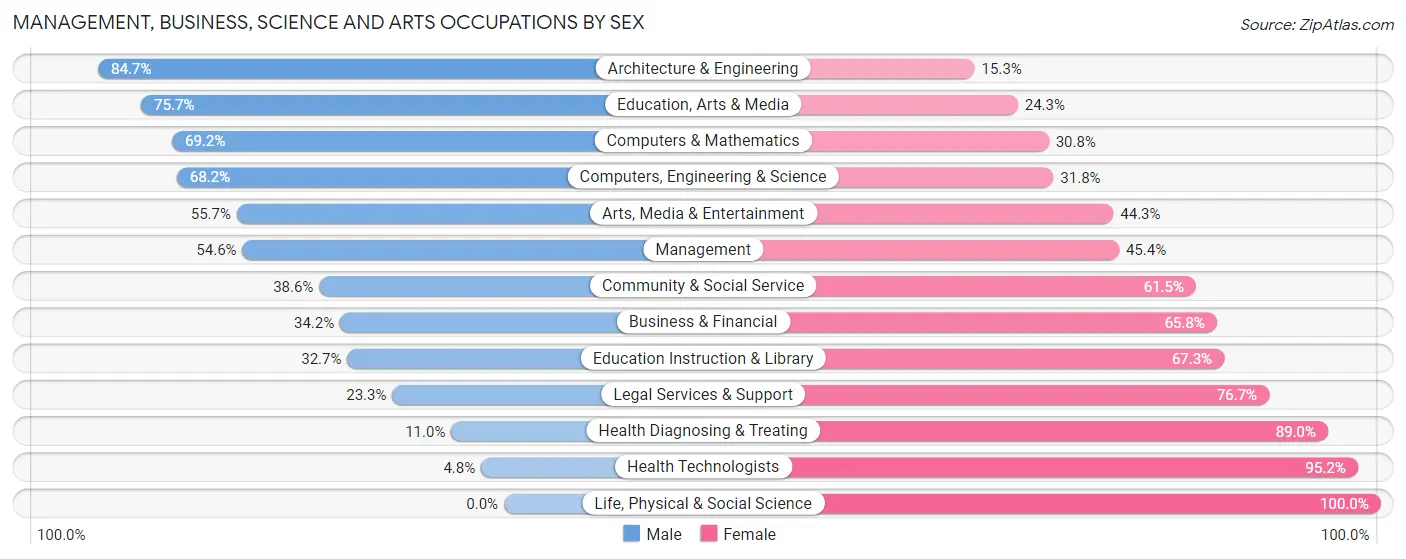
| Occupation | Male | Female |
| Management | 329 (54.6%) | 274 (45.4%) |
| Business & Financial | 107 (34.2%) | 206 (65.8%) |
| Computers, Engineering & Science | 260 (68.2%) | 121 (31.8%) |
| Computers & Mathematics | 144 (69.2%) | 64 (30.8%) |
| Architecture & Engineering | 116 (84.7%) | 21 (15.3%) |
| Life, Physical & Social Science | 0 (0.0%) | 36 (100.0%) |
| Community & Social Service | 256 (38.6%) | 408 (61.5%) |
| Education, Arts & Media | 56 (75.7%) | 18 (24.3%) |
| Legal Services & Support | 17 (23.3%) | 56 (76.7%) |
| Education Instruction & Library | 149 (32.7%) | 307 (67.3%) |
| Arts, Media & Entertainment | 34 (55.7%) | 27 (44.3%) |
| Health Diagnosing & Treating | 85 (11.0%) | 688 (89.0%) |
| Health Technologists | 15 (4.8%) | 299 (95.2%) |
| Total (Category) | 1,037 (37.9%) | 1,697 (62.1%) |
| Total (Overall) | 4,476 (49.6%) | 4,556 (50.4%) |
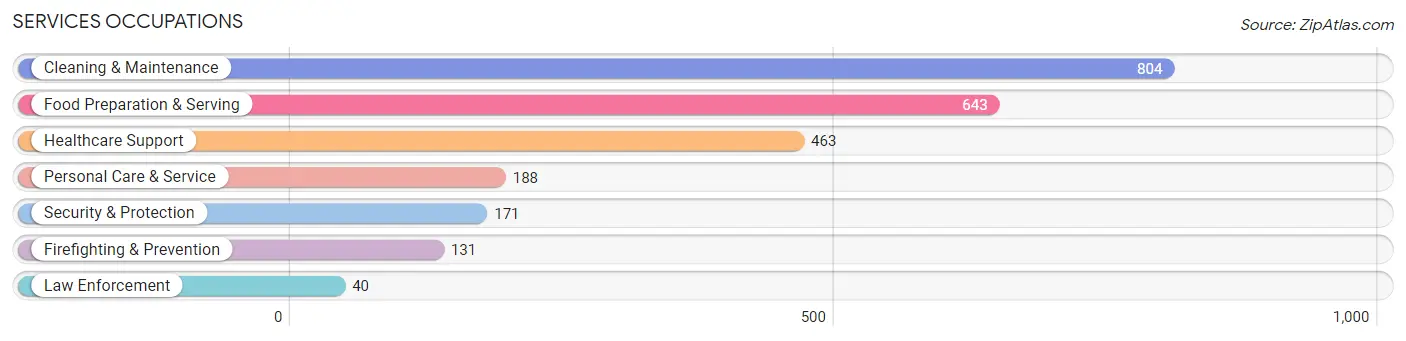
Services Occupations
The most common Services occupations in Beltsville are Cleaning & Maintenance (804 | 8.9%), Food Preparation & Serving (643 | 7.1%), Healthcare Support (463 | 5.1%), Personal Care & Service (188 | 2.1%), and Security & Protection (171 | 1.9%).
Services Occupations by Sex
Within the Services occupations in Beltsville, the most male-oriented occupations are Law Enforcement (62.5%), Security & Protection (62.0%), and Firefighting & Prevention (61.8%), while the most female-oriented occupations are Personal Care & Service (100.0%), Food Preparation & Serving (58.6%), and Healthcare Support (57.7%).
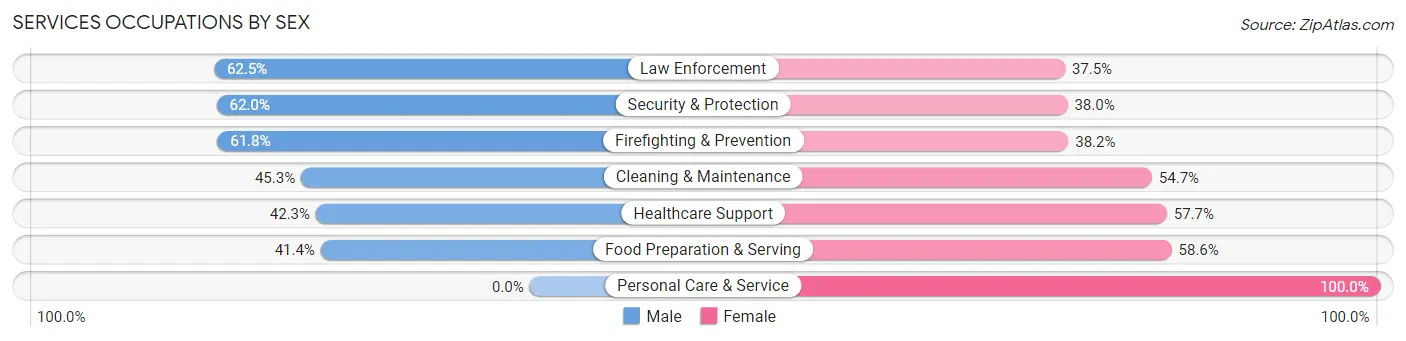
| Occupation | Male | Female |
| Healthcare Support | 196 (42.3%) | 267 (57.7%) |
| Security & Protection | 106 (62.0%) | 65 (38.0%) |
| Firefighting & Prevention | 81 (61.8%) | 50 (38.2%) |
| Law Enforcement | 25 (62.5%) | 15 (37.5%) |
| Food Preparation & Serving | 266 (41.4%) | 377 (58.6%) |
| Cleaning & Maintenance | 364 (45.3%) | 440 (54.7%) |
| Personal Care & Service | 0 (0.0%) | 188 (100.0%) |
| Total (Category) | 932 (41.1%) | 1,337 (58.9%) |
| Total (Overall) | 4,476 (49.6%) | 4,556 (50.4%) |
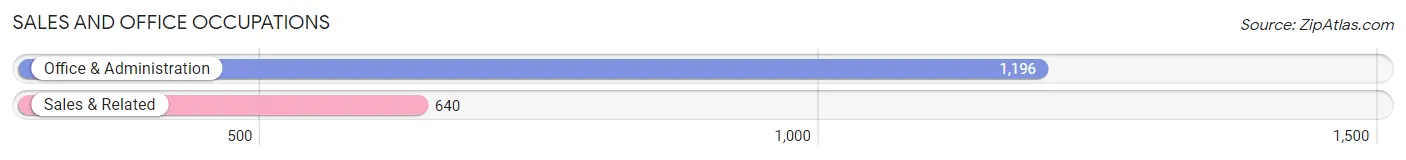
Sales and Office Occupations
The most common Sales and Office occupations in Beltsville are Office & Administration (1,196 | 13.2%), and Sales & Related (640 | 7.1%).
Sales and Office Occupations by Sex
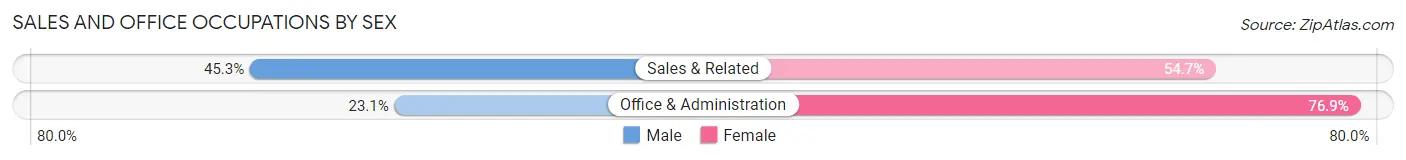
| Occupation | Male | Female |
| Sales & Related | 290 (45.3%) | 350 (54.7%) |
| Office & Administration | 276 (23.1%) | 920 (76.9%) |
| Total (Category) | 566 (30.8%) | 1,270 (69.2%) |
| Total (Overall) | 4,476 (49.6%) | 4,556 (50.4%) |
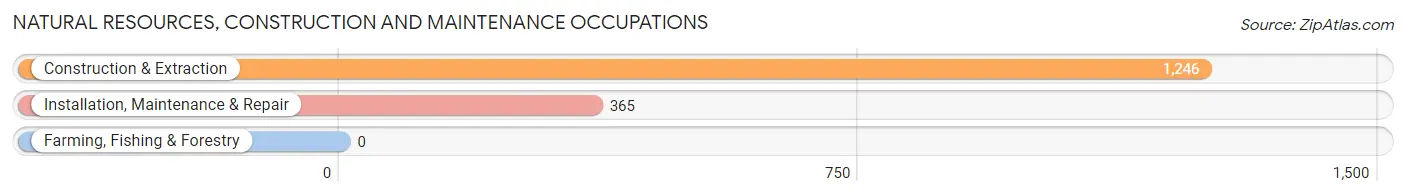
Natural Resources, Construction and Maintenance Occupations
The most common Natural Resources, Construction and Maintenance occupations in Beltsville are Construction & Extraction (1,246 | 13.8%), and Installation, Maintenance & Repair (365 | 4.0%).
Natural Resources, Construction and Maintenance Occupations by Sex
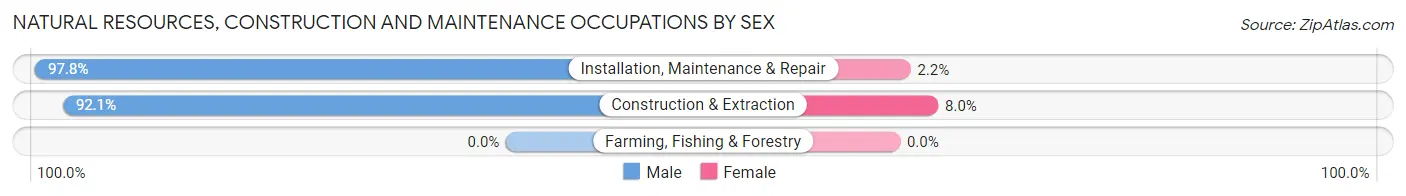
| Occupation | Male | Female |
| Farming, Fishing & Forestry | 0 (0.0%) | 0 (0.0%) |
| Construction & Extraction | 1,147 (92.0%) | 99 (8.0%) |
| Installation, Maintenance & Repair | 357 (97.8%) | 8 (2.2%) |
| Total (Category) | 1,504 (93.4%) | 107 (6.6%) |
| Total (Overall) | 4,476 (49.6%) | 4,556 (50.4%) |
Production, Transportation and Moving Occupations
The most common Production, Transportation and Moving occupations in Beltsville are Transportation (274 | 3.0%), Material Moving (220 | 2.4%), and Production (88 | 1.0%).
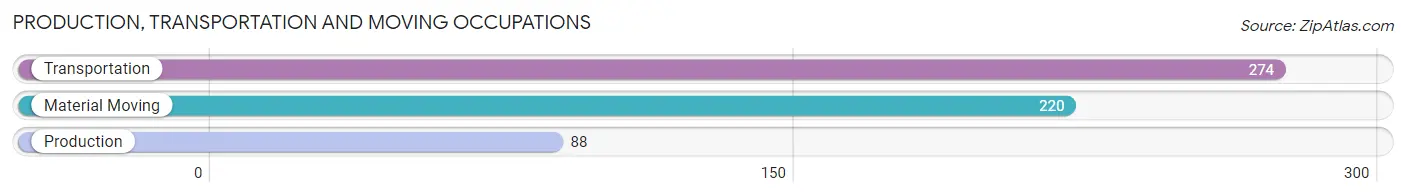
Production, Transportation and Moving Occupations by Sex
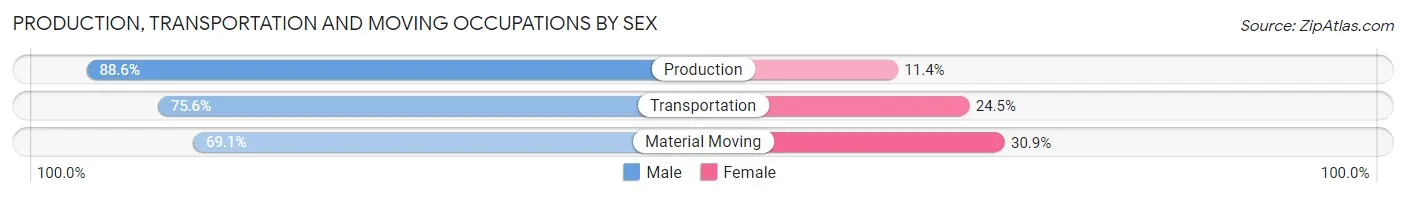
| Occupation | Male | Female |
| Production | 78 (88.6%) | 10 (11.4%) |
| Transportation | 207 (75.5%) | 67 (24.4%) |
| Material Moving | 152 (69.1%) | 68 (30.9%) |
| Total (Category) | 437 (75.1%) | 145 (24.9%) |
| Total (Overall) | 4,476 (49.6%) | 4,556 (50.4%) |
Employment Industries by Sex in Beltsville
Employment Industries in Beltsville
The major employment industries in Beltsville include Construction (1,500 | 16.6%), Health Care & Social Assistance (1,406 | 15.6%), Retail Trade (1,006 | 11.1%), Accommodation & Food Services (751 | 8.3%), and Administrative & Support (731 | 8.1%).
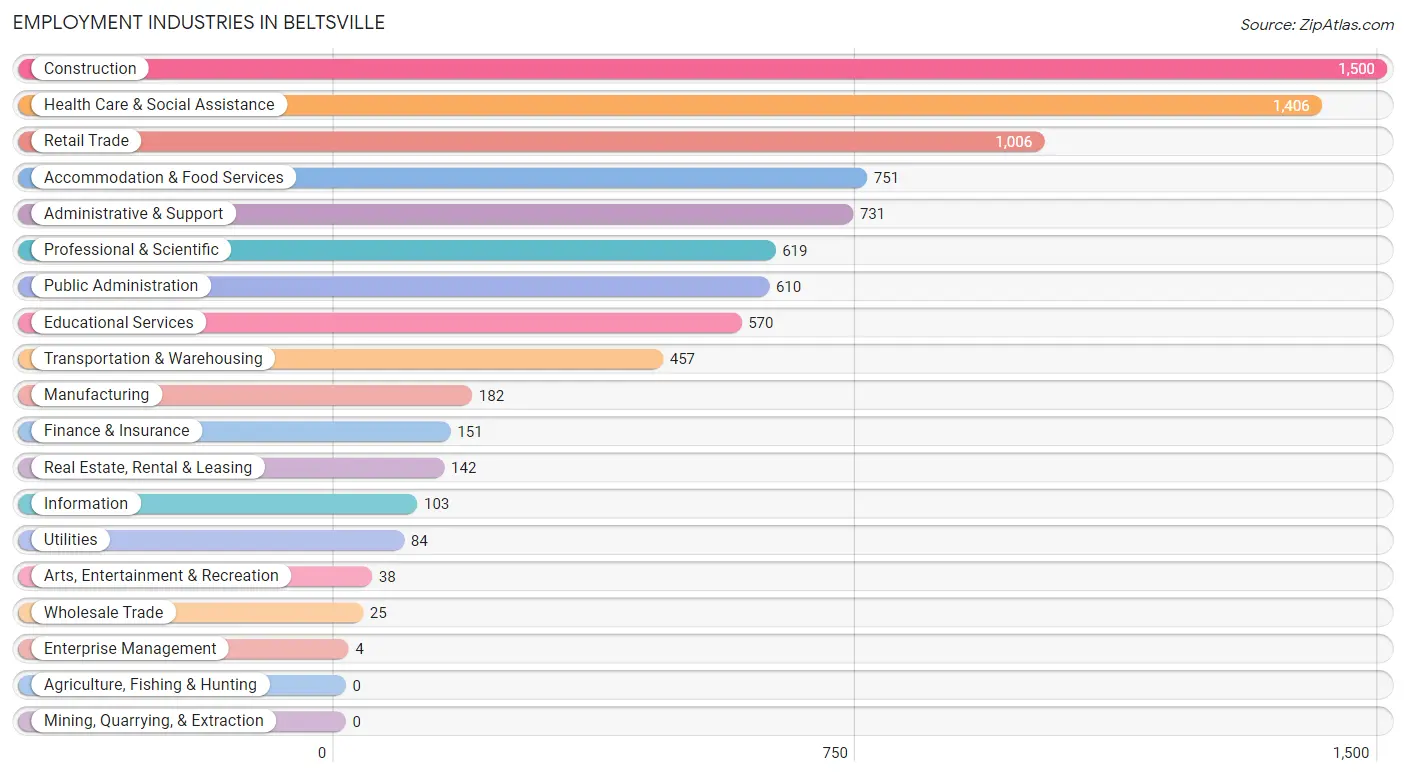
Employment Industries by Sex in Beltsville
The Beltsville industries that see more men than women are Enterprise Management (100.0%), Construction (86.9%), and Wholesale Trade (76.0%), whereas the industries that tend to have a higher number of women are Educational Services (84.9%), Health Care & Social Assistance (77.4%), and Accommodation & Food Services (65.5%).
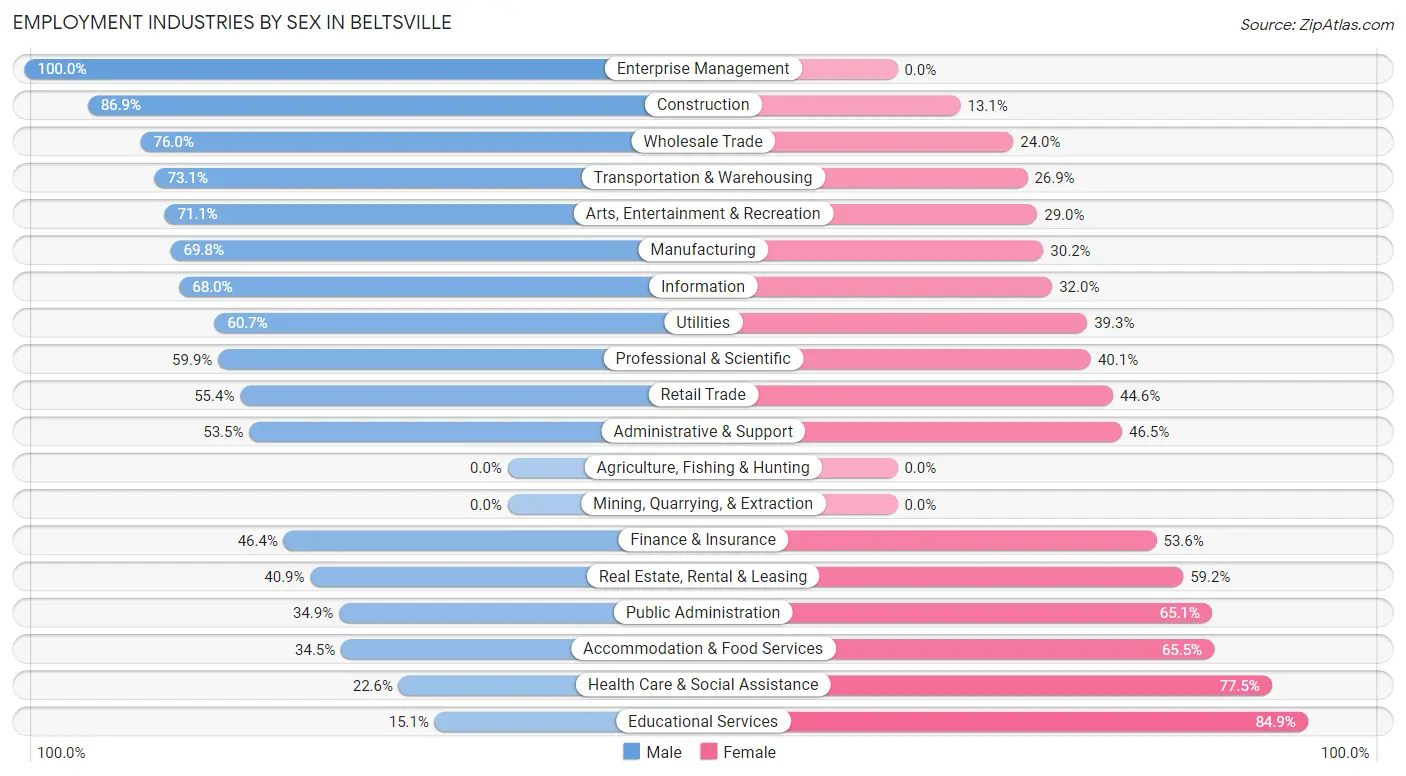
| Industry | Male | Female |
| Agriculture, Fishing & Hunting | 0 (0.0%) | 0 (0.0%) |
| Mining, Quarrying, & Extraction | 0 (0.0%) | 0 (0.0%) |
| Construction | 1,304 (86.9%) | 196 (13.1%) |
| Manufacturing | 127 (69.8%) | 55 (30.2%) |
| Wholesale Trade | 19 (76.0%) | 6 (24.0%) |
| Retail Trade | 557 (55.4%) | 449 (44.6%) |
| Transportation & Warehousing | 334 (73.1%) | 123 (26.9%) |
| Utilities | 51 (60.7%) | 33 (39.3%) |
| Information | 70 (68.0%) | 33 (32.0%) |
| Finance & Insurance | 70 (46.4%) | 81 (53.6%) |
| Real Estate, Rental & Leasing | 58 (40.8%) | 84 (59.2%) |
| Professional & Scientific | 371 (59.9%) | 248 (40.1%) |
| Enterprise Management | 4 (100.0%) | 0 (0.0%) |
| Administrative & Support | 391 (53.5%) | 340 (46.5%) |
| Educational Services | 86 (15.1%) | 484 (84.9%) |
| Health Care & Social Assistance | 317 (22.6%) | 1,089 (77.4%) |
| Arts, Entertainment & Recreation | 27 (71.1%) | 11 (28.9%) |
| Accommodation & Food Services | 259 (34.5%) | 492 (65.5%) |
| Public Administration | 213 (34.9%) | 397 (65.1%) |
| Total | 4,476 (49.6%) | 4,556 (50.4%) |
Education in Beltsville
School Enrollment in Beltsville
The most common levels of schooling among the 5,697 students in Beltsville are elementary school (1,464 | 25.7%), high school (1,434 | 25.2%), and college / undergraduate (1,062 | 18.6%).
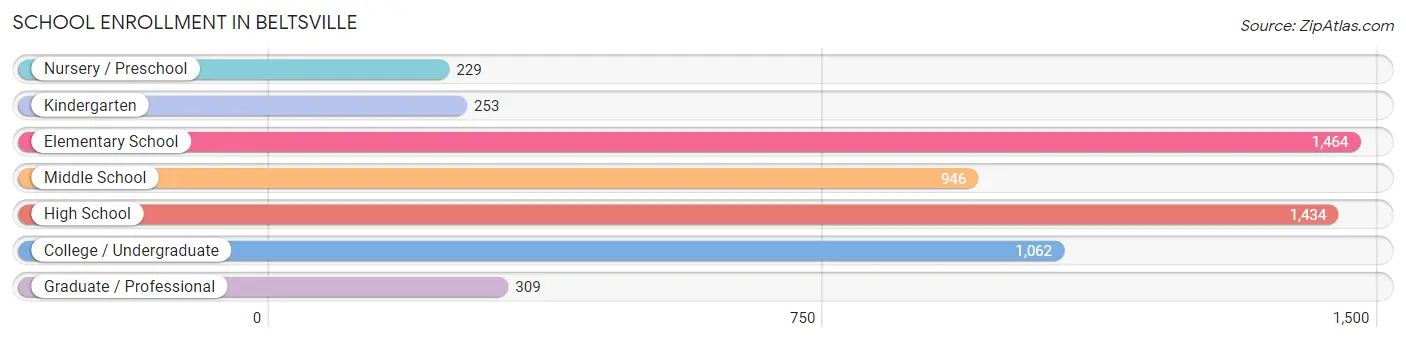
| School Level | # Students | % Students |
| Nursery / Preschool | 229 | 4.0% |
| Kindergarten | 253 | 4.4% |
| Elementary School | 1,464 | 25.7% |
| Middle School | 946 | 16.6% |
| High School | 1,434 | 25.2% |
| College / Undergraduate | 1,062 | 18.6% |
| Graduate / Professional | 309 | 5.4% |
| Total | 5,697 | 100.0% |
School Enrollment by Age by Funding Source in Beltsville
Out of a total of 5,697 students who are enrolled in schools in Beltsville, 809 (14.2%) attend a private institution, while the remaining 4,888 (85.8%) are enrolled in public schools. The age group of 3 to 4 year olds has the highest likelihood of being enrolled in private schools, with 118 (57.8% in the age bracket) enrolled. Conversely, the age group of 15 to 17 year olds has the lowest likelihood of being enrolled in a private school, with 880 (100.0% in the age bracket) attending a public institution.
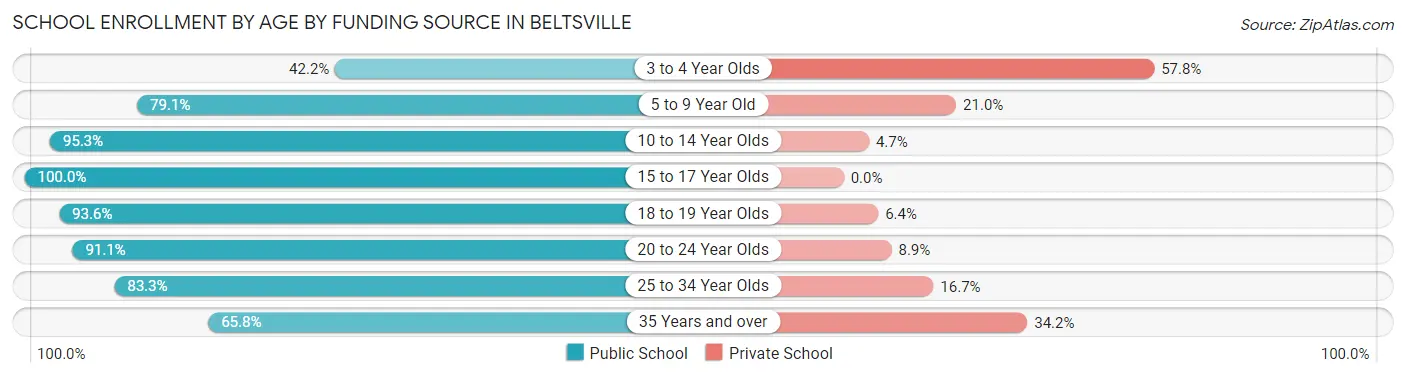
| Age Bracket | Public School | Private School |
| 3 to 4 Year Olds | 86 (42.2%) | 118 (57.8%) |
| 5 to 9 Year Old | 1,268 (79.0%) | 336 (20.9%) |
| 10 to 14 Year Olds | 1,113 (95.3%) | 55 (4.7%) |
| 15 to 17 Year Olds | 880 (100.0%) | 0 (0.0%) |
| 18 to 19 Year Olds | 524 (93.6%) | 36 (6.4%) |
| 20 to 24 Year Olds | 439 (91.1%) | 43 (8.9%) |
| 25 to 34 Year Olds | 254 (83.3%) | 51 (16.7%) |
| 35 Years and over | 325 (65.8%) | 169 (34.2%) |
| Total | 4,888 (85.8%) | 809 (14.2%) |
Educational Attainment by Field of Study in Beltsville
Business (717 | 15.8%), education (458 | 10.1%), computers & mathematics (421 | 9.3%), science & technology (419 | 9.2%), and social sciences (409 | 9.0%) are the most common fields of study among 4,538 individuals in Beltsville who have obtained a bachelor's degree or higher.
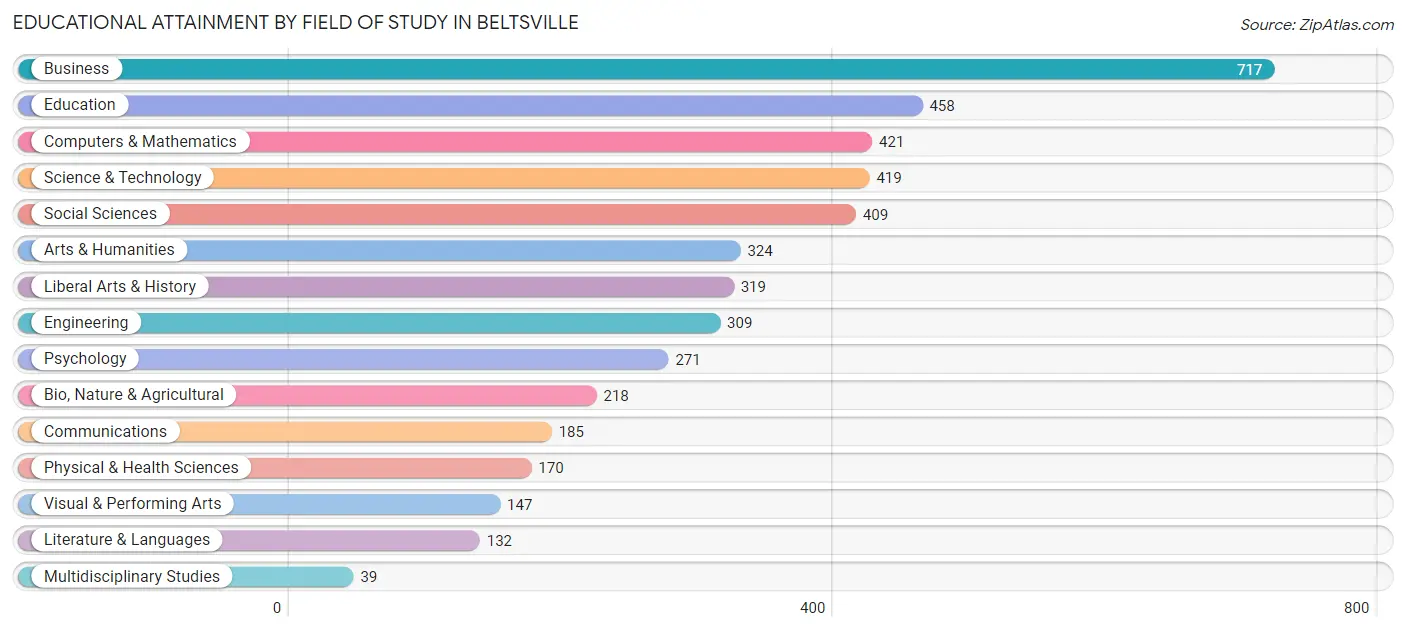
| Field of Study | # Graduates | % Graduates |
| Computers & Mathematics | 421 | 9.3% |
| Bio, Nature & Agricultural | 218 | 4.8% |
| Physical & Health Sciences | 170 | 3.7% |
| Psychology | 271 | 6.0% |
| Social Sciences | 409 | 9.0% |
| Engineering | 309 | 6.8% |
| Multidisciplinary Studies | 39 | 0.9% |
| Science & Technology | 419 | 9.2% |
| Business | 717 | 15.8% |
| Education | 458 | 10.1% |
| Literature & Languages | 132 | 2.9% |
| Liberal Arts & History | 319 | 7.0% |
| Visual & Performing Arts | 147 | 3.2% |
| Communications | 185 | 4.1% |
| Arts & Humanities | 324 | 7.1% |
| Total | 4,538 | 100.0% |
Transportation & Commute in Beltsville
Vehicle Availability by Sex in Beltsville
The most prevalent vehicle ownership categories in Beltsville are males with 2 vehicles (1,500, accounting for 34.8%) and females with 2 vehicles (1,477, making up 33.6%).
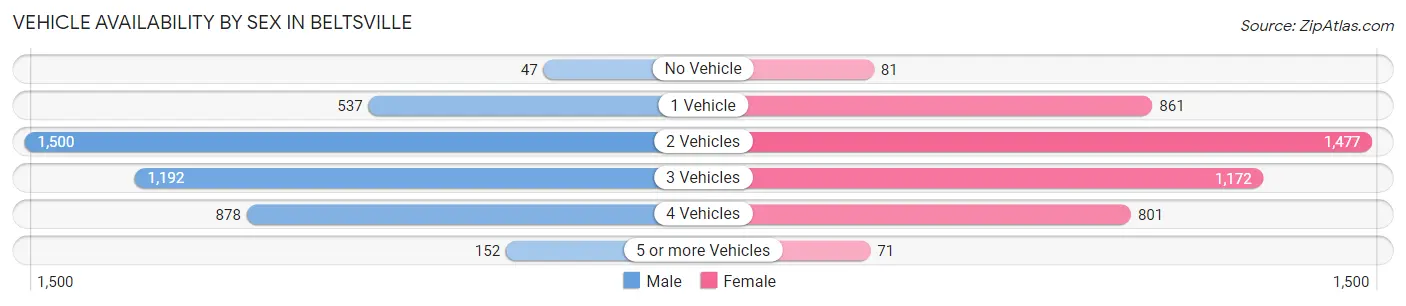
| Vehicles Available | Male | Female |
| No Vehicle | 47 (1.1%) | 81 (1.8%) |
| 1 Vehicle | 537 (12.5%) | 861 (19.3%) |
| 2 Vehicles | 1,500 (34.8%) | 1,477 (33.1%) |
| 3 Vehicles | 1,192 (27.7%) | 1,172 (26.3%) |
| 4 Vehicles | 878 (20.4%) | 801 (17.9%) |
| 5 or more Vehicles | 152 (3.5%) | 71 (1.6%) |
| Total | 4,306 (100.0%) | 4,463 (100.0%) |
Commute Time in Beltsville
The most frequently occuring commute durations in Beltsville are 30 to 34 minutes (1,792 commuters, 22.2%), 45 to 59 minutes (1,137 commuters, 14.1%), and 20 to 24 minutes (918 commuters, 11.4%).
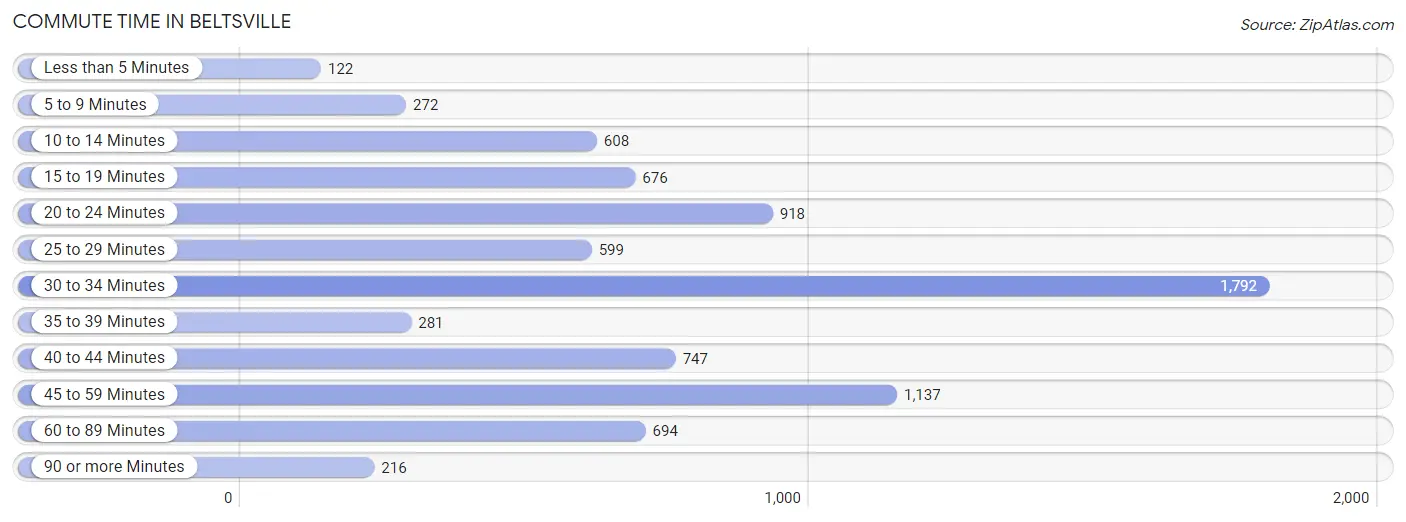
| Commute Time | # Commuters | % Commuters |
| Less than 5 Minutes | 122 | 1.5% |
| 5 to 9 Minutes | 272 | 3.4% |
| 10 to 14 Minutes | 608 | 7.5% |
| 15 to 19 Minutes | 676 | 8.4% |
| 20 to 24 Minutes | 918 | 11.4% |
| 25 to 29 Minutes | 599 | 7.4% |
| 30 to 34 Minutes | 1,792 | 22.2% |
| 35 to 39 Minutes | 281 | 3.5% |
| 40 to 44 Minutes | 747 | 9.3% |
| 45 to 59 Minutes | 1,137 | 14.1% |
| 60 to 89 Minutes | 694 | 8.6% |
| 90 or more Minutes | 216 | 2.7% |
Commute Time by Sex in Beltsville
The most common commute times in Beltsville are 30 to 34 minutes (758 commuters, 18.6%) for males and 30 to 34 minutes (1,034 commuters, 25.9%) for females.
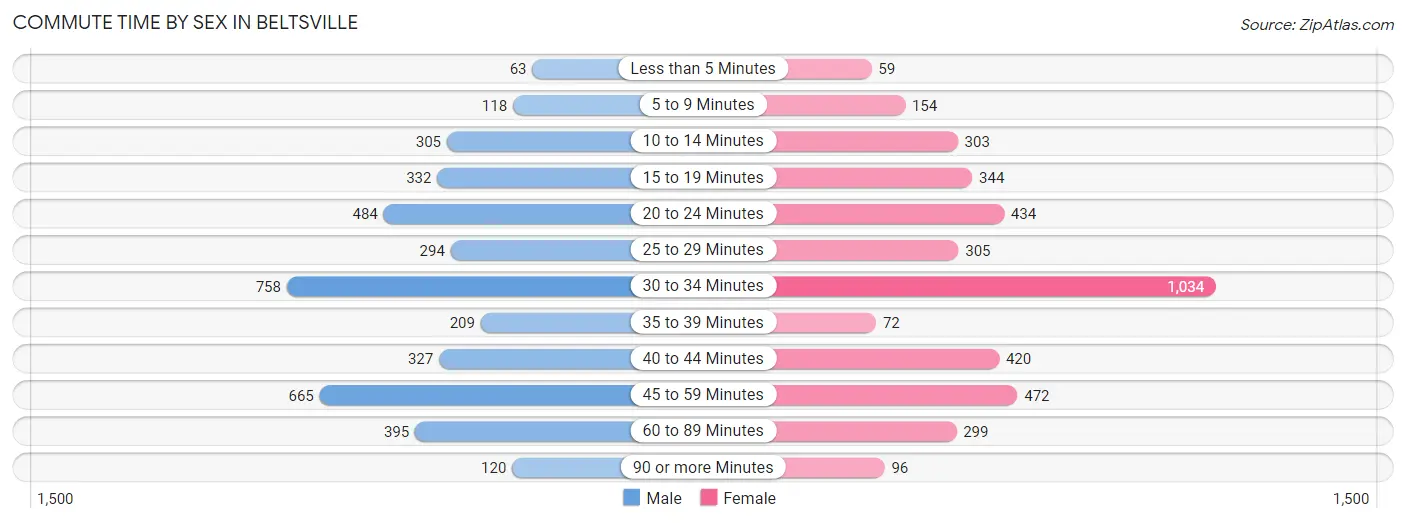
| Commute Time | Male | Female |
| Less than 5 Minutes | 63 (1.5%) | 59 (1.5%) |
| 5 to 9 Minutes | 118 (2.9%) | 154 (3.9%) |
| 10 to 14 Minutes | 305 (7.5%) | 303 (7.6%) |
| 15 to 19 Minutes | 332 (8.2%) | 344 (8.6%) |
| 20 to 24 Minutes | 484 (11.9%) | 434 (10.9%) |
| 25 to 29 Minutes | 294 (7.2%) | 305 (7.6%) |
| 30 to 34 Minutes | 758 (18.6%) | 1,034 (25.9%) |
| 35 to 39 Minutes | 209 (5.1%) | 72 (1.8%) |
| 40 to 44 Minutes | 327 (8.0%) | 420 (10.5%) |
| 45 to 59 Minutes | 665 (16.3%) | 472 (11.8%) |
| 60 to 89 Minutes | 395 (9.7%) | 299 (7.5%) |
| 90 or more Minutes | 120 (2.9%) | 96 (2.4%) |
Time of Departure to Work by Sex in Beltsville
The most frequent times of departure to work in Beltsville are 5:00 AM to 5:29 AM (512, 12.6%) for males and 7:30 AM to 7:59 AM (618, 15.5%) for females.
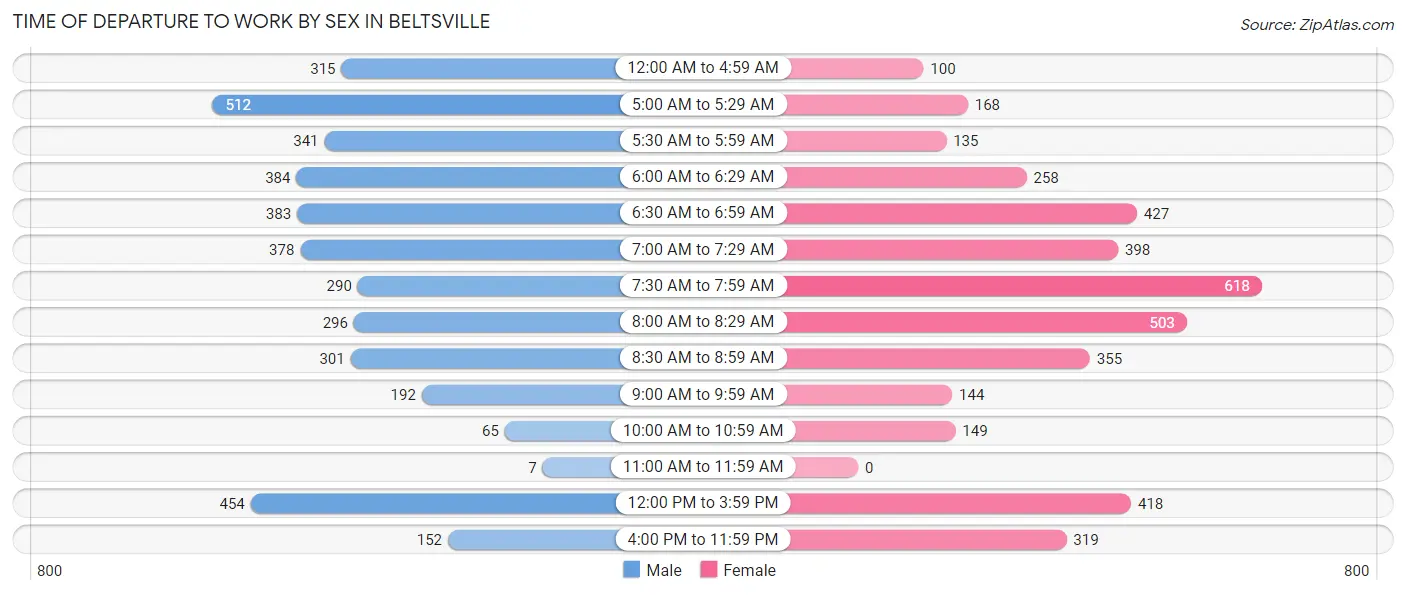
| Time of Departure | Male | Female |
| 12:00 AM to 4:59 AM | 315 (7.7%) | 100 (2.5%) |
| 5:00 AM to 5:29 AM | 512 (12.6%) | 168 (4.2%) |
| 5:30 AM to 5:59 AM | 341 (8.4%) | 135 (3.4%) |
| 6:00 AM to 6:29 AM | 384 (9.4%) | 258 (6.5%) |
| 6:30 AM to 6:59 AM | 383 (9.4%) | 427 (10.7%) |
| 7:00 AM to 7:29 AM | 378 (9.3%) | 398 (10.0%) |
| 7:30 AM to 7:59 AM | 290 (7.1%) | 618 (15.5%) |
| 8:00 AM to 8:29 AM | 296 (7.3%) | 503 (12.6%) |
| 8:30 AM to 8:59 AM | 301 (7.4%) | 355 (8.9%) |
| 9:00 AM to 9:59 AM | 192 (4.7%) | 144 (3.6%) |
| 10:00 AM to 10:59 AM | 65 (1.6%) | 149 (3.7%) |
| 11:00 AM to 11:59 AM | 7 (0.2%) | 0 (0.0%) |
| 12:00 PM to 3:59 PM | 454 (11.2%) | 418 (10.5%) |
| 4:00 PM to 11:59 PM | 152 (3.7%) | 319 (8.0%) |
| Total | 4,070 (100.0%) | 3,992 (100.0%) |
Housing Occupancy in Beltsville
Occupancy by Ownership in Beltsville
Of the total 6,277 dwellings in Beltsville, owner-occupied units account for 3,598 (57.3%), while renter-occupied units make up 2,679 (42.7%).
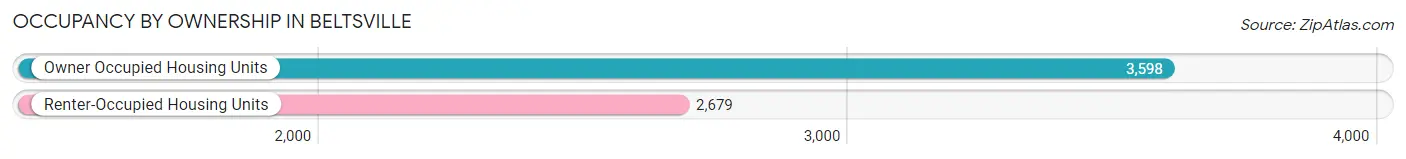
| Occupancy | # Housing Units | % Housing Units |
| Owner Occupied Housing Units | 3,598 | 57.3% |
| Renter-Occupied Housing Units | 2,679 | 42.7% |
| Total Occupied Housing Units | 6,277 | 100.0% |
Occupancy by Household Size in Beltsville
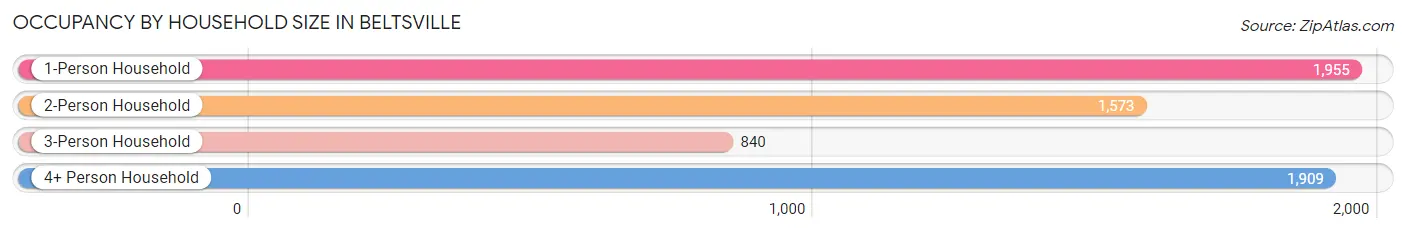
| Household Size | # Housing Units | % Housing Units |
| 1-Person Household | 1,955 | 31.1% |
| 2-Person Household | 1,573 | 25.1% |
| 3-Person Household | 840 | 13.4% |
| 4+ Person Household | 1,909 | 30.4% |
| Total Housing Units | 6,277 | 100.0% |
Occupancy by Ownership by Household Size in Beltsville
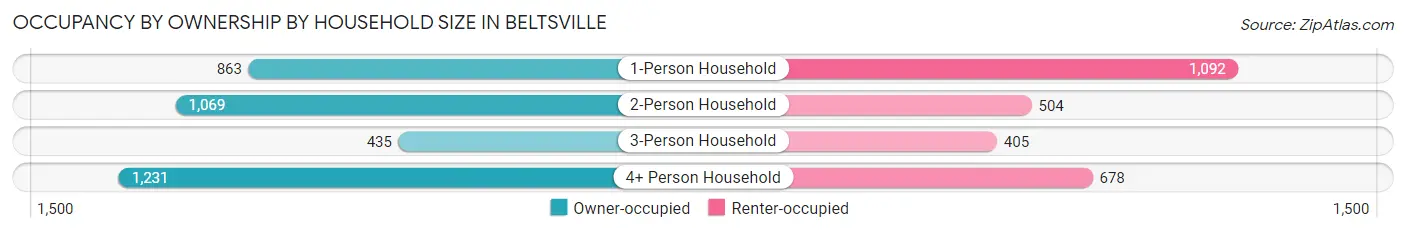
| Household Size | Owner-occupied | Renter-occupied |
| 1-Person Household | 863 (44.1%) | 1,092 (55.9%) |
| 2-Person Household | 1,069 (68.0%) | 504 (32.0%) |
| 3-Person Household | 435 (51.8%) | 405 (48.2%) |
| 4+ Person Household | 1,231 (64.5%) | 678 (35.5%) |
| Total Housing Units | 3,598 (57.3%) | 2,679 (42.7%) |
Occupancy by Educational Attainment in Beltsville
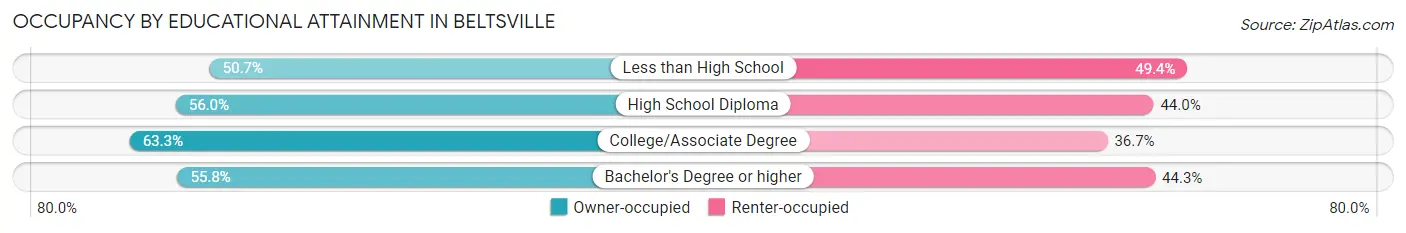
| Household Size | Owner-occupied | Renter-occupied |
| Less than High School | 387 (50.6%) | 377 (49.3%) |
| High School Diploma | 666 (56.0%) | 523 (44.0%) |
| College/Associate Degree | 1,124 (63.3%) | 651 (36.7%) |
| Bachelor's Degree or higher | 1,421 (55.7%) | 1,128 (44.3%) |
Occupancy by Age of Householder in Beltsville
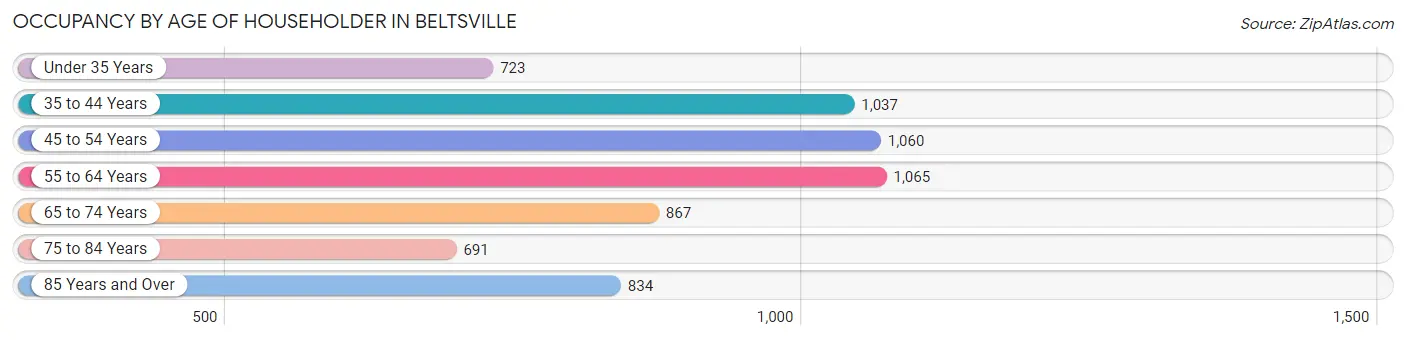
| Age Bracket | # Households | % Households |
| Under 35 Years | 723 | 11.5% |
| 35 to 44 Years | 1,037 | 16.5% |
| 45 to 54 Years | 1,060 | 16.9% |
| 55 to 64 Years | 1,065 | 17.0% |
| 65 to 74 Years | 867 | 13.8% |
| 75 to 84 Years | 691 | 11.0% |
| 85 Years and Over | 834 | 13.3% |
| Total | 6,277 | 100.0% |
Housing Finances in Beltsville
Median Income by Occupancy in Beltsville
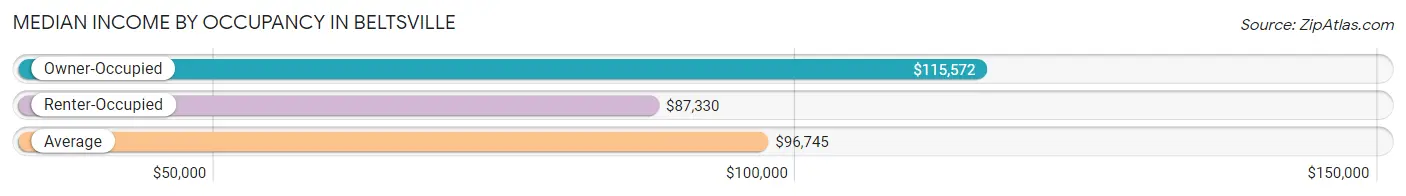
| Occupancy Type | # Households | Median Income |
| Owner-Occupied | 3,598 (57.3%) | $115,572 |
| Renter-Occupied | 2,679 (42.7%) | $87,330 |
| Average | 6,277 (100.0%) | $96,745 |
Occupancy by Householder Income Bracket in Beltsville
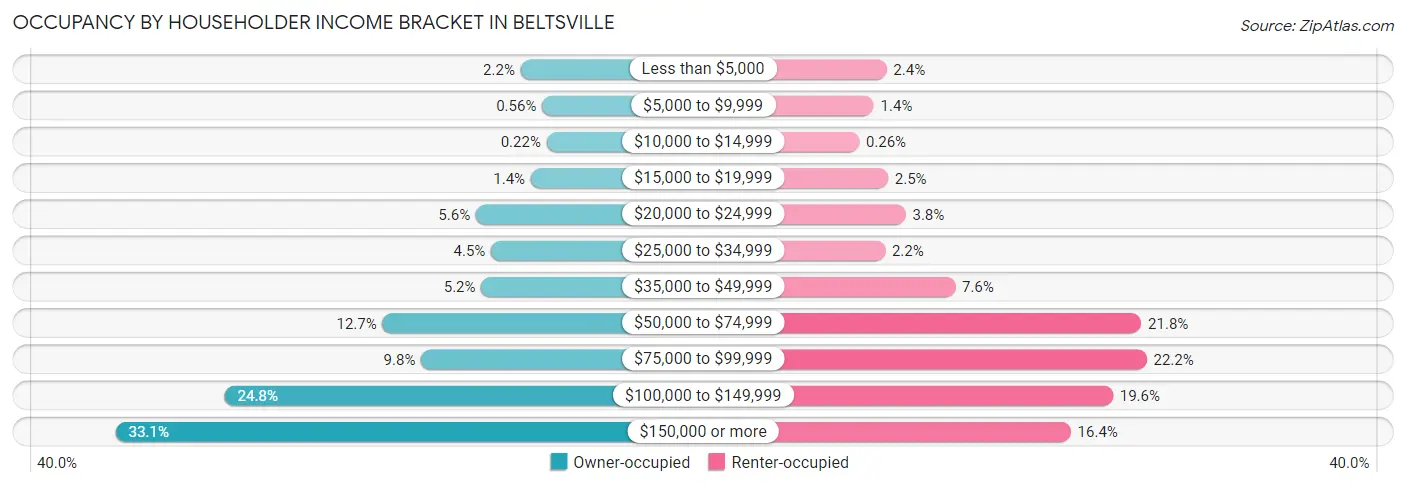
| Income Bracket | Owner-occupied | Renter-occupied |
| Less than $5,000 | 79 (2.2%) | 63 (2.4%) |
| $5,000 to $9,999 | 20 (0.6%) | 37 (1.4%) |
| $10,000 to $14,999 | 8 (0.2%) | 7 (0.3%) |
| $15,000 to $19,999 | 51 (1.4%) | 66 (2.5%) |
| $20,000 to $24,999 | 202 (5.6%) | 102 (3.8%) |
| $25,000 to $34,999 | 160 (4.4%) | 60 (2.2%) |
| $35,000 to $49,999 | 187 (5.2%) | 203 (7.6%) |
| $50,000 to $74,999 | 458 (12.7%) | 583 (21.8%) |
| $75,000 to $99,999 | 352 (9.8%) | 594 (22.2%) |
| $100,000 to $149,999 | 891 (24.8%) | 525 (19.6%) |
| $150,000 or more | 1,190 (33.1%) | 439 (16.4%) |
| Total | 3,598 (100.0%) | 2,679 (100.0%) |
Monthly Housing Cost Tiers in Beltsville
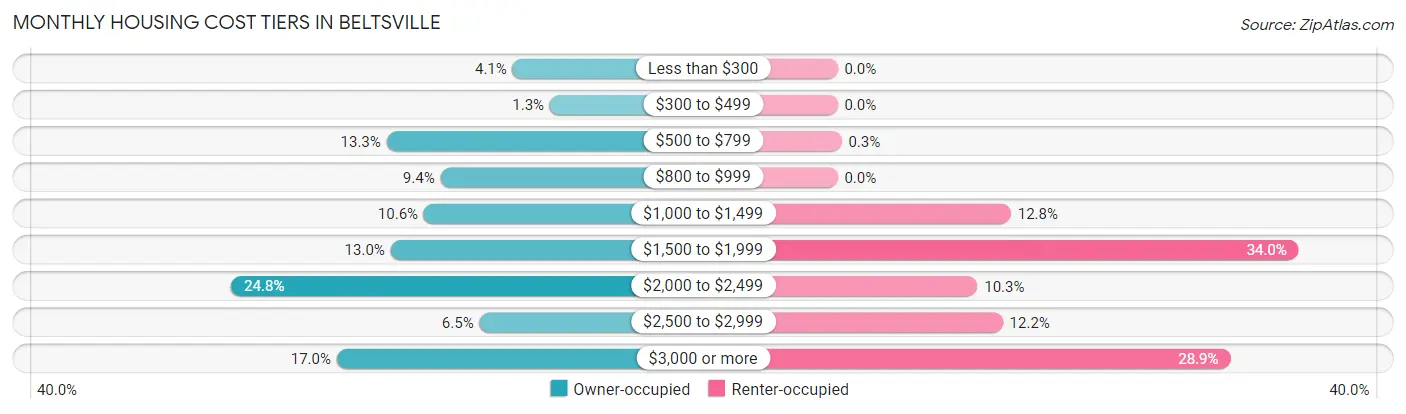
| Monthly Cost | Owner-occupied | Renter-occupied |
| Less than $300 | 146 (4.1%) | 0 (0.0%) |
| $300 to $499 | 47 (1.3%) | 0 (0.0%) |
| $500 to $799 | 480 (13.3%) | 8 (0.3%) |
| $800 to $999 | 337 (9.4%) | 0 (0.0%) |
| $1,000 to $1,499 | 381 (10.6%) | 342 (12.8%) |
| $1,500 to $1,999 | 469 (13.0%) | 910 (34.0%) |
| $2,000 to $2,499 | 892 (24.8%) | 276 (10.3%) |
| $2,500 to $2,999 | 234 (6.5%) | 326 (12.2%) |
| $3,000 or more | 612 (17.0%) | 775 (28.9%) |
| Total | 3,598 (100.0%) | 2,679 (100.0%) |
Physical Housing Characteristics in Beltsville
Housing Structures in Beltsville
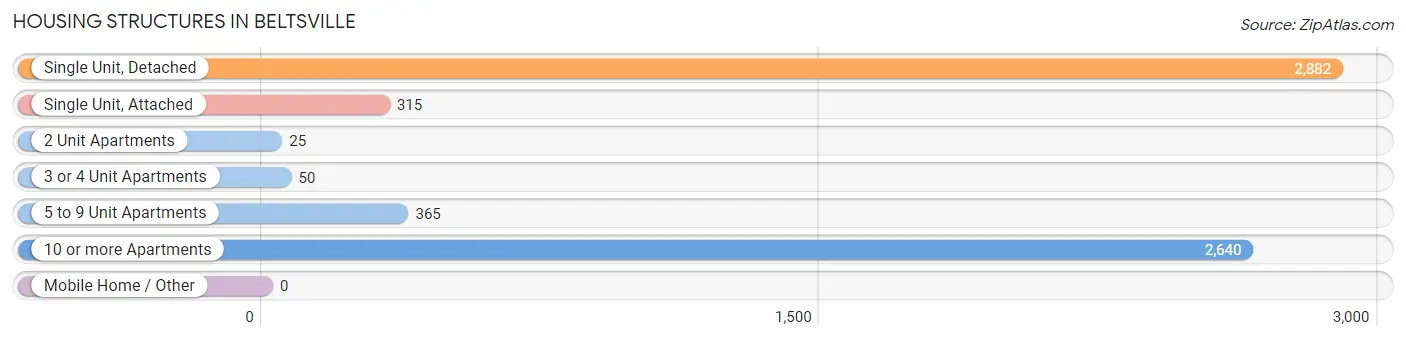
| Structure Type | # Housing Units | % Housing Units |
| Single Unit, Detached | 2,882 | 45.9% |
| Single Unit, Attached | 315 | 5.0% |
| 2 Unit Apartments | 25 | 0.4% |
| 3 or 4 Unit Apartments | 50 | 0.8% |
| 5 to 9 Unit Apartments | 365 | 5.8% |
| 10 or more Apartments | 2,640 | 42.1% |
| Mobile Home / Other | 0 | 0.0% |
| Total | 6,277 | 100.0% |
Housing Structures by Occupancy in Beltsville
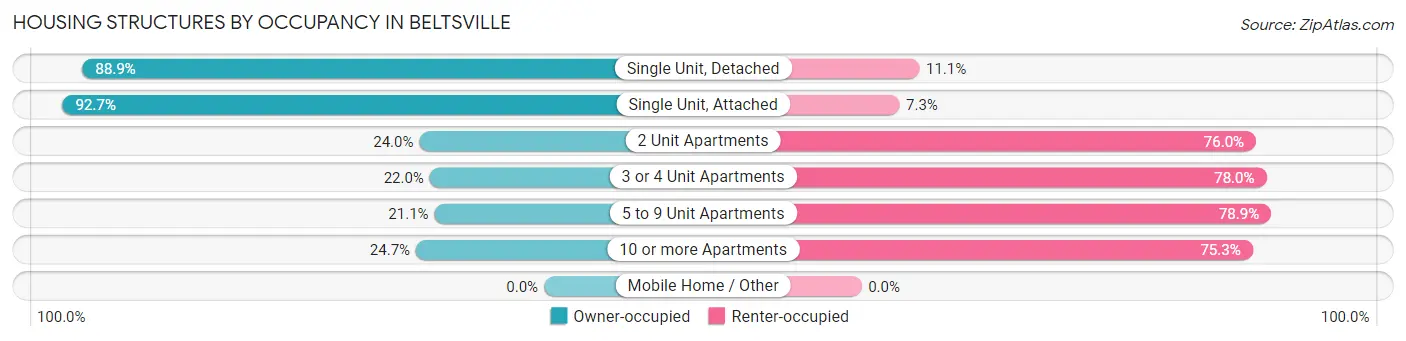
| Structure Type | Owner-occupied | Renter-occupied |
| Single Unit, Detached | 2,561 (88.9%) | 321 (11.1%) |
| Single Unit, Attached | 292 (92.7%) | 23 (7.3%) |
| 2 Unit Apartments | 6 (24.0%) | 19 (76.0%) |
| 3 or 4 Unit Apartments | 11 (22.0%) | 39 (78.0%) |
| 5 to 9 Unit Apartments | 77 (21.1%) | 288 (78.9%) |
| 10 or more Apartments | 651 (24.7%) | 1,989 (75.3%) |
| Mobile Home / Other | 0 (0.0%) | 0 (0.0%) |
| Total | 3,598 (57.3%) | 2,679 (42.7%) |
Housing Structures by Number of Rooms in Beltsville
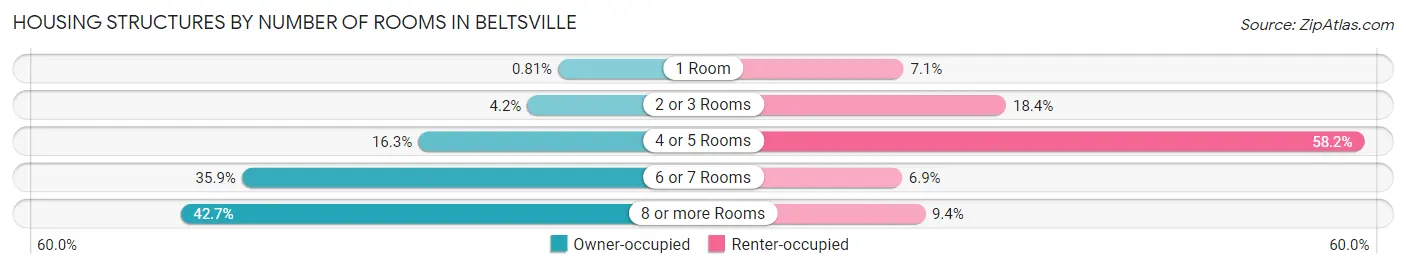
| Number of Rooms | Owner-occupied | Renter-occupied |
| 1 Room | 29 (0.8%) | 189 (7.0%) |
| 2 or 3 Rooms | 152 (4.2%) | 494 (18.4%) |
| 4 or 5 Rooms | 588 (16.3%) | 1,559 (58.2%) |
| 6 or 7 Rooms | 1,292 (35.9%) | 184 (6.9%) |
| 8 or more Rooms | 1,537 (42.7%) | 253 (9.4%) |
| Total | 3,598 (100.0%) | 2,679 (100.0%) |
Housing Structure by Heating Type in Beltsville
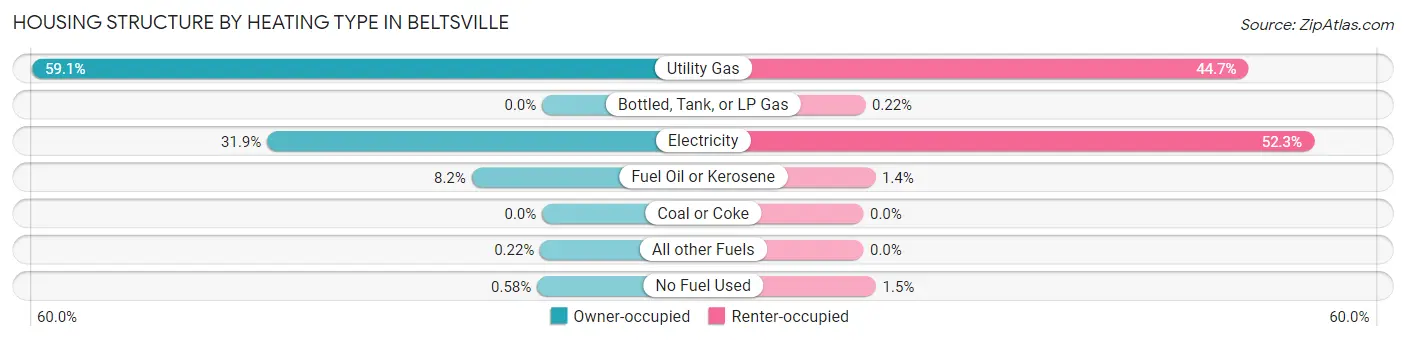
| Heating Type | Owner-occupied | Renter-occupied |
| Utility Gas | 2,128 (59.1%) | 1,197 (44.7%) |
| Bottled, Tank, or LP Gas | 0 (0.0%) | 6 (0.2%) |
| Electricity | 1,147 (31.9%) | 1,400 (52.3%) |
| Fuel Oil or Kerosene | 294 (8.2%) | 37 (1.4%) |
| Coal or Coke | 0 (0.0%) | 0 (0.0%) |
| All other Fuels | 8 (0.2%) | 0 (0.0%) |
| No Fuel Used | 21 (0.6%) | 39 (1.5%) |
| Total | 3,598 (100.0%) | 2,679 (100.0%) |
Household Vehicle Usage in Beltsville
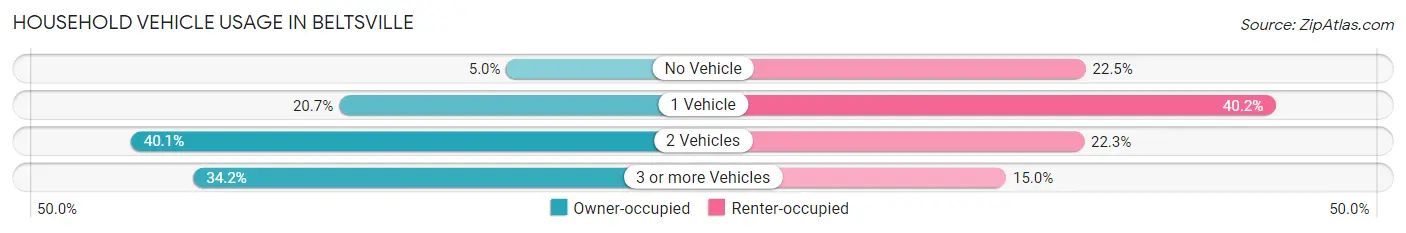
| Vehicles per Household | Owner-occupied | Renter-occupied |
| No Vehicle | 181 (5.0%) | 602 (22.5%) |
| 1 Vehicle | 743 (20.6%) | 1,076 (40.2%) |
| 2 Vehicles | 1,442 (40.1%) | 598 (22.3%) |
| 3 or more Vehicles | 1,232 (34.2%) | 403 (15.0%) |
| Total | 3,598 (100.0%) | 2,679 (100.0%) |
Real Estate & Mortgages in Beltsville
Real Estate and Mortgage Overview in Beltsville
| Characteristic | Without Mortgage | With Mortgage |
| Housing Units | 1,314 | 2,284 |
| Median Property Value | $340,500 | $389,800 |
| Median Household Income | $107,283 | $793 |
| Monthly Housing Costs | $813 | $466 |
| Real Estate Taxes | $4,383 | $189 |
Property Value by Mortgage Status in Beltsville
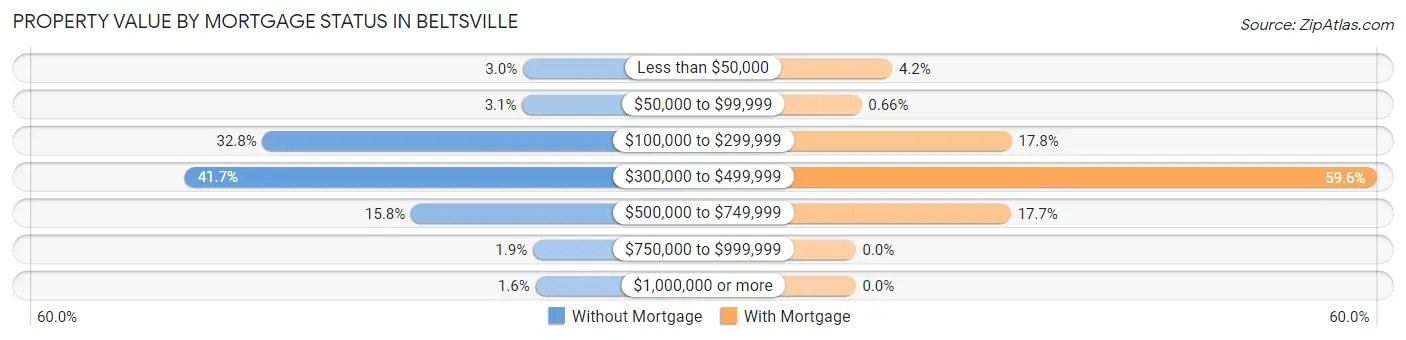
| Property Value | Without Mortgage | With Mortgage |
| Less than $50,000 | 40 (3.0%) | 95 (4.2%) |
| $50,000 to $99,999 | 41 (3.1%) | 15 (0.7%) |
| $100,000 to $299,999 | 431 (32.8%) | 407 (17.8%) |
| $300,000 to $499,999 | 548 (41.7%) | 1,362 (59.6%) |
| $500,000 to $749,999 | 208 (15.8%) | 405 (17.7%) |
| $750,000 to $999,999 | 25 (1.9%) | 0 (0.0%) |
| $1,000,000 or more | 21 (1.6%) | 0 (0.0%) |
| Total | 1,314 (100.0%) | 2,284 (100.0%) |
Household Income by Mortgage Status in Beltsville
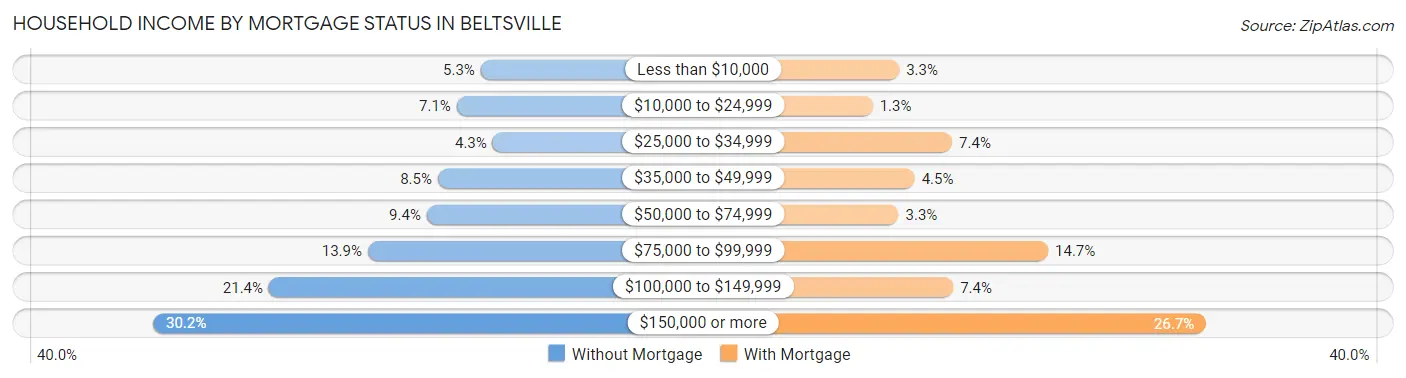
| Household Income | Without Mortgage | With Mortgage |
| Less than $10,000 | 69 (5.2%) | 76 (3.3%) |
| $10,000 to $24,999 | 93 (7.1%) | 30 (1.3%) |
| $25,000 to $34,999 | 57 (4.3%) | 168 (7.4%) |
| $35,000 to $49,999 | 112 (8.5%) | 103 (4.5%) |
| $50,000 to $74,999 | 123 (9.4%) | 75 (3.3%) |
| $75,000 to $99,999 | 182 (13.9%) | 335 (14.7%) |
| $100,000 to $149,999 | 281 (21.4%) | 170 (7.4%) |
| $150,000 or more | 397 (30.2%) | 610 (26.7%) |
| Total | 1,314 (100.0%) | 2,284 (100.0%) |
Property Value to Household Income Ratio in Beltsville
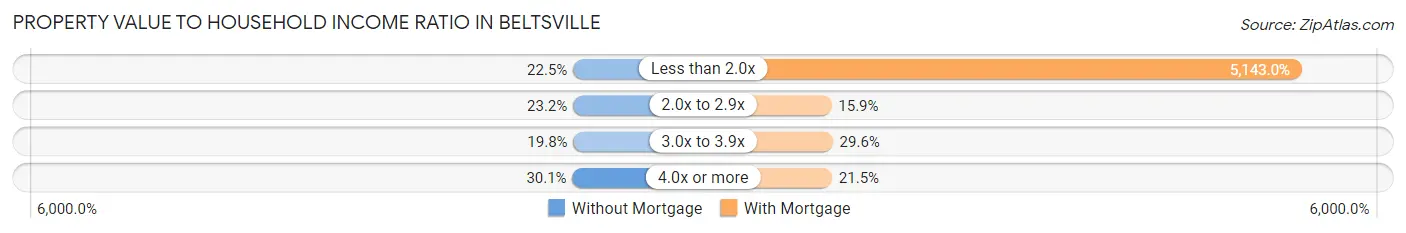
| Value-to-Income Ratio | Without Mortgage | With Mortgage |
| Less than 2.0x | 296 (22.5%) | 117,465 (5,142.9%) |
| 2.0x to 2.9x | 305 (23.2%) | 364 (15.9%) |
| 3.0x to 3.9x | 260 (19.8%) | 677 (29.6%) |
| 4.0x or more | 396 (30.1%) | 491 (21.5%) |
| Total | 1,314 (100.0%) | 2,284 (100.0%) |
Real Estate Taxes by Mortgage Status in Beltsville
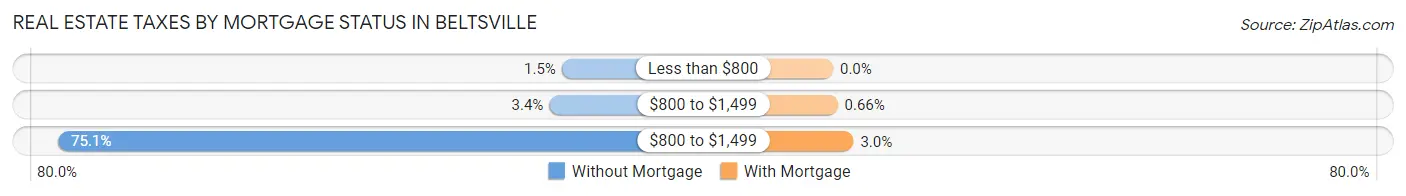
| Property Taxes | Without Mortgage | With Mortgage |
| Less than $800 | 20 (1.5%) | 0 (0.0%) |
| $800 to $1,499 | 44 (3.4%) | 15 (0.7%) |
| $800 to $1,499 | 987 (75.1%) | 68 (3.0%) |
| Total | 1,314 (100.0%) | 2,284 (100.0%) |
Health & Disability in Beltsville
Health Insurance Coverage by Age in Beltsville
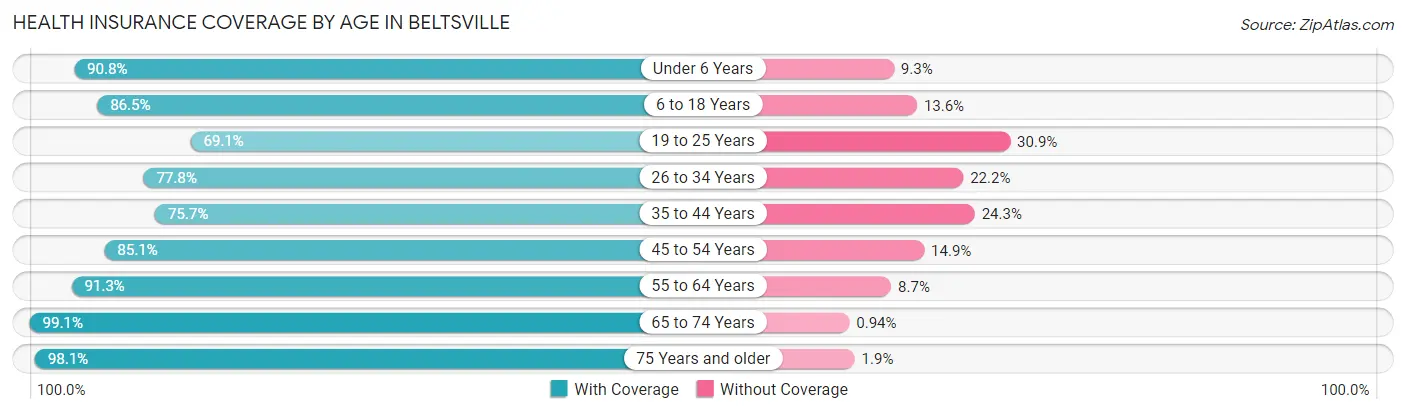
| Age Bracket | With Coverage | Without Coverage |
| Under 6 Years | 1,520 (90.7%) | 155 (9.2%) |
| 6 to 18 Years | 3,248 (86.5%) | 509 (13.6%) |
| 19 to 25 Years | 1,237 (69.1%) | 554 (30.9%) |
| 26 to 34 Years | 1,379 (77.8%) | 393 (22.2%) |
| 35 to 44 Years | 1,998 (75.7%) | 642 (24.3%) |
| 45 to 54 Years | 1,938 (85.1%) | 339 (14.9%) |
| 55 to 64 Years | 1,597 (91.3%) | 153 (8.7%) |
| 65 to 74 Years | 1,582 (99.1%) | 15 (0.9%) |
| 75 Years and older | 2,232 (98.1%) | 44 (1.9%) |
| Total | 16,731 (85.7%) | 2,804 (14.3%) |
Health Insurance Coverage by Citizenship Status in Beltsville
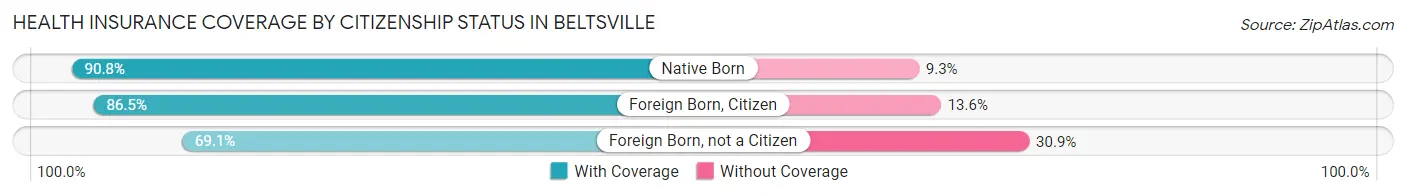
| Citizenship Status | With Coverage | Without Coverage |
| Native Born | 1,520 (90.7%) | 155 (9.2%) |
| Foreign Born, Citizen | 3,248 (86.5%) | 509 (13.6%) |
| Foreign Born, not a Citizen | 1,237 (69.1%) | 554 (30.9%) |
Health Insurance Coverage by Household Income in Beltsville
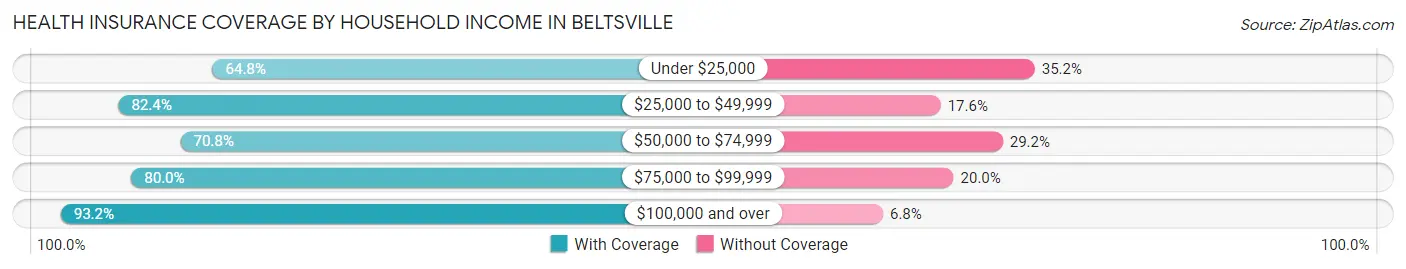
| Household Income | With Coverage | Without Coverage |
| Under $25,000 | 818 (64.8%) | 445 (35.2%) |
| $25,000 to $49,999 | 1,100 (82.4%) | 235 (17.6%) |
| $50,000 to $74,999 | 1,964 (70.8%) | 811 (29.2%) |
| $75,000 to $99,999 | 2,198 (80.0%) | 550 (20.0%) |
| $100,000 and over | 10,469 (93.2%) | 763 (6.8%) |
Public vs Private Health Insurance Coverage by Age in Beltsville
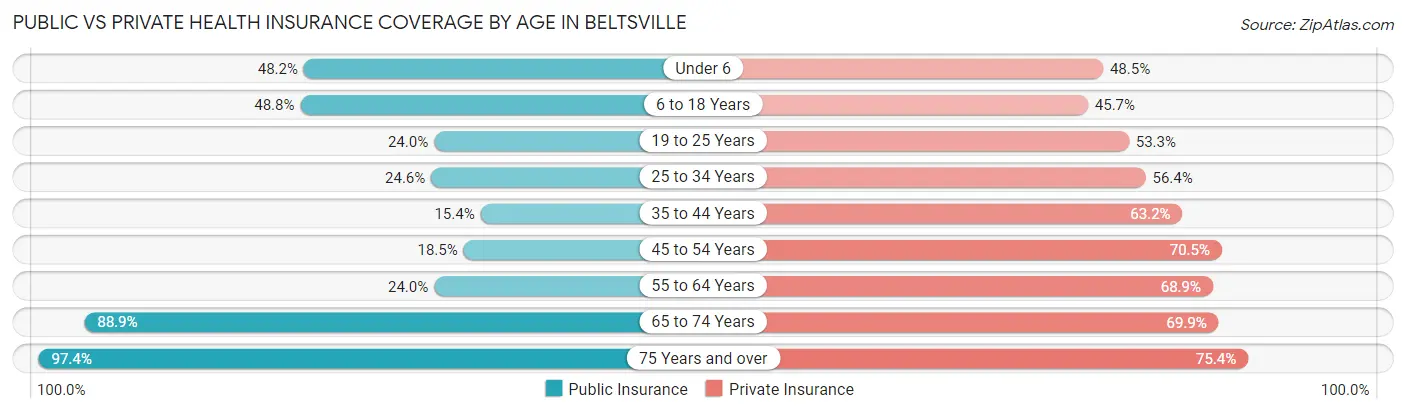
| Age Bracket | Public Insurance | Private Insurance |
| Under 6 | 807 (48.2%) | 812 (48.5%) |
| 6 to 18 Years | 1,834 (48.8%) | 1,716 (45.7%) |
| 19 to 25 Years | 430 (24.0%) | 954 (53.3%) |
| 25 to 34 Years | 435 (24.5%) | 999 (56.4%) |
| 35 to 44 Years | 406 (15.4%) | 1,669 (63.2%) |
| 45 to 54 Years | 422 (18.5%) | 1,606 (70.5%) |
| 55 to 64 Years | 420 (24.0%) | 1,205 (68.9%) |
| 65 to 74 Years | 1,420 (88.9%) | 1,117 (69.9%) |
| 75 Years and over | 2,217 (97.4%) | 1,716 (75.4%) |
| Total | 8,391 (42.9%) | 11,794 (60.4%) |
Disability Status by Sex by Age in Beltsville
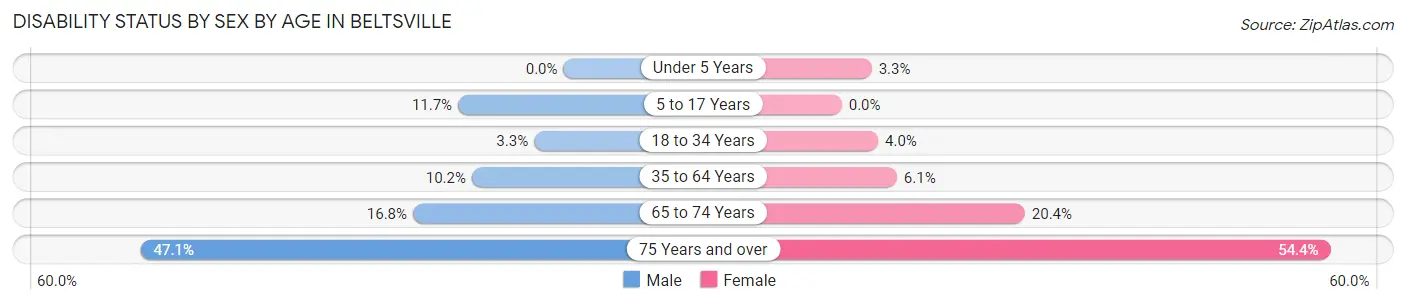
| Age Bracket | Male | Female |
| Under 5 Years | 0 (0.0%) | 21 (3.3%) |
| 5 to 17 Years | 216 (11.7%) | 0 (0.0%) |
| 18 to 34 Years | 66 (3.3%) | 71 (4.0%) |
| 35 to 64 Years | 310 (10.2%) | 223 (6.1%) |
| 65 to 74 Years | 123 (16.8%) | 176 (20.4%) |
| 75 Years and over | 362 (47.1%) | 820 (54.4%) |
Disability Class by Sex by Age in Beltsville
Disability Class: Hearing Difficulty
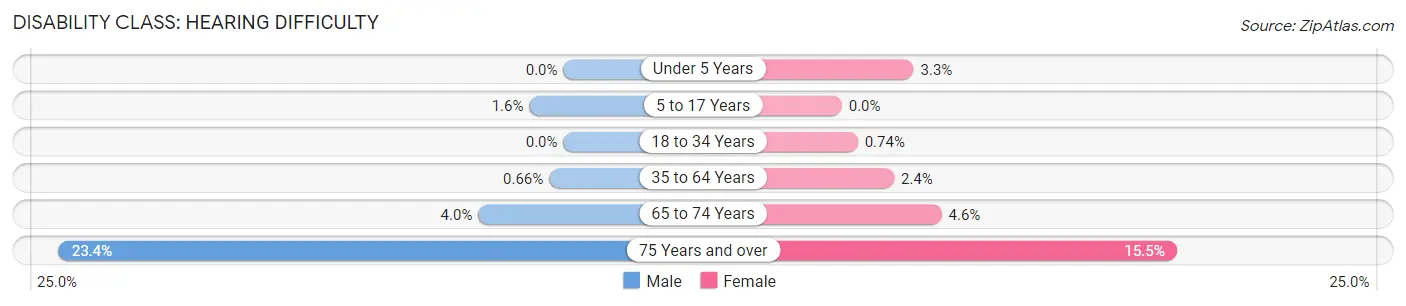
| Age Bracket | Male | Female |
| Under 5 Years | 0 (0.0%) | 21 (3.3%) |
| 5 to 17 Years | 29 (1.6%) | 0 (0.0%) |
| 18 to 34 Years | 0 (0.0%) | 13 (0.7%) |
| 35 to 64 Years | 20 (0.7%) | 88 (2.4%) |
| 65 to 74 Years | 29 (4.0%) | 40 (4.6%) |
| 75 Years and over | 180 (23.4%) | 234 (15.5%) |
Disability Class: Vision Difficulty
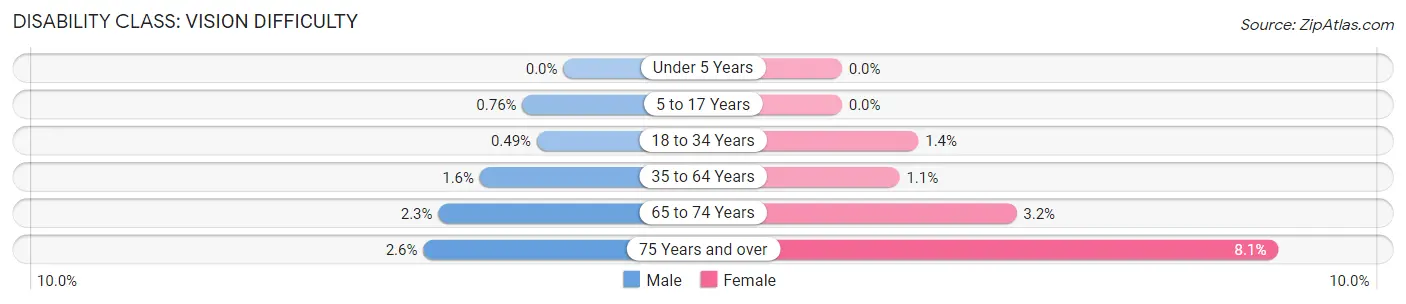
| Age Bracket | Male | Female |
| Under 5 Years | 0 (0.0%) | 0 (0.0%) |
| 5 to 17 Years | 14 (0.8%) | 0 (0.0%) |
| 18 to 34 Years | 10 (0.5%) | 25 (1.4%) |
| 35 to 64 Years | 47 (1.5%) | 39 (1.1%) |
| 65 to 74 Years | 17 (2.3%) | 28 (3.2%) |
| 75 Years and over | 20 (2.6%) | 122 (8.1%) |
Disability Class: Cognitive Difficulty
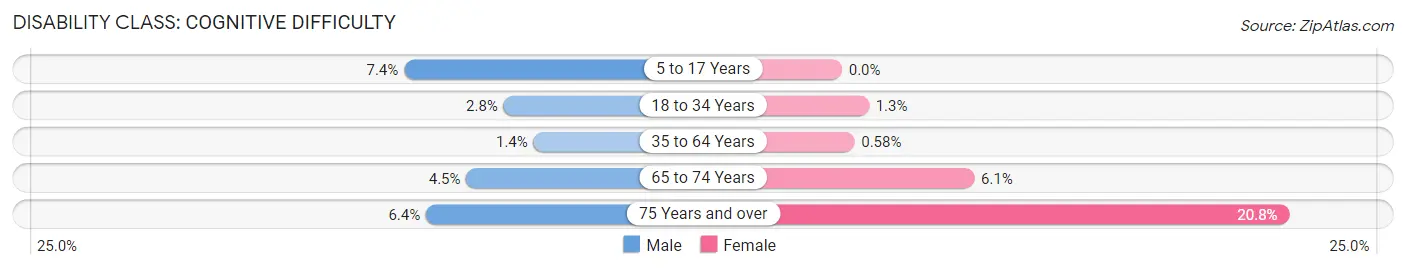
| Age Bracket | Male | Female |
| 5 to 17 Years | 136 (7.4%) | 0 (0.0%) |
| 18 to 34 Years | 56 (2.8%) | 22 (1.3%) |
| 35 to 64 Years | 42 (1.4%) | 21 (0.6%) |
| 65 to 74 Years | 33 (4.5%) | 53 (6.1%) |
| 75 Years and over | 49 (6.4%) | 313 (20.8%) |
Disability Class: Ambulatory Difficulty
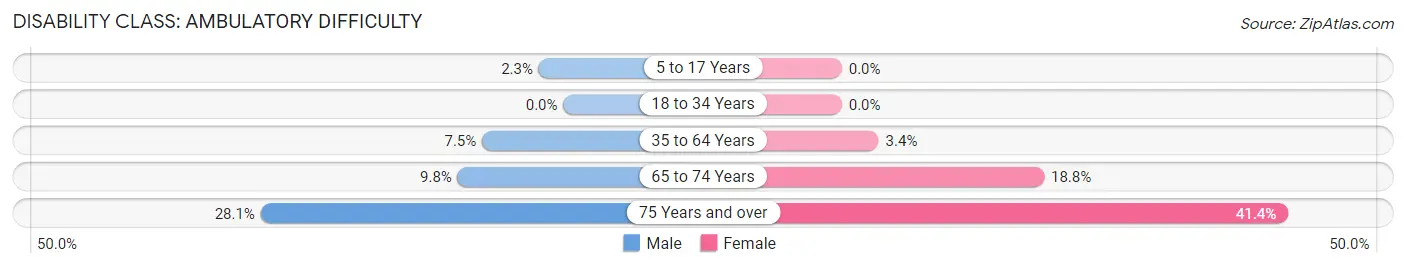
| Age Bracket | Male | Female |
| 5 to 17 Years | 42 (2.3%) | 0 (0.0%) |
| 18 to 34 Years | 0 (0.0%) | 0 (0.0%) |
| 35 to 64 Years | 229 (7.5%) | 124 (3.4%) |
| 65 to 74 Years | 72 (9.8%) | 162 (18.8%) |
| 75 Years and over | 216 (28.1%) | 624 (41.4%) |
Disability Class: Self-Care Difficulty
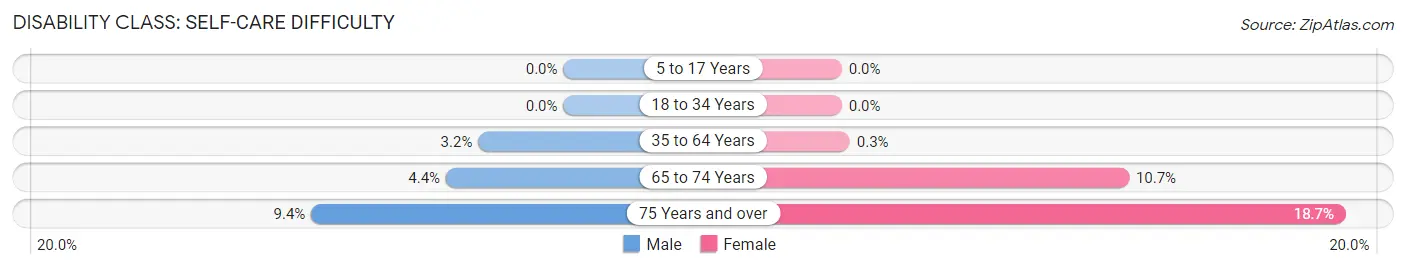
| Age Bracket | Male | Female |
| 5 to 17 Years | 0 (0.0%) | 0 (0.0%) |
| 18 to 34 Years | 0 (0.0%) | 0 (0.0%) |
| 35 to 64 Years | 96 (3.2%) | 11 (0.3%) |
| 65 to 74 Years | 32 (4.4%) | 92 (10.7%) |
| 75 Years and over | 72 (9.4%) | 282 (18.7%) |
Technology Access in Beltsville
Computing Device Access in Beltsville
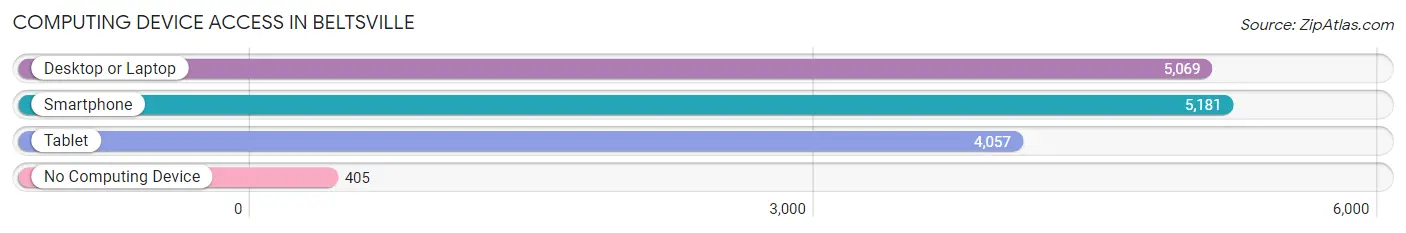
| Device Type | # Households | % Households |
| Desktop or Laptop | 5,069 | 80.8% |
| Smartphone | 5,181 | 82.5% |
| Tablet | 4,057 | 64.6% |
| No Computing Device | 405 | 6.5% |
| Total | 6,277 | 100.0% |
Internet Access in Beltsville
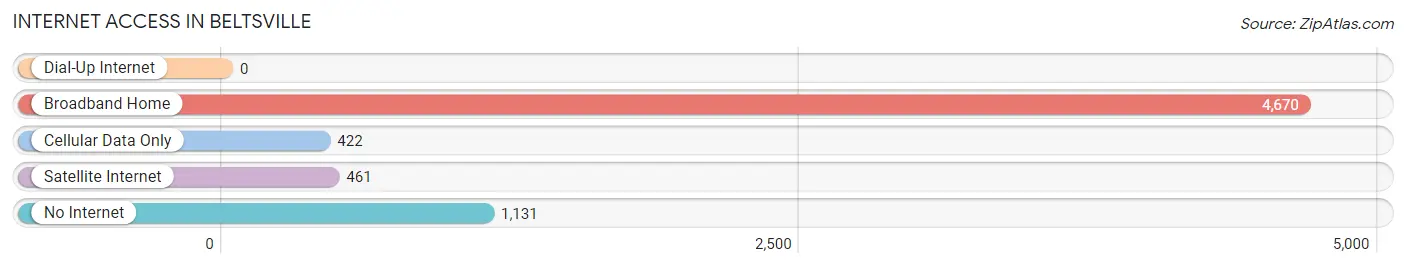
| Internet Type | # Households | % Households |
| Dial-Up Internet | 0 | 0.0% |
| Broadband Home | 4,670 | 74.4% |
| Cellular Data Only | 422 | 6.7% |
| Satellite Internet | 461 | 7.3% |
| No Internet | 1,131 | 18.0% |
| Total | 6,277 | 100.0% |
Beltsville Summary
Beltsville, Maryland is a small town located in Prince George’s County, Maryland, just outside of Washington, D.C. It is a part of the Washington-Arlington-Alexandria metropolitan area and is home to a population of just over 10,000 people. Beltsville is known for its agricultural research and is home to the Beltsville Agricultural Research Center, which is part of the United States Department of Agriculture.
History
Beltsville was first settled in the early 1700s by the Piscataway Indians. The town was named after Thomas Belt, who purchased the land in 1842. Belt was a farmer and a miller, and he built a mill on the Patuxent River. The town was officially incorporated in 1894.
In the early 1900s, Beltsville was a rural farming community. The town was home to several farms, including the Beltsville Farm, which was owned by the Belt family. The town also had a general store, a post office, and a few churches.
In the 1950s, the Beltsville Agricultural Research Center was established. This center was part of the United States Department of Agriculture and was used to conduct research on agricultural products. This research center helped to bring jobs and economic growth to the town.
In the late 1960s, Beltsville began to experience rapid growth. The town was annexed by Prince George’s County in 1968, and the population grew from just over 1,000 people in 1960 to over 10,000 people in 2000.
Geography
Beltsville is located in Prince George’s County, Maryland, just outside of Washington, D.C. The town is situated on the Patuxent River and is bordered by the towns of Laurel, College Park, and Greenbelt. Beltsville is located in the Piedmont region of Maryland and is part of the Atlantic Coastal Plain. The town has a total area of 4.2 square miles, with 0.2 square miles of water.
Economy
Beltsville’s economy is largely based on the Beltsville Agricultural Research Center. This center is part of the United States Department of Agriculture and is used to conduct research on agricultural products. The center employs over 1,000 people and is one of the largest employers in the town.
In addition to the research center, Beltsville is home to several other businesses. These include a variety of retail stores, restaurants, and other services. The town is also home to several government offices, including the Beltsville Post Office and the Beltsville Social Security Office.
Demographics
As of the 2010 census, Beltsville had a population of 10,709 people. The racial makeup of the town was 57.3% White, 28.2% African American, 0.3% Native American, 8.2% Asian, 0.1% Pacific Islander, and 5.9% from other races. The median household income was $68,945, and the median family income was $76,945.
Beltsville is a diverse community with a variety of cultures and backgrounds. The town is home to a large Hispanic population, as well as a growing Asian population. The town also has a large Jewish population, with several synagogues located in the area.
Conclusion
Beltsville, Maryland is a small town located in Prince George’s County, Maryland, just outside of Washington, D.C. The town is known for its agricultural research and is home to the Beltsville Agricultural Research Center. Beltsville has a population of just over 10,000 people and is a diverse community with a variety of cultures and backgrounds. The town’s economy is largely based on the Beltsville Agricultural Research Center, which is one of the largest employers in the town.
Common Questions
What is Per Capita Income in Beltsville?
Per Capita income in Beltsville is $37,444.
What is the Median Family Income in Beltsville?
Median Family Income in Beltsville is $107,500.
What is the Median Household income in Beltsville?
Median Household Income in Beltsville is $96,745.
What is Income or Wage Gap in Beltsville?
Income or Wage Gap in Beltsville is 23.6%.
Women in Beltsville earn 76.4 cents for every dollar earned by a man.
What is Family Income Deficit in Beltsville?
Family Income Deficit in Beltsville is $12,530.
Families that are below poverty line in Beltsville earn $12,530 less on average than the poverty threshold level.
What is Inequality or Gini Index in Beltsville?
Inequality or Gini Index in Beltsville is 0.36.
What is the Total Population of Beltsville?
Total Population of Beltsville is 19,704.
What is the Total Male Population of Beltsville?
Total Male Population of Beltsville is 9,340.
What is the Total Female Population of Beltsville?
Total Female Population of Beltsville is 10,364.
What is the Ratio of Males per 100 Females in Beltsville?
There are 90.12 Males per 100 Females in Beltsville.
What is the Ratio of Females per 100 Males in Beltsville?
There are 110.96 Females per 100 Males in Beltsville.
What is the Median Population Age in Beltsville?
Median Population Age in Beltsville is 38.8 Years.
What is the Average Family Size in Beltsville
Average Family Size in Beltsville is 4.0 People.
What is the Average Household Size in Beltsville
Average Household Size in Beltsville is 3.1 People.
How Large is the Labor Force in Beltsville?
There are 9,814 People in the Labor Forcein in Beltsville.
What is the Percentage of People in the Labor Force in Beltsville?
65.1% of People are in the Labor Force in Beltsville.
What is the Unemployment Rate in Beltsville?
Unemployment Rate in Beltsville is 7.9%.