Lismore, MN Map & Demographics
Lismore Map
Lismore Overview
$29,558
PER CAPITA INCOME
$56,287
AVG FAMILY INCOME
$56,069
AVG HOUSEHOLD INCOME
54.8%
WAGE / INCOME GAP [ % ]
45.2¢/ $1
WAGE / INCOME GAP [ $ ]
0.27
INEQUALITY / GINI INDEX
292
TOTAL POPULATION
183
MALE POPULATION
109
FEMALE POPULATION
167.89
MALES / 100 FEMALES
59.56
FEMALES / 100 MALES
48.7
MEDIAN AGE
2.0
AVG FAMILY SIZE
1.8
AVG HOUSEHOLD SIZE
181
LABOR FORCE [ PEOPLE ]
76.1%
PERCENT IN LABOR FORCE
Lismore Zip Codes
Lismore Area Codes
Income in Lismore
Income Overview in Lismore
Per Capita Income in Lismore is $29,558, while median incomes of families and households are $56,287 and $56,069 respectively.
| Characteristic | Number | Measure |
| Per Capita Income | 292 | $29,558 |
| Median Family Income | 122 | $56,287 |
| Mean Family Income | 122 | $63,340 |
| Median Household Income | 159 | $56,069 |
| Mean Household Income | 159 | $58,952 |
| Income Deficit | 122 | $0 |
| Wage / Income Gap (%) | 292 | 54.82% |
| Wage / Income Gap ($) | 292 | 45.18¢ per $1 |
| Gini / Inequality Index | 292 | 0.27 |
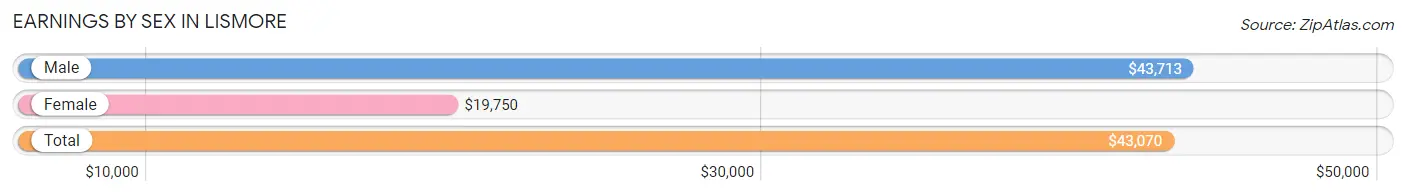
Earnings by Sex in Lismore
Average Earnings in Lismore are $43,070, $43,713 for men and $19,750 for women, a difference of 54.8%.
| Sex | Number | Average Earnings |
| Male | 130 (70.3%) | $43,713 |
| Female | 55 (29.7%) | $19,750 |
| Total | 185 (100.0%) | $43,070 |
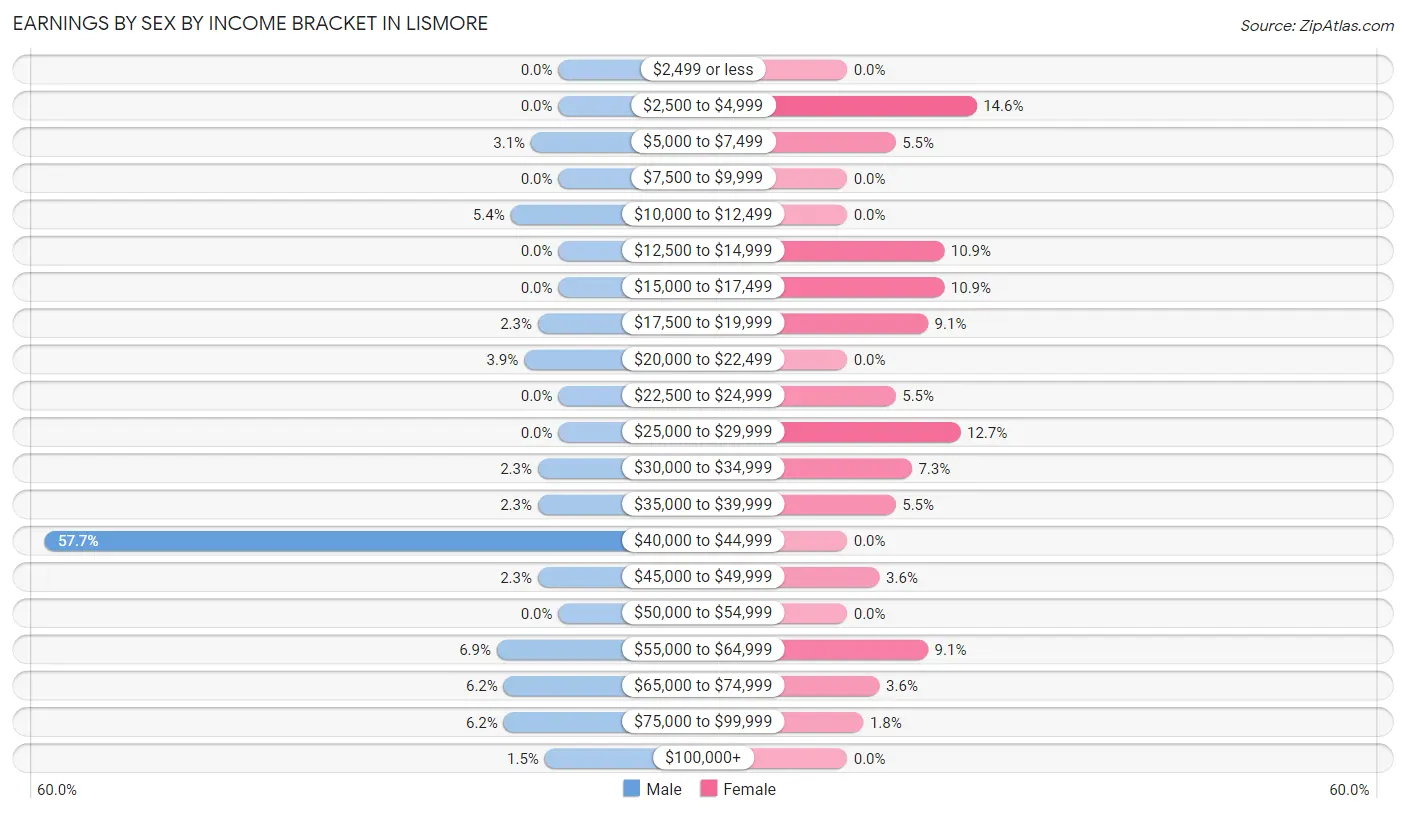
Earnings by Sex by Income Bracket in Lismore
The most common earnings brackets in Lismore are $40,000 to $44,999 for men (75 | 57.7%) and $2,500 to $4,999 for women (8 | 14.5%).
| Income | Male | Female |
| $2,499 or less | 0 (0.0%) | 0 (0.0%) |
| $2,500 to $4,999 | 0 (0.0%) | 8 (14.5%) |
| $5,000 to $7,499 | 4 (3.1%) | 3 (5.4%) |
| $7,500 to $9,999 | 0 (0.0%) | 0 (0.0%) |
| $10,000 to $12,499 | 7 (5.4%) | 0 (0.0%) |
| $12,500 to $14,999 | 0 (0.0%) | 6 (10.9%) |
| $15,000 to $17,499 | 0 (0.0%) | 6 (10.9%) |
| $17,500 to $19,999 | 3 (2.3%) | 5 (9.1%) |
| $20,000 to $22,499 | 5 (3.8%) | 0 (0.0%) |
| $22,500 to $24,999 | 0 (0.0%) | 3 (5.4%) |
| $25,000 to $29,999 | 0 (0.0%) | 7 (12.7%) |
| $30,000 to $34,999 | 3 (2.3%) | 4 (7.3%) |
| $35,000 to $39,999 | 3 (2.3%) | 3 (5.4%) |
| $40,000 to $44,999 | 75 (57.7%) | 0 (0.0%) |
| $45,000 to $49,999 | 3 (2.3%) | 2 (3.6%) |
| $50,000 to $54,999 | 0 (0.0%) | 0 (0.0%) |
| $55,000 to $64,999 | 9 (6.9%) | 5 (9.1%) |
| $65,000 to $74,999 | 8 (6.1%) | 2 (3.6%) |
| $75,000 to $99,999 | 8 (6.1%) | 1 (1.8%) |
| $100,000+ | 2 (1.5%) | 0 (0.0%) |
| Total | 130 (100.0%) | 55 (100.0%) |
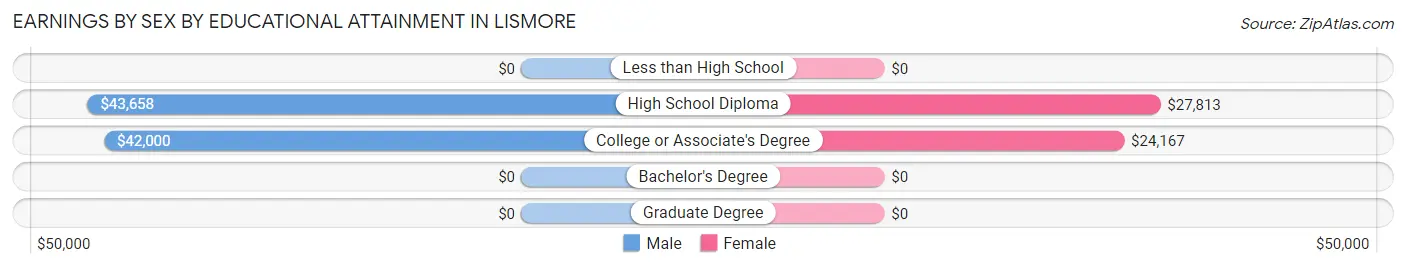
Earnings by Sex by Educational Attainment in Lismore
Average earnings in Lismore are $43,658 for men and $27,500 for women, a difference of 37.0%. Men with an educational attainment of high school diploma enjoy the highest average annual earnings of $43,658, while those with college or associate's degree education earn the least with $42,000. Women with an educational attainment of high school diploma earn the most with the average annual earnings of $27,813, while those with college or associate's degree education have the smallest earnings of $24,167.
| Educational Attainment | Male Income | Female Income |
| Less than High School | - | - |
| High School Diploma | $43,658 | $27,813 |
| College or Associate's Degree | $42,000 | $24,167 |
| Bachelor's Degree | - | - |
| Graduate Degree | - | - |
| Total | $43,658 | $27,500 |
Family Income in Lismore
Family Income Brackets in Lismore
According to the Lismore family income data, there are 80 families falling into the $50,000 to $74,999 income range, which is the most common income bracket and makes up 65.6% of all families.
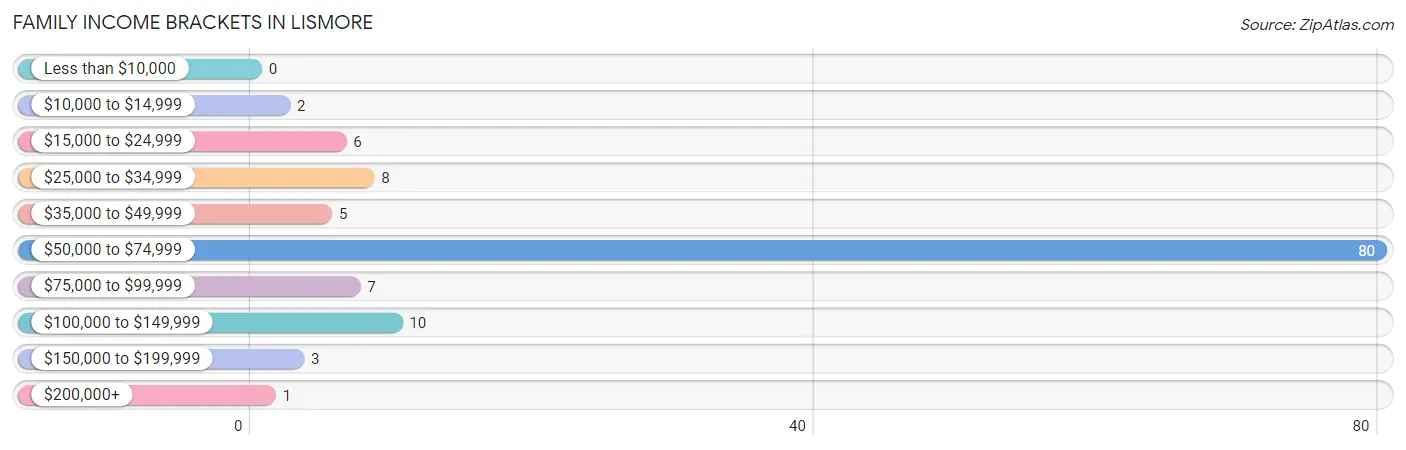
| Income Bracket | # Families | % Families |
| Less than $10,000 | 0 | 0.0% |
| $10,000 to $14,999 | 2 | 1.6% |
| $15,000 to $24,999 | 6 | 4.9% |
| $25,000 to $34,999 | 8 | 6.6% |
| $35,000 to $49,999 | 5 | 4.1% |
| $50,000 to $74,999 | 80 | 65.6% |
| $75,000 to $99,999 | 7 | 5.7% |
| $100,000 to $149,999 | 10 | 8.2% |
| $150,000 to $199,999 | 3 | 2.5% |
| $200,000+ | 1 | 0.8% |
Family Income by Famaliy Size in Lismore
4-person families (16 | 13.1%) account for the highest median family income in Lismore with $96,250 per family, while 2-person families (23 | 18.9%) have the highest median income of $30,938 per family member.
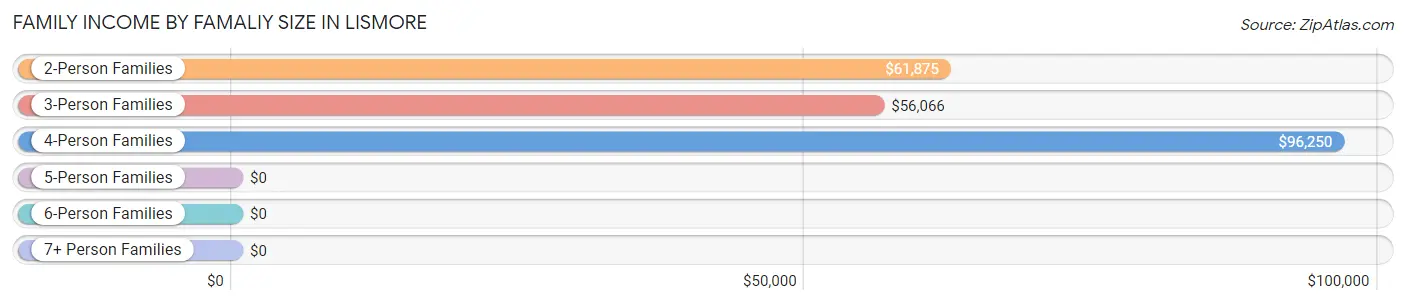
| Income Bracket | # Families | Median Income |
| 2-Person Families | 23 (18.9%) | $61,875 |
| 3-Person Families | 80 (65.6%) | $56,066 |
| 4-Person Families | 16 (13.1%) | $96,250 |
| 5-Person Families | 3 (2.5%) | $0 |
| 6-Person Families | 0 (0.0%) | $0 |
| 7+ Person Families | 0 (0.0%) | $0 |
| Total | 122 (100.0%) | $56,287 |
Family Income by Number of Earners in Lismore
The median family income in Lismore is $56,287, with families comprising 3+ earners (16) having the highest median family income of $96,250, while families with 1 earner (21) have the lowest median family income of $46,750, accounting for 13.1% and 17.2% of families, respectively.
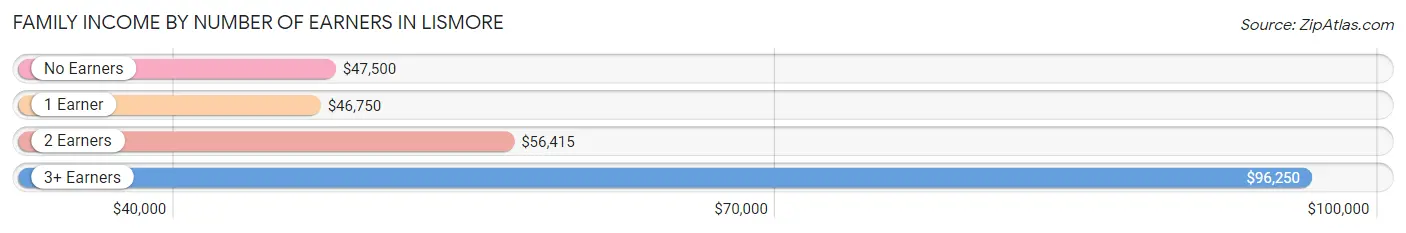
| Number of Earners | # Families | Median Income |
| No Earners | 8 (6.6%) | $47,500 |
| 1 Earner | 21 (17.2%) | $46,750 |
| 2 Earners | 77 (63.1%) | $56,415 |
| 3+ Earners | 16 (13.1%) | $96,250 |
| Total | 122 (100.0%) | $56,287 |
Household Income in Lismore
Household Income Brackets in Lismore
With 84 households falling in the category, the $50,000 to $74,999 income range is the most frequent in Lismore, accounting for 52.8% of all households. In contrast, only 1 households (0.6%) fall into the less than $10,000 income bracket, making it the least populous group.
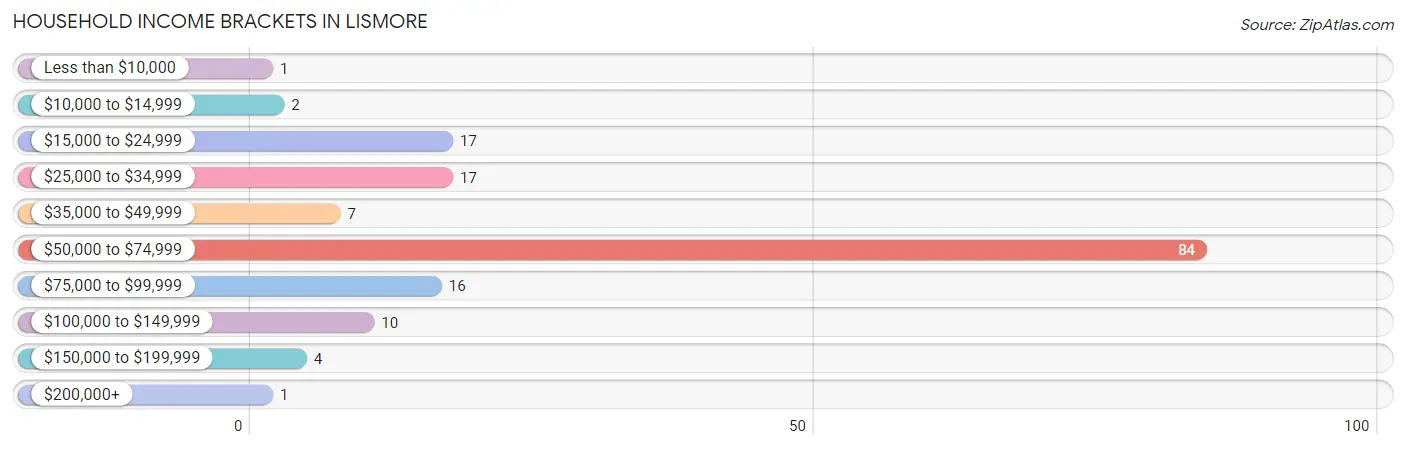
| Income Bracket | # Households | % Households |
| Less than $10,000 | 1 | 0.6% |
| $10,000 to $14,999 | 2 | 1.3% |
| $15,000 to $24,999 | 17 | 10.7% |
| $25,000 to $34,999 | 17 | 10.7% |
| $35,000 to $49,999 | 7 | 4.4% |
| $50,000 to $74,999 | 84 | 52.8% |
| $75,000 to $99,999 | 16 | 10.1% |
| $100,000 to $149,999 | 10 | 6.3% |
| $150,000 to $199,999 | 4 | 2.5% |
| $200,000+ | 1 | 0.6% |
Household Income by Householder Age in Lismore
The median household income in Lismore is $56,069, with the highest median household income of $76,250 found in the 15 to 24 years age bracket for the primary householder. A total of 7 households (4.4%) fall into this category. Meanwhile, the 65+ years age bracket for the primary householder has the lowest median household income of $33,750, with 29 households (18.2%) in this group.
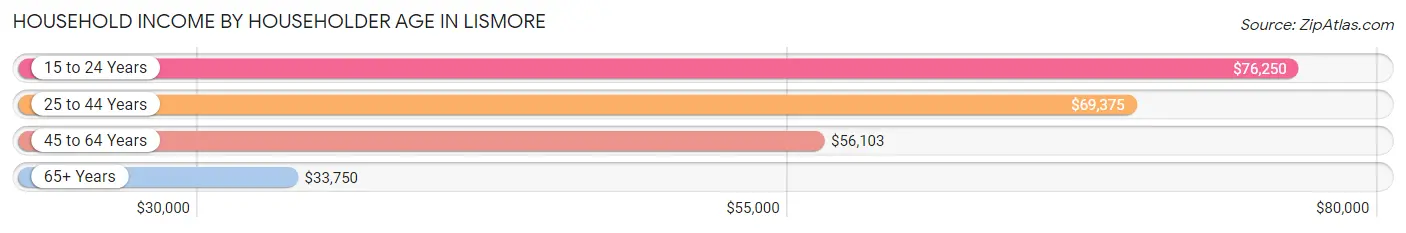
| Income Bracket | # Households | Median Income |
| 15 to 24 Years | 7 (4.4%) | $76,250 |
| 25 to 44 Years | 29 (18.2%) | $69,375 |
| 45 to 64 Years | 94 (59.1%) | $56,103 |
| 65+ Years | 29 (18.2%) | $33,750 |
| Total | 159 (100.0%) | $56,069 |
Poverty in Lismore
Income Below Poverty by Sex and Age in Lismore
With 12.0% poverty level for males and 19.3% for females among the residents of Lismore, 15 year old males and under 5 year old females are the most vulnerable to poverty, with 4 males (100.0%) and 5 females (100.0%) in their respective age groups living below the poverty level.
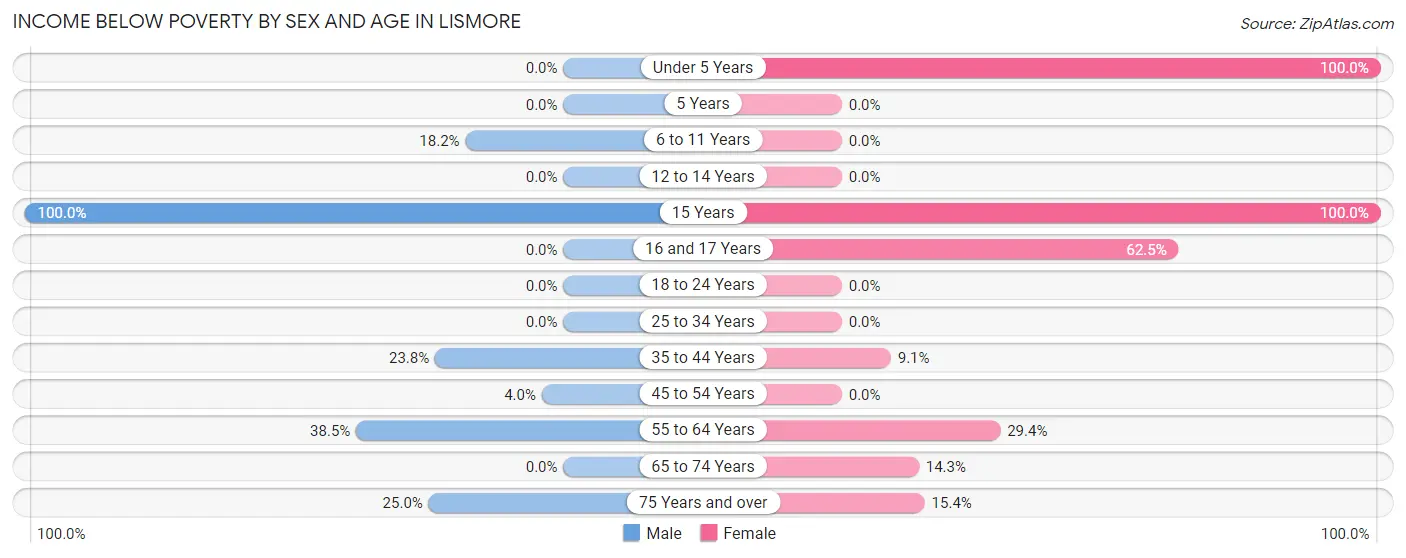
| Age Bracket | Male | Female |
| Under 5 Years | 0 (0.0%) | 5 (100.0%) |
| 5 Years | 0 (0.0%) | 0 (0.0%) |
| 6 to 11 Years | 4 (18.2%) | 0 (0.0%) |
| 12 to 14 Years | 0 (0.0%) | 0 (0.0%) |
| 15 Years | 4 (100.0%) | 1 (100.0%) |
| 16 and 17 Years | 0 (0.0%) | 5 (62.5%) |
| 18 to 24 Years | 0 (0.0%) | 0 (0.0%) |
| 25 to 34 Years | 0 (0.0%) | 0 (0.0%) |
| 35 to 44 Years | 5 (23.8%) | 1 (9.1%) |
| 45 to 54 Years | 3 (4.0%) | 0 (0.0%) |
| 55 to 64 Years | 5 (38.5%) | 5 (29.4%) |
| 65 to 74 Years | 0 (0.0%) | 2 (14.3%) |
| 75 Years and over | 1 (25.0%) | 2 (15.4%) |
| Total | 22 (12.0%) | 21 (19.3%) |
Income Above Poverty by Sex and Age in Lismore
According to the poverty statistics in Lismore, males aged under 5 years and females aged 5 years are the age groups that are most secure financially, with 100.0% of males and 100.0% of females in these age groups living above the poverty line.
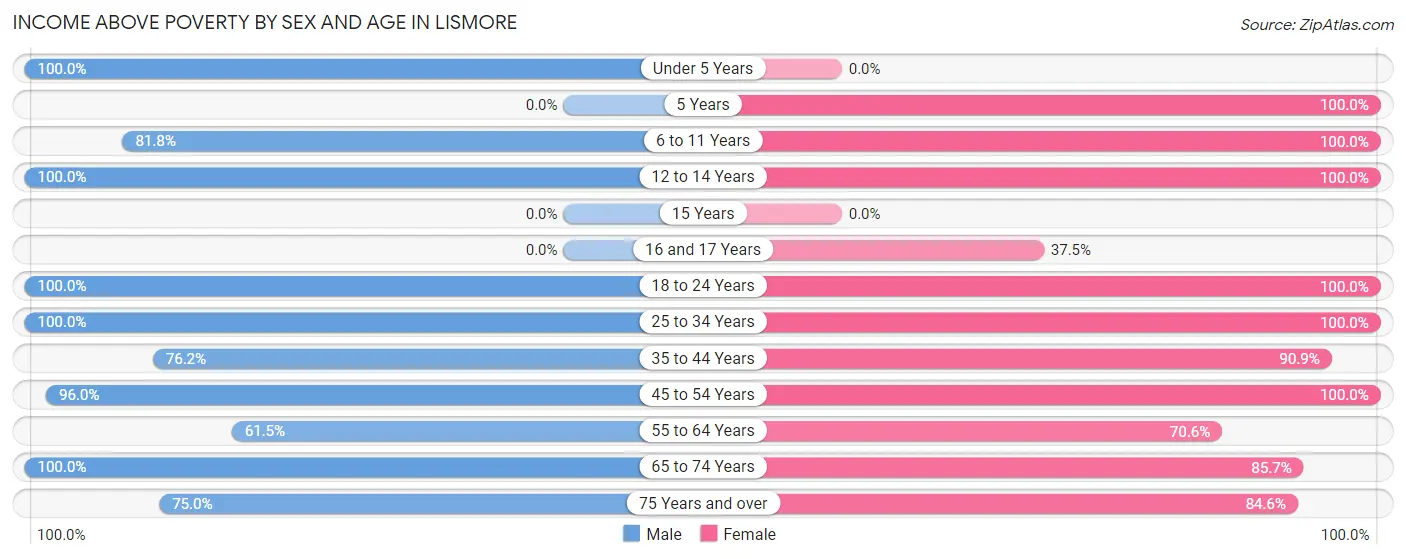
| Age Bracket | Male | Female |
| Under 5 Years | 10 (100.0%) | 0 (0.0%) |
| 5 Years | 0 (0.0%) | 2 (100.0%) |
| 6 to 11 Years | 18 (81.8%) | 7 (100.0%) |
| 12 to 14 Years | 1 (100.0%) | 2 (100.0%) |
| 15 Years | 0 (0.0%) | 0 (0.0%) |
| 16 and 17 Years | 0 (0.0%) | 3 (37.5%) |
| 18 to 24 Years | 7 (100.0%) | 17 (100.0%) |
| 25 to 34 Years | 15 (100.0%) | 2 (100.0%) |
| 35 to 44 Years | 16 (76.2%) | 10 (90.9%) |
| 45 to 54 Years | 72 (96.0%) | 10 (100.0%) |
| 55 to 64 Years | 8 (61.5%) | 12 (70.6%) |
| 65 to 74 Years | 11 (100.0%) | 12 (85.7%) |
| 75 Years and over | 3 (75.0%) | 11 (84.6%) |
| Total | 161 (88.0%) | 88 (80.7%) |
Income Below Poverty Among Married-Couple Families in Lismore
The poverty statistics for married-couple families in Lismore show that 7.3% or 8 of the total 109 families live below the poverty line. Families with 1 or 2 children have the highest poverty rate of 33.3%, comprising of 6 families. On the other hand, families with 3 or 4 children have the lowest poverty rate of 0.0%, which includes 0 families.
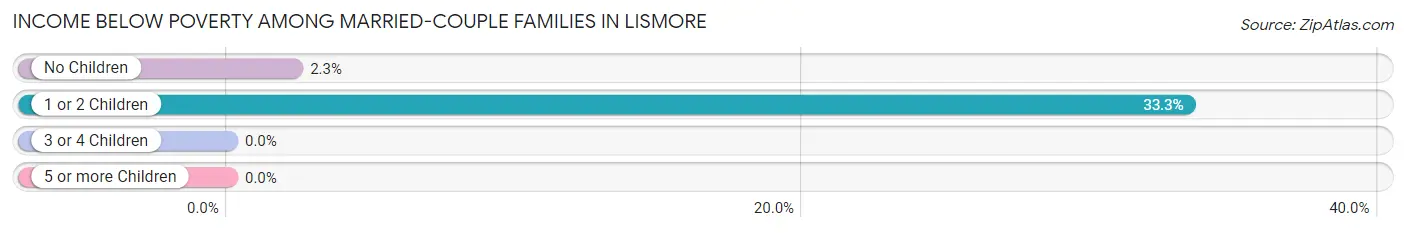
| Children | Above Poverty | Below Poverty |
| No Children | 86 (97.7%) | 2 (2.3%) |
| 1 or 2 Children | 12 (66.7%) | 6 (33.3%) |
| 3 or 4 Children | 3 (100.0%) | 0 (0.0%) |
| 5 or more Children | 0 (0.0%) | 0 (0.0%) |
| Total | 101 (92.7%) | 8 (7.3%) |
Income Below Poverty Among Single-Parent Households in Lismore
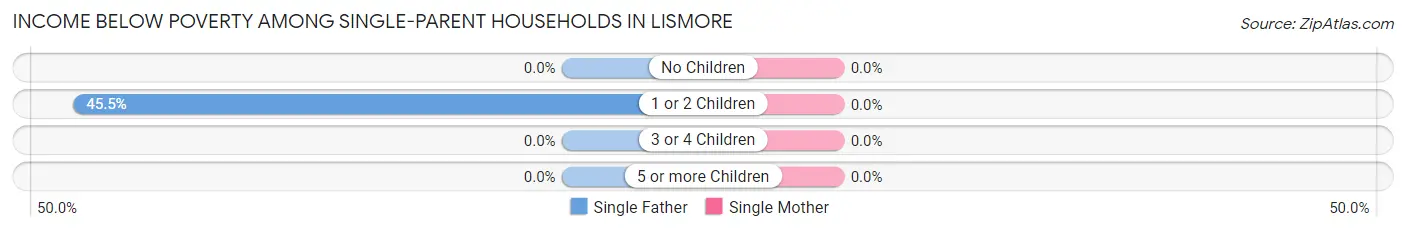
| Children | Single Father | Single Mother |
| No Children | 0 (0.0%) | 0 (0.0%) |
| 1 or 2 Children | 5 (45.5%) | 0 (0.0%) |
| 3 or 4 Children | 0 (0.0%) | 0 (0.0%) |
| 5 or more Children | 0 (0.0%) | 0 (0.0%) |
| Total | 5 (41.7%) | 0 (0.0%) |
Income Below Poverty Among Married-Couple vs Single-Parent Households in Lismore
The poverty data for Lismore shows that 8 of the married-couple family households (7.3%) and 5 of the single-parent households (38.5%) are living below the poverty level. Within the married-couple family households, those with 1 or 2 children have the highest poverty rate, with 6 households (33.3%) falling below the poverty line. Among the single-parent households, those with 1 or 2 children have the highest poverty rate, with 5 household (41.7%) living below poverty.
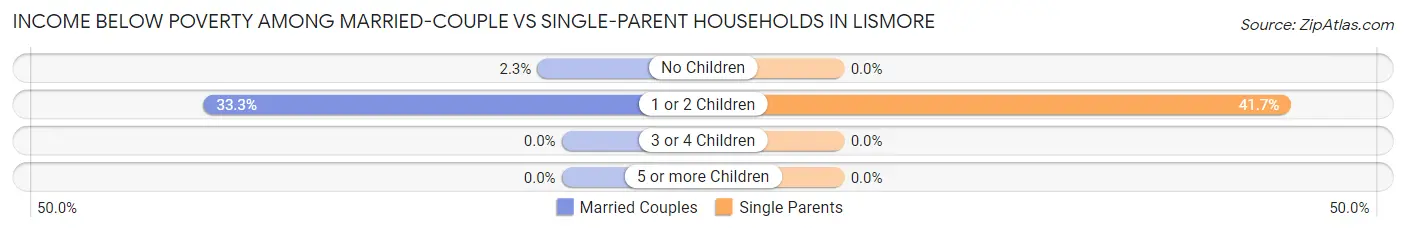
| Children | Married-Couple Families | Single-Parent Households |
| No Children | 2 (2.3%) | 0 (0.0%) |
| 1 or 2 Children | 6 (33.3%) | 5 (41.7%) |
| 3 or 4 Children | 0 (0.0%) | 0 (0.0%) |
| 5 or more Children | 0 (0.0%) | 0 (0.0%) |
| Total | 8 (7.3%) | 5 (38.5%) |
Race in Lismore
The most populous races in Lismore are White / Caucasian (254 | 87.0%), Hispanic or Latino (105 | 36.0%), and Two or more Races (25 | 8.6%).
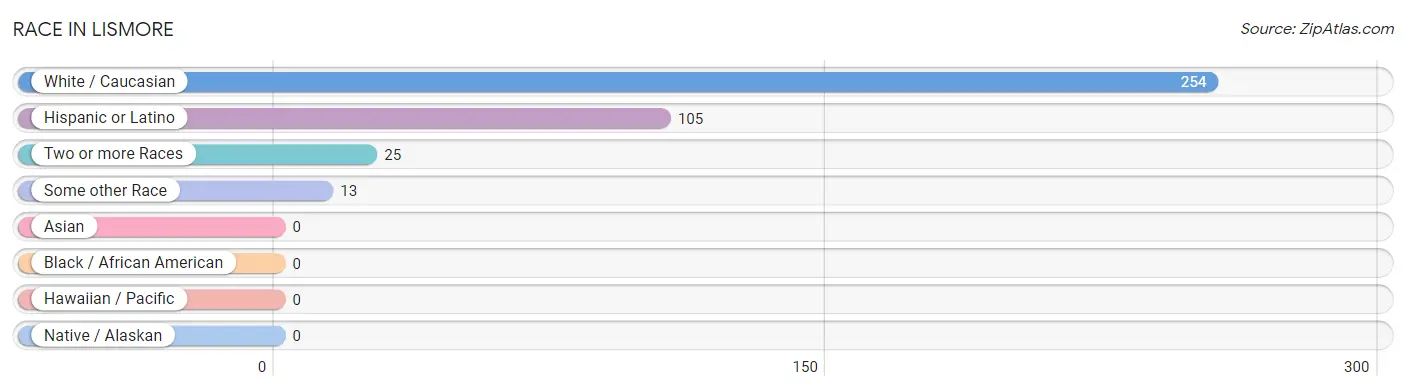
| Race | # Population | % Population |
| Asian | 0 | 0.0% |
| Black / African American | 0 | 0.0% |
| Hawaiian / Pacific | 0 | 0.0% |
| Hispanic or Latino | 105 | 36.0% |
| Native / Alaskan | 0 | 0.0% |
| White / Caucasian | 254 | 87.0% |
| Two or more Races | 25 | 8.6% |
| Some other Race | 13 | 4.4% |
| Total | 292 | 100.0% |
Ancestry in Lismore
The most populous ancestries reported in Lismore are German (103 | 35.3%), Central American (86 | 29.4%), Guatemalan (68 | 23.3%), Norwegian (40 | 13.7%), and American (20 | 6.9%), together accounting for 108.6% of all Lismore residents.
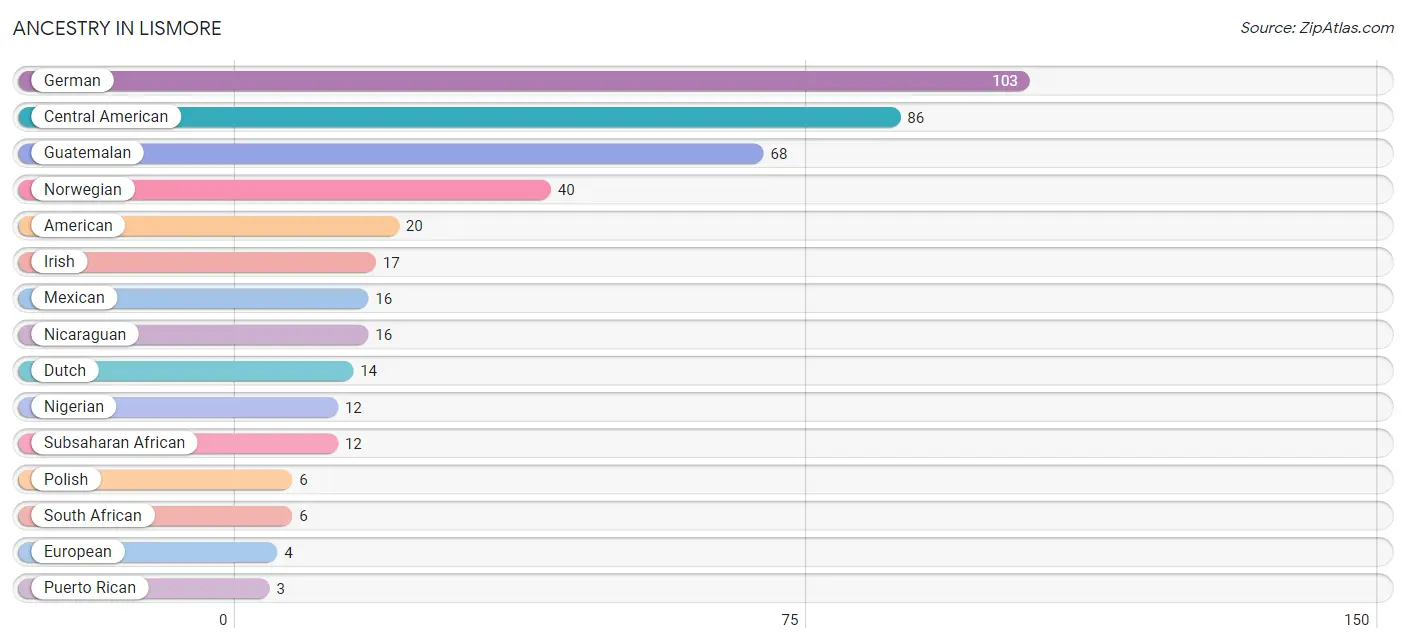
| Ancestry | # Population | % Population |
| American | 20 | 6.9% |
| Central American | 86 | 29.4% |
| Dutch | 14 | 4.8% |
| European | 4 | 1.4% |
| French | 1 | 0.3% |
| German | 103 | 35.3% |
| Guatemalan | 68 | 23.3% |
| Irish | 17 | 5.8% |
| Italian | 1 | 0.3% |
| Luxembourger | 1 | 0.3% |
| Mexican | 16 | 5.5% |
| Nicaraguan | 16 | 5.5% |
| Nigerian | 12 | 4.1% |
| Norwegian | 40 | 13.7% |
| Polish | 6 | 2.1% |
| Puerto Rican | 3 | 1.0% |
| Russian | 1 | 0.3% |
| Salvadoran | 2 | 0.7% |
| South African | 6 | 2.1% |
| Subsaharan African | 12 | 4.1% |
| Swedish | 1 | 0.3% | View All 21 Rows |
Immigrants in Lismore
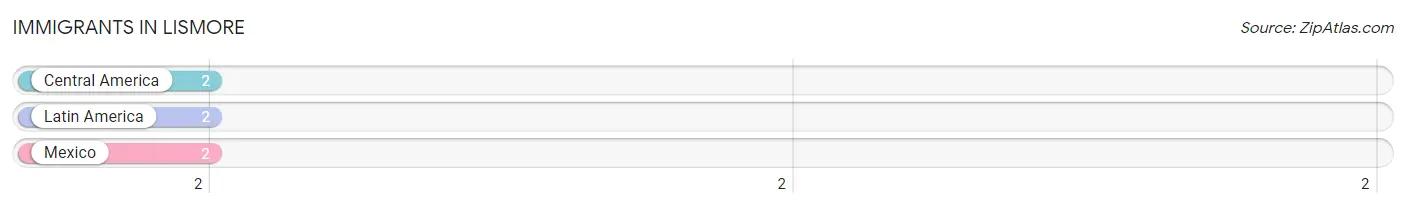
The most numerous immigrant groups reported in Lismore came from Central America (2 | 0.7%), Latin America (2 | 0.7%), and Mexico (2 | 0.7%), together accounting for 2.0% of all Lismore residents.
| Immigration Origin | # Population | % Population |
| Central America | 2 | 0.7% |
| Latin America | 2 | 0.7% |
| Mexico | 2 | 0.7% | View All 3 Rows |
Sex and Age in Lismore
Sex and Age in Lismore
The most populous age groups in Lismore are 50 to 54 Years (69 | 37.7%) for men and 15 to 19 Years (19 | 17.4%) for women.
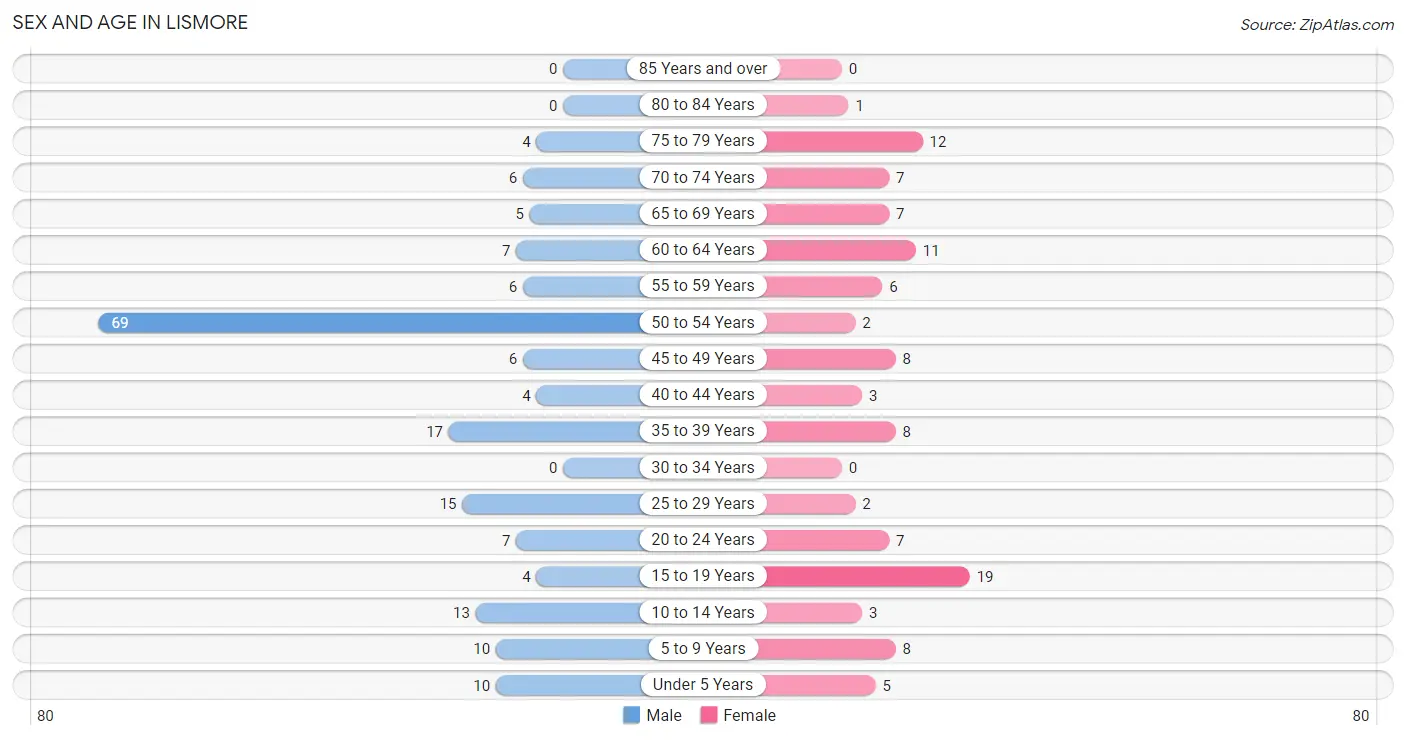
| Age Bracket | Male | Female |
| Under 5 Years | 10 (5.5%) | 5 (4.6%) |
| 5 to 9 Years | 10 (5.5%) | 8 (7.3%) |
| 10 to 14 Years | 13 (7.1%) | 3 (2.8%) |
| 15 to 19 Years | 4 (2.2%) | 19 (17.4%) |
| 20 to 24 Years | 7 (3.8%) | 7 (6.4%) |
| 25 to 29 Years | 15 (8.2%) | 2 (1.8%) |
| 30 to 34 Years | 0 (0.0%) | 0 (0.0%) |
| 35 to 39 Years | 17 (9.3%) | 8 (7.3%) |
| 40 to 44 Years | 4 (2.2%) | 3 (2.8%) |
| 45 to 49 Years | 6 (3.3%) | 8 (7.3%) |
| 50 to 54 Years | 69 (37.7%) | 2 (1.8%) |
| 55 to 59 Years | 6 (3.3%) | 6 (5.5%) |
| 60 to 64 Years | 7 (3.8%) | 11 (10.1%) |
| 65 to 69 Years | 5 (2.7%) | 7 (6.4%) |
| 70 to 74 Years | 6 (3.3%) | 7 (6.4%) |
| 75 to 79 Years | 4 (2.2%) | 12 (11.0%) |
| 80 to 84 Years | 0 (0.0%) | 1 (0.9%) |
| 85 Years and over | 0 (0.0%) | 0 (0.0%) |
| Total | 183 (100.0%) | 109 (100.0%) |
Families and Households in Lismore
Median Family Size in Lismore
The median family size in Lismore is 2.04 persons per family, with single male/father families (12 | 9.8%) accounting for the largest median family size of 3 persons per family. On the other hand, married-couple families (109 | 89.3%) represent the smallest median family size with 1.93 persons per family.
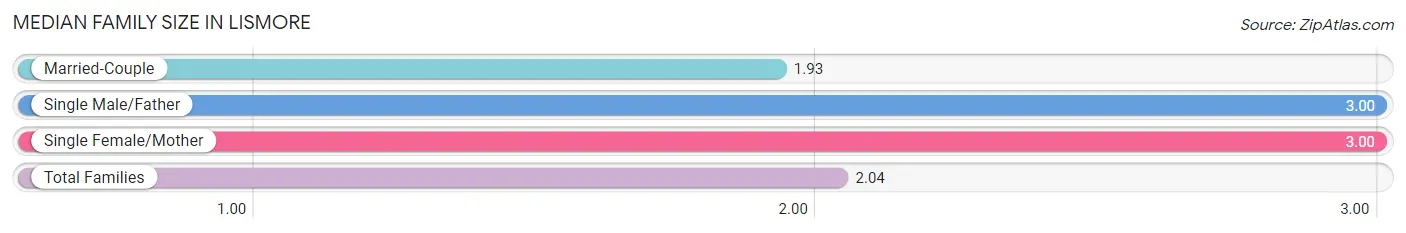
| Family Type | # Families | Family Size |
| Married-Couple | 109 (89.3%) | 1.93 |
| Single Male/Father | 12 (9.8%) | 3.00 |
| Single Female/Mother | 1 (0.8%) | 3.00 |
| Total Families | 122 (100.0%) | 2.04 |
Median Household Size in Lismore
The median household size in Lismore is 1.84 persons per household, with single male/father households (12 | 7.5%) accounting for the largest median household size of 3.08 persons per household. non-family households (37 | 23.3%) represent the smallest median household size with 1.14 persons per household.
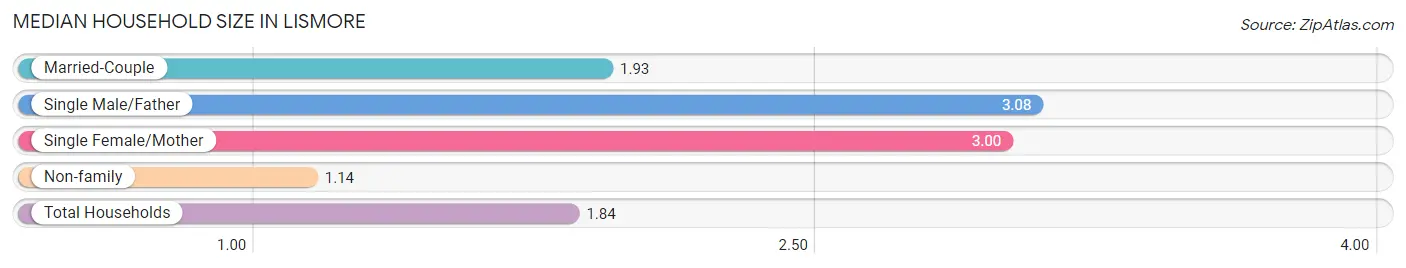
| Household Type | # Households | Household Size |
| Married-Couple | 109 (68.5%) | 1.93 |
| Single Male/Father | 12 (7.5%) | 3.08 |
| Single Female/Mother | 1 (0.6%) | 3.00 |
| Non-family | 37 (23.3%) | 1.14 |
| Total Households | 159 (100.0%) | 1.84 |
Household Size by Marriage Status in Lismore
Out of a total of 159 households in Lismore, 122 (76.7%) are family households, while 37 (23.3%) are nonfamily households. The most numerous type of family households are 3-person households, comprising 81, and the most common type of nonfamily households are 1-person households, comprising 34.
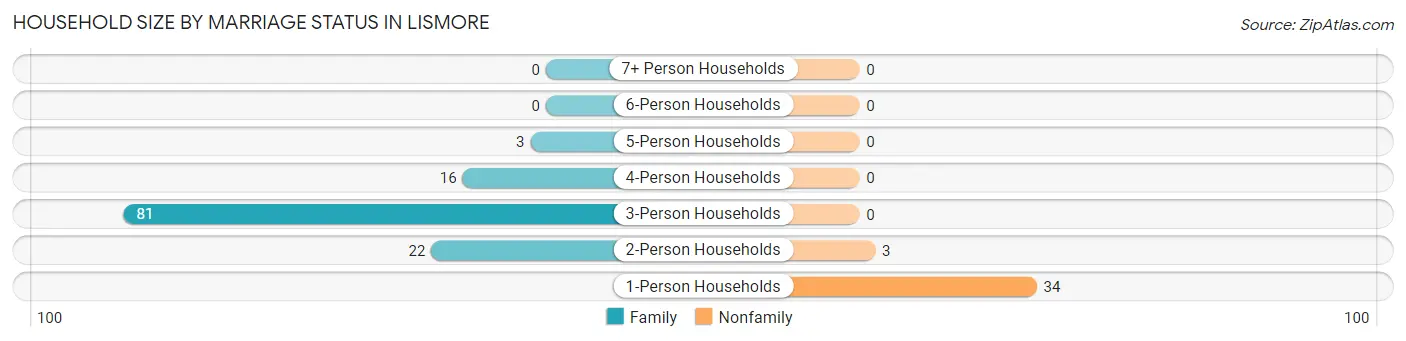
| Household Size | Family Households | Nonfamily Households |
| 1-Person Households | - | 34 (21.4%) |
| 2-Person Households | 22 (13.8%) | 3 (1.9%) |
| 3-Person Households | 81 (50.9%) | 0 (0.0%) |
| 4-Person Households | 16 (10.1%) | 0 (0.0%) |
| 5-Person Households | 3 (1.9%) | 0 (0.0%) |
| 6-Person Households | 0 (0.0%) | 0 (0.0%) |
| 7+ Person Households | 0 (0.0%) | 0 (0.0%) |
| Total | 122 (76.7%) | 37 (23.3%) |
Female Fertility in Lismore
Fertility by Age in Lismore
Average fertility rate in Lismore is 106.0 births per 1,000 women. Women in the age bracket of 20 to 34 years have the highest fertility rate with 556.0 births per 1,000 women. Women in the age bracket of 20 to 34 years acount for 100.0% of all women with births.
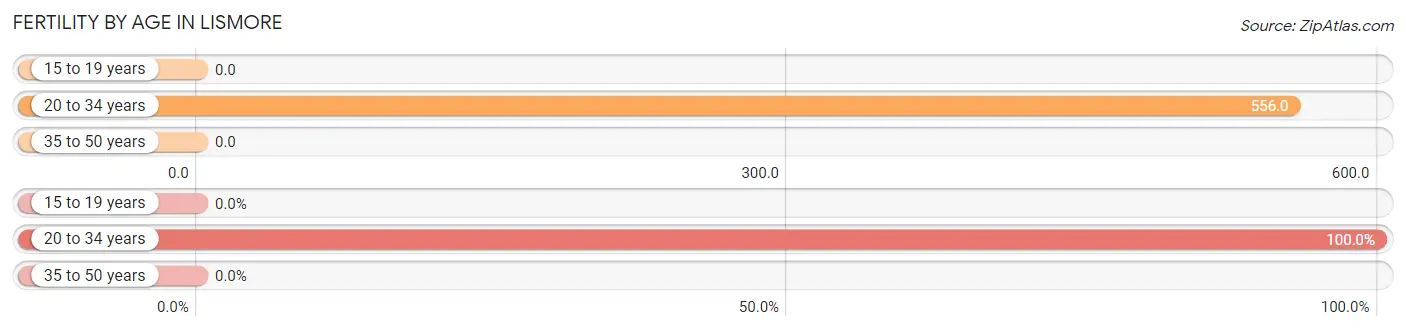
| Age Bracket | Women with Births | Births / 1,000 Women |
| 15 to 19 years | 0 (0.0%) | 0.0 |
| 20 to 34 years | 5 (100.0%) | 556.0 |
| 35 to 50 years | 0 (0.0%) | 0.0 |
| Total | 5 (100.0%) | 106.0 |
Fertility by Age by Marriage Status in Lismore
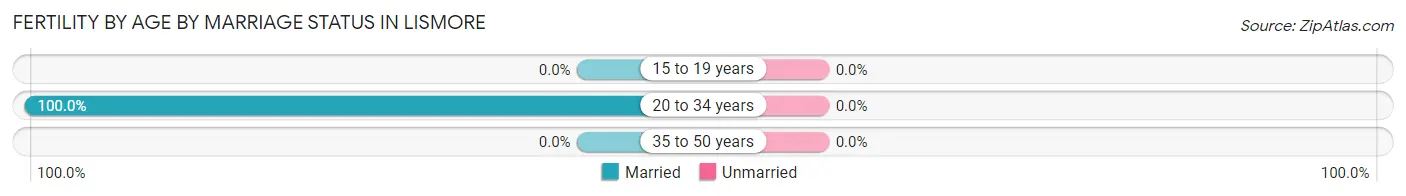
| Age Bracket | Married | Unmarried |
| 15 to 19 years | 0 (0.0%) | 0 (0.0%) |
| 20 to 34 years | 5 (100.0%) | 0 (0.0%) |
| 35 to 50 years | 0 (0.0%) | 0 (0.0%) |
| Total | 5 (100.0%) | 0 (0.0%) |
Fertility by Education in Lismore
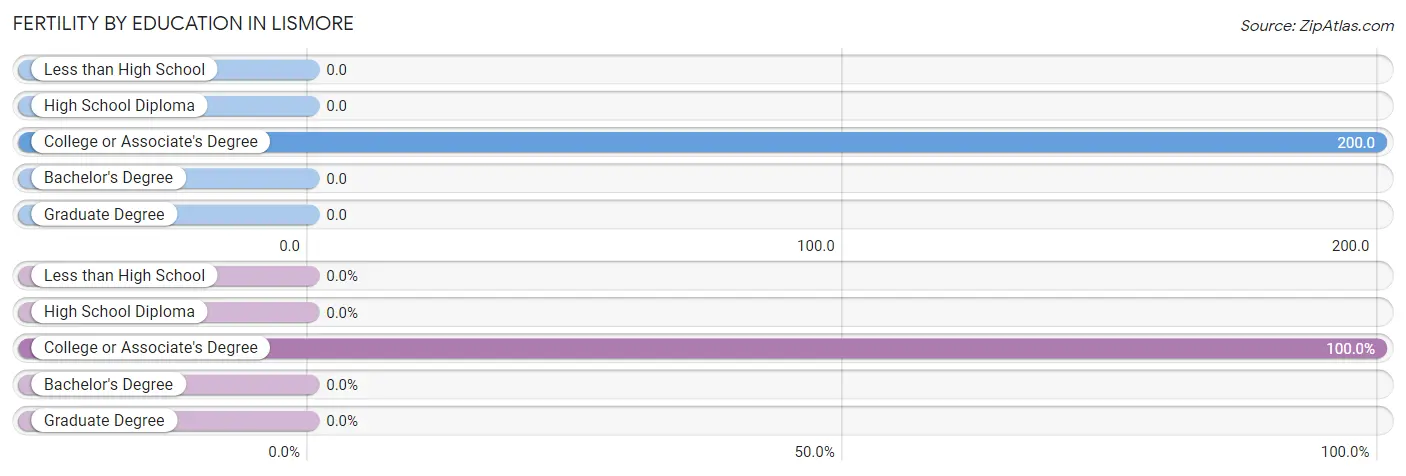
| Educational Attainment | Women with Births | Births / 1,000 Women |
| Less than High School | 0 (0.0%) | 0.0 |
| High School Diploma | 0 (0.0%) | 0.0 |
| College or Associate's Degree | 5 (100.0%) | 200.0 |
| Bachelor's Degree | 0 (0.0%) | 0.0 |
| Graduate Degree | 0 (0.0%) | 0.0 |
| Total | 5 (100.0%) | 106.0 |
Fertility by Education by Marriage Status in Lismore
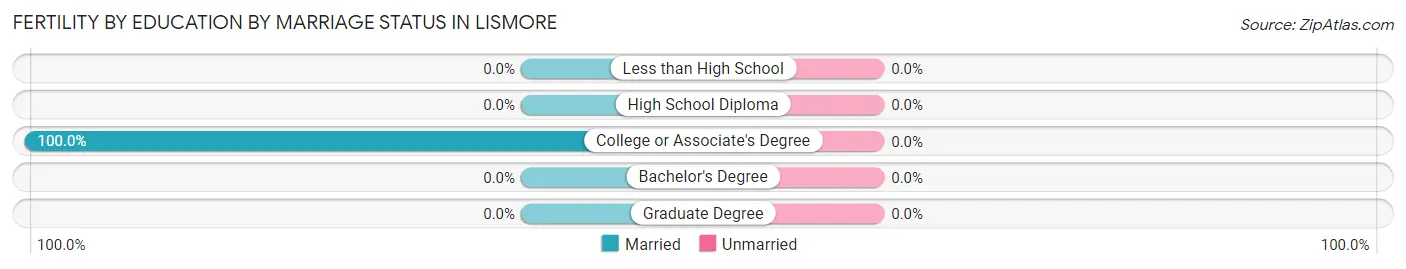
| Educational Attainment | Married | Unmarried |
| Less than High School | 0 (0.0%) | 0 (0.0%) |
| High School Diploma | 0 (0.0%) | 0 (0.0%) |
| College or Associate's Degree | 5 (100.0%) | 0 (0.0%) |
| Bachelor's Degree | 0 (0.0%) | 0 (0.0%) |
| Graduate Degree | 0 (0.0%) | 0 (0.0%) |
| Total | 5 (100.0%) | 0 (0.0%) |
Employment Characteristics in Lismore
Employment by Class of Employer in Lismore
Among the 181 employed individuals in Lismore, private company employees (157 | 86.7%), not-for-profit organizations (7 | 3.9%), and self-employed (incorporated) (6 | 3.3%) make up the most common classes of employment.
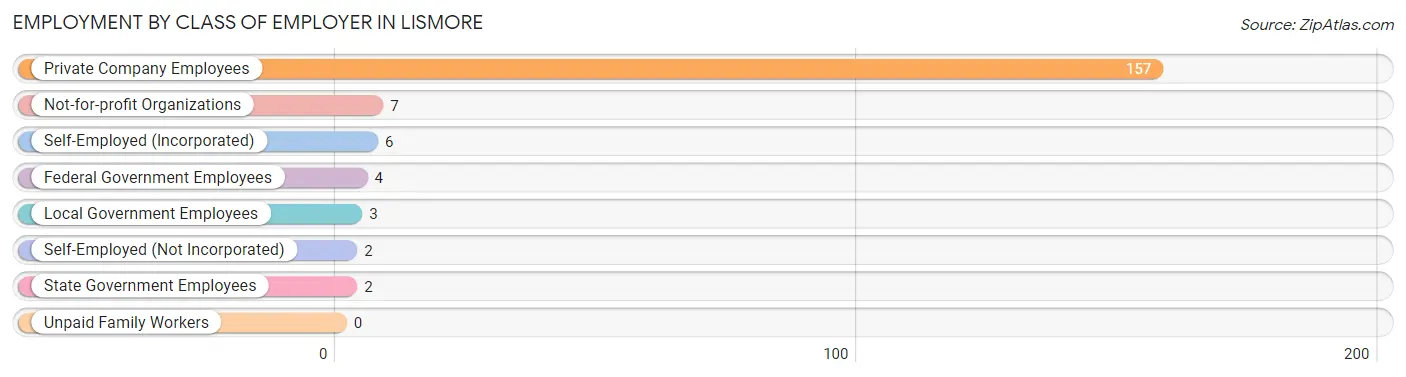
| Employer Class | # Employees | % Employees |
| Private Company Employees | 157 | 86.7% |
| Self-Employed (Incorporated) | 6 | 3.3% |
| Self-Employed (Not Incorporated) | 2 | 1.1% |
| Not-for-profit Organizations | 7 | 3.9% |
| Local Government Employees | 3 | 1.7% |
| State Government Employees | 2 | 1.1% |
| Federal Government Employees | 4 | 2.2% |
| Unpaid Family Workers | 0 | 0.0% |
| Total | 181 | 100.0% |
Employment Status by Age in Lismore
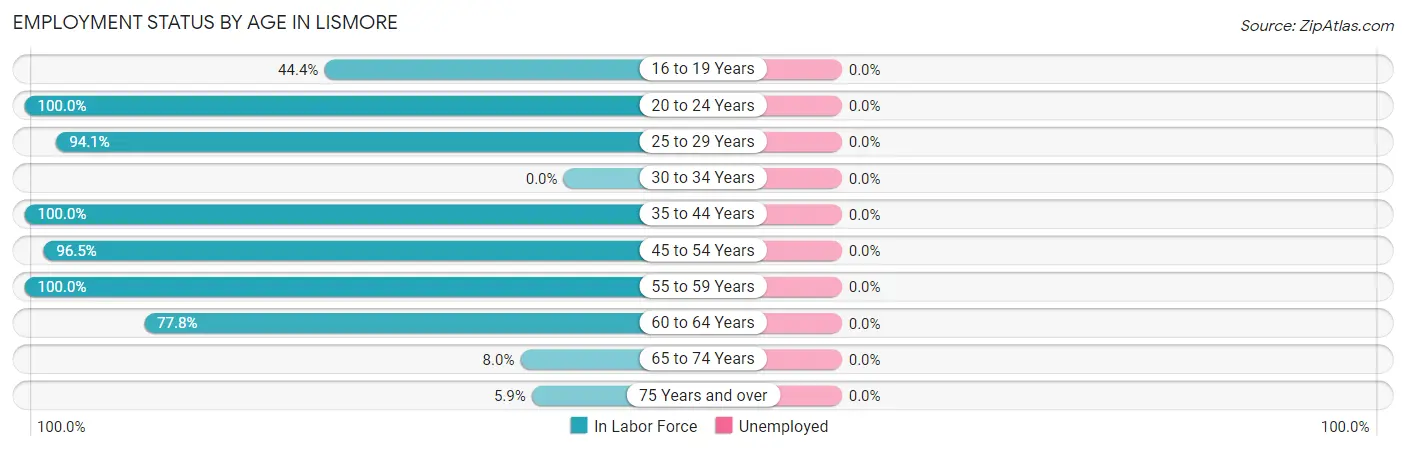
| Age Bracket | In Labor Force | Unemployed |
| 16 to 19 Years | 8 (44.4%) | 0 (0.0%) |
| 20 to 24 Years | 14 (100.0%) | 0 (0.0%) |
| 25 to 29 Years | 16 (94.1%) | 0 (0.0%) |
| 30 to 34 Years | 0 (0.0%) | 0 (0.0%) |
| 35 to 44 Years | 32 (100.0%) | 0 (0.0%) |
| 45 to 54 Years | 82 (96.5%) | 0 (0.0%) |
| 55 to 59 Years | 12 (100.0%) | 0 (0.0%) |
| 60 to 64 Years | 14 (77.8%) | 0 (0.0%) |
| 65 to 74 Years | 2 (8.0%) | 0 (0.0%) |
| 75 Years and over | 1 (5.9%) | 0 (0.0%) |
| Total | 181 (76.1%) | 0 (0.0%) |
Employment Status by Educational Attainment in Lismore
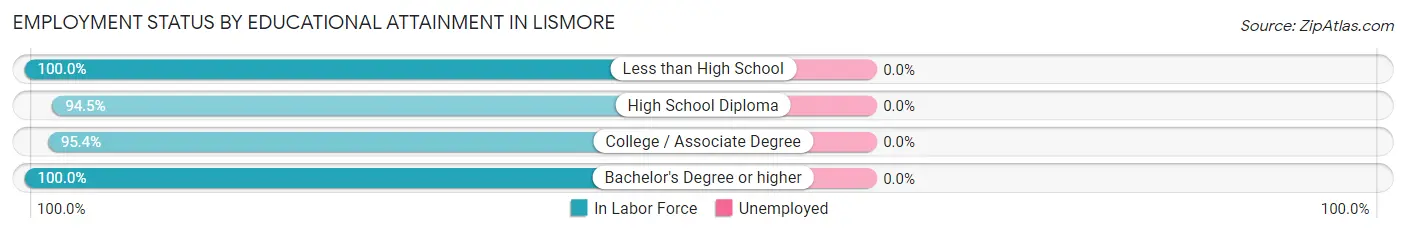
| Educational Attainment | In Labor Force | Unemployed |
| Less than High School | 2 (100.0%) | 0 (0.0%) |
| High School Diploma | 86 (94.5%) | 0 (0.0%) |
| College / Associate Degree | 62 (95.4%) | 0 (0.0%) |
| Bachelor's Degree or higher | 6 (100.0%) | 0 (0.0%) |
| Total | 156 (95.1%) | 0 (0.0%) |
Employment Occupations by Sex in Lismore
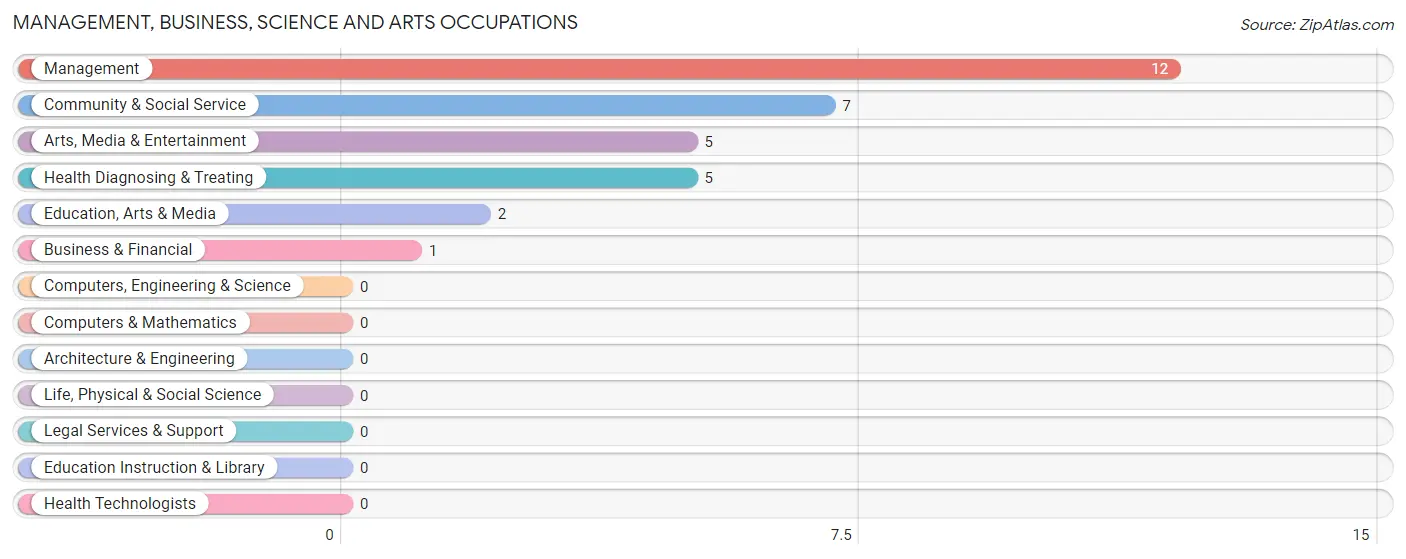
Management, Business, Science and Arts Occupations
The most common Management, Business, Science and Arts occupations in Lismore are Management (12 | 6.6%), Community & Social Service (7 | 3.9%), Arts, Media & Entertainment (5 | 2.8%), Health Diagnosing & Treating (5 | 2.8%), and Education, Arts & Media (2 | 1.1%).
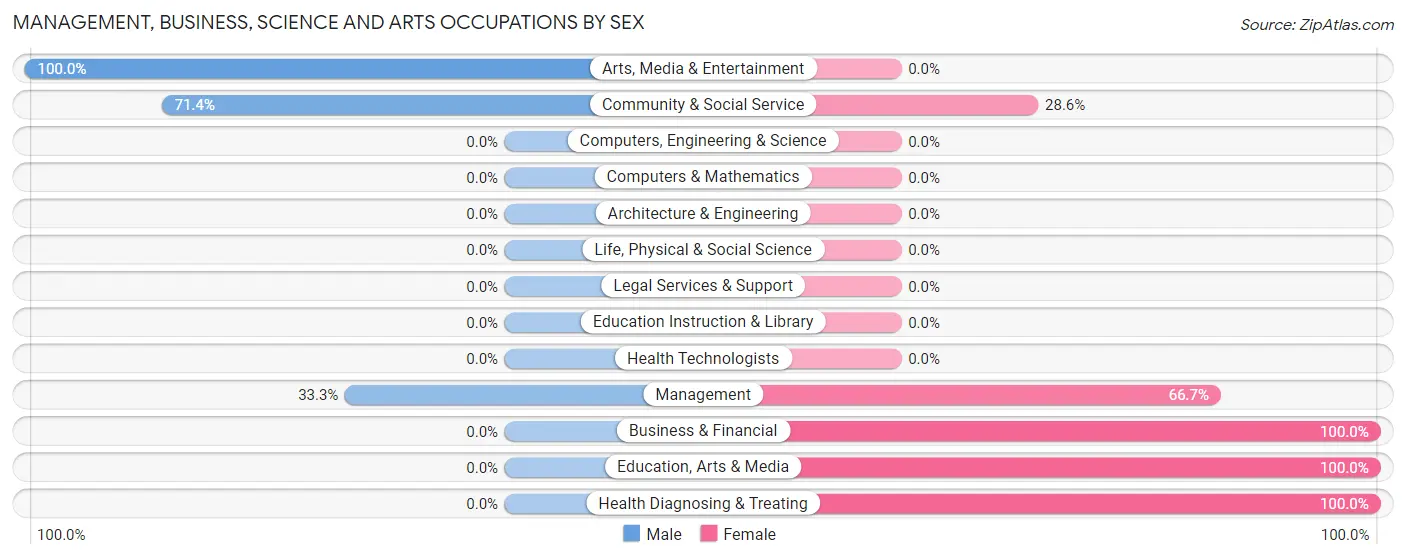
Management, Business, Science and Arts Occupations by Sex
Within the Management, Business, Science and Arts occupations in Lismore, the most male-oriented occupations are Arts, Media & Entertainment (100.0%), Community & Social Service (71.4%), and Management (33.3%), while the most female-oriented occupations are Business & Financial (100.0%), Education, Arts & Media (100.0%), and Health Diagnosing & Treating (100.0%).
| Occupation | Male | Female |
| Management | 4 (33.3%) | 8 (66.7%) |
| Business & Financial | 0 (0.0%) | 1 (100.0%) |
| Computers, Engineering & Science | 0 (0.0%) | 0 (0.0%) |
| Computers & Mathematics | 0 (0.0%) | 0 (0.0%) |
| Architecture & Engineering | 0 (0.0%) | 0 (0.0%) |
| Life, Physical & Social Science | 0 (0.0%) | 0 (0.0%) |
| Community & Social Service | 5 (71.4%) | 2 (28.6%) |
| Education, Arts & Media | 0 (0.0%) | 2 (100.0%) |
| Legal Services & Support | 0 (0.0%) | 0 (0.0%) |
| Education Instruction & Library | 0 (0.0%) | 0 (0.0%) |
| Arts, Media & Entertainment | 5 (100.0%) | 0 (0.0%) |
| Health Diagnosing & Treating | 0 (0.0%) | 5 (100.0%) |
| Health Technologists | 0 (0.0%) | 0 (0.0%) |
| Total (Category) | 9 (36.0%) | 16 (64.0%) |
| Total (Overall) | 126 (69.6%) | 55 (30.4%) |
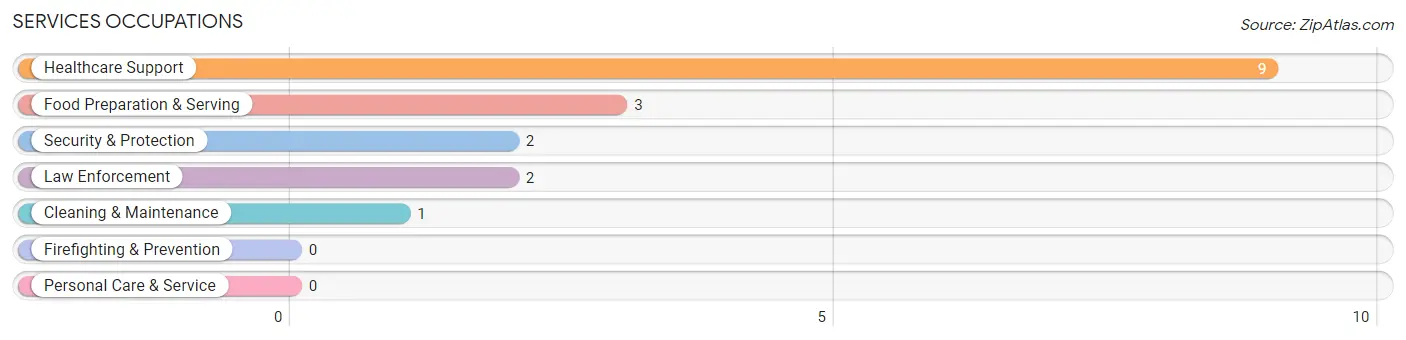
Services Occupations
The most common Services occupations in Lismore are Healthcare Support (9 | 5.0%), Food Preparation & Serving (3 | 1.7%), Security & Protection (2 | 1.1%), Law Enforcement (2 | 1.1%), and Cleaning & Maintenance (1 | 0.5%).
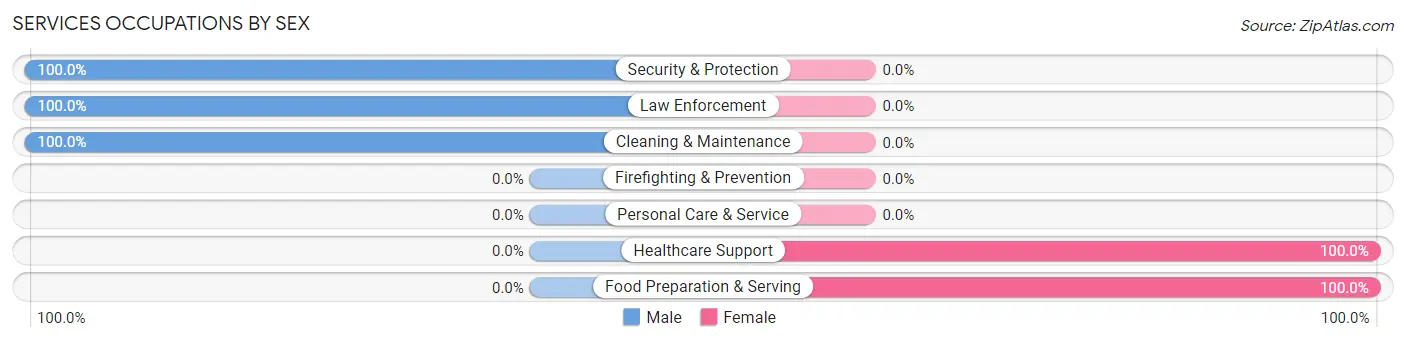
Services Occupations by Sex
Within the Services occupations in Lismore, the most male-oriented occupations are Security & Protection (100.0%), Law Enforcement (100.0%), and Cleaning & Maintenance (100.0%), while the most female-oriented occupations are Healthcare Support (100.0%), and Food Preparation & Serving (100.0%).
| Occupation | Male | Female |
| Healthcare Support | 0 (0.0%) | 9 (100.0%) |
| Security & Protection | 2 (100.0%) | 0 (0.0%) |
| Firefighting & Prevention | 0 (0.0%) | 0 (0.0%) |
| Law Enforcement | 2 (100.0%) | 0 (0.0%) |
| Food Preparation & Serving | 0 (0.0%) | 3 (100.0%) |
| Cleaning & Maintenance | 1 (100.0%) | 0 (0.0%) |
| Personal Care & Service | 0 (0.0%) | 0 (0.0%) |
| Total (Category) | 3 (20.0%) | 12 (80.0%) |
| Total (Overall) | 126 (69.6%) | 55 (30.4%) |
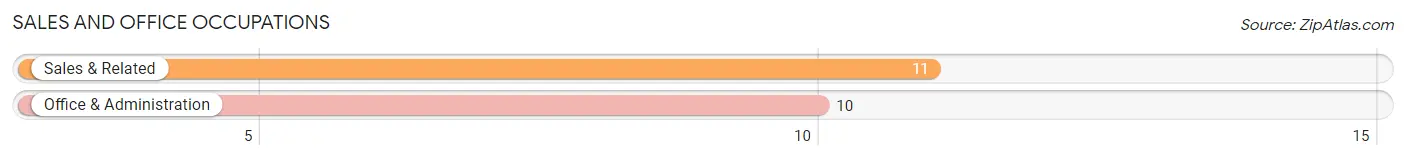
Sales and Office Occupations
The most common Sales and Office occupations in Lismore are Sales & Related (11 | 6.1%), and Office & Administration (10 | 5.5%).
Sales and Office Occupations by Sex
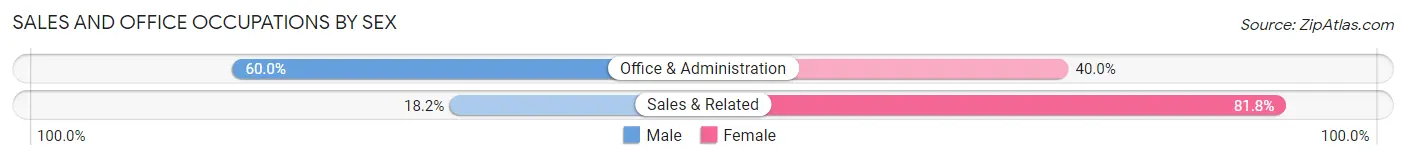
| Occupation | Male | Female |
| Sales & Related | 2 (18.2%) | 9 (81.8%) |
| Office & Administration | 6 (60.0%) | 4 (40.0%) |
| Total (Category) | 8 (38.1%) | 13 (61.9%) |
| Total (Overall) | 126 (69.6%) | 55 (30.4%) |
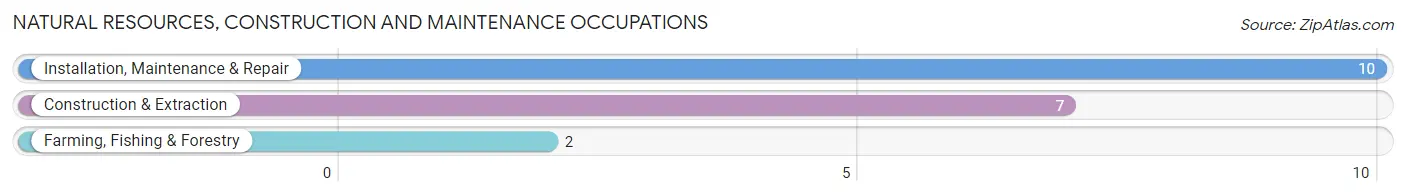
Natural Resources, Construction and Maintenance Occupations
The most common Natural Resources, Construction and Maintenance occupations in Lismore are Installation, Maintenance & Repair (10 | 5.5%), Construction & Extraction (7 | 3.9%), and Farming, Fishing & Forestry (2 | 1.1%).
Natural Resources, Construction and Maintenance Occupations by Sex
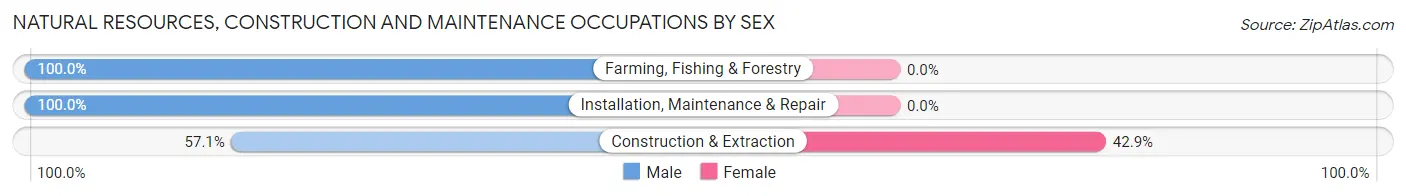
| Occupation | Male | Female |
| Farming, Fishing & Forestry | 2 (100.0%) | 0 (0.0%) |
| Construction & Extraction | 4 (57.1%) | 3 (42.9%) |
| Installation, Maintenance & Repair | 10 (100.0%) | 0 (0.0%) |
| Total (Category) | 16 (84.2%) | 3 (15.8%) |
| Total (Overall) | 126 (69.6%) | 55 (30.4%) |
Production, Transportation and Moving Occupations
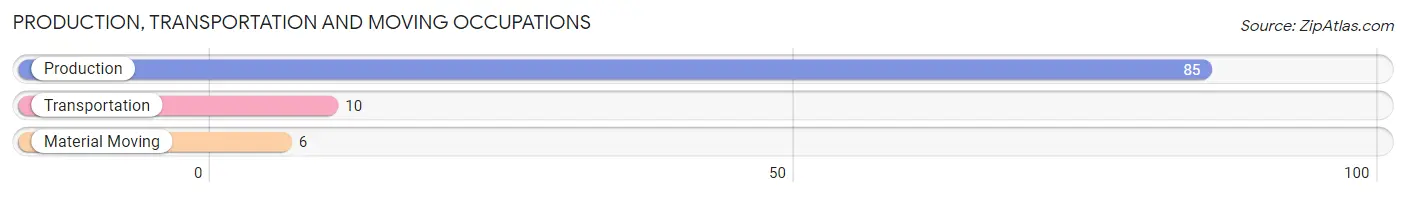
The most common Production, Transportation and Moving occupations in Lismore are Production (85 | 47.0%), Transportation (10 | 5.5%), and Material Moving (6 | 3.3%).
Production, Transportation and Moving Occupations by Sex
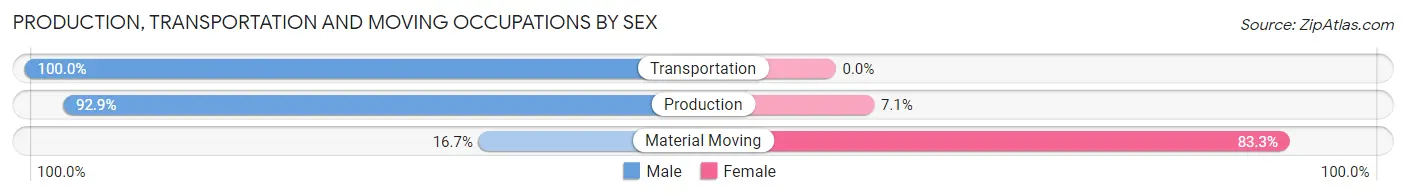
| Occupation | Male | Female |
| Production | 79 (92.9%) | 6 (7.1%) |
| Transportation | 10 (100.0%) | 0 (0.0%) |
| Material Moving | 1 (16.7%) | 5 (83.3%) |
| Total (Category) | 90 (89.1%) | 11 (10.9%) |
| Total (Overall) | 126 (69.6%) | 55 (30.4%) |
Employment Industries by Sex in Lismore
Employment Industries in Lismore
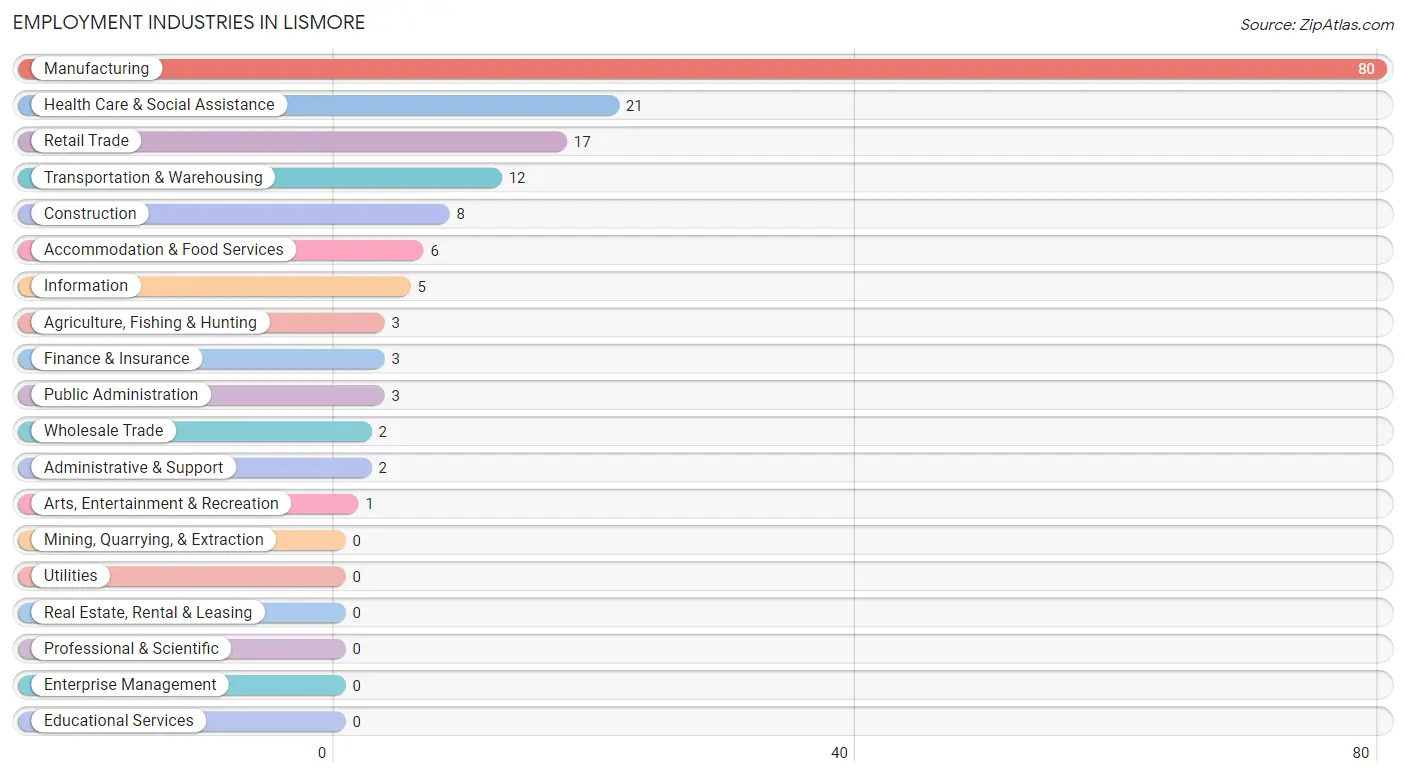
The major employment industries in Lismore include Manufacturing (80 | 44.2%), Health Care & Social Assistance (21 | 11.6%), Retail Trade (17 | 9.4%), Transportation & Warehousing (12 | 6.6%), and Construction (8 | 4.4%).
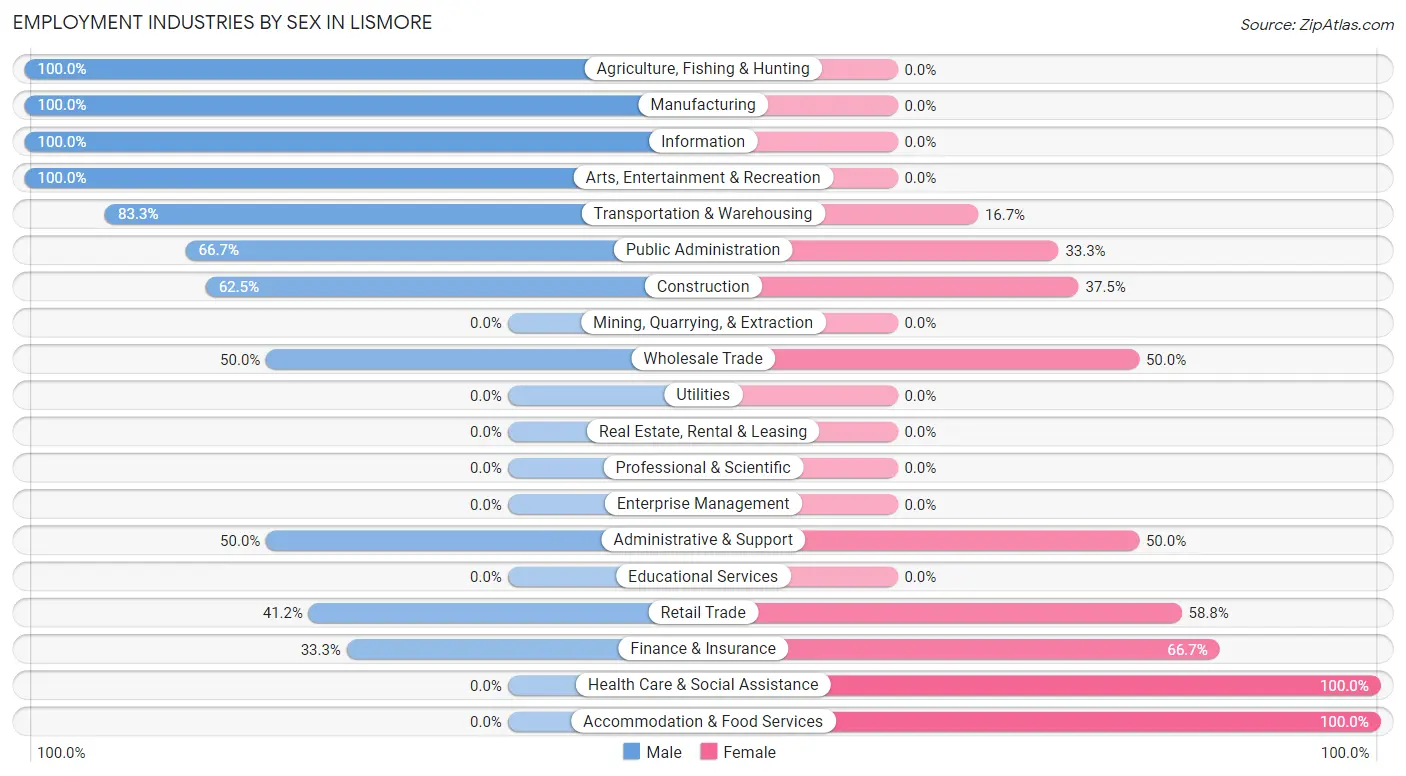
Employment Industries by Sex in Lismore
The Lismore industries that see more men than women are Agriculture, Fishing & Hunting (100.0%), Manufacturing (100.0%), and Information (100.0%), whereas the industries that tend to have a higher number of women are Health Care & Social Assistance (100.0%), Accommodation & Food Services (100.0%), and Finance & Insurance (66.7%).
| Industry | Male | Female |
| Agriculture, Fishing & Hunting | 3 (100.0%) | 0 (0.0%) |
| Mining, Quarrying, & Extraction | 0 (0.0%) | 0 (0.0%) |
| Construction | 5 (62.5%) | 3 (37.5%) |
| Manufacturing | 80 (100.0%) | 0 (0.0%) |
| Wholesale Trade | 1 (50.0%) | 1 (50.0%) |
| Retail Trade | 7 (41.2%) | 10 (58.8%) |
| Transportation & Warehousing | 10 (83.3%) | 2 (16.7%) |
| Utilities | 0 (0.0%) | 0 (0.0%) |
| Information | 5 (100.0%) | 0 (0.0%) |
| Finance & Insurance | 1 (33.3%) | 2 (66.7%) |
| Real Estate, Rental & Leasing | 0 (0.0%) | 0 (0.0%) |
| Professional & Scientific | 0 (0.0%) | 0 (0.0%) |
| Enterprise Management | 0 (0.0%) | 0 (0.0%) |
| Administrative & Support | 1 (50.0%) | 1 (50.0%) |
| Educational Services | 0 (0.0%) | 0 (0.0%) |
| Health Care & Social Assistance | 0 (0.0%) | 21 (100.0%) |
| Arts, Entertainment & Recreation | 1 (100.0%) | 0 (0.0%) |
| Accommodation & Food Services | 0 (0.0%) | 6 (100.0%) |
| Public Administration | 2 (66.7%) | 1 (33.3%) |
| Total | 126 (69.6%) | 55 (30.4%) |
Education in Lismore
School Enrollment in Lismore
The most common levels of schooling among the 57 students in Lismore are high school (23 | 40.4%), elementary school (22 | 38.6%), and middle school (10 | 17.5%).
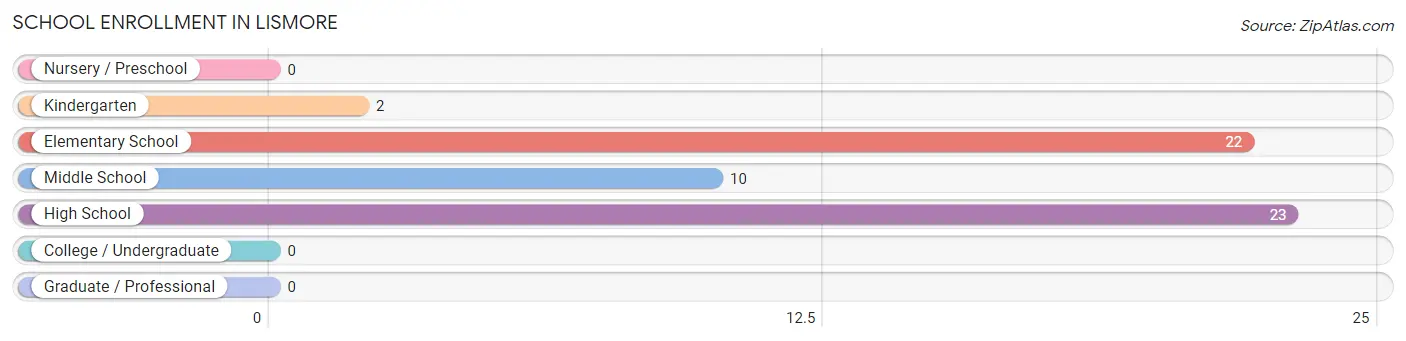
| School Level | # Students | % Students |
| Nursery / Preschool | 0 | 0.0% |
| Kindergarten | 2 | 3.5% |
| Elementary School | 22 | 38.6% |
| Middle School | 10 | 17.5% |
| High School | 23 | 40.4% |
| College / Undergraduate | 0 | 0.0% |
| Graduate / Professional | 0 | 0.0% |
| Total | 57 | 100.0% |
School Enrollment by Age by Funding Source in Lismore
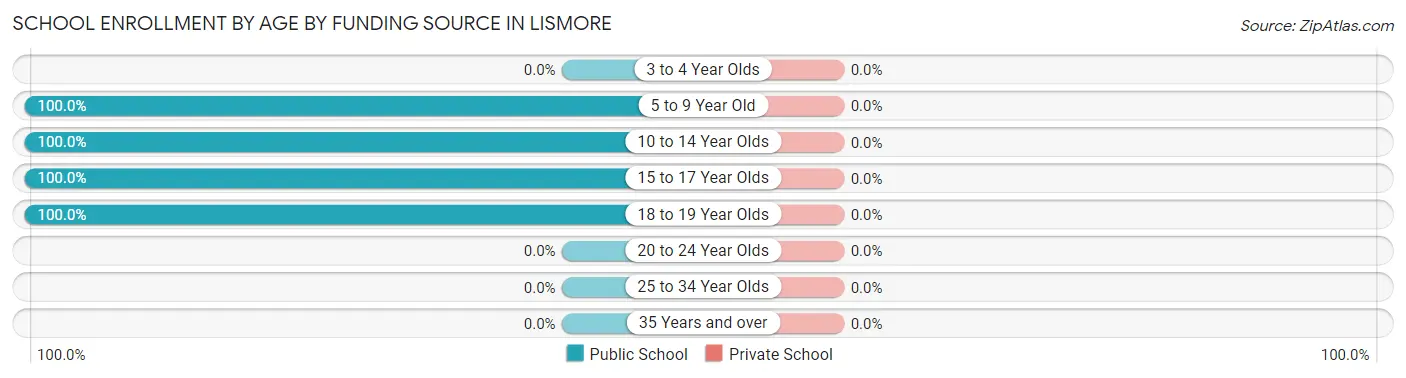
| Age Bracket | Public School | Private School |
| 3 to 4 Year Olds | 0 (0.0%) | 0 (0.0%) |
| 5 to 9 Year Old | 18 (100.0%) | 0 (0.0%) |
| 10 to 14 Year Olds | 16 (100.0%) | 0 (0.0%) |
| 15 to 17 Year Olds | 13 (100.0%) | 0 (0.0%) |
| 18 to 19 Year Olds | 10 (100.0%) | 0 (0.0%) |
| 20 to 24 Year Olds | 0 (0.0%) | 0 (0.0%) |
| 25 to 34 Year Olds | 0 (0.0%) | 0 (0.0%) |
| 35 Years and over | 0 (0.0%) | 0 (0.0%) |
| Total | 57 (100.0%) | 0 (0.0%) |
Educational Attainment by Field of Study in Lismore
Science & technology (6 | 33.3%), business (3 | 16.7%), bio, nature & agricultural (2 | 11.1%), physical & health sciences (2 | 11.1%), and arts & humanities (2 | 11.1%) are the most common fields of study among 18 individuals in Lismore who have obtained a bachelor's degree or higher.
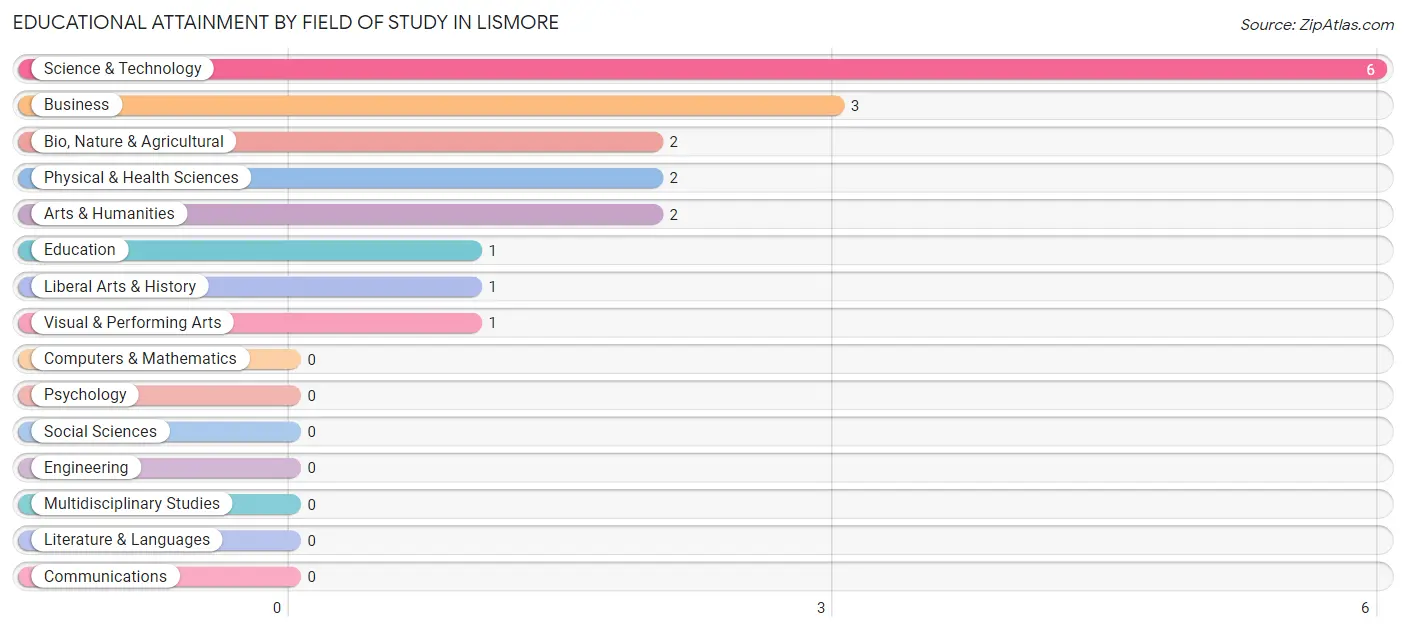
| Field of Study | # Graduates | % Graduates |
| Computers & Mathematics | 0 | 0.0% |
| Bio, Nature & Agricultural | 2 | 11.1% |
| Physical & Health Sciences | 2 | 11.1% |
| Psychology | 0 | 0.0% |
| Social Sciences | 0 | 0.0% |
| Engineering | 0 | 0.0% |
| Multidisciplinary Studies | 0 | 0.0% |
| Science & Technology | 6 | 33.3% |
| Business | 3 | 16.7% |
| Education | 1 | 5.6% |
| Literature & Languages | 0 | 0.0% |
| Liberal Arts & History | 1 | 5.6% |
| Visual & Performing Arts | 1 | 5.6% |
| Communications | 0 | 0.0% |
| Arts & Humanities | 2 | 11.1% |
| Total | 18 | 100.0% |
Transportation & Commute in Lismore
Vehicle Availability by Sex in Lismore
The most prevalent vehicle ownership categories in Lismore are males with 4 vehicles (73, accounting for 57.9%) and females with 4 vehicles (14, making up 132.7%).
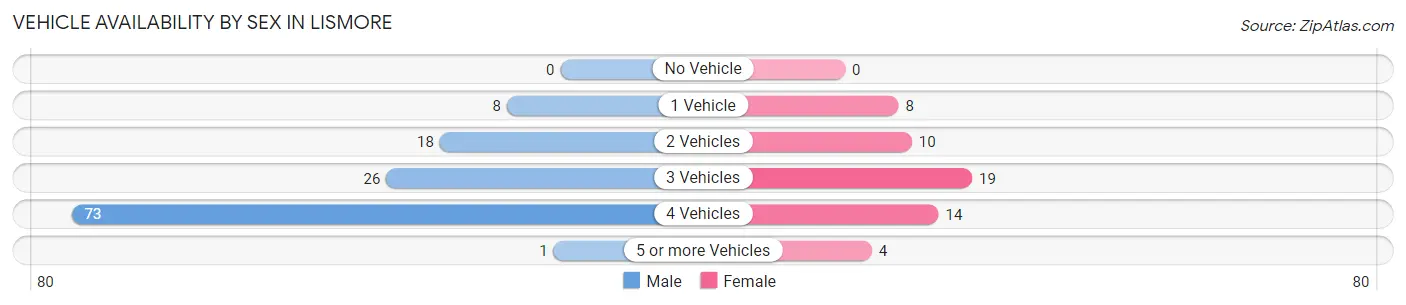
| Vehicles Available | Male | Female |
| No Vehicle | 0 (0.0%) | 0 (0.0%) |
| 1 Vehicle | 8 (6.4%) | 8 (14.5%) |
| 2 Vehicles | 18 (14.3%) | 10 (18.2%) |
| 3 Vehicles | 26 (20.6%) | 19 (34.5%) |
| 4 Vehicles | 73 (57.9%) | 14 (25.5%) |
| 5 or more Vehicles | 1 (0.8%) | 4 (7.3%) |
| Total | 126 (100.0%) | 55 (100.0%) |
Commute Time in Lismore
The most frequently occuring commute durations in Lismore are 10 to 14 minutes (85 commuters, 47.2%), 30 to 34 minutes (42 commuters, 23.3%), and 25 to 29 minutes (13 commuters, 7.2%).
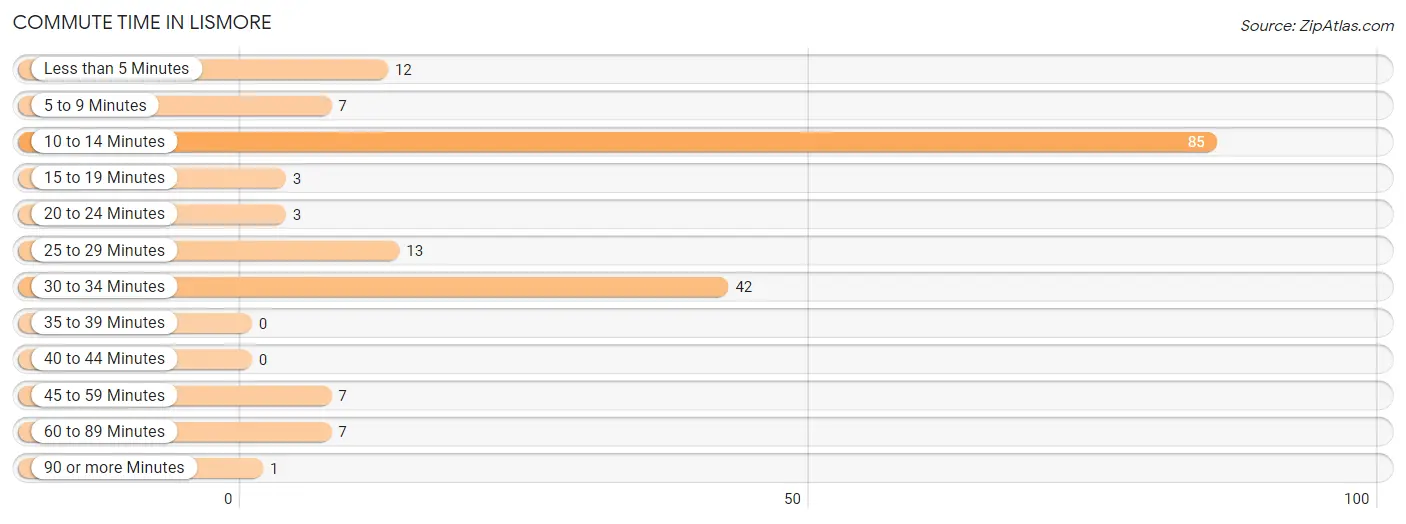
| Commute Time | # Commuters | % Commuters |
| Less than 5 Minutes | 12 | 6.7% |
| 5 to 9 Minutes | 7 | 3.9% |
| 10 to 14 Minutes | 85 | 47.2% |
| 15 to 19 Minutes | 3 | 1.7% |
| 20 to 24 Minutes | 3 | 1.7% |
| 25 to 29 Minutes | 13 | 7.2% |
| 30 to 34 Minutes | 42 | 23.3% |
| 35 to 39 Minutes | 0 | 0.0% |
| 40 to 44 Minutes | 0 | 0.0% |
| 45 to 59 Minutes | 7 | 3.9% |
| 60 to 89 Minutes | 7 | 3.9% |
| 90 or more Minutes | 1 | 0.6% |
Commute Time by Sex in Lismore
The most common commute times in Lismore are 10 to 14 minutes (76 commuters, 60.3%) for males and 30 to 34 minutes (28 commuters, 51.8%) for females.
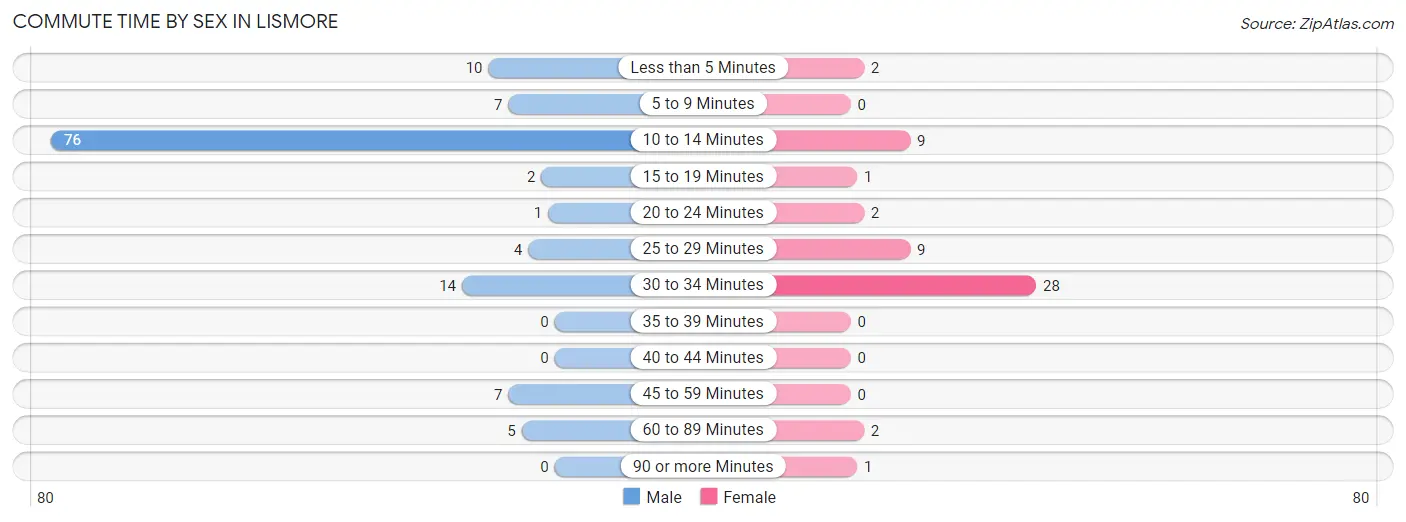
| Commute Time | Male | Female |
| Less than 5 Minutes | 10 (7.9%) | 2 (3.7%) |
| 5 to 9 Minutes | 7 (5.6%) | 0 (0.0%) |
| 10 to 14 Minutes | 76 (60.3%) | 9 (16.7%) |
| 15 to 19 Minutes | 2 (1.6%) | 1 (1.8%) |
| 20 to 24 Minutes | 1 (0.8%) | 2 (3.7%) |
| 25 to 29 Minutes | 4 (3.2%) | 9 (16.7%) |
| 30 to 34 Minutes | 14 (11.1%) | 28 (51.8%) |
| 35 to 39 Minutes | 0 (0.0%) | 0 (0.0%) |
| 40 to 44 Minutes | 0 (0.0%) | 0 (0.0%) |
| 45 to 59 Minutes | 7 (5.6%) | 0 (0.0%) |
| 60 to 89 Minutes | 5 (4.0%) | 2 (3.7%) |
| 90 or more Minutes | 0 (0.0%) | 1 (1.8%) |
Time of Departure to Work by Sex in Lismore
The most frequent times of departure to work in Lismore are 5:00 AM to 5:29 AM (79, 62.7%) for males and 12:00 PM to 3:59 PM (13, 24.1%) for females.
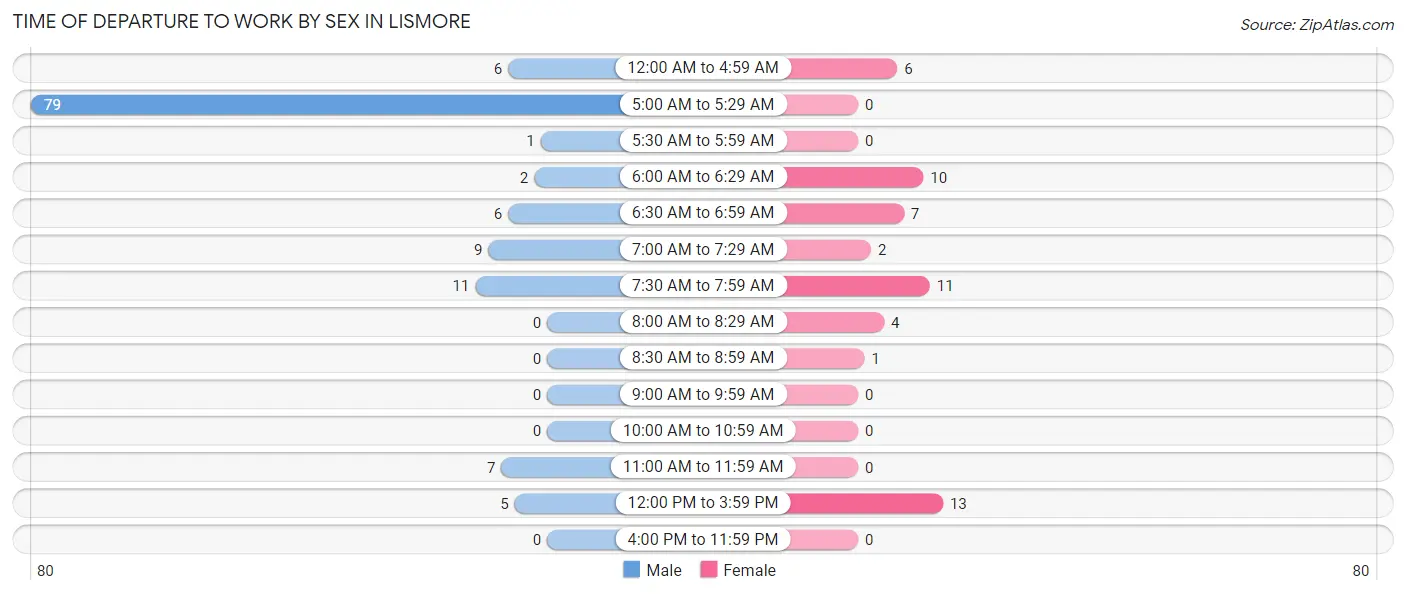
| Time of Departure | Male | Female |
| 12:00 AM to 4:59 AM | 6 (4.8%) | 6 (11.1%) |
| 5:00 AM to 5:29 AM | 79 (62.7%) | 0 (0.0%) |
| 5:30 AM to 5:59 AM | 1 (0.8%) | 0 (0.0%) |
| 6:00 AM to 6:29 AM | 2 (1.6%) | 10 (18.5%) |
| 6:30 AM to 6:59 AM | 6 (4.8%) | 7 (13.0%) |
| 7:00 AM to 7:29 AM | 9 (7.1%) | 2 (3.7%) |
| 7:30 AM to 7:59 AM | 11 (8.7%) | 11 (20.4%) |
| 8:00 AM to 8:29 AM | 0 (0.0%) | 4 (7.4%) |
| 8:30 AM to 8:59 AM | 0 (0.0%) | 1 (1.8%) |
| 9:00 AM to 9:59 AM | 0 (0.0%) | 0 (0.0%) |
| 10:00 AM to 10:59 AM | 0 (0.0%) | 0 (0.0%) |
| 11:00 AM to 11:59 AM | 7 (5.6%) | 0 (0.0%) |
| 12:00 PM to 3:59 PM | 5 (4.0%) | 13 (24.1%) |
| 4:00 PM to 11:59 PM | 0 (0.0%) | 0 (0.0%) |
| Total | 126 (100.0%) | 54 (100.0%) |
Housing Occupancy in Lismore
Occupancy by Ownership in Lismore
Of the total 159 dwellings in Lismore, owner-occupied units account for 137 (86.2%), while renter-occupied units make up 22 (13.8%).
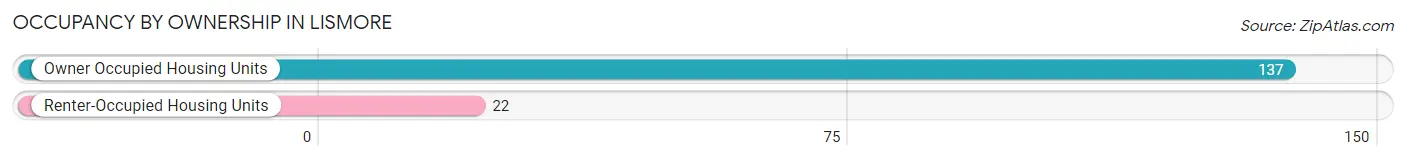
| Occupancy | # Housing Units | % Housing Units |
| Owner Occupied Housing Units | 137 | 86.2% |
| Renter-Occupied Housing Units | 22 | 13.8% |
| Total Occupied Housing Units | 159 | 100.0% |
Occupancy by Household Size in Lismore
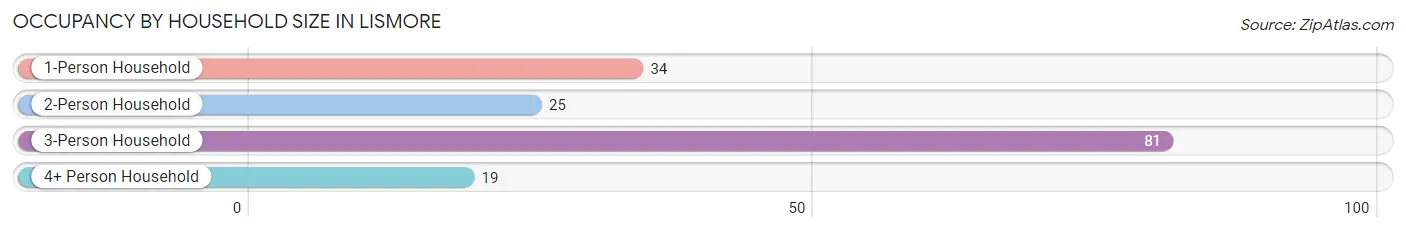
| Household Size | # Housing Units | % Housing Units |
| 1-Person Household | 34 | 21.4% |
| 2-Person Household | 25 | 15.7% |
| 3-Person Household | 81 | 50.9% |
| 4+ Person Household | 19 | 11.9% |
| Total Housing Units | 159 | 100.0% |
Occupancy by Ownership by Household Size in Lismore
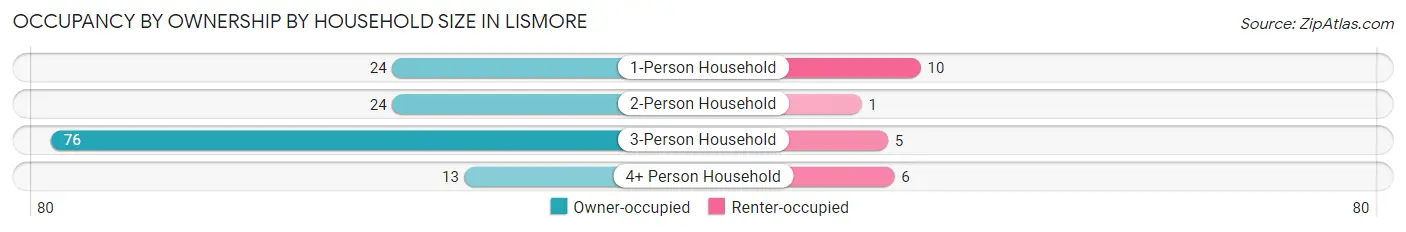
| Household Size | Owner-occupied | Renter-occupied |
| 1-Person Household | 24 (70.6%) | 10 (29.4%) |
| 2-Person Household | 24 (96.0%) | 1 (4.0%) |
| 3-Person Household | 76 (93.8%) | 5 (6.2%) |
| 4+ Person Household | 13 (68.4%) | 6 (31.6%) |
| Total Housing Units | 137 (86.2%) | 22 (13.8%) |
Occupancy by Educational Attainment in Lismore
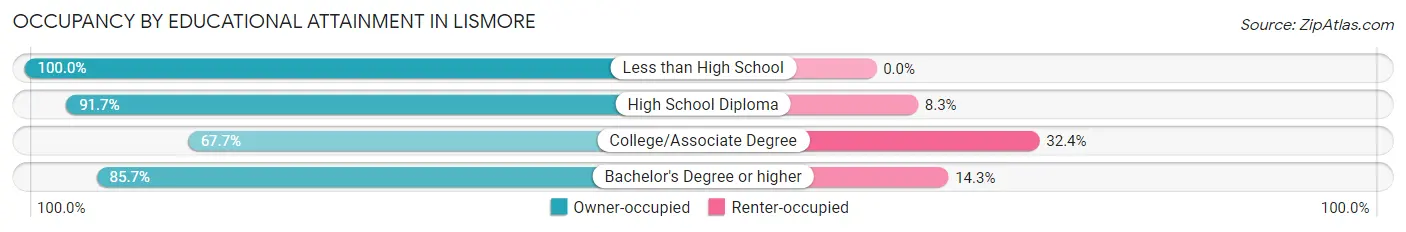
| Household Size | Owner-occupied | Renter-occupied |
| Less than High School | 2 (100.0%) | 0 (0.0%) |
| High School Diploma | 100 (91.7%) | 9 (8.3%) |
| College/Associate Degree | 23 (67.6%) | 11 (32.4%) |
| Bachelor's Degree or higher | 12 (85.7%) | 2 (14.3%) |
Occupancy by Age of Householder in Lismore
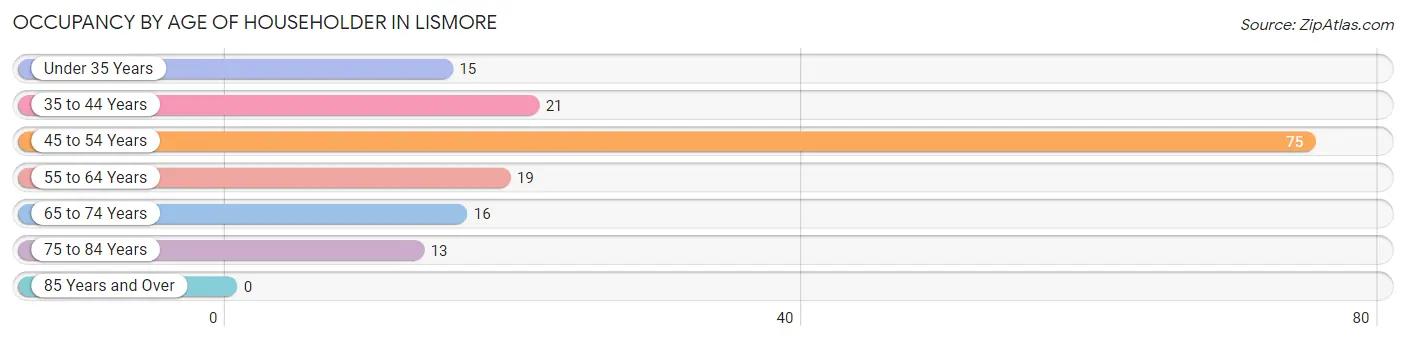
| Age Bracket | # Households | % Households |
| Under 35 Years | 15 | 9.4% |
| 35 to 44 Years | 21 | 13.2% |
| 45 to 54 Years | 75 | 47.2% |
| 55 to 64 Years | 19 | 11.9% |
| 65 to 74 Years | 16 | 10.1% |
| 75 to 84 Years | 13 | 8.2% |
| 85 Years and Over | 0 | 0.0% |
| Total | 159 | 100.0% |
Housing Finances in Lismore
Median Income by Occupancy in Lismore
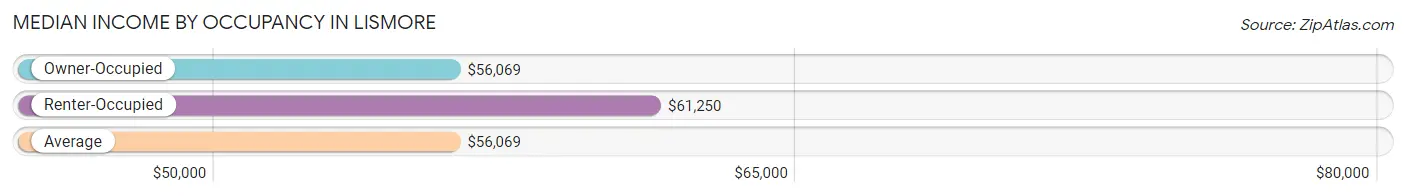
| Occupancy Type | # Households | Median Income |
| Owner-Occupied | 137 (86.2%) | $56,069 |
| Renter-Occupied | 22 (13.8%) | $61,250 |
| Average | 159 (100.0%) | $56,069 |
Occupancy by Householder Income Bracket in Lismore
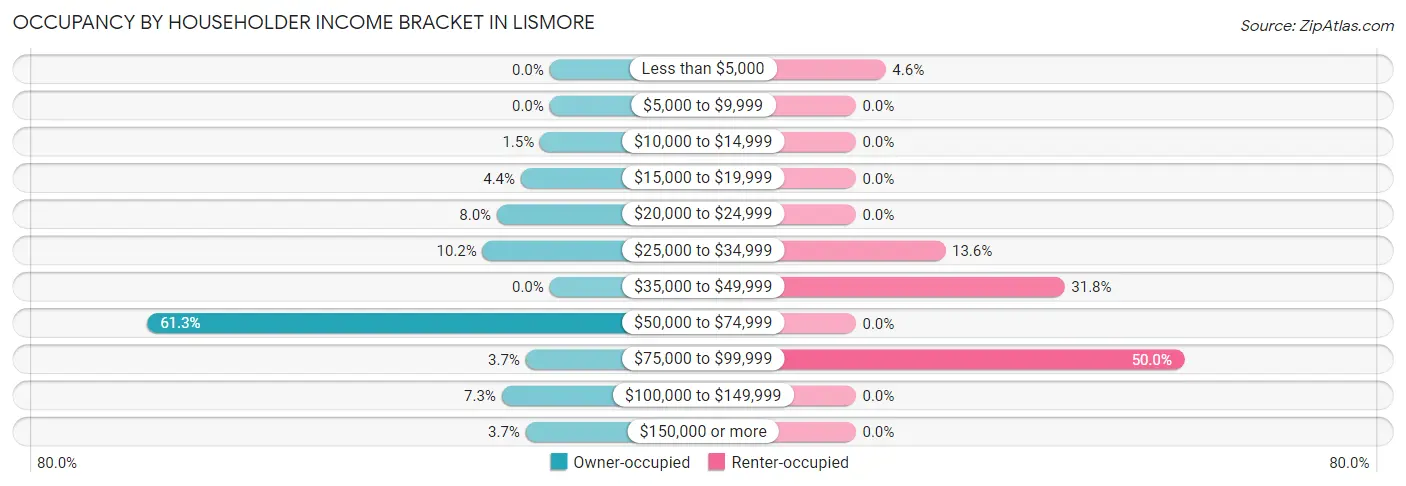
| Income Bracket | Owner-occupied | Renter-occupied |
| Less than $5,000 | 0 (0.0%) | 1 (4.5%) |
| $5,000 to $9,999 | 0 (0.0%) | 0 (0.0%) |
| $10,000 to $14,999 | 2 (1.5%) | 0 (0.0%) |
| $15,000 to $19,999 | 6 (4.4%) | 0 (0.0%) |
| $20,000 to $24,999 | 11 (8.0%) | 0 (0.0%) |
| $25,000 to $34,999 | 14 (10.2%) | 3 (13.6%) |
| $35,000 to $49,999 | 0 (0.0%) | 7 (31.8%) |
| $50,000 to $74,999 | 84 (61.3%) | 0 (0.0%) |
| $75,000 to $99,999 | 5 (3.6%) | 11 (50.0%) |
| $100,000 to $149,999 | 10 (7.3%) | 0 (0.0%) |
| $150,000 or more | 5 (3.6%) | 0 (0.0%) |
| Total | 137 (100.0%) | 22 (100.0%) |
Monthly Housing Cost Tiers in Lismore
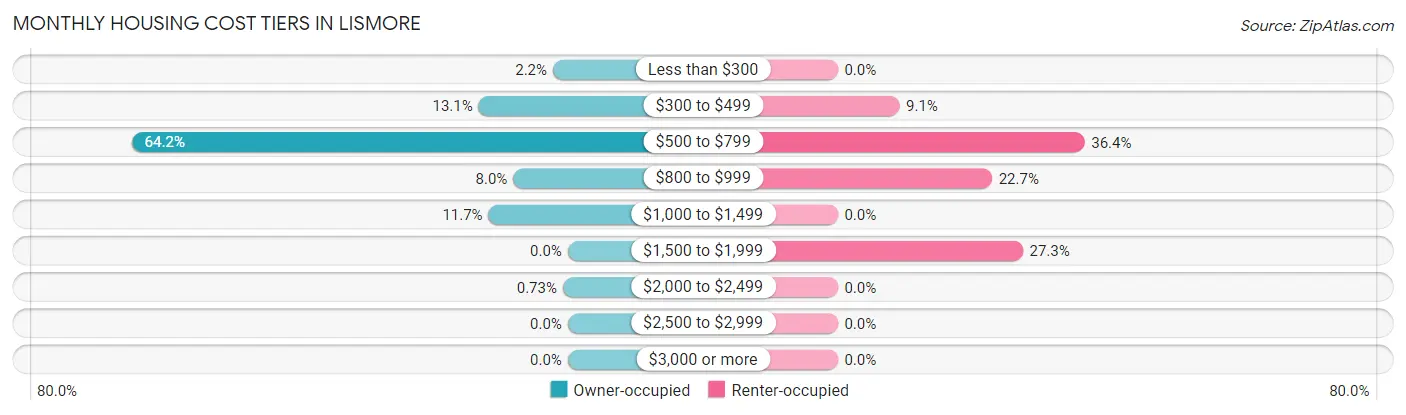
| Monthly Cost | Owner-occupied | Renter-occupied |
| Less than $300 | 3 (2.2%) | 0 (0.0%) |
| $300 to $499 | 18 (13.1%) | 2 (9.1%) |
| $500 to $799 | 88 (64.2%) | 8 (36.4%) |
| $800 to $999 | 11 (8.0%) | 5 (22.7%) |
| $1,000 to $1,499 | 16 (11.7%) | 0 (0.0%) |
| $1,500 to $1,999 | 0 (0.0%) | 6 (27.3%) |
| $2,000 to $2,499 | 1 (0.7%) | 0 (0.0%) |
| $2,500 to $2,999 | 0 (0.0%) | 0 (0.0%) |
| $3,000 or more | 0 (0.0%) | 0 (0.0%) |
| Total | 137 (100.0%) | 22 (100.0%) |
Physical Housing Characteristics in Lismore
Housing Structures in Lismore
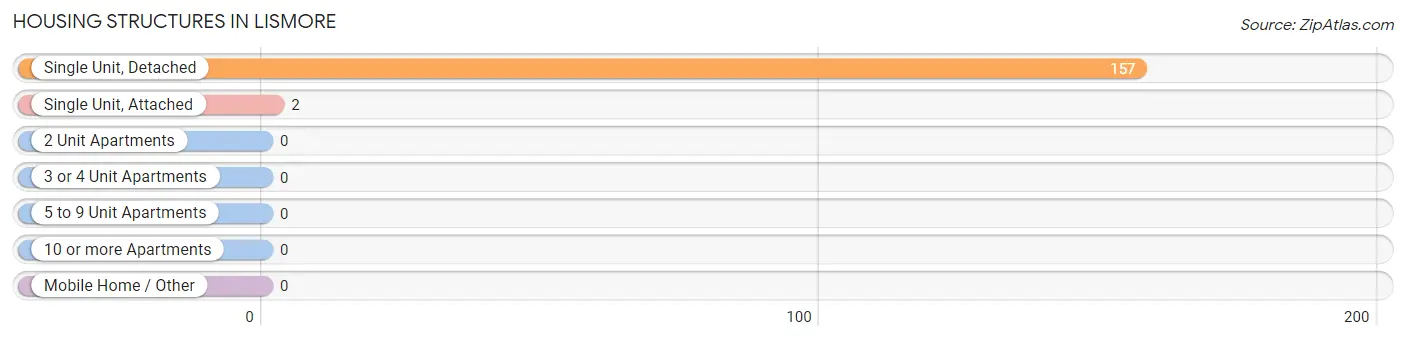
| Structure Type | # Housing Units | % Housing Units |
| Single Unit, Detached | 157 | 98.7% |
| Single Unit, Attached | 2 | 1.3% |
| 2 Unit Apartments | 0 | 0.0% |
| 3 or 4 Unit Apartments | 0 | 0.0% |
| 5 to 9 Unit Apartments | 0 | 0.0% |
| 10 or more Apartments | 0 | 0.0% |
| Mobile Home / Other | 0 | 0.0% |
| Total | 159 | 100.0% |
Housing Structures by Occupancy in Lismore
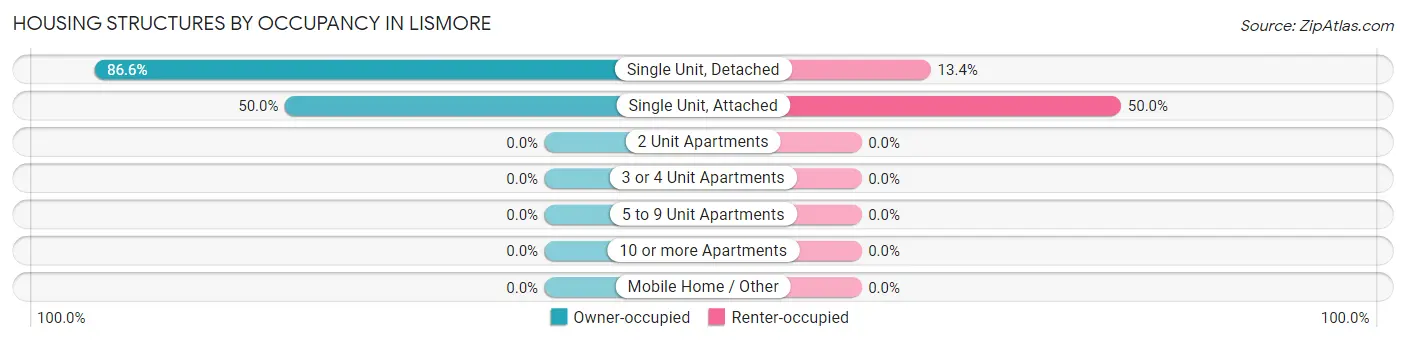
| Structure Type | Owner-occupied | Renter-occupied |
| Single Unit, Detached | 136 (86.6%) | 21 (13.4%) |
| Single Unit, Attached | 1 (50.0%) | 1 (50.0%) |
| 2 Unit Apartments | 0 (0.0%) | 0 (0.0%) |
| 3 or 4 Unit Apartments | 0 (0.0%) | 0 (0.0%) |
| 5 to 9 Unit Apartments | 0 (0.0%) | 0 (0.0%) |
| 10 or more Apartments | 0 (0.0%) | 0 (0.0%) |
| Mobile Home / Other | 0 (0.0%) | 0 (0.0%) |
| Total | 137 (86.2%) | 22 (13.8%) |
Housing Structures by Number of Rooms in Lismore
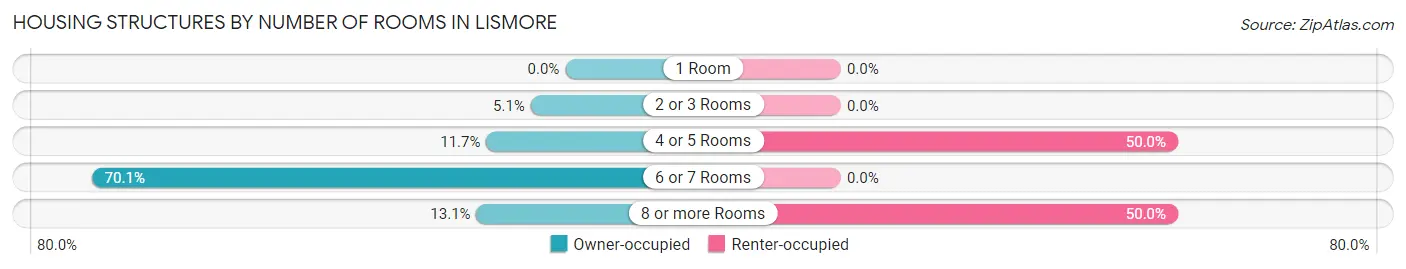
| Number of Rooms | Owner-occupied | Renter-occupied |
| 1 Room | 0 (0.0%) | 0 (0.0%) |
| 2 or 3 Rooms | 7 (5.1%) | 0 (0.0%) |
| 4 or 5 Rooms | 16 (11.7%) | 11 (50.0%) |
| 6 or 7 Rooms | 96 (70.1%) | 0 (0.0%) |
| 8 or more Rooms | 18 (13.1%) | 11 (50.0%) |
| Total | 137 (100.0%) | 22 (100.0%) |
Housing Structure by Heating Type in Lismore
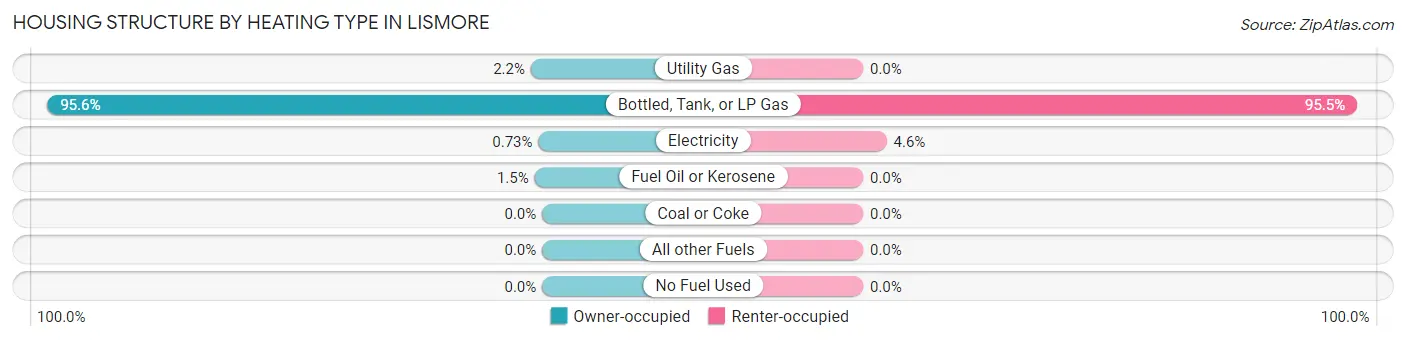
| Heating Type | Owner-occupied | Renter-occupied |
| Utility Gas | 3 (2.2%) | 0 (0.0%) |
| Bottled, Tank, or LP Gas | 131 (95.6%) | 21 (95.5%) |
| Electricity | 1 (0.7%) | 1 (4.5%) |
| Fuel Oil or Kerosene | 2 (1.5%) | 0 (0.0%) |
| Coal or Coke | 0 (0.0%) | 0 (0.0%) |
| All other Fuels | 0 (0.0%) | 0 (0.0%) |
| No Fuel Used | 0 (0.0%) | 0 (0.0%) |
| Total | 137 (100.0%) | 22 (100.0%) |
Household Vehicle Usage in Lismore
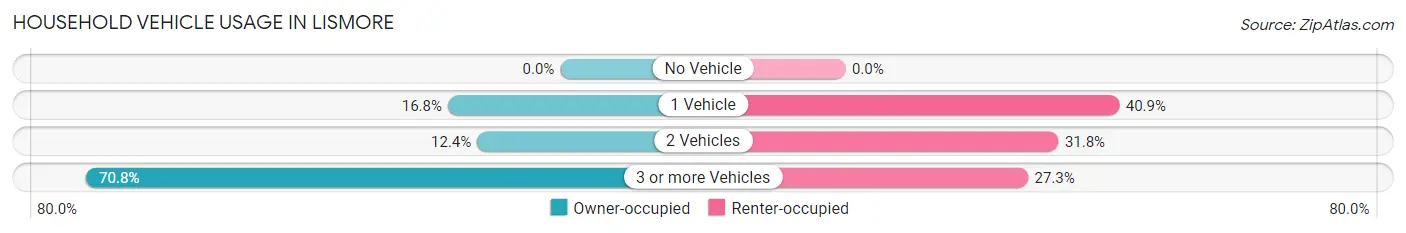
| Vehicles per Household | Owner-occupied | Renter-occupied |
| No Vehicle | 0 (0.0%) | 0 (0.0%) |
| 1 Vehicle | 23 (16.8%) | 9 (40.9%) |
| 2 Vehicles | 17 (12.4%) | 7 (31.8%) |
| 3 or more Vehicles | 97 (70.8%) | 6 (27.3%) |
| Total | 137 (100.0%) | 22 (100.0%) |
Real Estate & Mortgages in Lismore
Real Estate and Mortgage Overview in Lismore
| Characteristic | Without Mortgage | With Mortgage |
| Housing Units | 43 | 94 |
| Median Property Value | $72,500 | $46,200 |
| Median Household Income | $28,958 | $3 |
| Monthly Housing Costs | $506 | $0 |
| Real Estate Taxes | $656 | $0 |
Property Value by Mortgage Status in Lismore
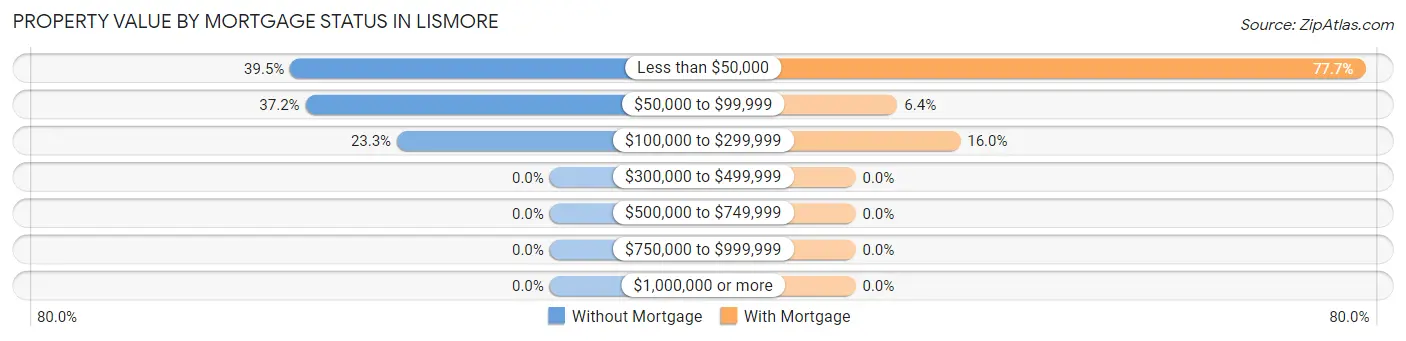
| Property Value | Without Mortgage | With Mortgage |
| Less than $50,000 | 17 (39.5%) | 73 (77.7%) |
| $50,000 to $99,999 | 16 (37.2%) | 6 (6.4%) |
| $100,000 to $299,999 | 10 (23.3%) | 15 (16.0%) |
| $300,000 to $499,999 | 0 (0.0%) | 0 (0.0%) |
| $500,000 to $749,999 | 0 (0.0%) | 0 (0.0%) |
| $750,000 to $999,999 | 0 (0.0%) | 0 (0.0%) |
| $1,000,000 or more | 0 (0.0%) | 0 (0.0%) |
| Total | 43 (100.0%) | 94 (100.0%) |
Household Income by Mortgage Status in Lismore
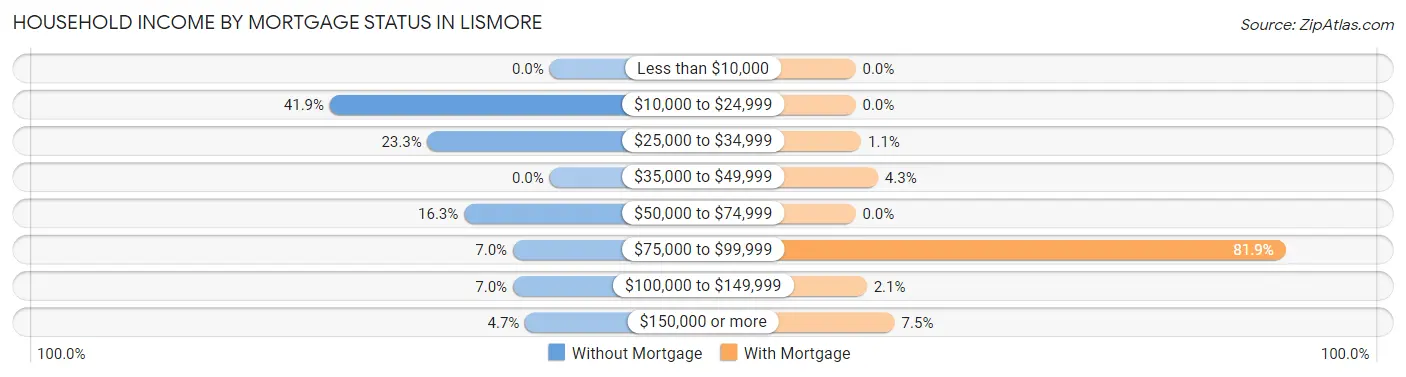
| Household Income | Without Mortgage | With Mortgage |
| Less than $10,000 | 0 (0.0%) | 0 (0.0%) |
| $10,000 to $24,999 | 18 (41.9%) | 0 (0.0%) |
| $25,000 to $34,999 | 10 (23.3%) | 1 (1.1%) |
| $35,000 to $49,999 | 0 (0.0%) | 4 (4.3%) |
| $50,000 to $74,999 | 7 (16.3%) | 0 (0.0%) |
| $75,000 to $99,999 | 3 (7.0%) | 77 (81.9%) |
| $100,000 to $149,999 | 3 (7.0%) | 2 (2.1%) |
| $150,000 or more | 2 (4.6%) | 7 (7.4%) |
| Total | 43 (100.0%) | 94 (100.0%) |
Property Value to Household Income Ratio in Lismore
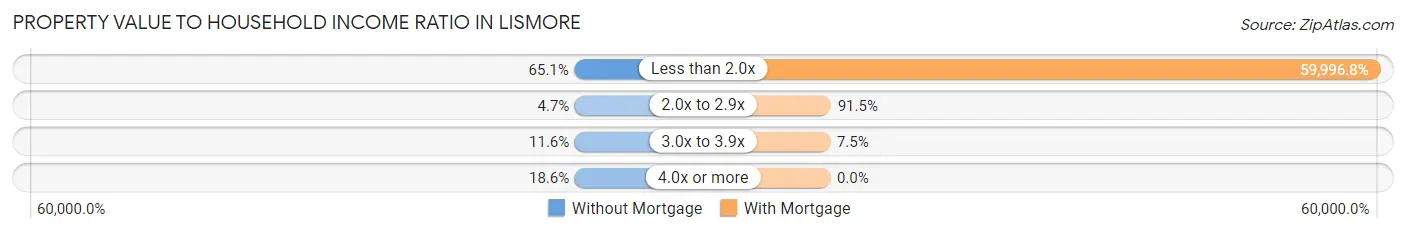
| Value-to-Income Ratio | Without Mortgage | With Mortgage |
| Less than 2.0x | 28 (65.1%) | 56,397 (59,996.8%) |
| 2.0x to 2.9x | 2 (4.6%) | 86 (91.5%) |
| 3.0x to 3.9x | 5 (11.6%) | 7 (7.4%) |
| 4.0x or more | 8 (18.6%) | 0 (0.0%) |
| Total | 43 (100.0%) | 94 (100.0%) |
Real Estate Taxes by Mortgage Status in Lismore
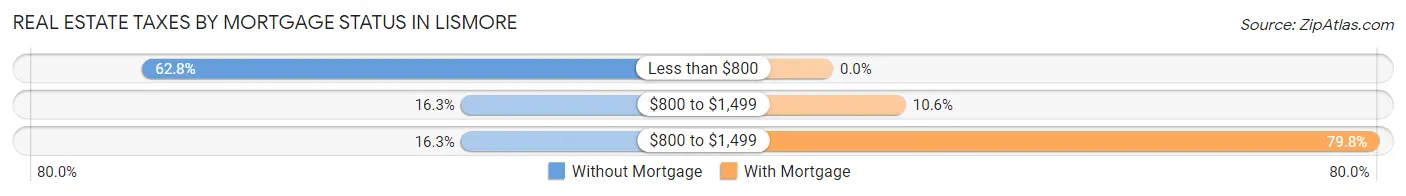
| Property Taxes | Without Mortgage | With Mortgage |
| Less than $800 | 27 (62.8%) | 0 (0.0%) |
| $800 to $1,499 | 7 (16.3%) | 10 (10.6%) |
| $800 to $1,499 | 7 (16.3%) | 75 (79.8%) |
| Total | 43 (100.0%) | 94 (100.0%) |
Health & Disability in Lismore
Health Insurance Coverage by Age in Lismore
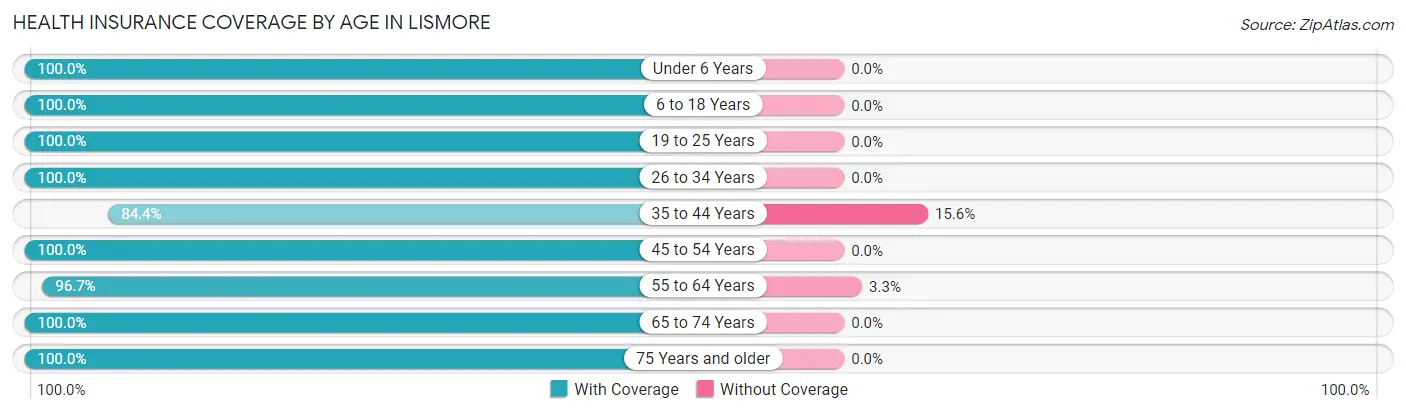
| Age Bracket | With Coverage | Without Coverage |
| Under 6 Years | 17 (100.0%) | 0 (0.0%) |
| 6 to 18 Years | 55 (100.0%) | 0 (0.0%) |
| 19 to 25 Years | 27 (100.0%) | 0 (0.0%) |
| 26 to 34 Years | 4 (100.0%) | 0 (0.0%) |
| 35 to 44 Years | 27 (84.4%) | 5 (15.6%) |
| 45 to 54 Years | 85 (100.0%) | 0 (0.0%) |
| 55 to 64 Years | 29 (96.7%) | 1 (3.3%) |
| 65 to 74 Years | 25 (100.0%) | 0 (0.0%) |
| 75 Years and older | 17 (100.0%) | 0 (0.0%) |
| Total | 286 (98.0%) | 6 (2.1%) |
Health Insurance Coverage by Citizenship Status in Lismore
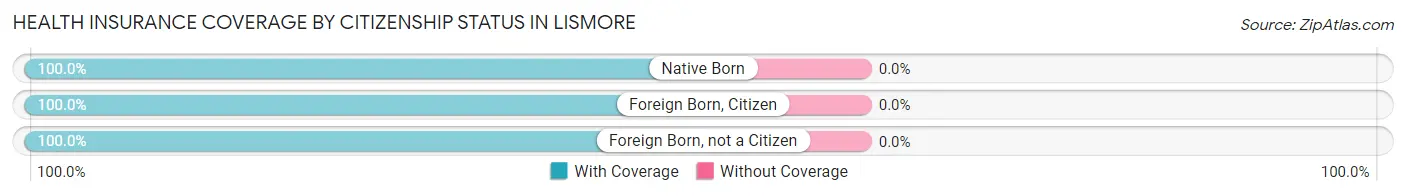
| Citizenship Status | With Coverage | Without Coverage |
| Native Born | 17 (100.0%) | 0 (0.0%) |
| Foreign Born, Citizen | 55 (100.0%) | 0 (0.0%) |
| Foreign Born, not a Citizen | 27 (100.0%) | 0 (0.0%) |
Health Insurance Coverage by Household Income in Lismore
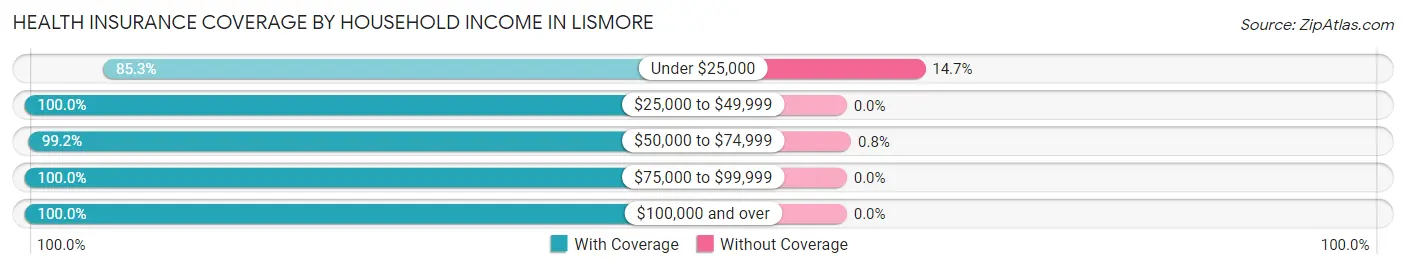
| Household Income | With Coverage | Without Coverage |
| Under $25,000 | 29 (85.3%) | 5 (14.7%) |
| $25,000 to $49,999 | 54 (100.0%) | 0 (0.0%) |
| $50,000 to $74,999 | 124 (99.2%) | 1 (0.8%) |
| $75,000 to $99,999 | 38 (100.0%) | 0 (0.0%) |
| $100,000 and over | 41 (100.0%) | 0 (0.0%) |
Public vs Private Health Insurance Coverage by Age in Lismore
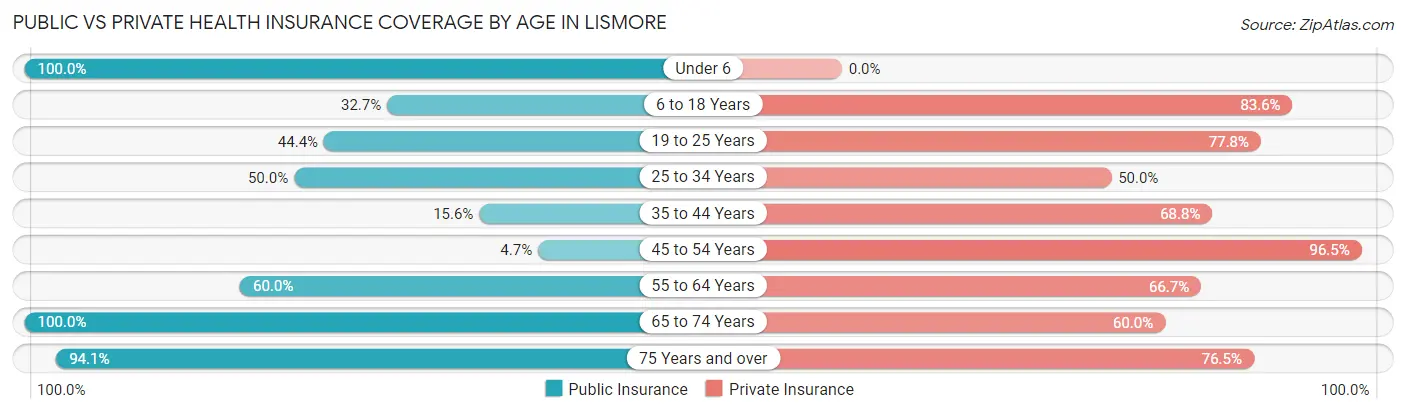
| Age Bracket | Public Insurance | Private Insurance |
| Under 6 | 17 (100.0%) | 0 (0.0%) |
| 6 to 18 Years | 18 (32.7%) | 46 (83.6%) |
| 19 to 25 Years | 12 (44.4%) | 21 (77.8%) |
| 25 to 34 Years | 2 (50.0%) | 2 (50.0%) |
| 35 to 44 Years | 5 (15.6%) | 22 (68.8%) |
| 45 to 54 Years | 4 (4.7%) | 82 (96.5%) |
| 55 to 64 Years | 18 (60.0%) | 20 (66.7%) |
| 65 to 74 Years | 25 (100.0%) | 15 (60.0%) |
| 75 Years and over | 16 (94.1%) | 13 (76.5%) |
| Total | 117 (40.1%) | 221 (75.7%) |
Disability Status by Sex by Age in Lismore
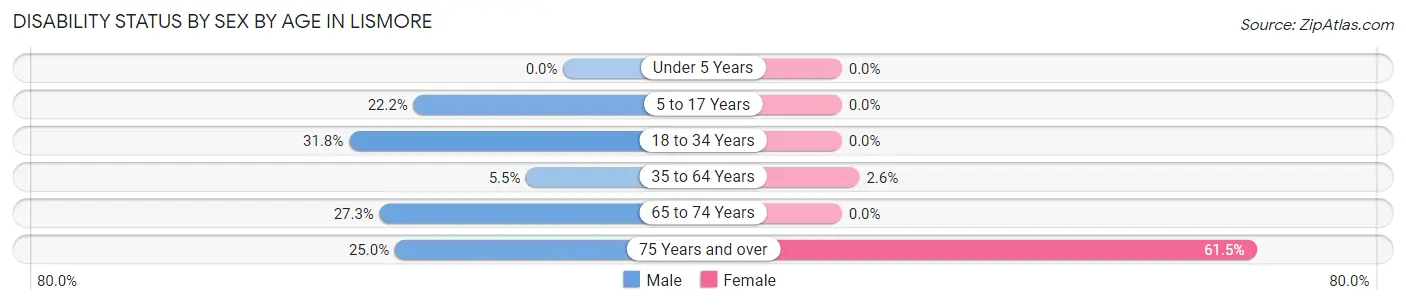
| Age Bracket | Male | Female |
| Under 5 Years | 0 (0.0%) | 0 (0.0%) |
| 5 to 17 Years | 6 (22.2%) | 0 (0.0%) |
| 18 to 34 Years | 7 (31.8%) | 0 (0.0%) |
| 35 to 64 Years | 6 (5.5%) | 1 (2.6%) |
| 65 to 74 Years | 3 (27.3%) | 0 (0.0%) |
| 75 Years and over | 1 (25.0%) | 8 (61.5%) |
Disability Class by Sex by Age in Lismore
Disability Class: Hearing Difficulty
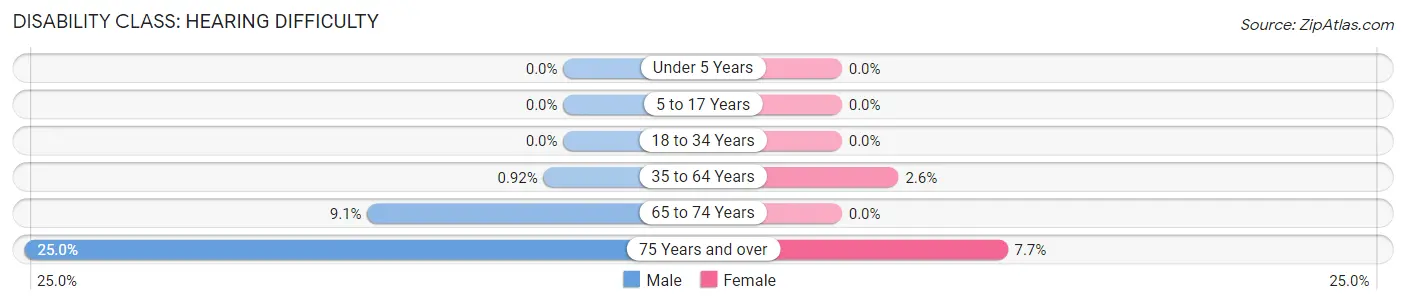
| Age Bracket | Male | Female |
| Under 5 Years | 0 (0.0%) | 0 (0.0%) |
| 5 to 17 Years | 0 (0.0%) | 0 (0.0%) |
| 18 to 34 Years | 0 (0.0%) | 0 (0.0%) |
| 35 to 64 Years | 1 (0.9%) | 1 (2.6%) |
| 65 to 74 Years | 1 (9.1%) | 0 (0.0%) |
| 75 Years and over | 1 (25.0%) | 1 (7.7%) |
Disability Class: Vision Difficulty
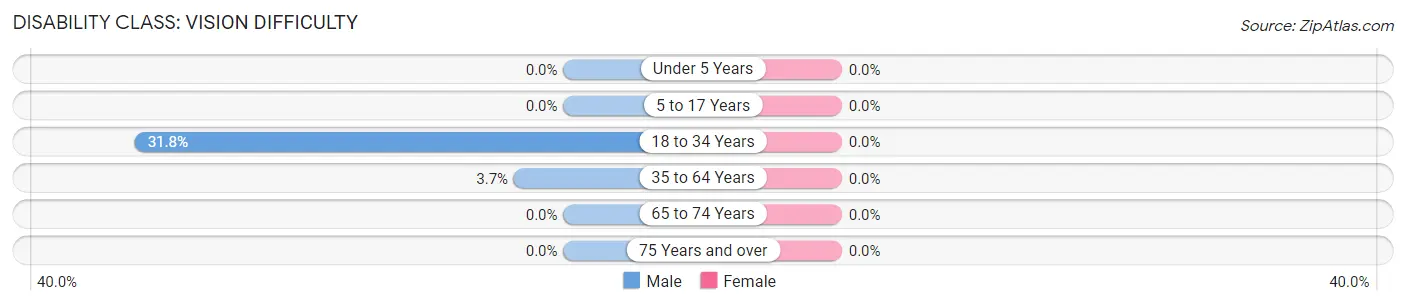
| Age Bracket | Male | Female |
| Under 5 Years | 0 (0.0%) | 0 (0.0%) |
| 5 to 17 Years | 0 (0.0%) | 0 (0.0%) |
| 18 to 34 Years | 7 (31.8%) | 0 (0.0%) |
| 35 to 64 Years | 4 (3.7%) | 0 (0.0%) |
| 65 to 74 Years | 0 (0.0%) | 0 (0.0%) |
| 75 Years and over | 0 (0.0%) | 0 (0.0%) |
Disability Class: Cognitive Difficulty
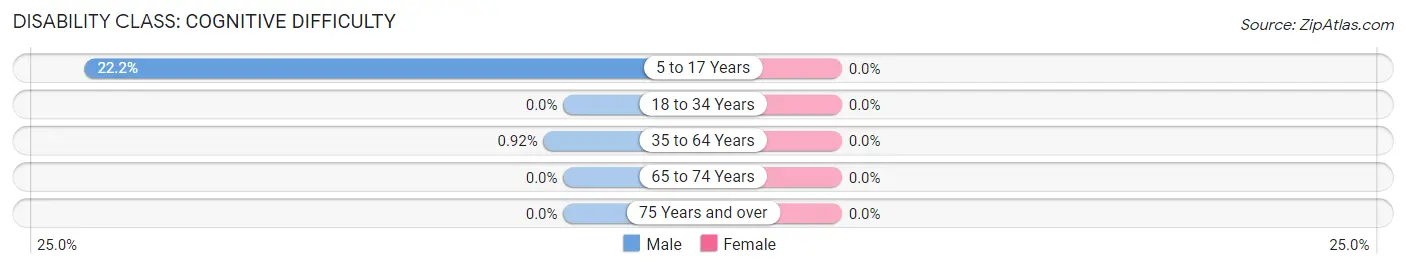
| Age Bracket | Male | Female |
| 5 to 17 Years | 6 (22.2%) | 0 (0.0%) |
| 18 to 34 Years | 0 (0.0%) | 0 (0.0%) |
| 35 to 64 Years | 1 (0.9%) | 0 (0.0%) |
| 65 to 74 Years | 0 (0.0%) | 0 (0.0%) |
| 75 Years and over | 0 (0.0%) | 0 (0.0%) |
Disability Class: Ambulatory Difficulty
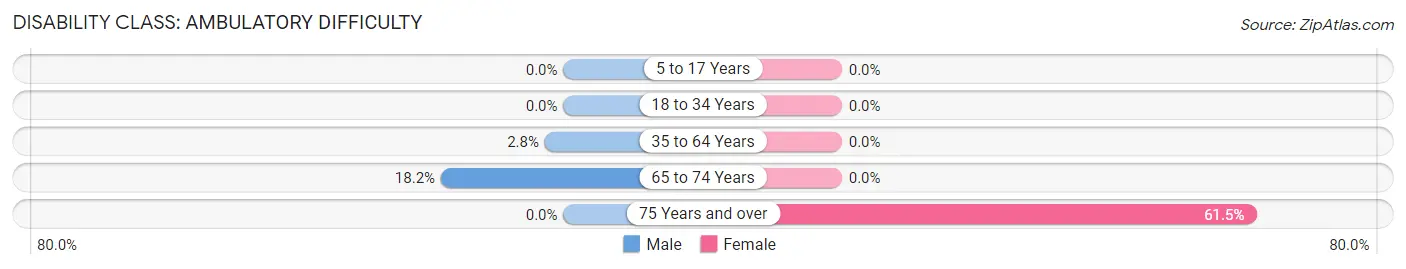
| Age Bracket | Male | Female |
| 5 to 17 Years | 0 (0.0%) | 0 (0.0%) |
| 18 to 34 Years | 0 (0.0%) | 0 (0.0%) |
| 35 to 64 Years | 3 (2.8%) | 0 (0.0%) |
| 65 to 74 Years | 2 (18.2%) | 0 (0.0%) |
| 75 Years and over | 0 (0.0%) | 8 (61.5%) |
Disability Class: Self-Care Difficulty
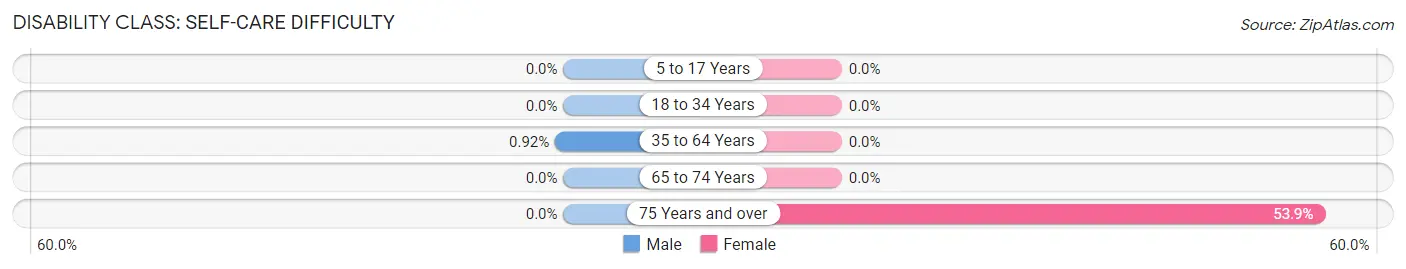
| Age Bracket | Male | Female |
| 5 to 17 Years | 0 (0.0%) | 0 (0.0%) |
| 18 to 34 Years | 0 (0.0%) | 0 (0.0%) |
| 35 to 64 Years | 1 (0.9%) | 0 (0.0%) |
| 65 to 74 Years | 0 (0.0%) | 0 (0.0%) |
| 75 Years and over | 0 (0.0%) | 7 (53.8%) |
Technology Access in Lismore
Computing Device Access in Lismore
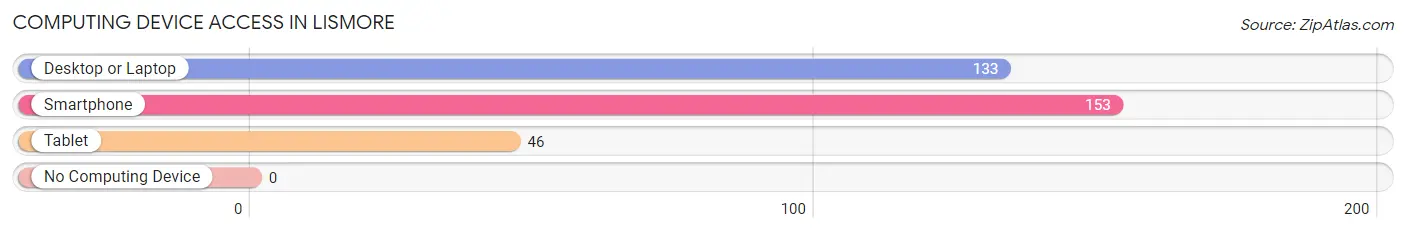
| Device Type | # Households | % Households |
| Desktop or Laptop | 133 | 83.7% |
| Smartphone | 153 | 96.2% |
| Tablet | 46 | 28.9% |
| No Computing Device | 0 | 0.0% |
| Total | 159 | 100.0% |
Internet Access in Lismore
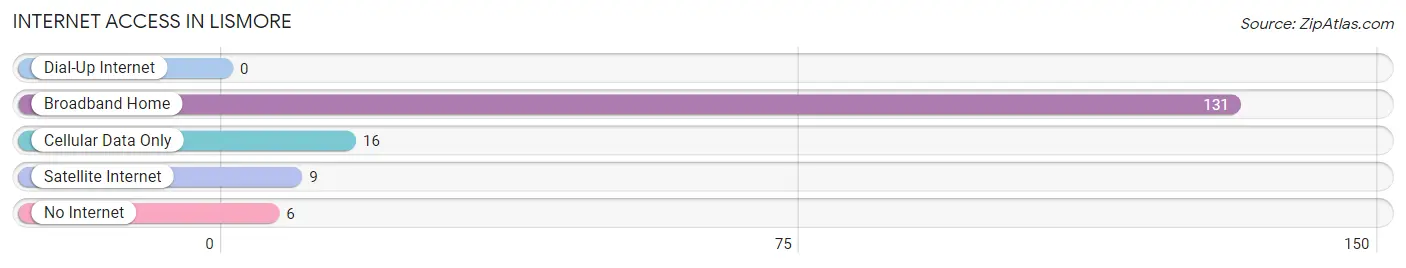
| Internet Type | # Households | % Households |
| Dial-Up Internet | 0 | 0.0% |
| Broadband Home | 131 | 82.4% |
| Cellular Data Only | 16 | 10.1% |
| Satellite Internet | 9 | 5.7% |
| No Internet | 6 | 3.8% |
| Total | 159 | 100.0% |
Lismore Summary
Lismore is a small city located in Cottonwood County, Minnesota, United States. The population was 1,072 at the 2010 census. It is the county seat of Cottonwood County.
History
Lismore was founded in 1872 by a group of Irish immigrants who had come to the area to work on the railroad. The town was named after the town of Lismore in County Waterford, Ireland. The first post office was established in 1873.
In 1876, the first school was built in Lismore. The first church was built in 1877. The first newspaper, the Lismore Herald, was established in 1878.
In 1881 the first bank was established in Lismore The first telephone line was installed in 1883
In 1885 the first railroad was built in Lismore The first electric lights were installed in 1887
In 1889 the first hospital was built in Lismore The first fire department was established in 1890
In 1891 the first library was established in Lismore The first movie theater was built in 1895
In 1897, the first public park was established in Lismore. The first public swimming pool was built in 1898.
In 1900, the first public library was established in Lismore. The first public golf course was built in 1901.
In 1902, the first public high school was established in Lismore. The first public library building was built in 1903.
In 1906, the first public water system was established in Lismore. The first public sewer system was built in 1907.
In 1910, the first public airport was established in Lismore. The first public swimming pool was built in 1911.
In 1912, the first public park was established in Lismore. The first public library building was built in 1913.
In 1914, the first public hospital was established in Lismore. The first public golf course was built in 1915.
In 1916, the first public high school was established in Lismore. The first public library building was built in 1917.
In 1918, the first public water system was established in Lismore. The first public sewer system was built in 1919.
In 1920, the first public airport was established in Lismore. The first public swimming pool was built in 1921.
In 1922, the first public park was established in Lismore. The first public library building was built in 1923.
In 1924, the first public hospital was established in Lismore. The first public golf course was built in 1925.
Geography
Lismore is located at the intersection of U.S. Route 14 and Minnesota State Highway 60 in the southwestern corner of Cottonwood County. It is approximately 30 miles east of the Iowa border and 40 miles west of the South Dakota border.
The city is situated on the banks of the Des Moines River, which flows through the city from east to west. The city is surrounded by rolling hills and farmland.
Economy
The economy of Lismore is largely based on agriculture and manufacturing. The city is home to several large agricultural businesses, including a feed mill, a grain elevator, and a dairy farm.
The city is also home to several manufacturing businesses, including a furniture factory, a plastics factory, and a metal fabrication plant.
Demographics
As of the 2010 census, the population of Lismore was 1,072. The racial makeup of the city was 97.2% White, 0.3% African American, 0.2% Native American, 0.2% Asian, 0.1% Pacific Islander, 0.7% from other races, and 1.3% from two or more races. Hispanic or Latino of any race were 1.7% of the population.
The median household income in Lismore was $41,250, and the median family income was $48,750. The per capita income for the city was $19,945. About 8.3% of families and 10.2% of the population were below the poverty line, including 14.2% of those under age 18 and 8.3% of those age 65 or over.
Common Questions
What is Per Capita Income in Lismore?
Per Capita income in Lismore is $29,558.
What is the Median Family Income in Lismore?
Median Family Income in Lismore is $56,287.
What is the Median Household income in Lismore?
Median Household Income in Lismore is $56,069.
What is Income or Wage Gap in Lismore?
Income or Wage Gap in Lismore is 54.8%.
Women in Lismore earn 45.2 cents for every dollar earned by a man.
What is Inequality or Gini Index in Lismore?
Inequality or Gini Index in Lismore is 0.27.
What is the Total Population of Lismore?
Total Population of Lismore is 292.
What is the Total Male Population of Lismore?
Total Male Population of Lismore is 183.
What is the Total Female Population of Lismore?
Total Female Population of Lismore is 109.
What is the Ratio of Males per 100 Females in Lismore?
There are 167.89 Males per 100 Females in Lismore.
What is the Ratio of Females per 100 Males in Lismore?
There are 59.56 Females per 100 Males in Lismore.
What is the Median Population Age in Lismore?
Median Population Age in Lismore is 48.7 Years.
What is the Average Family Size in Lismore
Average Family Size in Lismore is 2.0 People.
What is the Average Household Size in Lismore
Average Household Size in Lismore is 1.8 People.
How Large is the Labor Force in Lismore?
There are 181 People in the Labor Forcein in Lismore.
What is the Percentage of People in the Labor Force in Lismore?
76.1% of People are in the Labor Force in Lismore.