Edinburg, ND Map & Demographics
Edinburg Map
Edinburg Overview
$43,927
PER CAPITA INCOME
$115,625
AVG FAMILY INCOME
$54,167
AVG HOUSEHOLD INCOME
44.0%
WAGE / INCOME GAP [ % ]
56.0¢/ $1
WAGE / INCOME GAP [ $ ]
0.50
INEQUALITY / GINI INDEX
195
TOTAL POPULATION
80
MALE POPULATION
115
FEMALE POPULATION
69.57
MALES / 100 FEMALES
143.75
FEMALES / 100 MALES
59.1
MEDIAN AGE
2.9
AVG FAMILY SIZE
1.8
AVG HOUSEHOLD SIZE
84
LABOR FORCE [ PEOPLE ]
50.6%
PERCENT IN LABOR FORCE
Edinburg Zip Codes
Edinburg Area Codes
Income in Edinburg
Income Overview in Edinburg
Per Capita Income in Edinburg is $43,927, while median incomes of families and households are $115,625 and $54,167 respectively.
| Characteristic | Number | Measure |
| Per Capita Income | 195 | $43,927 |
| Median Family Income | 46 | $115,625 |
| Mean Family Income | 46 | $137,146 |
| Median Household Income | 108 | $54,167 |
| Mean Household Income | 108 | $76,969 |
| Income Deficit | 46 | $0 |
| Wage / Income Gap (%) | 195 | 43.96% |
| Wage / Income Gap ($) | 195 | 56.04¢ per $1 |
| Gini / Inequality Index | 195 | 0.50 |
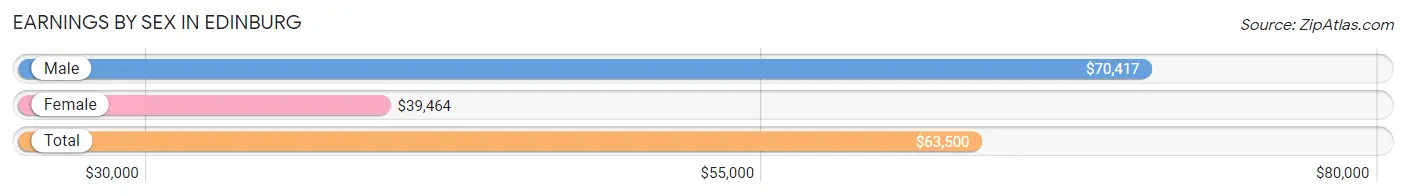
Earnings by Sex in Edinburg
Average Earnings in Edinburg are $63,500, $70,417 for men and $39,464 for women, a difference of 44.0%.
| Sex | Number | Average Earnings |
| Male | 49 (53.3%) | $70,417 |
| Female | 43 (46.7%) | $39,464 |
| Total | 92 (100.0%) | $63,500 |
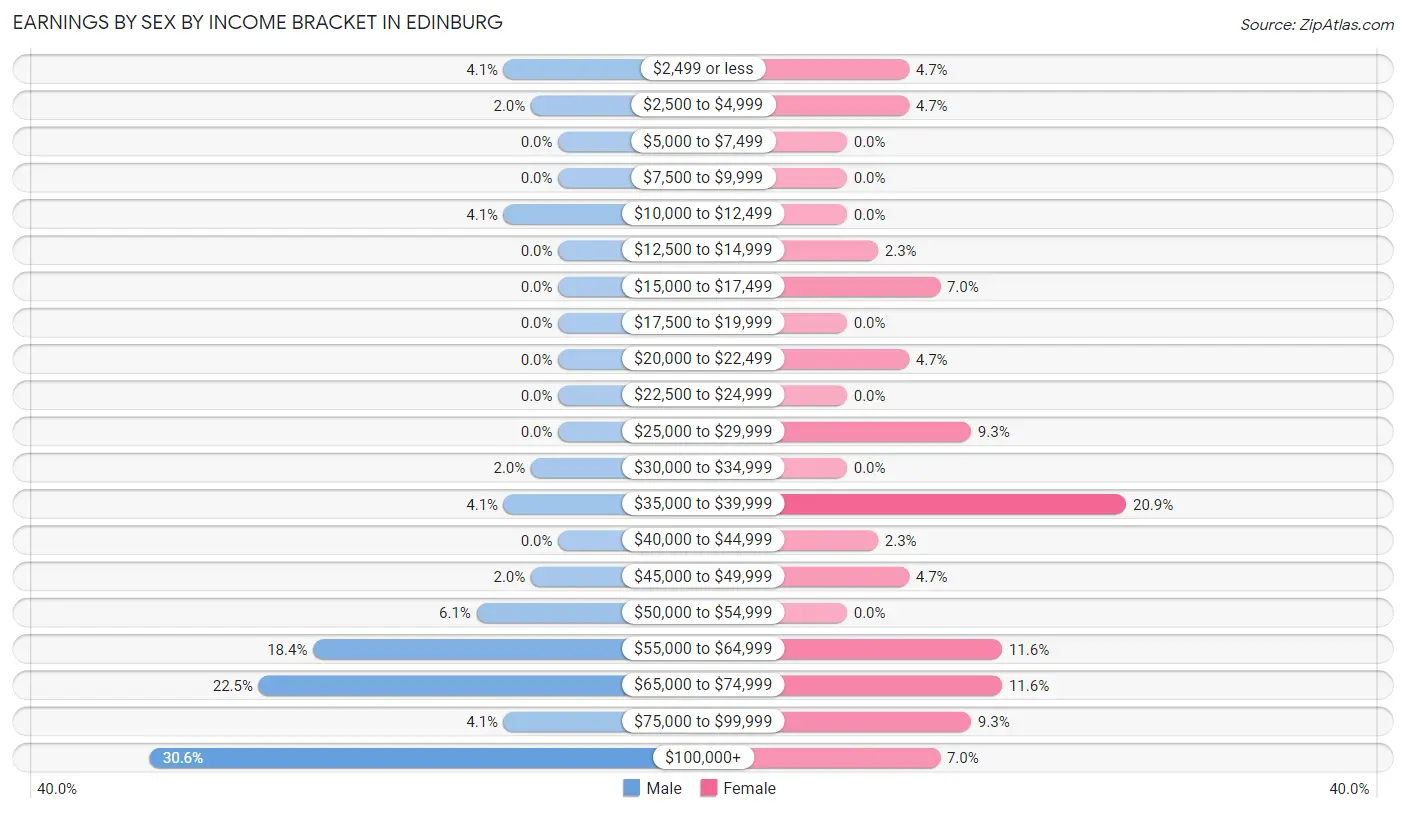
Earnings by Sex by Income Bracket in Edinburg
The most common earnings brackets in Edinburg are $100,000+ for men (15 | 30.6%) and $35,000 to $39,999 for women (9 | 20.9%).
| Income | Male | Female |
| $2,499 or less | 2 (4.1%) | 2 (4.6%) |
| $2,500 to $4,999 | 1 (2.0%) | 2 (4.6%) |
| $5,000 to $7,499 | 0 (0.0%) | 0 (0.0%) |
| $7,500 to $9,999 | 0 (0.0%) | 0 (0.0%) |
| $10,000 to $12,499 | 2 (4.1%) | 0 (0.0%) |
| $12,500 to $14,999 | 0 (0.0%) | 1 (2.3%) |
| $15,000 to $17,499 | 0 (0.0%) | 3 (7.0%) |
| $17,500 to $19,999 | 0 (0.0%) | 0 (0.0%) |
| $20,000 to $22,499 | 0 (0.0%) | 2 (4.6%) |
| $22,500 to $24,999 | 0 (0.0%) | 0 (0.0%) |
| $25,000 to $29,999 | 0 (0.0%) | 4 (9.3%) |
| $30,000 to $34,999 | 1 (2.0%) | 0 (0.0%) |
| $35,000 to $39,999 | 2 (4.1%) | 9 (20.9%) |
| $40,000 to $44,999 | 0 (0.0%) | 1 (2.3%) |
| $45,000 to $49,999 | 1 (2.0%) | 2 (4.6%) |
| $50,000 to $54,999 | 3 (6.1%) | 0 (0.0%) |
| $55,000 to $64,999 | 9 (18.4%) | 5 (11.6%) |
| $65,000 to $74,999 | 11 (22.5%) | 5 (11.6%) |
| $75,000 to $99,999 | 2 (4.1%) | 4 (9.3%) |
| $100,000+ | 15 (30.6%) | 3 (7.0%) |
| Total | 49 (100.0%) | 43 (100.0%) |
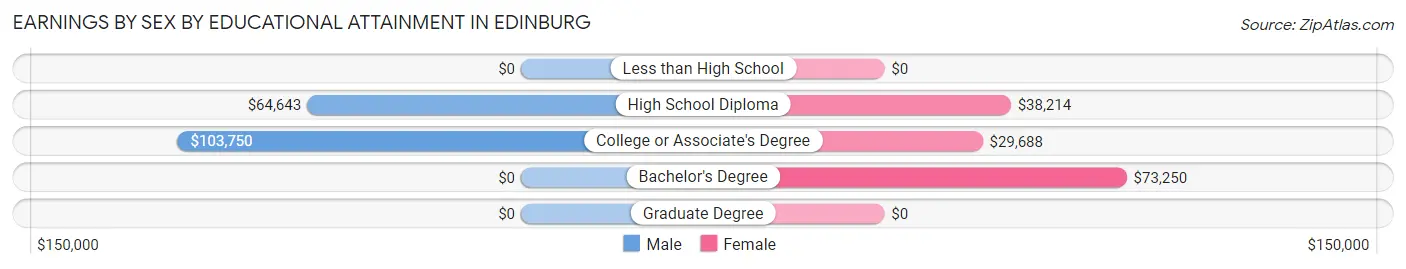
Earnings by Sex by Educational Attainment in Edinburg
Average earnings in Edinburg are $64,821 for men and $39,464 for women, a difference of 39.1%. Men with an educational attainment of college or associate's degree enjoy the highest average annual earnings of $103,750, while those with high school diploma education earn the least with $64,643. Women with an educational attainment of bachelor's degree earn the most with the average annual earnings of $73,250, while those with college or associate's degree education have the smallest earnings of $29,688.
| Educational Attainment | Male Income | Female Income |
| Less than High School | - | - |
| High School Diploma | $64,643 | $38,214 |
| College or Associate's Degree | $103,750 | $29,688 |
| Bachelor's Degree | - | - |
| Graduate Degree | - | - |
| Total | $64,821 | $39,464 |
Family Income in Edinburg
Family Income Brackets in Edinburg
According to the Edinburg family income data, there are 17 families falling into the $100,000 to $149,999 income range, which is the most common income bracket and makes up 37.0% of all families.
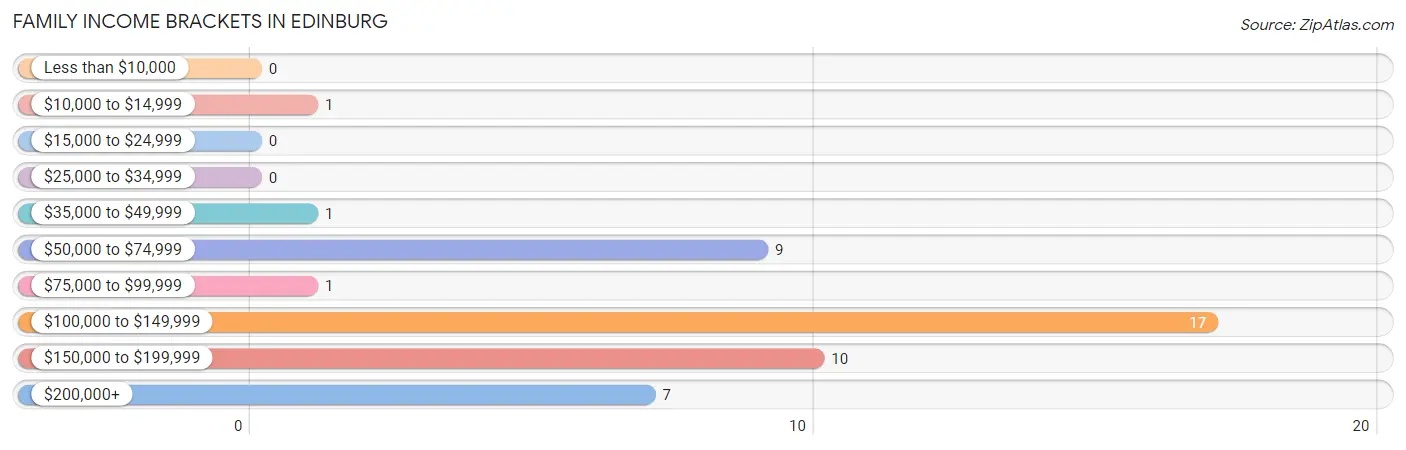
| Income Bracket | # Families | % Families |
| Less than $10,000 | 0 | 0.0% |
| $10,000 to $14,999 | 1 | 2.2% |
| $15,000 to $24,999 | 0 | 0.0% |
| $25,000 to $34,999 | 0 | 0.0% |
| $35,000 to $49,999 | 1 | 2.2% |
| $50,000 to $74,999 | 9 | 19.6% |
| $75,000 to $99,999 | 1 | 2.2% |
| $100,000 to $149,999 | 17 | 37.0% |
| $150,000 to $199,999 | 10 | 21.7% |
| $200,000+ | 7 | 15.2% |
Family Income by Famaliy Size in Edinburg
2-person families (30 | 65.2%) account for the highest median family income in Edinburg with $116,875 per family, while 2-person families (30 | 65.2%) have the highest median income of $58,438 per family member.
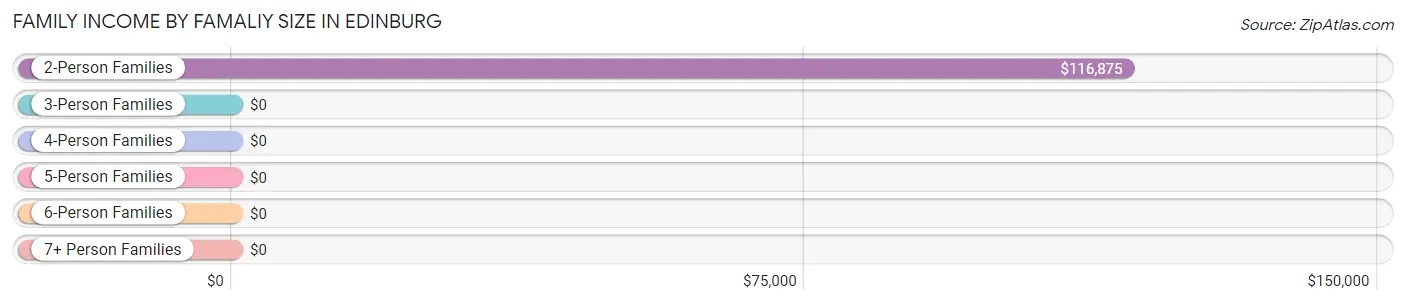
| Income Bracket | # Families | Median Income |
| 2-Person Families | 30 (65.2%) | $116,875 |
| 3-Person Families | 12 (26.1%) | $0 |
| 4-Person Families | 1 (2.2%) | $0 |
| 5-Person Families | 3 (6.5%) | $0 |
| 6-Person Families | 0 (0.0%) | $0 |
| 7+ Person Families | 0 (0.0%) | $0 |
| Total | 46 (100.0%) | $115,625 |
Family Income by Number of Earners in Edinburg
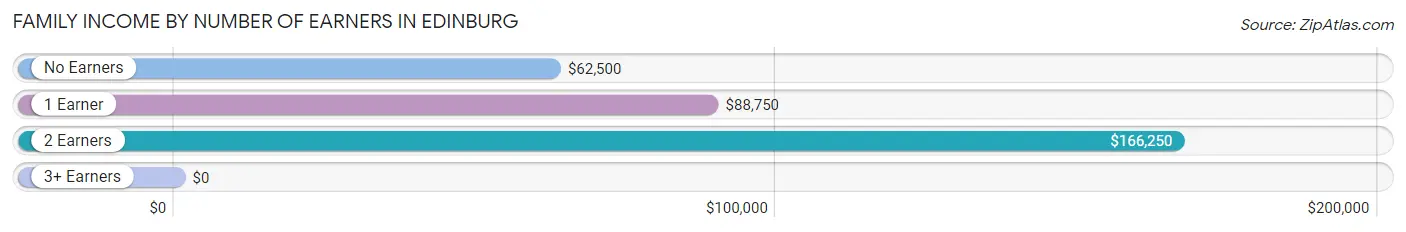
| Number of Earners | # Families | Median Income |
| No Earners | 12 (26.1%) | $62,500 |
| 1 Earner | 7 (15.2%) | $88,750 |
| 2 Earners | 27 (58.7%) | $166,250 |
| 3+ Earners | 0 (0.0%) | $0 |
| Total | 46 (100.0%) | $115,625 |
Household Income in Edinburg
Household Income Brackets in Edinburg
With 23 households falling in the category, the $15,000 to $24,999 income range is the most frequent in Edinburg, accounting for 21.3% of all households. In contrast, only 2 households (1.8%) fall into the $75,000 to $99,999 income bracket, making it the least populous group.
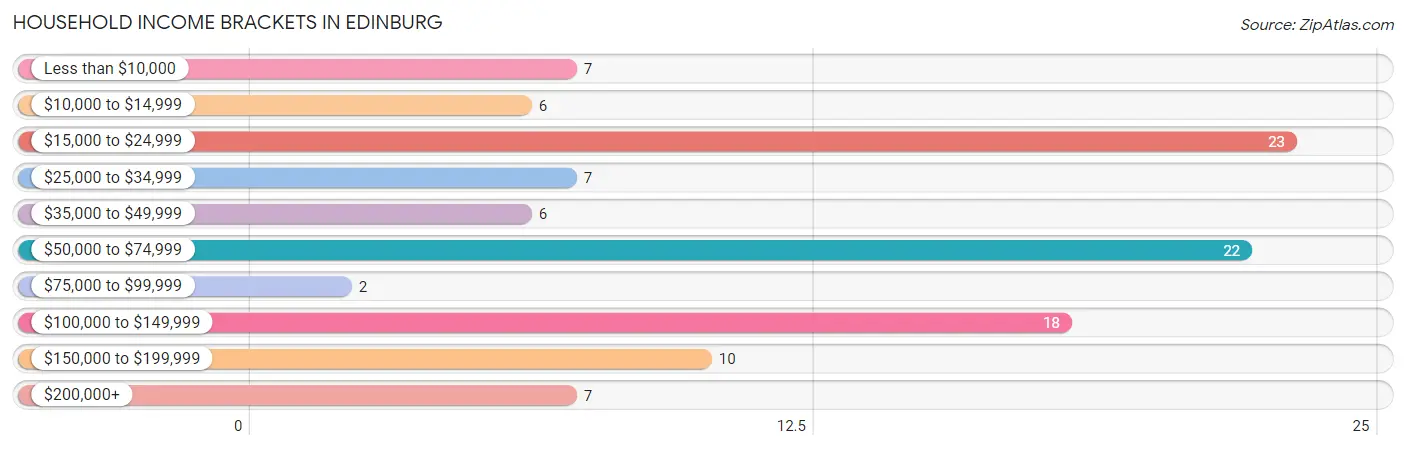
| Income Bracket | # Households | % Households |
| Less than $10,000 | 7 | 6.5% |
| $10,000 to $14,999 | 6 | 5.6% |
| $15,000 to $24,999 | 23 | 21.3% |
| $25,000 to $34,999 | 7 | 6.5% |
| $35,000 to $49,999 | 6 | 5.6% |
| $50,000 to $74,999 | 22 | 20.4% |
| $75,000 to $99,999 | 2 | 1.9% |
| $100,000 to $149,999 | 18 | 16.7% |
| $150,000 to $199,999 | 10 | 9.3% |
| $200,000+ | 7 | 6.5% |
Household Income by Householder Age in Edinburg
The median household income in Edinburg is $54,167, with the highest median household income of $100,833 found in the 25 to 44 years age bracket for the primary householder. A total of 16 households (14.8%) fall into this category. Meanwhile, the 15 to 24 years age bracket for the primary householder has the lowest median household income of $0, with 8 households (7.4%) in this group.
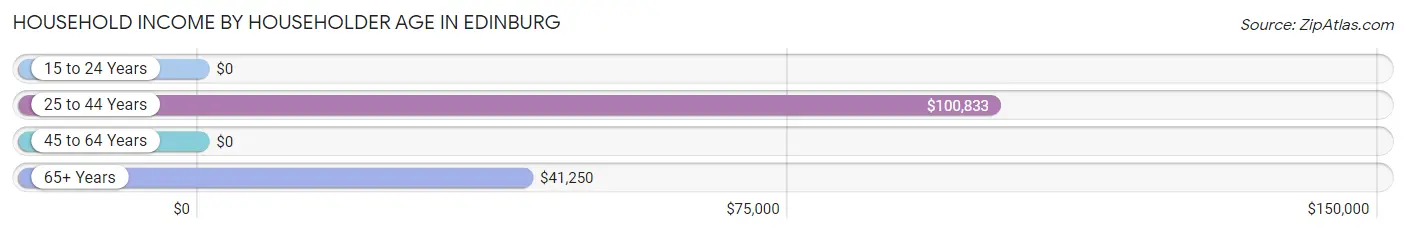
| Income Bracket | # Households | Median Income |
| 15 to 24 Years | 8 (7.4%) | $0 |
| 25 to 44 Years | 16 (14.8%) | $100,833 |
| 45 to 64 Years | 47 (43.5%) | $0 |
| 65+ Years | 37 (34.3%) | $41,250 |
| Total | 108 (100.0%) | $54,167 |
Poverty in Edinburg
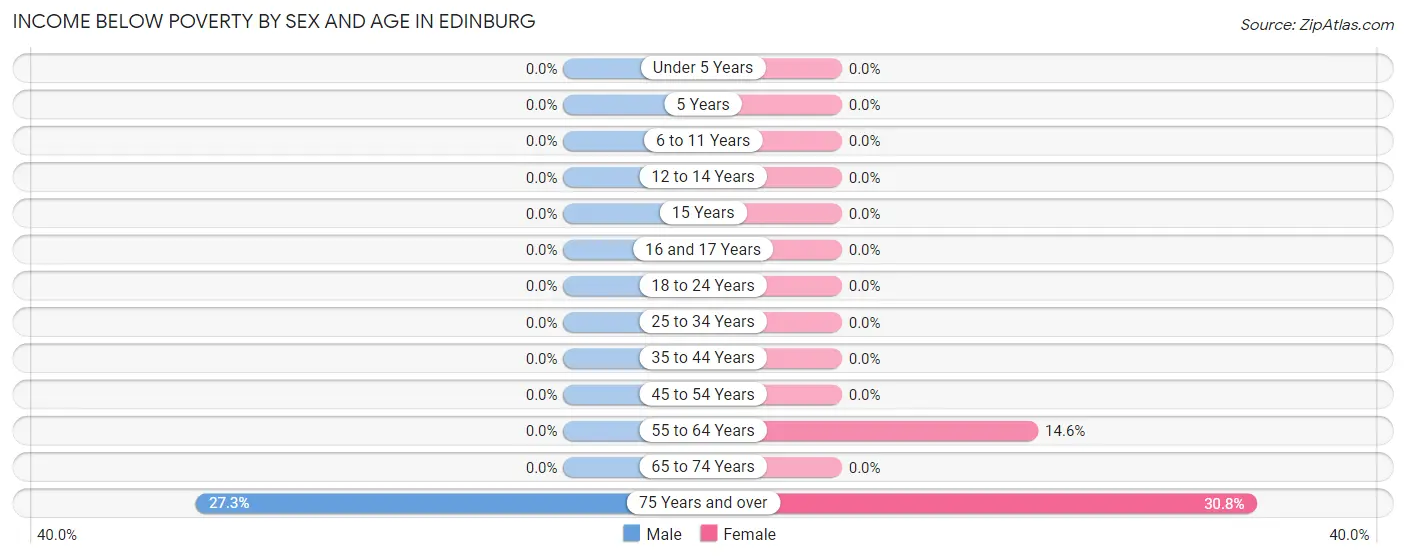
Income Below Poverty by Sex and Age in Edinburg
With 3.7% poverty level for males and 9.6% for females among the residents of Edinburg, 75 year old and over males and 75 year old and over females are the most vulnerable to poverty, with 3 males (27.3%) and 4 females (30.8%) in their respective age groups living below the poverty level.
| Age Bracket | Male | Female |
| Under 5 Years | 0 (0.0%) | 0 (0.0%) |
| 5 Years | 0 (0.0%) | 0 (0.0%) |
| 6 to 11 Years | 0 (0.0%) | 0 (0.0%) |
| 12 to 14 Years | 0 (0.0%) | 0 (0.0%) |
| 15 Years | 0 (0.0%) | 0 (0.0%) |
| 16 and 17 Years | 0 (0.0%) | 0 (0.0%) |
| 18 to 24 Years | 0 (0.0%) | 0 (0.0%) |
| 25 to 34 Years | 0 (0.0%) | 0 (0.0%) |
| 35 to 44 Years | 0 (0.0%) | 0 (0.0%) |
| 45 to 54 Years | 0 (0.0%) | 0 (0.0%) |
| 55 to 64 Years | 0 (0.0%) | 7 (14.6%) |
| 65 to 74 Years | 0 (0.0%) | 0 (0.0%) |
| 75 Years and over | 3 (27.3%) | 4 (30.8%) |
| Total | 3 (3.7%) | 11 (9.6%) |
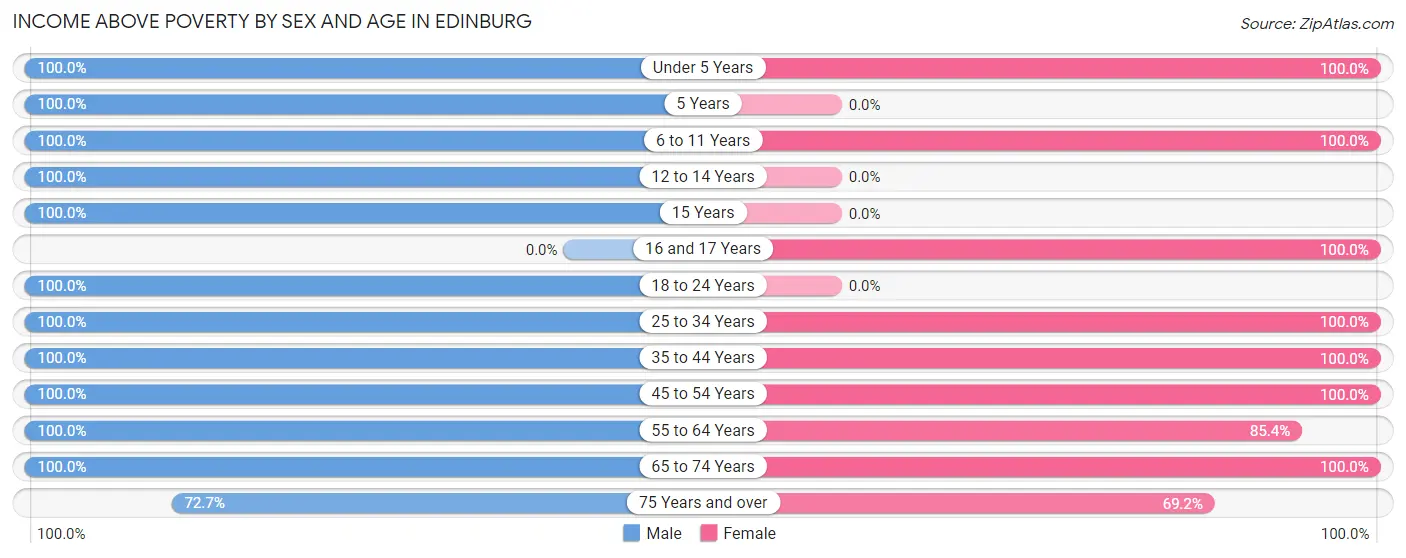
Income Above Poverty by Sex and Age in Edinburg
According to the poverty statistics in Edinburg, males aged under 5 years and females aged under 5 years are the age groups that are most secure financially, with 100.0% of males and 100.0% of females in these age groups living above the poverty line.
| Age Bracket | Male | Female |
| Under 5 Years | 3 (100.0%) | 14 (100.0%) |
| 5 Years | 2 (100.0%) | 0 (0.0%) |
| 6 to 11 Years | 2 (100.0%) | 4 (100.0%) |
| 12 to 14 Years | 2 (100.0%) | 0 (0.0%) |
| 15 Years | 2 (100.0%) | 0 (0.0%) |
| 16 and 17 Years | 0 (0.0%) | 3 (100.0%) |
| 18 to 24 Years | 8 (100.0%) | 0 (0.0%) |
| 25 to 34 Years | 8 (100.0%) | 6 (100.0%) |
| 35 to 44 Years | 8 (100.0%) | 9 (100.0%) |
| 45 to 54 Years | 3 (100.0%) | 4 (100.0%) |
| 55 to 64 Years | 18 (100.0%) | 41 (85.4%) |
| 65 to 74 Years | 13 (100.0%) | 14 (100.0%) |
| 75 Years and over | 8 (72.7%) | 9 (69.2%) |
| Total | 77 (96.3%) | 104 (90.4%) |
Income Below Poverty Among Married-Couple Families in Edinburg
The poverty statistics for married-couple families in Edinburg show that 2.2% or 1 of the total 46 families live below the poverty line. Families with no children have the highest poverty rate of 3.2%, comprising of 1 families. On the other hand, families with 1 or 2 children have the lowest poverty rate of 0.0%, which includes 0 families.
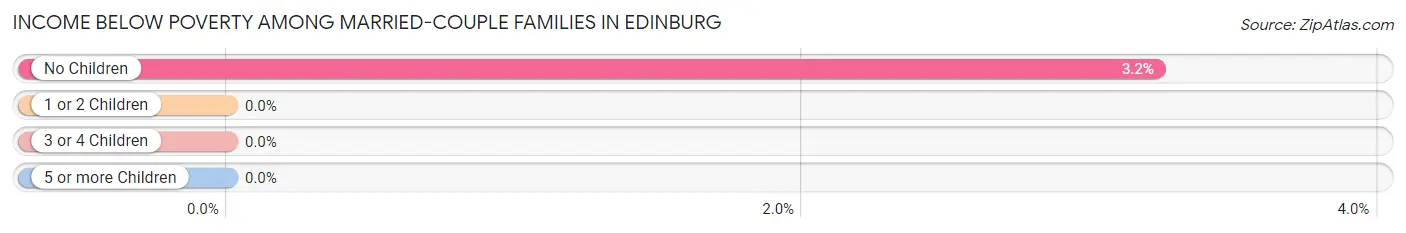
| Children | Above Poverty | Below Poverty |
| No Children | 30 (96.8%) | 1 (3.2%) |
| 1 or 2 Children | 12 (100.0%) | 0 (0.0%) |
| 3 or 4 Children | 3 (100.0%) | 0 (0.0%) |
| 5 or more Children | 0 (0.0%) | 0 (0.0%) |
| Total | 45 (97.8%) | 1 (2.2%) |
Income Below Poverty Among Single-Parent Households in Edinburg
| Children | Single Father | Single Mother |
| No Children | 0 (0.0%) | 0 (0.0%) |
| 1 or 2 Children | 0 (0.0%) | 0 (0.0%) |
| 3 or 4 Children | 0 (0.0%) | 0 (0.0%) |
| 5 or more Children | 0 (0.0%) | 0 (0.0%) |
| Total | 0 (0.0%) | 0 (0.0%) |
Income Below Poverty Among Married-Couple vs Single-Parent Households in Edinburg
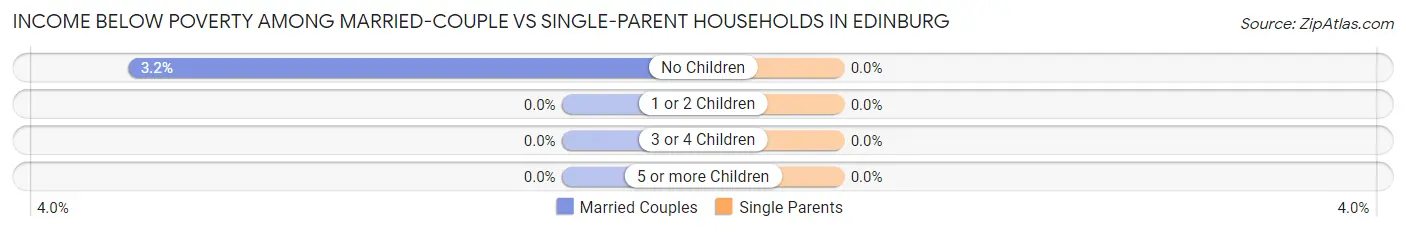
| Children | Married-Couple Families | Single-Parent Households |
| No Children | 1 (3.2%) | 0 (0.0%) |
| 1 or 2 Children | 0 (0.0%) | 0 (0.0%) |
| 3 or 4 Children | 0 (0.0%) | 0 (0.0%) |
| 5 or more Children | 0 (0.0%) | 0 (0.0%) |
| Total | 1 (2.2%) | 0 (0.0%) |
Race in Edinburg
The most populous races in Edinburg are White / Caucasian (188 | 96.4%), Hispanic or Latino (7 | 3.6%), and Asian (4 | 2.1%).
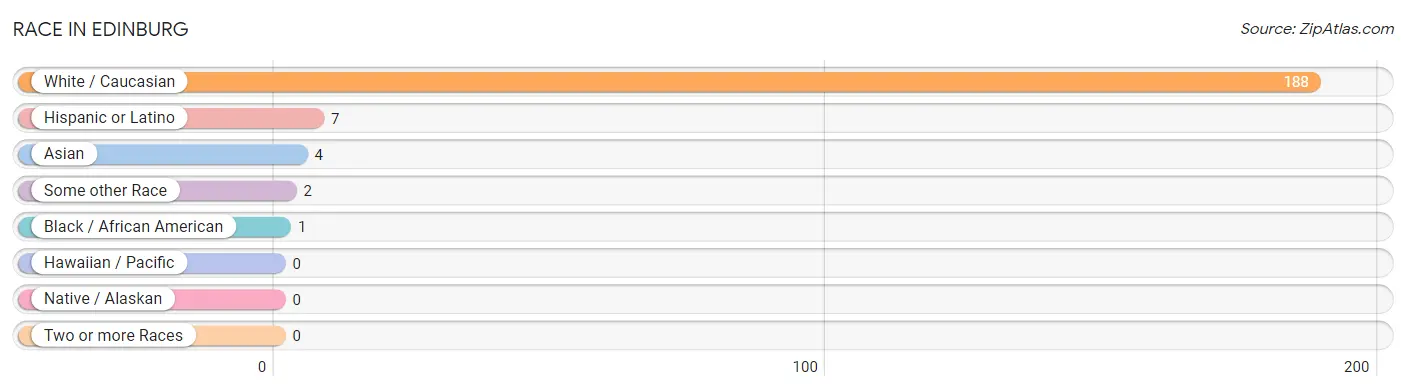
| Race | # Population | % Population |
| Asian | 4 | 2.1% |
| Black / African American | 1 | 0.5% |
| Hawaiian / Pacific | 0 | 0.0% |
| Hispanic or Latino | 7 | 3.6% |
| Native / Alaskan | 0 | 0.0% |
| White / Caucasian | 188 | 96.4% |
| Two or more Races | 0 | 0.0% |
| Some other Race | 2 | 1.0% |
| Total | 195 | 100.0% |
Ancestry in Edinburg
The most populous ancestries reported in Edinburg are German (55 | 28.2%), Norwegian (49 | 25.1%), Icelander (25 | 12.8%), Swedish (21 | 10.8%), and Polish (7 | 3.6%), together accounting for 80.5% of all Edinburg residents.
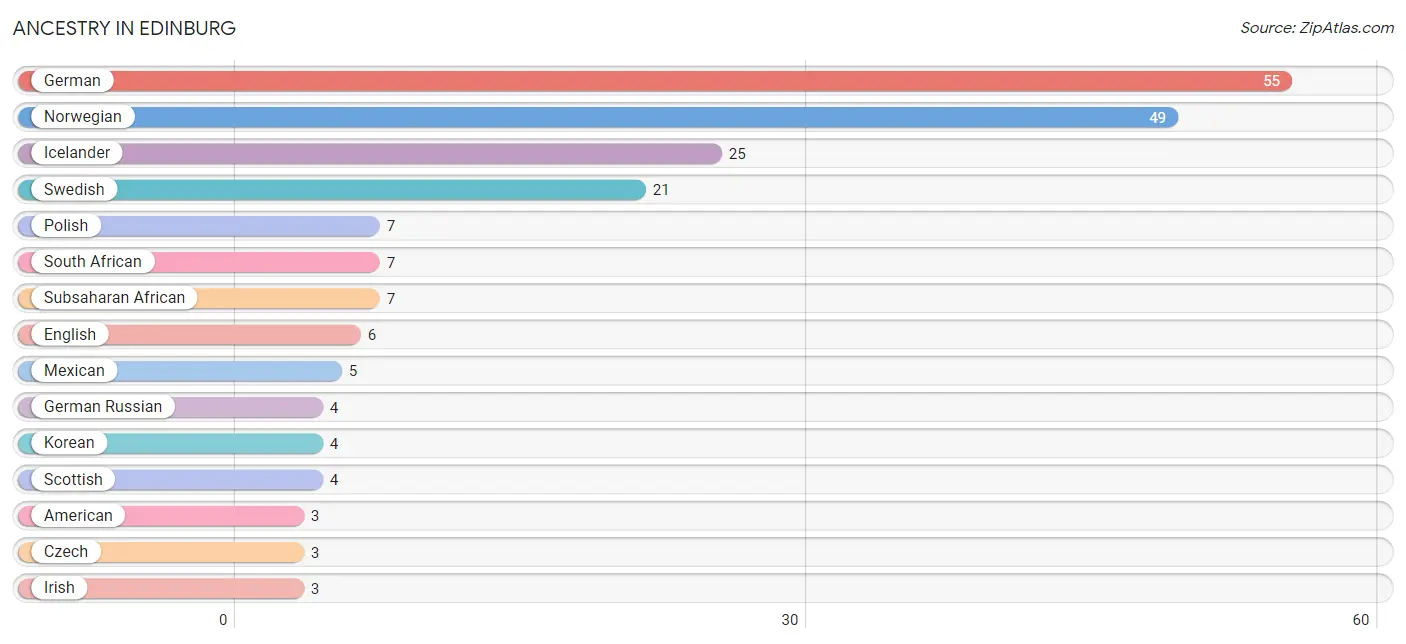
| Ancestry | # Population | % Population |
| American | 3 | 1.5% |
| British | 2 | 1.0% |
| Central American | 2 | 1.0% |
| Czech | 3 | 1.5% |
| English | 6 | 3.1% |
| German | 55 | 28.2% |
| German Russian | 4 | 2.1% |
| Icelander | 25 | 12.8% |
| Irish | 3 | 1.5% |
| Korean | 4 | 2.1% |
| Mexican | 5 | 2.6% |
| Norwegian | 49 | 25.1% |
| Panamanian | 2 | 1.0% |
| Polish | 7 | 3.6% |
| Scandinavian | 2 | 1.0% |
| Scottish | 4 | 2.1% |
| South African | 7 | 3.6% |
| Subsaharan African | 7 | 3.6% |
| Swedish | 21 | 10.8% | View All 19 Rows |
Immigrants in Edinburg
The most numerous immigrant groups reported in Edinburg came from , and Africa (7 | 3.6%), together accounting for 3.6% of all Edinburg residents.

| Immigration Origin | # Population | % Population |
| Africa | 7 | 3.6% | View All 1 Rows |
Sex and Age in Edinburg
Sex and Age in Edinburg
The most populous age groups in Edinburg are 60 to 64 Years (10 | 12.5%) for men and 55 to 59 Years (28 | 24.3%) for women.
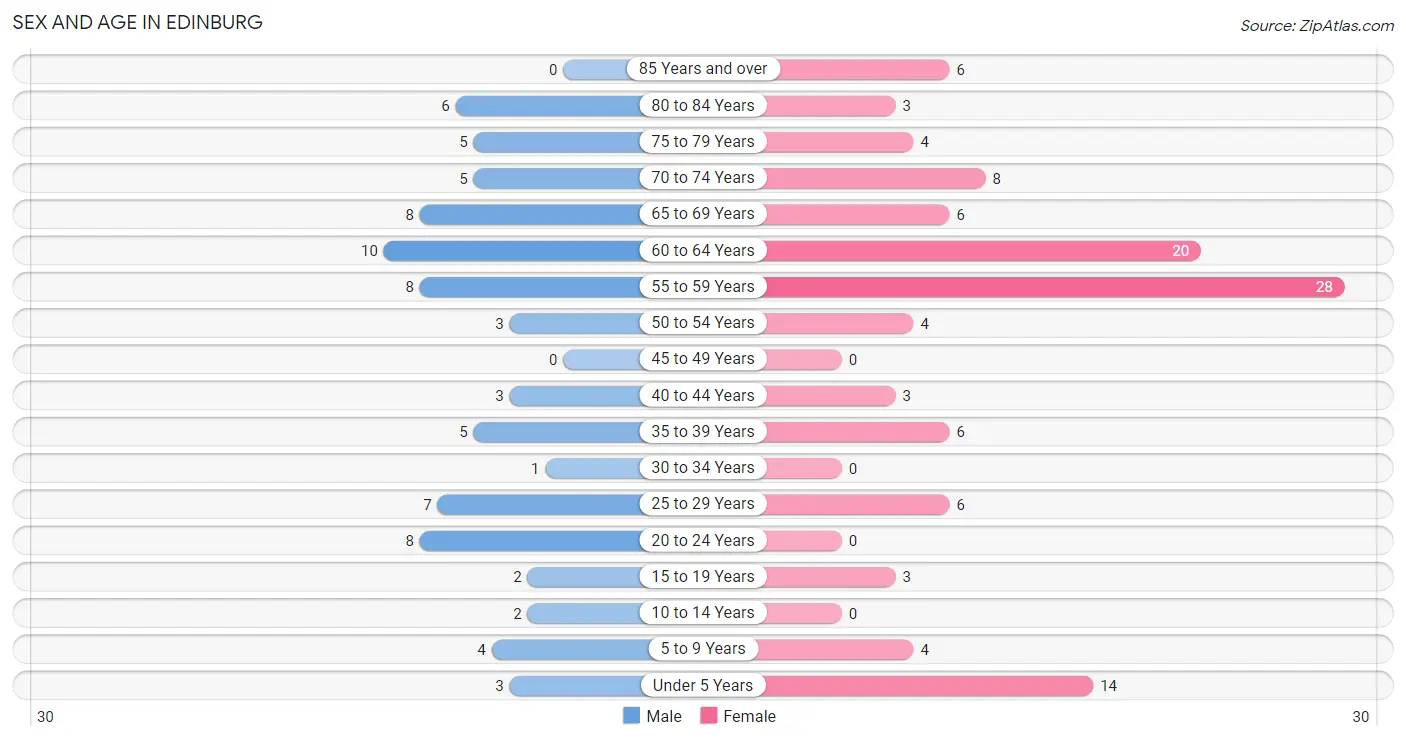
| Age Bracket | Male | Female |
| Under 5 Years | 3 (3.7%) | 14 (12.2%) |
| 5 to 9 Years | 4 (5.0%) | 4 (3.5%) |
| 10 to 14 Years | 2 (2.5%) | 0 (0.0%) |
| 15 to 19 Years | 2 (2.5%) | 3 (2.6%) |
| 20 to 24 Years | 8 (10.0%) | 0 (0.0%) |
| 25 to 29 Years | 7 (8.7%) | 6 (5.2%) |
| 30 to 34 Years | 1 (1.3%) | 0 (0.0%) |
| 35 to 39 Years | 5 (6.2%) | 6 (5.2%) |
| 40 to 44 Years | 3 (3.7%) | 3 (2.6%) |
| 45 to 49 Years | 0 (0.0%) | 0 (0.0%) |
| 50 to 54 Years | 3 (3.7%) | 4 (3.5%) |
| 55 to 59 Years | 8 (10.0%) | 28 (24.3%) |
| 60 to 64 Years | 10 (12.5%) | 20 (17.4%) |
| 65 to 69 Years | 8 (10.0%) | 6 (5.2%) |
| 70 to 74 Years | 5 (6.2%) | 8 (7.0%) |
| 75 to 79 Years | 5 (6.2%) | 4 (3.5%) |
| 80 to 84 Years | 6 (7.5%) | 3 (2.6%) |
| 85 Years and over | 0 (0.0%) | 6 (5.2%) |
| Total | 80 (100.0%) | 115 (100.0%) |
Families and Households in Edinburg
Median Family Size in Edinburg
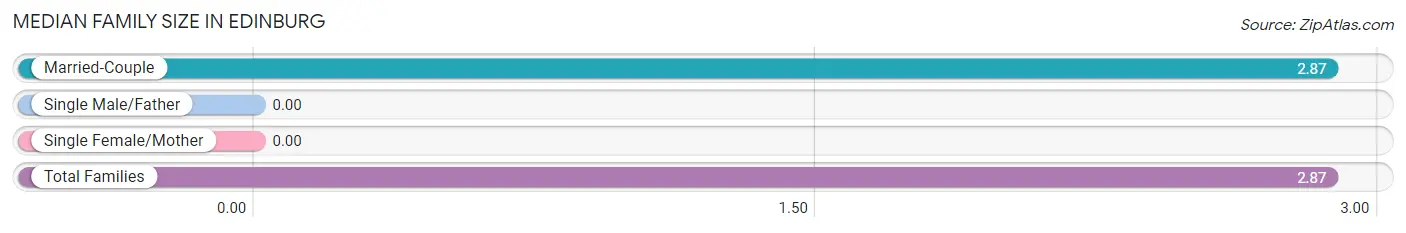
| Family Type | # Families | Family Size |
| Married-Couple | 46 (100.0%) | 2.87 |
| Single Male/Father | 0 (0.0%) | - |
| Single Female/Mother | 0 (0.0%) | - |
| Total Families | 46 (100.0%) | 2.87 |
Median Household Size in Edinburg
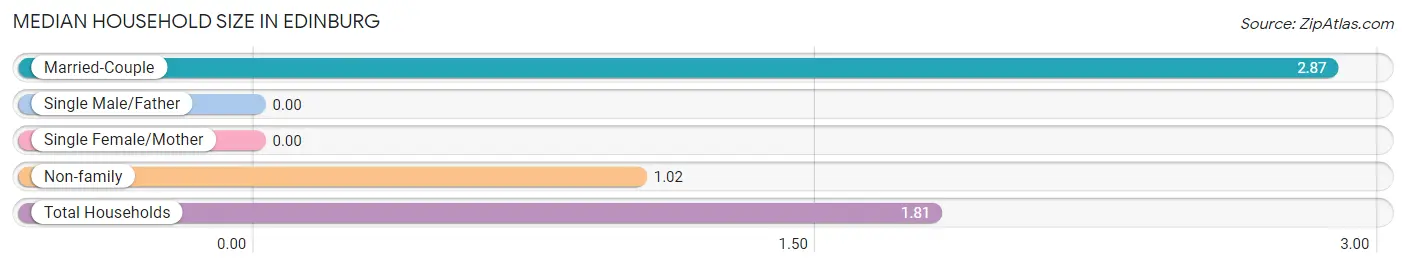
| Household Type | # Households | Household Size |
| Married-Couple | 46 (42.6%) | 2.87 |
| Single Male/Father | 0 (0.0%) | - |
| Single Female/Mother | 0 (0.0%) | - |
| Non-family | 62 (57.4%) | 1.02 |
| Total Households | 108 (100.0%) | 1.81 |
Household Size by Marriage Status in Edinburg
Out of a total of 108 households in Edinburg, 46 (42.6%) are family households, while 62 (57.4%) are nonfamily households. The most numerous type of family households are 2-person households, comprising 30, and the most common type of nonfamily households are 1-person households, comprising 61.
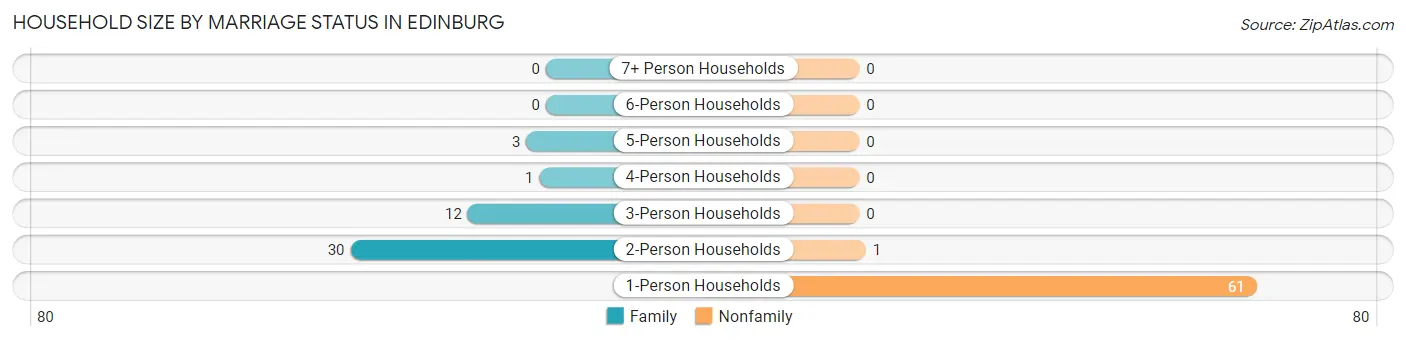
| Household Size | Family Households | Nonfamily Households |
| 1-Person Households | - | 61 (56.5%) |
| 2-Person Households | 30 (27.8%) | 1 (0.9%) |
| 3-Person Households | 12 (11.1%) | 0 (0.0%) |
| 4-Person Households | 1 (0.9%) | 0 (0.0%) |
| 5-Person Households | 3 (2.8%) | 0 (0.0%) |
| 6-Person Households | 0 (0.0%) | 0 (0.0%) |
| 7+ Person Households | 0 (0.0%) | 0 (0.0%) |
| Total | 46 (42.6%) | 62 (57.4%) |
Female Fertility in Edinburg
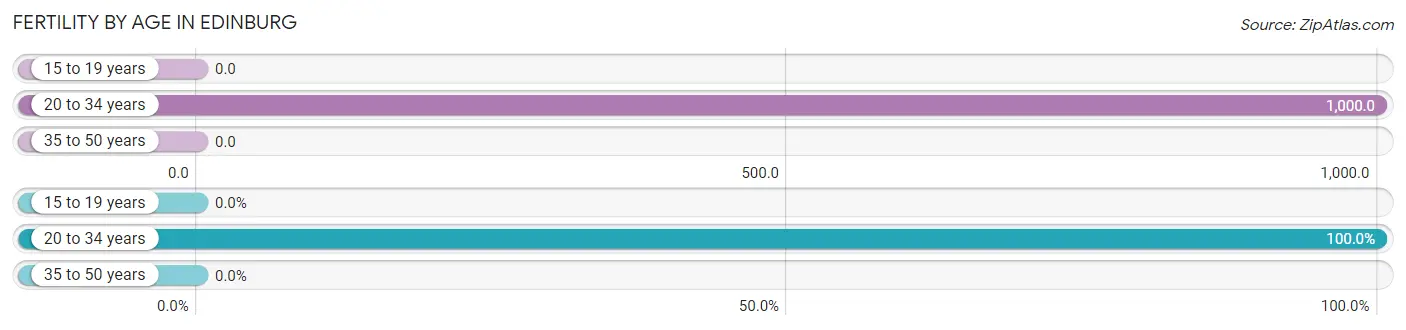
Fertility by Age in Edinburg
Average fertility rate in Edinburg is 333.0 births per 1,000 women. Women in the age bracket of 20 to 34 years have the highest fertility rate with 1,000.0 births per 1,000 women. Women in the age bracket of 20 to 34 years acount for 100.0% of all women with births.
| Age Bracket | Women with Births | Births / 1,000 Women |
| 15 to 19 years | 0 (0.0%) | 0.0 |
| 20 to 34 years | 6 (100.0%) | 1,000.0 |
| 35 to 50 years | 0 (0.0%) | 0.0 |
| Total | 6 (100.0%) | 333.0 |
Fertility by Age by Marriage Status in Edinburg
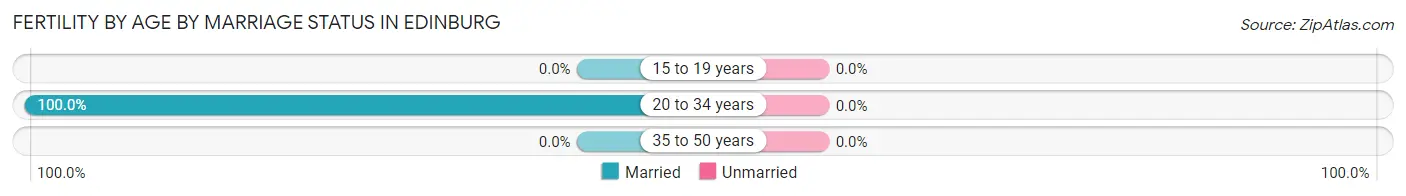
| Age Bracket | Married | Unmarried |
| 15 to 19 years | 0 (0.0%) | 0 (0.0%) |
| 20 to 34 years | 6 (100.0%) | 0 (0.0%) |
| 35 to 50 years | 0 (0.0%) | 0 (0.0%) |
| Total | 6 (100.0%) | 0 (0.0%) |
Fertility by Education in Edinburg
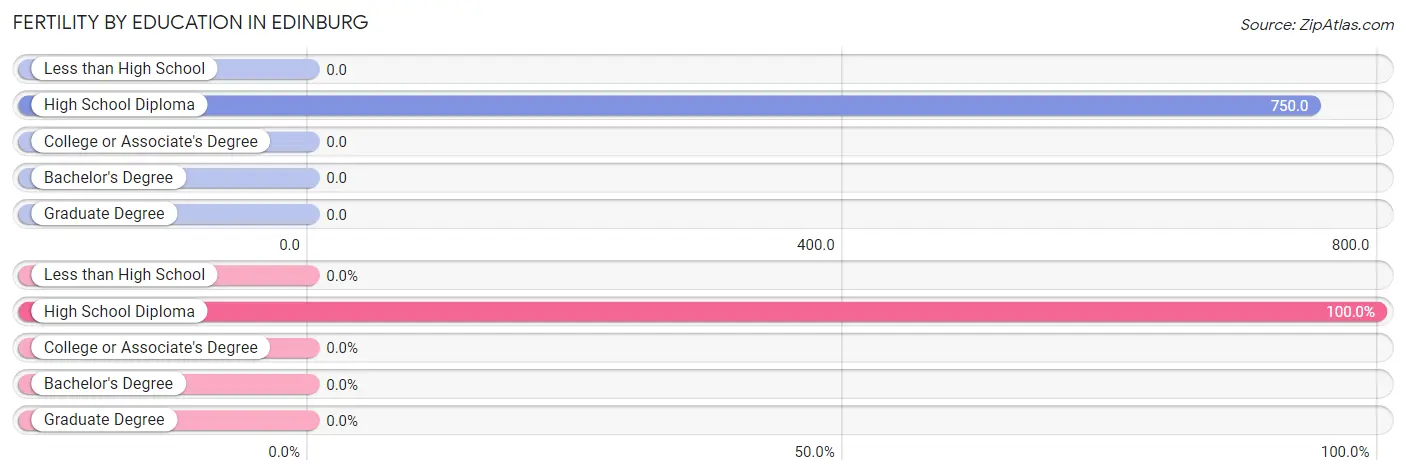
| Educational Attainment | Women with Births | Births / 1,000 Women |
| Less than High School | 0 (0.0%) | 0.0 |
| High School Diploma | 6 (100.0%) | 750.0 |
| College or Associate's Degree | 0 (0.0%) | 0.0 |
| Bachelor's Degree | 0 (0.0%) | 0.0 |
| Graduate Degree | 0 (0.0%) | 0.0 |
| Total | 6 (100.0%) | 333.0 |
Fertility by Education by Marriage Status in Edinburg
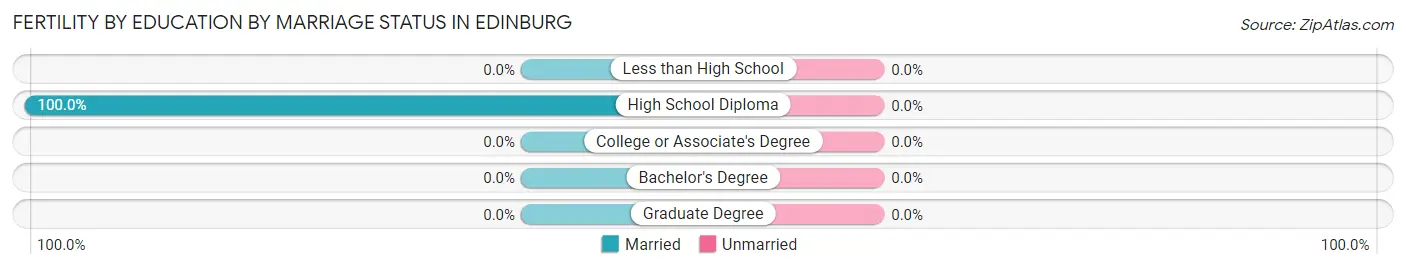
| Educational Attainment | Married | Unmarried |
| Less than High School | 0 (0.0%) | 0 (0.0%) |
| High School Diploma | 6 (100.0%) | 0 (0.0%) |
| College or Associate's Degree | 0 (0.0%) | 0 (0.0%) |
| Bachelor's Degree | 0 (0.0%) | 0 (0.0%) |
| Graduate Degree | 0 (0.0%) | 0 (0.0%) |
| Total | 6 (100.0%) | 0 (0.0%) |
Employment Characteristics in Edinburg
Employment by Class of Employer in Edinburg
Among the 84 employed individuals in Edinburg, private company employees (36 | 42.9%), self-employed (not incorporated) (15 | 17.9%), and local government employees (9 | 10.7%) make up the most common classes of employment.
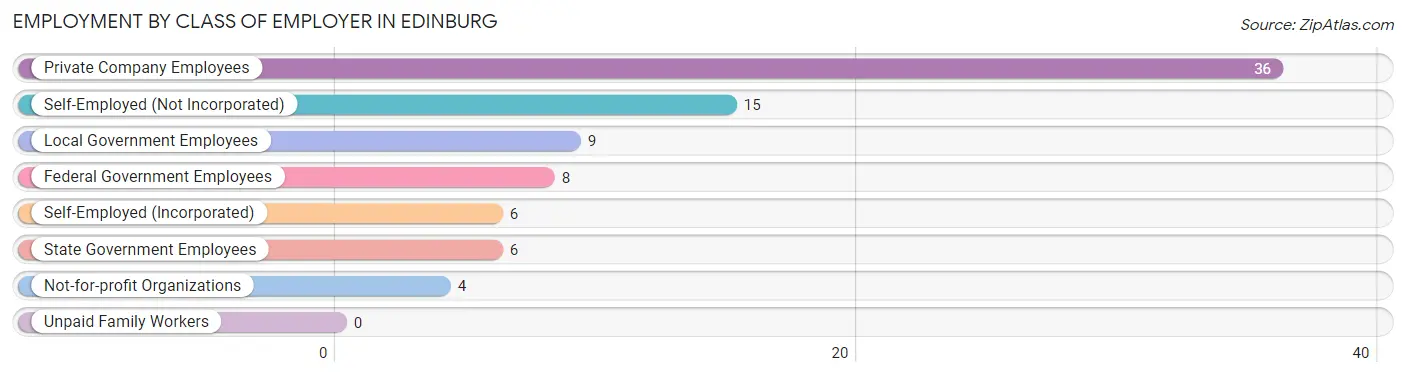
| Employer Class | # Employees | % Employees |
| Private Company Employees | 36 | 42.9% |
| Self-Employed (Incorporated) | 6 | 7.1% |
| Self-Employed (Not Incorporated) | 15 | 17.9% |
| Not-for-profit Organizations | 4 | 4.8% |
| Local Government Employees | 9 | 10.7% |
| State Government Employees | 6 | 7.1% |
| Federal Government Employees | 8 | 9.5% |
| Unpaid Family Workers | 0 | 0.0% |
| Total | 84 | 100.0% |
Employment Status by Age in Edinburg
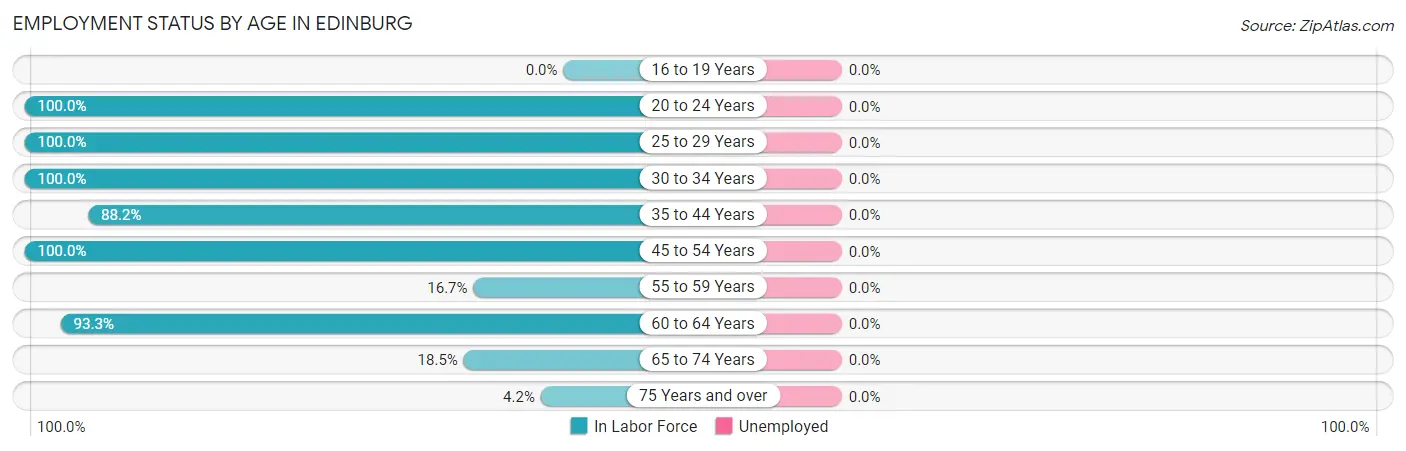
| Age Bracket | In Labor Force | Unemployed |
| 16 to 19 Years | 0 (0.0%) | 0 (0.0%) |
| 20 to 24 Years | 8 (100.0%) | 0 (0.0%) |
| 25 to 29 Years | 13 (100.0%) | 0 (0.0%) |
| 30 to 34 Years | 1 (100.0%) | 0 (0.0%) |
| 35 to 44 Years | 15 (88.2%) | 0 (0.0%) |
| 45 to 54 Years | 7 (100.0%) | 0 (0.0%) |
| 55 to 59 Years | 6 (16.7%) | 0 (0.0%) |
| 60 to 64 Years | 28 (93.3%) | 0 (0.0%) |
| 65 to 74 Years | 5 (18.5%) | 0 (0.0%) |
| 75 Years and over | 1 (4.2%) | 0 (0.0%) |
| Total | 84 (50.6%) | 0 (0.0%) |
Employment Status by Educational Attainment in Edinburg
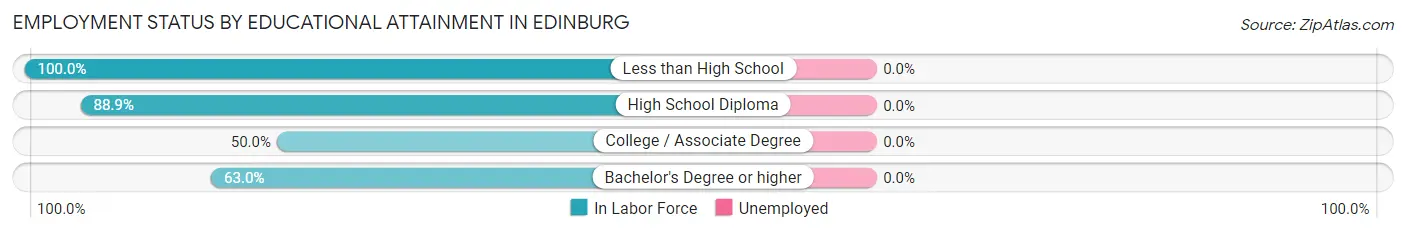
| Educational Attainment | In Labor Force | Unemployed |
| Less than High School | 1 (100.0%) | 0 (0.0%) |
| High School Diploma | 32 (88.9%) | 0 (0.0%) |
| College / Associate Degree | 20 (50.0%) | 0 (0.0%) |
| Bachelor's Degree or higher | 17 (63.0%) | 0 (0.0%) |
| Total | 70 (67.3%) | 0 (0.0%) |
Employment Occupations by Sex in Edinburg
Management, Business, Science and Arts Occupations
The most common Management, Business, Science and Arts occupations in Edinburg are Management (20 | 23.8%), Health Diagnosing & Treating (12 | 14.3%), Health Technologists (12 | 14.3%), Community & Social Service (7 | 8.3%), and Education Instruction & Library (4 | 4.8%).
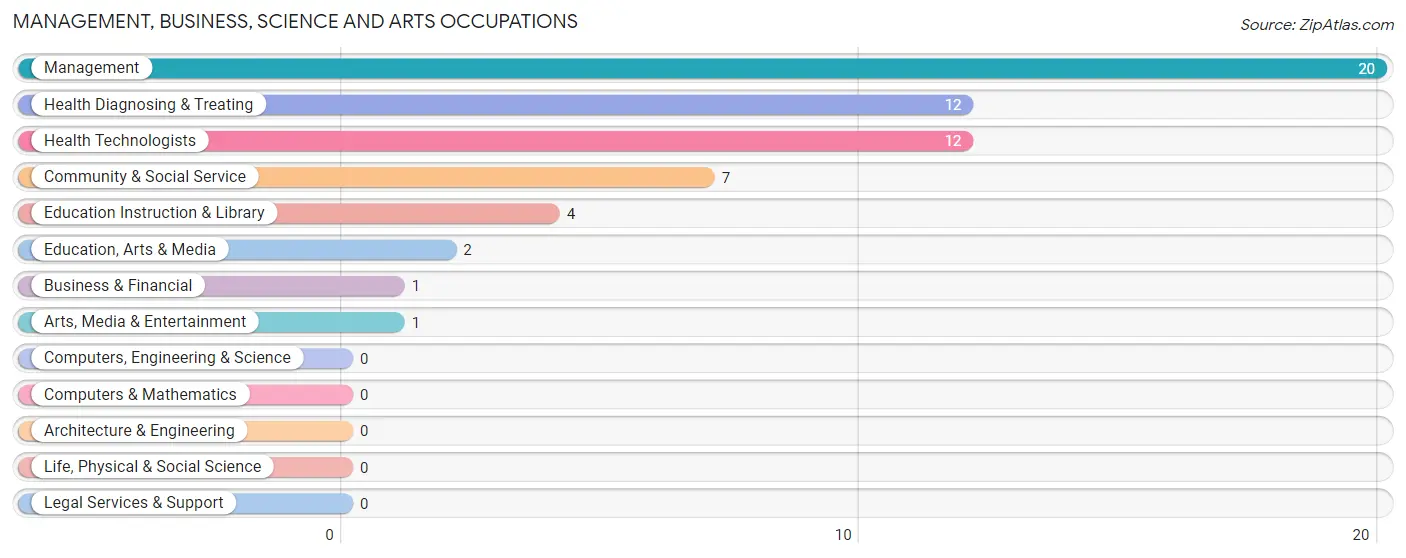
Management, Business, Science and Arts Occupations by Sex
Within the Management, Business, Science and Arts occupations in Edinburg, the most male-oriented occupations are Business & Financial (100.0%), Management (85.0%), and Health Diagnosing & Treating (8.3%), while the most female-oriented occupations are Community & Social Service (100.0%), Education, Arts & Media (100.0%), and Education Instruction & Library (100.0%).
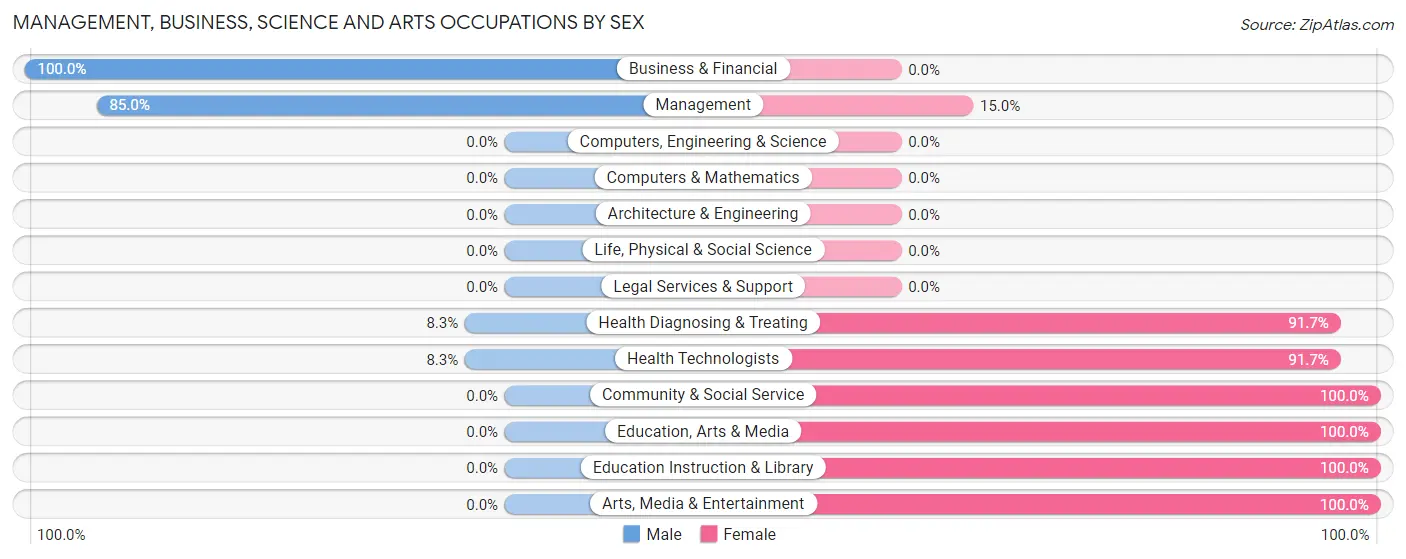
| Occupation | Male | Female |
| Management | 17 (85.0%) | 3 (15.0%) |
| Business & Financial | 1 (100.0%) | 0 (0.0%) |
| Computers, Engineering & Science | 0 (0.0%) | 0 (0.0%) |
| Computers & Mathematics | 0 (0.0%) | 0 (0.0%) |
| Architecture & Engineering | 0 (0.0%) | 0 (0.0%) |
| Life, Physical & Social Science | 0 (0.0%) | 0 (0.0%) |
| Community & Social Service | 0 (0.0%) | 7 (100.0%) |
| Education, Arts & Media | 0 (0.0%) | 2 (100.0%) |
| Legal Services & Support | 0 (0.0%) | 0 (0.0%) |
| Education Instruction & Library | 0 (0.0%) | 4 (100.0%) |
| Arts, Media & Entertainment | 0 (0.0%) | 1 (100.0%) |
| Health Diagnosing & Treating | 1 (8.3%) | 11 (91.7%) |
| Health Technologists | 1 (8.3%) | 11 (91.7%) |
| Total (Category) | 19 (47.5%) | 21 (52.5%) |
| Total (Overall) | 43 (51.2%) | 41 (48.8%) |
Services Occupations
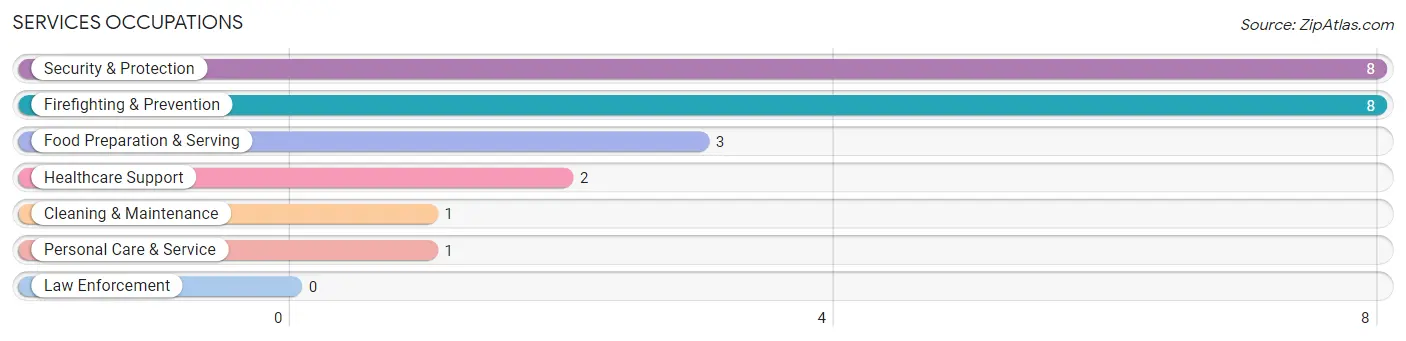
The most common Services occupations in Edinburg are Security & Protection (8 | 9.5%), Firefighting & Prevention (8 | 9.5%), Food Preparation & Serving (3 | 3.6%), Healthcare Support (2 | 2.4%), and Cleaning & Maintenance (1 | 1.2%).
Services Occupations by Sex
Within the Services occupations in Edinburg, the most male-oriented occupations are Security & Protection (100.0%), and Firefighting & Prevention (100.0%), while the most female-oriented occupations are Healthcare Support (100.0%), Food Preparation & Serving (100.0%), and Cleaning & Maintenance (100.0%).
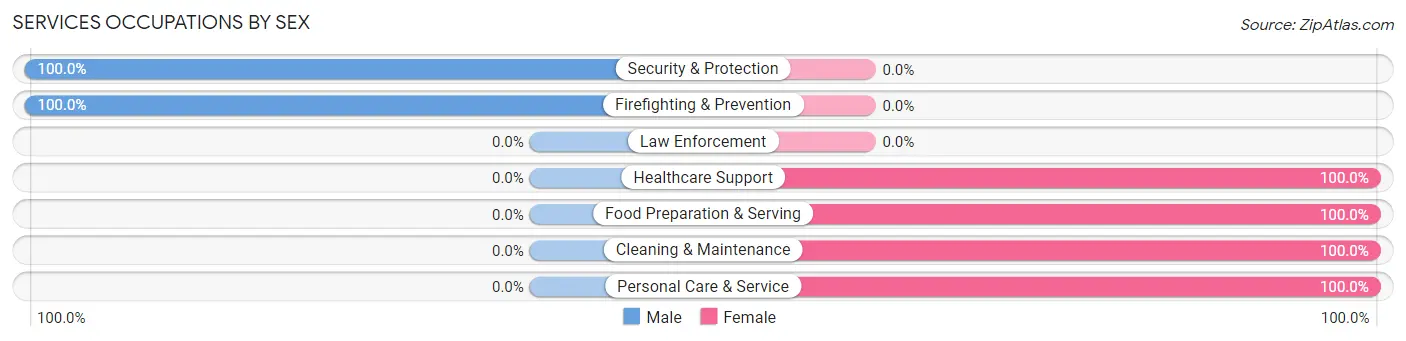
| Occupation | Male | Female |
| Healthcare Support | 0 (0.0%) | 2 (100.0%) |
| Security & Protection | 8 (100.0%) | 0 (0.0%) |
| Firefighting & Prevention | 8 (100.0%) | 0 (0.0%) |
| Law Enforcement | 0 (0.0%) | 0 (0.0%) |
| Food Preparation & Serving | 0 (0.0%) | 3 (100.0%) |
| Cleaning & Maintenance | 0 (0.0%) | 1 (100.0%) |
| Personal Care & Service | 0 (0.0%) | 1 (100.0%) |
| Total (Category) | 8 (53.3%) | 7 (46.7%) |
| Total (Overall) | 43 (51.2%) | 41 (48.8%) |
Sales and Office Occupations
The most common Sales and Office occupations in Edinburg are Office & Administration (9 | 10.7%), and Sales & Related (6 | 7.1%).
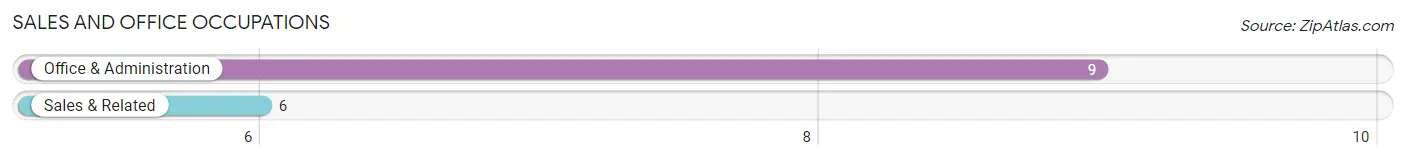
Sales and Office Occupations by Sex
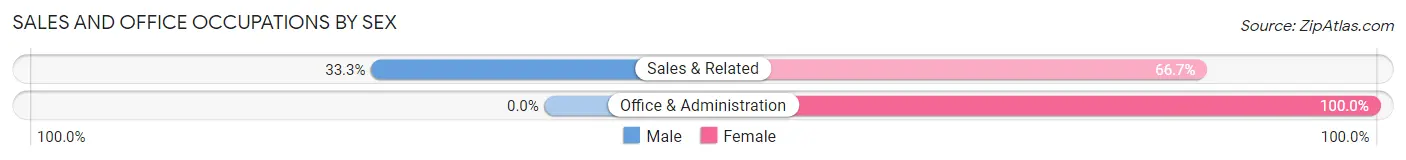
| Occupation | Male | Female |
| Sales & Related | 2 (33.3%) | 4 (66.7%) |
| Office & Administration | 0 (0.0%) | 9 (100.0%) |
| Total (Category) | 2 (13.3%) | 13 (86.7%) |
| Total (Overall) | 43 (51.2%) | 41 (48.8%) |
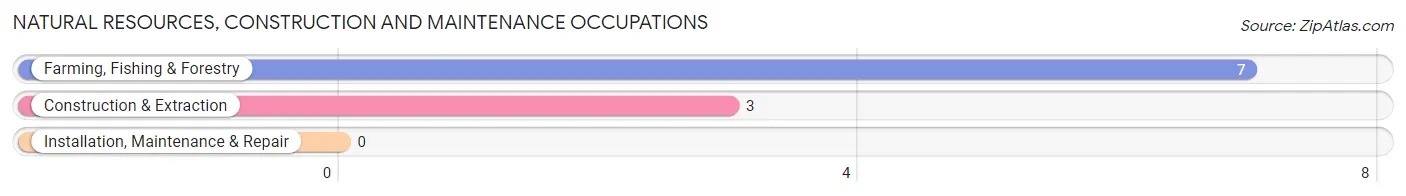
Natural Resources, Construction and Maintenance Occupations
The most common Natural Resources, Construction and Maintenance occupations in Edinburg are Farming, Fishing & Forestry (7 | 8.3%), and Construction & Extraction (3 | 3.6%).
Natural Resources, Construction and Maintenance Occupations by Sex
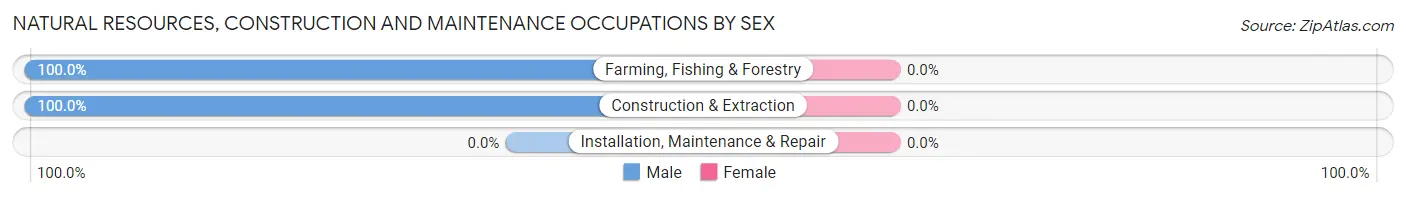
| Occupation | Male | Female |
| Farming, Fishing & Forestry | 7 (100.0%) | 0 (0.0%) |
| Construction & Extraction | 3 (100.0%) | 0 (0.0%) |
| Installation, Maintenance & Repair | 0 (0.0%) | 0 (0.0%) |
| Total (Category) | 10 (100.0%) | 0 (0.0%) |
| Total (Overall) | 43 (51.2%) | 41 (48.8%) |
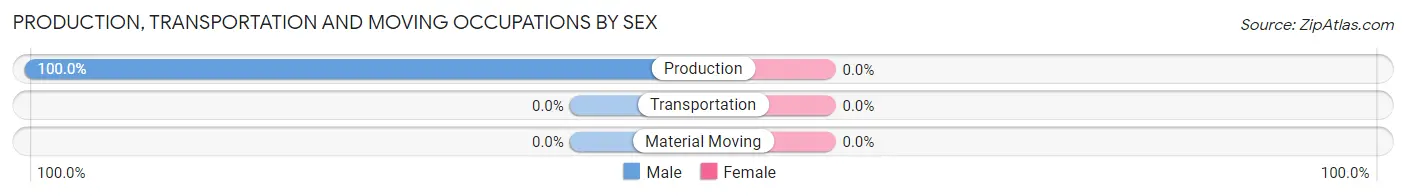
Production, Transportation and Moving Occupations
The most common Production, Transportation and Moving occupations in Edinburg are , and Production (4 | 4.8%).
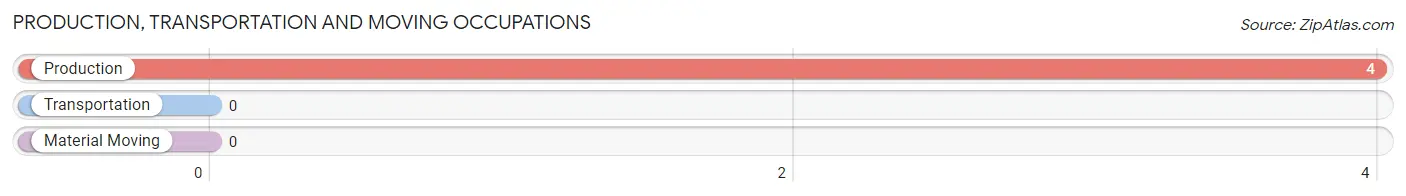
Production, Transportation and Moving Occupations by Sex
| Occupation | Male | Female |
| Production | 4 (100.0%) | 0 (0.0%) |
| Transportation | 0 (0.0%) | 0 (0.0%) |
| Material Moving | 0 (0.0%) | 0 (0.0%) |
| Total (Category) | 4 (100.0%) | 0 (0.0%) |
| Total (Overall) | 43 (51.2%) | 41 (48.8%) |
Employment Industries by Sex in Edinburg
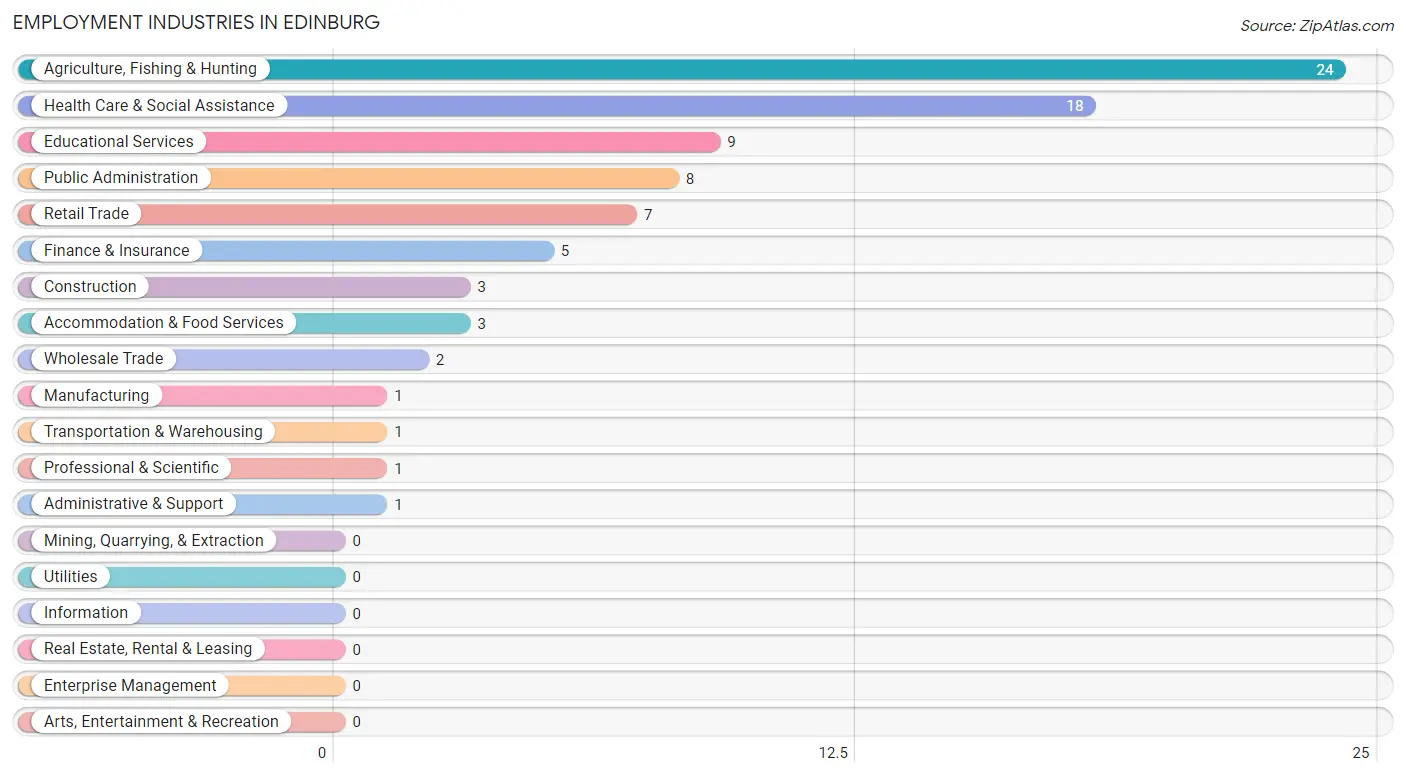
Employment Industries in Edinburg
The major employment industries in Edinburg include Agriculture, Fishing & Hunting (24 | 28.6%), Health Care & Social Assistance (18 | 21.4%), Educational Services (9 | 10.7%), Public Administration (8 | 9.5%), and Retail Trade (7 | 8.3%).
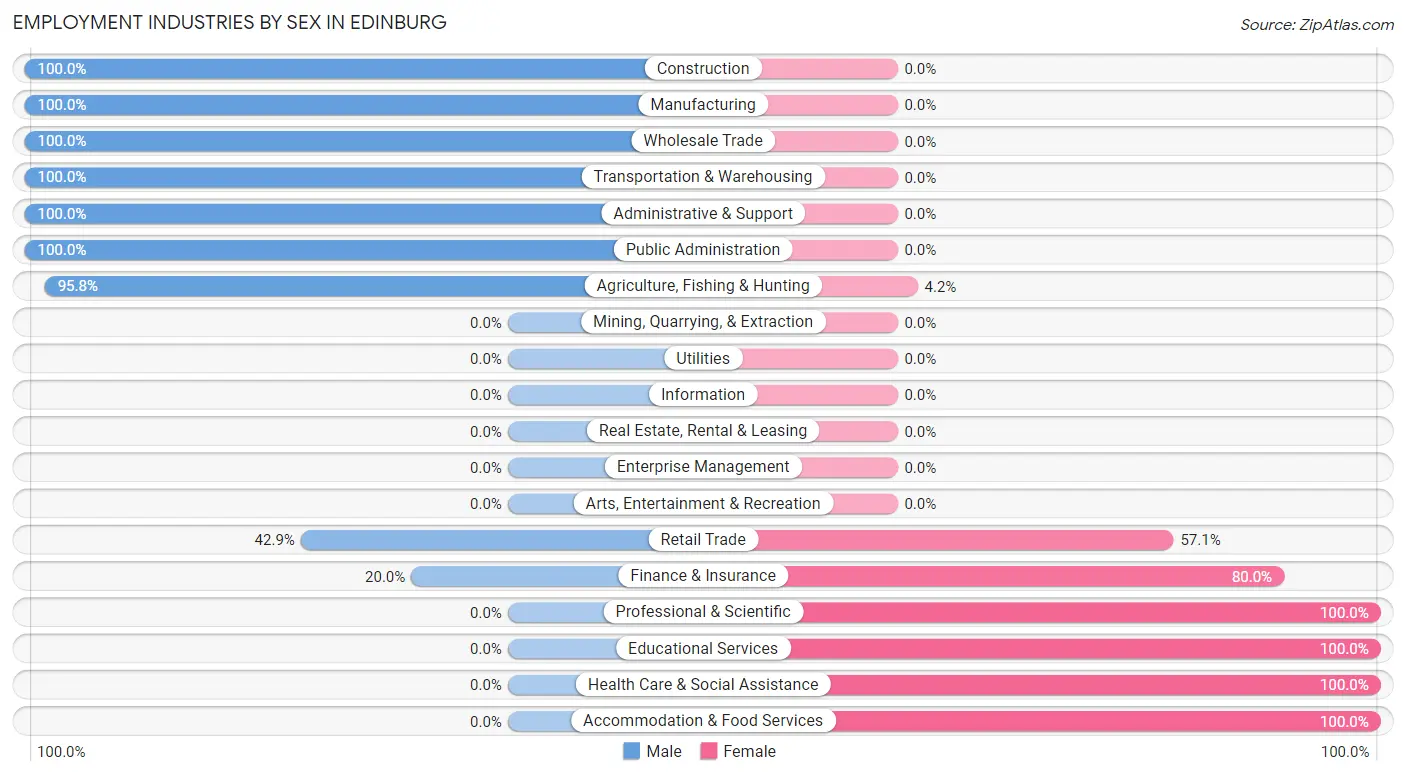
Employment Industries by Sex in Edinburg
The Edinburg industries that see more men than women are Construction (100.0%), Manufacturing (100.0%), and Wholesale Trade (100.0%), whereas the industries that tend to have a higher number of women are Professional & Scientific (100.0%), Educational Services (100.0%), and Health Care & Social Assistance (100.0%).
| Industry | Male | Female |
| Agriculture, Fishing & Hunting | 23 (95.8%) | 1 (4.2%) |
| Mining, Quarrying, & Extraction | 0 (0.0%) | 0 (0.0%) |
| Construction | 3 (100.0%) | 0 (0.0%) |
| Manufacturing | 1 (100.0%) | 0 (0.0%) |
| Wholesale Trade | 2 (100.0%) | 0 (0.0%) |
| Retail Trade | 3 (42.9%) | 4 (57.1%) |
| Transportation & Warehousing | 1 (100.0%) | 0 (0.0%) |
| Utilities | 0 (0.0%) | 0 (0.0%) |
| Information | 0 (0.0%) | 0 (0.0%) |
| Finance & Insurance | 1 (20.0%) | 4 (80.0%) |
| Real Estate, Rental & Leasing | 0 (0.0%) | 0 (0.0%) |
| Professional & Scientific | 0 (0.0%) | 1 (100.0%) |
| Enterprise Management | 0 (0.0%) | 0 (0.0%) |
| Administrative & Support | 1 (100.0%) | 0 (0.0%) |
| Educational Services | 0 (0.0%) | 9 (100.0%) |
| Health Care & Social Assistance | 0 (0.0%) | 18 (100.0%) |
| Arts, Entertainment & Recreation | 0 (0.0%) | 0 (0.0%) |
| Accommodation & Food Services | 0 (0.0%) | 3 (100.0%) |
| Public Administration | 8 (100.0%) | 0 (0.0%) |
| Total | 43 (51.2%) | 41 (48.8%) |
Education in Edinburg
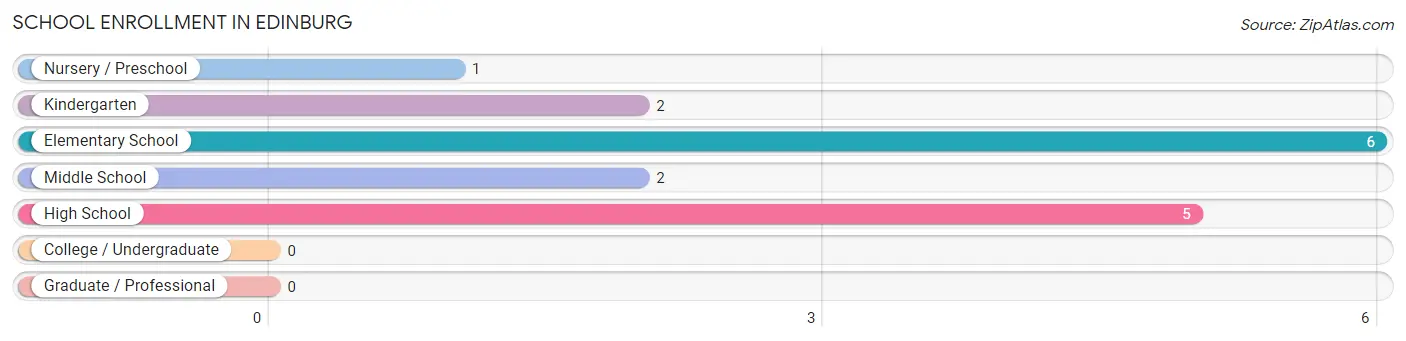
School Enrollment in Edinburg
The most common levels of schooling among the 16 students in Edinburg are elementary school (6 | 37.5%), high school (5 | 31.2%), and kindergarten (2 | 12.5%).
| School Level | # Students | % Students |
| Nursery / Preschool | 1 | 6.2% |
| Kindergarten | 2 | 12.5% |
| Elementary School | 6 | 37.5% |
| Middle School | 2 | 12.5% |
| High School | 5 | 31.2% |
| College / Undergraduate | 0 | 0.0% |
| Graduate / Professional | 0 | 0.0% |
| Total | 16 | 100.0% |
School Enrollment by Age by Funding Source in Edinburg
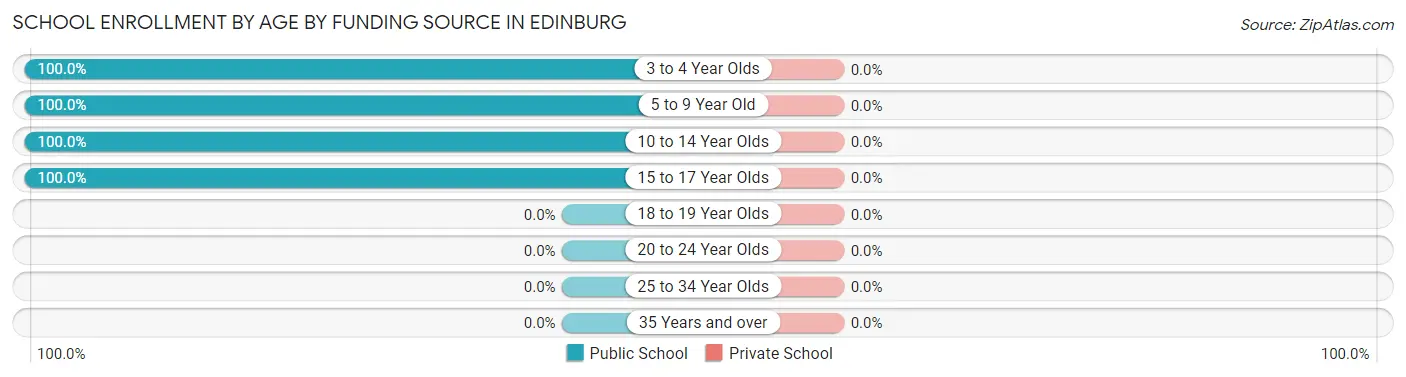
| Age Bracket | Public School | Private School |
| 3 to 4 Year Olds | 1 (100.0%) | 0 (0.0%) |
| 5 to 9 Year Old | 8 (100.0%) | 0 (0.0%) |
| 10 to 14 Year Olds | 2 (100.0%) | 0 (0.0%) |
| 15 to 17 Year Olds | 5 (100.0%) | 0 (0.0%) |
| 18 to 19 Year Olds | 0 (0.0%) | 0 (0.0%) |
| 20 to 24 Year Olds | 0 (0.0%) | 0 (0.0%) |
| 25 to 34 Year Olds | 0 (0.0%) | 0 (0.0%) |
| 35 Years and over | 0 (0.0%) | 0 (0.0%) |
| Total | 16 (100.0%) | 0 (0.0%) |
Educational Attainment by Field of Study in Edinburg
Business (16 | 32.7%), education (13 | 26.5%), science & technology (12 | 24.5%), bio, nature & agricultural (3 | 6.1%), and psychology (2 | 4.1%) are the most common fields of study among 49 individuals in Edinburg who have obtained a bachelor's degree or higher.
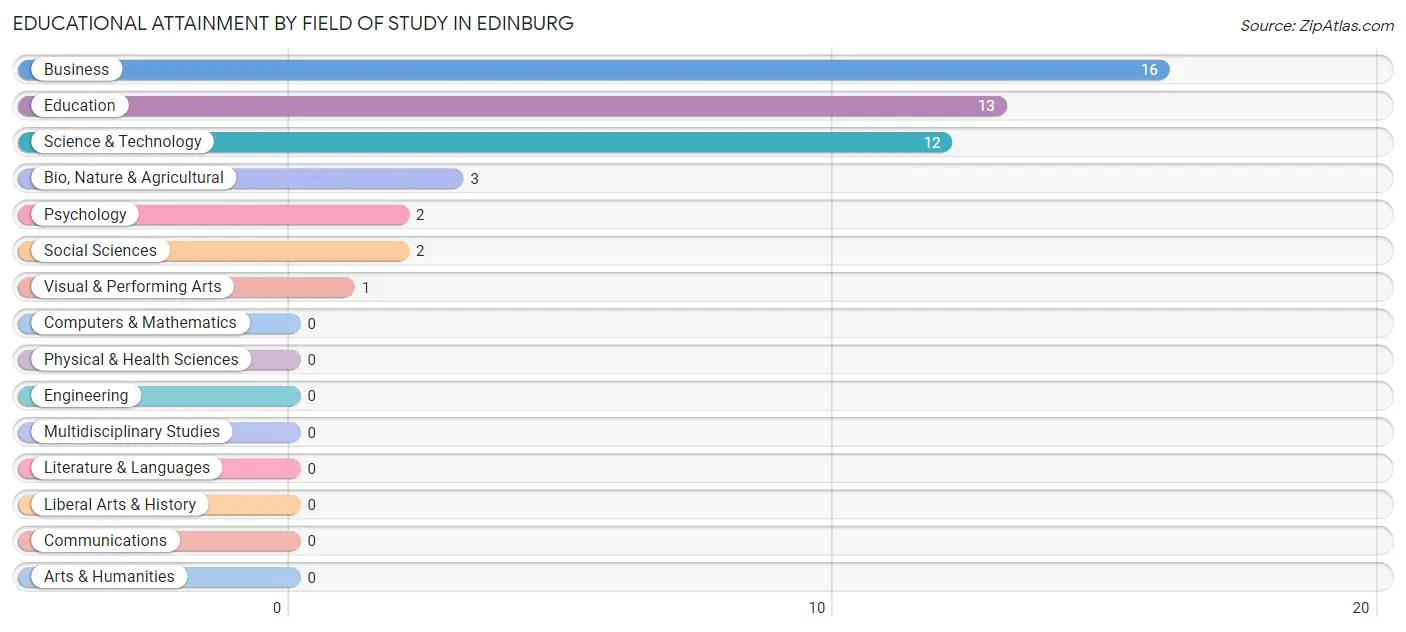
| Field of Study | # Graduates | % Graduates |
| Computers & Mathematics | 0 | 0.0% |
| Bio, Nature & Agricultural | 3 | 6.1% |
| Physical & Health Sciences | 0 | 0.0% |
| Psychology | 2 | 4.1% |
| Social Sciences | 2 | 4.1% |
| Engineering | 0 | 0.0% |
| Multidisciplinary Studies | 0 | 0.0% |
| Science & Technology | 12 | 24.5% |
| Business | 16 | 32.7% |
| Education | 13 | 26.5% |
| Literature & Languages | 0 | 0.0% |
| Liberal Arts & History | 0 | 0.0% |
| Visual & Performing Arts | 1 | 2.0% |
| Communications | 0 | 0.0% |
| Arts & Humanities | 0 | 0.0% |
| Total | 49 | 100.0% |
Transportation & Commute in Edinburg
Vehicle Availability by Sex in Edinburg
The most prevalent vehicle ownership categories in Edinburg are males with 2 vehicles (24, accounting for 55.8%) and females with 2 vehicles (23, making up 58.5%).
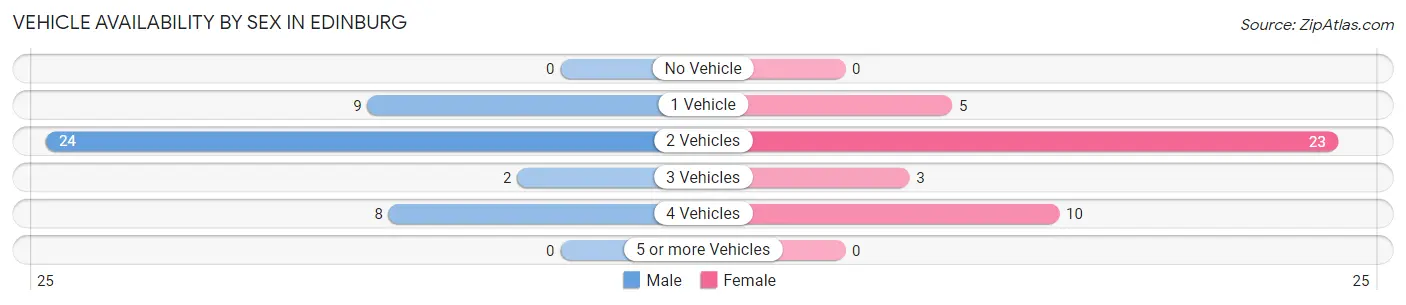
| Vehicles Available | Male | Female |
| No Vehicle | 0 (0.0%) | 0 (0.0%) |
| 1 Vehicle | 9 (20.9%) | 5 (12.2%) |
| 2 Vehicles | 24 (55.8%) | 23 (56.1%) |
| 3 Vehicles | 2 (4.6%) | 3 (7.3%) |
| 4 Vehicles | 8 (18.6%) | 10 (24.4%) |
| 5 or more Vehicles | 0 (0.0%) | 0 (0.0%) |
| Total | 43 (100.0%) | 41 (100.0%) |
Commute Time in Edinburg
The most frequently occuring commute durations in Edinburg are 15 to 19 minutes (22 commuters, 26.5%), 30 to 34 minutes (15 commuters, 18.1%), and 25 to 29 minutes (14 commuters, 16.9%).
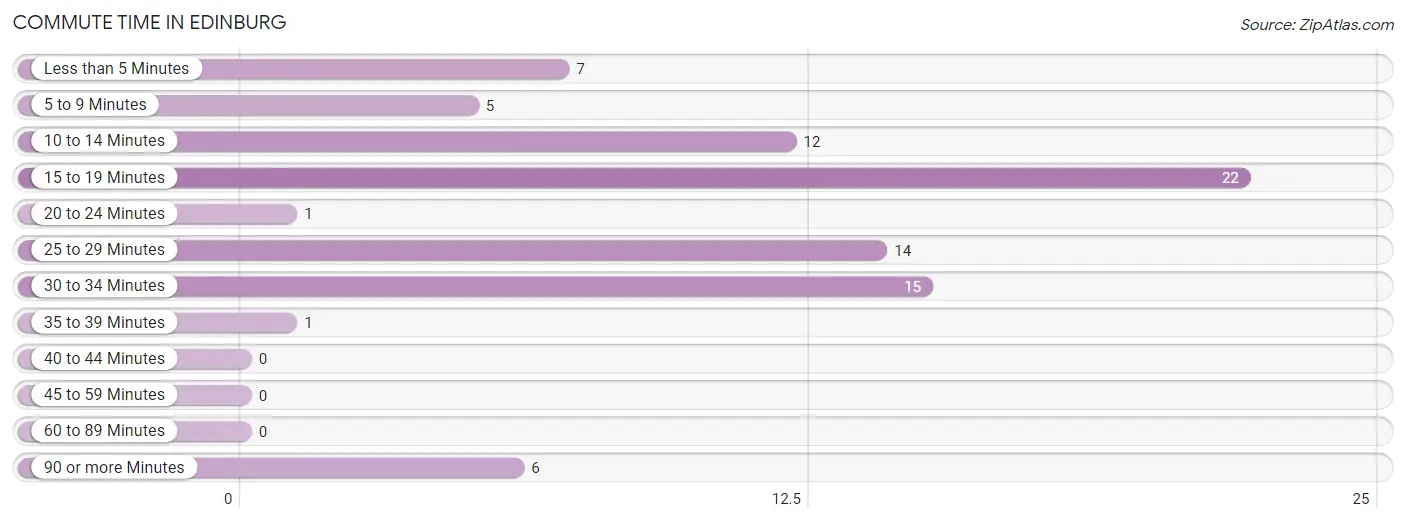
| Commute Time | # Commuters | % Commuters |
| Less than 5 Minutes | 7 | 8.4% |
| 5 to 9 Minutes | 5 | 6.0% |
| 10 to 14 Minutes | 12 | 14.5% |
| 15 to 19 Minutes | 22 | 26.5% |
| 20 to 24 Minutes | 1 | 1.2% |
| 25 to 29 Minutes | 14 | 16.9% |
| 30 to 34 Minutes | 15 | 18.1% |
| 35 to 39 Minutes | 1 | 1.2% |
| 40 to 44 Minutes | 0 | 0.0% |
| 45 to 59 Minutes | 0 | 0.0% |
| 60 to 89 Minutes | 0 | 0.0% |
| 90 or more Minutes | 6 | 7.2% |
Commute Time by Sex in Edinburg
The most common commute times in Edinburg are 15 to 19 minutes (18 commuters, 41.9%) for males and 30 to 34 minutes (10 commuters, 25.0%) for females.
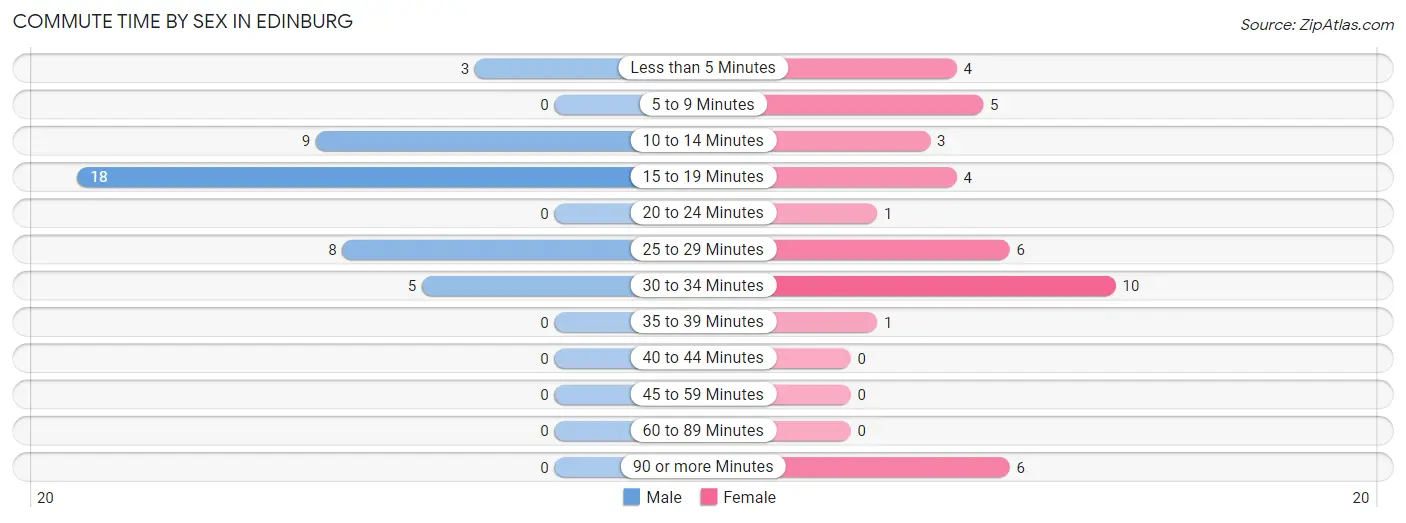
| Commute Time | Male | Female |
| Less than 5 Minutes | 3 (7.0%) | 4 (10.0%) |
| 5 to 9 Minutes | 0 (0.0%) | 5 (12.5%) |
| 10 to 14 Minutes | 9 (20.9%) | 3 (7.5%) |
| 15 to 19 Minutes | 18 (41.9%) | 4 (10.0%) |
| 20 to 24 Minutes | 0 (0.0%) | 1 (2.5%) |
| 25 to 29 Minutes | 8 (18.6%) | 6 (15.0%) |
| 30 to 34 Minutes | 5 (11.6%) | 10 (25.0%) |
| 35 to 39 Minutes | 0 (0.0%) | 1 (2.5%) |
| 40 to 44 Minutes | 0 (0.0%) | 0 (0.0%) |
| 45 to 59 Minutes | 0 (0.0%) | 0 (0.0%) |
| 60 to 89 Minutes | 0 (0.0%) | 0 (0.0%) |
| 90 or more Minutes | 0 (0.0%) | 6 (15.0%) |
Time of Departure to Work by Sex in Edinburg
The most frequent times of departure to work in Edinburg are 6:30 AM to 6:59 AM (14, 32.6%) for males and 7:00 AM to 7:29 AM (8, 20.0%) for females.
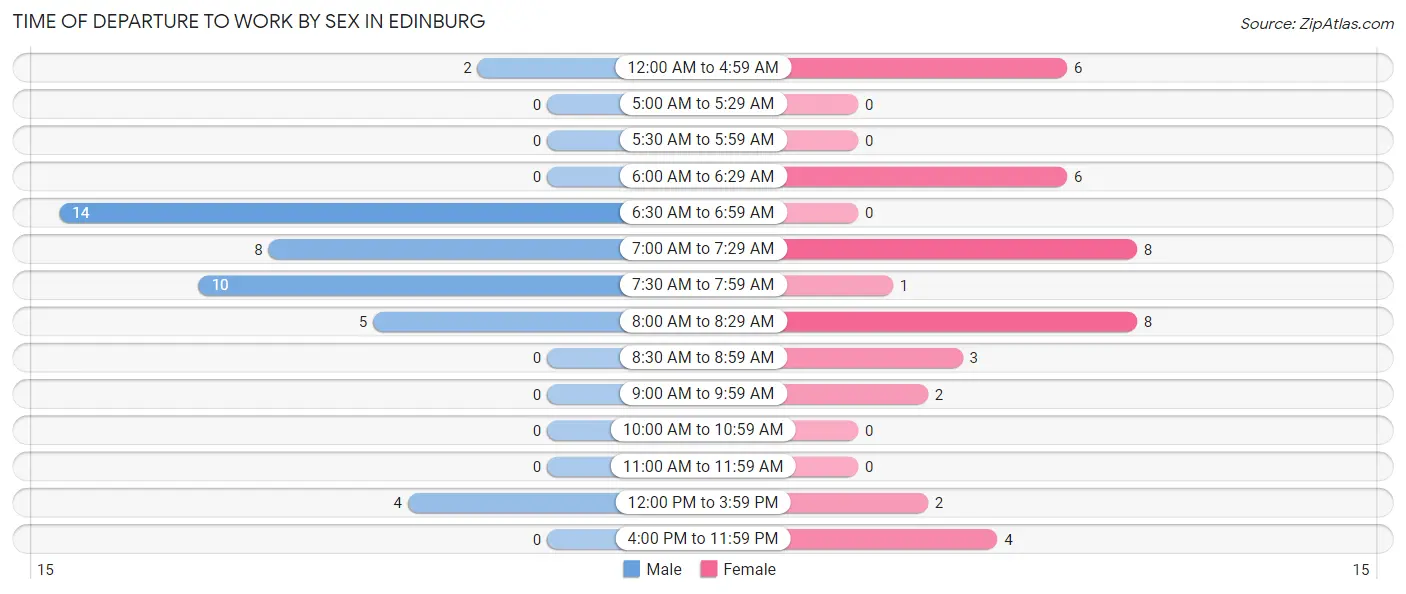
| Time of Departure | Male | Female |
| 12:00 AM to 4:59 AM | 2 (4.6%) | 6 (15.0%) |
| 5:00 AM to 5:29 AM | 0 (0.0%) | 0 (0.0%) |
| 5:30 AM to 5:59 AM | 0 (0.0%) | 0 (0.0%) |
| 6:00 AM to 6:29 AM | 0 (0.0%) | 6 (15.0%) |
| 6:30 AM to 6:59 AM | 14 (32.6%) | 0 (0.0%) |
| 7:00 AM to 7:29 AM | 8 (18.6%) | 8 (20.0%) |
| 7:30 AM to 7:59 AM | 10 (23.3%) | 1 (2.5%) |
| 8:00 AM to 8:29 AM | 5 (11.6%) | 8 (20.0%) |
| 8:30 AM to 8:59 AM | 0 (0.0%) | 3 (7.5%) |
| 9:00 AM to 9:59 AM | 0 (0.0%) | 2 (5.0%) |
| 10:00 AM to 10:59 AM | 0 (0.0%) | 0 (0.0%) |
| 11:00 AM to 11:59 AM | 0 (0.0%) | 0 (0.0%) |
| 12:00 PM to 3:59 PM | 4 (9.3%) | 2 (5.0%) |
| 4:00 PM to 11:59 PM | 0 (0.0%) | 4 (10.0%) |
| Total | 43 (100.0%) | 40 (100.0%) |
Housing Occupancy in Edinburg
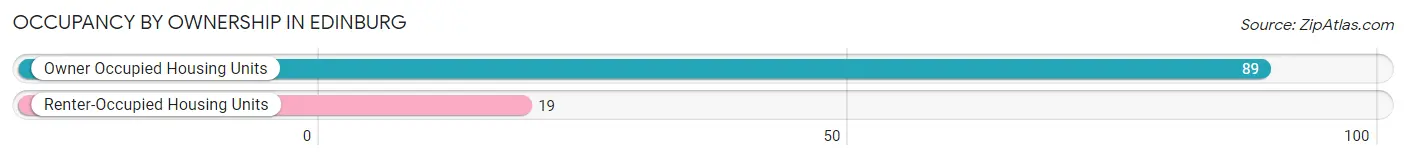
Occupancy by Ownership in Edinburg
Of the total 108 dwellings in Edinburg, owner-occupied units account for 89 (82.4%), while renter-occupied units make up 19 (17.6%).
| Occupancy | # Housing Units | % Housing Units |
| Owner Occupied Housing Units | 89 | 82.4% |
| Renter-Occupied Housing Units | 19 | 17.6% |
| Total Occupied Housing Units | 108 | 100.0% |
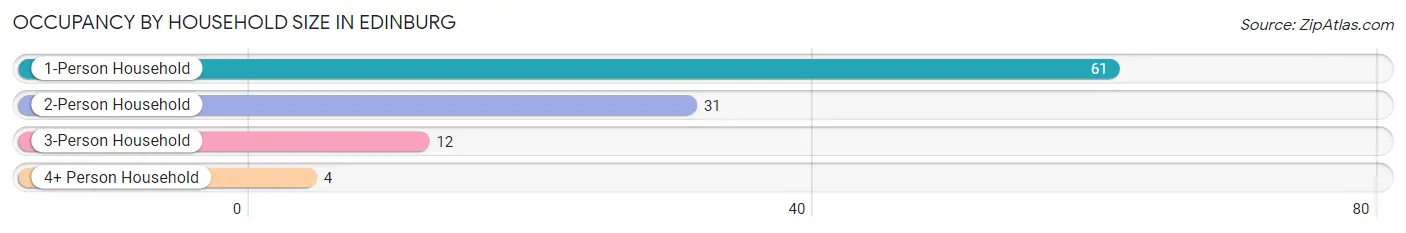
Occupancy by Household Size in Edinburg
| Household Size | # Housing Units | % Housing Units |
| 1-Person Household | 61 | 56.5% |
| 2-Person Household | 31 | 28.7% |
| 3-Person Household | 12 | 11.1% |
| 4+ Person Household | 4 | 3.7% |
| Total Housing Units | 108 | 100.0% |
Occupancy by Ownership by Household Size in Edinburg
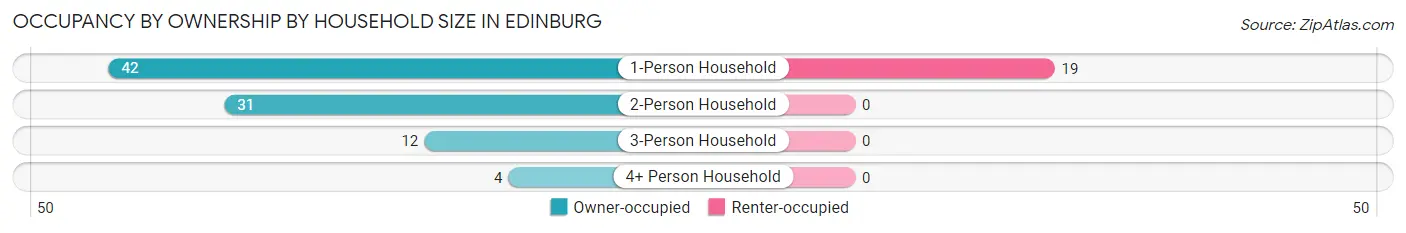
| Household Size | Owner-occupied | Renter-occupied |
| 1-Person Household | 42 (68.9%) | 19 (31.1%) |
| 2-Person Household | 31 (100.0%) | 0 (0.0%) |
| 3-Person Household | 12 (100.0%) | 0 (0.0%) |
| 4+ Person Household | 4 (100.0%) | 0 (0.0%) |
| Total Housing Units | 89 (82.4%) | 19 (17.6%) |
Occupancy by Educational Attainment in Edinburg
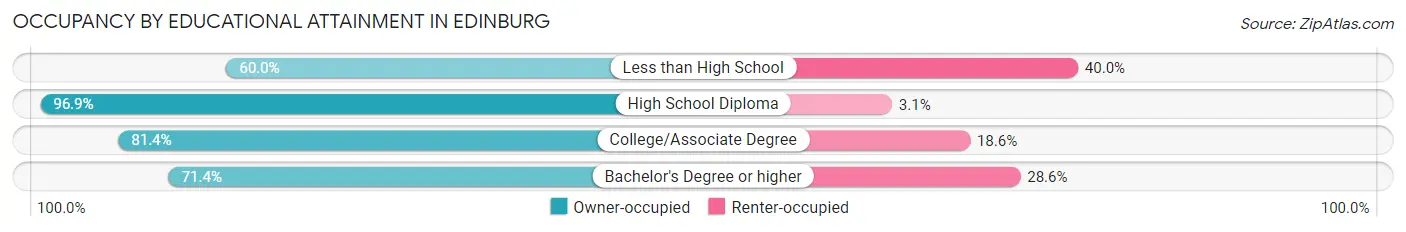
| Household Size | Owner-occupied | Renter-occupied |
| Less than High School | 3 (60.0%) | 2 (40.0%) |
| High School Diploma | 31 (96.9%) | 1 (3.1%) |
| College/Associate Degree | 35 (81.4%) | 8 (18.6%) |
| Bachelor's Degree or higher | 20 (71.4%) | 8 (28.6%) |
Occupancy by Age of Householder in Edinburg
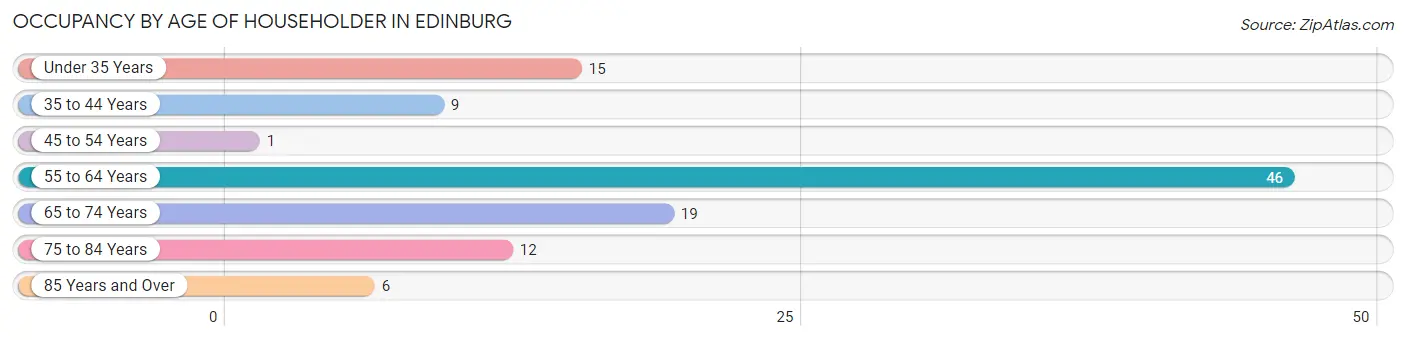
| Age Bracket | # Households | % Households |
| Under 35 Years | 15 | 13.9% |
| 35 to 44 Years | 9 | 8.3% |
| 45 to 54 Years | 1 | 0.9% |
| 55 to 64 Years | 46 | 42.6% |
| 65 to 74 Years | 19 | 17.6% |
| 75 to 84 Years | 12 | 11.1% |
| 85 Years and Over | 6 | 5.6% |
| Total | 108 | 100.0% |
Housing Finances in Edinburg
Median Income by Occupancy in Edinburg
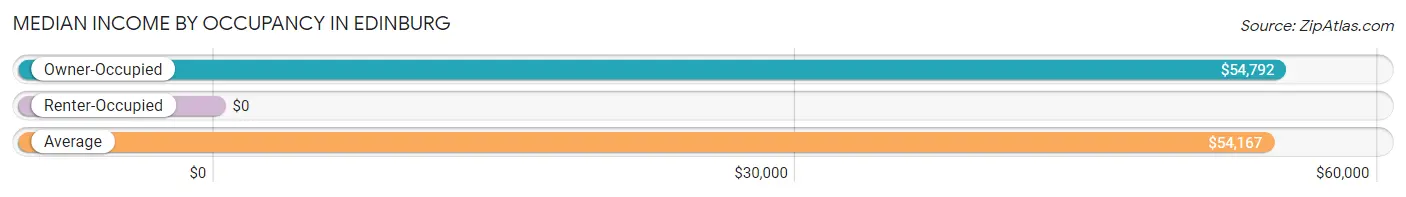
| Occupancy Type | # Households | Median Income |
| Owner-Occupied | 89 (82.4%) | $54,792 |
| Renter-Occupied | 19 (17.6%) | $0 |
| Average | 108 (100.0%) | $54,167 |
Occupancy by Householder Income Bracket in Edinburg
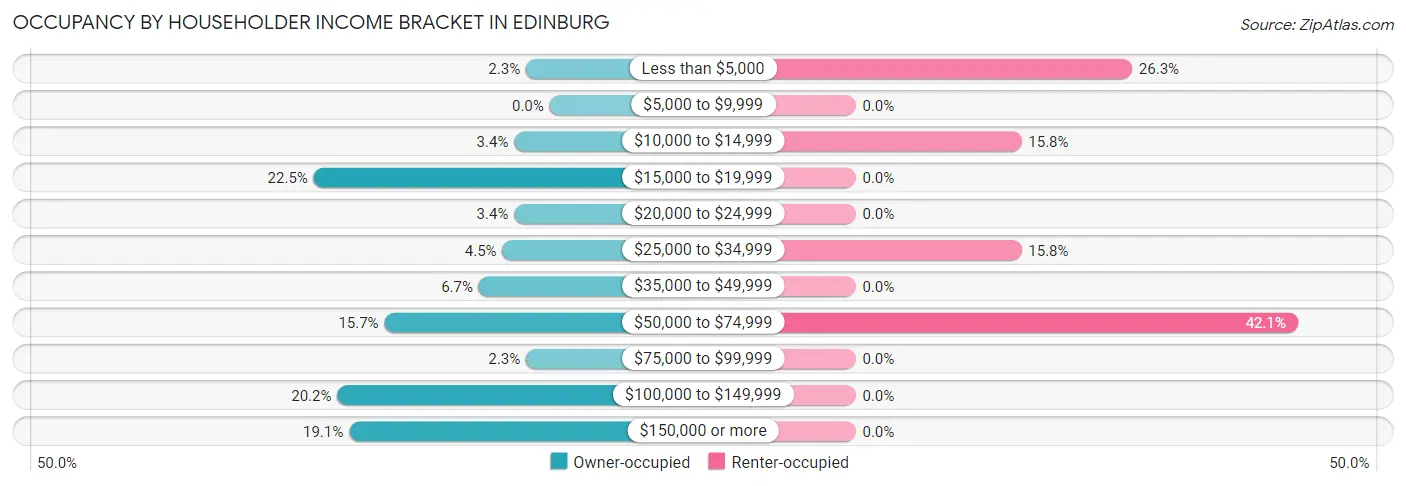
| Income Bracket | Owner-occupied | Renter-occupied |
| Less than $5,000 | 2 (2.2%) | 5 (26.3%) |
| $5,000 to $9,999 | 0 (0.0%) | 0 (0.0%) |
| $10,000 to $14,999 | 3 (3.4%) | 3 (15.8%) |
| $15,000 to $19,999 | 20 (22.5%) | 0 (0.0%) |
| $20,000 to $24,999 | 3 (3.4%) | 0 (0.0%) |
| $25,000 to $34,999 | 4 (4.5%) | 3 (15.8%) |
| $35,000 to $49,999 | 6 (6.7%) | 0 (0.0%) |
| $50,000 to $74,999 | 14 (15.7%) | 8 (42.1%) |
| $75,000 to $99,999 | 2 (2.2%) | 0 (0.0%) |
| $100,000 to $149,999 | 18 (20.2%) | 0 (0.0%) |
| $150,000 or more | 17 (19.1%) | 0 (0.0%) |
| Total | 89 (100.0%) | 19 (100.0%) |
Monthly Housing Cost Tiers in Edinburg
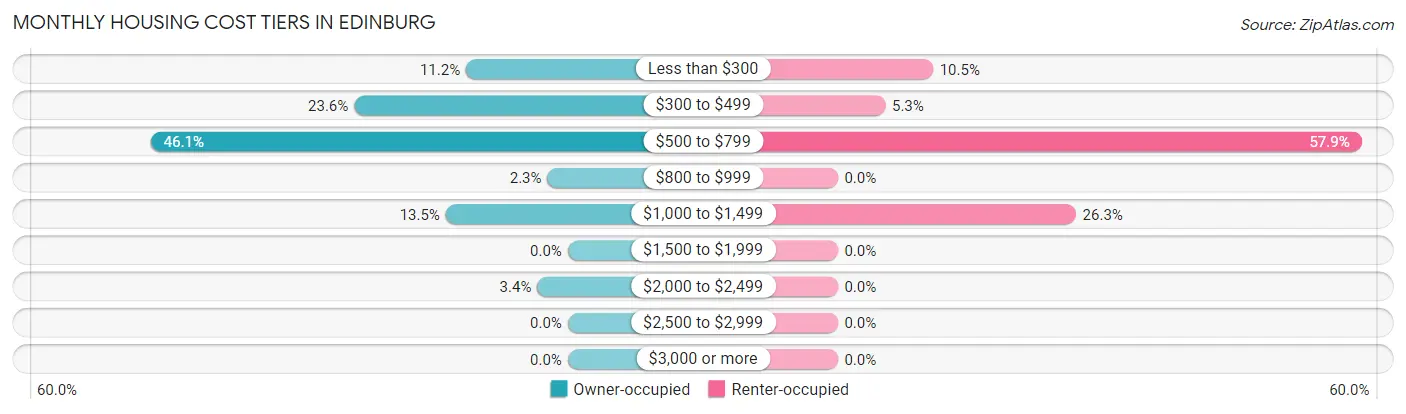
| Monthly Cost | Owner-occupied | Renter-occupied |
| Less than $300 | 10 (11.2%) | 2 (10.5%) |
| $300 to $499 | 21 (23.6%) | 1 (5.3%) |
| $500 to $799 | 41 (46.1%) | 11 (57.9%) |
| $800 to $999 | 2 (2.2%) | 0 (0.0%) |
| $1,000 to $1,499 | 12 (13.5%) | 5 (26.3%) |
| $1,500 to $1,999 | 0 (0.0%) | 0 (0.0%) |
| $2,000 to $2,499 | 3 (3.4%) | 0 (0.0%) |
| $2,500 to $2,999 | 0 (0.0%) | 0 (0.0%) |
| $3,000 or more | 0 (0.0%) | 0 (0.0%) |
| Total | 89 (100.0%) | 19 (100.0%) |
Physical Housing Characteristics in Edinburg
Housing Structures in Edinburg
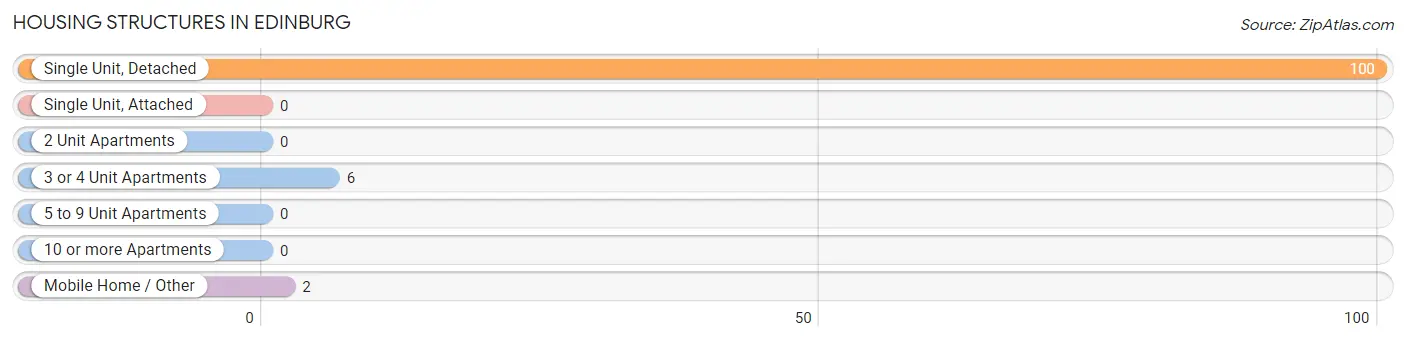
| Structure Type | # Housing Units | % Housing Units |
| Single Unit, Detached | 100 | 92.6% |
| Single Unit, Attached | 0 | 0.0% |
| 2 Unit Apartments | 0 | 0.0% |
| 3 or 4 Unit Apartments | 6 | 5.6% |
| 5 to 9 Unit Apartments | 0 | 0.0% |
| 10 or more Apartments | 0 | 0.0% |
| Mobile Home / Other | 2 | 1.8% |
| Total | 108 | 100.0% |
Housing Structures by Occupancy in Edinburg
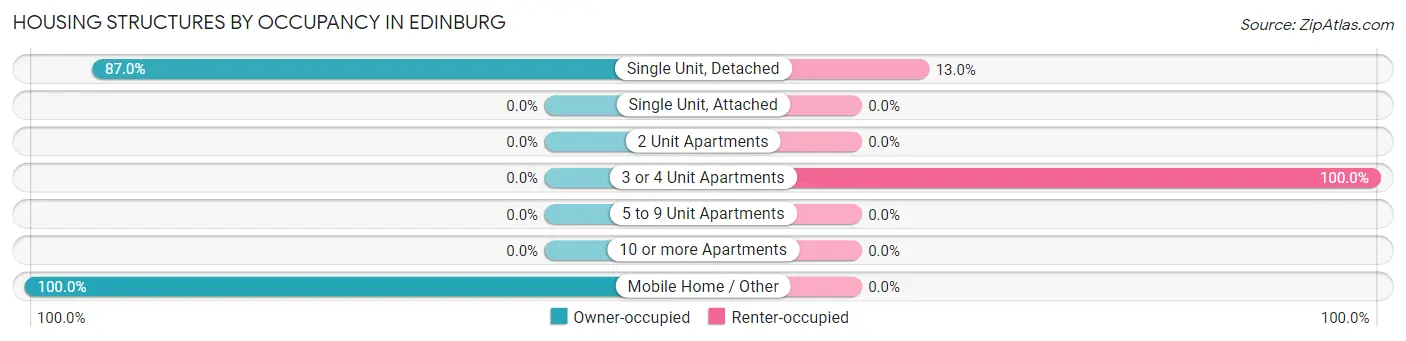
| Structure Type | Owner-occupied | Renter-occupied |
| Single Unit, Detached | 87 (87.0%) | 13 (13.0%) |
| Single Unit, Attached | 0 (0.0%) | 0 (0.0%) |
| 2 Unit Apartments | 0 (0.0%) | 0 (0.0%) |
| 3 or 4 Unit Apartments | 0 (0.0%) | 6 (100.0%) |
| 5 to 9 Unit Apartments | 0 (0.0%) | 0 (0.0%) |
| 10 or more Apartments | 0 (0.0%) | 0 (0.0%) |
| Mobile Home / Other | 2 (100.0%) | 0 (0.0%) |
| Total | 89 (82.4%) | 19 (17.6%) |
Housing Structures by Number of Rooms in Edinburg
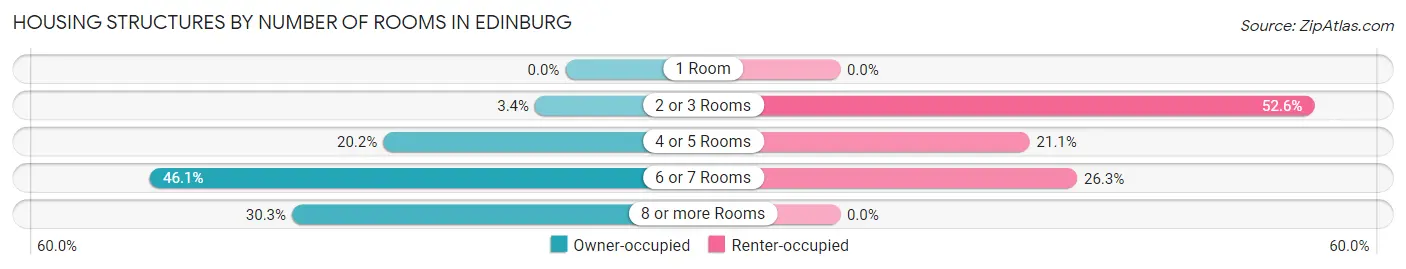
| Number of Rooms | Owner-occupied | Renter-occupied |
| 1 Room | 0 (0.0%) | 0 (0.0%) |
| 2 or 3 Rooms | 3 (3.4%) | 10 (52.6%) |
| 4 or 5 Rooms | 18 (20.2%) | 4 (21.0%) |
| 6 or 7 Rooms | 41 (46.1%) | 5 (26.3%) |
| 8 or more Rooms | 27 (30.3%) | 0 (0.0%) |
| Total | 89 (100.0%) | 19 (100.0%) |
Housing Structure by Heating Type in Edinburg
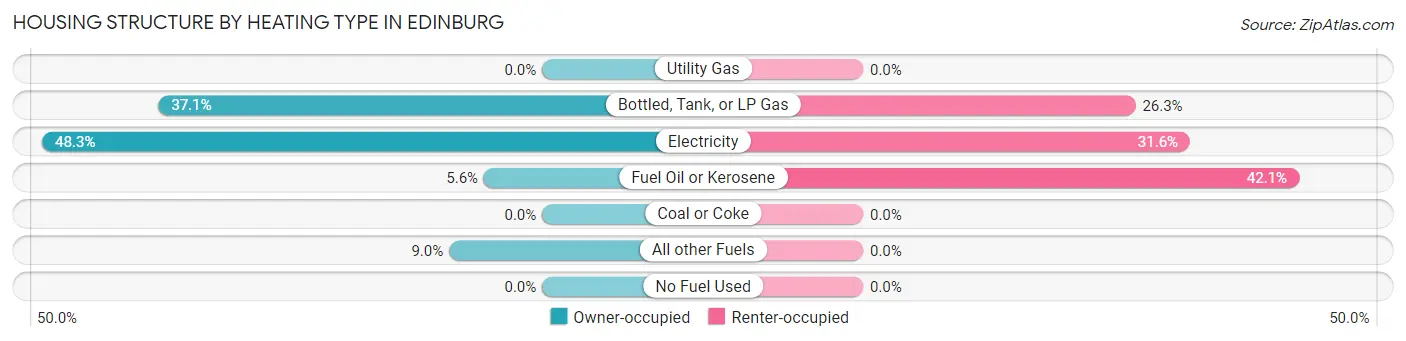
| Heating Type | Owner-occupied | Renter-occupied |
| Utility Gas | 0 (0.0%) | 0 (0.0%) |
| Bottled, Tank, or LP Gas | 33 (37.1%) | 5 (26.3%) |
| Electricity | 43 (48.3%) | 6 (31.6%) |
| Fuel Oil or Kerosene | 5 (5.6%) | 8 (42.1%) |
| Coal or Coke | 0 (0.0%) | 0 (0.0%) |
| All other Fuels | 8 (9.0%) | 0 (0.0%) |
| No Fuel Used | 0 (0.0%) | 0 (0.0%) |
| Total | 89 (100.0%) | 19 (100.0%) |
Household Vehicle Usage in Edinburg
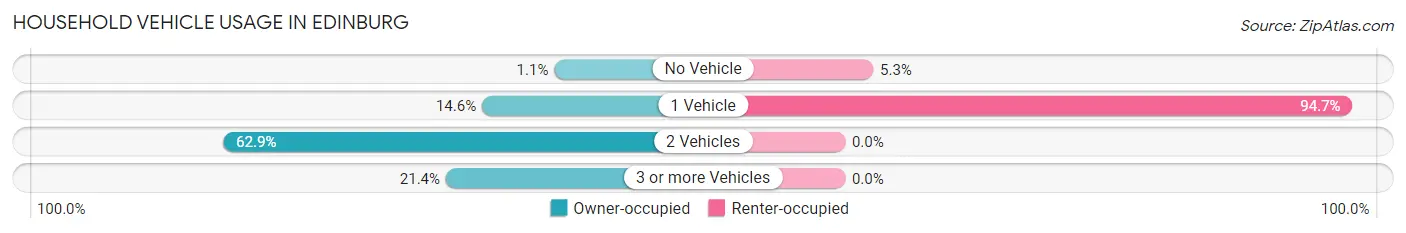
| Vehicles per Household | Owner-occupied | Renter-occupied |
| No Vehicle | 1 (1.1%) | 1 (5.3%) |
| 1 Vehicle | 13 (14.6%) | 18 (94.7%) |
| 2 Vehicles | 56 (62.9%) | 0 (0.0%) |
| 3 or more Vehicles | 19 (21.3%) | 0 (0.0%) |
| Total | 89 (100.0%) | 19 (100.0%) |
Real Estate & Mortgages in Edinburg
Real Estate and Mortgage Overview in Edinburg
| Characteristic | Without Mortgage | With Mortgage |
| Housing Units | 70 | 19 |
| Median Property Value | $70,000 | $101,800 |
| Median Household Income | $52,500 | $3 |
| Monthly Housing Costs | $536 | $0 |
| Real Estate Taxes | $931 | $0 |
Property Value by Mortgage Status in Edinburg
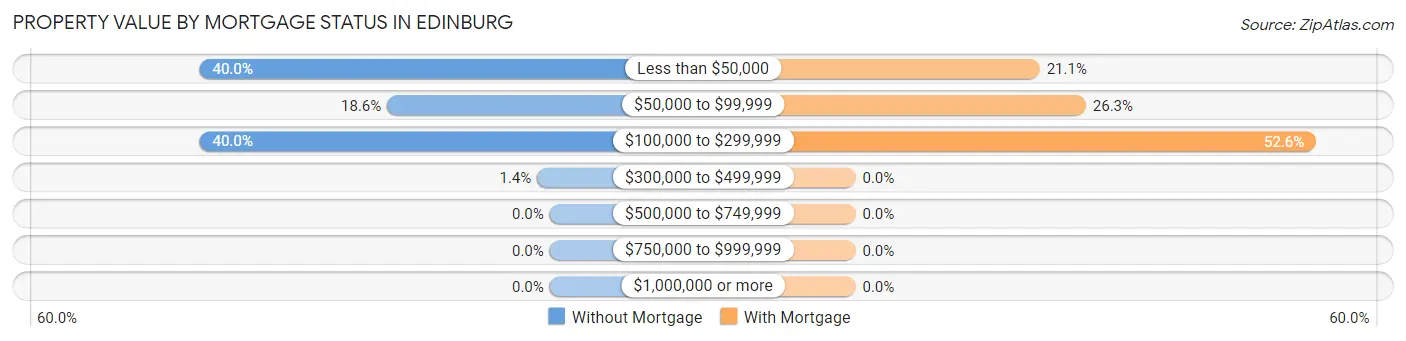
| Property Value | Without Mortgage | With Mortgage |
| Less than $50,000 | 28 (40.0%) | 4 (21.0%) |
| $50,000 to $99,999 | 13 (18.6%) | 5 (26.3%) |
| $100,000 to $299,999 | 28 (40.0%) | 10 (52.6%) |
| $300,000 to $499,999 | 1 (1.4%) | 0 (0.0%) |
| $500,000 to $749,999 | 0 (0.0%) | 0 (0.0%) |
| $750,000 to $999,999 | 0 (0.0%) | 0 (0.0%) |
| $1,000,000 or more | 0 (0.0%) | 0 (0.0%) |
| Total | 70 (100.0%) | 19 (100.0%) |
Household Income by Mortgage Status in Edinburg
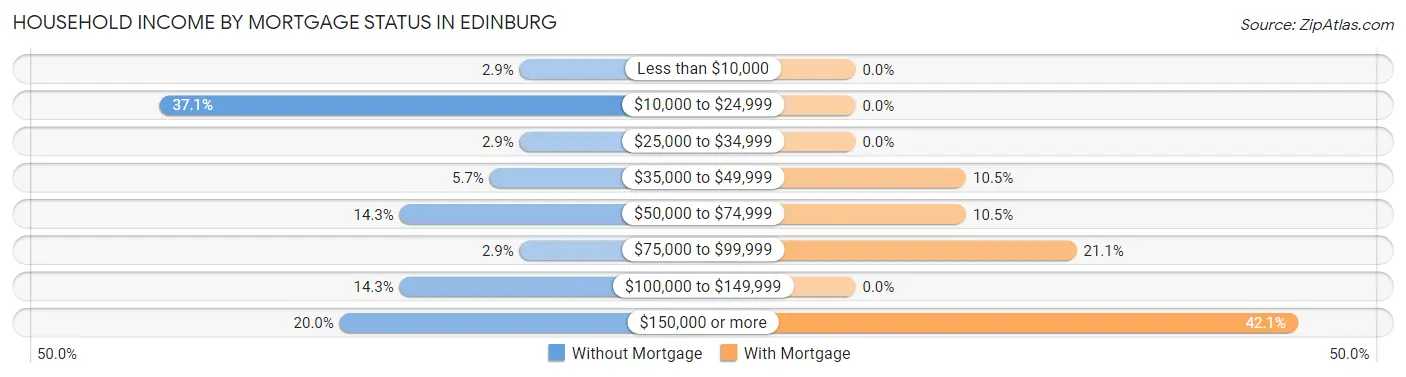
| Household Income | Without Mortgage | With Mortgage |
| Less than $10,000 | 2 (2.9%) | 0 (0.0%) |
| $10,000 to $24,999 | 26 (37.1%) | 0 (0.0%) |
| $25,000 to $34,999 | 2 (2.9%) | 0 (0.0%) |
| $35,000 to $49,999 | 4 (5.7%) | 2 (10.5%) |
| $50,000 to $74,999 | 10 (14.3%) | 2 (10.5%) |
| $75,000 to $99,999 | 2 (2.9%) | 4 (21.0%) |
| $100,000 to $149,999 | 10 (14.3%) | 0 (0.0%) |
| $150,000 or more | 14 (20.0%) | 8 (42.1%) |
| Total | 70 (100.0%) | 19 (100.0%) |
Property Value to Household Income Ratio in Edinburg
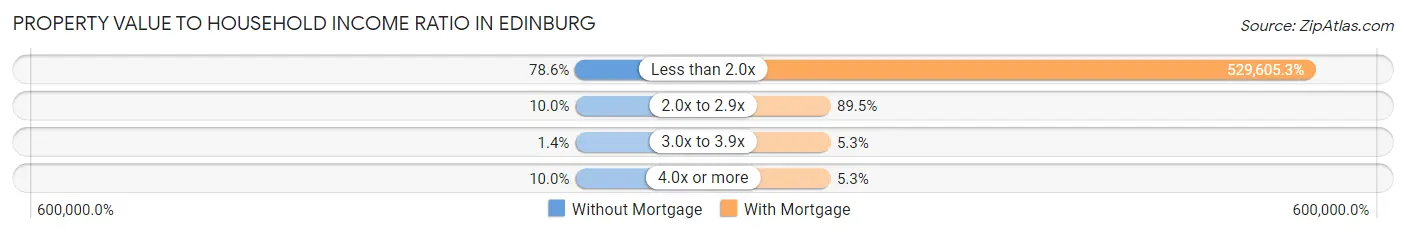
| Value-to-Income Ratio | Without Mortgage | With Mortgage |
| Less than 2.0x | 55 (78.6%) | 100,625 (529,605.3%) |
| 2.0x to 2.9x | 7 (10.0%) | 17 (89.5%) |
| 3.0x to 3.9x | 1 (1.4%) | 1 (5.3%) |
| 4.0x or more | 7 (10.0%) | 1 (5.3%) |
| Total | 70 (100.0%) | 19 (100.0%) |
Real Estate Taxes by Mortgage Status in Edinburg
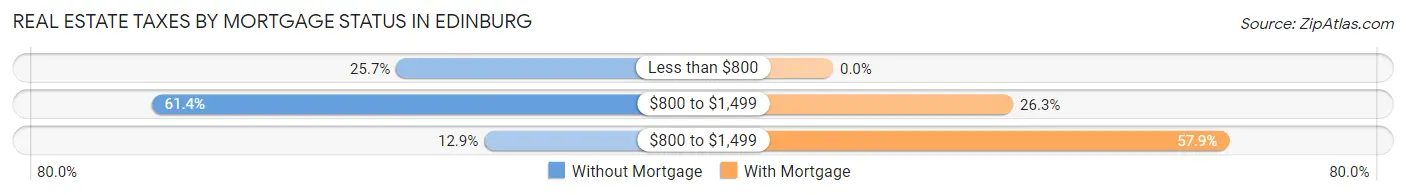
| Property Taxes | Without Mortgage | With Mortgage |
| Less than $800 | 18 (25.7%) | 0 (0.0%) |
| $800 to $1,499 | 43 (61.4%) | 5 (26.3%) |
| $800 to $1,499 | 9 (12.9%) | 11 (57.9%) |
| Total | 70 (100.0%) | 19 (100.0%) |
Health & Disability in Edinburg
Health Insurance Coverage by Age in Edinburg
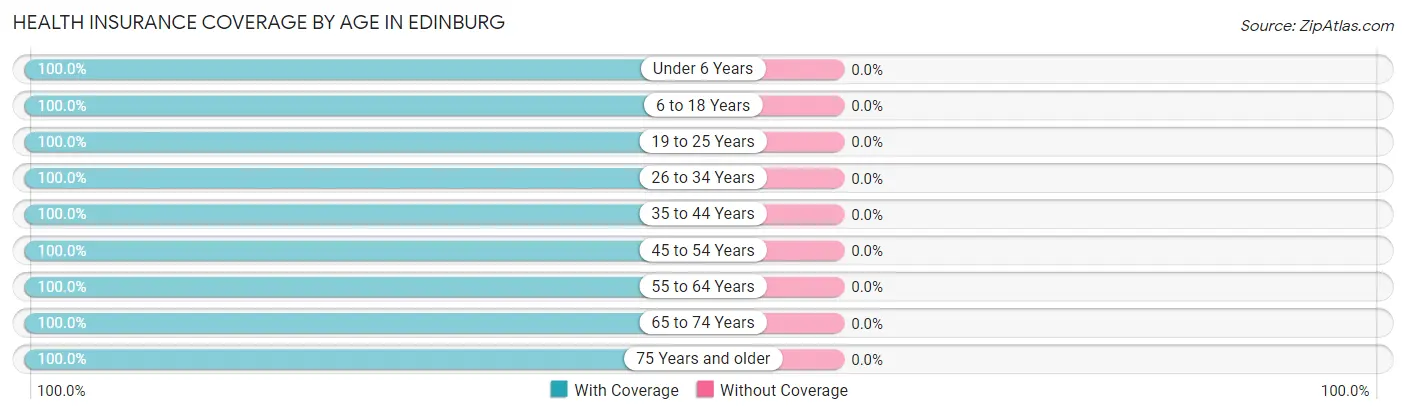
| Age Bracket | With Coverage | Without Coverage |
| Under 6 Years | 19 (100.0%) | 0 (0.0%) |
| 6 to 18 Years | 13 (100.0%) | 0 (0.0%) |
| 19 to 25 Years | 8 (100.0%) | 0 (0.0%) |
| 26 to 34 Years | 14 (100.0%) | 0 (0.0%) |
| 35 to 44 Years | 17 (100.0%) | 0 (0.0%) |
| 45 to 54 Years | 7 (100.0%) | 0 (0.0%) |
| 55 to 64 Years | 66 (100.0%) | 0 (0.0%) |
| 65 to 74 Years | 27 (100.0%) | 0 (0.0%) |
| 75 Years and older | 24 (100.0%) | 0 (0.0%) |
| Total | 195 (100.0%) | 0 (0.0%) |
Health Insurance Coverage by Citizenship Status in Edinburg
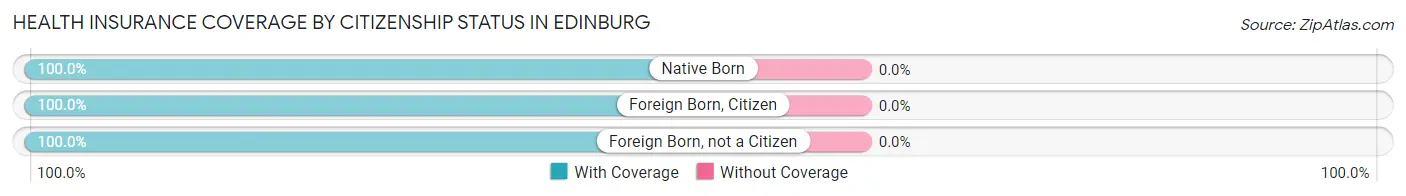
| Citizenship Status | With Coverage | Without Coverage |
| Native Born | 19 (100.0%) | 0 (0.0%) |
| Foreign Born, Citizen | 13 (100.0%) | 0 (0.0%) |
| Foreign Born, not a Citizen | 8 (100.0%) | 0 (0.0%) |
Health Insurance Coverage by Household Income in Edinburg
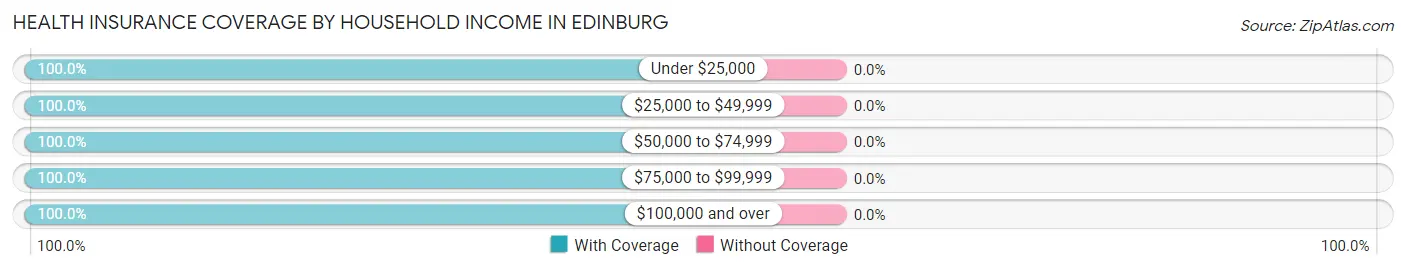
| Household Income | With Coverage | Without Coverage |
| Under $25,000 | 37 (100.0%) | 0 (0.0%) |
| $25,000 to $49,999 | 14 (100.0%) | 0 (0.0%) |
| $50,000 to $74,999 | 40 (100.0%) | 0 (0.0%) |
| $75,000 to $99,999 | 5 (100.0%) | 0 (0.0%) |
| $100,000 and over | 99 (100.0%) | 0 (0.0%) |
Public vs Private Health Insurance Coverage by Age in Edinburg
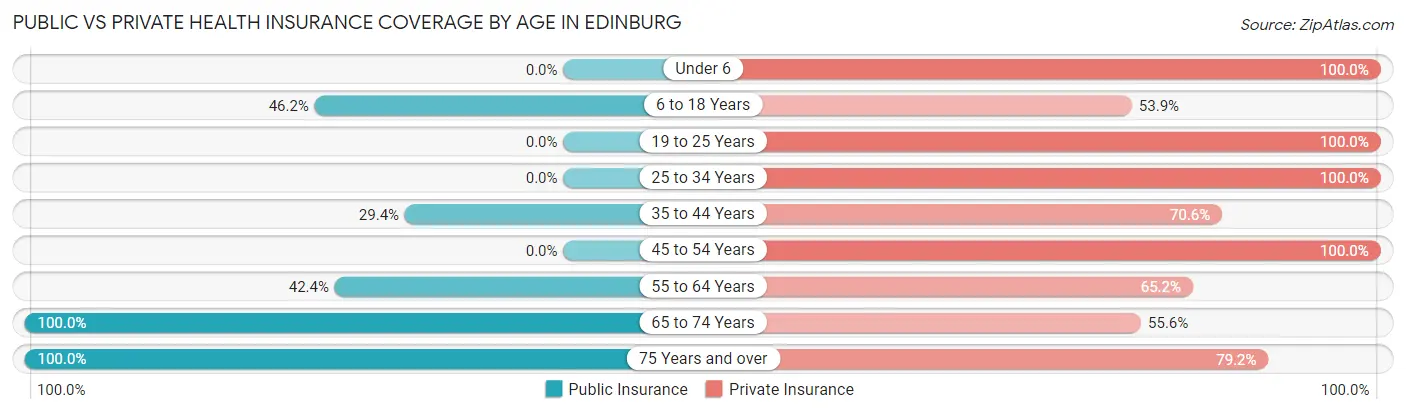
| Age Bracket | Public Insurance | Private Insurance |
| Under 6 | 0 (0.0%) | 19 (100.0%) |
| 6 to 18 Years | 6 (46.2%) | 7 (53.8%) |
| 19 to 25 Years | 0 (0.0%) | 8 (100.0%) |
| 25 to 34 Years | 0 (0.0%) | 14 (100.0%) |
| 35 to 44 Years | 5 (29.4%) | 12 (70.6%) |
| 45 to 54 Years | 0 (0.0%) | 7 (100.0%) |
| 55 to 64 Years | 28 (42.4%) | 43 (65.1%) |
| 65 to 74 Years | 27 (100.0%) | 15 (55.6%) |
| 75 Years and over | 24 (100.0%) | 19 (79.2%) |
| Total | 90 (46.2%) | 144 (73.9%) |
Disability Status by Sex by Age in Edinburg
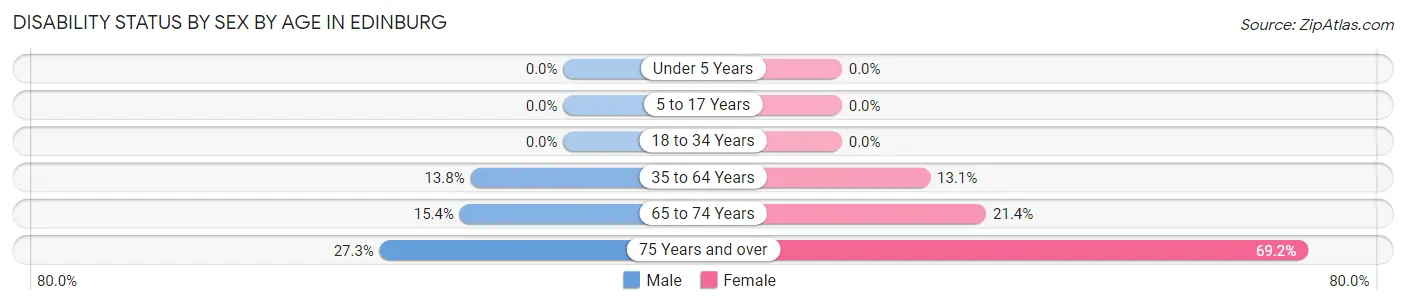
| Age Bracket | Male | Female |
| Under 5 Years | 0 (0.0%) | 0 (0.0%) |
| 5 to 17 Years | 0 (0.0%) | 0 (0.0%) |
| 18 to 34 Years | 0 (0.0%) | 0 (0.0%) |
| 35 to 64 Years | 4 (13.8%) | 8 (13.1%) |
| 65 to 74 Years | 2 (15.4%) | 3 (21.4%) |
| 75 Years and over | 3 (27.3%) | 9 (69.2%) |
Disability Class by Sex by Age in Edinburg
Disability Class: Hearing Difficulty
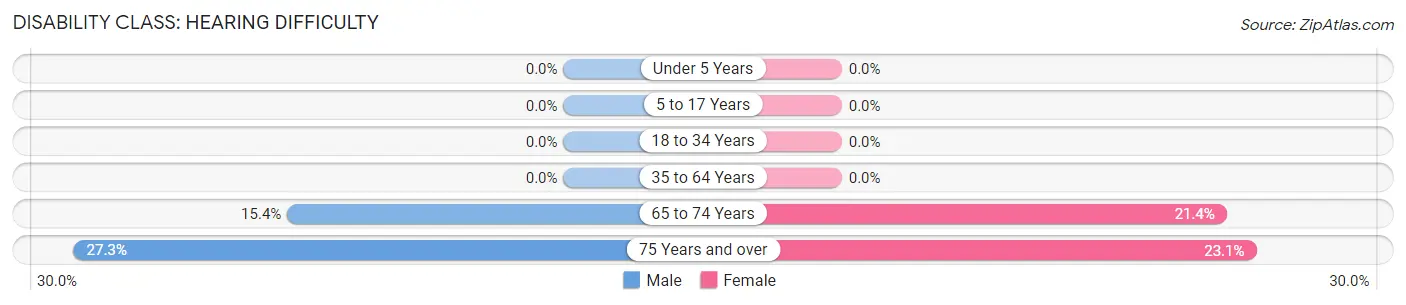
| Age Bracket | Male | Female |
| Under 5 Years | 0 (0.0%) | 0 (0.0%) |
| 5 to 17 Years | 0 (0.0%) | 0 (0.0%) |
| 18 to 34 Years | 0 (0.0%) | 0 (0.0%) |
| 35 to 64 Years | 0 (0.0%) | 0 (0.0%) |
| 65 to 74 Years | 2 (15.4%) | 3 (21.4%) |
| 75 Years and over | 3 (27.3%) | 3 (23.1%) |
Disability Class: Vision Difficulty
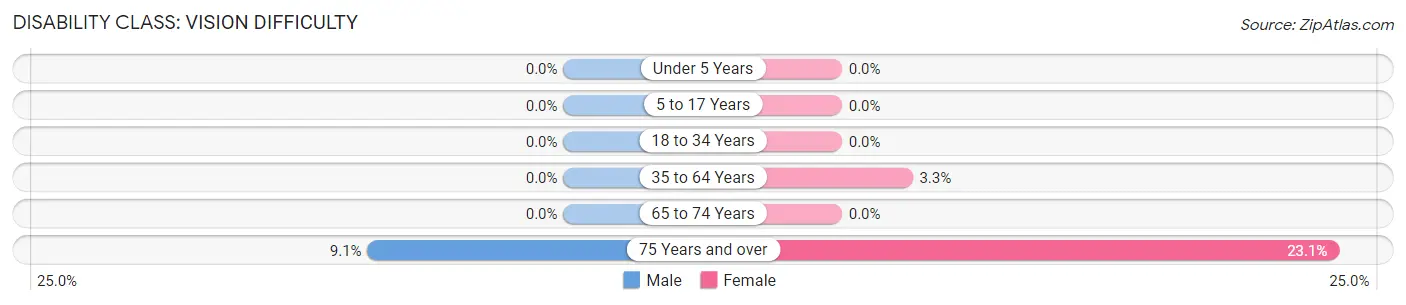
| Age Bracket | Male | Female |
| Under 5 Years | 0 (0.0%) | 0 (0.0%) |
| 5 to 17 Years | 0 (0.0%) | 0 (0.0%) |
| 18 to 34 Years | 0 (0.0%) | 0 (0.0%) |
| 35 to 64 Years | 0 (0.0%) | 2 (3.3%) |
| 65 to 74 Years | 0 (0.0%) | 0 (0.0%) |
| 75 Years and over | 1 (9.1%) | 3 (23.1%) |
Disability Class: Cognitive Difficulty
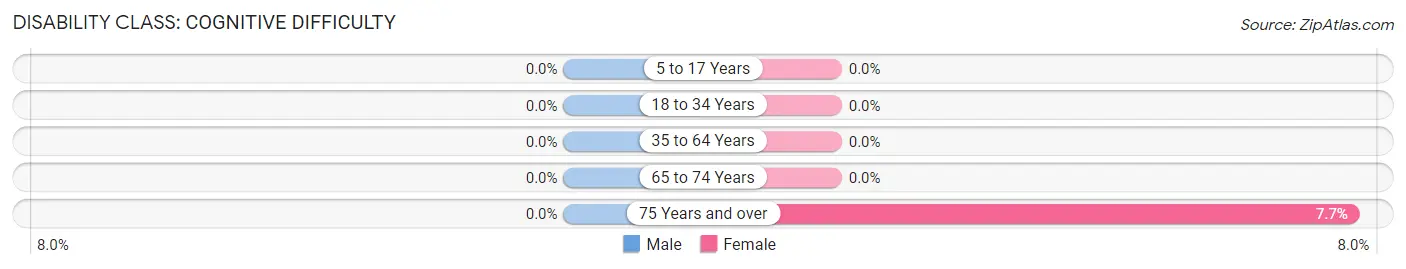
| Age Bracket | Male | Female |
| 5 to 17 Years | 0 (0.0%) | 0 (0.0%) |
| 18 to 34 Years | 0 (0.0%) | 0 (0.0%) |
| 35 to 64 Years | 0 (0.0%) | 0 (0.0%) |
| 65 to 74 Years | 0 (0.0%) | 0 (0.0%) |
| 75 Years and over | 0 (0.0%) | 1 (7.7%) |
Disability Class: Ambulatory Difficulty
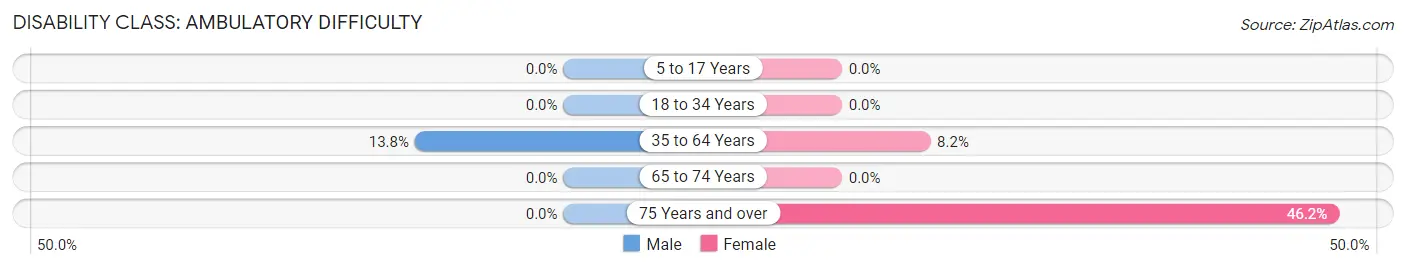
| Age Bracket | Male | Female |
| 5 to 17 Years | 0 (0.0%) | 0 (0.0%) |
| 18 to 34 Years | 0 (0.0%) | 0 (0.0%) |
| 35 to 64 Years | 4 (13.8%) | 5 (8.2%) |
| 65 to 74 Years | 0 (0.0%) | 0 (0.0%) |
| 75 Years and over | 0 (0.0%) | 6 (46.2%) |
Disability Class: Self-Care Difficulty
| Age Bracket | Male | Female |
| 5 to 17 Years | 0 (0.0%) | 0 (0.0%) |
| 18 to 34 Years | 0 (0.0%) | 0 (0.0%) |
| 35 to 64 Years | 0 (0.0%) | 0 (0.0%) |
| 65 to 74 Years | 0 (0.0%) | 0 (0.0%) |
| 75 Years and over | 0 (0.0%) | 0 (0.0%) |
Technology Access in Edinburg
Computing Device Access in Edinburg
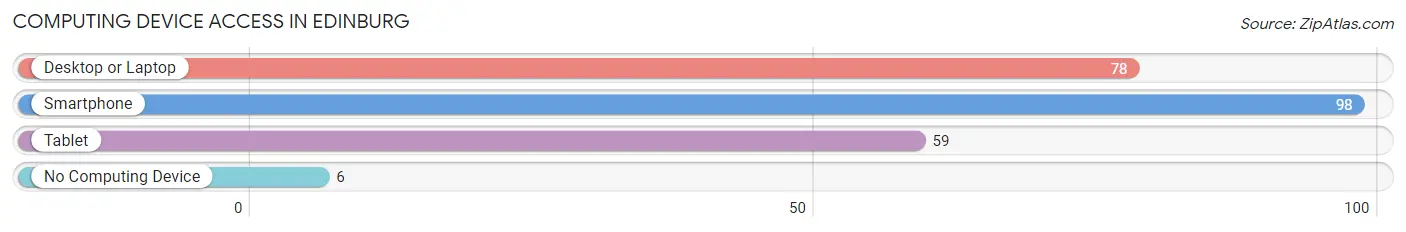
| Device Type | # Households | % Households |
| Desktop or Laptop | 78 | 72.2% |
| Smartphone | 98 | 90.7% |
| Tablet | 59 | 54.6% |
| No Computing Device | 6 | 5.6% |
| Total | 108 | 100.0% |
Internet Access in Edinburg
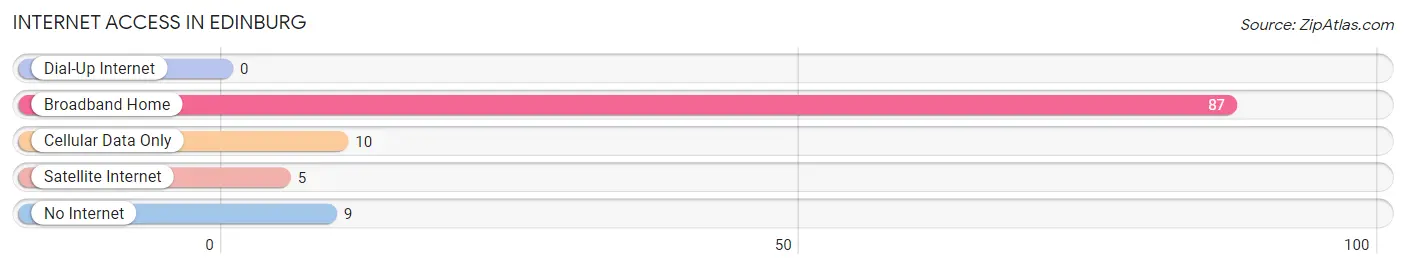
| Internet Type | # Households | % Households |
| Dial-Up Internet | 0 | 0.0% |
| Broadband Home | 87 | 80.6% |
| Cellular Data Only | 10 | 9.3% |
| Satellite Internet | 5 | 4.6% |
| No Internet | 9 | 8.3% |
| Total | 108 | 100.0% |
Edinburg Summary
Edinburg, North Dakota is a small town located in the southeastern corner of the state. It is situated in the Red River Valley, which is a major agricultural region in the United States. The town has a population of just over 500 people, and is the county seat of Walsh County.
History
Edinburg was founded in 1882 by a group of settlers from Norway. The town was named after the city of Edinburgh in Scotland, and was originally known as “Edinburgh”. The town was incorporated in 1883, and the first post office was established in 1884.
The town grew slowly, but steadily, and by the early 1900s, it had become a thriving agricultural center. The town was home to a number of businesses, including a bank, a hotel, a general store, and a lumberyard.
In the 1920s, the town experienced a period of growth and prosperity. The Great Northern Railway was extended to Edinburg, and the town became a major shipping center for the region. The town also became a popular tourist destination, and many people from the surrounding area would come to Edinburg to enjoy the scenery and the small-town atmosphere.
Geography
Edinburg is located in the Red River Valley, which is a major agricultural region in the United States. The town is situated on the banks of the Red River, and is surrounded by rolling hills and farmland. The town is located about 30 miles south of Grand Forks, North Dakota, and about 50 miles north of Fargo, North Dakota.
The climate in Edinburg is typical of the northern Great Plains. Summers are hot and humid, with temperatures often reaching into the 90s. Winters are cold and snowy, with temperatures often dropping below zero.
Economy
The economy of Edinburg is largely based on agriculture. The town is located in the heart of the Red River Valley, which is one of the most productive agricultural regions in the United States. The town is home to a number of farms, and the surrounding area is known for its production of wheat, corn, soybeans, and other crops.
In addition to agriculture, Edinburg is also home to a number of small businesses. These include a bank, a hotel, a general store, and a lumberyard. The town is also home to a number of restaurants, bars, and other businesses.
Demographics
As of the 2010 census, the population of Edinburg was 514. The town is predominantly white, with 92.3% of the population identifying as white. The town also has a small Hispanic population, with 4.3% of the population identifying as Hispanic or Latino. The median household income in Edinburg is $41,250, and the median home value is $90,000.
Edinburg is a small town with a rich history and a strong sense of community. The town is home to a number of businesses, and the surrounding area is known for its agricultural production. The town is also home to a diverse population, and is a great place to live and work.
Common Questions
What is Per Capita Income in Edinburg?
Per Capita income in Edinburg is $43,927.
What is the Median Family Income in Edinburg?
Median Family Income in Edinburg is $115,625.
What is the Median Household income in Edinburg?
Median Household Income in Edinburg is $54,167.
What is Income or Wage Gap in Edinburg?
Income or Wage Gap in Edinburg is 44.0%.
Women in Edinburg earn 56.0 cents for every dollar earned by a man.
What is Inequality or Gini Index in Edinburg?
Inequality or Gini Index in Edinburg is 0.50.
What is the Total Population of Edinburg?
Total Population of Edinburg is 195.
What is the Total Male Population of Edinburg?
Total Male Population of Edinburg is 80.
What is the Total Female Population of Edinburg?
Total Female Population of Edinburg is 115.
What is the Ratio of Males per 100 Females in Edinburg?
There are 69.57 Males per 100 Females in Edinburg.
What is the Ratio of Females per 100 Males in Edinburg?
There are 143.75 Females per 100 Males in Edinburg.
What is the Median Population Age in Edinburg?
Median Population Age in Edinburg is 59.1 Years.
What is the Average Family Size in Edinburg
Average Family Size in Edinburg is 2.9 People.
What is the Average Household Size in Edinburg
Average Household Size in Edinburg is 1.8 People.
How Large is the Labor Force in Edinburg?
There are 84 People in the Labor Forcein in Edinburg.
What is the Percentage of People in the Labor Force in Edinburg?
50.6% of People are in the Labor Force in Edinburg.