South Deerfield, MA Map & Demographics
South Deerfield Map
South Deerfield Overview
$55,175
PER CAPITA INCOME
$107,339
AVG FAMILY INCOME
$81,577
AVG HOUSEHOLD INCOME
26.4%
WAGE / INCOME GAP [ % ]
73.6¢/ $1
WAGE / INCOME GAP [ $ ]
0.42
INEQUALITY / GINI INDEX
1,953
TOTAL POPULATION
922
MALE POPULATION
1,031
FEMALE POPULATION
89.43
MALES / 100 FEMALES
111.82
FEMALES / 100 MALES
51.6
MEDIAN AGE
2.7
AVG FAMILY SIZE
1.9
AVG HOUSEHOLD SIZE
1,251
LABOR FORCE [ PEOPLE ]
68.8%
PERCENT IN LABOR FORCE
5.8%
UNEMPLOYMENT RATE
South Deerfield Zip Codes
South Deerfield Area Codes
Income in South Deerfield
Income Overview in South Deerfield
Per Capita Income in South Deerfield is $55,175, while median incomes of families and households are $107,339 and $81,577 respectively.
| Characteristic | Number | Measure |
| Per Capita Income | 1,953 | $55,175 |
| Median Family Income | 476 | $107,339 |
| Mean Family Income | 476 | $141,598 |
| Median Household Income | 1,003 | $81,577 |
| Mean Household Income | 1,003 | $106,461 |
| Income Deficit | 476 | $0 |
| Wage / Income Gap (%) | 1,953 | 26.44% |
| Wage / Income Gap ($) | 1,953 | 73.56¢ per $1 |
| Gini / Inequality Index | 1,953 | 0.42 |
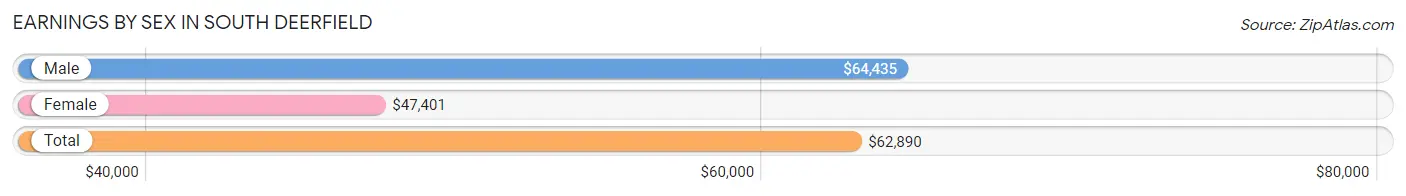
Earnings by Sex in South Deerfield
Average Earnings in South Deerfield are $62,890, $64,435 for men and $47,401 for women, a difference of 26.4%.
| Sex | Number | Average Earnings |
| Male | 602 (49.0%) | $64,435 |
| Female | 627 (51.0%) | $47,401 |
| Total | 1,229 (100.0%) | $62,890 |
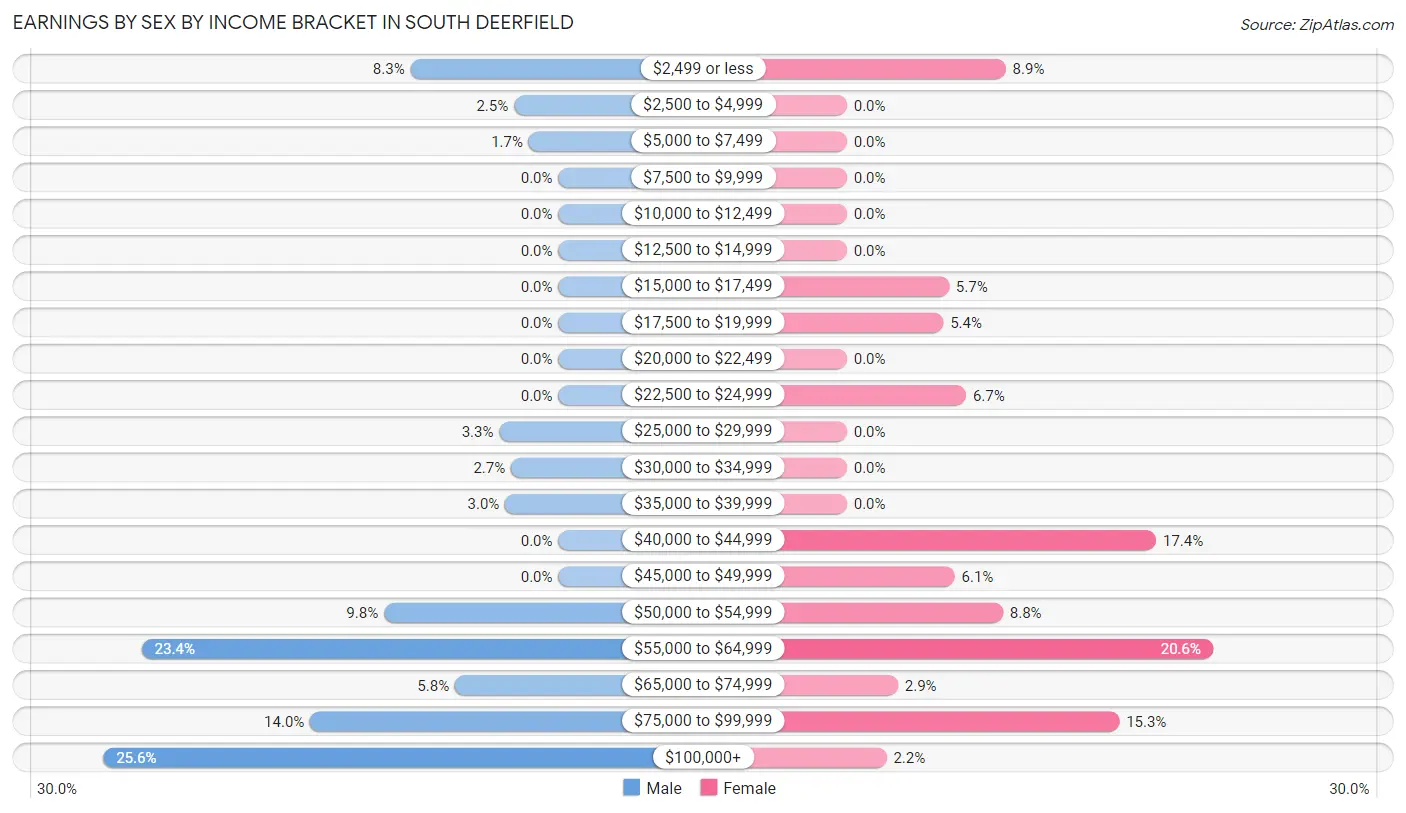
Earnings by Sex by Income Bracket in South Deerfield
The most common earnings brackets in South Deerfield are $100,000+ for men (154 | 25.6%) and $55,000 to $64,999 for women (129 | 20.6%).
| Income | Male | Female |
| $2,499 or less | 50 (8.3%) | 56 (8.9%) |
| $2,500 to $4,999 | 15 (2.5%) | 0 (0.0%) |
| $5,000 to $7,499 | 10 (1.7%) | 0 (0.0%) |
| $7,500 to $9,999 | 0 (0.0%) | 0 (0.0%) |
| $10,000 to $12,499 | 0 (0.0%) | 0 (0.0%) |
| $12,500 to $14,999 | 0 (0.0%) | 0 (0.0%) |
| $15,000 to $17,499 | 0 (0.0%) | 36 (5.7%) |
| $17,500 to $19,999 | 0 (0.0%) | 34 (5.4%) |
| $20,000 to $22,499 | 0 (0.0%) | 0 (0.0%) |
| $22,500 to $24,999 | 0 (0.0%) | 42 (6.7%) |
| $25,000 to $29,999 | 20 (3.3%) | 0 (0.0%) |
| $30,000 to $34,999 | 16 (2.7%) | 0 (0.0%) |
| $35,000 to $39,999 | 18 (3.0%) | 0 (0.0%) |
| $40,000 to $44,999 | 0 (0.0%) | 109 (17.4%) |
| $45,000 to $49,999 | 0 (0.0%) | 38 (6.1%) |
| $50,000 to $54,999 | 59 (9.8%) | 55 (8.8%) |
| $55,000 to $64,999 | 141 (23.4%) | 129 (20.6%) |
| $65,000 to $74,999 | 35 (5.8%) | 18 (2.9%) |
| $75,000 to $99,999 | 84 (14.0%) | 96 (15.3%) |
| $100,000+ | 154 (25.6%) | 14 (2.2%) |
| Total | 602 (100.0%) | 627 (100.0%) |
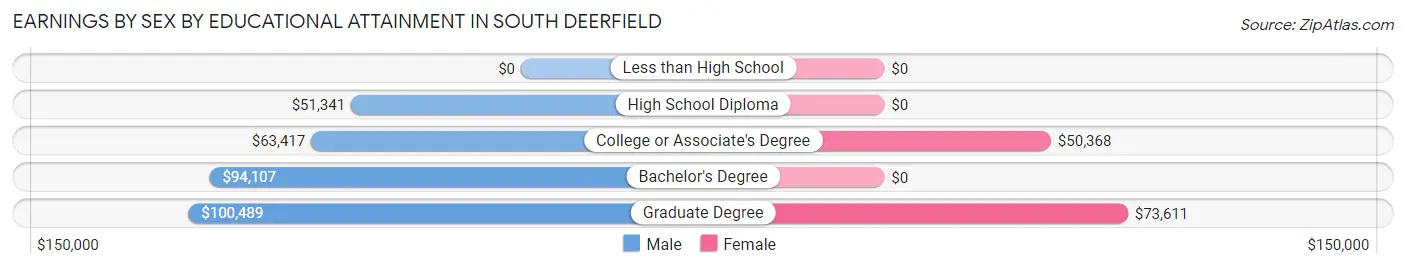
Earnings by Sex by Educational Attainment in South Deerfield
Average earnings in South Deerfield are $64,637 for men and $51,205 for women, a difference of 20.8%. Men with an educational attainment of graduate degree enjoy the highest average annual earnings of $100,489, while those with high school diploma education earn the least with $51,341. Women with an educational attainment of graduate degree earn the most with the average annual earnings of $73,611, while those with college or associate's degree education have the smallest earnings of $50,368.
| Educational Attainment | Male Income | Female Income |
| Less than High School | - | - |
| High School Diploma | $51,341 | $0 |
| College or Associate's Degree | $63,417 | $50,368 |
| Bachelor's Degree | $94,107 | $0 |
| Graduate Degree | $100,489 | $73,611 |
| Total | $64,637 | $51,205 |
Family Income in South Deerfield
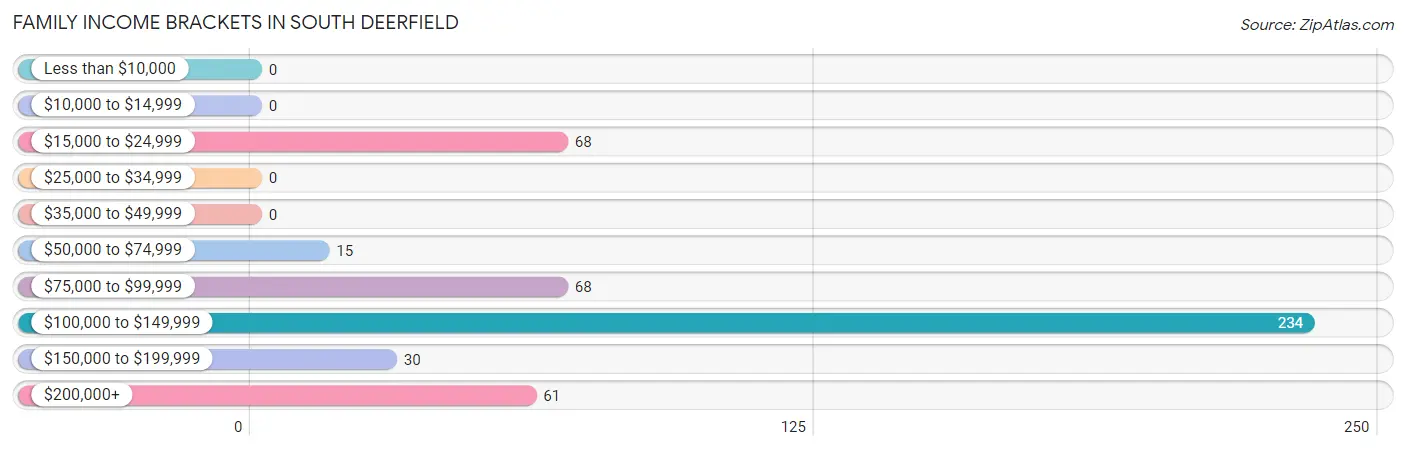
Family Income Brackets in South Deerfield
According to the South Deerfield family income data, there are 234 families falling into the $100,000 to $149,999 income range, which is the most common income bracket and makes up 49.2% of all families.
| Income Bracket | # Families | % Families |
| Less than $10,000 | 0 | 0.0% |
| $10,000 to $14,999 | 0 | 0.0% |
| $15,000 to $24,999 | 68 | 14.3% |
| $25,000 to $34,999 | 0 | 0.0% |
| $35,000 to $49,999 | 0 | 0.0% |
| $50,000 to $74,999 | 15 | 3.2% |
| $75,000 to $99,999 | 68 | 14.3% |
| $100,000 to $149,999 | 234 | 49.2% |
| $150,000 to $199,999 | 30 | 6.3% |
| $200,000+ | 61 | 12.8% |
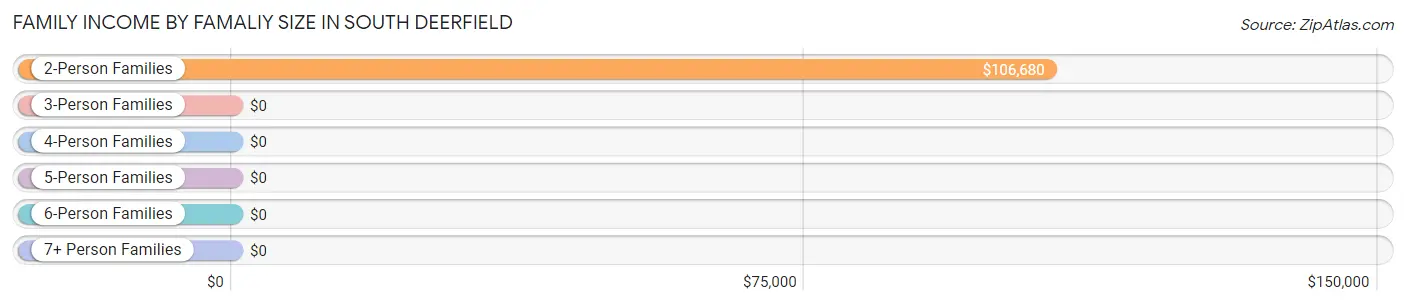
Family Income by Famaliy Size in South Deerfield
2-person families (307 | 64.5%) account for the highest median family income in South Deerfield with $106,680 per family, while 2-person families (307 | 64.5%) have the highest median income of $53,340 per family member.
| Income Bracket | # Families | Median Income |
| 2-Person Families | 307 (64.5%) | $106,680 |
| 3-Person Families | 97 (20.4%) | $0 |
| 4-Person Families | 38 (8.0%) | $0 |
| 5-Person Families | 34 (7.1%) | $0 |
| 6-Person Families | 0 (0.0%) | $0 |
| 7+ Person Families | 0 (0.0%) | $0 |
| Total | 476 (100.0%) | $107,339 |
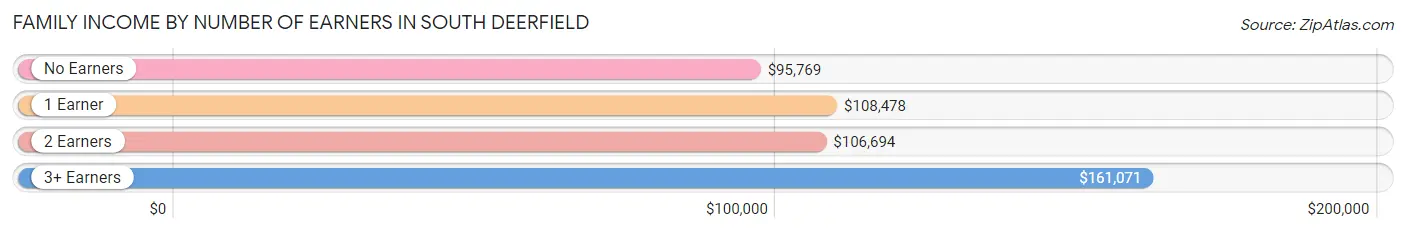
Family Income by Number of Earners in South Deerfield
The median family income in South Deerfield is $107,339, with families comprising 3+ earners (48) having the highest median family income of $161,071, while families with no earners (90) have the lowest median family income of $95,769, accounting for 10.1% and 18.9% of families, respectively.
| Number of Earners | # Families | Median Income |
| No Earners | 90 (18.9%) | $95,769 |
| 1 Earner | 128 (26.9%) | $108,478 |
| 2 Earners | 210 (44.1%) | $106,694 |
| 3+ Earners | 48 (10.1%) | $161,071 |
| Total | 476 (100.0%) | $107,339 |
Household Income in South Deerfield
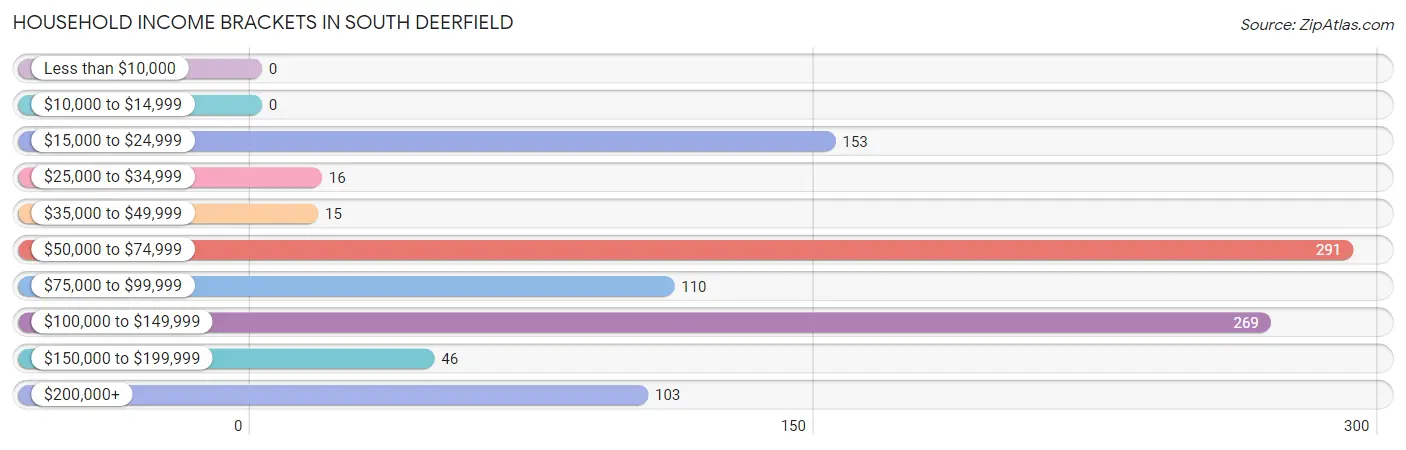
Household Income Brackets in South Deerfield
With 291 households falling in the category, the $50,000 to $74,999 income range is the most frequent in South Deerfield, accounting for 29.0% of all households.
| Income Bracket | # Households | % Households |
| Less than $10,000 | 0 | 0.0% |
| $10,000 to $14,999 | 0 | 0.0% |
| $15,000 to $24,999 | 153 | 15.3% |
| $25,000 to $34,999 | 16 | 1.6% |
| $35,000 to $49,999 | 15 | 1.5% |
| $50,000 to $74,999 | 291 | 29.0% |
| $75,000 to $99,999 | 110 | 11.0% |
| $100,000 to $149,999 | 269 | 26.8% |
| $150,000 to $199,999 | 46 | 4.6% |
| $200,000+ | 103 | 10.3% |
Household Income by Householder Age in South Deerfield
The median household income in South Deerfield is $81,577, with the highest median household income of $101,467 found in the 25 to 44 years age bracket for the primary householder. A total of 207 households (20.6%) fall into this category. Meanwhile, the 15 to 24 years age bracket for the primary householder has the lowest median household income of $0, with 15 households (1.5%) in this group.
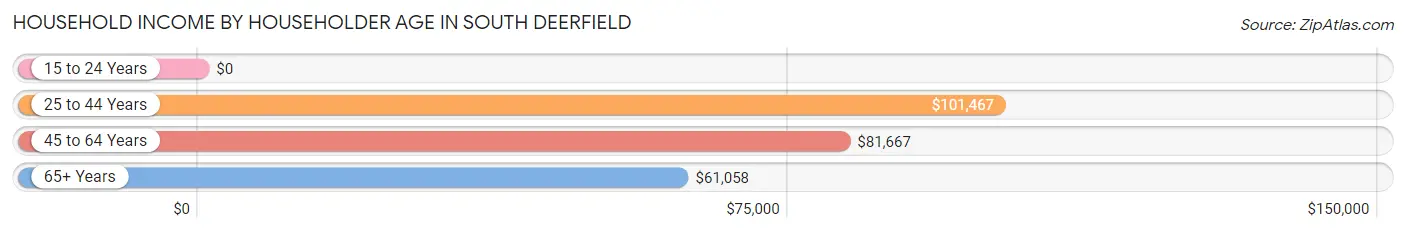
| Income Bracket | # Households | Median Income |
| 15 to 24 Years | 15 (1.5%) | $0 |
| 25 to 44 Years | 207 (20.6%) | $101,467 |
| 45 to 64 Years | 520 (51.8%) | $81,667 |
| 65+ Years | 261 (26.0%) | $61,058 |
| Total | 1,003 (100.0%) | $81,577 |
Poverty in South Deerfield
Income Below Poverty by Sex and Age in South Deerfield
With 3.1% poverty level for males and 1.0% for females among the residents of South Deerfield, 75 year old and over males and 65 to 74 year old females are the most vulnerable to poverty, with 11 males (17.7%) and 10 females (8.2%) in their respective age groups living below the poverty level.
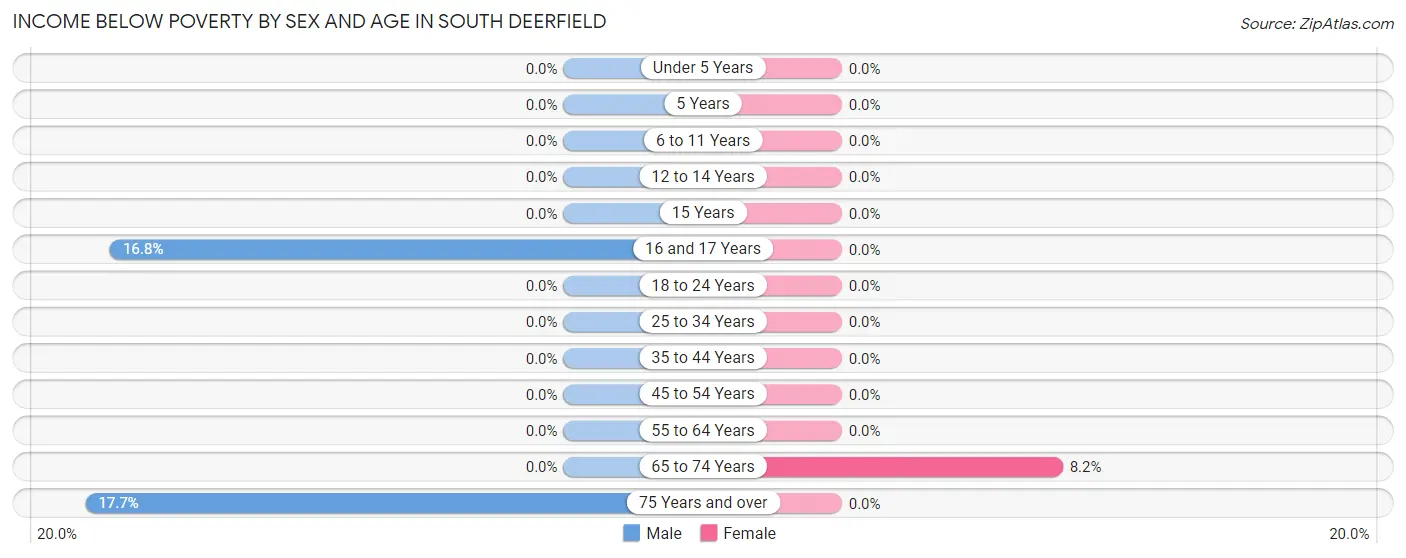
| Age Bracket | Male | Female |
| Under 5 Years | 0 (0.0%) | 0 (0.0%) |
| 5 Years | 0 (0.0%) | 0 (0.0%) |
| 6 to 11 Years | 0 (0.0%) | 0 (0.0%) |
| 12 to 14 Years | 0 (0.0%) | 0 (0.0%) |
| 15 Years | 0 (0.0%) | 0 (0.0%) |
| 16 and 17 Years | 17 (16.8%) | 0 (0.0%) |
| 18 to 24 Years | 0 (0.0%) | 0 (0.0%) |
| 25 to 34 Years | 0 (0.0%) | 0 (0.0%) |
| 35 to 44 Years | 0 (0.0%) | 0 (0.0%) |
| 45 to 54 Years | 0 (0.0%) | 0 (0.0%) |
| 55 to 64 Years | 0 (0.0%) | 0 (0.0%) |
| 65 to 74 Years | 0 (0.0%) | 10 (8.2%) |
| 75 Years and over | 11 (17.7%) | 0 (0.0%) |
| Total | 28 (3.1%) | 10 (1.0%) |
Income Above Poverty by Sex and Age in South Deerfield
According to the poverty statistics in South Deerfield, males aged 12 to 14 years and females aged under 5 years are the age groups that are most secure financially, with 100.0% of males and 100.0% of females in these age groups living above the poverty line.
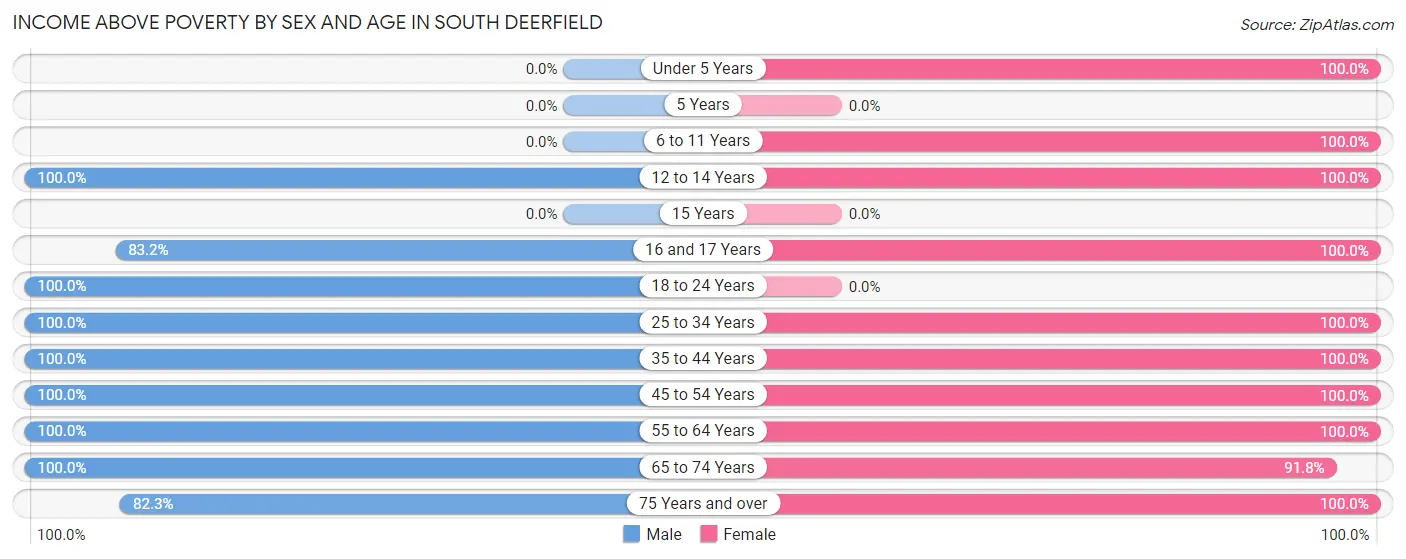
| Age Bracket | Male | Female |
| Under 5 Years | 0 (0.0%) | 16 (100.0%) |
| 5 Years | 0 (0.0%) | 0 (0.0%) |
| 6 to 11 Years | 0 (0.0%) | 46 (100.0%) |
| 12 to 14 Years | 14 (100.0%) | 44 (100.0%) |
| 15 Years | 0 (0.0%) | 0 (0.0%) |
| 16 and 17 Years | 84 (83.2%) | 98 (100.0%) |
| 18 to 24 Years | 66 (100.0%) | 0 (0.0%) |
| 25 to 34 Years | 118 (100.0%) | 65 (100.0%) |
| 35 to 44 Years | 63 (100.0%) | 88 (100.0%) |
| 45 to 54 Years | 110 (100.0%) | 206 (100.0%) |
| 55 to 64 Years | 289 (100.0%) | 216 (100.0%) |
| 65 to 74 Years | 85 (100.0%) | 112 (91.8%) |
| 75 Years and over | 51 (82.3%) | 130 (100.0%) |
| Total | 880 (96.9%) | 1,021 (99.0%) |
Income Below Poverty Among Married-Couple Families in South Deerfield
The poverty statistics for married-couple families in South Deerfield show that 3.4% or 11 of the total 325 families live below the poverty line. Families with no children have the highest poverty rate of 4.3%, comprising of 11 families. On the other hand, families with 1 or 2 children have the lowest poverty rate of 0.0%, which includes 0 families.
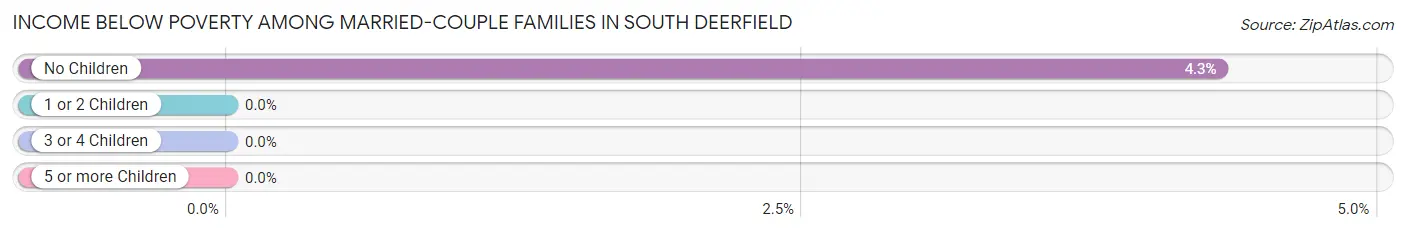
| Children | Above Poverty | Below Poverty |
| No Children | 244 (95.7%) | 11 (4.3%) |
| 1 or 2 Children | 70 (100.0%) | 0 (0.0%) |
| 3 or 4 Children | 0 (0.0%) | 0 (0.0%) |
| 5 or more Children | 0 (0.0%) | 0 (0.0%) |
| Total | 314 (96.6%) | 11 (3.4%) |
Income Below Poverty Among Single-Parent Households in South Deerfield
| Children | Single Father | Single Mother |
| No Children | 0 (0.0%) | 0 (0.0%) |
| 1 or 2 Children | 0 (0.0%) | 0 (0.0%) |
| 3 or 4 Children | 0 (0.0%) | 0 (0.0%) |
| 5 or more Children | 0 (0.0%) | 0 (0.0%) |
| Total | 0 (0.0%) | 0 (0.0%) |
Income Below Poverty Among Married-Couple vs Single-Parent Households in South Deerfield
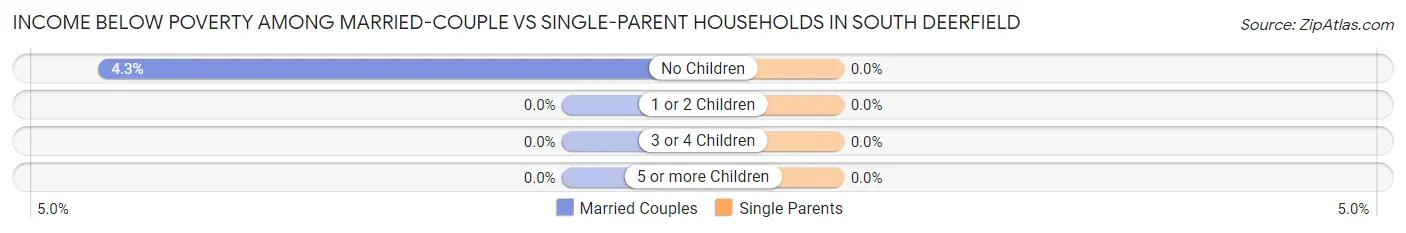
| Children | Married-Couple Families | Single-Parent Households |
| No Children | 11 (4.3%) | 0 (0.0%) |
| 1 or 2 Children | 0 (0.0%) | 0 (0.0%) |
| 3 or 4 Children | 0 (0.0%) | 0 (0.0%) |
| 5 or more Children | 0 (0.0%) | 0 (0.0%) |
| Total | 11 (3.4%) | 0 (0.0%) |
Race in South Deerfield
The most populous races in South Deerfield are White / Caucasian (1,890 | 96.8%), Hispanic or Latino (179 | 9.2%), and Two or more Races (63 | 3.2%).
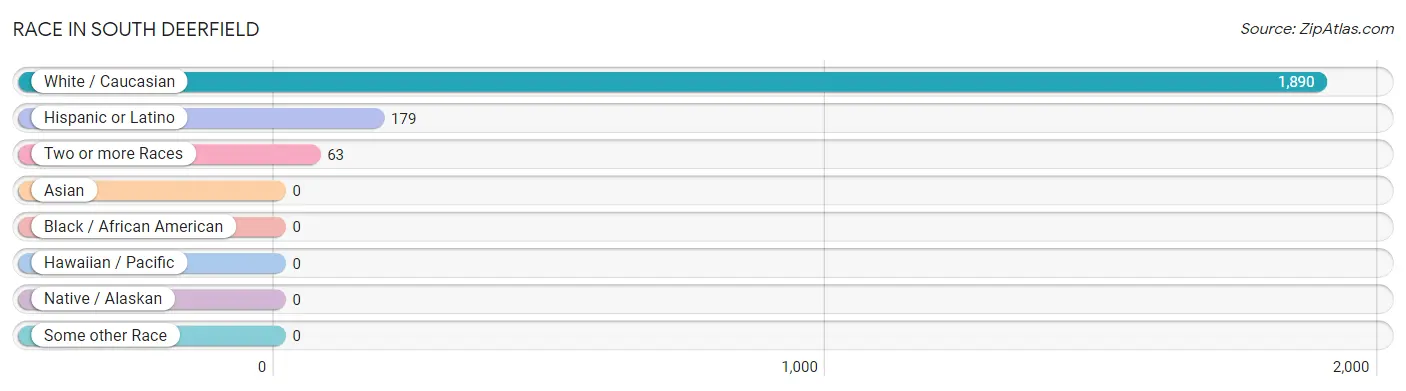
| Race | # Population | % Population |
| Asian | 0 | 0.0% |
| Black / African American | 0 | 0.0% |
| Hawaiian / Pacific | 0 | 0.0% |
| Hispanic or Latino | 179 | 9.2% |
| Native / Alaskan | 0 | 0.0% |
| White / Caucasian | 1,890 | 96.8% |
| Two or more Races | 63 | 3.2% |
| Some other Race | 0 | 0.0% |
| Total | 1,953 | 100.0% |
Ancestry in South Deerfield
The most populous ancestries reported in South Deerfield are Irish (501 | 25.7%), English (342 | 17.5%), Polish (296 | 15.2%), American (274 | 14.0%), and Italian (260 | 13.3%), together accounting for 85.7% of all South Deerfield residents.
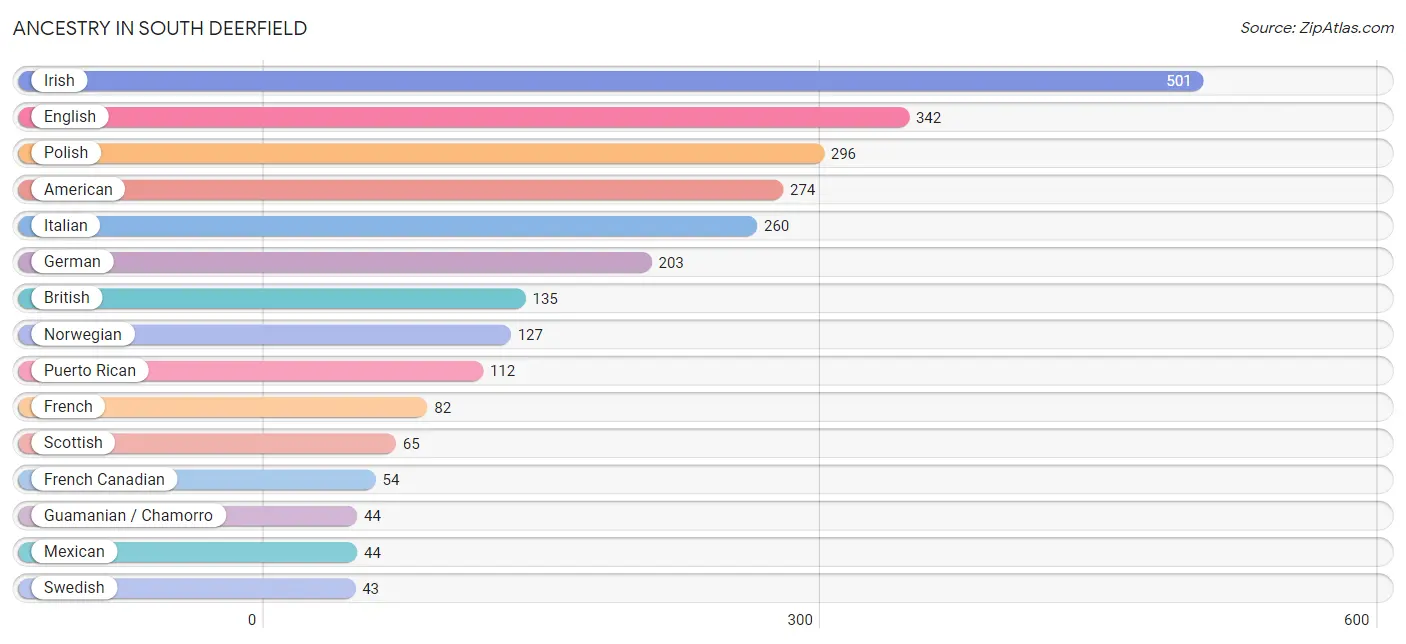
| Ancestry | # Population | % Population |
| Albanian | 17 | 0.9% |
| American | 274 | 14.0% |
| Austrian | 15 | 0.8% |
| British | 135 | 6.9% |
| Colombian | 23 | 1.2% |
| English | 342 | 17.5% |
| French | 82 | 4.2% |
| French Canadian | 54 | 2.8% |
| German | 203 | 10.4% |
| Guamanian / Chamorro | 44 | 2.2% |
| Haitian | 19 | 1.0% |
| Irish | 501 | 25.7% |
| Italian | 260 | 13.3% |
| Lithuanian | 10 | 0.5% |
| Mexican | 44 | 2.2% |
| Norwegian | 127 | 6.5% |
| Polish | 296 | 15.2% |
| Portuguese | 36 | 1.8% |
| Puerto Rican | 112 | 5.7% |
| Scottish | 65 | 3.3% |
| South African | 24 | 1.2% |
| South American | 23 | 1.2% |
| Subsaharan African | 24 | 1.2% |
| Swedish | 43 | 2.2% | View All 24 Rows |
Immigrants in South Deerfield
The most numerous immigrant groups reported in South Deerfield came from Europe (93 | 4.8%), Northern Europe (56 | 2.9%), England (41 | 2.1%), Eastern Europe (37 | 1.9%), and Poland (37 | 1.9%), together accounting for 13.5% of all South Deerfield residents.
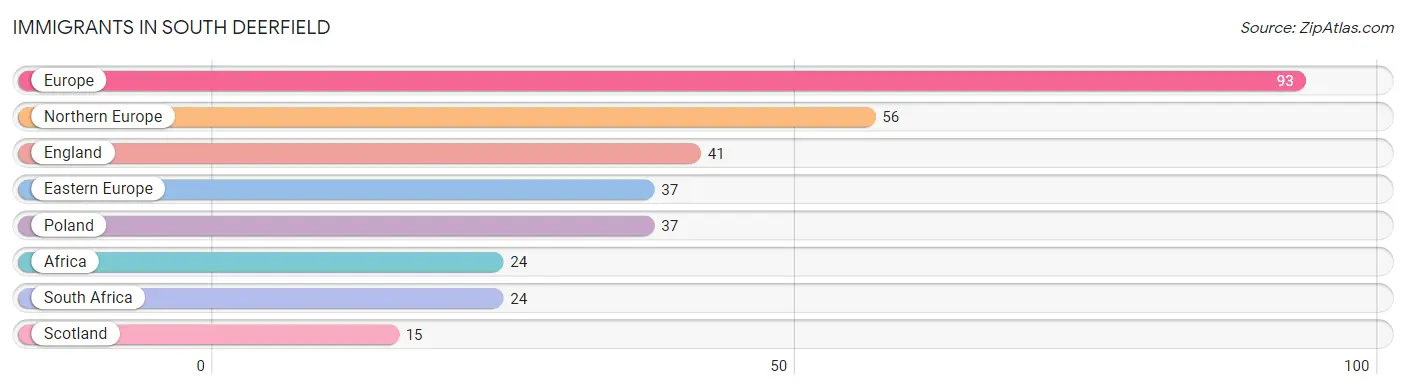
| Immigration Origin | # Population | % Population |
| Africa | 24 | 1.2% |
| Eastern Europe | 37 | 1.9% |
| England | 41 | 2.1% |
| Europe | 93 | 4.8% |
| Northern Europe | 56 | 2.9% |
| Poland | 37 | 1.9% |
| Scotland | 15 | 0.8% |
| South Africa | 24 | 1.2% | View All 8 Rows |
Sex and Age in South Deerfield
Sex and Age in South Deerfield
The most populous age groups in South Deerfield are 55 to 59 Years (209 | 22.7%) for men and 60 to 64 Years (180 | 17.5%) for women.
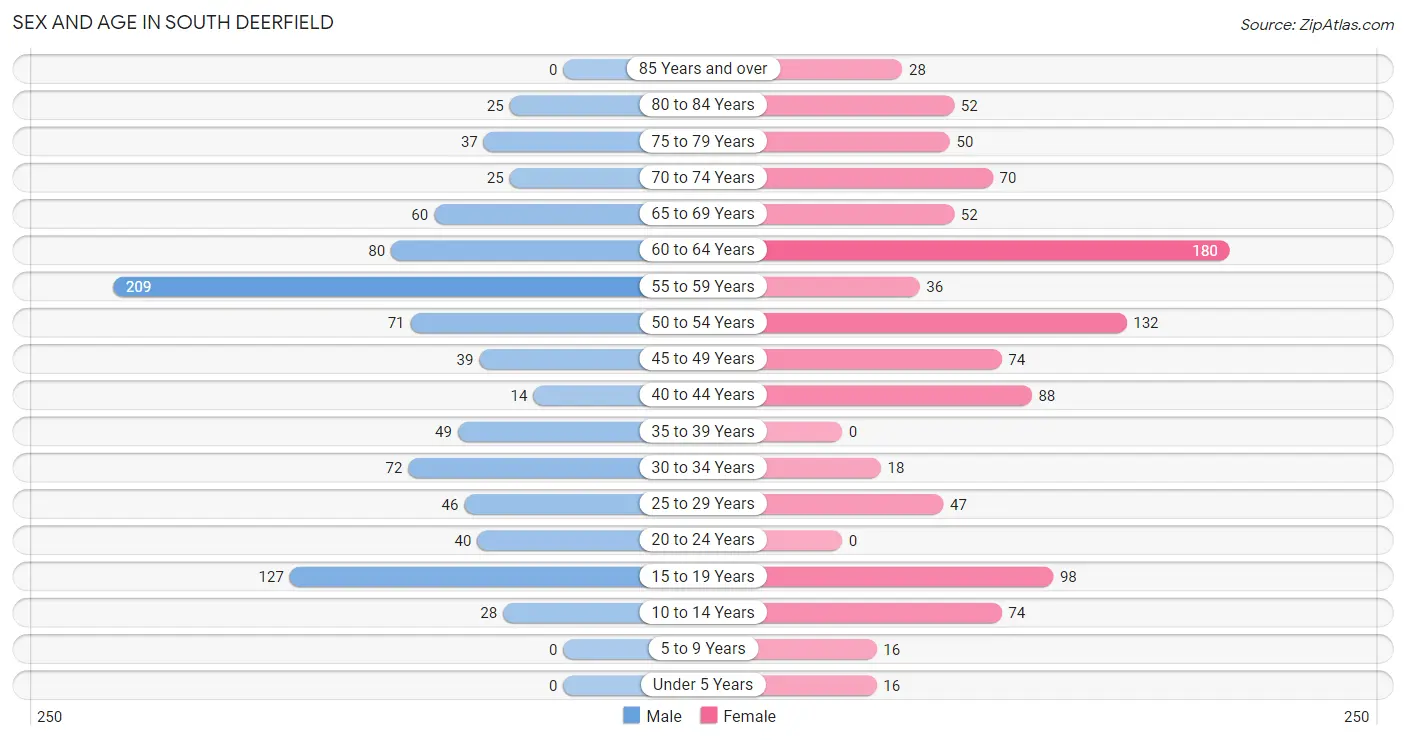
| Age Bracket | Male | Female |
| Under 5 Years | 0 (0.0%) | 16 (1.5%) |
| 5 to 9 Years | 0 (0.0%) | 16 (1.5%) |
| 10 to 14 Years | 28 (3.0%) | 74 (7.2%) |
| 15 to 19 Years | 127 (13.8%) | 98 (9.5%) |
| 20 to 24 Years | 40 (4.3%) | 0 (0.0%) |
| 25 to 29 Years | 46 (5.0%) | 47 (4.6%) |
| 30 to 34 Years | 72 (7.8%) | 18 (1.8%) |
| 35 to 39 Years | 49 (5.3%) | 0 (0.0%) |
| 40 to 44 Years | 14 (1.5%) | 88 (8.5%) |
| 45 to 49 Years | 39 (4.2%) | 74 (7.2%) |
| 50 to 54 Years | 71 (7.7%) | 132 (12.8%) |
| 55 to 59 Years | 209 (22.7%) | 36 (3.5%) |
| 60 to 64 Years | 80 (8.7%) | 180 (17.5%) |
| 65 to 69 Years | 60 (6.5%) | 52 (5.0%) |
| 70 to 74 Years | 25 (2.7%) | 70 (6.8%) |
| 75 to 79 Years | 37 (4.0%) | 50 (4.9%) |
| 80 to 84 Years | 25 (2.7%) | 52 (5.0%) |
| 85 Years and over | 0 (0.0%) | 28 (2.7%) |
| Total | 922 (100.0%) | 1,031 (100.0%) |
Families and Households in South Deerfield
Median Family Size in South Deerfield
The median family size in South Deerfield is 2.70 persons per family, with single female/mother families (126 | 26.5%) accounting for the largest median family size of 3.02 persons per family. On the other hand, married-couple families (325 | 68.3%) represent the smallest median family size with 2.56 persons per family.
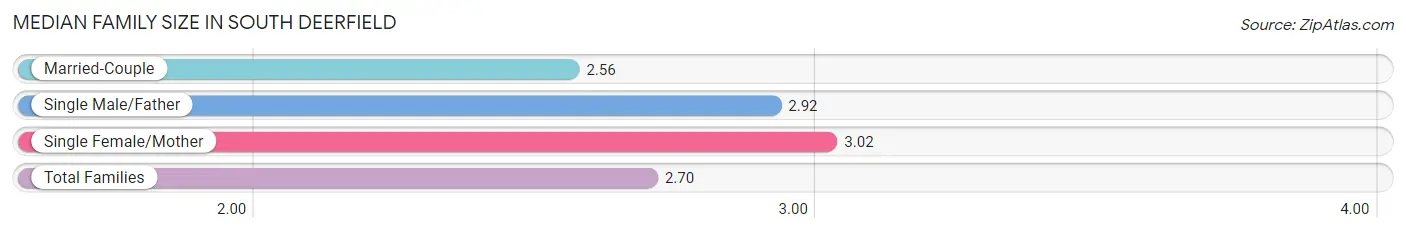
| Family Type | # Families | Family Size |
| Married-Couple | 325 (68.3%) | 2.56 |
| Single Male/Father | 25 (5.2%) | 2.92 |
| Single Female/Mother | 126 (26.5%) | 3.02 |
| Total Families | 476 (100.0%) | 2.70 |
Median Household Size in South Deerfield
The median household size in South Deerfield is 1.95 persons per household, with single male/father households (25 | 2.5%) accounting for the largest median household size of 3.56 persons per household. non-family households (527 | 52.5%) represent the smallest median household size with 1.18 persons per household.
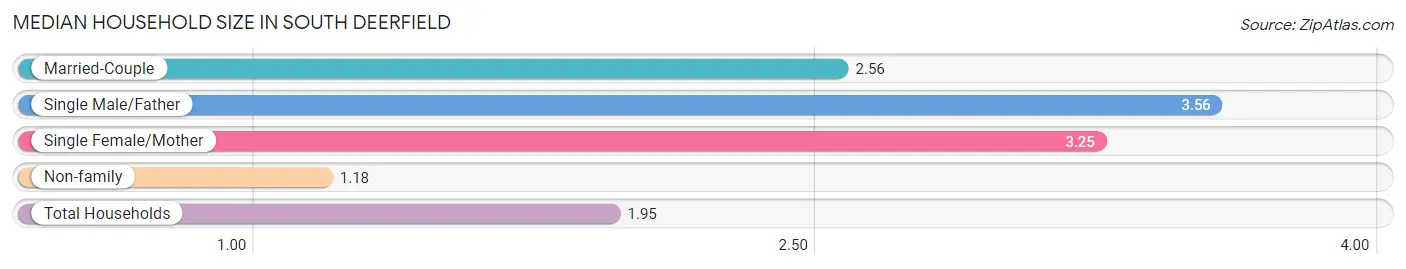
| Household Type | # Households | Household Size |
| Married-Couple | 325 (32.4%) | 2.56 |
| Single Male/Father | 25 (2.5%) | 3.56 |
| Single Female/Mother | 126 (12.6%) | 3.25 |
| Non-family | 527 (52.5%) | 1.18 |
| Total Households | 1,003 (100.0%) | 1.95 |
Household Size by Marriage Status in South Deerfield
Out of a total of 1,003 households in South Deerfield, 476 (47.5%) are family households, while 527 (52.5%) are nonfamily households. The most numerous type of family households are 2-person households, comprising 307, and the most common type of nonfamily households are 1-person households, comprising 446.
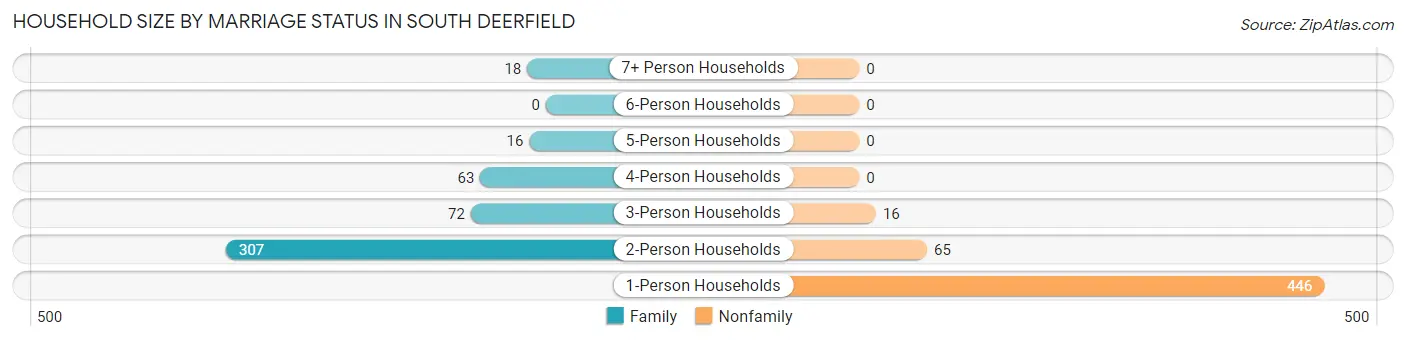
| Household Size | Family Households | Nonfamily Households |
| 1-Person Households | - | 446 (44.5%) |
| 2-Person Households | 307 (30.6%) | 65 (6.5%) |
| 3-Person Households | 72 (7.2%) | 16 (1.6%) |
| 4-Person Households | 63 (6.3%) | 0 (0.0%) |
| 5-Person Households | 16 (1.6%) | 0 (0.0%) |
| 6-Person Households | 0 (0.0%) | 0 (0.0%) |
| 7+ Person Households | 18 (1.8%) | 0 (0.0%) |
| Total | 476 (47.5%) | 527 (52.5%) |
Female Fertility in South Deerfield
Fertility by Age in South Deerfield
Average fertility rate in South Deerfield is 58.0 births per 1,000 women. Women in the age bracket of 35 to 50 years have the highest fertility rate with 117.0 births per 1,000 women. Women in the age bracket of 35 to 50 years acount for 100.0% of all women with births.
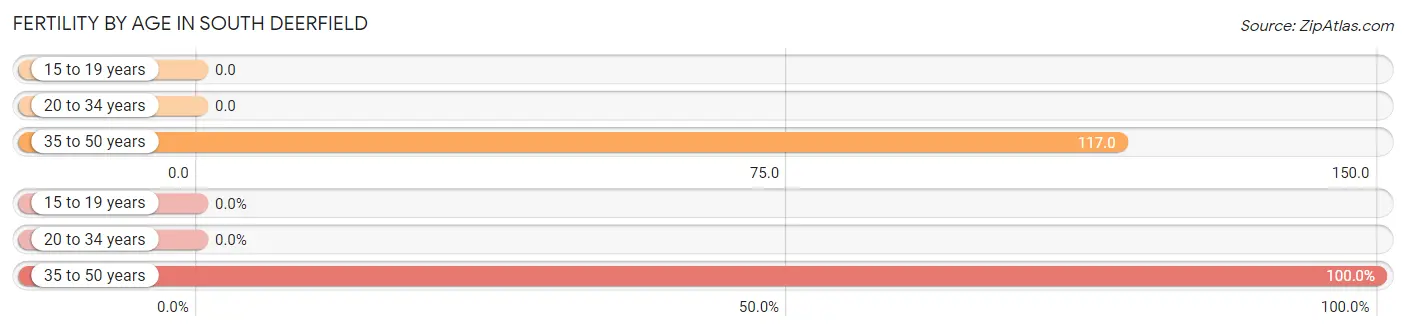
| Age Bracket | Women with Births | Births / 1,000 Women |
| 15 to 19 years | 0 (0.0%) | 0.0 |
| 20 to 34 years | 0 (0.0%) | 0.0 |
| 35 to 50 years | 19 (100.0%) | 117.0 |
| Total | 19 (100.0%) | 58.0 |
Fertility by Age by Marriage Status in South Deerfield
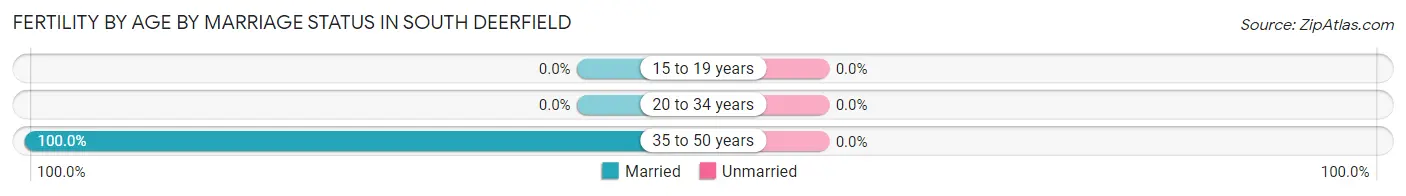
| Age Bracket | Married | Unmarried |
| 15 to 19 years | 0 (0.0%) | 0 (0.0%) |
| 20 to 34 years | 0 (0.0%) | 0 (0.0%) |
| 35 to 50 years | 19 (100.0%) | 0 (0.0%) |
| Total | 19 (100.0%) | 0 (0.0%) |
Fertility by Education in South Deerfield
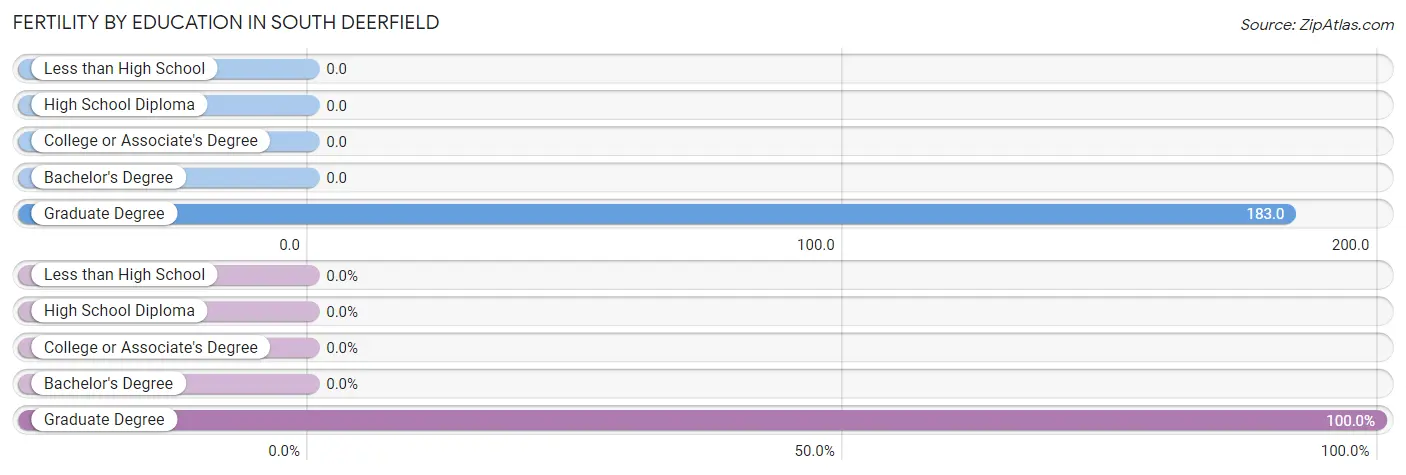
| Educational Attainment | Women with Births | Births / 1,000 Women |
| Less than High School | 0 (0.0%) | 0.0 |
| High School Diploma | 0 (0.0%) | 0.0 |
| College or Associate's Degree | 0 (0.0%) | 0.0 |
| Bachelor's Degree | 0 (0.0%) | 0.0 |
| Graduate Degree | 19 (100.0%) | 183.0 |
| Total | 19 (100.0%) | 58.0 |
Fertility by Education by Marriage Status in South Deerfield
| Educational Attainment | Married | Unmarried |
| Less than High School | 0 (0.0%) | 0 (0.0%) |
| High School Diploma | 0 (0.0%) | 0 (0.0%) |
| College or Associate's Degree | 0 (0.0%) | 0 (0.0%) |
| Bachelor's Degree | 0 (0.0%) | 0 (0.0%) |
| Graduate Degree | 19 (100.0%) | 0 (0.0%) |
| Total | 19 (100.0%) | 0 (0.0%) |
Employment Characteristics in South Deerfield
Employment by Class of Employer in South Deerfield
Among the 1,179 employed individuals in South Deerfield, private company employees (671 | 56.9%), self-employed (not incorporated) (145 | 12.3%), and self-employed (incorporated) (111 | 9.4%) make up the most common classes of employment.
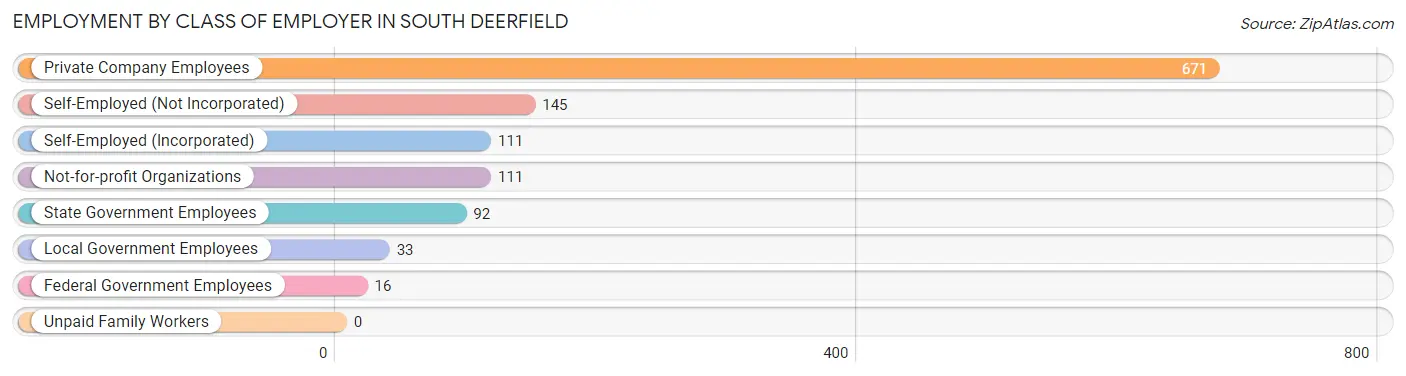
| Employer Class | # Employees | % Employees |
| Private Company Employees | 671 | 56.9% |
| Self-Employed (Incorporated) | 111 | 9.4% |
| Self-Employed (Not Incorporated) | 145 | 12.3% |
| Not-for-profit Organizations | 111 | 9.4% |
| Local Government Employees | 33 | 2.8% |
| State Government Employees | 92 | 7.8% |
| Federal Government Employees | 16 | 1.4% |
| Unpaid Family Workers | 0 | 0.0% |
| Total | 1,179 | 100.0% |
Employment Status by Age in South Deerfield
According to the labor force statistics for South Deerfield, out of the total population over 16 years of age (1,819), 68.8% or 1,251 individuals are in the labor force, with 5.8% or 73 of them unemployed. The age group with the highest labor force participation rate is 20 to 24 years, with 100.0% or 40 individuals in the labor force. Within the labor force, the 20 to 24 years age range has the highest percentage of unemployed individuals, with 62.5% or 25 of them being unemployed.
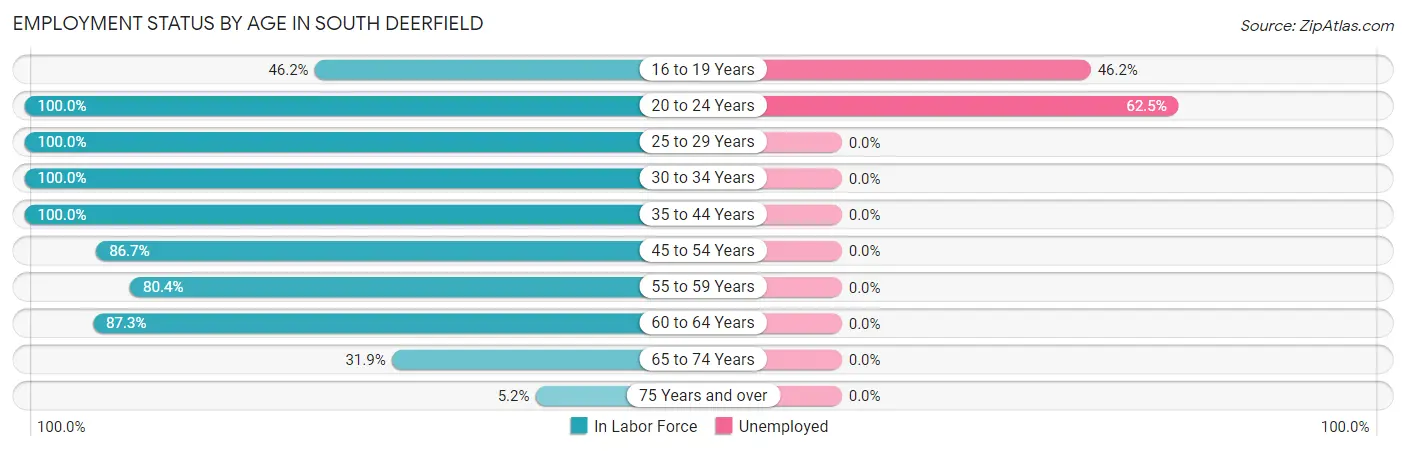
| Age Bracket | In Labor Force | Unemployed |
| 16 to 19 Years | 104 (46.2%) | 48 (46.2%) |
| 20 to 24 Years | 40 (100.0%) | 25 (62.5%) |
| 25 to 29 Years | 93 (100.0%) | 0 (0.0%) |
| 30 to 34 Years | 90 (100.0%) | 0 (0.0%) |
| 35 to 44 Years | 151 (100.0%) | 0 (0.0%) |
| 45 to 54 Years | 274 (86.7%) | 0 (0.0%) |
| 55 to 59 Years | 197 (80.4%) | 0 (0.0%) |
| 60 to 64 Years | 227 (87.3%) | 0 (0.0%) |
| 65 to 74 Years | 66 (31.9%) | 0 (0.0%) |
| 75 Years and over | 10 (5.2%) | 0 (0.0%) |
| Total | 1,251 (68.8%) | 73 (5.8%) |
Employment Status by Educational Attainment in South Deerfield
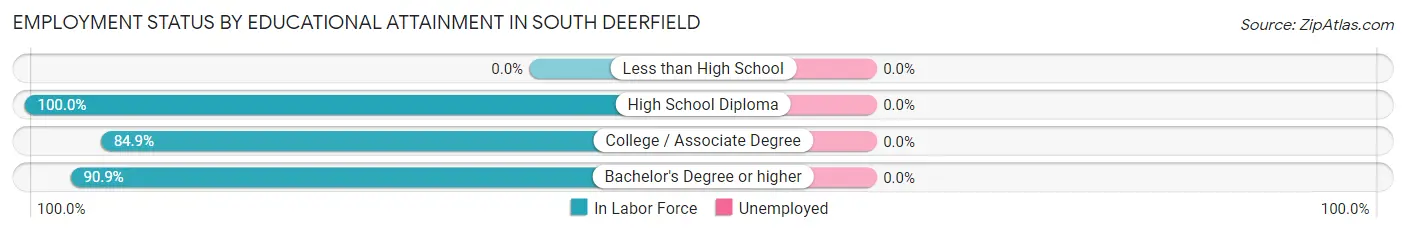
| Educational Attainment | In Labor Force | Unemployed |
| Less than High School | 0 (0.0%) | 0 (0.0%) |
| High School Diploma | 157 (100.0%) | 0 (0.0%) |
| College / Associate Degree | 457 (84.9%) | 0 (0.0%) |
| Bachelor's Degree or higher | 418 (90.9%) | 0 (0.0%) |
| Total | 1,033 (89.4%) | 0 (0.0%) |
Employment Occupations by Sex in South Deerfield
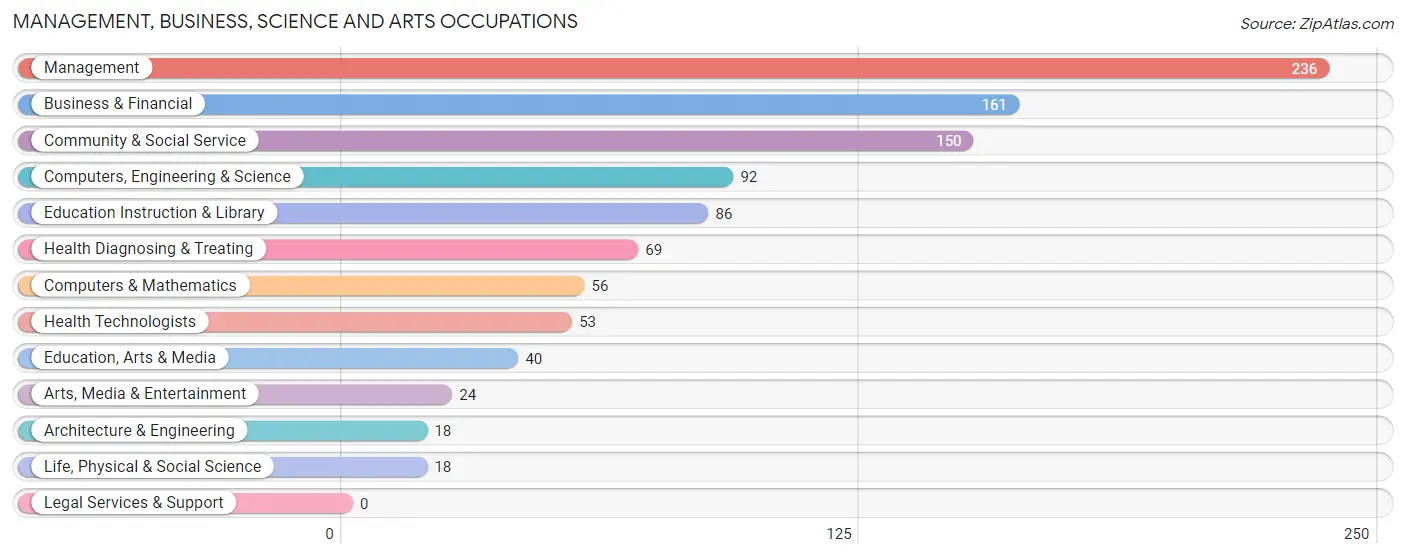
Management, Business, Science and Arts Occupations
The most common Management, Business, Science and Arts occupations in South Deerfield are Management (236 | 20.0%), Business & Financial (161 | 13.7%), Community & Social Service (150 | 12.7%), Computers, Engineering & Science (92 | 7.8%), and Education Instruction & Library (86 | 7.3%).
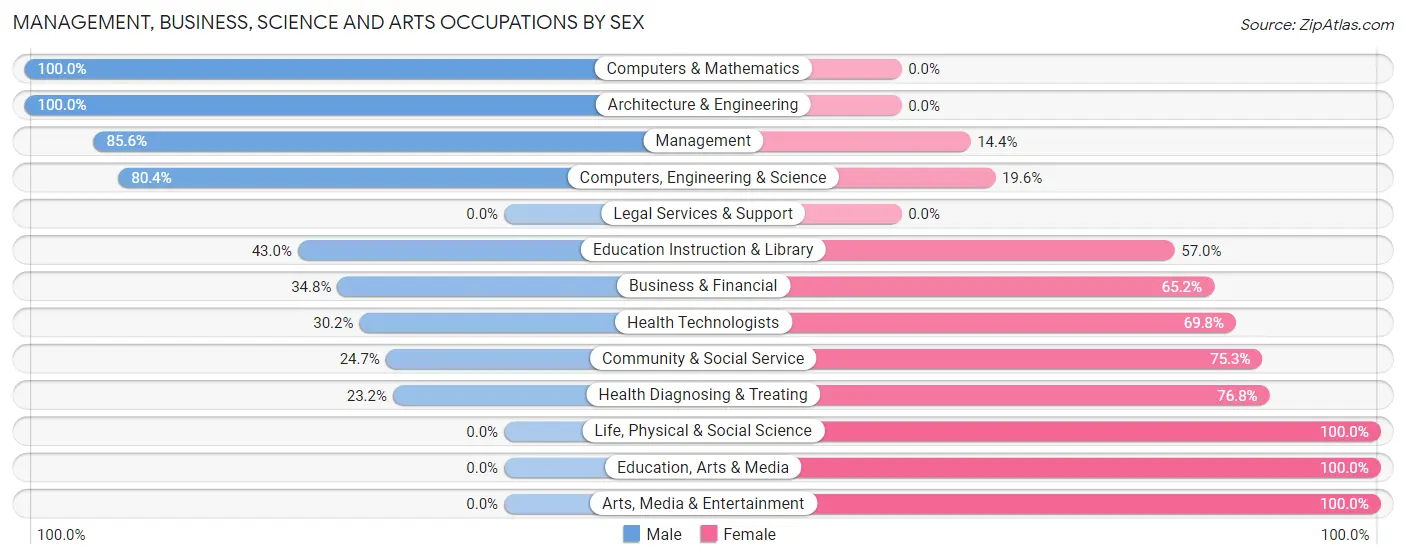
Management, Business, Science and Arts Occupations by Sex
Within the Management, Business, Science and Arts occupations in South Deerfield, the most male-oriented occupations are Computers & Mathematics (100.0%), Architecture & Engineering (100.0%), and Management (85.6%), while the most female-oriented occupations are Life, Physical & Social Science (100.0%), Education, Arts & Media (100.0%), and Arts, Media & Entertainment (100.0%).
| Occupation | Male | Female |
| Management | 202 (85.6%) | 34 (14.4%) |
| Business & Financial | 56 (34.8%) | 105 (65.2%) |
| Computers, Engineering & Science | 74 (80.4%) | 18 (19.6%) |
| Computers & Mathematics | 56 (100.0%) | 0 (0.0%) |
| Architecture & Engineering | 18 (100.0%) | 0 (0.0%) |
| Life, Physical & Social Science | 0 (0.0%) | 18 (100.0%) |
| Community & Social Service | 37 (24.7%) | 113 (75.3%) |
| Education, Arts & Media | 0 (0.0%) | 40 (100.0%) |
| Legal Services & Support | 0 (0.0%) | 0 (0.0%) |
| Education Instruction & Library | 37 (43.0%) | 49 (57.0%) |
| Arts, Media & Entertainment | 0 (0.0%) | 24 (100.0%) |
| Health Diagnosing & Treating | 16 (23.2%) | 53 (76.8%) |
| Health Technologists | 16 (30.2%) | 37 (69.8%) |
| Total (Category) | 385 (54.4%) | 323 (45.6%) |
| Total (Overall) | 552 (46.8%) | 627 (53.2%) |
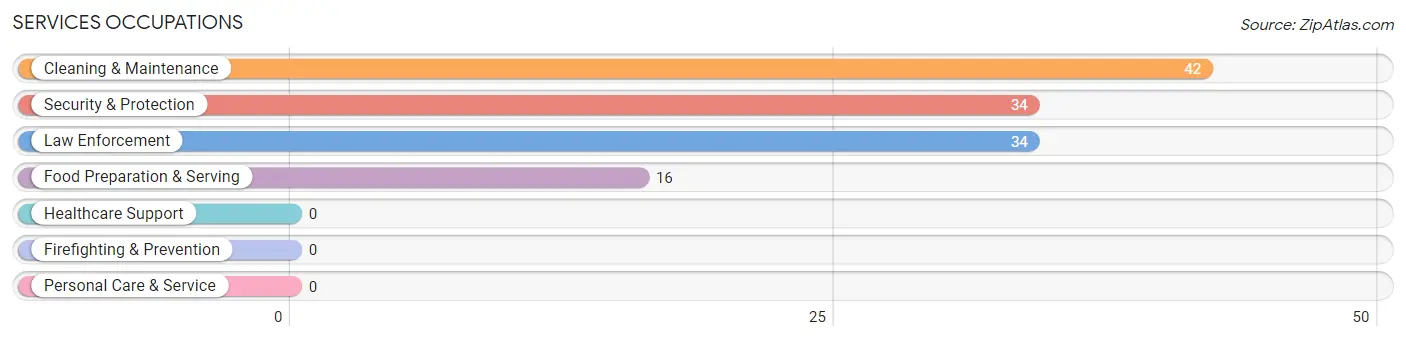
Services Occupations
The most common Services occupations in South Deerfield are Cleaning & Maintenance (42 | 3.6%), Security & Protection (34 | 2.9%), Law Enforcement (34 | 2.9%), and Food Preparation & Serving (16 | 1.4%).
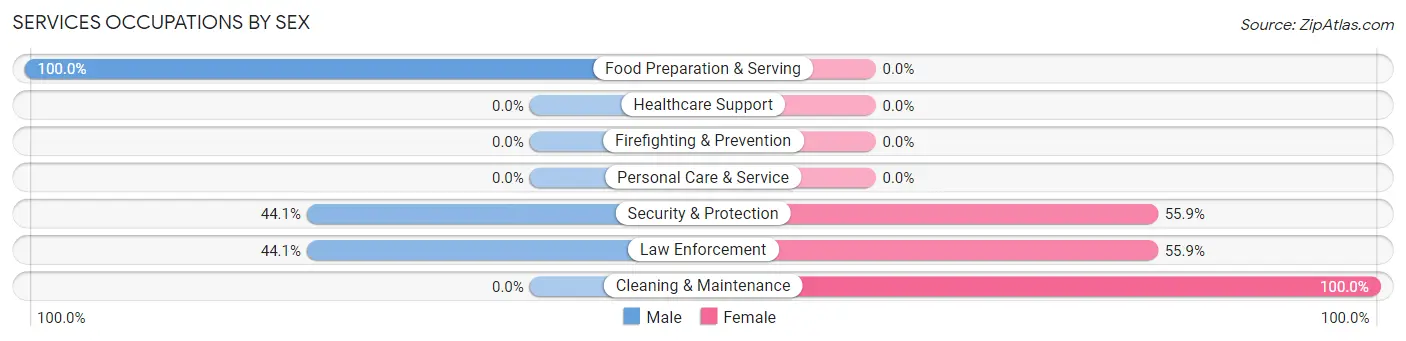
Services Occupations by Sex
Within the Services occupations in South Deerfield, the most male-oriented occupations are Food Preparation & Serving (100.0%), Security & Protection (44.1%), and Law Enforcement (44.1%), while the most female-oriented occupations are Cleaning & Maintenance (100.0%), Security & Protection (55.9%), and Law Enforcement (55.9%).
| Occupation | Male | Female |
| Healthcare Support | 0 (0.0%) | 0 (0.0%) |
| Security & Protection | 15 (44.1%) | 19 (55.9%) |
| Firefighting & Prevention | 0 (0.0%) | 0 (0.0%) |
| Law Enforcement | 15 (44.1%) | 19 (55.9%) |
| Food Preparation & Serving | 16 (100.0%) | 0 (0.0%) |
| Cleaning & Maintenance | 0 (0.0%) | 42 (100.0%) |
| Personal Care & Service | 0 (0.0%) | 0 (0.0%) |
| Total (Category) | 31 (33.7%) | 61 (66.3%) |
| Total (Overall) | 552 (46.8%) | 627 (53.2%) |
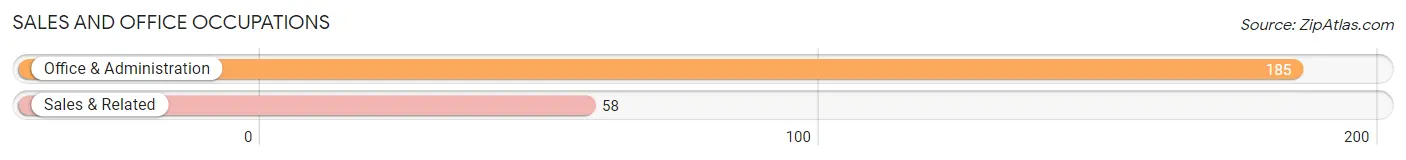
Sales and Office Occupations
The most common Sales and Office occupations in South Deerfield are Office & Administration (185 | 15.7%), and Sales & Related (58 | 4.9%).
Sales and Office Occupations by Sex
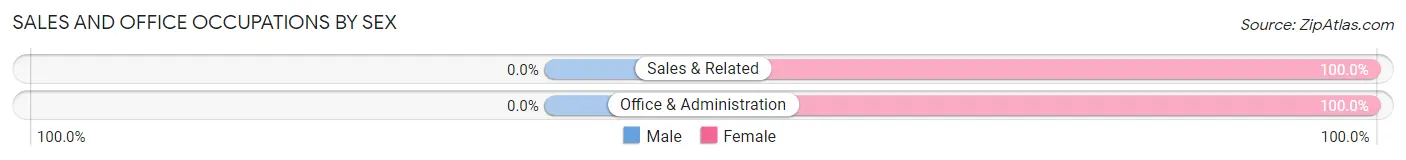
| Occupation | Male | Female |
| Sales & Related | 0 (0.0%) | 58 (100.0%) |
| Office & Administration | 0 (0.0%) | 185 (100.0%) |
| Total (Category) | 0 (0.0%) | 243 (100.0%) |
| Total (Overall) | 552 (46.8%) | 627 (53.2%) |
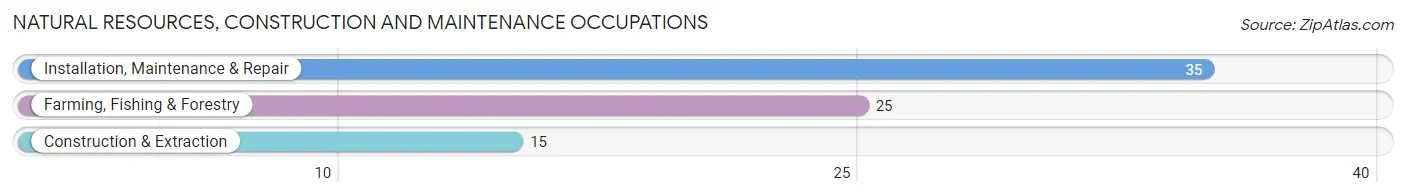
Natural Resources, Construction and Maintenance Occupations
The most common Natural Resources, Construction and Maintenance occupations in South Deerfield are Installation, Maintenance & Repair (35 | 3.0%), Farming, Fishing & Forestry (25 | 2.1%), and Construction & Extraction (15 | 1.3%).
Natural Resources, Construction and Maintenance Occupations by Sex
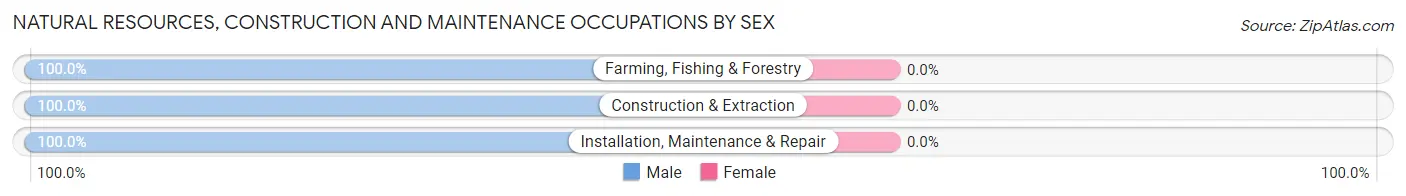
| Occupation | Male | Female |
| Farming, Fishing & Forestry | 25 (100.0%) | 0 (0.0%) |
| Construction & Extraction | 15 (100.0%) | 0 (0.0%) |
| Installation, Maintenance & Repair | 35 (100.0%) | 0 (0.0%) |
| Total (Category) | 75 (100.0%) | 0 (0.0%) |
| Total (Overall) | 552 (46.8%) | 627 (53.2%) |
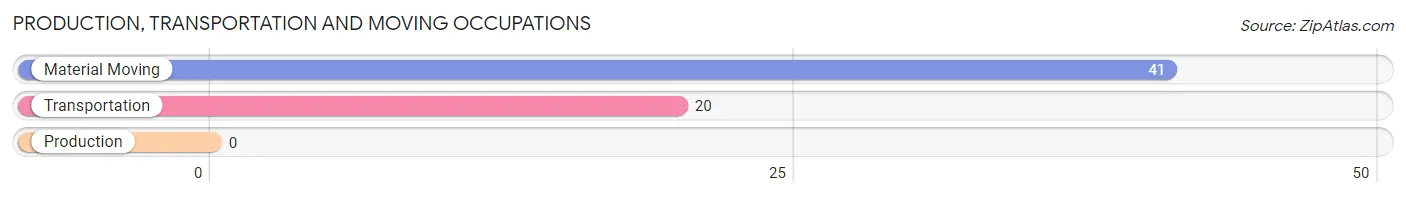
Production, Transportation and Moving Occupations
The most common Production, Transportation and Moving occupations in South Deerfield are Material Moving (41 | 3.5%), and Transportation (20 | 1.7%).
Production, Transportation and Moving Occupations by Sex
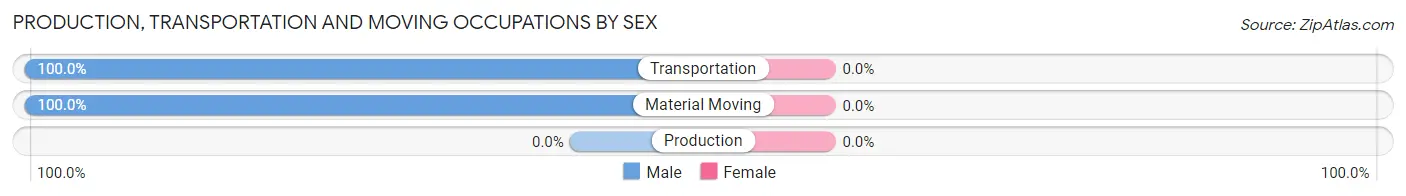
| Occupation | Male | Female |
| Production | 0 (0.0%) | 0 (0.0%) |
| Transportation | 20 (100.0%) | 0 (0.0%) |
| Material Moving | 41 (100.0%) | 0 (0.0%) |
| Total (Category) | 61 (100.0%) | 0 (0.0%) |
| Total (Overall) | 552 (46.8%) | 627 (53.2%) |
Employment Industries by Sex in South Deerfield
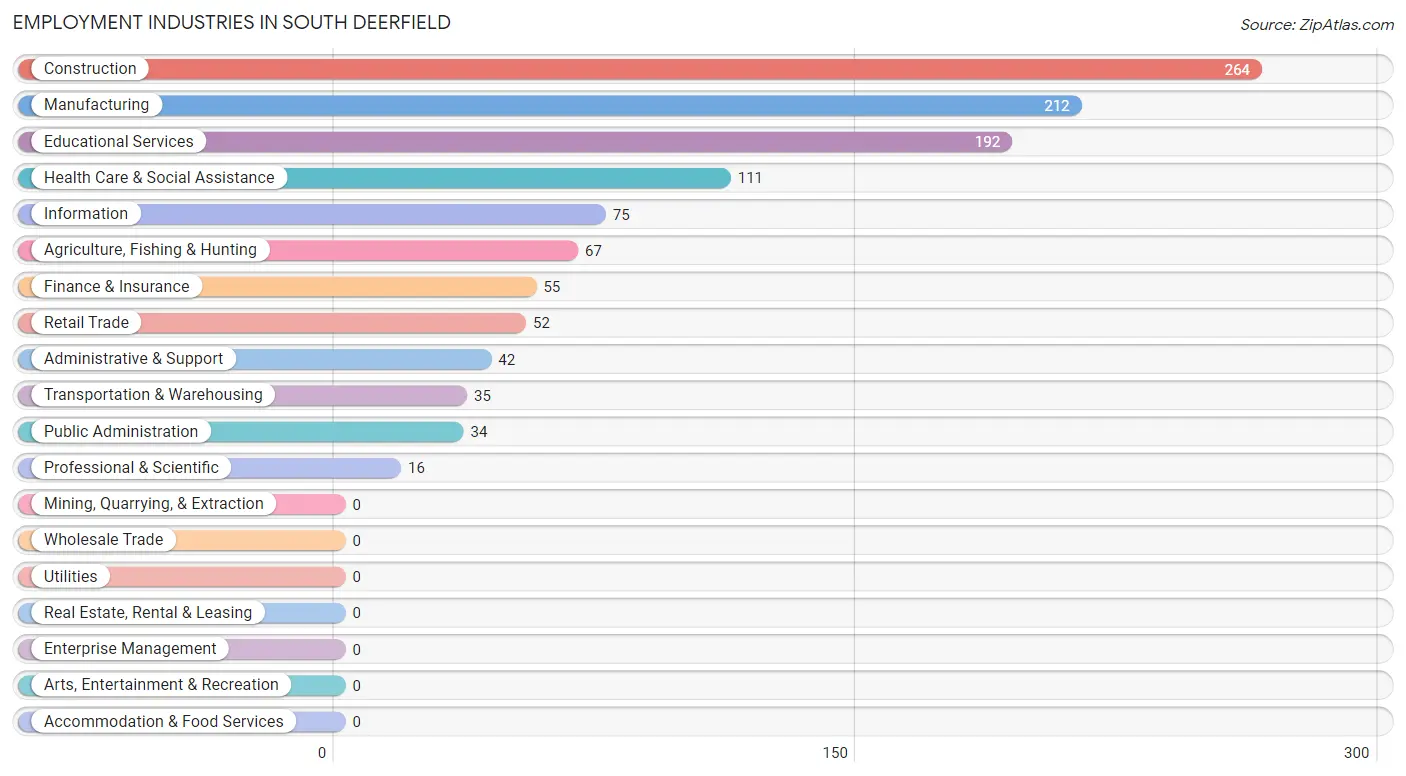
Employment Industries in South Deerfield
The major employment industries in South Deerfield include Construction (264 | 22.4%), Manufacturing (212 | 18.0%), Educational Services (192 | 16.3%), Health Care & Social Assistance (111 | 9.4%), and Information (75 | 6.4%).
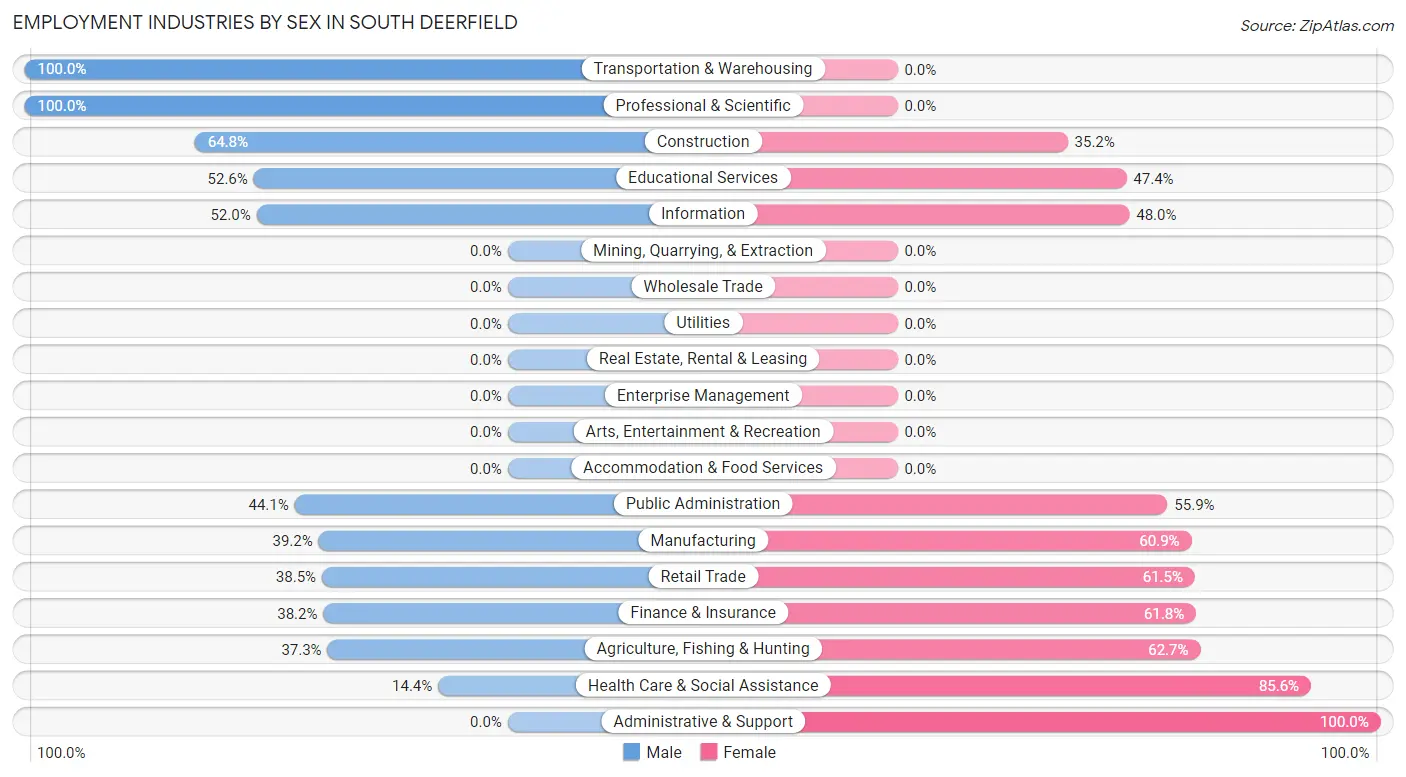
Employment Industries by Sex in South Deerfield
The South Deerfield industries that see more men than women are Transportation & Warehousing (100.0%), Professional & Scientific (100.0%), and Construction (64.8%), whereas the industries that tend to have a higher number of women are Administrative & Support (100.0%), Health Care & Social Assistance (85.6%), and Agriculture, Fishing & Hunting (62.7%).
| Industry | Male | Female |
| Agriculture, Fishing & Hunting | 25 (37.3%) | 42 (62.7%) |
| Mining, Quarrying, & Extraction | 0 (0.0%) | 0 (0.0%) |
| Construction | 171 (64.8%) | 93 (35.2%) |
| Manufacturing | 83 (39.2%) | 129 (60.9%) |
| Wholesale Trade | 0 (0.0%) | 0 (0.0%) |
| Retail Trade | 20 (38.5%) | 32 (61.5%) |
| Transportation & Warehousing | 35 (100.0%) | 0 (0.0%) |
| Utilities | 0 (0.0%) | 0 (0.0%) |
| Information | 39 (52.0%) | 36 (48.0%) |
| Finance & Insurance | 21 (38.2%) | 34 (61.8%) |
| Real Estate, Rental & Leasing | 0 (0.0%) | 0 (0.0%) |
| Professional & Scientific | 16 (100.0%) | 0 (0.0%) |
| Enterprise Management | 0 (0.0%) | 0 (0.0%) |
| Administrative & Support | 0 (0.0%) | 42 (100.0%) |
| Educational Services | 101 (52.6%) | 91 (47.4%) |
| Health Care & Social Assistance | 16 (14.4%) | 95 (85.6%) |
| Arts, Entertainment & Recreation | 0 (0.0%) | 0 (0.0%) |
| Accommodation & Food Services | 0 (0.0%) | 0 (0.0%) |
| Public Administration | 15 (44.1%) | 19 (55.9%) |
| Total | 552 (46.8%) | 627 (53.2%) |
Education in South Deerfield
School Enrollment in South Deerfield
The most common levels of schooling among the 398 students in South Deerfield are high school (202 | 50.7%), middle school (88 | 22.1%), and college / undergraduate (63 | 15.8%).
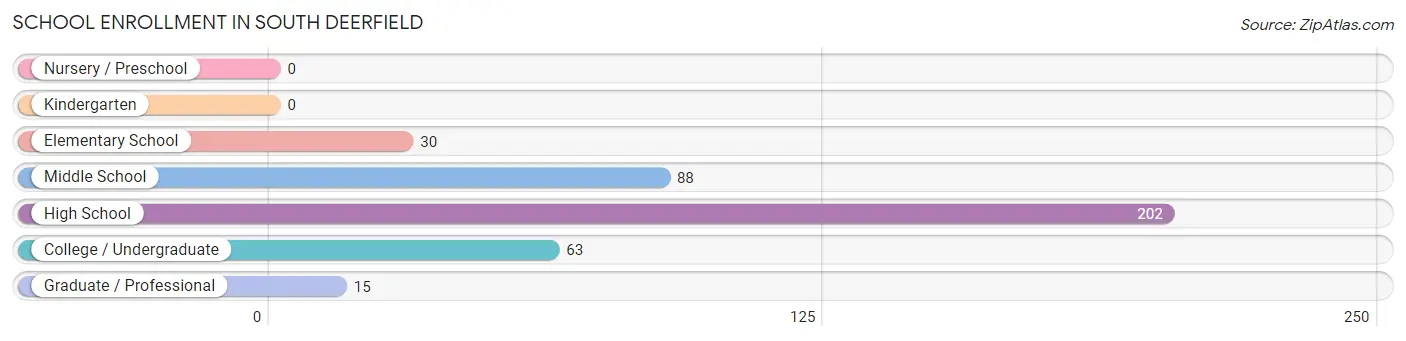
| School Level | # Students | % Students |
| Nursery / Preschool | 0 | 0.0% |
| Kindergarten | 0 | 0.0% |
| Elementary School | 30 | 7.5% |
| Middle School | 88 | 22.1% |
| High School | 202 | 50.7% |
| College / Undergraduate | 63 | 15.8% |
| Graduate / Professional | 15 | 3.8% |
| Total | 398 | 100.0% |
School Enrollment by Age by Funding Source in South Deerfield
Out of a total of 398 students who are enrolled in schools in South Deerfield, 76 (19.1%) attend a private institution, while the remaining 322 (80.9%) are enrolled in public schools. The age group of 18 to 19 year olds has the highest likelihood of being enrolled in private schools, with 26 (100.0% in the age bracket) enrolled. Conversely, the age group of 5 to 9 year old has the lowest likelihood of being enrolled in a private school, with 16 (100.0% in the age bracket) attending a public institution.
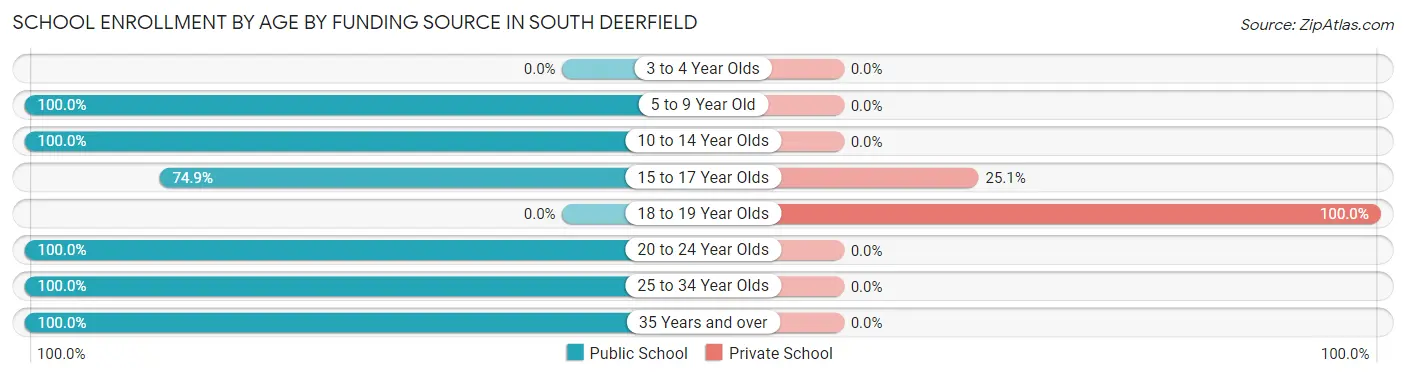
| Age Bracket | Public School | Private School |
| 3 to 4 Year Olds | 0 (0.0%) | 0 (0.0%) |
| 5 to 9 Year Old | 16 (100.0%) | 0 (0.0%) |
| 10 to 14 Year Olds | 102 (100.0%) | 0 (0.0%) |
| 15 to 17 Year Olds | 149 (74.9%) | 50 (25.1%) |
| 18 to 19 Year Olds | 0 (0.0%) | 26 (100.0%) |
| 20 to 24 Year Olds | 25 (100.0%) | 0 (0.0%) |
| 25 to 34 Year Olds | 15 (100.0%) | 0 (0.0%) |
| 35 Years and over | 15 (100.0%) | 0 (0.0%) |
| Total | 322 (80.9%) | 76 (19.1%) |
Educational Attainment by Field of Study in South Deerfield
Arts & humanities (100 | 14.6%), bio, nature & agricultural (89 | 13.0%), social sciences (77 | 11.2%), computers & mathematics (76 | 11.1%), and business (69 | 10.0%) are the most common fields of study among 687 individuals in South Deerfield who have obtained a bachelor's degree or higher.
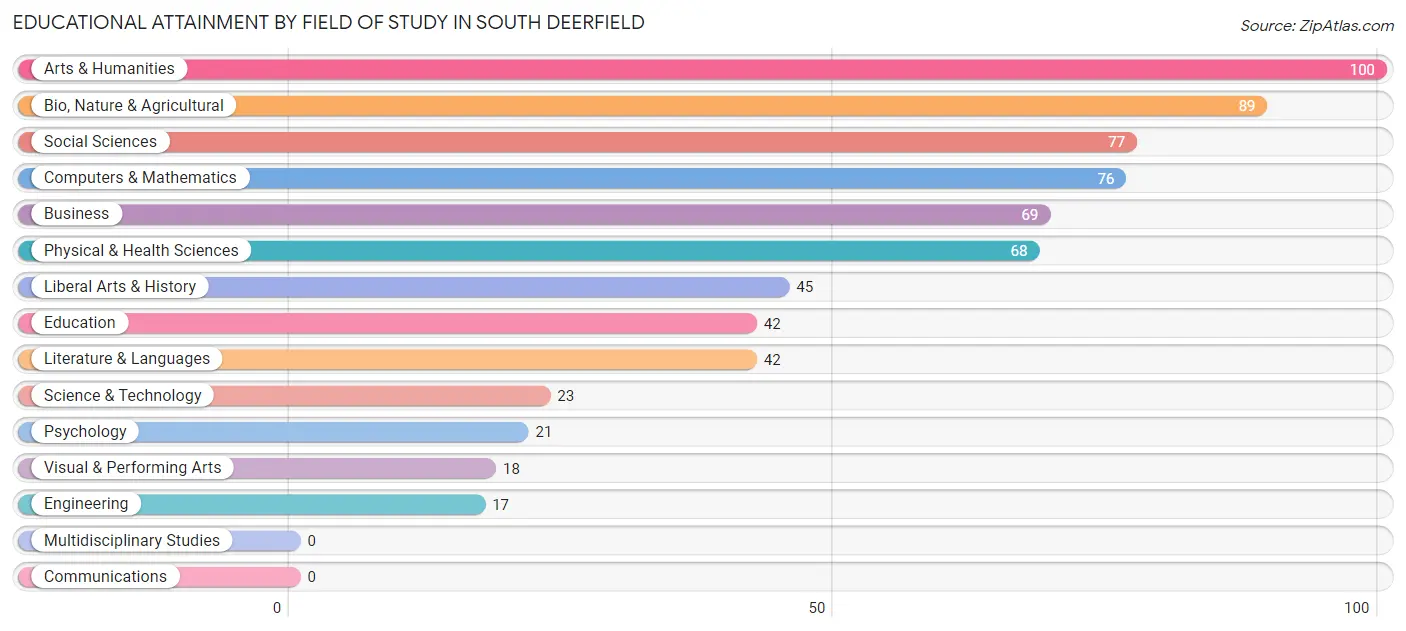
| Field of Study | # Graduates | % Graduates |
| Computers & Mathematics | 76 | 11.1% |
| Bio, Nature & Agricultural | 89 | 13.0% |
| Physical & Health Sciences | 68 | 9.9% |
| Psychology | 21 | 3.1% |
| Social Sciences | 77 | 11.2% |
| Engineering | 17 | 2.5% |
| Multidisciplinary Studies | 0 | 0.0% |
| Science & Technology | 23 | 3.4% |
| Business | 69 | 10.0% |
| Education | 42 | 6.1% |
| Literature & Languages | 42 | 6.1% |
| Liberal Arts & History | 45 | 6.6% |
| Visual & Performing Arts | 18 | 2.6% |
| Communications | 0 | 0.0% |
| Arts & Humanities | 100 | 14.6% |
| Total | 687 | 100.0% |
Transportation & Commute in South Deerfield
Vehicle Availability by Sex in South Deerfield
The most prevalent vehicle ownership categories in South Deerfield are males with 2 vehicles (311, accounting for 56.3%) and females with 2 vehicles (306, making up 49.6%).
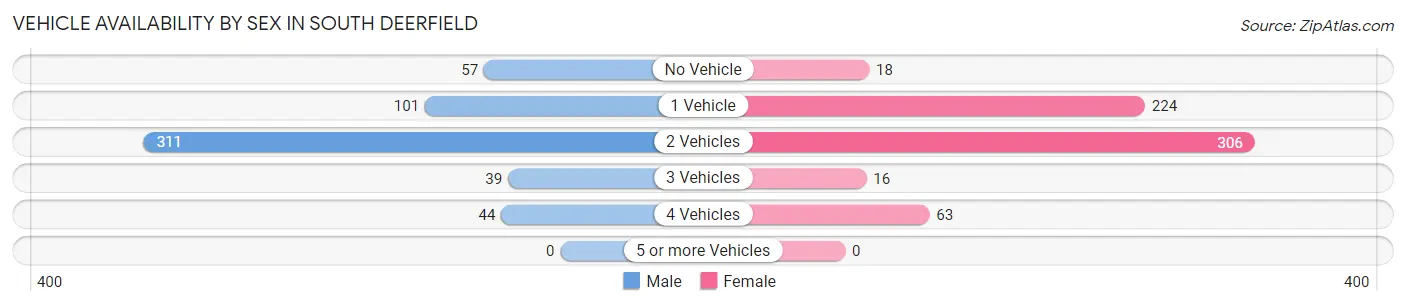
| Vehicles Available | Male | Female |
| No Vehicle | 57 (10.3%) | 18 (2.9%) |
| 1 Vehicle | 101 (18.3%) | 224 (35.7%) |
| 2 Vehicles | 311 (56.3%) | 306 (48.8%) |
| 3 Vehicles | 39 (7.1%) | 16 (2.5%) |
| 4 Vehicles | 44 (8.0%) | 63 (10.1%) |
| 5 or more Vehicles | 0 (0.0%) | 0 (0.0%) |
| Total | 552 (100.0%) | 627 (100.0%) |
Commute Time in South Deerfield
The most frequently occuring commute durations in South Deerfield are 5 to 9 minutes (266 commuters, 26.0%), 20 to 24 minutes (224 commuters, 21.9%), and less than 5 minutes (208 commuters, 20.3%).
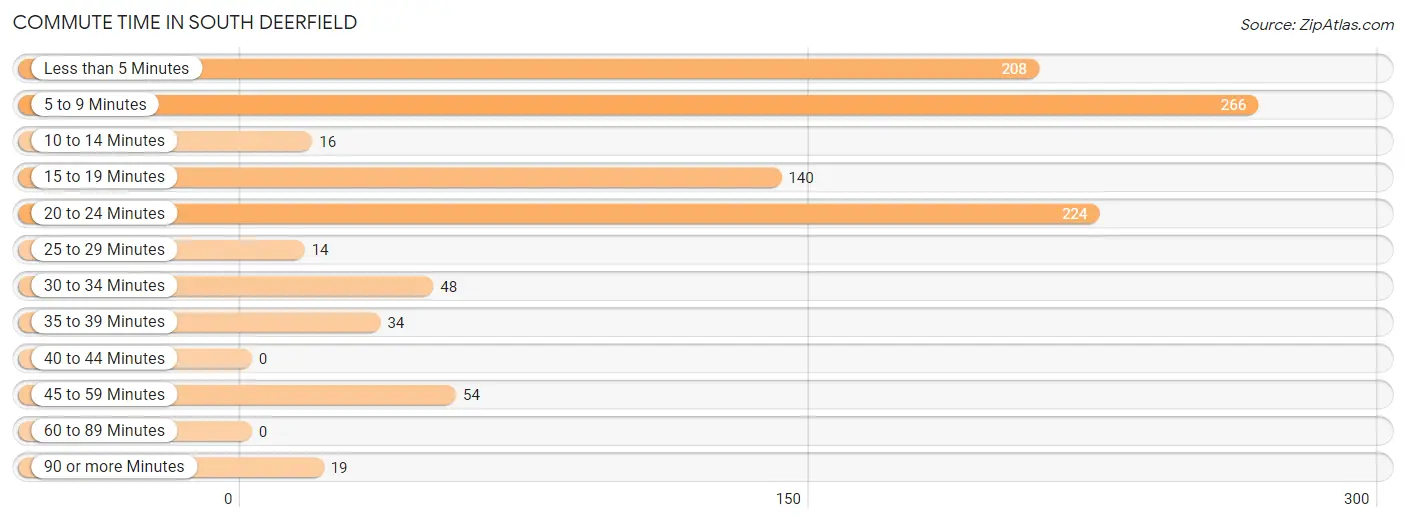
| Commute Time | # Commuters | % Commuters |
| Less than 5 Minutes | 208 | 20.3% |
| 5 to 9 Minutes | 266 | 26.0% |
| 10 to 14 Minutes | 16 | 1.6% |
| 15 to 19 Minutes | 140 | 13.7% |
| 20 to 24 Minutes | 224 | 21.9% |
| 25 to 29 Minutes | 14 | 1.4% |
| 30 to 34 Minutes | 48 | 4.7% |
| 35 to 39 Minutes | 34 | 3.3% |
| 40 to 44 Minutes | 0 | 0.0% |
| 45 to 59 Minutes | 54 | 5.3% |
| 60 to 89 Minutes | 0 | 0.0% |
| 90 or more Minutes | 19 | 1.9% |
Commute Time by Sex in South Deerfield
The most common commute times in South Deerfield are 20 to 24 minutes (182 commuters, 39.7%) for males and less than 5 minutes (160 commuters, 28.4%) for females.
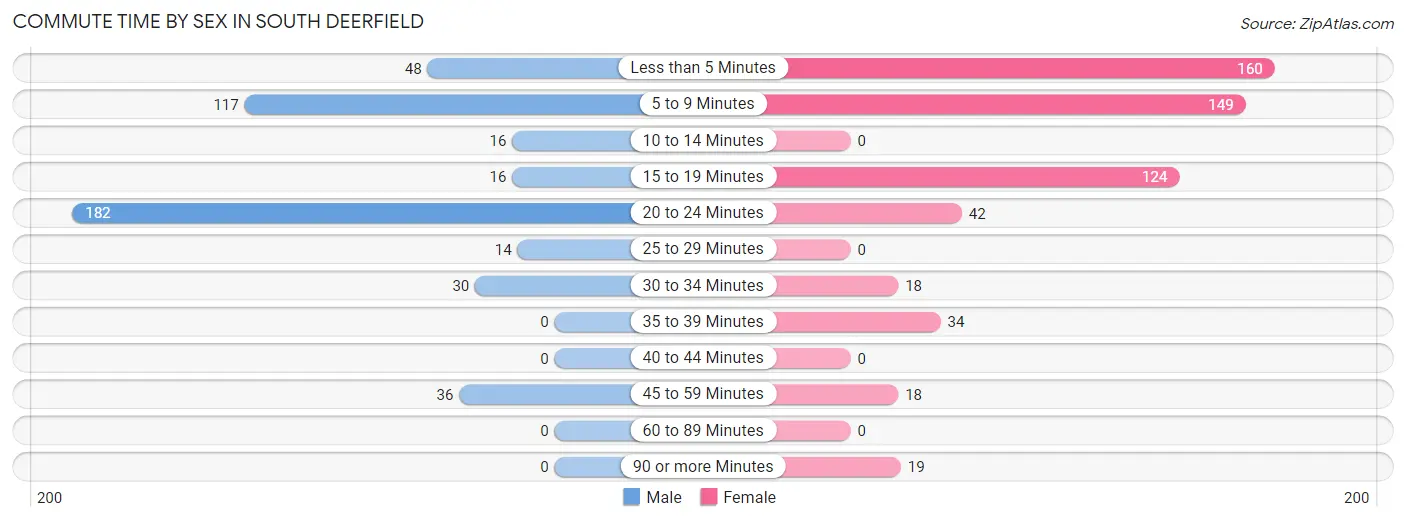
| Commute Time | Male | Female |
| Less than 5 Minutes | 48 (10.5%) | 160 (28.4%) |
| 5 to 9 Minutes | 117 (25.5%) | 149 (26.4%) |
| 10 to 14 Minutes | 16 (3.5%) | 0 (0.0%) |
| 15 to 19 Minutes | 16 (3.5%) | 124 (22.0%) |
| 20 to 24 Minutes | 182 (39.7%) | 42 (7.4%) |
| 25 to 29 Minutes | 14 (3.0%) | 0 (0.0%) |
| 30 to 34 Minutes | 30 (6.5%) | 18 (3.2%) |
| 35 to 39 Minutes | 0 (0.0%) | 34 (6.0%) |
| 40 to 44 Minutes | 0 (0.0%) | 0 (0.0%) |
| 45 to 59 Minutes | 36 (7.8%) | 18 (3.2%) |
| 60 to 89 Minutes | 0 (0.0%) | 0 (0.0%) |
| 90 or more Minutes | 0 (0.0%) | 19 (3.4%) |
Time of Departure to Work by Sex in South Deerfield
The most frequent times of departure to work in South Deerfield are 8:00 AM to 8:29 AM (124, 27.0%) for males and 6:00 AM to 6:29 AM (170, 30.1%) for females.
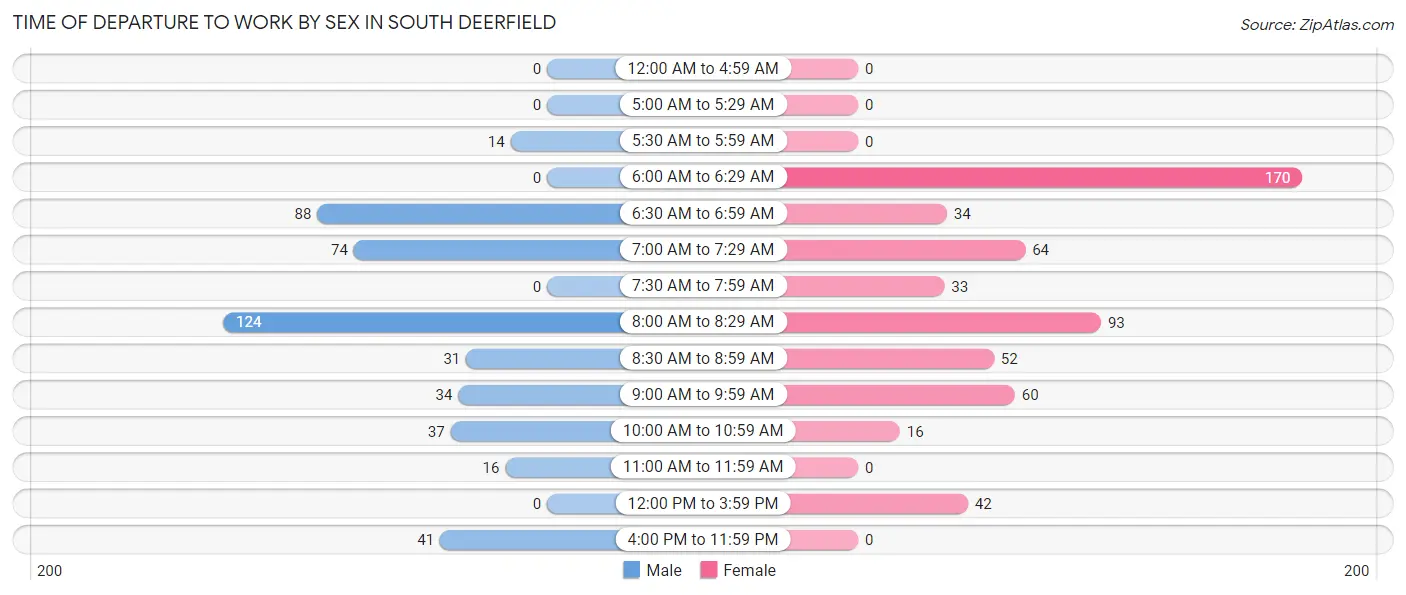
| Time of Departure | Male | Female |
| 12:00 AM to 4:59 AM | 0 (0.0%) | 0 (0.0%) |
| 5:00 AM to 5:29 AM | 0 (0.0%) | 0 (0.0%) |
| 5:30 AM to 5:59 AM | 14 (3.0%) | 0 (0.0%) |
| 6:00 AM to 6:29 AM | 0 (0.0%) | 170 (30.1%) |
| 6:30 AM to 6:59 AM | 88 (19.2%) | 34 (6.0%) |
| 7:00 AM to 7:29 AM | 74 (16.1%) | 64 (11.4%) |
| 7:30 AM to 7:59 AM | 0 (0.0%) | 33 (5.9%) |
| 8:00 AM to 8:29 AM | 124 (27.0%) | 93 (16.5%) |
| 8:30 AM to 8:59 AM | 31 (6.8%) | 52 (9.2%) |
| 9:00 AM to 9:59 AM | 34 (7.4%) | 60 (10.6%) |
| 10:00 AM to 10:59 AM | 37 (8.1%) | 16 (2.8%) |
| 11:00 AM to 11:59 AM | 16 (3.5%) | 0 (0.0%) |
| 12:00 PM to 3:59 PM | 0 (0.0%) | 42 (7.4%) |
| 4:00 PM to 11:59 PM | 41 (8.9%) | 0 (0.0%) |
| Total | 459 (100.0%) | 564 (100.0%) |
Housing Occupancy in South Deerfield
Occupancy by Ownership in South Deerfield
Of the total 1,003 dwellings in South Deerfield, owner-occupied units account for 660 (65.8%), while renter-occupied units make up 343 (34.2%).
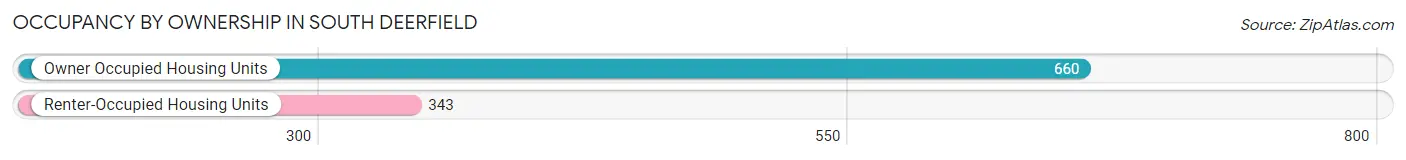
| Occupancy | # Housing Units | % Housing Units |
| Owner Occupied Housing Units | 660 | 65.8% |
| Renter-Occupied Housing Units | 343 | 34.2% |
| Total Occupied Housing Units | 1,003 | 100.0% |
Occupancy by Household Size in South Deerfield
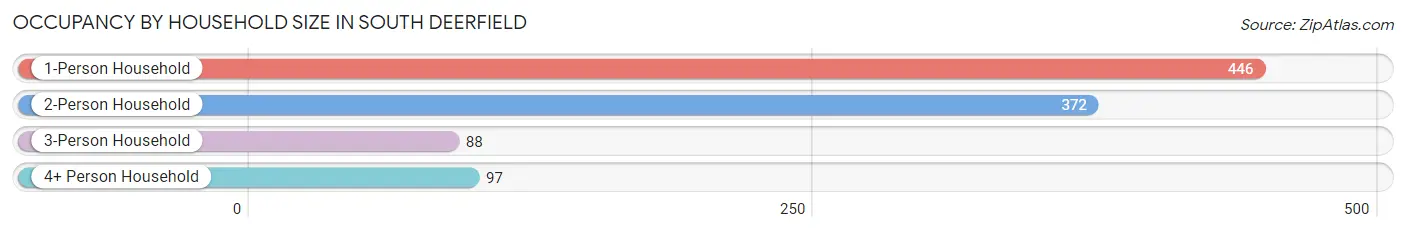
| Household Size | # Housing Units | % Housing Units |
| 1-Person Household | 446 | 44.5% |
| 2-Person Household | 372 | 37.1% |
| 3-Person Household | 88 | 8.8% |
| 4+ Person Household | 97 | 9.7% |
| Total Housing Units | 1,003 | 100.0% |
Occupancy by Ownership by Household Size in South Deerfield
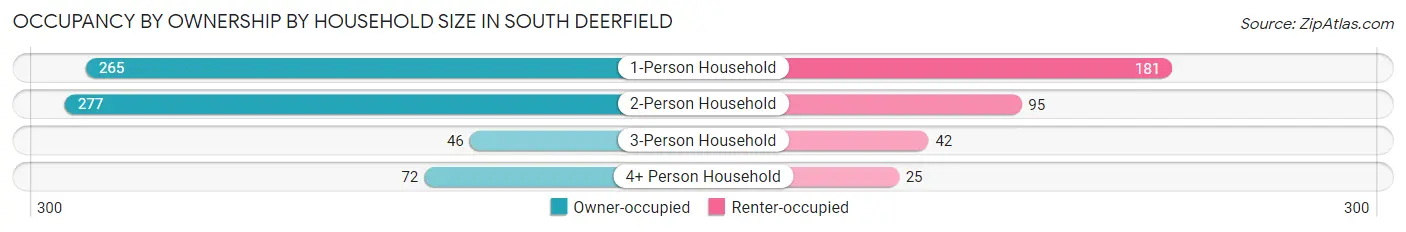
| Household Size | Owner-occupied | Renter-occupied |
| 1-Person Household | 265 (59.4%) | 181 (40.6%) |
| 2-Person Household | 277 (74.5%) | 95 (25.5%) |
| 3-Person Household | 46 (52.3%) | 42 (47.7%) |
| 4+ Person Household | 72 (74.2%) | 25 (25.8%) |
| Total Housing Units | 660 (65.8%) | 343 (34.2%) |
Occupancy by Educational Attainment in South Deerfield
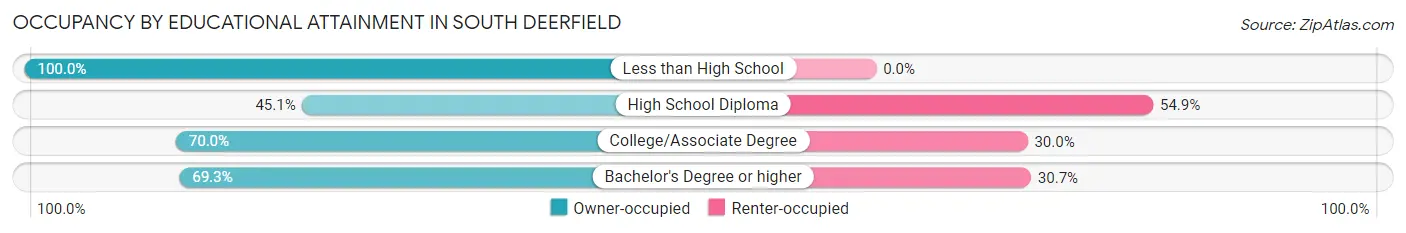
| Household Size | Owner-occupied | Renter-occupied |
| Less than High School | 37 (100.0%) | 0 (0.0%) |
| High School Diploma | 92 (45.1%) | 112 (54.9%) |
| College/Associate Degree | 287 (70.0%) | 123 (30.0%) |
| Bachelor's Degree or higher | 244 (69.3%) | 108 (30.7%) |
Occupancy by Age of Householder in South Deerfield
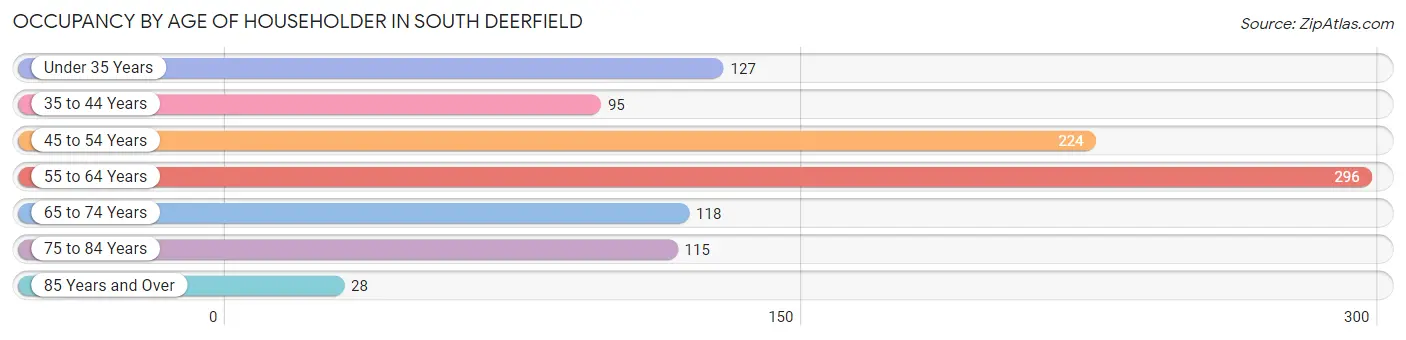
| Age Bracket | # Households | % Households |
| Under 35 Years | 127 | 12.7% |
| 35 to 44 Years | 95 | 9.5% |
| 45 to 54 Years | 224 | 22.3% |
| 55 to 64 Years | 296 | 29.5% |
| 65 to 74 Years | 118 | 11.8% |
| 75 to 84 Years | 115 | 11.5% |
| 85 Years and Over | 28 | 2.8% |
| Total | 1,003 | 100.0% |
Housing Finances in South Deerfield
Median Income by Occupancy in South Deerfield
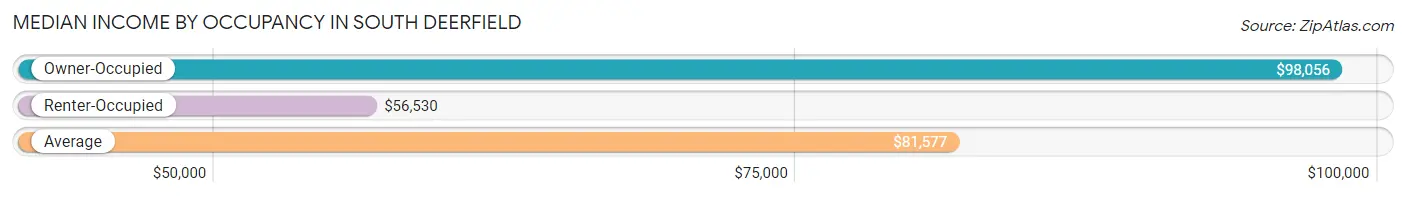
| Occupancy Type | # Households | Median Income |
| Owner-Occupied | 660 (65.8%) | $98,056 |
| Renter-Occupied | 343 (34.2%) | $56,530 |
| Average | 1,003 (100.0%) | $81,577 |
Occupancy by Householder Income Bracket in South Deerfield
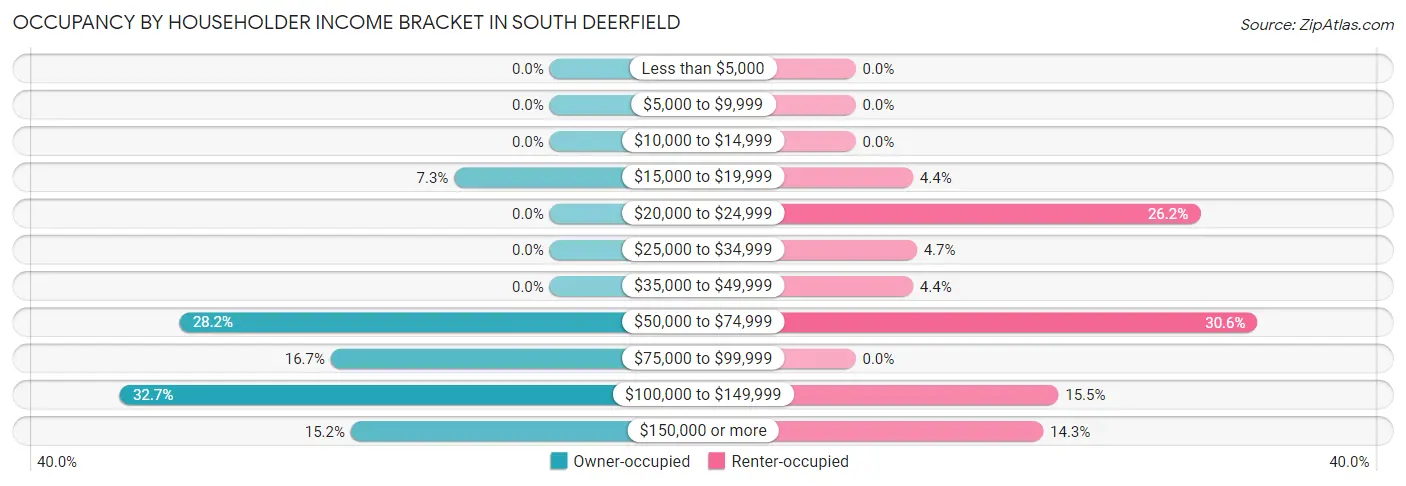
| Income Bracket | Owner-occupied | Renter-occupied |
| Less than $5,000 | 0 (0.0%) | 0 (0.0%) |
| $5,000 to $9,999 | 0 (0.0%) | 0 (0.0%) |
| $10,000 to $14,999 | 0 (0.0%) | 0 (0.0%) |
| $15,000 to $19,999 | 48 (7.3%) | 15 (4.4%) |
| $20,000 to $24,999 | 0 (0.0%) | 90 (26.2%) |
| $25,000 to $34,999 | 0 (0.0%) | 16 (4.7%) |
| $35,000 to $49,999 | 0 (0.0%) | 15 (4.4%) |
| $50,000 to $74,999 | 186 (28.2%) | 105 (30.6%) |
| $75,000 to $99,999 | 110 (16.7%) | 0 (0.0%) |
| $100,000 to $149,999 | 216 (32.7%) | 53 (15.4%) |
| $150,000 or more | 100 (15.1%) | 49 (14.3%) |
| Total | 660 (100.0%) | 343 (100.0%) |
Monthly Housing Cost Tiers in South Deerfield
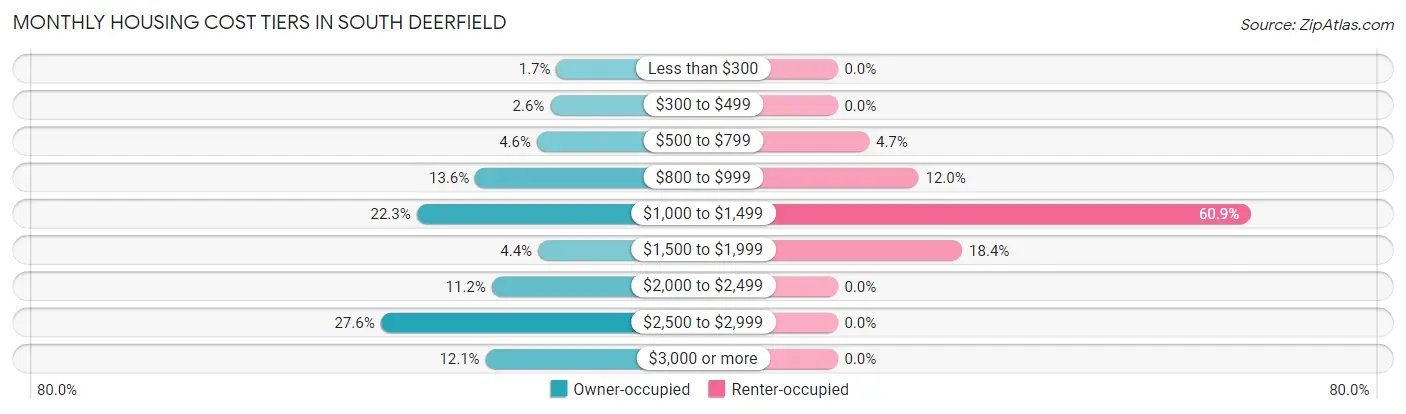
| Monthly Cost | Owner-occupied | Renter-occupied |
| Less than $300 | 11 (1.7%) | 0 (0.0%) |
| $300 to $499 | 17 (2.6%) | 0 (0.0%) |
| $500 to $799 | 30 (4.5%) | 16 (4.7%) |
| $800 to $999 | 90 (13.6%) | 41 (11.9%) |
| $1,000 to $1,499 | 147 (22.3%) | 209 (60.9%) |
| $1,500 to $1,999 | 29 (4.4%) | 63 (18.4%) |
| $2,000 to $2,499 | 74 (11.2%) | 0 (0.0%) |
| $2,500 to $2,999 | 182 (27.6%) | 0 (0.0%) |
| $3,000 or more | 80 (12.1%) | 0 (0.0%) |
| Total | 660 (100.0%) | 343 (100.0%) |
Physical Housing Characteristics in South Deerfield
Housing Structures in South Deerfield
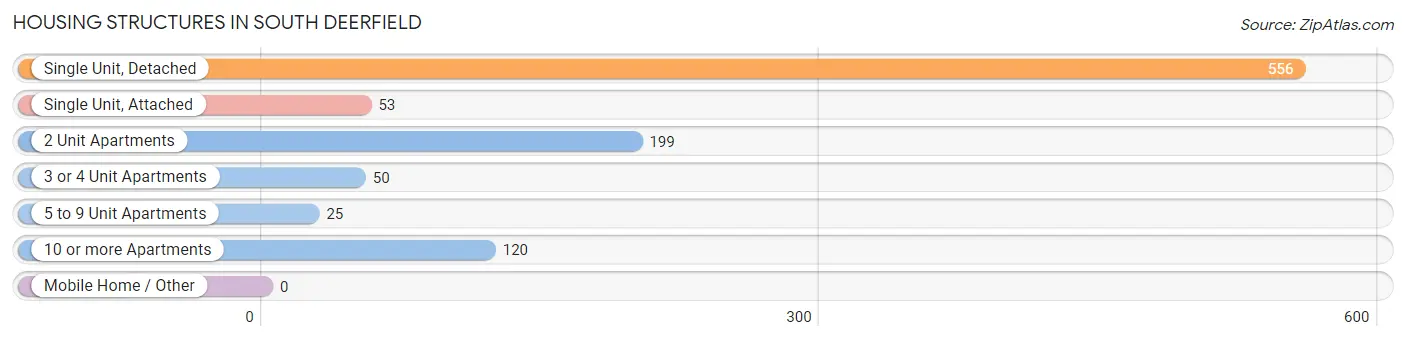
| Structure Type | # Housing Units | % Housing Units |
| Single Unit, Detached | 556 | 55.4% |
| Single Unit, Attached | 53 | 5.3% |
| 2 Unit Apartments | 199 | 19.8% |
| 3 or 4 Unit Apartments | 50 | 5.0% |
| 5 to 9 Unit Apartments | 25 | 2.5% |
| 10 or more Apartments | 120 | 12.0% |
| Mobile Home / Other | 0 | 0.0% |
| Total | 1,003 | 100.0% |
Housing Structures by Occupancy in South Deerfield
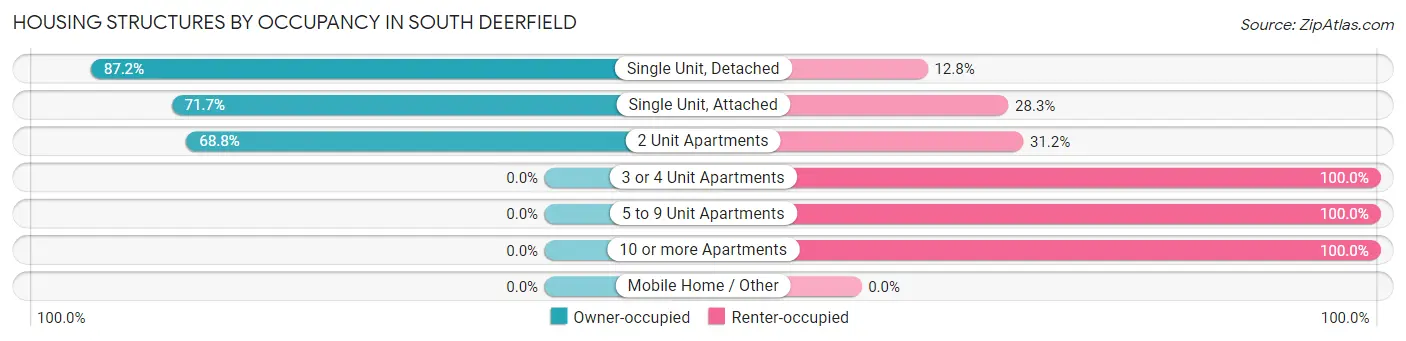
| Structure Type | Owner-occupied | Renter-occupied |
| Single Unit, Detached | 485 (87.2%) | 71 (12.8%) |
| Single Unit, Attached | 38 (71.7%) | 15 (28.3%) |
| 2 Unit Apartments | 137 (68.8%) | 62 (31.2%) |
| 3 or 4 Unit Apartments | 0 (0.0%) | 50 (100.0%) |
| 5 to 9 Unit Apartments | 0 (0.0%) | 25 (100.0%) |
| 10 or more Apartments | 0 (0.0%) | 120 (100.0%) |
| Mobile Home / Other | 0 (0.0%) | 0 (0.0%) |
| Total | 660 (65.8%) | 343 (34.2%) |
Housing Structures by Number of Rooms in South Deerfield
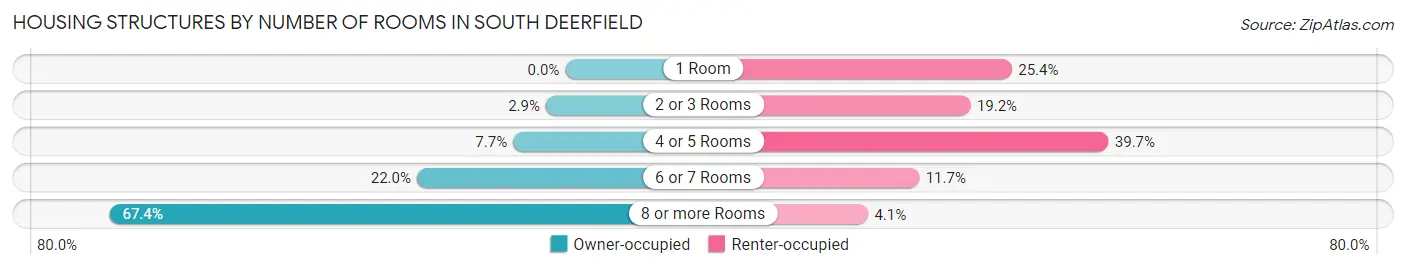
| Number of Rooms | Owner-occupied | Renter-occupied |
| 1 Room | 0 (0.0%) | 87 (25.4%) |
| 2 or 3 Rooms | 19 (2.9%) | 66 (19.2%) |
| 4 or 5 Rooms | 51 (7.7%) | 136 (39.7%) |
| 6 or 7 Rooms | 145 (22.0%) | 40 (11.7%) |
| 8 or more Rooms | 445 (67.4%) | 14 (4.1%) |
| Total | 660 (100.0%) | 343 (100.0%) |
Housing Structure by Heating Type in South Deerfield
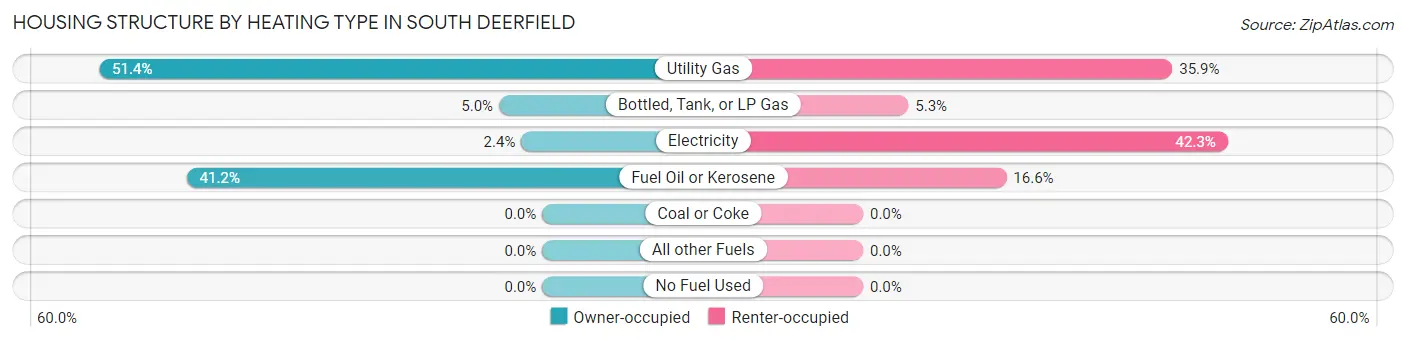
| Heating Type | Owner-occupied | Renter-occupied |
| Utility Gas | 339 (51.4%) | 123 (35.9%) |
| Bottled, Tank, or LP Gas | 33 (5.0%) | 18 (5.2%) |
| Electricity | 16 (2.4%) | 145 (42.3%) |
| Fuel Oil or Kerosene | 272 (41.2%) | 57 (16.6%) |
| Coal or Coke | 0 (0.0%) | 0 (0.0%) |
| All other Fuels | 0 (0.0%) | 0 (0.0%) |
| No Fuel Used | 0 (0.0%) | 0 (0.0%) |
| Total | 660 (100.0%) | 343 (100.0%) |
Household Vehicle Usage in South Deerfield
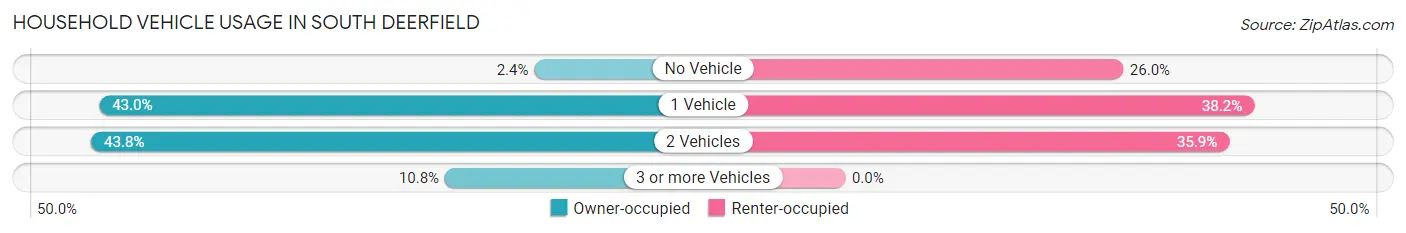
| Vehicles per Household | Owner-occupied | Renter-occupied |
| No Vehicle | 16 (2.4%) | 89 (26.0%) |
| 1 Vehicle | 284 (43.0%) | 131 (38.2%) |
| 2 Vehicles | 289 (43.8%) | 123 (35.9%) |
| 3 or more Vehicles | 71 (10.8%) | 0 (0.0%) |
| Total | 660 (100.0%) | 343 (100.0%) |
Real Estate & Mortgages in South Deerfield
Real Estate and Mortgage Overview in South Deerfield
| Characteristic | Without Mortgage | With Mortgage |
| Housing Units | 306 | 354 |
| Median Property Value | - | - |
| Median Household Income | $63,976 | $100 |
| Monthly Housing Costs | $1,105 | $80 |
| Real Estate Taxes | $6,359 | $0 |
Property Value by Mortgage Status in South Deerfield
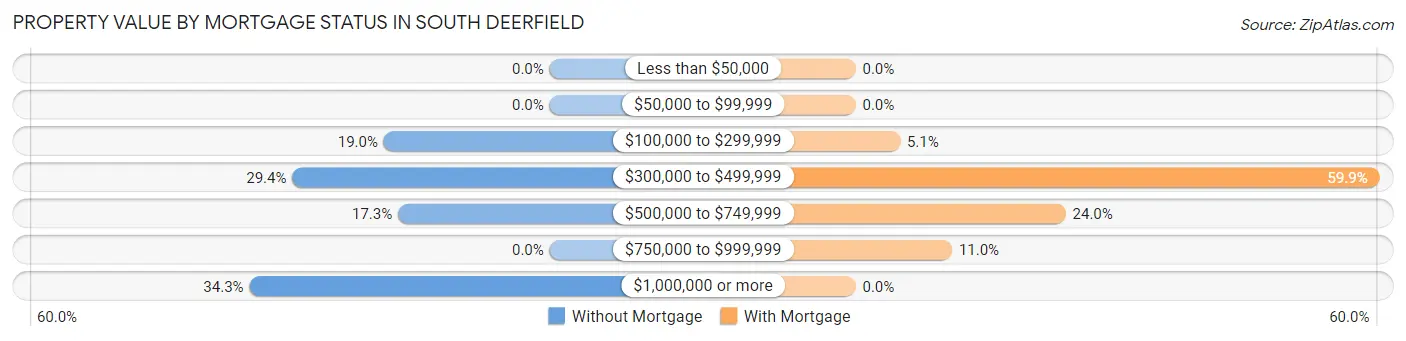
| Property Value | Without Mortgage | With Mortgage |
| Less than $50,000 | 0 (0.0%) | 0 (0.0%) |
| $50,000 to $99,999 | 0 (0.0%) | 0 (0.0%) |
| $100,000 to $299,999 | 58 (19.0%) | 18 (5.1%) |
| $300,000 to $499,999 | 90 (29.4%) | 212 (59.9%) |
| $500,000 to $749,999 | 53 (17.3%) | 85 (24.0%) |
| $750,000 to $999,999 | 0 (0.0%) | 39 (11.0%) |
| $1,000,000 or more | 105 (34.3%) | 0 (0.0%) |
| Total | 306 (100.0%) | 354 (100.0%) |
Household Income by Mortgage Status in South Deerfield
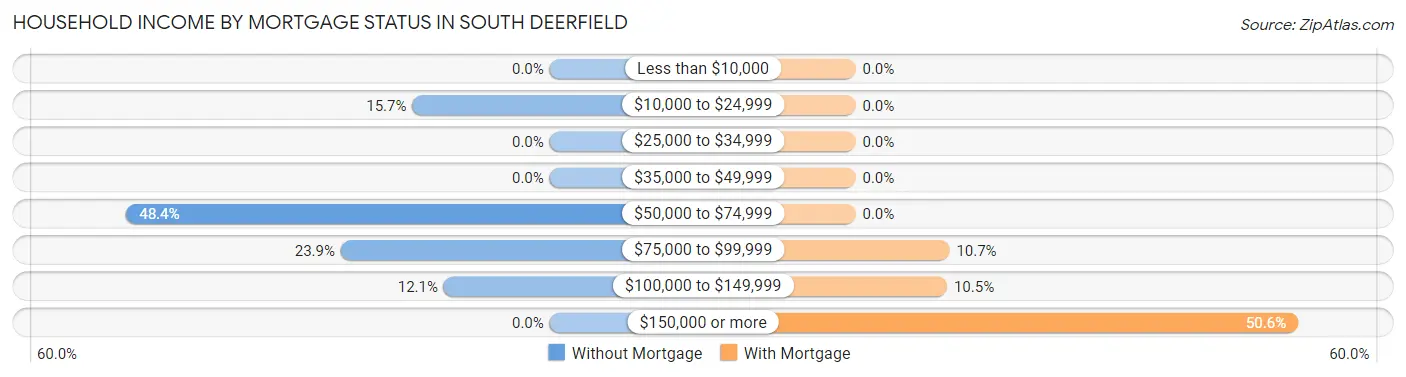
| Household Income | Without Mortgage | With Mortgage |
| Less than $10,000 | 0 (0.0%) | 0 (0.0%) |
| $10,000 to $24,999 | 48 (15.7%) | 0 (0.0%) |
| $25,000 to $34,999 | 0 (0.0%) | 0 (0.0%) |
| $35,000 to $49,999 | 0 (0.0%) | 0 (0.0%) |
| $50,000 to $74,999 | 148 (48.4%) | 0 (0.0%) |
| $75,000 to $99,999 | 73 (23.9%) | 38 (10.7%) |
| $100,000 to $149,999 | 37 (12.1%) | 37 (10.4%) |
| $150,000 or more | 0 (0.0%) | 179 (50.6%) |
| Total | 306 (100.0%) | 354 (100.0%) |
Property Value to Household Income Ratio in South Deerfield
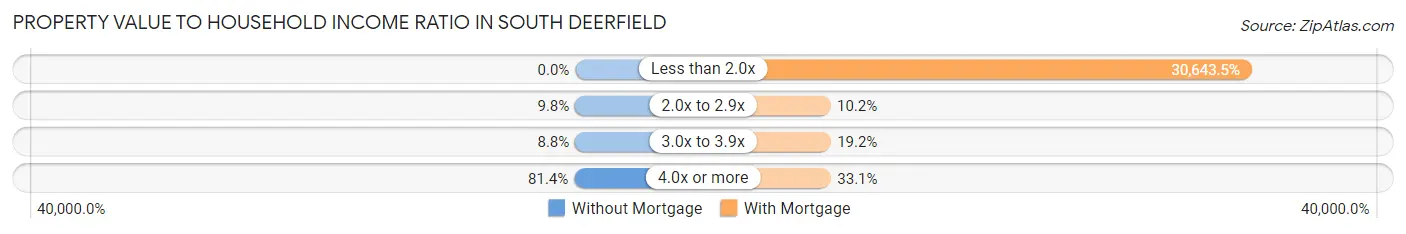
| Value-to-Income Ratio | Without Mortgage | With Mortgage |
| Less than 2.0x | 0 (0.0%) | 108,478 (30,643.5%) |
| 2.0x to 2.9x | 30 (9.8%) | 36 (10.2%) |
| 3.0x to 3.9x | 27 (8.8%) | 68 (19.2%) |
| 4.0x or more | 249 (81.4%) | 117 (33.1%) |
| Total | 306 (100.0%) | 354 (100.0%) |
Real Estate Taxes by Mortgage Status in South Deerfield
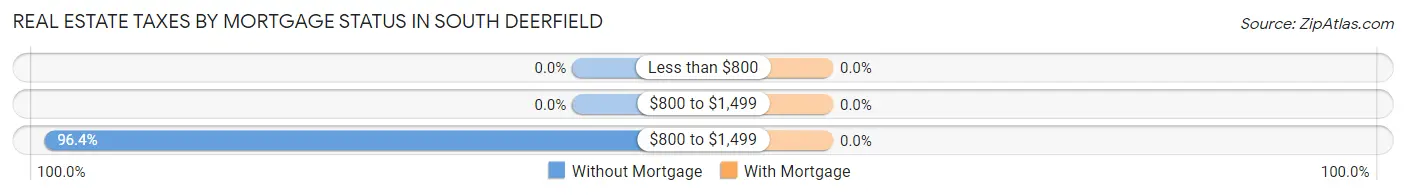
| Property Taxes | Without Mortgage | With Mortgage |
| Less than $800 | 0 (0.0%) | 0 (0.0%) |
| $800 to $1,499 | 0 (0.0%) | 0 (0.0%) |
| $800 to $1,499 | 295 (96.4%) | 0 (0.0%) |
| Total | 306 (100.0%) | 354 (100.0%) |
Health & Disability in South Deerfield
Health Insurance Coverage by Age in South Deerfield
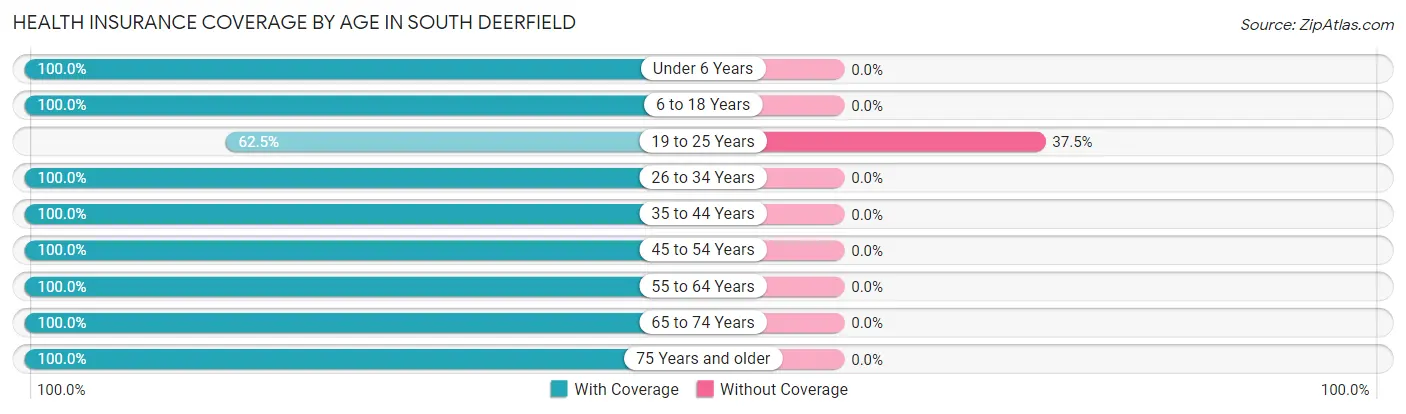
| Age Bracket | With Coverage | Without Coverage |
| Under 6 Years | 16 (100.0%) | 0 (0.0%) |
| 6 to 18 Years | 343 (100.0%) | 0 (0.0%) |
| 19 to 25 Years | 25 (62.5%) | 15 (37.5%) |
| 26 to 34 Years | 183 (100.0%) | 0 (0.0%) |
| 35 to 44 Years | 151 (100.0%) | 0 (0.0%) |
| 45 to 54 Years | 316 (100.0%) | 0 (0.0%) |
| 55 to 64 Years | 505 (100.0%) | 0 (0.0%) |
| 65 to 74 Years | 207 (100.0%) | 0 (0.0%) |
| 75 Years and older | 192 (100.0%) | 0 (0.0%) |
| Total | 1,938 (99.2%) | 15 (0.8%) |
Health Insurance Coverage by Citizenship Status in South Deerfield
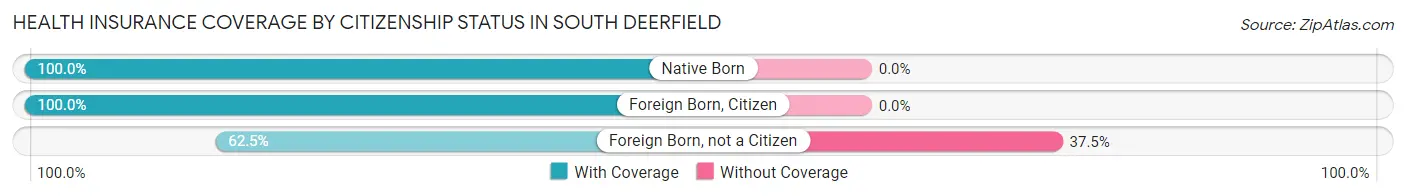
| Citizenship Status | With Coverage | Without Coverage |
| Native Born | 16 (100.0%) | 0 (0.0%) |
| Foreign Born, Citizen | 343 (100.0%) | 0 (0.0%) |
| Foreign Born, not a Citizen | 25 (62.5%) | 15 (37.5%) |
Health Insurance Coverage by Household Income in South Deerfield
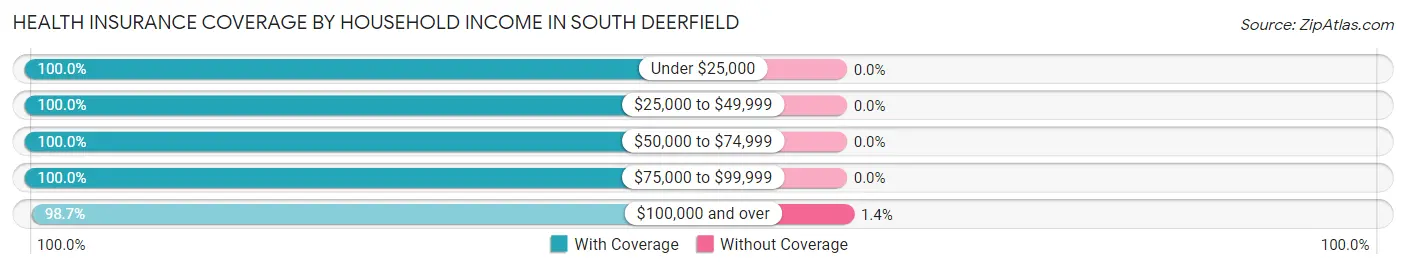
| Household Income | With Coverage | Without Coverage |
| Under $25,000 | 271 (100.0%) | 0 (0.0%) |
| $25,000 to $49,999 | 31 (100.0%) | 0 (0.0%) |
| $50,000 to $74,999 | 327 (100.0%) | 0 (0.0%) |
| $75,000 to $99,999 | 210 (100.0%) | 0 (0.0%) |
| $100,000 and over | 1,099 (98.7%) | 15 (1.3%) |
Public vs Private Health Insurance Coverage by Age in South Deerfield
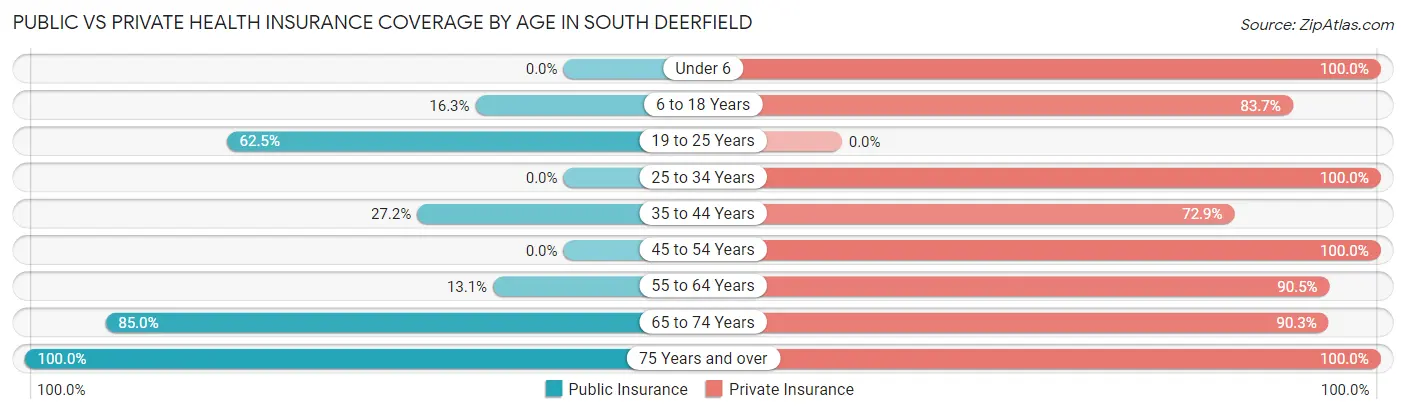
| Age Bracket | Public Insurance | Private Insurance |
| Under 6 | 0 (0.0%) | 16 (100.0%) |
| 6 to 18 Years | 56 (16.3%) | 287 (83.7%) |
| 19 to 25 Years | 25 (62.5%) | 0 (0.0%) |
| 25 to 34 Years | 0 (0.0%) | 183 (100.0%) |
| 35 to 44 Years | 41 (27.2%) | 110 (72.9%) |
| 45 to 54 Years | 0 (0.0%) | 316 (100.0%) |
| 55 to 64 Years | 66 (13.1%) | 457 (90.5%) |
| 65 to 74 Years | 176 (85.0%) | 187 (90.3%) |
| 75 Years and over | 192 (100.0%) | 192 (100.0%) |
| Total | 556 (28.5%) | 1,748 (89.5%) |
Disability Status by Sex by Age in South Deerfield
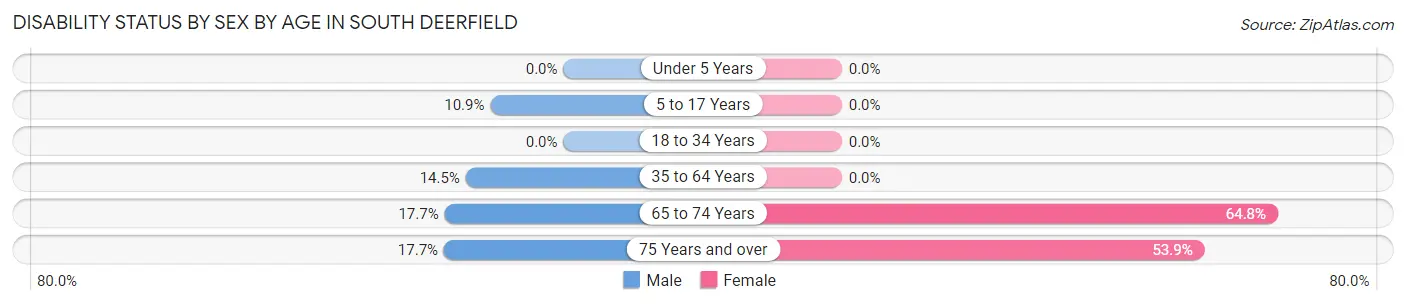
| Age Bracket | Male | Female |
| Under 5 Years | 0 (0.0%) | 0 (0.0%) |
| 5 to 17 Years | 14 (10.8%) | 0 (0.0%) |
| 18 to 34 Years | 0 (0.0%) | 0 (0.0%) |
| 35 to 64 Years | 67 (14.5%) | 0 (0.0%) |
| 65 to 74 Years | 15 (17.6%) | 79 (64.7%) |
| 75 Years and over | 11 (17.7%) | 70 (53.8%) |
Disability Class by Sex by Age in South Deerfield
Disability Class: Hearing Difficulty
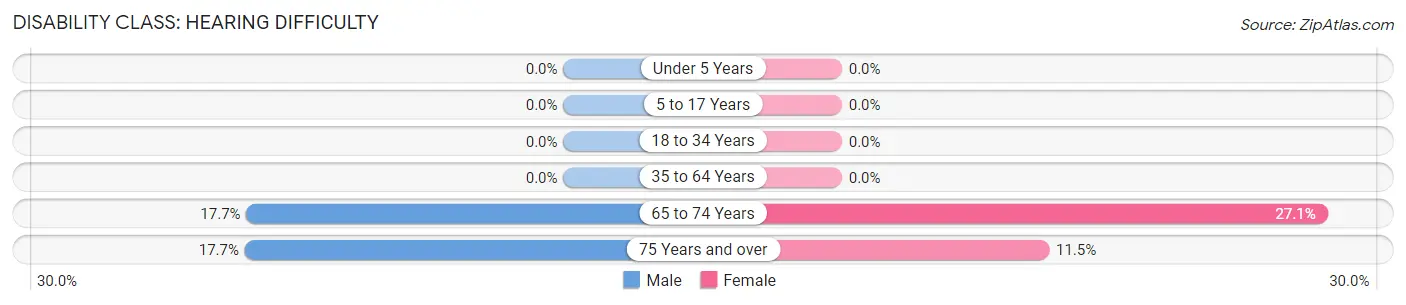
| Age Bracket | Male | Female |
| Under 5 Years | 0 (0.0%) | 0 (0.0%) |
| 5 to 17 Years | 0 (0.0%) | 0 (0.0%) |
| 18 to 34 Years | 0 (0.0%) | 0 (0.0%) |
| 35 to 64 Years | 0 (0.0%) | 0 (0.0%) |
| 65 to 74 Years | 15 (17.6%) | 33 (27.1%) |
| 75 Years and over | 11 (17.7%) | 15 (11.5%) |
Disability Class: Vision Difficulty
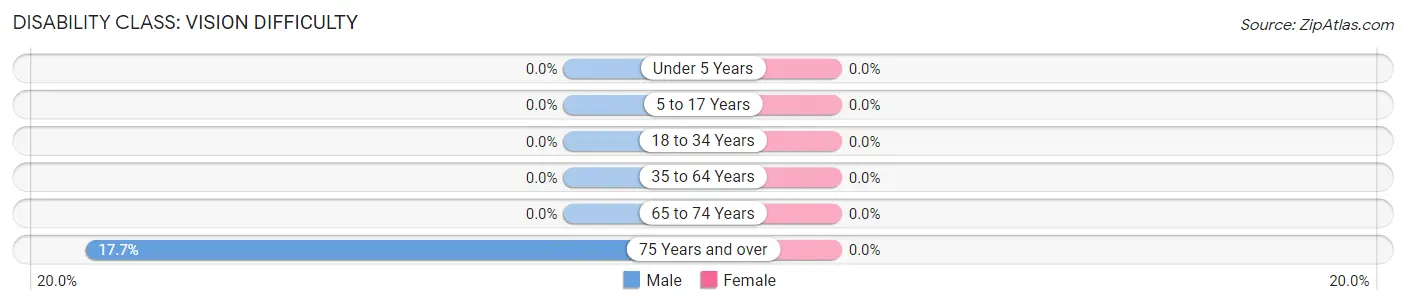
| Age Bracket | Male | Female |
| Under 5 Years | 0 (0.0%) | 0 (0.0%) |
| 5 to 17 Years | 0 (0.0%) | 0 (0.0%) |
| 18 to 34 Years | 0 (0.0%) | 0 (0.0%) |
| 35 to 64 Years | 0 (0.0%) | 0 (0.0%) |
| 65 to 74 Years | 0 (0.0%) | 0 (0.0%) |
| 75 Years and over | 11 (17.7%) | 0 (0.0%) |
Disability Class: Cognitive Difficulty
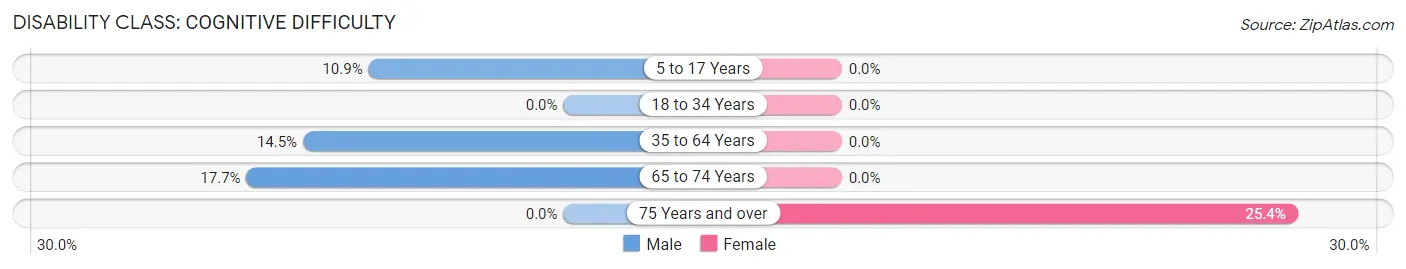
| Age Bracket | Male | Female |
| 5 to 17 Years | 14 (10.8%) | 0 (0.0%) |
| 18 to 34 Years | 0 (0.0%) | 0 (0.0%) |
| 35 to 64 Years | 67 (14.5%) | 0 (0.0%) |
| 65 to 74 Years | 15 (17.6%) | 0 (0.0%) |
| 75 Years and over | 0 (0.0%) | 33 (25.4%) |
Disability Class: Ambulatory Difficulty
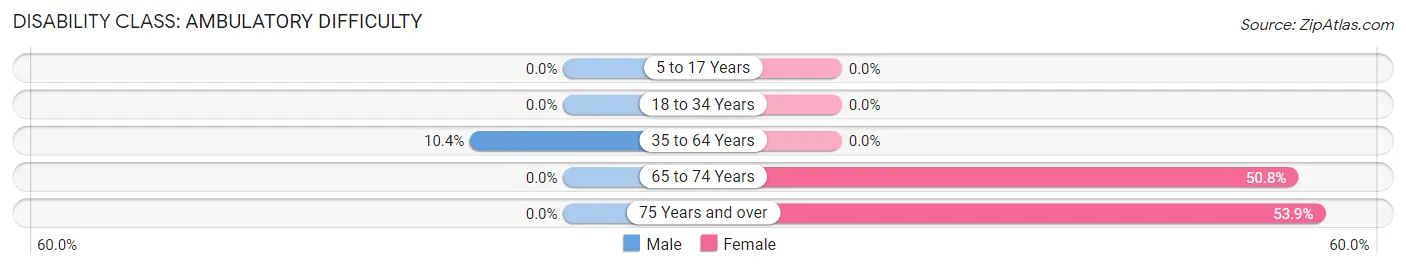
| Age Bracket | Male | Female |
| 5 to 17 Years | 0 (0.0%) | 0 (0.0%) |
| 18 to 34 Years | 0 (0.0%) | 0 (0.0%) |
| 35 to 64 Years | 48 (10.4%) | 0 (0.0%) |
| 65 to 74 Years | 0 (0.0%) | 62 (50.8%) |
| 75 Years and over | 0 (0.0%) | 70 (53.8%) |
Disability Class: Self-Care Difficulty
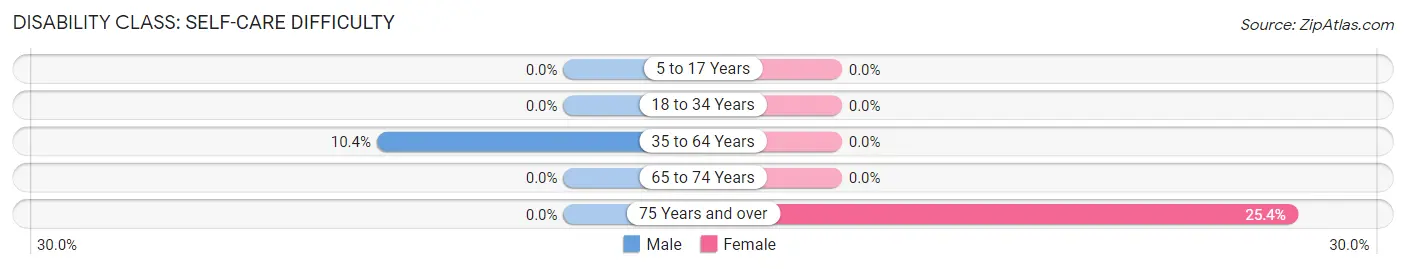
| Age Bracket | Male | Female |
| 5 to 17 Years | 0 (0.0%) | 0 (0.0%) |
| 18 to 34 Years | 0 (0.0%) | 0 (0.0%) |
| 35 to 64 Years | 48 (10.4%) | 0 (0.0%) |
| 65 to 74 Years | 0 (0.0%) | 0 (0.0%) |
| 75 Years and over | 0 (0.0%) | 33 (25.4%) |
Technology Access in South Deerfield
Computing Device Access in South Deerfield
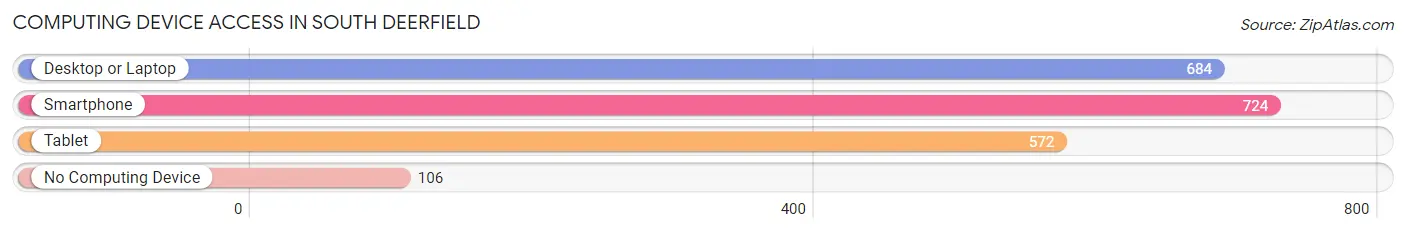
| Device Type | # Households | % Households |
| Desktop or Laptop | 684 | 68.2% |
| Smartphone | 724 | 72.2% |
| Tablet | 572 | 57.0% |
| No Computing Device | 106 | 10.6% |
| Total | 1,003 | 100.0% |
Internet Access in South Deerfield
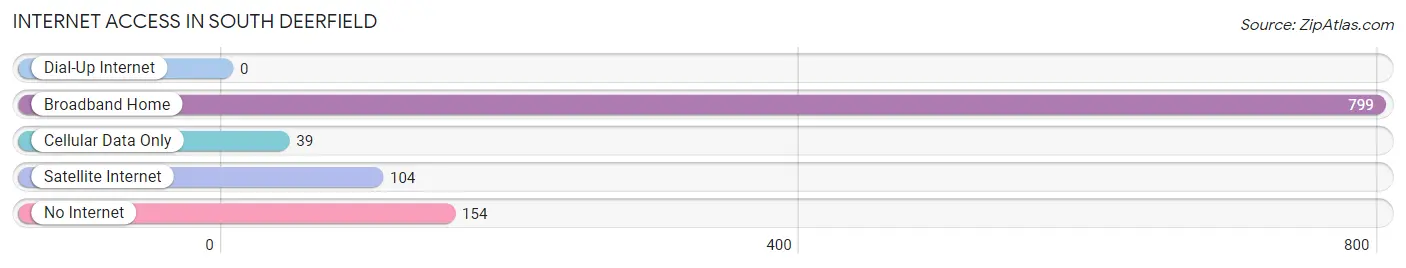
| Internet Type | # Households | % Households |
| Dial-Up Internet | 0 | 0.0% |
| Broadband Home | 799 | 79.7% |
| Cellular Data Only | 39 | 3.9% |
| Satellite Internet | 104 | 10.4% |
| No Internet | 154 | 15.3% |
| Total | 1,003 | 100.0% |
South Deerfield Summary
Deerfield, Massachusetts is a small town located in the western part of the state, in Franklin County. It is bordered by the towns of Conway, Whately, Sunderland, and Montague. The town is situated on the banks of the Connecticut River, and is home to a population of approximately 4,500 people.
History
Deerfield was first settled in 1673 by a group of English settlers from Dedham, Massachusetts. The town was originally known as Pocumtuck, and was part of the Pocumtuck Plantation. The town was officially incorporated in 1753, and was named after the deer that roamed the area.
During the American Revolution, Deerfield was the site of several battles between the British and American forces. The most famous of these battles was the Battle of Bloody Brook, which took place in September of 1777. The battle resulted in the death of over 40 American soldiers, and was a major victory for the British.
In the 19th century, Deerfield became an important center for the production of woolen goods. The town was home to several mills, and the industry provided employment for many of the town’s residents.
Geography
Deerfield is located in the western part of Massachusetts, in Franklin County. The town is situated on the banks of the Connecticut River, and is bordered by the towns of Conway, Whately, Sunderland, and Montague. The town covers an area of approximately 24 square miles, and is home to a population of approximately 4,500 people.
The town is located in the Pioneer Valley, and is part of the Connecticut River Valley. The town is located in the foothills of the Berkshire Mountains, and is home to several small hills and mountains. The highest point in the town is Mount Sugarloaf, which has an elevation of 1,064 feet.
Economy
Deerfield’s economy is largely based on agriculture and tourism. The town is home to several farms, which produce a variety of crops, including corn, hay, and apples. The town is also home to several small businesses, including restaurants, retail stores, and art galleries.
Tourism is an important part of the town’s economy. The town is home to several historic sites, including the Deerfield Academy, the Pocumtuck Valley Memorial Association, and the Deerfield Inn. The town is also home to several outdoor recreation areas, including the Deerfield River, the Deerfield Wildlife Management Area, and the Deerfield State Forest.
Demographics
As of the 2010 census, Deerfield had a population of 4,521 people. The racial makeup of the town was 95.3% White, 0.7% African American, 0.3% Native American, 0.7% Asian, 0.1% Pacific Islander, 1.2% from other races, and 1.7% from two or more races. Hispanic or Latino of any race were 2.7% of the population.
The median household income in Deerfield was $60,972, and the median family income was $71,944. The per capita income for the town was $27,945. About 4.3% of families and 5.7% of the population were below the poverty line, including 6.3% of those under age 18 and 4.2% of those age 65 or over.
Common Questions
What is Per Capita Income in South Deerfield?
Per Capita income in South Deerfield is $55,175.
What is the Median Family Income in South Deerfield?
Median Family Income in South Deerfield is $107,339.
What is the Median Household income in South Deerfield?
Median Household Income in South Deerfield is $81,577.
What is Income or Wage Gap in South Deerfield?
Income or Wage Gap in South Deerfield is 26.4%.
Women in South Deerfield earn 73.6 cents for every dollar earned by a man.
What is Inequality or Gini Index in South Deerfield?
Inequality or Gini Index in South Deerfield is 0.42.
What is the Total Population of South Deerfield?
Total Population of South Deerfield is 1,953.
What is the Total Male Population of South Deerfield?
Total Male Population of South Deerfield is 922.
What is the Total Female Population of South Deerfield?
Total Female Population of South Deerfield is 1,031.
What is the Ratio of Males per 100 Females in South Deerfield?
There are 89.43 Males per 100 Females in South Deerfield.
What is the Ratio of Females per 100 Males in South Deerfield?
There are 111.82 Females per 100 Males in South Deerfield.
What is the Median Population Age in South Deerfield?
Median Population Age in South Deerfield is 51.6 Years.
What is the Average Family Size in South Deerfield
Average Family Size in South Deerfield is 2.7 People.
What is the Average Household Size in South Deerfield
Average Household Size in South Deerfield is 1.9 People.
How Large is the Labor Force in South Deerfield?
There are 1,251 People in the Labor Forcein in South Deerfield.
What is the Percentage of People in the Labor Force in South Deerfield?
68.8% of People are in the Labor Force in South Deerfield.
What is the Unemployment Rate in South Deerfield?
Unemployment Rate in South Deerfield is 5.8%.