Micanopy, FL Map & Demographics
Micanopy Map
Micanopy Overview
$44,000
PER CAPITA INCOME
$78,375
AVG FAMILY INCOME
$59,457
AVG HOUSEHOLD INCOME
16.6%
WAGE / INCOME GAP [ % ]
83.4¢/ $1
WAGE / INCOME GAP [ $ ]
0.48
INEQUALITY / GINI INDEX
522
TOTAL POPULATION
236
MALE POPULATION
286
FEMALE POPULATION
82.52
MALES / 100 FEMALES
121.19
FEMALES / 100 MALES
47.1
MEDIAN AGE
2.9
AVG FAMILY SIZE
2.1
AVG HOUSEHOLD SIZE
294
LABOR FORCE [ PEOPLE ]
63.2%
PERCENT IN LABOR FORCE
6.8%
UNEMPLOYMENT RATE
Micanopy Zip Codes
Micanopy Area Codes
Income in Micanopy
Income Overview in Micanopy
Per Capita Income in Micanopy is $44,000, while median incomes of families and households are $78,375 and $59,457 respectively.
| Characteristic | Number | Measure |
| Per Capita Income | 522 | $44,000 |
| Median Family Income | 103 | $78,375 |
| Mean Family Income | 103 | $105,895 |
| Median Household Income | 250 | $59,457 |
| Mean Household Income | 250 | $87,420 |
| Income Deficit | 103 | $0 |
| Wage / Income Gap (%) | 522 | 16.61% |
| Wage / Income Gap ($) | 522 | 83.39¢ per $1 |
| Gini / Inequality Index | 522 | 0.48 |
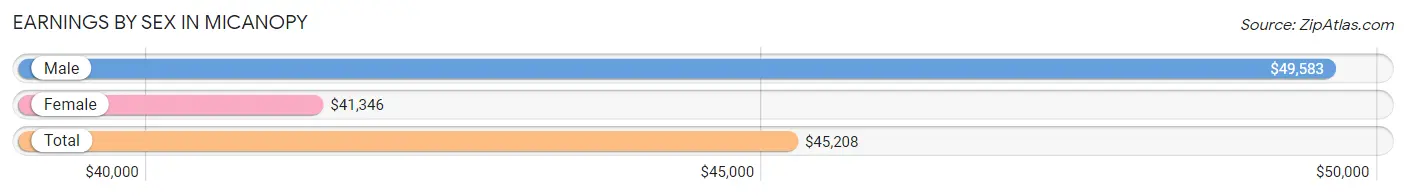
Earnings by Sex in Micanopy
Average Earnings in Micanopy are $45,208, $49,583 for men and $41,346 for women, a difference of 16.6%.
| Sex | Number | Average Earnings |
| Male | 145 (45.7%) | $49,583 |
| Female | 172 (54.3%) | $41,346 |
| Total | 317 (100.0%) | $45,208 |
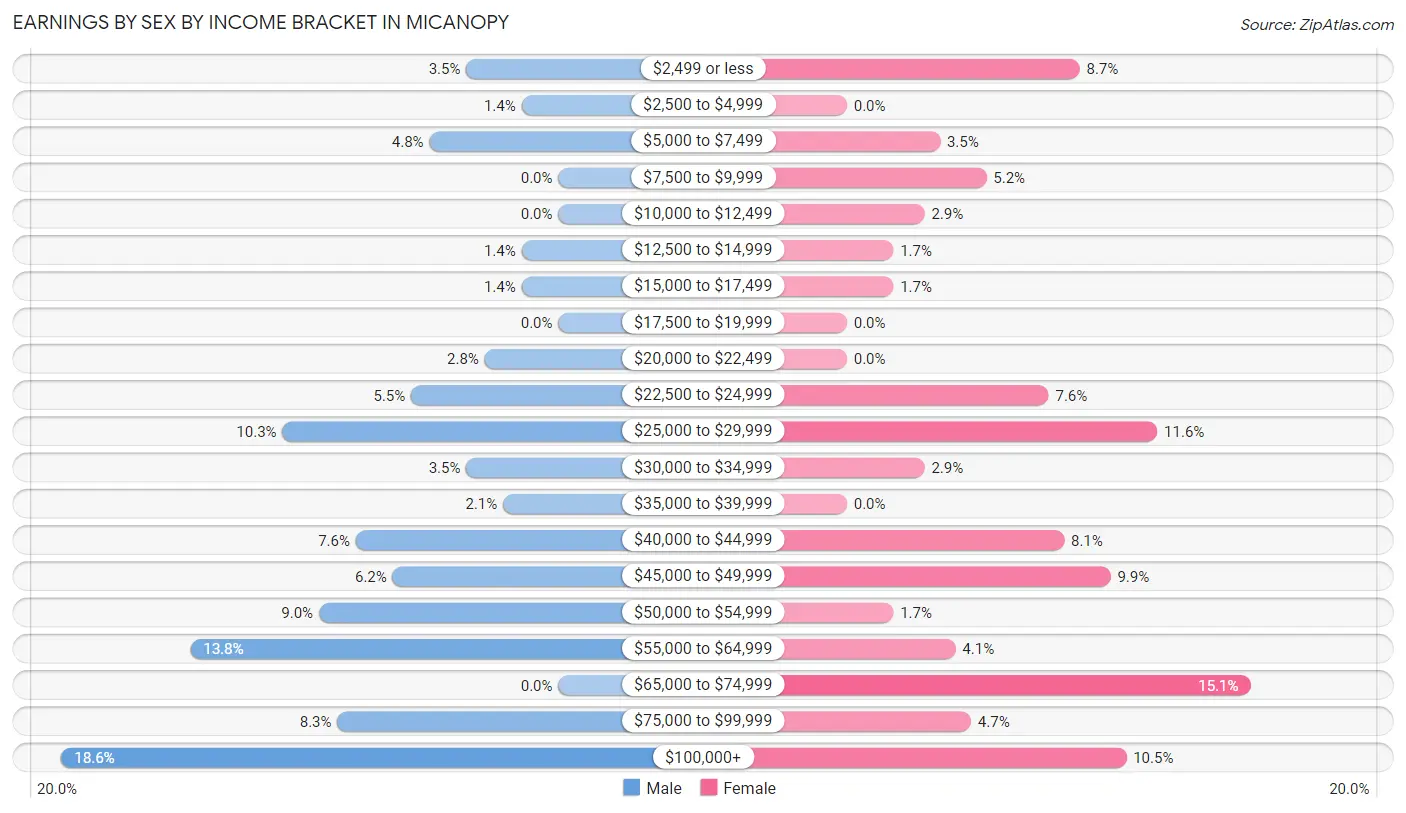
Earnings by Sex by Income Bracket in Micanopy
The most common earnings brackets in Micanopy are $100,000+ for men (27 | 18.6%) and $65,000 to $74,999 for women (26 | 15.1%).
| Income | Male | Female |
| $2,499 or less | 5 (3.5%) | 15 (8.7%) |
| $2,500 to $4,999 | 2 (1.4%) | 0 (0.0%) |
| $5,000 to $7,499 | 7 (4.8%) | 6 (3.5%) |
| $7,500 to $9,999 | 0 (0.0%) | 9 (5.2%) |
| $10,000 to $12,499 | 0 (0.0%) | 5 (2.9%) |
| $12,500 to $14,999 | 2 (1.4%) | 3 (1.7%) |
| $15,000 to $17,499 | 2 (1.4%) | 3 (1.7%) |
| $17,500 to $19,999 | 0 (0.0%) | 0 (0.0%) |
| $20,000 to $22,499 | 4 (2.8%) | 0 (0.0%) |
| $22,500 to $24,999 | 8 (5.5%) | 13 (7.6%) |
| $25,000 to $29,999 | 15 (10.3%) | 20 (11.6%) |
| $30,000 to $34,999 | 5 (3.5%) | 5 (2.9%) |
| $35,000 to $39,999 | 3 (2.1%) | 0 (0.0%) |
| $40,000 to $44,999 | 11 (7.6%) | 14 (8.1%) |
| $45,000 to $49,999 | 9 (6.2%) | 17 (9.9%) |
| $50,000 to $54,999 | 13 (9.0%) | 3 (1.7%) |
| $55,000 to $64,999 | 20 (13.8%) | 7 (4.1%) |
| $65,000 to $74,999 | 0 (0.0%) | 26 (15.1%) |
| $75,000 to $99,999 | 12 (8.3%) | 8 (4.6%) |
| $100,000+ | 27 (18.6%) | 18 (10.5%) |
| Total | 145 (100.0%) | 172 (100.0%) |
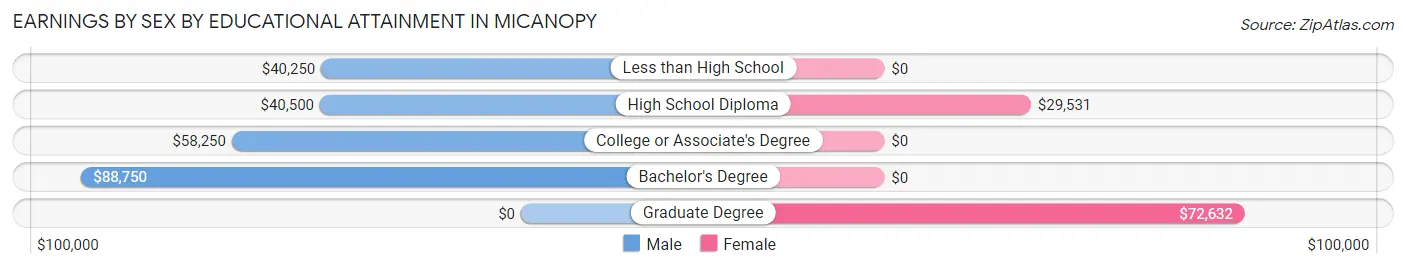
Earnings by Sex by Educational Attainment in Micanopy
Average earnings in Micanopy are $50,481 for men and $45,104 for women, a difference of 10.6%. Men with an educational attainment of bachelor's degree enjoy the highest average annual earnings of $88,750, while those with less than high school education earn the least with $40,250. Women with an educational attainment of graduate degree earn the most with the average annual earnings of $72,632, while those with high school diploma education have the smallest earnings of $29,531.
| Educational Attainment | Male Income | Female Income |
| Less than High School | $40,250 | $0 |
| High School Diploma | $40,500 | $29,531 |
| College or Associate's Degree | $58,250 | $0 |
| Bachelor's Degree | $88,750 | $0 |
| Graduate Degree | - | - |
| Total | $50,481 | $45,104 |
Family Income in Micanopy
Family Income Brackets in Micanopy
According to the Micanopy family income data, there are 24 families falling into the $50,000 to $74,999 income range, which is the most common income bracket and makes up 23.3% of all families.
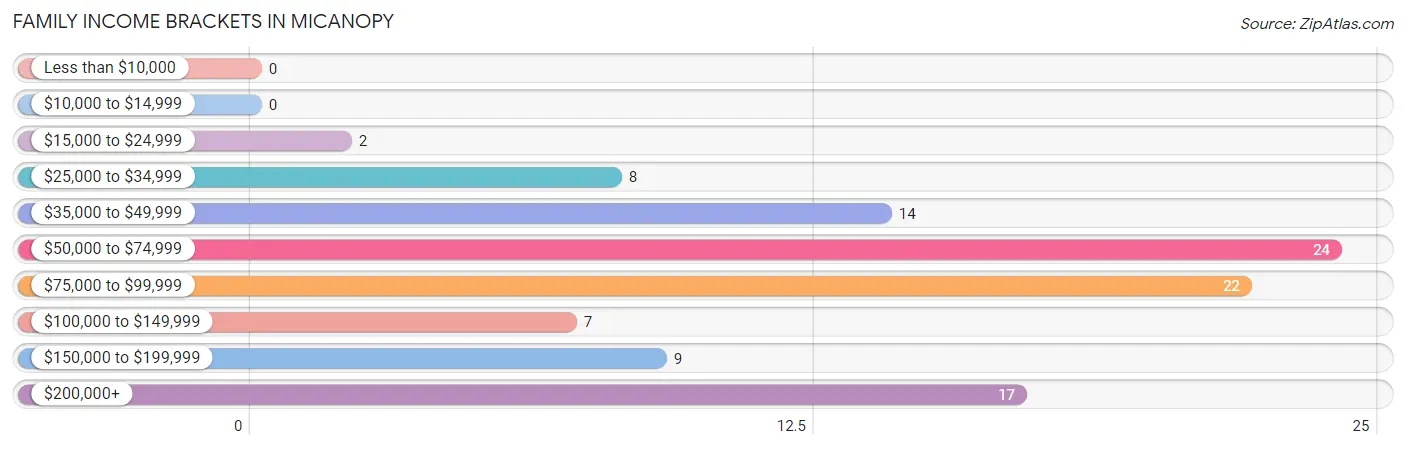
| Income Bracket | # Families | % Families |
| Less than $10,000 | 0 | 0.0% |
| $10,000 to $14,999 | 0 | 0.0% |
| $15,000 to $24,999 | 2 | 1.9% |
| $25,000 to $34,999 | 8 | 7.8% |
| $35,000 to $49,999 | 14 | 13.6% |
| $50,000 to $74,999 | 24 | 23.3% |
| $75,000 to $99,999 | 22 | 21.4% |
| $100,000 to $149,999 | 7 | 6.8% |
| $150,000 to $199,999 | 9 | 8.7% |
| $200,000+ | 17 | 16.5% |
Family Income by Famaliy Size in Micanopy
2-person families (66 | 64.1%) account for the highest median family income in Micanopy with $79,250 per family, while 2-person families (66 | 64.1%) have the highest median income of $39,625 per family member.
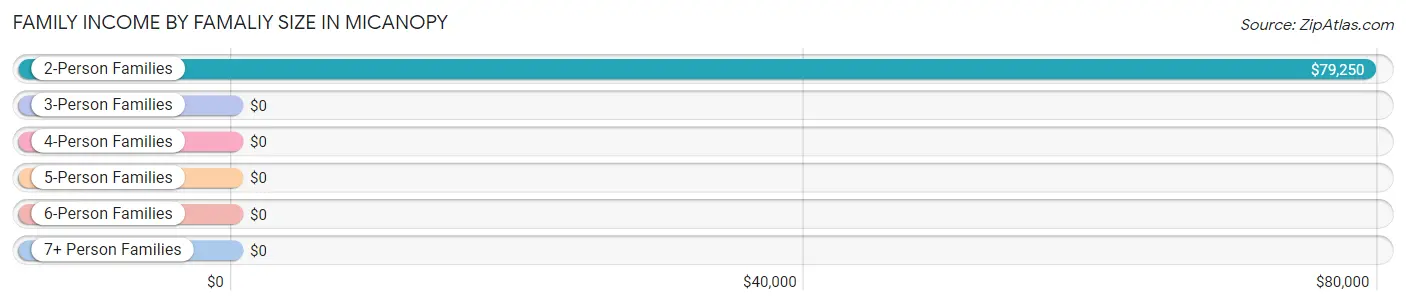
| Income Bracket | # Families | Median Income |
| 2-Person Families | 66 (64.1%) | $79,250 |
| 3-Person Families | 14 (13.6%) | $0 |
| 4-Person Families | 12 (11.7%) | $0 |
| 5-Person Families | 11 (10.7%) | $0 |
| 6-Person Families | 0 (0.0%) | $0 |
| 7+ Person Families | 0 (0.0%) | $0 |
| Total | 103 (100.0%) | $78,375 |
Family Income by Number of Earners in Micanopy
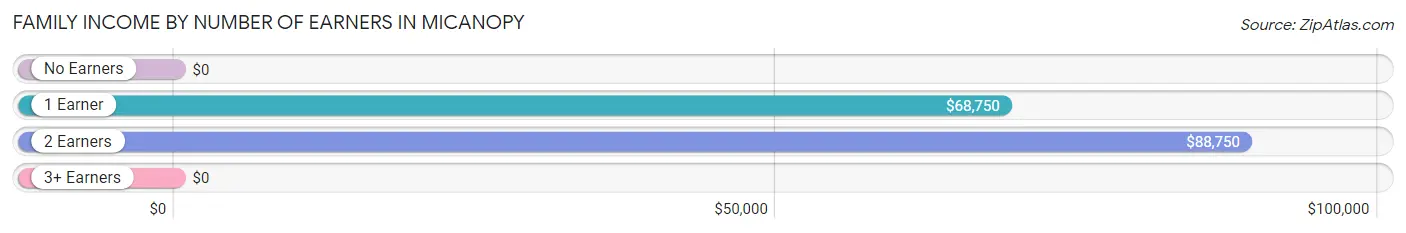
| Number of Earners | # Families | Median Income |
| No Earners | 16 (15.5%) | $0 |
| 1 Earner | 28 (27.2%) | $68,750 |
| 2 Earners | 56 (54.4%) | $88,750 |
| 3+ Earners | 3 (2.9%) | $0 |
| Total | 103 (100.0%) | $78,375 |
Household Income in Micanopy
Household Income Brackets in Micanopy
With 69 households falling in the category, the $50,000 to $74,999 income range is the most frequent in Micanopy, accounting for 27.6% of all households. In contrast, only 12 households (4.8%) fall into the $10,000 to $14,999 income bracket, making it the least populous group.
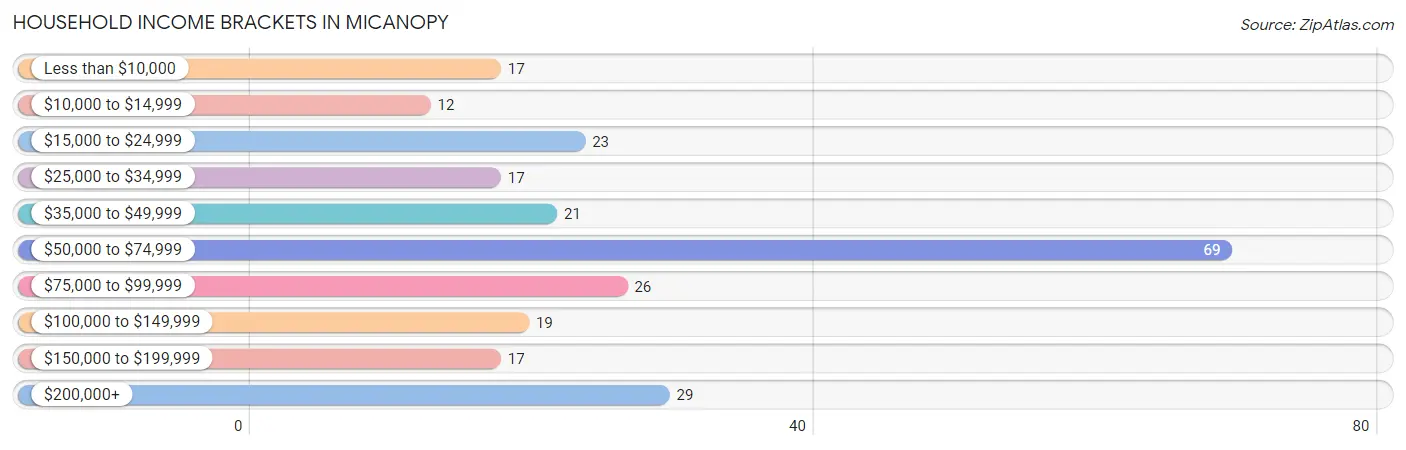
| Income Bracket | # Households | % Households |
| Less than $10,000 | 17 | 6.8% |
| $10,000 to $14,999 | 12 | 4.8% |
| $15,000 to $24,999 | 23 | 9.2% |
| $25,000 to $34,999 | 17 | 6.8% |
| $35,000 to $49,999 | 21 | 8.4% |
| $50,000 to $74,999 | 69 | 27.6% |
| $75,000 to $99,999 | 26 | 10.4% |
| $100,000 to $149,999 | 19 | 7.6% |
| $150,000 to $199,999 | 17 | 6.8% |
| $200,000+ | 29 | 11.6% |
Household Income by Householder Age in Micanopy
The median household income in Micanopy is $59,457, with the highest median household income of $70,417 found in the 25 to 44 years age bracket for the primary householder. A total of 73 households (29.2%) fall into this category. Meanwhile, the 15 to 24 years age bracket for the primary householder has the lowest median household income of $0, with 8 households (3.2%) in this group.
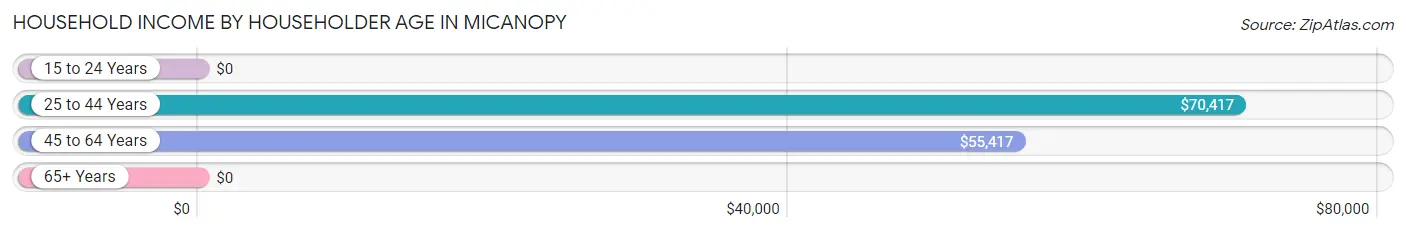
| Income Bracket | # Households | Median Income |
| 15 to 24 Years | 8 (3.2%) | $0 |
| 25 to 44 Years | 73 (29.2%) | $70,417 |
| 45 to 64 Years | 79 (31.6%) | $55,417 |
| 65+ Years | 90 (36.0%) | $0 |
| Total | 250 (100.0%) | $59,457 |
Poverty in Micanopy
Income Below Poverty by Sex and Age in Micanopy
With 4.7% poverty level for males and 14.7% for females among the residents of Micanopy, 25 to 34 year old males and 18 to 24 year old females are the most vulnerable to poverty, with 3 males (25.0%) and 14 females (93.3%) in their respective age groups living below the poverty level.
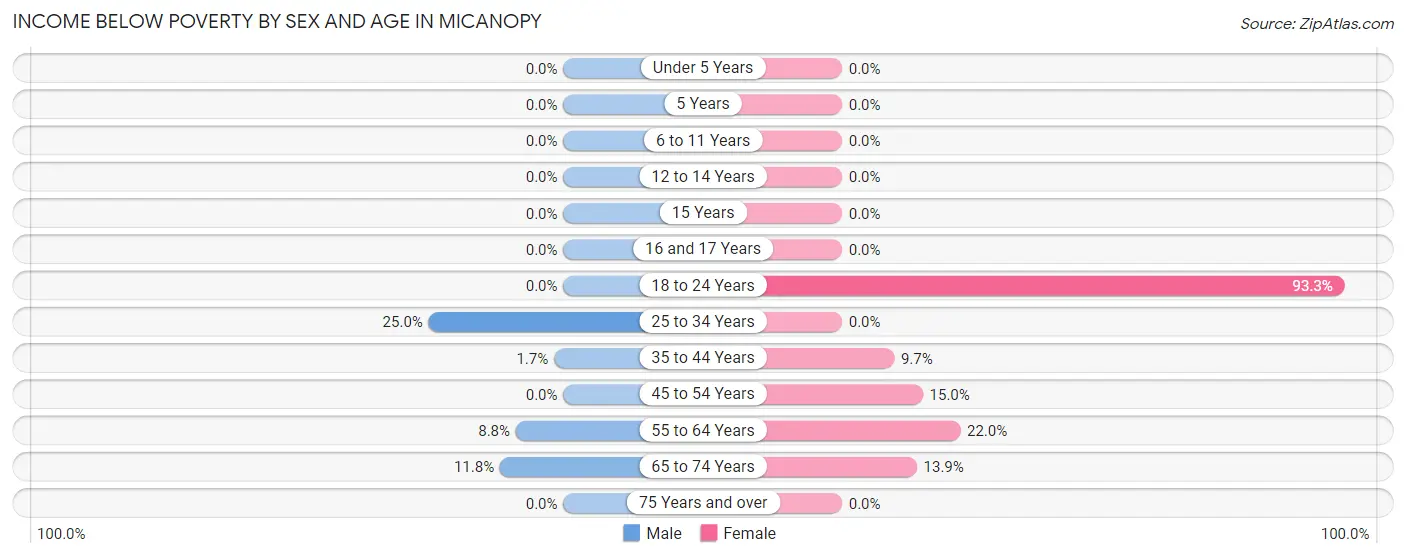
| Age Bracket | Male | Female |
| Under 5 Years | 0 (0.0%) | 0 (0.0%) |
| 5 Years | 0 (0.0%) | 0 (0.0%) |
| 6 to 11 Years | 0 (0.0%) | 0 (0.0%) |
| 12 to 14 Years | 0 (0.0%) | 0 (0.0%) |
| 15 Years | 0 (0.0%) | 0 (0.0%) |
| 16 and 17 Years | 0 (0.0%) | 0 (0.0%) |
| 18 to 24 Years | 0 (0.0%) | 14 (93.3%) |
| 25 to 34 Years | 3 (25.0%) | 0 (0.0%) |
| 35 to 44 Years | 1 (1.7%) | 3 (9.7%) |
| 45 to 54 Years | 0 (0.0%) | 6 (15.0%) |
| 55 to 64 Years | 3 (8.8%) | 9 (22.0%) |
| 65 to 74 Years | 4 (11.8%) | 10 (13.9%) |
| 75 Years and over | 0 (0.0%) | 0 (0.0%) |
| Total | 11 (4.7%) | 42 (14.7%) |
Income Above Poverty by Sex and Age in Micanopy
According to the poverty statistics in Micanopy, males aged under 5 years and females aged under 5 years are the age groups that are most secure financially, with 100.0% of males and 100.0% of females in these age groups living above the poverty line.
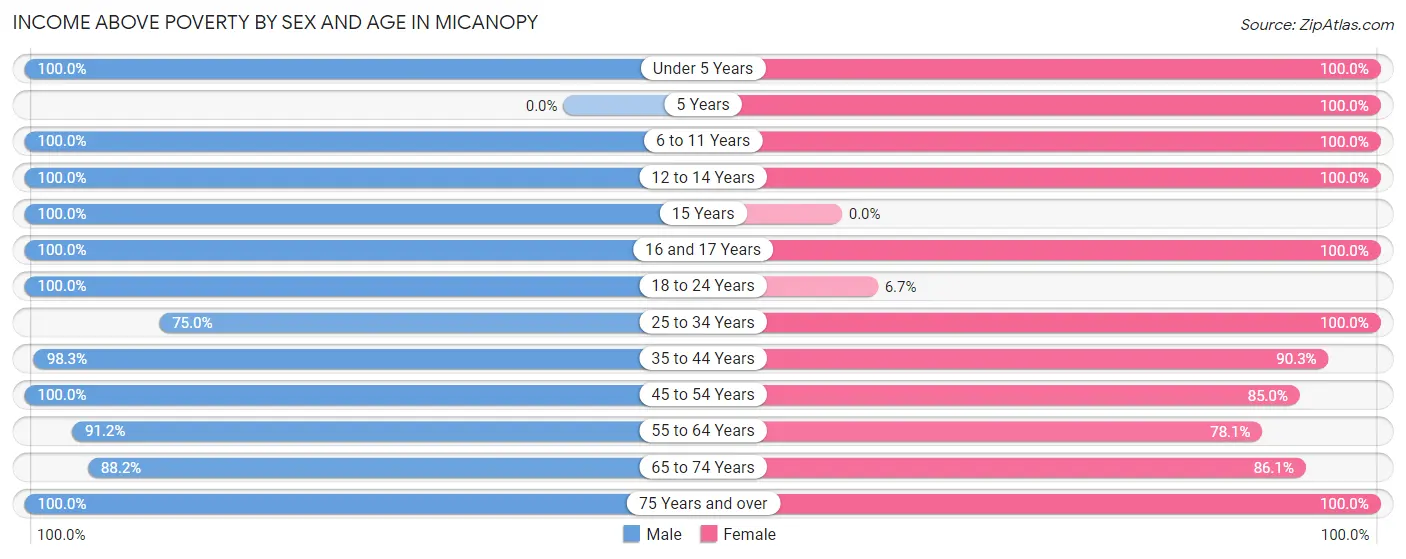
| Age Bracket | Male | Female |
| Under 5 Years | 12 (100.0%) | 11 (100.0%) |
| 5 Years | 0 (0.0%) | 4 (100.0%) |
| 6 to 11 Years | 12 (100.0%) | 3 (100.0%) |
| 12 to 14 Years | 7 (100.0%) | 6 (100.0%) |
| 15 Years | 2 (100.0%) | 0 (0.0%) |
| 16 and 17 Years | 4 (100.0%) | 3 (100.0%) |
| 18 to 24 Years | 14 (100.0%) | 1 (6.7%) |
| 25 to 34 Years | 9 (75.0%) | 53 (100.0%) |
| 35 to 44 Years | 57 (98.3%) | 28 (90.3%) |
| 45 to 54 Years | 40 (100.0%) | 34 (85.0%) |
| 55 to 64 Years | 31 (91.2%) | 32 (78.0%) |
| 65 to 74 Years | 30 (88.2%) | 62 (86.1%) |
| 75 Years and over | 7 (100.0%) | 7 (100.0%) |
| Total | 225 (95.3%) | 244 (85.3%) |
Income Below Poverty Among Married-Couple Families in Micanopy
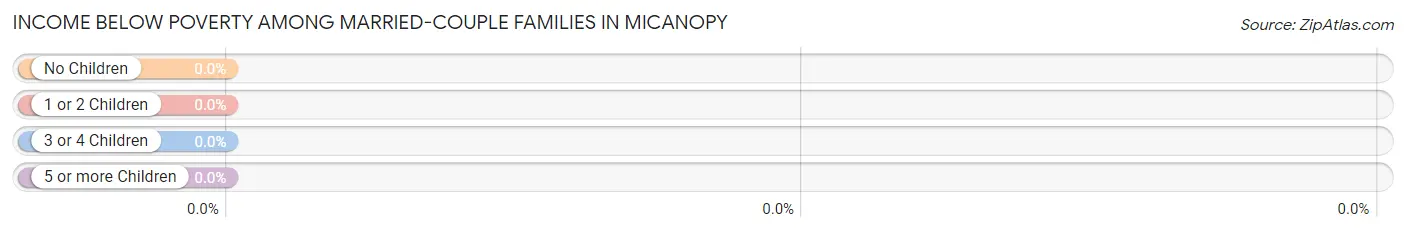
| Children | Above Poverty | Below Poverty |
| No Children | 67 (100.0%) | 0 (0.0%) |
| 1 or 2 Children | 20 (100.0%) | 0 (0.0%) |
| 3 or 4 Children | 0 (0.0%) | 0 (0.0%) |
| 5 or more Children | 0 (0.0%) | 0 (0.0%) |
| Total | 87 (100.0%) | 0 (0.0%) |
Income Below Poverty Among Single-Parent Households in Micanopy
| Children | Single Father | Single Mother |
| No Children | 0 (0.0%) | 0 (0.0%) |
| 1 or 2 Children | 0 (0.0%) | 0 (0.0%) |
| 3 or 4 Children | 0 (0.0%) | 0 (0.0%) |
| 5 or more Children | 0 (0.0%) | 0 (0.0%) |
| Total | 0 (0.0%) | 0 (0.0%) |
Income Below Poverty Among Married-Couple vs Single-Parent Households in Micanopy
| Children | Married-Couple Families | Single-Parent Households |
| No Children | 0 (0.0%) | 0 (0.0%) |
| 1 or 2 Children | 0 (0.0%) | 0 (0.0%) |
| 3 or 4 Children | 0 (0.0%) | 0 (0.0%) |
| 5 or more Children | 0 (0.0%) | 0 (0.0%) |
| Total | 0 (0.0%) | 0 (0.0%) |
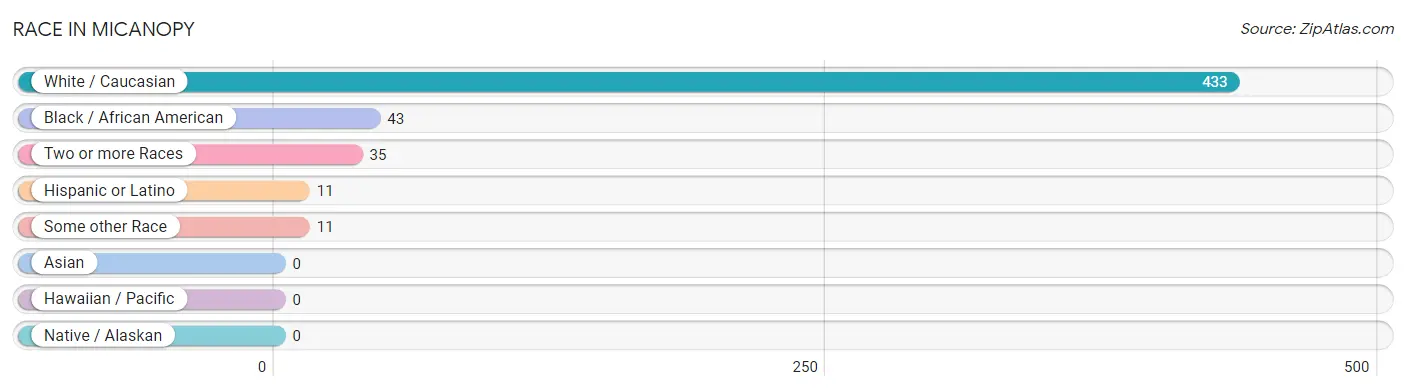
Race in Micanopy
The most populous races in Micanopy are White / Caucasian (433 | 83.0%), Black / African American (43 | 8.2%), and Two or more Races (35 | 6.7%).
| Race | # Population | % Population |
| Asian | 0 | 0.0% |
| Black / African American | 43 | 8.2% |
| Hawaiian / Pacific | 0 | 0.0% |
| Hispanic or Latino | 11 | 2.1% |
| Native / Alaskan | 0 | 0.0% |
| White / Caucasian | 433 | 83.0% |
| Two or more Races | 35 | 6.7% |
| Some other Race | 11 | 2.1% |
| Total | 522 | 100.0% |
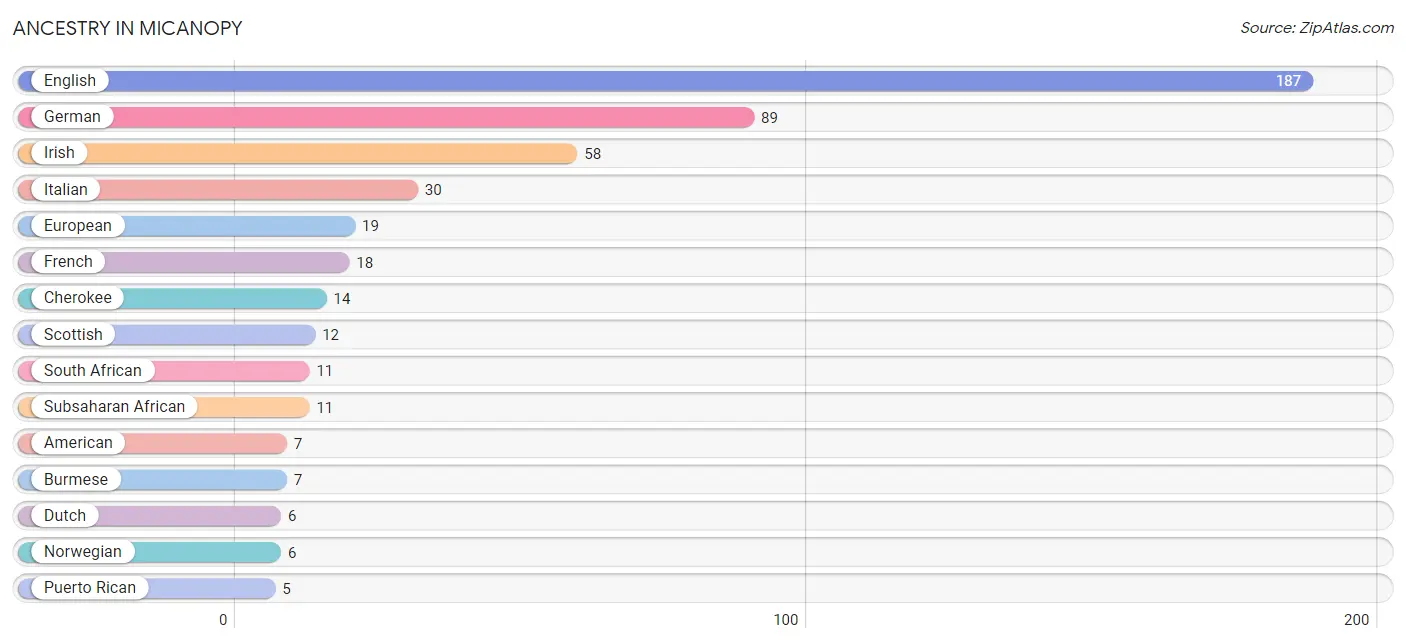
Ancestry in Micanopy
The most populous ancestries reported in Micanopy are English (187 | 35.8%), German (89 | 17.1%), Irish (58 | 11.1%), Italian (30 | 5.8%), and European (19 | 3.6%), together accounting for 73.4% of all Micanopy residents.
| Ancestry | # Population | % Population |
| American | 7 | 1.3% |
| Arab | 2 | 0.4% |
| British | 4 | 0.8% |
| Burmese | 7 | 1.3% |
| Canadian | 4 | 0.8% |
| Cherokee | 14 | 2.7% |
| Dutch | 6 | 1.1% |
| English | 187 | 35.8% |
| European | 19 | 3.6% |
| French | 18 | 3.5% |
| German | 89 | 17.1% |
| Hungarian | 3 | 0.6% |
| Irish | 58 | 11.1% |
| Italian | 30 | 5.8% |
| Mexican | 3 | 0.6% |
| Norwegian | 6 | 1.1% |
| Polish | 2 | 0.4% |
| Puerto Rican | 5 | 1.0% |
| Scotch-Irish | 5 | 1.0% |
| Scottish | 12 | 2.3% |
| Slavic | 2 | 0.4% |
| South African | 11 | 2.1% |
| Subsaharan African | 11 | 2.1% |
| Swedish | 4 | 0.8% |
| Welsh | 5 | 1.0% |
| West Indian | 2 | 0.4% | View All 26 Rows |
Immigrants in Micanopy
The most numerous immigrant groups reported in Micanopy came from Europe (8 | 1.5%), Africa (7 | 1.3%), South Africa (7 | 1.3%), Germany (5 | 1.0%), and Western Europe (5 | 1.0%), together accounting for 6.1% of all Micanopy residents.
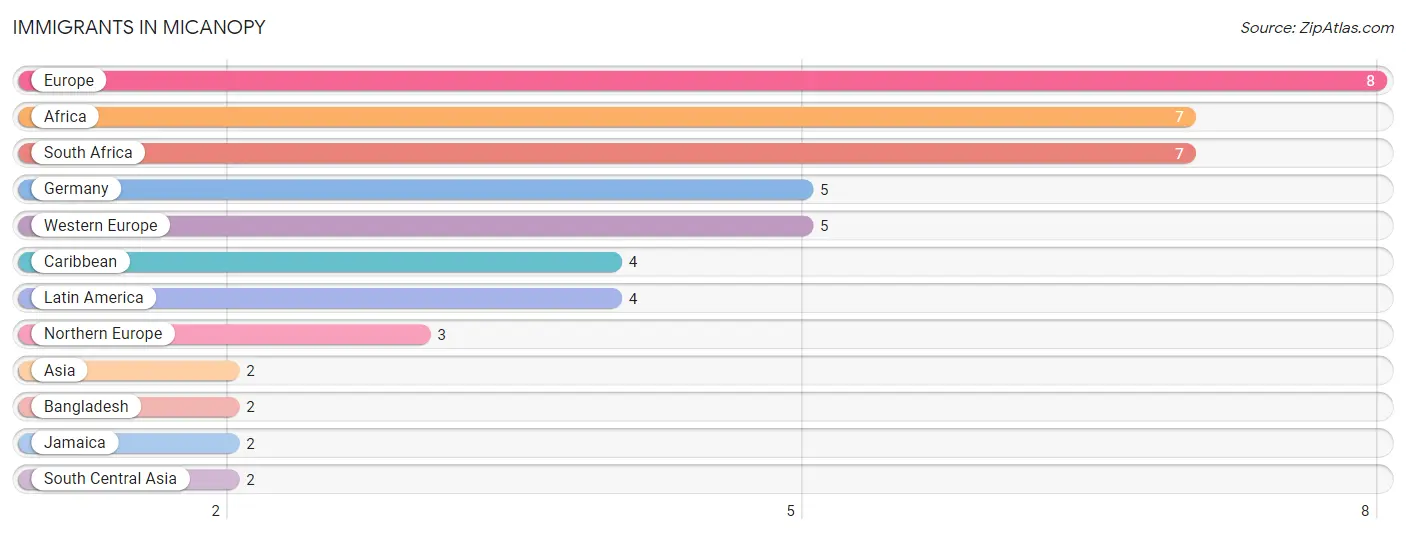
| Immigration Origin | # Population | % Population |
| Africa | 7 | 1.3% |
| Asia | 2 | 0.4% |
| Bangladesh | 2 | 0.4% |
| Caribbean | 4 | 0.8% |
| Europe | 8 | 1.5% |
| Germany | 5 | 1.0% |
| Jamaica | 2 | 0.4% |
| Latin America | 4 | 0.8% |
| Northern Europe | 3 | 0.6% |
| South Africa | 7 | 1.3% |
| South Central Asia | 2 | 0.4% |
| Western Europe | 5 | 1.0% | View All 12 Rows |
Sex and Age in Micanopy
Sex and Age in Micanopy
The most populous age groups in Micanopy are 35 to 39 Years (46 | 19.5%) for men and 25 to 29 Years (47 | 16.4%) for women.
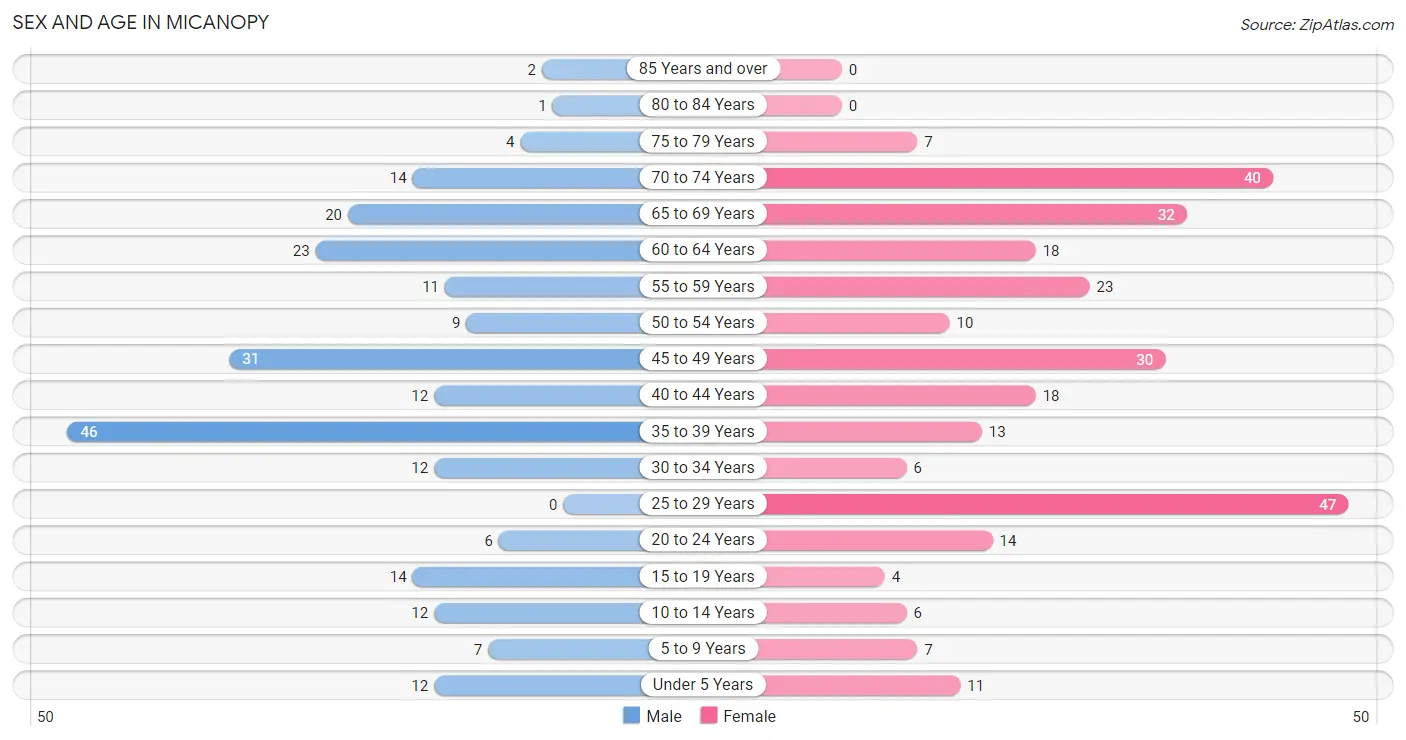
| Age Bracket | Male | Female |
| Under 5 Years | 12 (5.1%) | 11 (3.8%) |
| 5 to 9 Years | 7 (3.0%) | 7 (2.5%) |
| 10 to 14 Years | 12 (5.1%) | 6 (2.1%) |
| 15 to 19 Years | 14 (5.9%) | 4 (1.4%) |
| 20 to 24 Years | 6 (2.5%) | 14 (4.9%) |
| 25 to 29 Years | 0 (0.0%) | 47 (16.4%) |
| 30 to 34 Years | 12 (5.1%) | 6 (2.1%) |
| 35 to 39 Years | 46 (19.5%) | 13 (4.5%) |
| 40 to 44 Years | 12 (5.1%) | 18 (6.3%) |
| 45 to 49 Years | 31 (13.1%) | 30 (10.5%) |
| 50 to 54 Years | 9 (3.8%) | 10 (3.5%) |
| 55 to 59 Years | 11 (4.7%) | 23 (8.0%) |
| 60 to 64 Years | 23 (9.8%) | 18 (6.3%) |
| 65 to 69 Years | 20 (8.5%) | 32 (11.2%) |
| 70 to 74 Years | 14 (5.9%) | 40 (14.0%) |
| 75 to 79 Years | 4 (1.7%) | 7 (2.5%) |
| 80 to 84 Years | 1 (0.4%) | 0 (0.0%) |
| 85 Years and over | 2 (0.9%) | 0 (0.0%) |
| Total | 236 (100.0%) | 286 (100.0%) |
Families and Households in Micanopy
Median Family Size in Micanopy
The median family size in Micanopy is 2.93 persons per family, with single male/father families (8 | 7.8%) accounting for the largest median family size of 6.63 persons per family. On the other hand, married-couple families (87 | 84.5%) represent the smallest median family size with 2.44 persons per family.
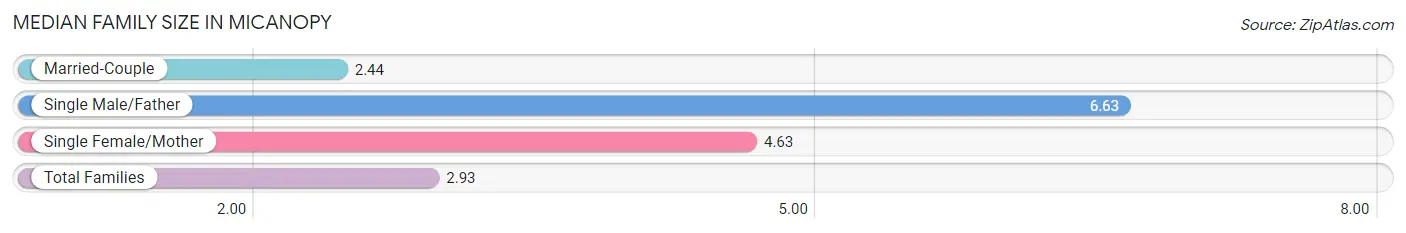
| Family Type | # Families | Family Size |
| Married-Couple | 87 (84.5%) | 2.44 |
| Single Male/Father | 8 (7.8%) | 6.63 |
| Single Female/Mother | 8 (7.8%) | 4.63 |
| Total Families | 103 (100.0%) | 2.93 |
Median Household Size in Micanopy
The median household size in Micanopy is 2.09 persons per household, with single male/father households (8 | 3.2%) accounting for the largest median household size of 8.38 persons per household. non-family households (147 | 58.8%) represent the smallest median household size with 1.36 persons per household.
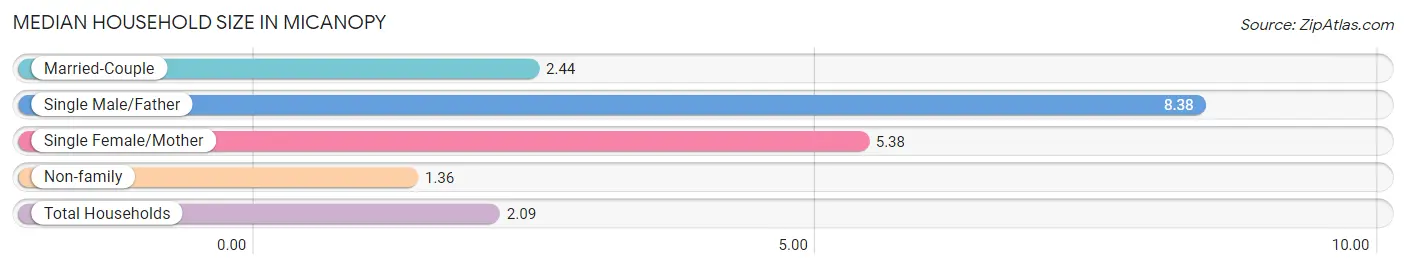
| Household Type | # Households | Household Size |
| Married-Couple | 87 (34.8%) | 2.44 |
| Single Male/Father | 8 (3.2%) | 8.38 |
| Single Female/Mother | 8 (3.2%) | 5.38 |
| Non-family | 147 (58.8%) | 1.36 |
| Total Households | 250 (100.0%) | 2.09 |
Household Size by Marriage Status in Micanopy
Out of a total of 250 households in Micanopy, 103 (41.2%) are family households, while 147 (58.8%) are nonfamily households. The most numerous type of family households are 2-person households, comprising 66, and the most common type of nonfamily households are 1-person households, comprising 112.
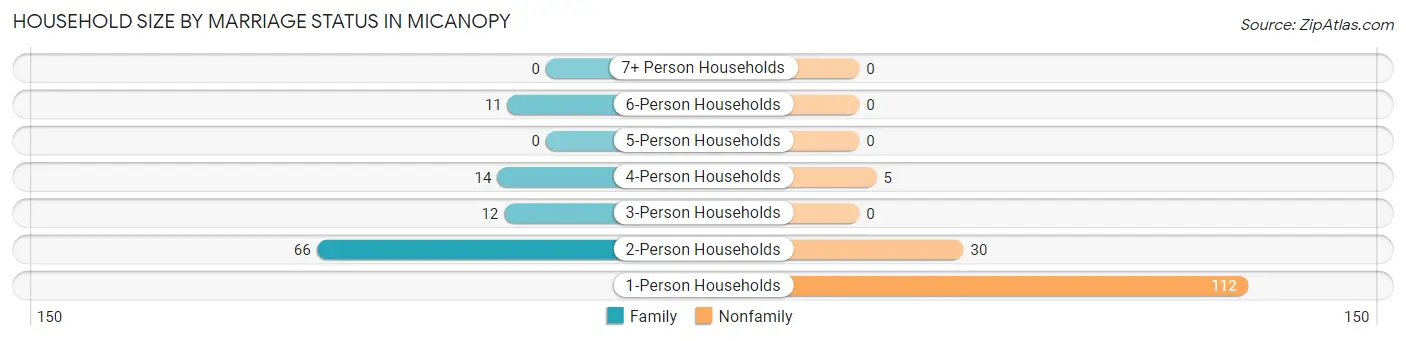
| Household Size | Family Households | Nonfamily Households |
| 1-Person Households | - | 112 (44.8%) |
| 2-Person Households | 66 (26.4%) | 30 (12.0%) |
| 3-Person Households | 12 (4.8%) | 0 (0.0%) |
| 4-Person Households | 14 (5.6%) | 5 (2.0%) |
| 5-Person Households | 0 (0.0%) | 0 (0.0%) |
| 6-Person Households | 11 (4.4%) | 0 (0.0%) |
| 7+ Person Households | 0 (0.0%) | 0 (0.0%) |
| Total | 103 (41.2%) | 147 (58.8%) |
Female Fertility in Micanopy
Fertility by Age in Micanopy
Average fertility rate in Micanopy is 104.0 births per 1,000 women. Women in the age bracket of 20 to 34 years have the highest fertility rate with 209.0 births per 1,000 women. Women in the age bracket of 20 to 34 years acount for 100.0% of all women with births.
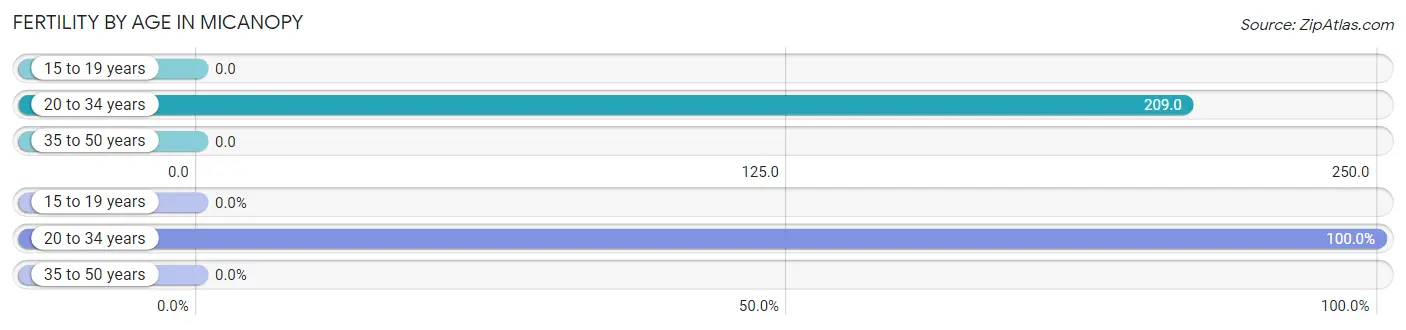
| Age Bracket | Women with Births | Births / 1,000 Women |
| 15 to 19 years | 0 (0.0%) | 0.0 |
| 20 to 34 years | 14 (100.0%) | 209.0 |
| 35 to 50 years | 0 (0.0%) | 0.0 |
| Total | 14 (100.0%) | 104.0 |
Fertility by Age by Marriage Status in Micanopy
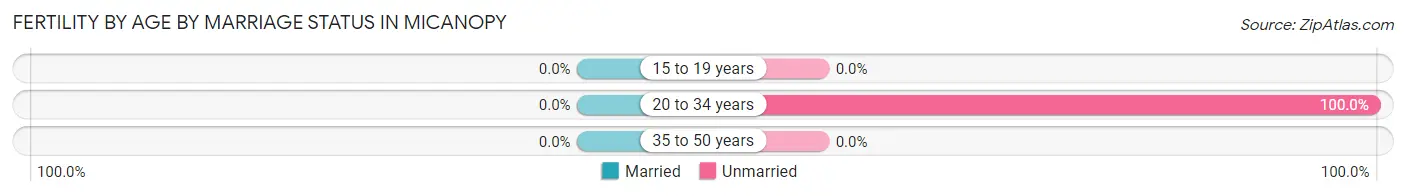
| Age Bracket | Married | Unmarried |
| 15 to 19 years | 0 (0.0%) | 0 (0.0%) |
| 20 to 34 years | 0 (0.0%) | 14 (100.0%) |
| 35 to 50 years | 0 (0.0%) | 0 (0.0%) |
| Total | 0 (0.0%) | 14 (100.0%) |
Fertility by Education in Micanopy
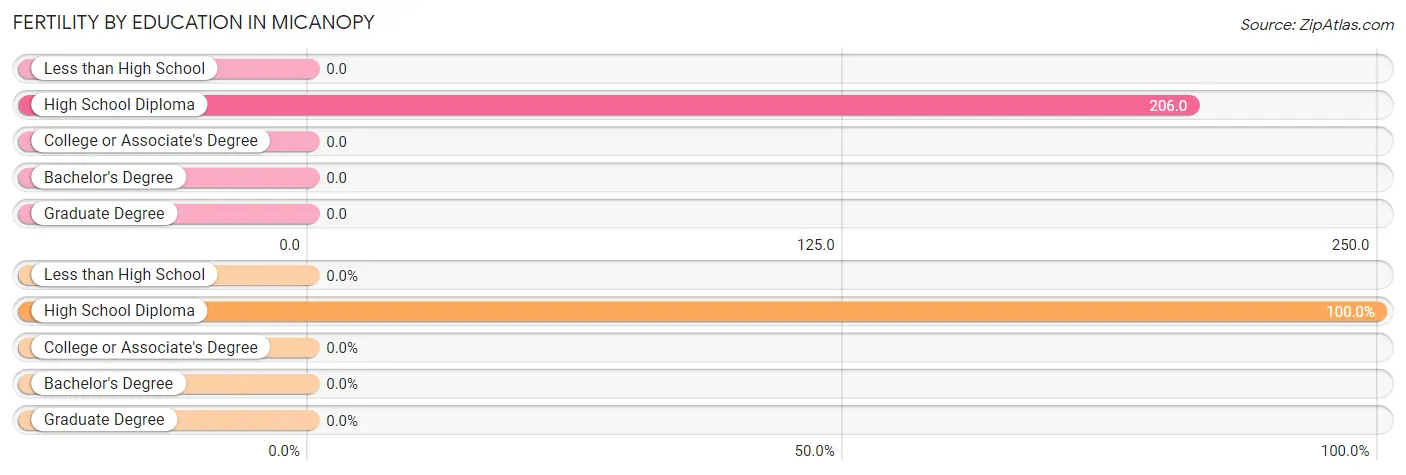
| Educational Attainment | Women with Births | Births / 1,000 Women |
| Less than High School | 0 (0.0%) | 0.0 |
| High School Diploma | 14 (100.0%) | 206.0 |
| College or Associate's Degree | 0 (0.0%) | 0.0 |
| Bachelor's Degree | 0 (0.0%) | 0.0 |
| Graduate Degree | 0 (0.0%) | 0.0 |
| Total | 14 (100.0%) | 104.0 |
Fertility by Education by Marriage Status in Micanopy
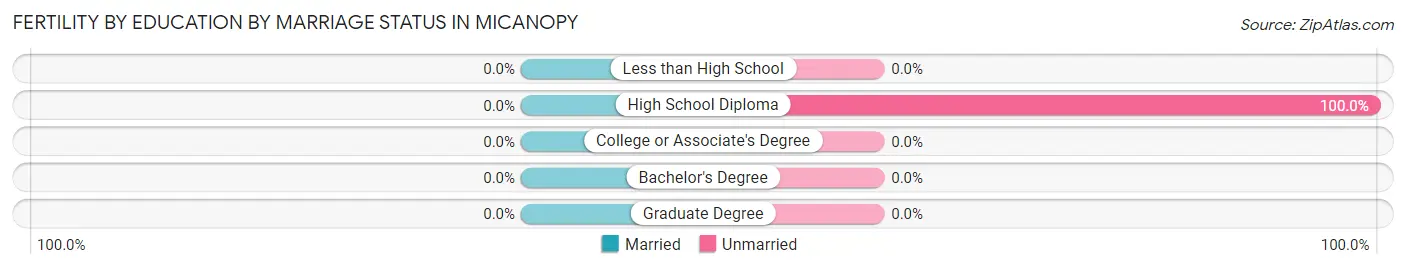
| Educational Attainment | Married | Unmarried |
| Less than High School | 0 (0.0%) | 0 (0.0%) |
| High School Diploma | 0 (0.0%) | 14 (100.0%) |
| College or Associate's Degree | 0 (0.0%) | 0 (0.0%) |
| Bachelor's Degree | 0 (0.0%) | 0 (0.0%) |
| Graduate Degree | 0 (0.0%) | 0 (0.0%) |
| Total | 0 (0.0%) | 14 (100.0%) |
Employment Characteristics in Micanopy
Employment by Class of Employer in Micanopy
Among the 274 employed individuals in Micanopy, private company employees (152 | 55.5%), state government employees (47 | 17.2%), and not-for-profit organizations (32 | 11.7%) make up the most common classes of employment.
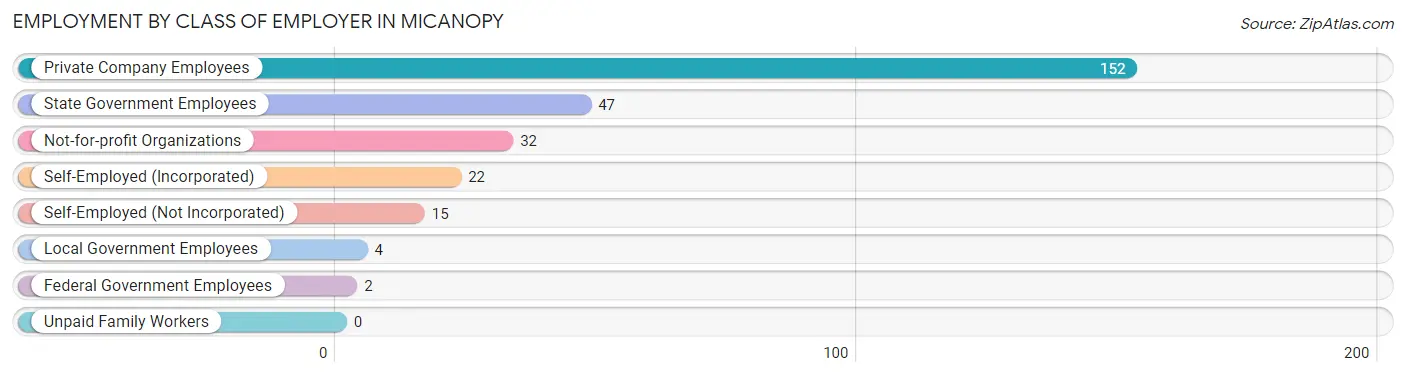
| Employer Class | # Employees | % Employees |
| Private Company Employees | 152 | 55.5% |
| Self-Employed (Incorporated) | 22 | 8.0% |
| Self-Employed (Not Incorporated) | 15 | 5.5% |
| Not-for-profit Organizations | 32 | 11.7% |
| Local Government Employees | 4 | 1.5% |
| State Government Employees | 47 | 17.2% |
| Federal Government Employees | 2 | 0.7% |
| Unpaid Family Workers | 0 | 0.0% |
| Total | 274 | 100.0% |
Employment Status by Age in Micanopy
According to the labor force statistics for Micanopy, out of the total population over 16 years of age (465), 63.2% or 294 individuals are in the labor force, with 6.8% or 20 of them unemployed. The age group with the highest labor force participation rate is 20 to 24 years, with 100.0% or 20 individuals in the labor force. Within the labor force, the 20 to 24 years age range has the highest percentage of unemployed individuals, with 95.0% or 19 of them being unemployed.
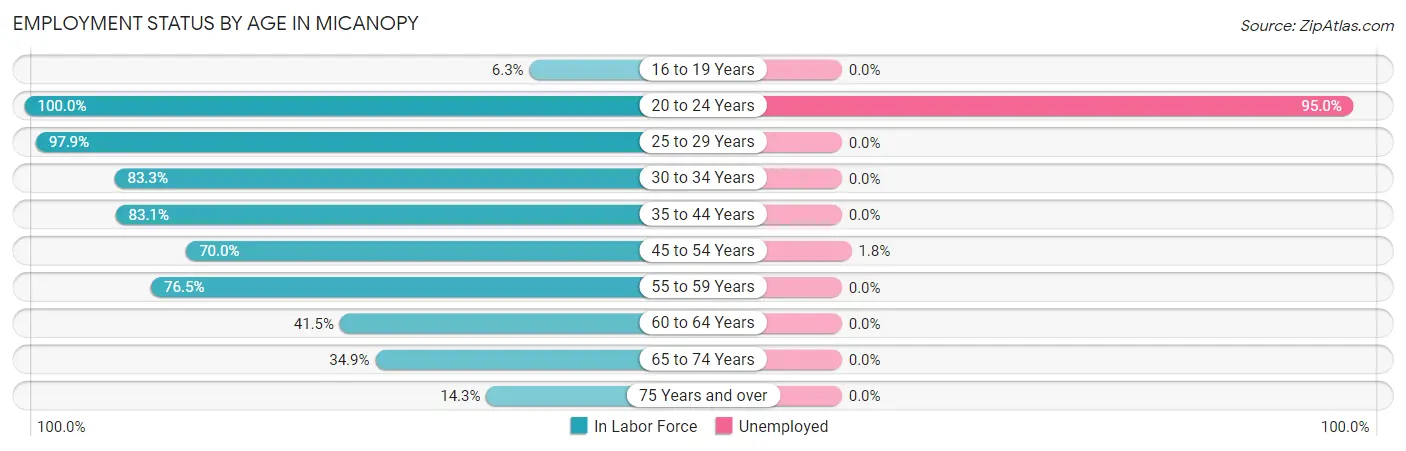
| Age Bracket | In Labor Force | Unemployed |
| 16 to 19 Years | 1 (6.3%) | 0 (0.0%) |
| 20 to 24 Years | 20 (100.0%) | 19 (95.0%) |
| 25 to 29 Years | 46 (97.9%) | 0 (0.0%) |
| 30 to 34 Years | 15 (83.3%) | 0 (0.0%) |
| 35 to 44 Years | 74 (83.1%) | 0 (0.0%) |
| 45 to 54 Years | 56 (70.0%) | 1 (1.8%) |
| 55 to 59 Years | 26 (76.5%) | 0 (0.0%) |
| 60 to 64 Years | 17 (41.5%) | 0 (0.0%) |
| 65 to 74 Years | 37 (34.9%) | 0 (0.0%) |
| 75 Years and over | 2 (14.3%) | 0 (0.0%) |
| Total | 294 (63.2%) | 20 (6.8%) |
Employment Status by Educational Attainment in Micanopy
According to labor force statistics for Micanopy, 75.7% of individuals (234) out of the total population between 25 and 64 years of age (309) are in the labor force, with 0.4% or 1 of them being unemployed. The group with the highest labor force participation rate are those with the educational attainment of high school diploma, with 82.5% or 94 individuals in the labor force. Within the labor force, individuals with high school diploma education have the highest percentage of unemployment, with 1.1% or 1 of them being unemployed.
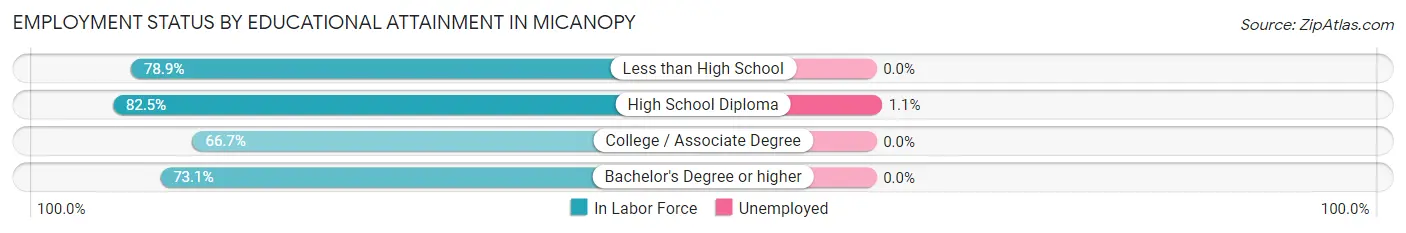
| Educational Attainment | In Labor Force | Unemployed |
| Less than High School | 15 (78.9%) | 0 (0.0%) |
| High School Diploma | 94 (82.5%) | 1 (1.1%) |
| College / Associate Degree | 38 (66.7%) | 0 (0.0%) |
| Bachelor's Degree or higher | 87 (73.1%) | 0 (0.0%) |
| Total | 234 (75.7%) | 1 (0.4%) |
Employment Occupations by Sex in Micanopy
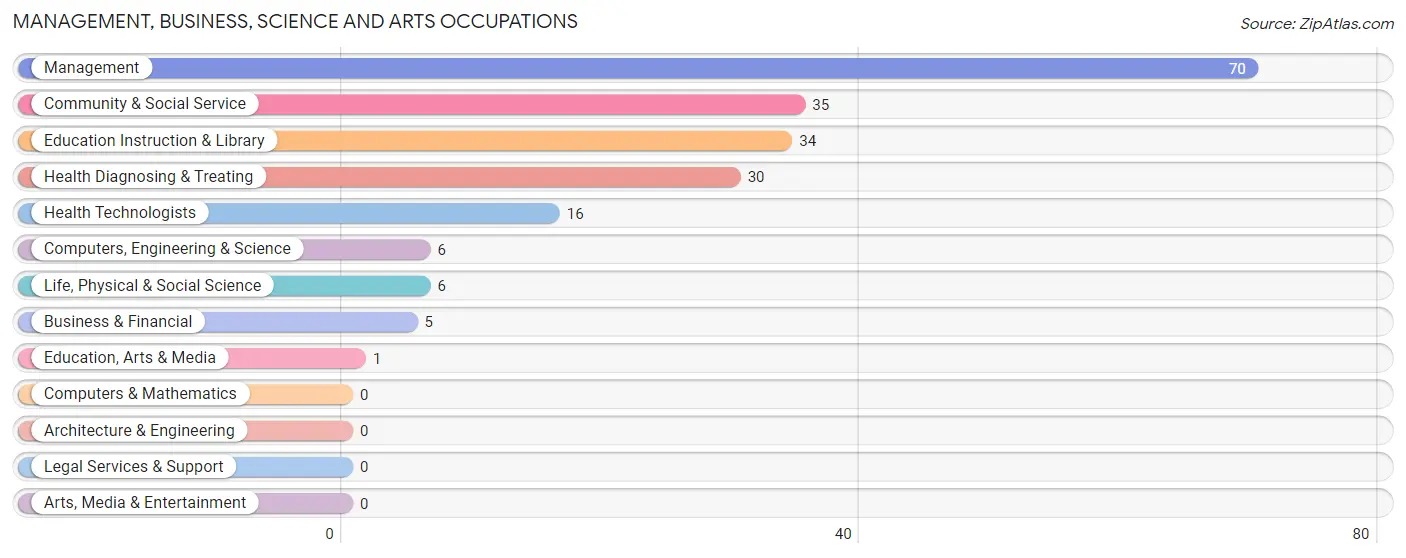
Management, Business, Science and Arts Occupations
The most common Management, Business, Science and Arts occupations in Micanopy are Management (70 | 25.6%), Community & Social Service (35 | 12.8%), Education Instruction & Library (34 | 12.4%), Health Diagnosing & Treating (30 | 11.0%), and Health Technologists (16 | 5.8%).
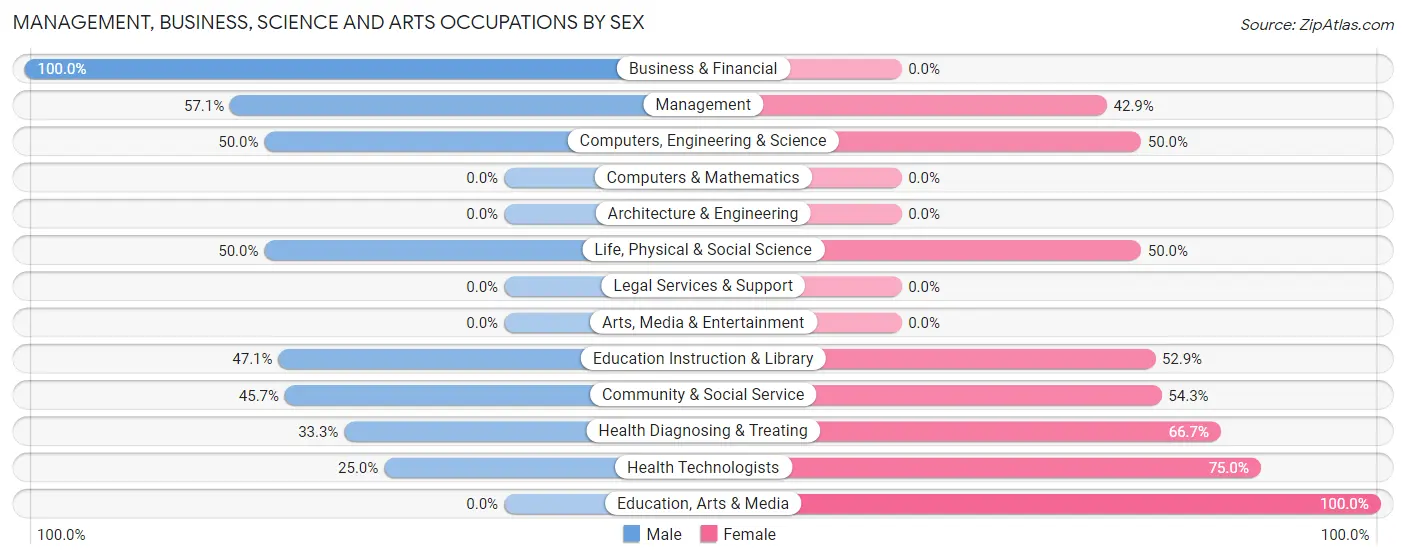
Management, Business, Science and Arts Occupations by Sex
Within the Management, Business, Science and Arts occupations in Micanopy, the most male-oriented occupations are Business & Financial (100.0%), Management (57.1%), and Computers, Engineering & Science (50.0%), while the most female-oriented occupations are Education, Arts & Media (100.0%), Health Technologists (75.0%), and Health Diagnosing & Treating (66.7%).
| Occupation | Male | Female |
| Management | 40 (57.1%) | 30 (42.9%) |
| Business & Financial | 5 (100.0%) | 0 (0.0%) |
| Computers, Engineering & Science | 3 (50.0%) | 3 (50.0%) |
| Computers & Mathematics | 0 (0.0%) | 0 (0.0%) |
| Architecture & Engineering | 0 (0.0%) | 0 (0.0%) |
| Life, Physical & Social Science | 3 (50.0%) | 3 (50.0%) |
| Community & Social Service | 16 (45.7%) | 19 (54.3%) |
| Education, Arts & Media | 0 (0.0%) | 1 (100.0%) |
| Legal Services & Support | 0 (0.0%) | 0 (0.0%) |
| Education Instruction & Library | 16 (47.1%) | 18 (52.9%) |
| Arts, Media & Entertainment | 0 (0.0%) | 0 (0.0%) |
| Health Diagnosing & Treating | 10 (33.3%) | 20 (66.7%) |
| Health Technologists | 4 (25.0%) | 12 (75.0%) |
| Total (Category) | 74 (50.7%) | 72 (49.3%) |
| Total (Overall) | 129 (47.1%) | 145 (52.9%) |
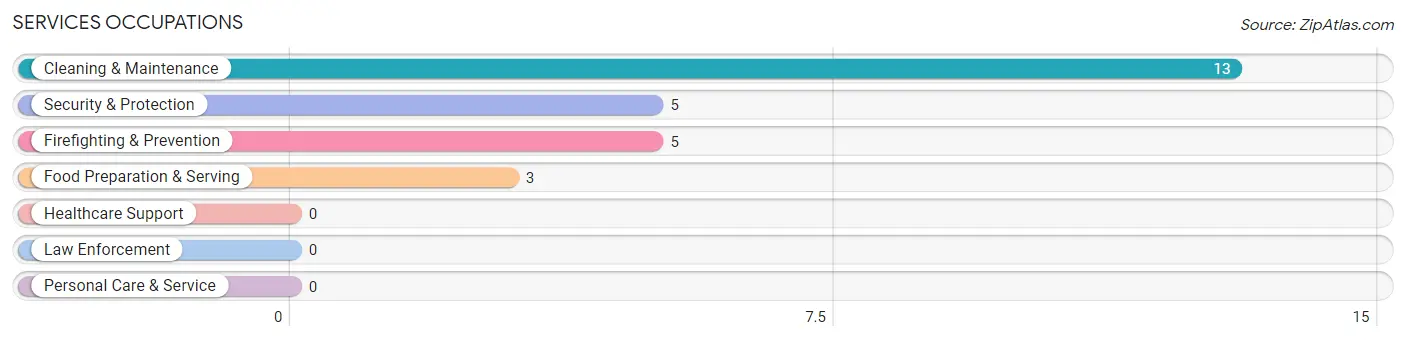
Services Occupations
The most common Services occupations in Micanopy are Cleaning & Maintenance (13 | 4.7%), Security & Protection (5 | 1.8%), Firefighting & Prevention (5 | 1.8%), and Food Preparation & Serving (3 | 1.1%).
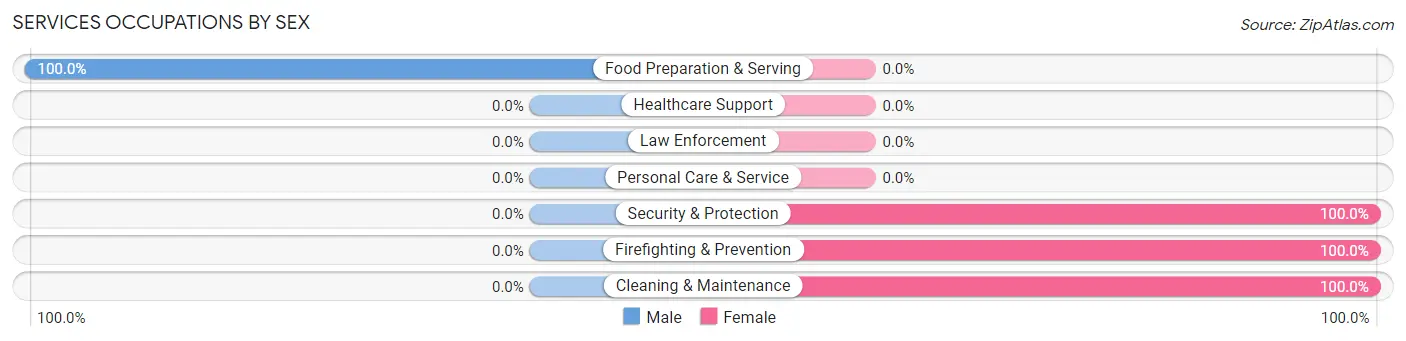
Services Occupations by Sex
| Occupation | Male | Female |
| Healthcare Support | 0 (0.0%) | 0 (0.0%) |
| Security & Protection | 0 (0.0%) | 5 (100.0%) |
| Firefighting & Prevention | 0 (0.0%) | 5 (100.0%) |
| Law Enforcement | 0 (0.0%) | 0 (0.0%) |
| Food Preparation & Serving | 3 (100.0%) | 0 (0.0%) |
| Cleaning & Maintenance | 0 (0.0%) | 13 (100.0%) |
| Personal Care & Service | 0 (0.0%) | 0 (0.0%) |
| Total (Category) | 3 (14.3%) | 18 (85.7%) |
| Total (Overall) | 129 (47.1%) | 145 (52.9%) |
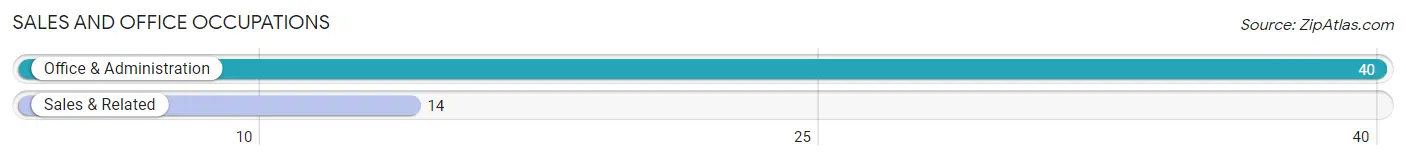
Sales and Office Occupations
The most common Sales and Office occupations in Micanopy are Office & Administration (40 | 14.6%), and Sales & Related (14 | 5.1%).
Sales and Office Occupations by Sex
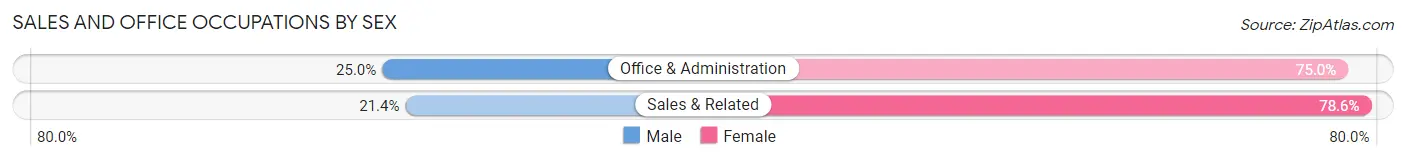
| Occupation | Male | Female |
| Sales & Related | 3 (21.4%) | 11 (78.6%) |
| Office & Administration | 10 (25.0%) | 30 (75.0%) |
| Total (Category) | 13 (24.1%) | 41 (75.9%) |
| Total (Overall) | 129 (47.1%) | 145 (52.9%) |
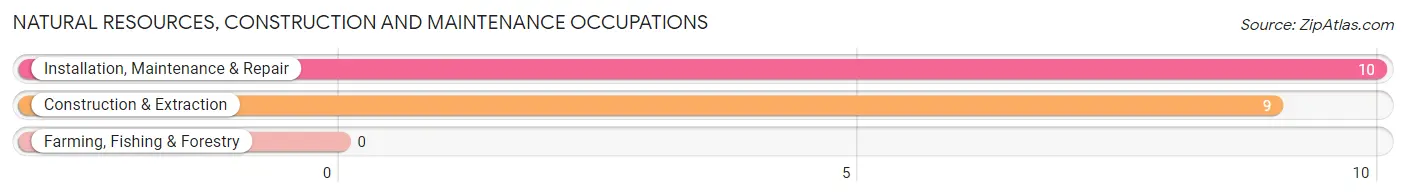
Natural Resources, Construction and Maintenance Occupations
The most common Natural Resources, Construction and Maintenance occupations in Micanopy are Installation, Maintenance & Repair (10 | 3.6%), and Construction & Extraction (9 | 3.3%).
Natural Resources, Construction and Maintenance Occupations by Sex

| Occupation | Male | Female |
| Farming, Fishing & Forestry | 0 (0.0%) | 0 (0.0%) |
| Construction & Extraction | 6 (66.7%) | 3 (33.3%) |
| Installation, Maintenance & Repair | 10 (100.0%) | 0 (0.0%) |
| Total (Category) | 16 (84.2%) | 3 (15.8%) |
| Total (Overall) | 129 (47.1%) | 145 (52.9%) |
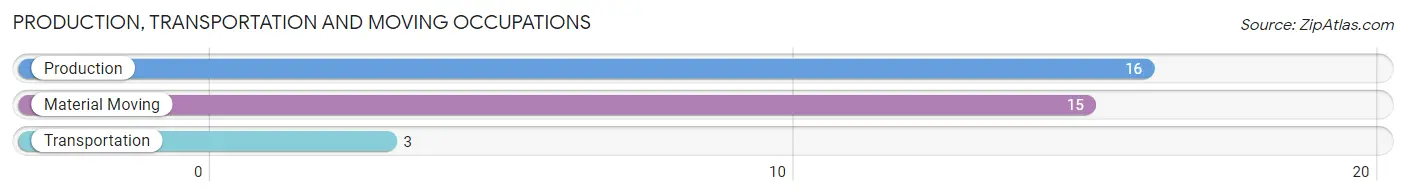
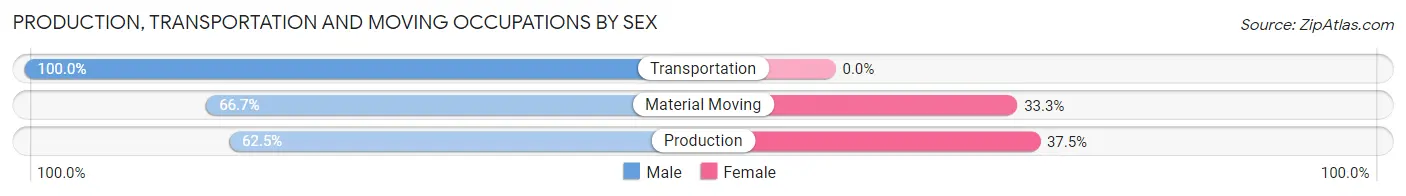
Production, Transportation and Moving Occupations
The most common Production, Transportation and Moving occupations in Micanopy are Production (16 | 5.8%), Material Moving (15 | 5.5%), and Transportation (3 | 1.1%).
Production, Transportation and Moving Occupations by Sex
| Occupation | Male | Female |
| Production | 10 (62.5%) | 6 (37.5%) |
| Transportation | 3 (100.0%) | 0 (0.0%) |
| Material Moving | 10 (66.7%) | 5 (33.3%) |
| Total (Category) | 23 (67.6%) | 11 (32.4%) |
| Total (Overall) | 129 (47.1%) | 145 (52.9%) |
Employment Industries by Sex in Micanopy
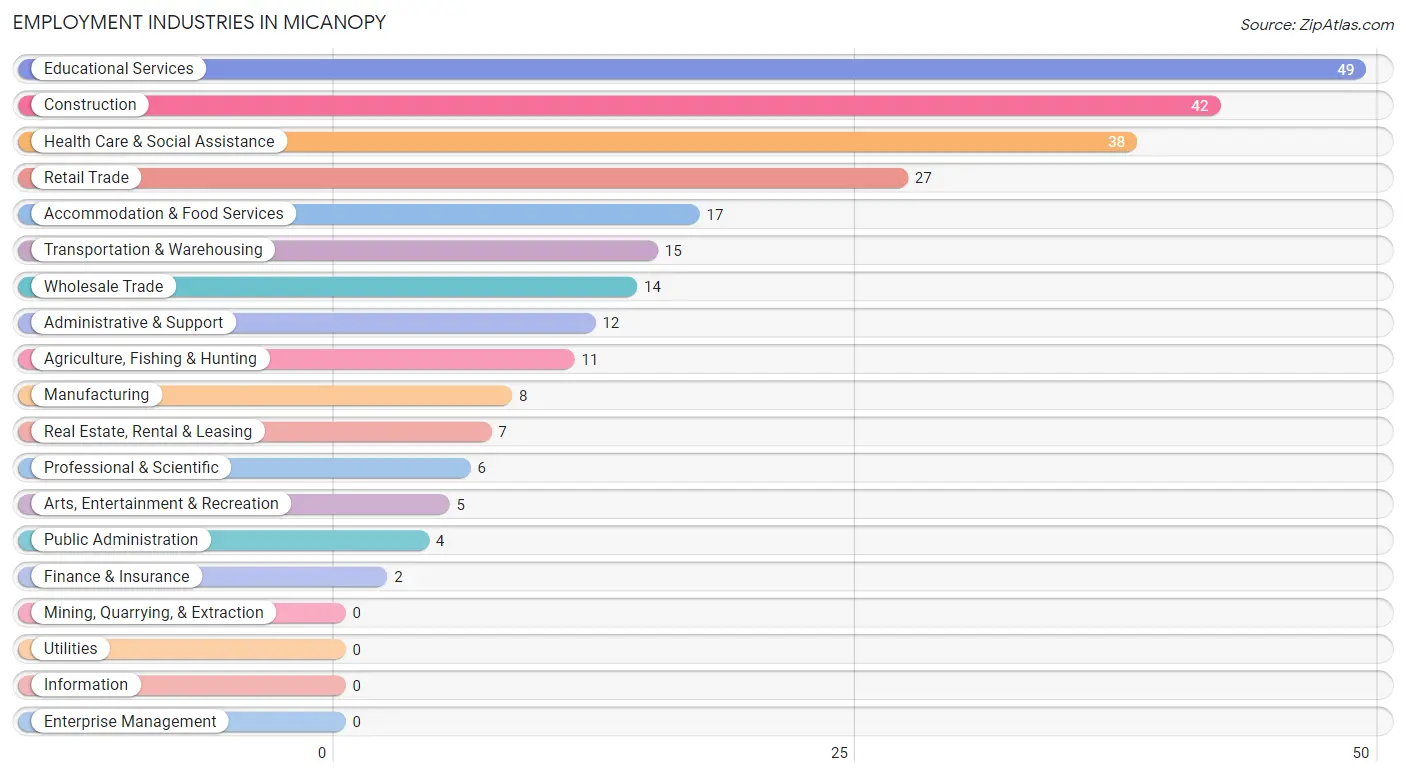
Employment Industries in Micanopy
The major employment industries in Micanopy include Educational Services (49 | 17.9%), Construction (42 | 15.3%), Health Care & Social Assistance (38 | 13.9%), Retail Trade (27 | 9.9%), and Accommodation & Food Services (17 | 6.2%).
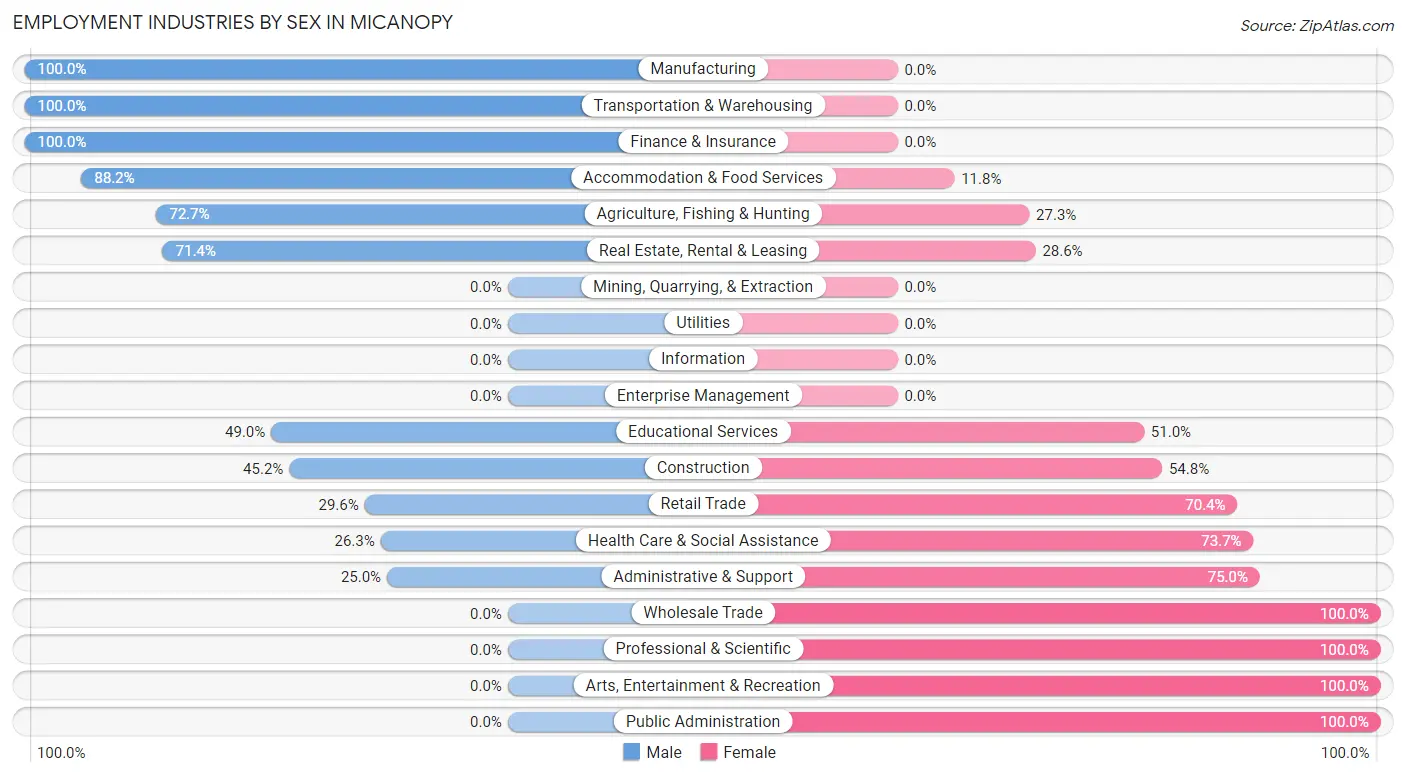
Employment Industries by Sex in Micanopy
The Micanopy industries that see more men than women are Manufacturing (100.0%), Transportation & Warehousing (100.0%), and Finance & Insurance (100.0%), whereas the industries that tend to have a higher number of women are Wholesale Trade (100.0%), Professional & Scientific (100.0%), and Arts, Entertainment & Recreation (100.0%).
| Industry | Male | Female |
| Agriculture, Fishing & Hunting | 8 (72.7%) | 3 (27.3%) |
| Mining, Quarrying, & Extraction | 0 (0.0%) | 0 (0.0%) |
| Construction | 19 (45.2%) | 23 (54.8%) |
| Manufacturing | 8 (100.0%) | 0 (0.0%) |
| Wholesale Trade | 0 (0.0%) | 14 (100.0%) |
| Retail Trade | 8 (29.6%) | 19 (70.4%) |
| Transportation & Warehousing | 15 (100.0%) | 0 (0.0%) |
| Utilities | 0 (0.0%) | 0 (0.0%) |
| Information | 0 (0.0%) | 0 (0.0%) |
| Finance & Insurance | 2 (100.0%) | 0 (0.0%) |
| Real Estate, Rental & Leasing | 5 (71.4%) | 2 (28.6%) |
| Professional & Scientific | 0 (0.0%) | 6 (100.0%) |
| Enterprise Management | 0 (0.0%) | 0 (0.0%) |
| Administrative & Support | 3 (25.0%) | 9 (75.0%) |
| Educational Services | 24 (49.0%) | 25 (51.0%) |
| Health Care & Social Assistance | 10 (26.3%) | 28 (73.7%) |
| Arts, Entertainment & Recreation | 0 (0.0%) | 5 (100.0%) |
| Accommodation & Food Services | 15 (88.2%) | 2 (11.8%) |
| Public Administration | 0 (0.0%) | 4 (100.0%) |
| Total | 129 (47.1%) | 145 (52.9%) |
Education in Micanopy
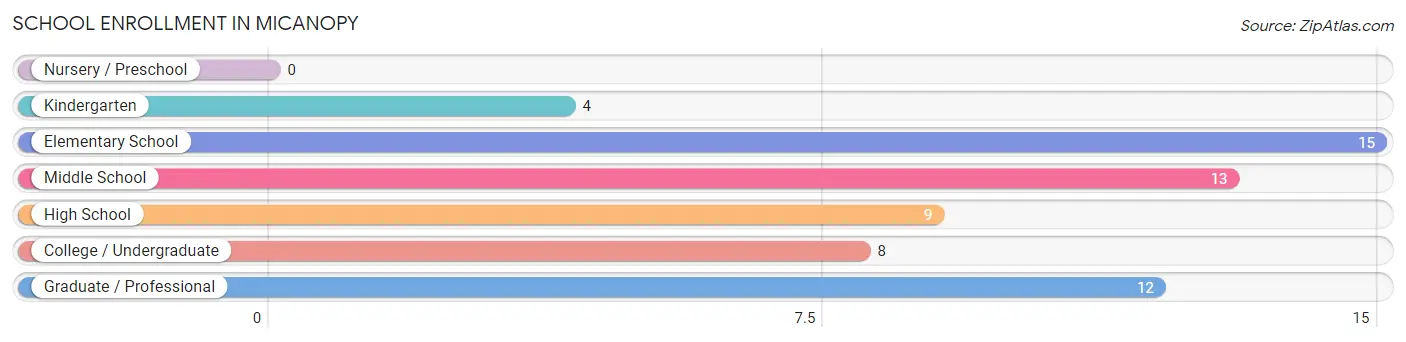
School Enrollment in Micanopy
The most common levels of schooling among the 61 students in Micanopy are elementary school (15 | 24.6%), middle school (13 | 21.3%), and graduate / professional (12 | 19.7%).
| School Level | # Students | % Students |
| Nursery / Preschool | 0 | 0.0% |
| Kindergarten | 4 | 6.6% |
| Elementary School | 15 | 24.6% |
| Middle School | 13 | 21.3% |
| High School | 9 | 14.7% |
| College / Undergraduate | 8 | 13.1% |
| Graduate / Professional | 12 | 19.7% |
| Total | 61 | 100.0% |
School Enrollment by Age by Funding Source in Micanopy
Out of a total of 61 students who are enrolled in schools in Micanopy, 20 (32.8%) attend a private institution, while the remaining 41 (67.2%) are enrolled in public schools. The age group of 25 to 34 year olds has the highest likelihood of being enrolled in private schools, with 3 (75.0% in the age bracket) enrolled. Conversely, the age group of 15 to 17 year olds has the lowest likelihood of being enrolled in a private school, with 9 (100.0% in the age bracket) attending a public institution.
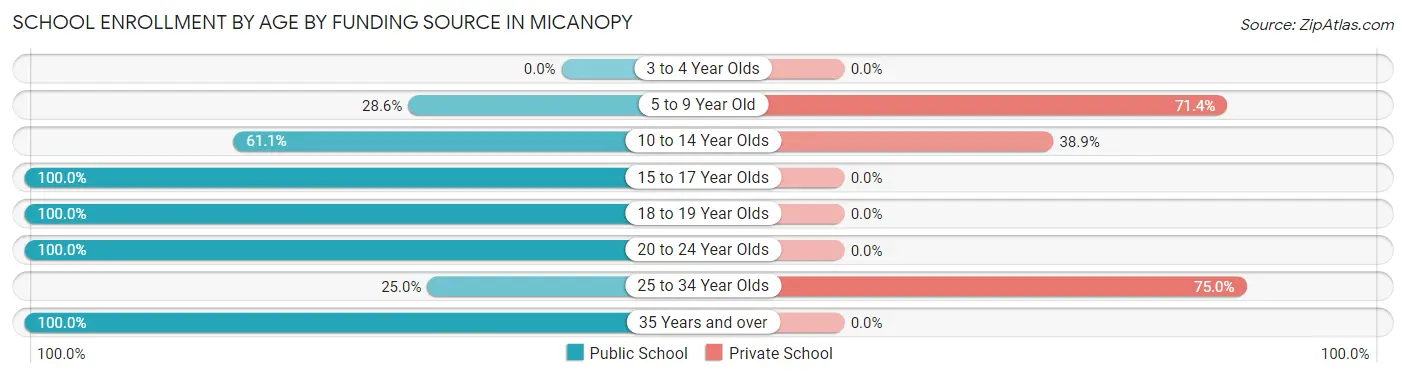
| Age Bracket | Public School | Private School |
| 3 to 4 Year Olds | 0 (0.0%) | 0 (0.0%) |
| 5 to 9 Year Old | 4 (28.6%) | 10 (71.4%) |
| 10 to 14 Year Olds | 11 (61.1%) | 7 (38.9%) |
| 15 to 17 Year Olds | 9 (100.0%) | 0 (0.0%) |
| 18 to 19 Year Olds | 1 (100.0%) | 0 (0.0%) |
| 20 to 24 Year Olds | 5 (100.0%) | 0 (0.0%) |
| 25 to 34 Year Olds | 1 (25.0%) | 3 (75.0%) |
| 35 Years and over | 10 (100.0%) | 0 (0.0%) |
| Total | 41 (67.2%) | 20 (32.8%) |
Educational Attainment by Field of Study in Micanopy
Bio, nature & agricultural (43 | 23.5%), visual & performing arts (19 | 10.4%), psychology (18 | 9.8%), education (18 | 9.8%), and science & technology (16 | 8.7%) are the most common fields of study among 183 individuals in Micanopy who have obtained a bachelor's degree or higher.
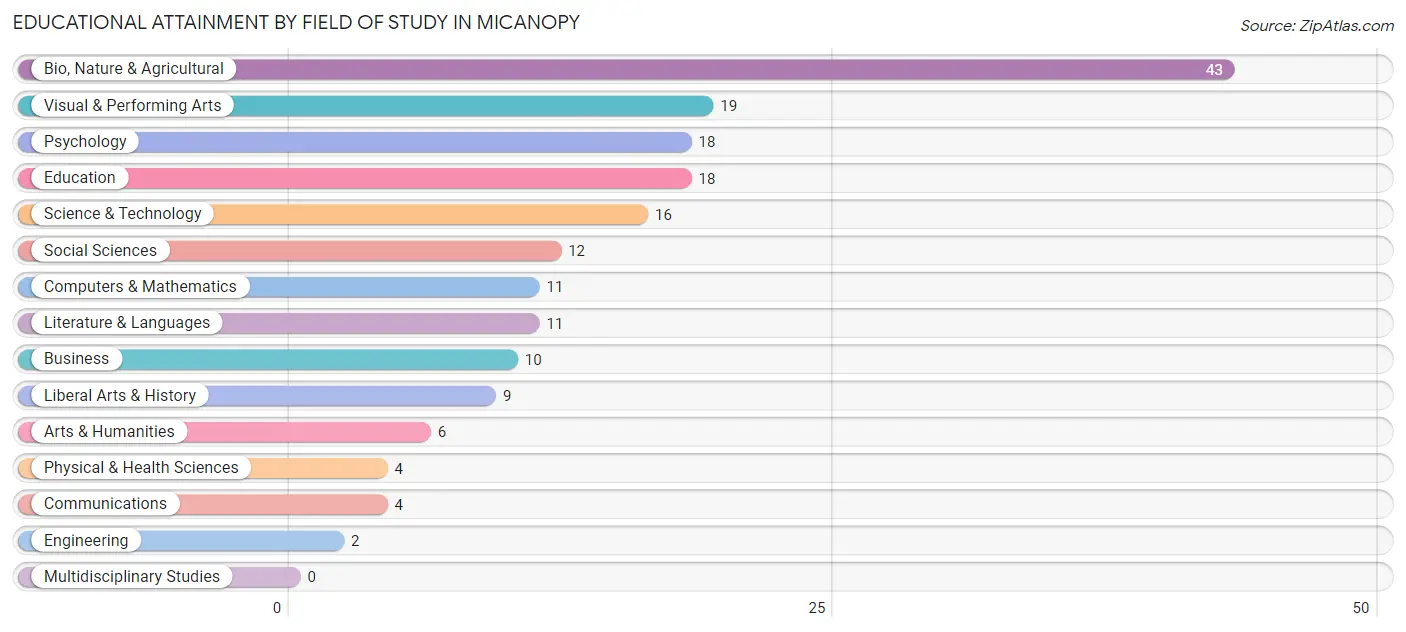
| Field of Study | # Graduates | % Graduates |
| Computers & Mathematics | 11 | 6.0% |
| Bio, Nature & Agricultural | 43 | 23.5% |
| Physical & Health Sciences | 4 | 2.2% |
| Psychology | 18 | 9.8% |
| Social Sciences | 12 | 6.6% |
| Engineering | 2 | 1.1% |
| Multidisciplinary Studies | 0 | 0.0% |
| Science & Technology | 16 | 8.7% |
| Business | 10 | 5.5% |
| Education | 18 | 9.8% |
| Literature & Languages | 11 | 6.0% |
| Liberal Arts & History | 9 | 4.9% |
| Visual & Performing Arts | 19 | 10.4% |
| Communications | 4 | 2.2% |
| Arts & Humanities | 6 | 3.3% |
| Total | 183 | 100.0% |
Transportation & Commute in Micanopy
Vehicle Availability by Sex in Micanopy
The most prevalent vehicle ownership categories in Micanopy are males with 2 vehicles (80, accounting for 62.0%) and females with 2 vehicles (70, making up 55.2%).
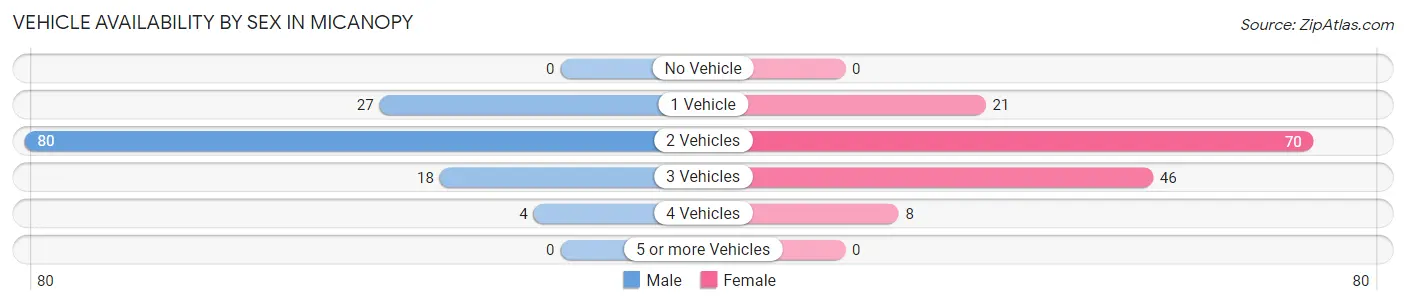
| Vehicles Available | Male | Female |
| No Vehicle | 0 (0.0%) | 0 (0.0%) |
| 1 Vehicle | 27 (20.9%) | 21 (14.5%) |
| 2 Vehicles | 80 (62.0%) | 70 (48.3%) |
| 3 Vehicles | 18 (14.0%) | 46 (31.7%) |
| 4 Vehicles | 4 (3.1%) | 8 (5.5%) |
| 5 or more Vehicles | 0 (0.0%) | 0 (0.0%) |
| Total | 129 (100.0%) | 145 (100.0%) |
Commute Time in Micanopy
The most frequently occuring commute durations in Micanopy are 30 to 34 minutes (75 commuters, 31.9%), 20 to 24 minutes (52 commuters, 22.1%), and 10 to 14 minutes (31 commuters, 13.2%).
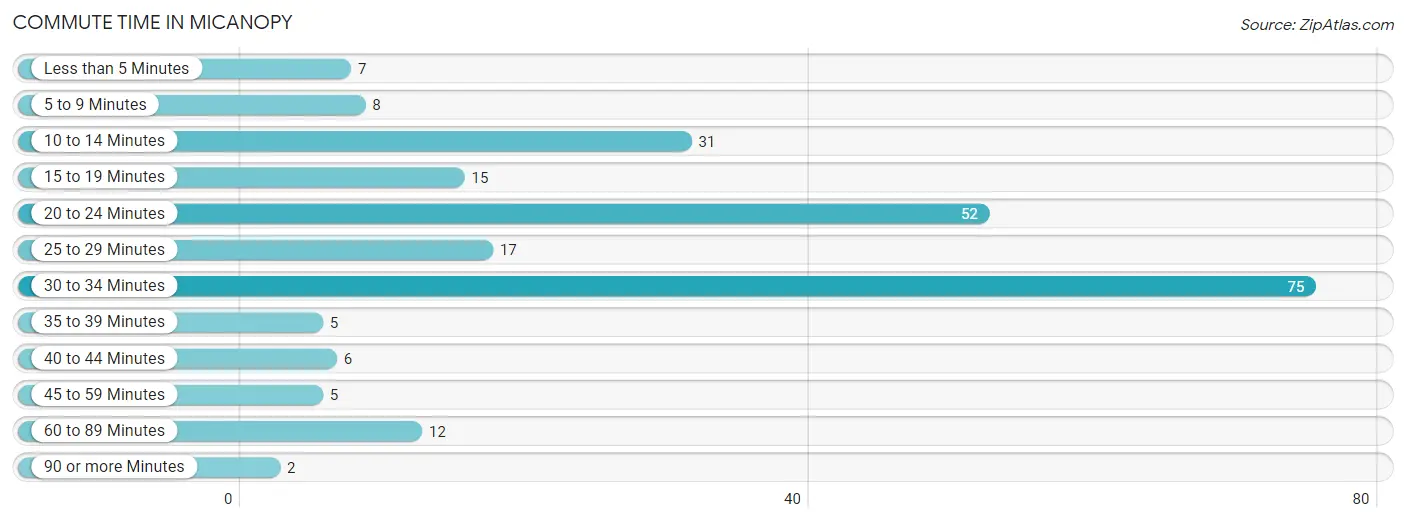
| Commute Time | # Commuters | % Commuters |
| Less than 5 Minutes | 7 | 3.0% |
| 5 to 9 Minutes | 8 | 3.4% |
| 10 to 14 Minutes | 31 | 13.2% |
| 15 to 19 Minutes | 15 | 6.4% |
| 20 to 24 Minutes | 52 | 22.1% |
| 25 to 29 Minutes | 17 | 7.2% |
| 30 to 34 Minutes | 75 | 31.9% |
| 35 to 39 Minutes | 5 | 2.1% |
| 40 to 44 Minutes | 6 | 2.5% |
| 45 to 59 Minutes | 5 | 2.1% |
| 60 to 89 Minutes | 12 | 5.1% |
| 90 or more Minutes | 2 | 0.9% |
Commute Time by Sex in Micanopy
The most common commute times in Micanopy are 20 to 24 minutes (33 commuters, 33.7%) for males and 30 to 34 minutes (49 commuters, 35.8%) for females.
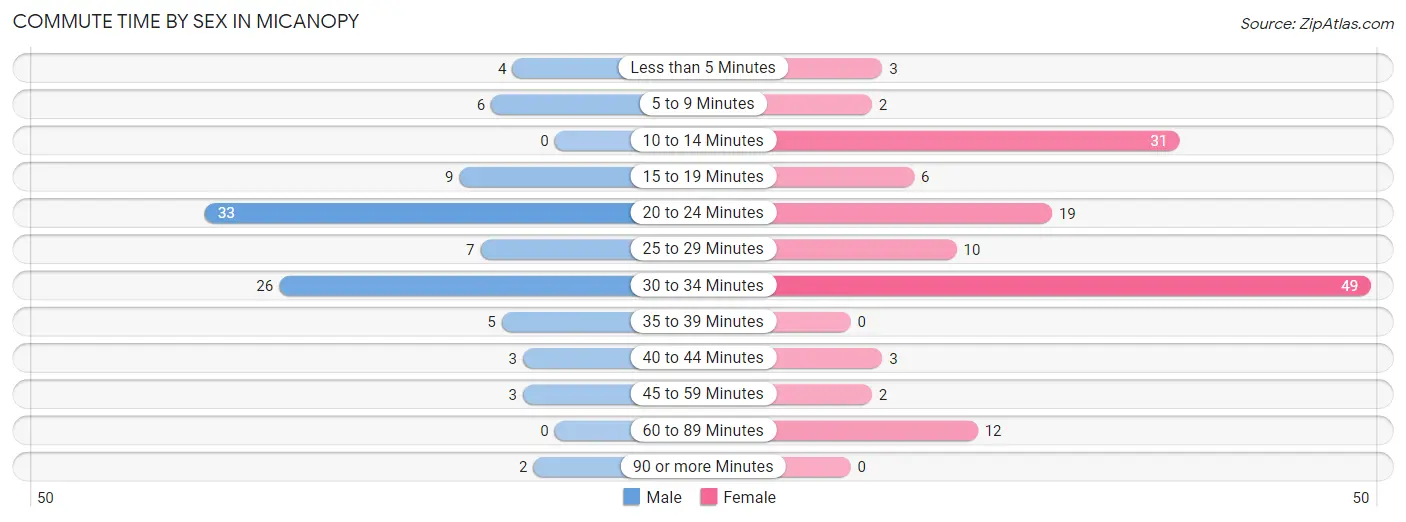
| Commute Time | Male | Female |
| Less than 5 Minutes | 4 (4.1%) | 3 (2.2%) |
| 5 to 9 Minutes | 6 (6.1%) | 2 (1.5%) |
| 10 to 14 Minutes | 0 (0.0%) | 31 (22.6%) |
| 15 to 19 Minutes | 9 (9.2%) | 6 (4.4%) |
| 20 to 24 Minutes | 33 (33.7%) | 19 (13.9%) |
| 25 to 29 Minutes | 7 (7.1%) | 10 (7.3%) |
| 30 to 34 Minutes | 26 (26.5%) | 49 (35.8%) |
| 35 to 39 Minutes | 5 (5.1%) | 0 (0.0%) |
| 40 to 44 Minutes | 3 (3.1%) | 3 (2.2%) |
| 45 to 59 Minutes | 3 (3.1%) | 2 (1.5%) |
| 60 to 89 Minutes | 0 (0.0%) | 12 (8.8%) |
| 90 or more Minutes | 2 (2.0%) | 0 (0.0%) |
Time of Departure to Work by Sex in Micanopy
The most frequent times of departure to work in Micanopy are 8:00 AM to 8:29 AM (33, 33.7%) for males and 7:00 AM to 7:29 AM (32, 23.4%) for females.
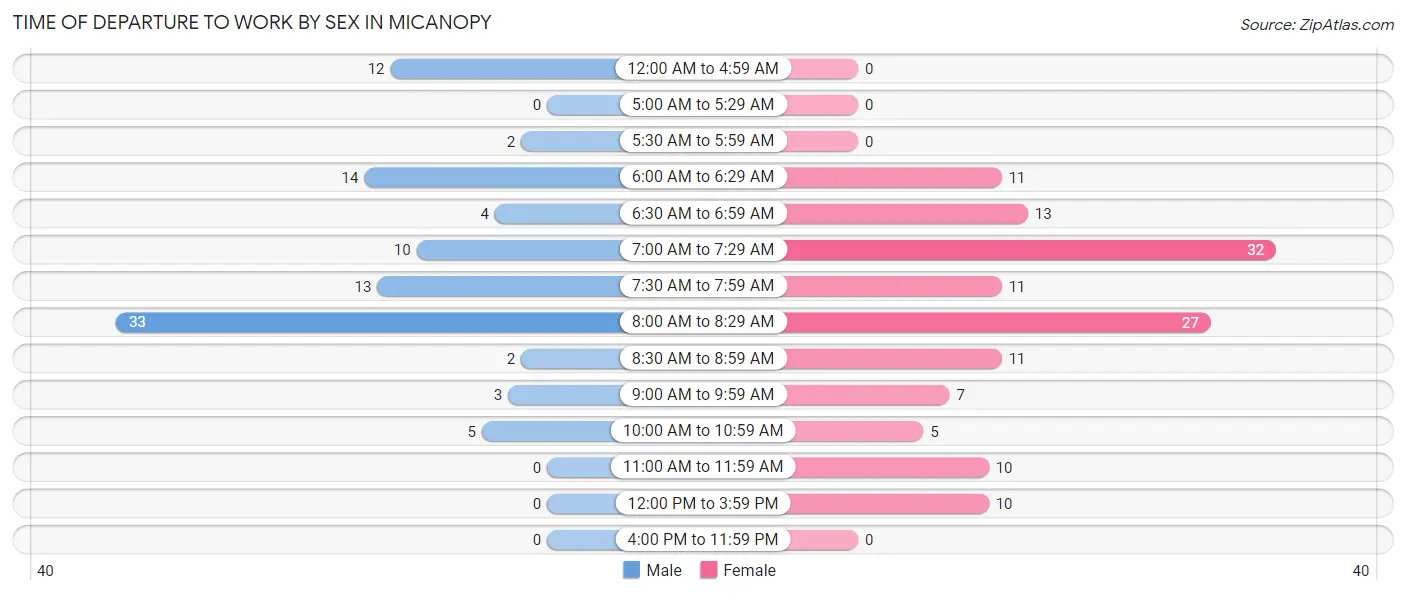
| Time of Departure | Male | Female |
| 12:00 AM to 4:59 AM | 12 (12.2%) | 0 (0.0%) |
| 5:00 AM to 5:29 AM | 0 (0.0%) | 0 (0.0%) |
| 5:30 AM to 5:59 AM | 2 (2.0%) | 0 (0.0%) |
| 6:00 AM to 6:29 AM | 14 (14.3%) | 11 (8.0%) |
| 6:30 AM to 6:59 AM | 4 (4.1%) | 13 (9.5%) |
| 7:00 AM to 7:29 AM | 10 (10.2%) | 32 (23.4%) |
| 7:30 AM to 7:59 AM | 13 (13.3%) | 11 (8.0%) |
| 8:00 AM to 8:29 AM | 33 (33.7%) | 27 (19.7%) |
| 8:30 AM to 8:59 AM | 2 (2.0%) | 11 (8.0%) |
| 9:00 AM to 9:59 AM | 3 (3.1%) | 7 (5.1%) |
| 10:00 AM to 10:59 AM | 5 (5.1%) | 5 (3.6%) |
| 11:00 AM to 11:59 AM | 0 (0.0%) | 10 (7.3%) |
| 12:00 PM to 3:59 PM | 0 (0.0%) | 10 (7.3%) |
| 4:00 PM to 11:59 PM | 0 (0.0%) | 0 (0.0%) |
| Total | 98 (100.0%) | 137 (100.0%) |
Housing Occupancy in Micanopy
Occupancy by Ownership in Micanopy
Of the total 250 dwellings in Micanopy, owner-occupied units account for 141 (56.4%), while renter-occupied units make up 109 (43.6%).
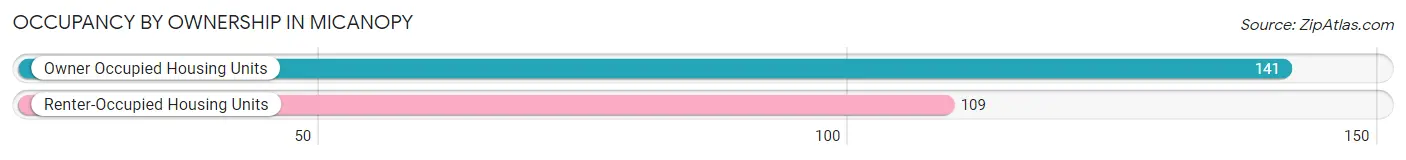
| Occupancy | # Housing Units | % Housing Units |
| Owner Occupied Housing Units | 141 | 56.4% |
| Renter-Occupied Housing Units | 109 | 43.6% |
| Total Occupied Housing Units | 250 | 100.0% |
Occupancy by Household Size in Micanopy
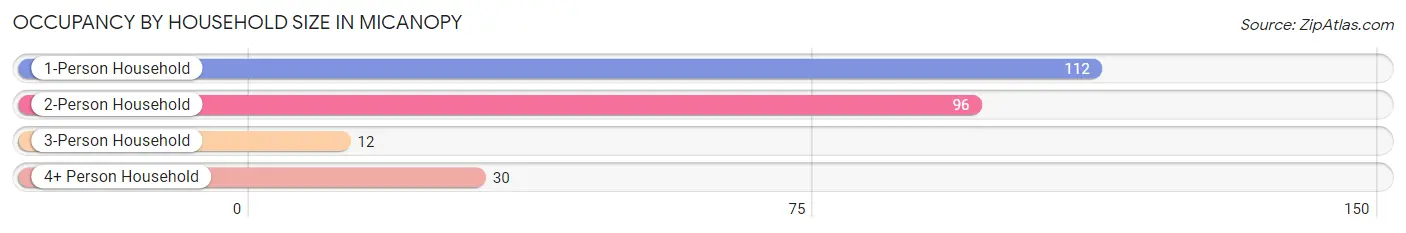
| Household Size | # Housing Units | % Housing Units |
| 1-Person Household | 112 | 44.8% |
| 2-Person Household | 96 | 38.4% |
| 3-Person Household | 12 | 4.8% |
| 4+ Person Household | 30 | 12.0% |
| Total Housing Units | 250 | 100.0% |
Occupancy by Ownership by Household Size in Micanopy
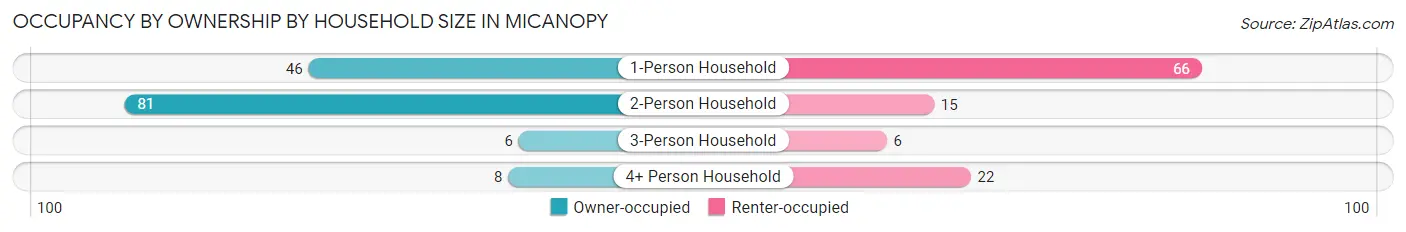
| Household Size | Owner-occupied | Renter-occupied |
| 1-Person Household | 46 (41.1%) | 66 (58.9%) |
| 2-Person Household | 81 (84.4%) | 15 (15.6%) |
| 3-Person Household | 6 (50.0%) | 6 (50.0%) |
| 4+ Person Household | 8 (26.7%) | 22 (73.3%) |
| Total Housing Units | 141 (56.4%) | 109 (43.6%) |
Occupancy by Educational Attainment in Micanopy
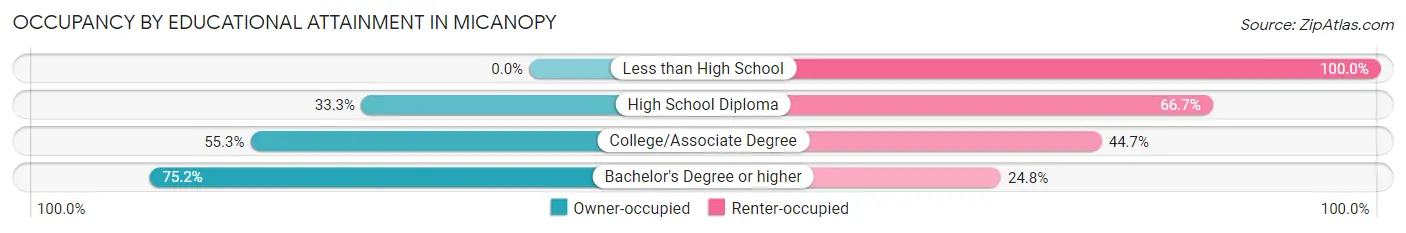
| Household Size | Owner-occupied | Renter-occupied |
| Less than High School | 0 (0.0%) | 9 (100.0%) |
| High School Diploma | 20 (33.3%) | 40 (66.7%) |
| College/Associate Degree | 42 (55.3%) | 34 (44.7%) |
| Bachelor's Degree or higher | 79 (75.2%) | 26 (24.8%) |
Occupancy by Age of Householder in Micanopy
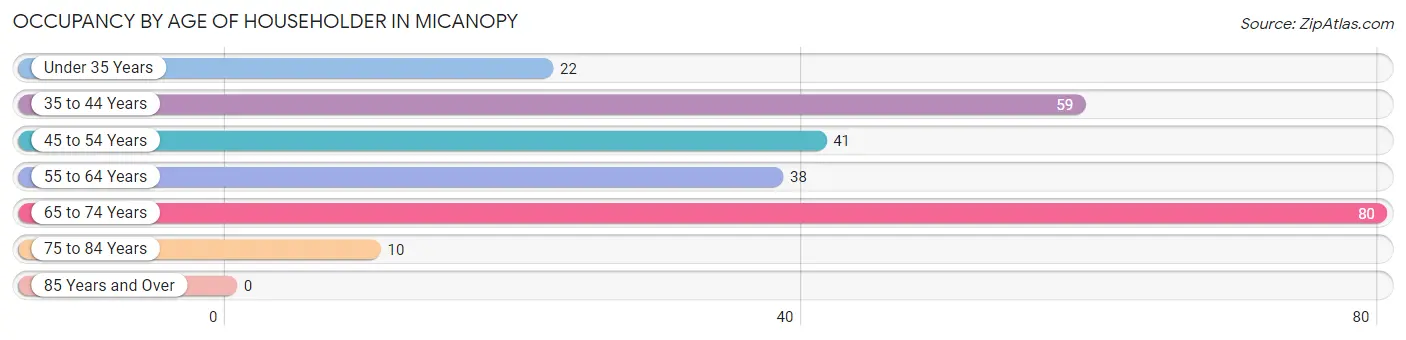
| Age Bracket | # Households | % Households |
| Under 35 Years | 22 | 8.8% |
| 35 to 44 Years | 59 | 23.6% |
| 45 to 54 Years | 41 | 16.4% |
| 55 to 64 Years | 38 | 15.2% |
| 65 to 74 Years | 80 | 32.0% |
| 75 to 84 Years | 10 | 4.0% |
| 85 Years and Over | 0 | 0.0% |
| Total | 250 | 100.0% |
Housing Finances in Micanopy
Median Income by Occupancy in Micanopy
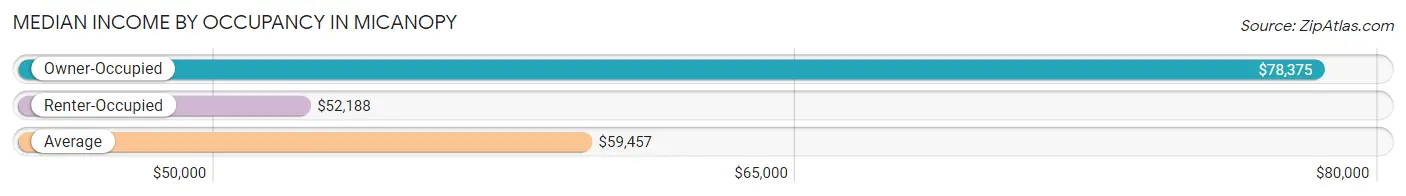
| Occupancy Type | # Households | Median Income |
| Owner-Occupied | 141 (56.4%) | $78,375 |
| Renter-Occupied | 109 (43.6%) | $52,188 |
| Average | 250 (100.0%) | $59,457 |
Occupancy by Householder Income Bracket in Micanopy
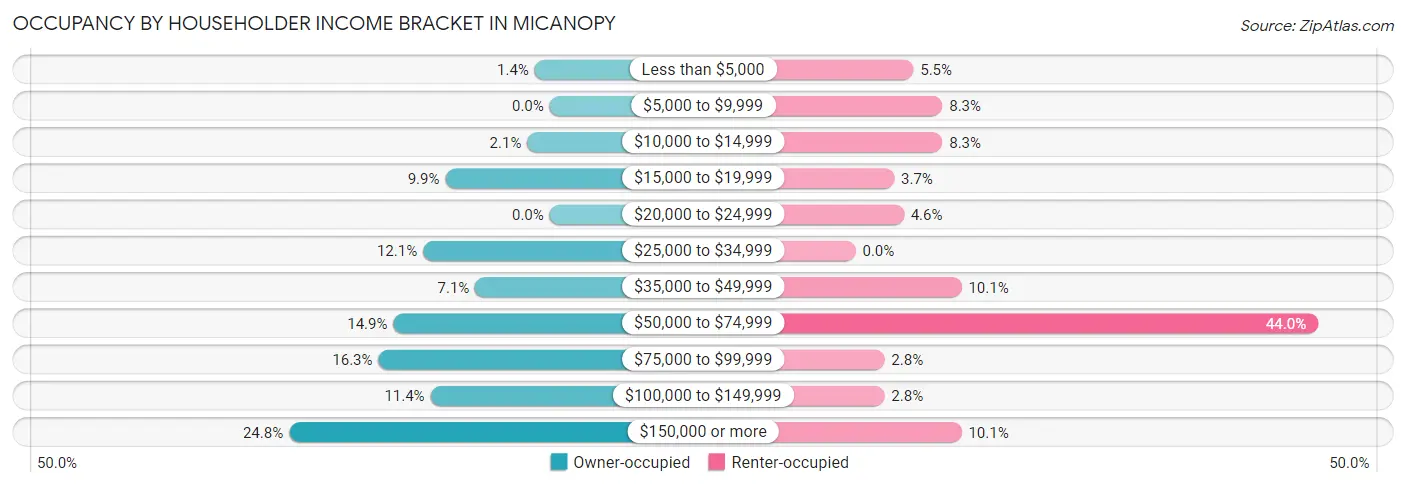
| Income Bracket | Owner-occupied | Renter-occupied |
| Less than $5,000 | 2 (1.4%) | 6 (5.5%) |
| $5,000 to $9,999 | 0 (0.0%) | 9 (8.3%) |
| $10,000 to $14,999 | 3 (2.1%) | 9 (8.3%) |
| $15,000 to $19,999 | 14 (9.9%) | 4 (3.7%) |
| $20,000 to $24,999 | 0 (0.0%) | 5 (4.6%) |
| $25,000 to $34,999 | 17 (12.1%) | 0 (0.0%) |
| $35,000 to $49,999 | 10 (7.1%) | 11 (10.1%) |
| $50,000 to $74,999 | 21 (14.9%) | 48 (44.0%) |
| $75,000 to $99,999 | 23 (16.3%) | 3 (2.8%) |
| $100,000 to $149,999 | 16 (11.4%) | 3 (2.8%) |
| $150,000 or more | 35 (24.8%) | 11 (10.1%) |
| Total | 141 (100.0%) | 109 (100.0%) |
Monthly Housing Cost Tiers in Micanopy
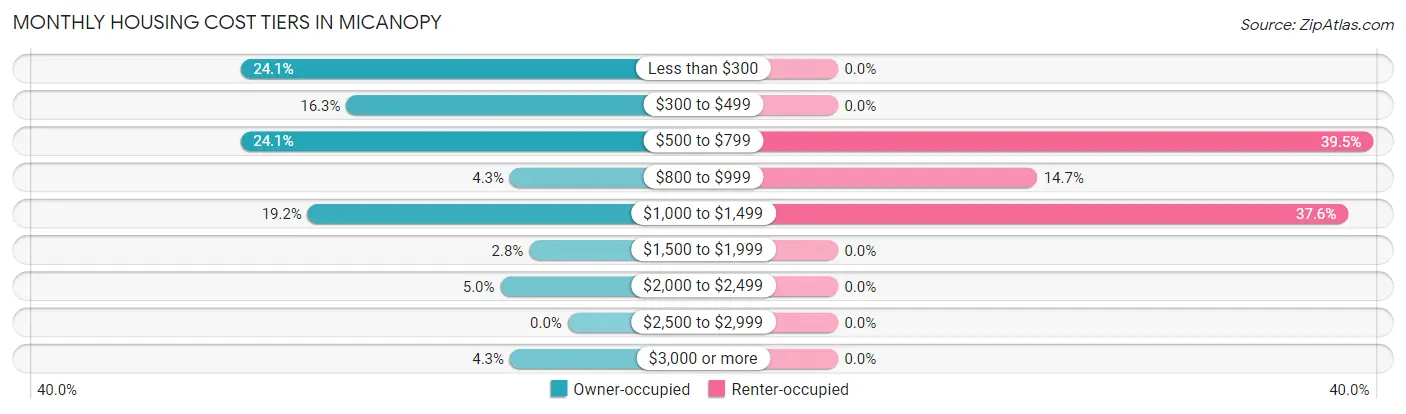
| Monthly Cost | Owner-occupied | Renter-occupied |
| Less than $300 | 34 (24.1%) | 0 (0.0%) |
| $300 to $499 | 23 (16.3%) | 0 (0.0%) |
| $500 to $799 | 34 (24.1%) | 43 (39.5%) |
| $800 to $999 | 6 (4.3%) | 16 (14.7%) |
| $1,000 to $1,499 | 27 (19.2%) | 41 (37.6%) |
| $1,500 to $1,999 | 4 (2.8%) | 0 (0.0%) |
| $2,000 to $2,499 | 7 (5.0%) | 0 (0.0%) |
| $2,500 to $2,999 | 0 (0.0%) | 0 (0.0%) |
| $3,000 or more | 6 (4.3%) | 0 (0.0%) |
| Total | 141 (100.0%) | 109 (100.0%) |
Physical Housing Characteristics in Micanopy
Housing Structures in Micanopy
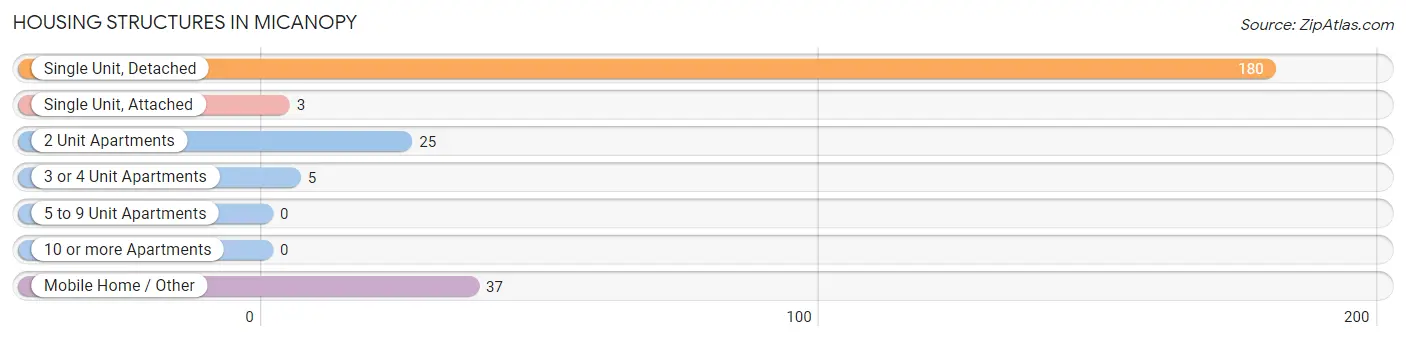
| Structure Type | # Housing Units | % Housing Units |
| Single Unit, Detached | 180 | 72.0% |
| Single Unit, Attached | 3 | 1.2% |
| 2 Unit Apartments | 25 | 10.0% |
| 3 or 4 Unit Apartments | 5 | 2.0% |
| 5 to 9 Unit Apartments | 0 | 0.0% |
| 10 or more Apartments | 0 | 0.0% |
| Mobile Home / Other | 37 | 14.8% |
| Total | 250 | 100.0% |
Housing Structures by Occupancy in Micanopy
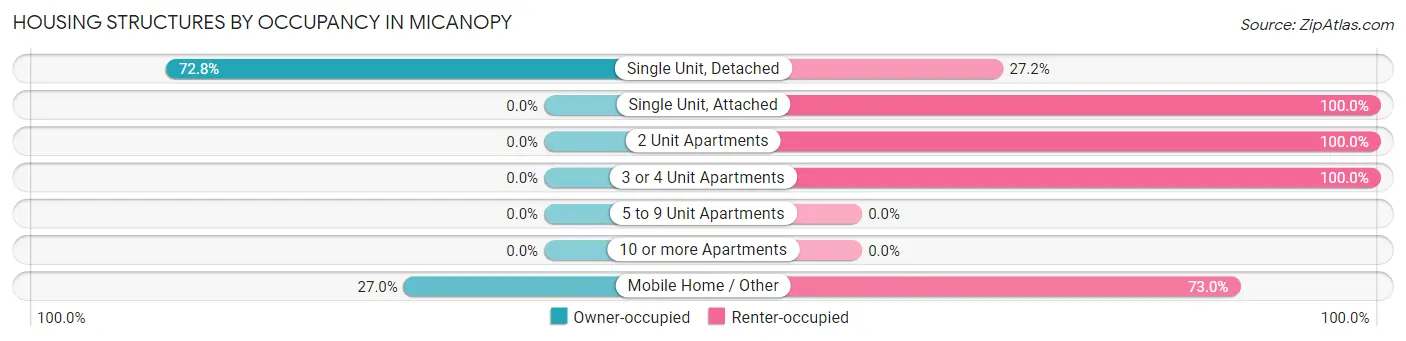
| Structure Type | Owner-occupied | Renter-occupied |
| Single Unit, Detached | 131 (72.8%) | 49 (27.2%) |
| Single Unit, Attached | 0 (0.0%) | 3 (100.0%) |
| 2 Unit Apartments | 0 (0.0%) | 25 (100.0%) |
| 3 or 4 Unit Apartments | 0 (0.0%) | 5 (100.0%) |
| 5 to 9 Unit Apartments | 0 (0.0%) | 0 (0.0%) |
| 10 or more Apartments | 0 (0.0%) | 0 (0.0%) |
| Mobile Home / Other | 10 (27.0%) | 27 (73.0%) |
| Total | 141 (56.4%) | 109 (43.6%) |
Housing Structures by Number of Rooms in Micanopy
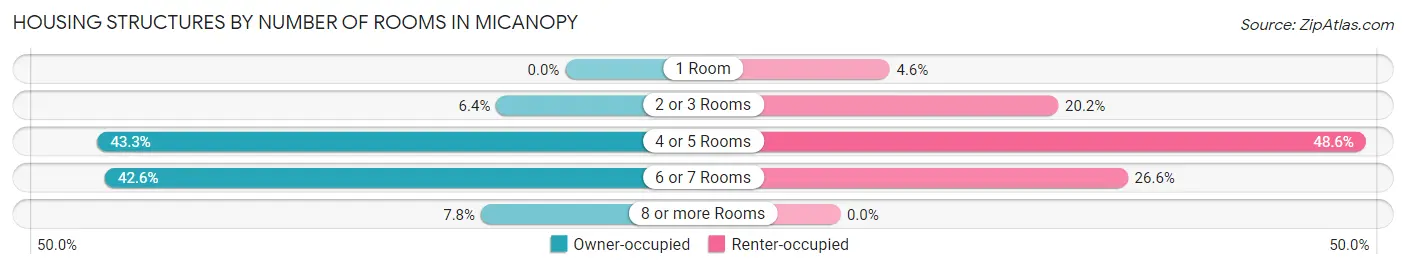
| Number of Rooms | Owner-occupied | Renter-occupied |
| 1 Room | 0 (0.0%) | 5 (4.6%) |
| 2 or 3 Rooms | 9 (6.4%) | 22 (20.2%) |
| 4 or 5 Rooms | 61 (43.3%) | 53 (48.6%) |
| 6 or 7 Rooms | 60 (42.5%) | 29 (26.6%) |
| 8 or more Rooms | 11 (7.8%) | 0 (0.0%) |
| Total | 141 (100.0%) | 109 (100.0%) |
Housing Structure by Heating Type in Micanopy
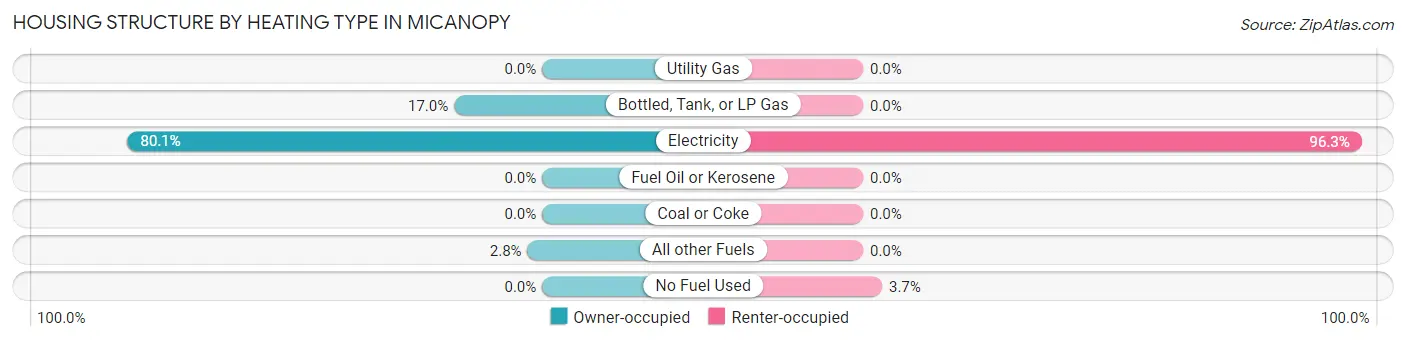
| Heating Type | Owner-occupied | Renter-occupied |
| Utility Gas | 0 (0.0%) | 0 (0.0%) |
| Bottled, Tank, or LP Gas | 24 (17.0%) | 0 (0.0%) |
| Electricity | 113 (80.1%) | 105 (96.3%) |
| Fuel Oil or Kerosene | 0 (0.0%) | 0 (0.0%) |
| Coal or Coke | 0 (0.0%) | 0 (0.0%) |
| All other Fuels | 4 (2.8%) | 0 (0.0%) |
| No Fuel Used | 0 (0.0%) | 4 (3.7%) |
| Total | 141 (100.0%) | 109 (100.0%) |
Household Vehicle Usage in Micanopy
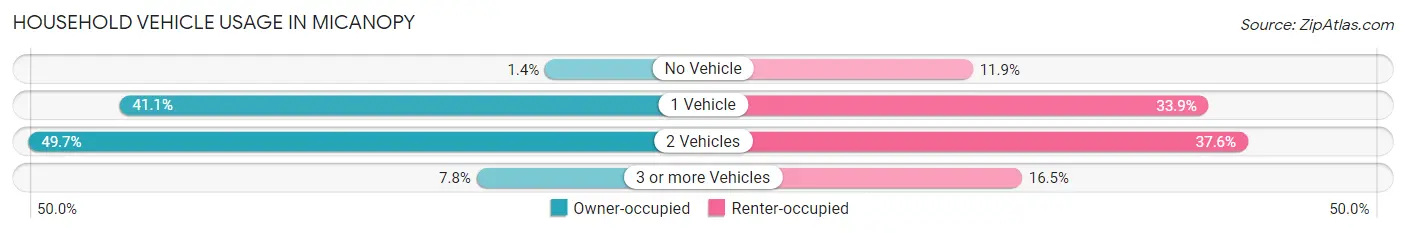
| Vehicles per Household | Owner-occupied | Renter-occupied |
| No Vehicle | 2 (1.4%) | 13 (11.9%) |
| 1 Vehicle | 58 (41.1%) | 37 (33.9%) |
| 2 Vehicles | 70 (49.6%) | 41 (37.6%) |
| 3 or more Vehicles | 11 (7.8%) | 18 (16.5%) |
| Total | 141 (100.0%) | 109 (100.0%) |
Real Estate & Mortgages in Micanopy
Real Estate and Mortgage Overview in Micanopy
| Characteristic | Without Mortgage | With Mortgage |
| Housing Units | 87 | 54 |
| Median Property Value | $219,100 | $200,000 |
| Median Household Income | $66,250 | $23 |
| Monthly Housing Costs | $423 | $6 |
| Real Estate Taxes | $844 | $2 |
Property Value by Mortgage Status in Micanopy
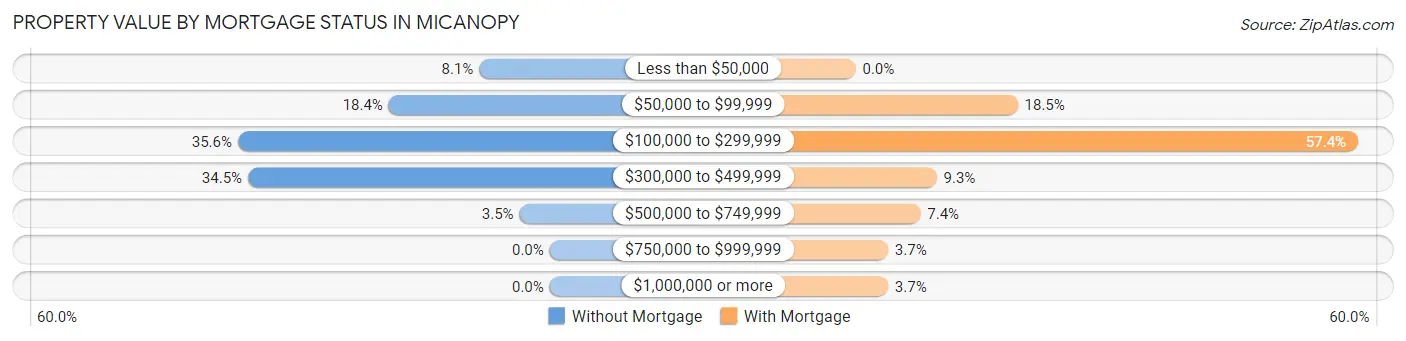
| Property Value | Without Mortgage | With Mortgage |
| Less than $50,000 | 7 (8.1%) | 0 (0.0%) |
| $50,000 to $99,999 | 16 (18.4%) | 10 (18.5%) |
| $100,000 to $299,999 | 31 (35.6%) | 31 (57.4%) |
| $300,000 to $499,999 | 30 (34.5%) | 5 (9.3%) |
| $500,000 to $749,999 | 3 (3.5%) | 4 (7.4%) |
| $750,000 to $999,999 | 0 (0.0%) | 2 (3.7%) |
| $1,000,000 or more | 0 (0.0%) | 2 (3.7%) |
| Total | 87 (100.0%) | 54 (100.0%) |
Household Income by Mortgage Status in Micanopy
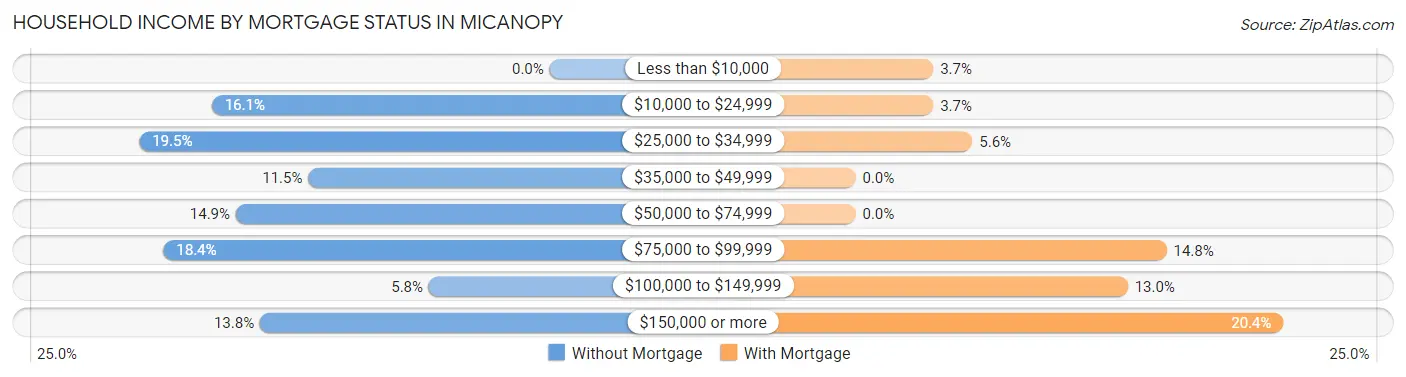
| Household Income | Without Mortgage | With Mortgage |
| Less than $10,000 | 0 (0.0%) | 2 (3.7%) |
| $10,000 to $24,999 | 14 (16.1%) | 2 (3.7%) |
| $25,000 to $34,999 | 17 (19.5%) | 3 (5.6%) |
| $35,000 to $49,999 | 10 (11.5%) | 0 (0.0%) |
| $50,000 to $74,999 | 13 (14.9%) | 0 (0.0%) |
| $75,000 to $99,999 | 16 (18.4%) | 8 (14.8%) |
| $100,000 to $149,999 | 5 (5.8%) | 7 (13.0%) |
| $150,000 or more | 12 (13.8%) | 11 (20.4%) |
| Total | 87 (100.0%) | 54 (100.0%) |
Property Value to Household Income Ratio in Micanopy
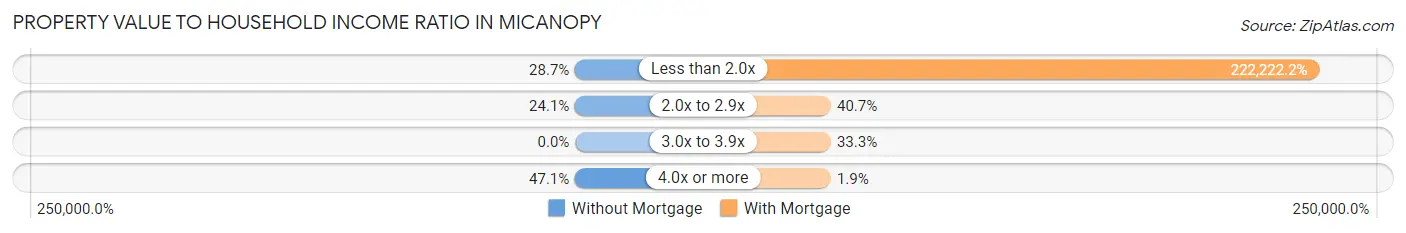
| Value-to-Income Ratio | Without Mortgage | With Mortgage |
| Less than 2.0x | 25 (28.7%) | 120,000 (222,222.2%) |
| 2.0x to 2.9x | 21 (24.1%) | 22 (40.7%) |
| 3.0x to 3.9x | 0 (0.0%) | 18 (33.3%) |
| 4.0x or more | 41 (47.1%) | 1 (1.8%) |
| Total | 87 (100.0%) | 54 (100.0%) |
Real Estate Taxes by Mortgage Status in Micanopy
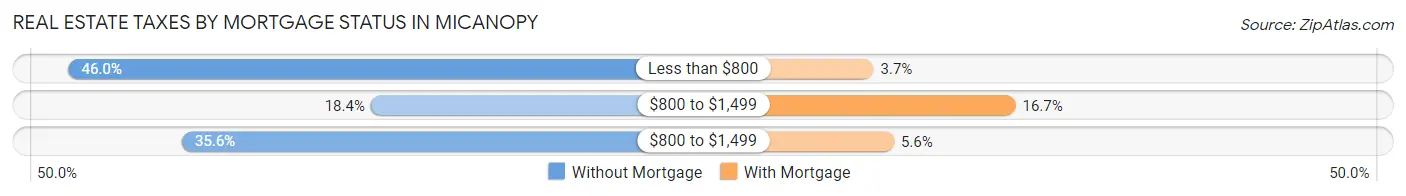
| Property Taxes | Without Mortgage | With Mortgage |
| Less than $800 | 40 (46.0%) | 2 (3.7%) |
| $800 to $1,499 | 16 (18.4%) | 9 (16.7%) |
| $800 to $1,499 | 31 (35.6%) | 3 (5.6%) |
| Total | 87 (100.0%) | 54 (100.0%) |
Health & Disability in Micanopy
Health Insurance Coverage by Age in Micanopy
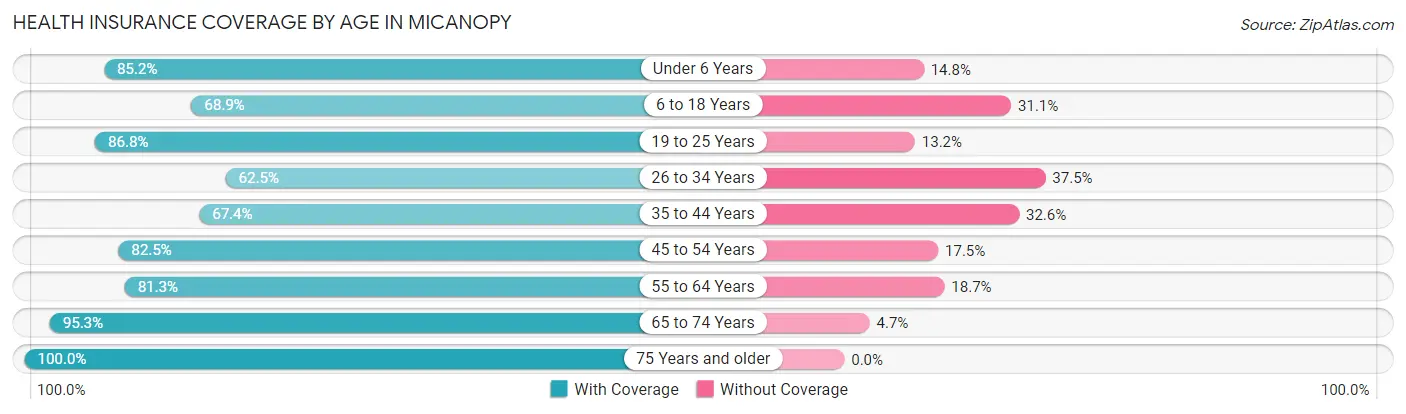
| Age Bracket | With Coverage | Without Coverage |
| Under 6 Years | 23 (85.2%) | 4 (14.8%) |
| 6 to 18 Years | 31 (68.9%) | 14 (31.1%) |
| 19 to 25 Years | 33 (86.8%) | 5 (13.2%) |
| 26 to 34 Years | 30 (62.5%) | 18 (37.5%) |
| 35 to 44 Years | 60 (67.4%) | 29 (32.6%) |
| 45 to 54 Years | 66 (82.5%) | 14 (17.5%) |
| 55 to 64 Years | 61 (81.3%) | 14 (18.7%) |
| 65 to 74 Years | 101 (95.3%) | 5 (4.7%) |
| 75 Years and older | 14 (100.0%) | 0 (0.0%) |
| Total | 419 (80.3%) | 103 (19.7%) |
Health Insurance Coverage by Citizenship Status in Micanopy
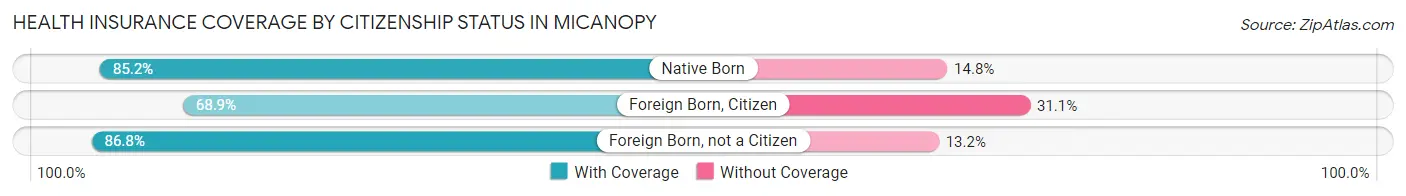
| Citizenship Status | With Coverage | Without Coverage |
| Native Born | 23 (85.2%) | 4 (14.8%) |
| Foreign Born, Citizen | 31 (68.9%) | 14 (31.1%) |
| Foreign Born, not a Citizen | 33 (86.8%) | 5 (13.2%) |
Health Insurance Coverage by Household Income in Micanopy
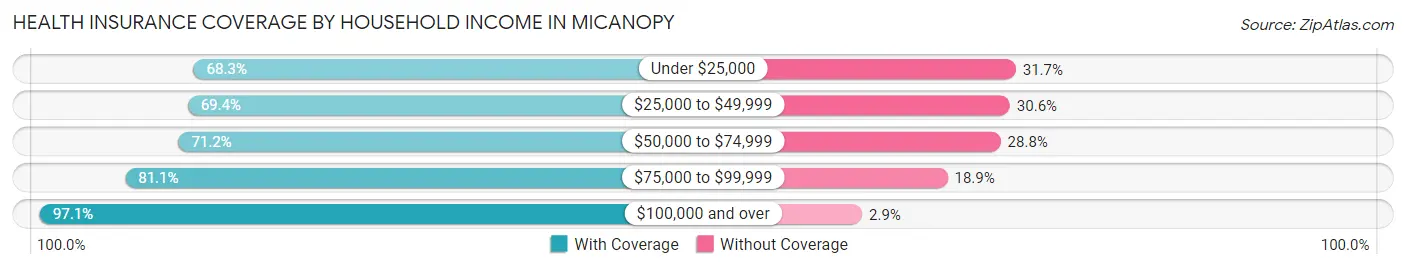
| Household Income | With Coverage | Without Coverage |
| Under $25,000 | 41 (68.3%) | 19 (31.7%) |
| $25,000 to $49,999 | 50 (69.4%) | 22 (30.6%) |
| $50,000 to $74,999 | 116 (71.2%) | 47 (28.8%) |
| $75,000 to $99,999 | 43 (81.1%) | 10 (18.9%) |
| $100,000 and over | 169 (97.1%) | 5 (2.9%) |
Public vs Private Health Insurance Coverage by Age in Micanopy
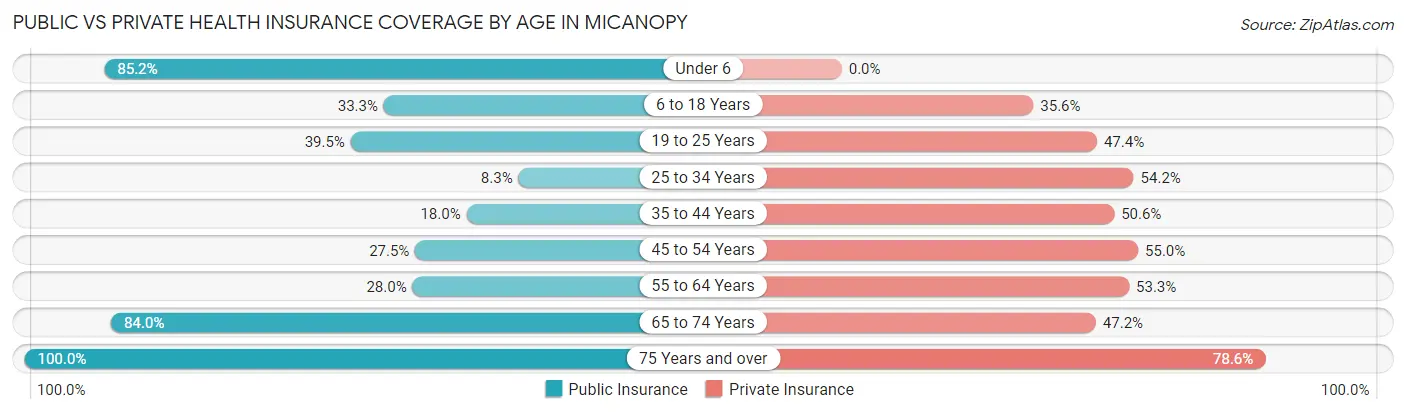
| Age Bracket | Public Insurance | Private Insurance |
| Under 6 | 23 (85.2%) | 0 (0.0%) |
| 6 to 18 Years | 15 (33.3%) | 16 (35.6%) |
| 19 to 25 Years | 15 (39.5%) | 18 (47.4%) |
| 25 to 34 Years | 4 (8.3%) | 26 (54.2%) |
| 35 to 44 Years | 16 (18.0%) | 45 (50.6%) |
| 45 to 54 Years | 22 (27.5%) | 44 (55.0%) |
| 55 to 64 Years | 21 (28.0%) | 40 (53.3%) |
| 65 to 74 Years | 89 (84.0%) | 50 (47.2%) |
| 75 Years and over | 14 (100.0%) | 11 (78.6%) |
| Total | 219 (41.9%) | 250 (47.9%) |
Disability Status by Sex by Age in Micanopy
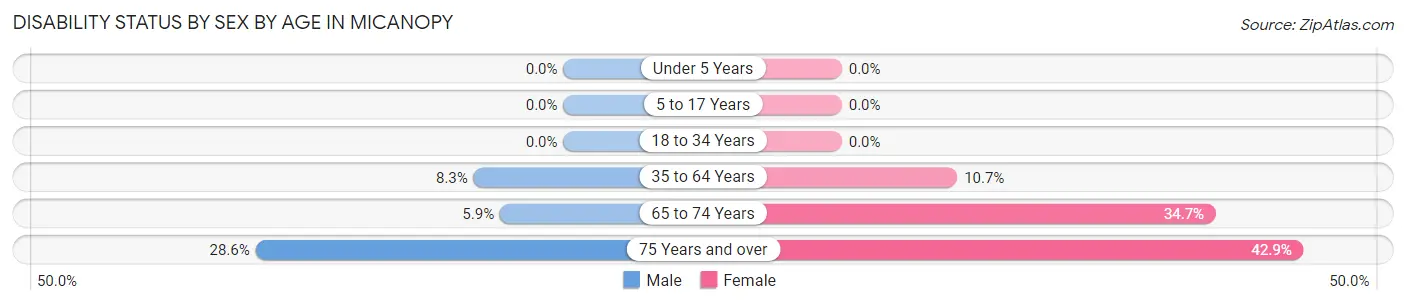
| Age Bracket | Male | Female |
| Under 5 Years | 0 (0.0%) | 0 (0.0%) |
| 5 to 17 Years | 0 (0.0%) | 0 (0.0%) |
| 18 to 34 Years | 0 (0.0%) | 0 (0.0%) |
| 35 to 64 Years | 11 (8.3%) | 12 (10.7%) |
| 65 to 74 Years | 2 (5.9%) | 25 (34.7%) |
| 75 Years and over | 2 (28.6%) | 3 (42.9%) |
Disability Class by Sex by Age in Micanopy
Disability Class: Hearing Difficulty
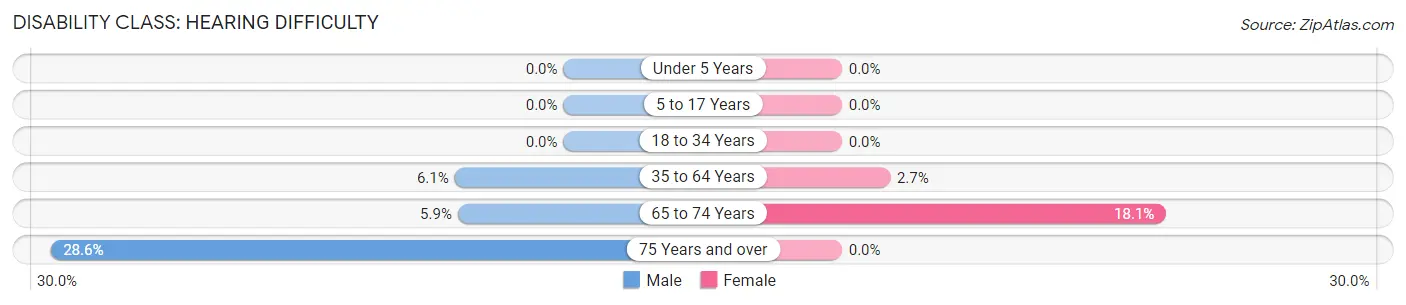
| Age Bracket | Male | Female |
| Under 5 Years | 0 (0.0%) | 0 (0.0%) |
| 5 to 17 Years | 0 (0.0%) | 0 (0.0%) |
| 18 to 34 Years | 0 (0.0%) | 0 (0.0%) |
| 35 to 64 Years | 8 (6.1%) | 3 (2.7%) |
| 65 to 74 Years | 2 (5.9%) | 13 (18.1%) |
| 75 Years and over | 2 (28.6%) | 0 (0.0%) |
Disability Class: Vision Difficulty
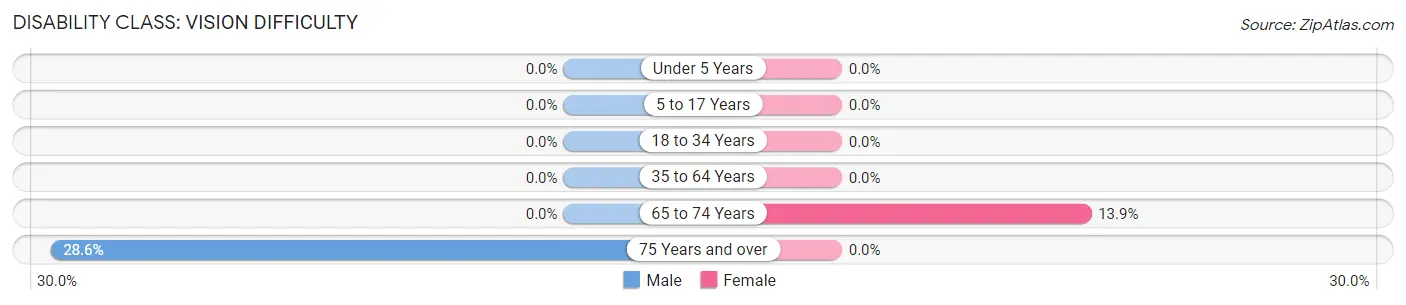
| Age Bracket | Male | Female |
| Under 5 Years | 0 (0.0%) | 0 (0.0%) |
| 5 to 17 Years | 0 (0.0%) | 0 (0.0%) |
| 18 to 34 Years | 0 (0.0%) | 0 (0.0%) |
| 35 to 64 Years | 0 (0.0%) | 0 (0.0%) |
| 65 to 74 Years | 0 (0.0%) | 10 (13.9%) |
| 75 Years and over | 2 (28.6%) | 0 (0.0%) |
Disability Class: Cognitive Difficulty
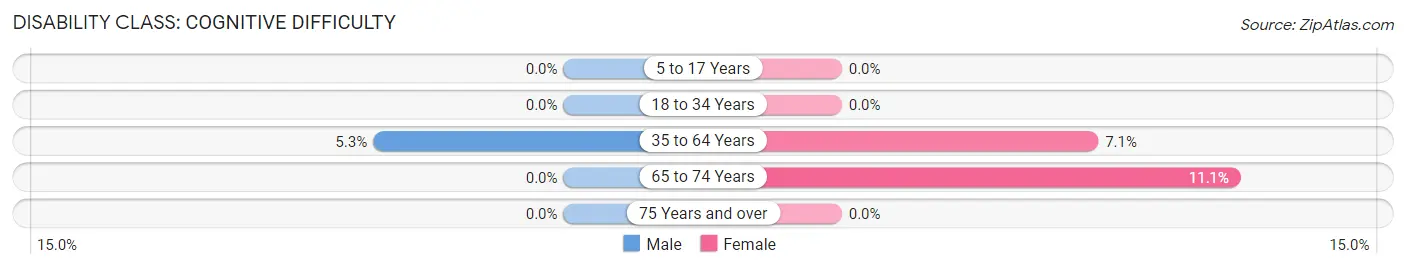
| Age Bracket | Male | Female |
| 5 to 17 Years | 0 (0.0%) | 0 (0.0%) |
| 18 to 34 Years | 0 (0.0%) | 0 (0.0%) |
| 35 to 64 Years | 7 (5.3%) | 8 (7.1%) |
| 65 to 74 Years | 0 (0.0%) | 8 (11.1%) |
| 75 Years and over | 0 (0.0%) | 0 (0.0%) |
Disability Class: Ambulatory Difficulty
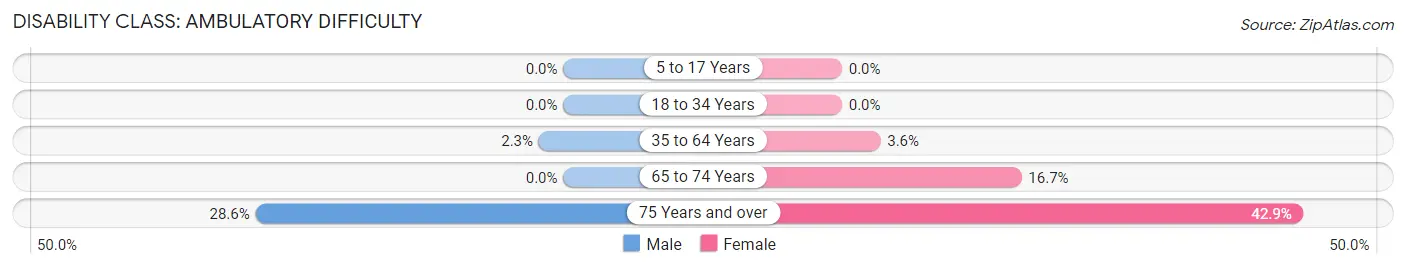
| Age Bracket | Male | Female |
| 5 to 17 Years | 0 (0.0%) | 0 (0.0%) |
| 18 to 34 Years | 0 (0.0%) | 0 (0.0%) |
| 35 to 64 Years | 3 (2.3%) | 4 (3.6%) |
| 65 to 74 Years | 0 (0.0%) | 12 (16.7%) |
| 75 Years and over | 2 (28.6%) | 3 (42.9%) |
Disability Class: Self-Care Difficulty
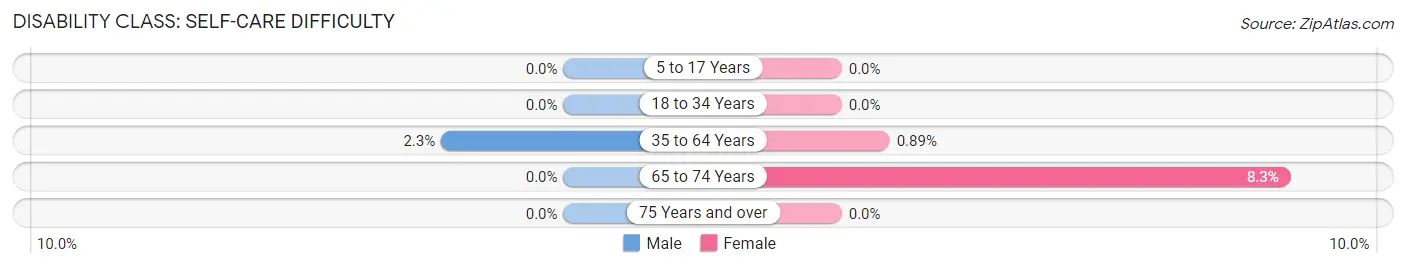
| Age Bracket | Male | Female |
| 5 to 17 Years | 0 (0.0%) | 0 (0.0%) |
| 18 to 34 Years | 0 (0.0%) | 0 (0.0%) |
| 35 to 64 Years | 3 (2.3%) | 1 (0.9%) |
| 65 to 74 Years | 0 (0.0%) | 6 (8.3%) |
| 75 Years and over | 0 (0.0%) | 0 (0.0%) |
Technology Access in Micanopy
Computing Device Access in Micanopy
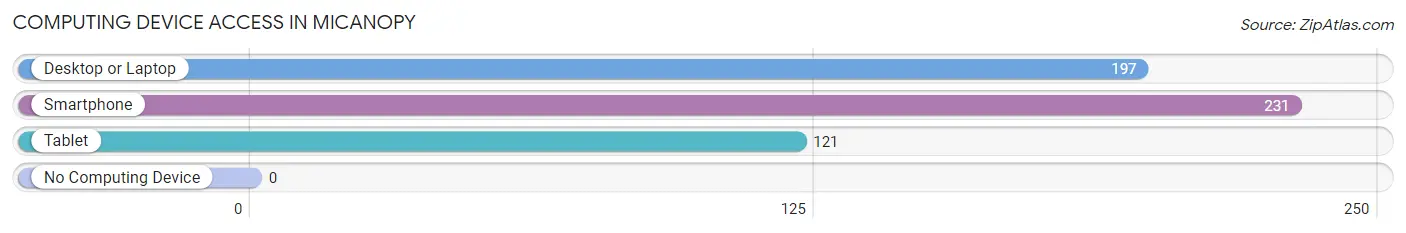
| Device Type | # Households | % Households |
| Desktop or Laptop | 197 | 78.8% |
| Smartphone | 231 | 92.4% |
| Tablet | 121 | 48.4% |
| No Computing Device | 0 | 0.0% |
| Total | 250 | 100.0% |
Internet Access in Micanopy
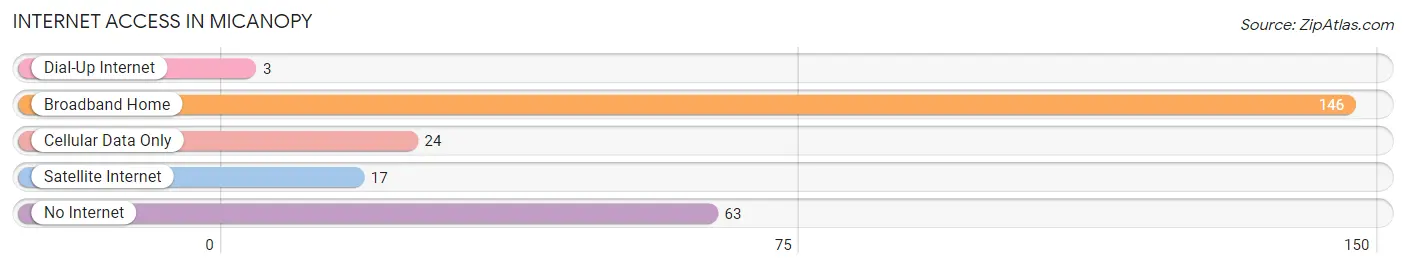
| Internet Type | # Households | % Households |
| Dial-Up Internet | 3 | 1.2% |
| Broadband Home | 146 | 58.4% |
| Cellular Data Only | 24 | 9.6% |
| Satellite Internet | 17 | 6.8% |
| No Internet | 63 | 25.2% |
| Total | 250 | 100.0% |
Micanopy Summary
Micanopy is a small town located in Alachua County, Florida, United States. It is situated about 15 miles south of Gainesville and is part of the Gainesville Metropolitan Statistical Area. The town was founded in 1821 and is the oldest inland town in Florida. It is named after Chief Micanopy of the Seminole tribe, who lived in the area in the early 19th century. The town has a population of 600 people and covers an area of 0.7 square miles.
History
Micanopy was founded in 1821 by Colonel Daniel Newnan, who was a veteran of the War of 1812. He named the town after Chief Micanopy of the Seminole tribe, who lived in the area in the early 19th century. The town was originally a trading post and was the first inland town in Florida. In 1824, the town was incorporated and became the county seat of Alachua County.
In the late 19th century, Micanopy was a popular tourist destination due to its mild climate and natural beauty. The town was known for its orange groves and was home to several hotels and resorts. In the early 20th century, the town began to decline as the railroad bypassed it and tourists began to visit other destinations.
Geography
Micanopy is located in Alachua County, Florida, United States. It is situated about 15 miles south of Gainesville and is part of the Gainesville Metropolitan Statistical Area. The town covers an area of 0.7 square miles and has a population of 600 people. The town is located on the banks of the Orange Creek and is surrounded by rolling hills and forests.
Economy
Micanopy’s economy is largely based on tourism and agriculture. The town is home to several antique stores, art galleries, and restaurants. It is also home to the Micanopy Historical Society, which is dedicated to preserving the town’s history. The town is also home to several farms, which produce oranges, peaches, and other fruits and vegetables.
Demographics
As of the 2010 census, Micanopy had a population of 600 people. The racial makeup of the town was 94.3% White, 2.7% African American, 0.2% Native American, 0.2% Asian, 0.2% from other races, and 2.5% from two or more races. The median household income was $37,500 and the median family income was $45,000. The per capita income was $19,000.
Conclusion
Micanopy is a small town located in Alachua County, Florida, United States. It was founded in 1821 and is the oldest inland town in Florida. The town has a population of 600 people and covers an area of 0.7 square miles. The town’s economy is largely based on tourism and agriculture. The town is home to several antique stores, art galleries, and restaurants. As of the 2010 census, the town had a population of 600 people and the median household income was $37,500.
Common Questions
What is Per Capita Income in Micanopy?
Per Capita income in Micanopy is $44,000.
What is the Median Family Income in Micanopy?
Median Family Income in Micanopy is $78,375.
What is the Median Household income in Micanopy?
Median Household Income in Micanopy is $59,457.
What is Income or Wage Gap in Micanopy?
Income or Wage Gap in Micanopy is 16.6%.
Women in Micanopy earn 83.4 cents for every dollar earned by a man.
What is Inequality or Gini Index in Micanopy?
Inequality or Gini Index in Micanopy is 0.48.
What is the Total Population of Micanopy?
Total Population of Micanopy is 522.
What is the Total Male Population of Micanopy?
Total Male Population of Micanopy is 236.
What is the Total Female Population of Micanopy?
Total Female Population of Micanopy is 286.
What is the Ratio of Males per 100 Females in Micanopy?
There are 82.52 Males per 100 Females in Micanopy.
What is the Ratio of Females per 100 Males in Micanopy?
There are 121.19 Females per 100 Males in Micanopy.
What is the Median Population Age in Micanopy?
Median Population Age in Micanopy is 47.1 Years.
What is the Average Family Size in Micanopy
Average Family Size in Micanopy is 2.9 People.
What is the Average Household Size in Micanopy
Average Household Size in Micanopy is 2.1 People.
How Large is the Labor Force in Micanopy?
There are 294 People in the Labor Forcein in Micanopy.
What is the Percentage of People in the Labor Force in Micanopy?
63.2% of People are in the Labor Force in Micanopy.
What is the Unemployment Rate in Micanopy?
Unemployment Rate in Micanopy is 6.8%.