Capitan, NM Map & Demographics
Capitan Map
Capitan Overview
$30,118
PER CAPITA INCOME
$68,750
AVG FAMILY INCOME
$48,826
AVG HOUSEHOLD INCOME
33.2%
WAGE / INCOME GAP [ % ]
66.8¢/ $1
WAGE / INCOME GAP [ $ ]
0.38
INEQUALITY / GINI INDEX
1,381
TOTAL POPULATION
729
MALE POPULATION
652
FEMALE POPULATION
111.81
MALES / 100 FEMALES
89.44
FEMALES / 100 MALES
49.4
MEDIAN AGE
2.9
AVG FAMILY SIZE
2.2
AVG HOUSEHOLD SIZE
555
LABOR FORCE [ PEOPLE ]
50.8%
PERCENT IN LABOR FORCE
2.9%
UNEMPLOYMENT RATE
Capitan Zip Codes
Capitan Area Codes
Income in Capitan
Income Overview in Capitan
Per Capita Income in Capitan is $30,118, while median incomes of families and households are $68,750 and $48,826 respectively.
| Characteristic | Number | Measure |
| Per Capita Income | 1,381 | $30,118 |
| Median Family Income | 327 | $68,750 |
| Mean Family Income | 327 | $64,064 |
| Median Household Income | 612 | $48,826 |
| Mean Household Income | 612 | $65,652 |
| Income Deficit | 327 | $0 |
| Wage / Income Gap (%) | 1,381 | 33.16% |
| Wage / Income Gap ($) | 1,381 | 66.84¢ per $1 |
| Gini / Inequality Index | 1,381 | 0.38 |
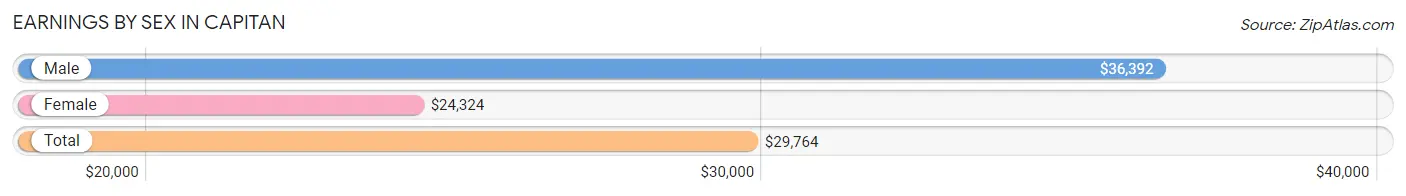
Earnings by Sex in Capitan
Average Earnings in Capitan are $29,764, $36,392 for men and $24,324 for women, a difference of 33.2%.
| Sex | Number | Average Earnings |
| Male | 249 (42.7%) | $36,392 |
| Female | 334 (57.3%) | $24,324 |
| Total | 583 (100.0%) | $29,764 |
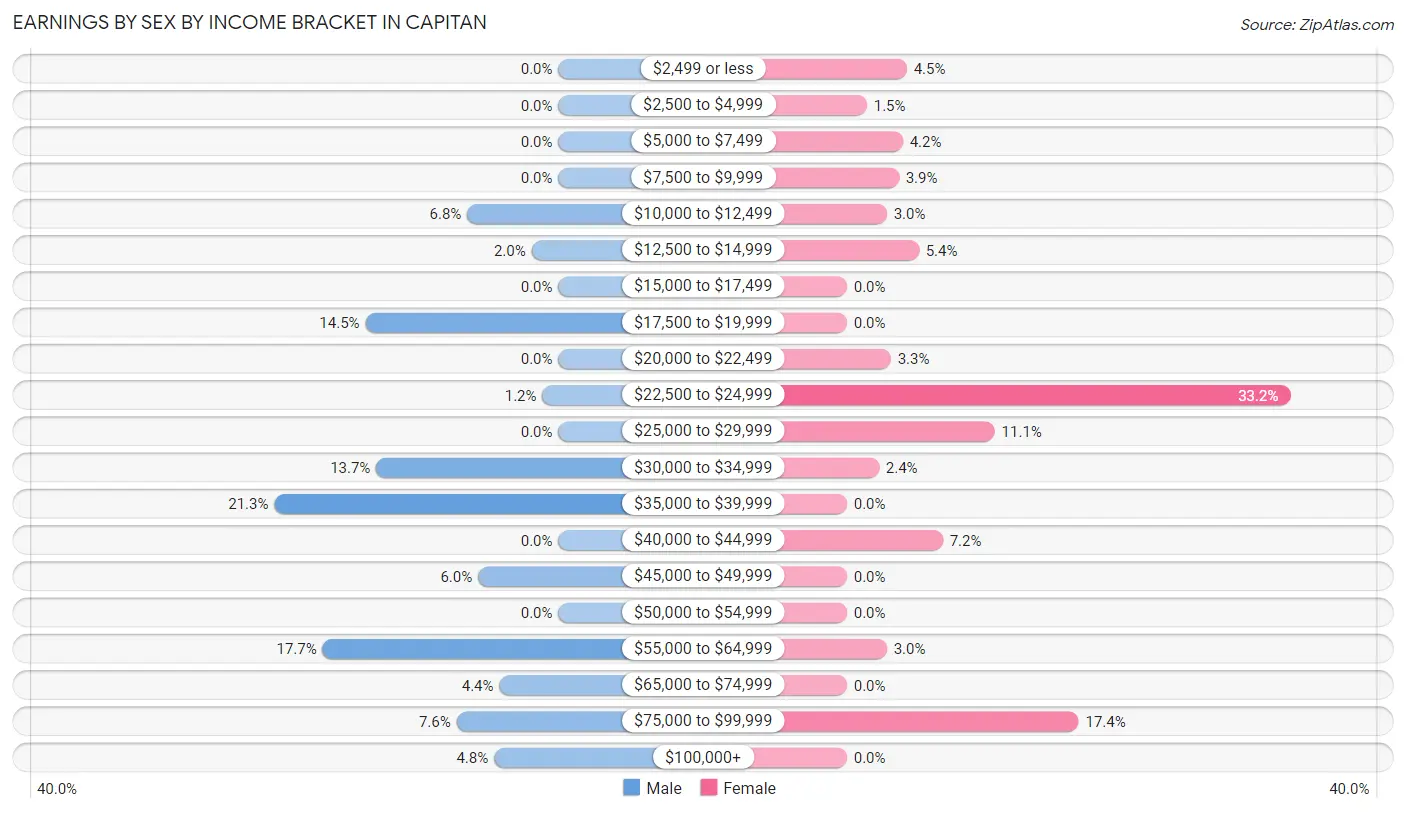
Earnings by Sex by Income Bracket in Capitan
The most common earnings brackets in Capitan are $35,000 to $39,999 for men (53 | 21.3%) and $22,500 to $24,999 for women (111 | 33.2%).
| Income | Male | Female |
| $2,499 or less | 0 (0.0%) | 15 (4.5%) |
| $2,500 to $4,999 | 0 (0.0%) | 5 (1.5%) |
| $5,000 to $7,499 | 0 (0.0%) | 14 (4.2%) |
| $7,500 to $9,999 | 0 (0.0%) | 13 (3.9%) |
| $10,000 to $12,499 | 17 (6.8%) | 10 (3.0%) |
| $12,500 to $14,999 | 5 (2.0%) | 18 (5.4%) |
| $15,000 to $17,499 | 0 (0.0%) | 0 (0.0%) |
| $17,500 to $19,999 | 36 (14.5%) | 0 (0.0%) |
| $20,000 to $22,499 | 0 (0.0%) | 11 (3.3%) |
| $22,500 to $24,999 | 3 (1.2%) | 111 (33.2%) |
| $25,000 to $29,999 | 0 (0.0%) | 37 (11.1%) |
| $30,000 to $34,999 | 34 (13.7%) | 8 (2.4%) |
| $35,000 to $39,999 | 53 (21.3%) | 0 (0.0%) |
| $40,000 to $44,999 | 0 (0.0%) | 24 (7.2%) |
| $45,000 to $49,999 | 15 (6.0%) | 0 (0.0%) |
| $50,000 to $54,999 | 0 (0.0%) | 0 (0.0%) |
| $55,000 to $64,999 | 44 (17.7%) | 10 (3.0%) |
| $65,000 to $74,999 | 11 (4.4%) | 0 (0.0%) |
| $75,000 to $99,999 | 19 (7.6%) | 58 (17.4%) |
| $100,000+ | 12 (4.8%) | 0 (0.0%) |
| Total | 249 (100.0%) | 334 (100.0%) |
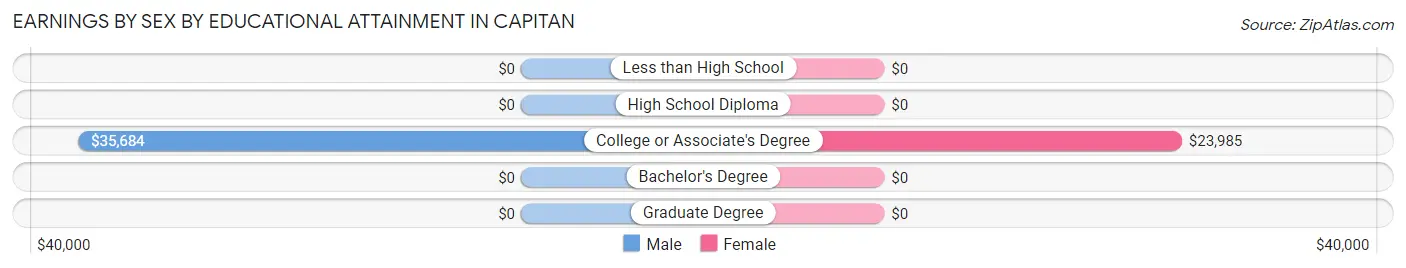
Earnings by Sex by Educational Attainment in Capitan
Average earnings in Capitan are $37,075 for men and $24,257 for women, a difference of 34.6%. Men with an educational attainment of college or associate's degree enjoy the highest average annual earnings of $35,684, while those with college or associate's degree education earn the least with $35,684. Women with an educational attainment of college or associate's degree earn the most with the average annual earnings of $23,985, while those with college or associate's degree education have the smallest earnings of $23,985.
| Educational Attainment | Male Income | Female Income |
| Less than High School | - | - |
| High School Diploma | - | - |
| College or Associate's Degree | $35,684 | $23,985 |
| Bachelor's Degree | - | - |
| Graduate Degree | - | - |
| Total | $37,075 | $24,257 |
Family Income in Capitan
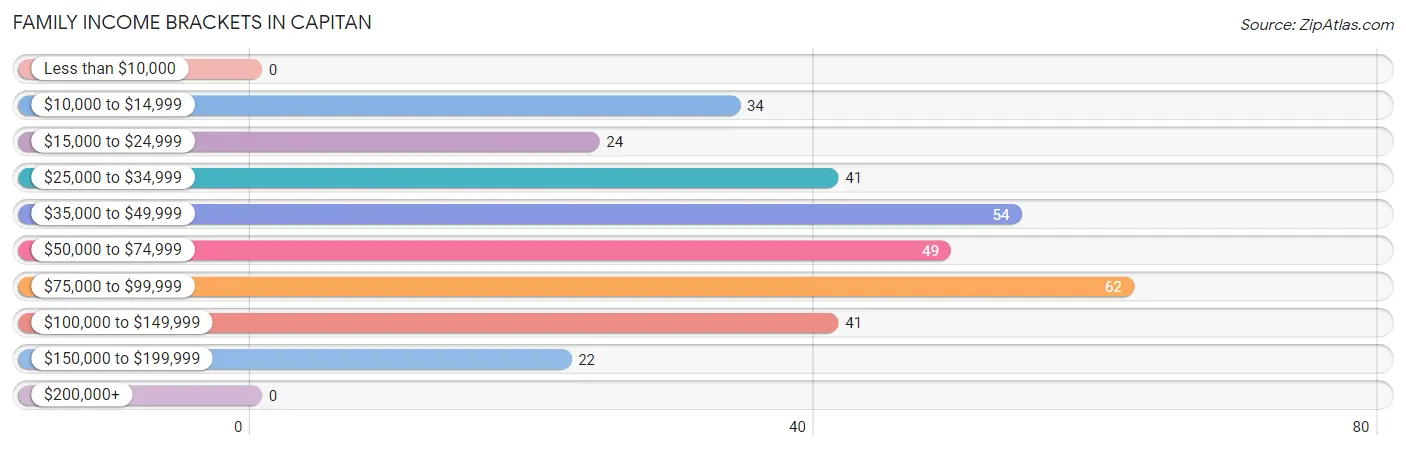
Family Income Brackets in Capitan
According to the Capitan family income data, there are 62 families falling into the $75,000 to $99,999 income range, which is the most common income bracket and makes up 19.0% of all families.
| Income Bracket | # Families | % Families |
| Less than $10,000 | 0 | 0.0% |
| $10,000 to $14,999 | 34 | 10.4% |
| $15,000 to $24,999 | 24 | 7.3% |
| $25,000 to $34,999 | 41 | 12.5% |
| $35,000 to $49,999 | 54 | 16.5% |
| $50,000 to $74,999 | 49 | 15.0% |
| $75,000 to $99,999 | 62 | 19.0% |
| $100,000 to $149,999 | 41 | 12.5% |
| $150,000 to $199,999 | 22 | 6.7% |
| $200,000+ | 0 | 0.0% |
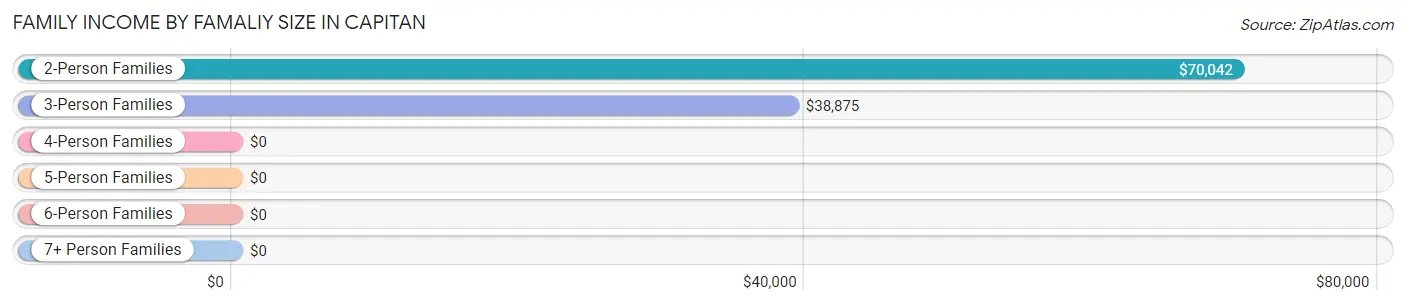
Family Income by Famaliy Size in Capitan
2-person families (185 | 56.6%) account for the highest median family income in Capitan with $70,042 per family, while 2-person families (185 | 56.6%) have the highest median income of $35,021 per family member.
| Income Bracket | # Families | Median Income |
| 2-Person Families | 185 (56.6%) | $70,042 |
| 3-Person Families | 68 (20.8%) | $38,875 |
| 4-Person Families | 59 (18.0%) | $0 |
| 5-Person Families | 2 (0.6%) | $0 |
| 6-Person Families | 0 (0.0%) | $0 |
| 7+ Person Families | 13 (4.0%) | $0 |
| Total | 327 (100.0%) | $68,750 |
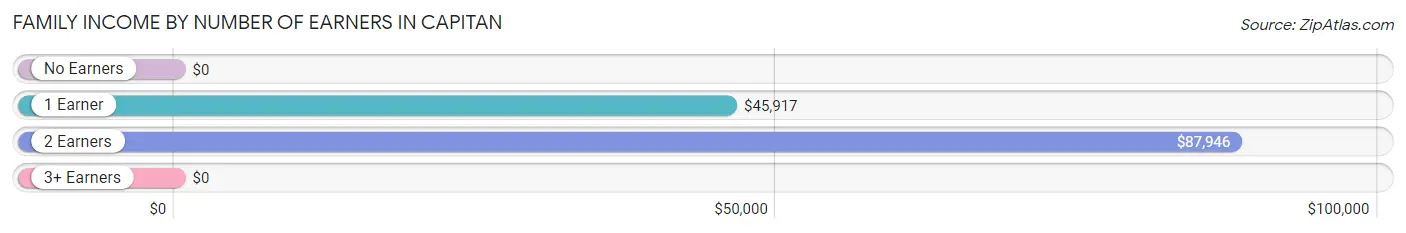
Family Income by Number of Earners in Capitan
| Number of Earners | # Families | Median Income |
| No Earners | 119 (36.4%) | $0 |
| 1 Earner | 97 (29.7%) | $45,917 |
| 2 Earners | 91 (27.8%) | $87,946 |
| 3+ Earners | 20 (6.1%) | $0 |
| Total | 327 (100.0%) | $68,750 |
Household Income in Capitan
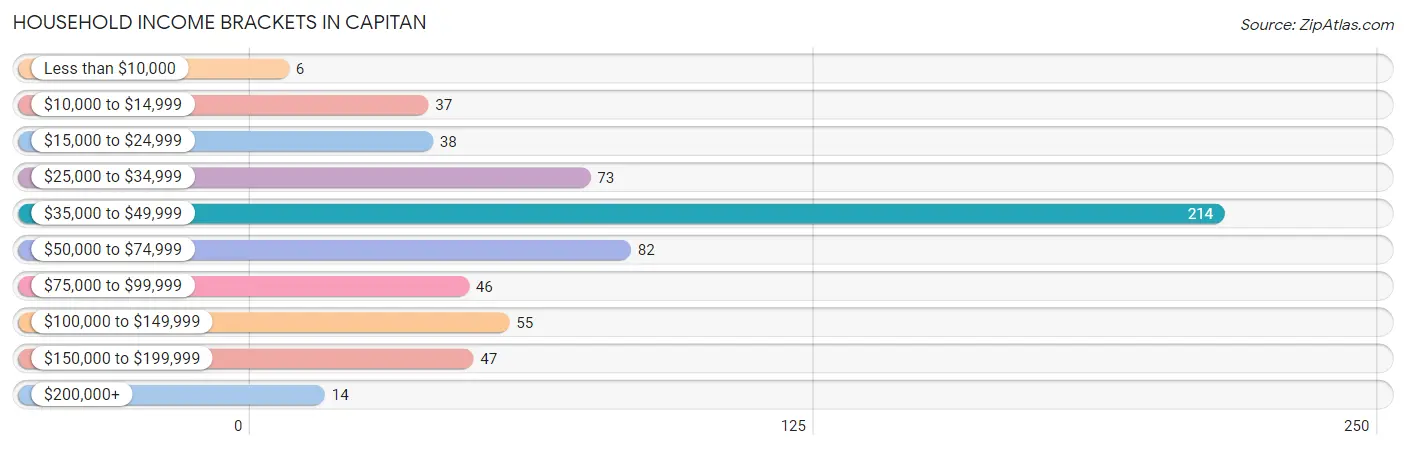
Household Income Brackets in Capitan
With 214 households falling in the category, the $35,000 to $49,999 income range is the most frequent in Capitan, accounting for 35.0% of all households. In contrast, only 6 households (1.0%) fall into the less than $10,000 income bracket, making it the least populous group.
| Income Bracket | # Households | % Households |
| Less than $10,000 | 6 | 1.0% |
| $10,000 to $14,999 | 37 | 6.0% |
| $15,000 to $24,999 | 38 | 6.2% |
| $25,000 to $34,999 | 73 | 11.9% |
| $35,000 to $49,999 | 214 | 35.0% |
| $50,000 to $74,999 | 82 | 13.4% |
| $75,000 to $99,999 | 46 | 7.5% |
| $100,000 to $149,999 | 55 | 9.0% |
| $150,000 to $199,999 | 47 | 7.7% |
| $200,000+ | 14 | 2.3% |
Household Income by Householder Age in Capitan
The median household income in Capitan is $48,826, with the highest median household income of $70,750 found in the 25 to 44 years age bracket for the primary householder. A total of 94 households (15.4%) fall into this category.
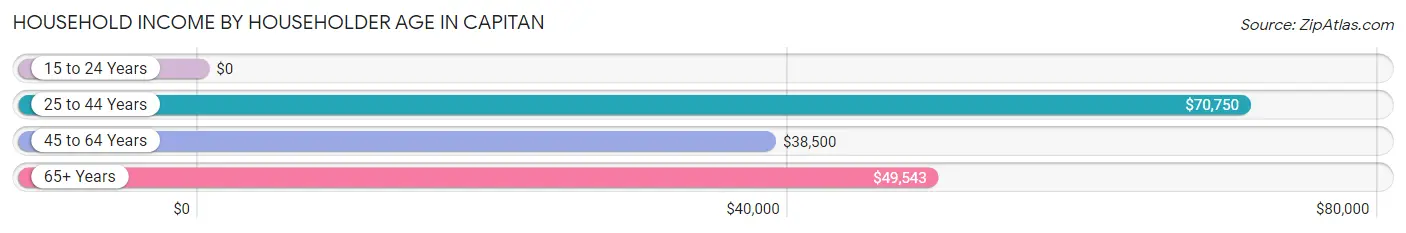
| Income Bracket | # Households | Median Income |
| 15 to 24 Years | 0 (0.0%) | $0 |
| 25 to 44 Years | 94 (15.4%) | $70,750 |
| 45 to 64 Years | 274 (44.8%) | $38,500 |
| 65+ Years | 244 (39.9%) | $49,543 |
| Total | 612 (100.0%) | $48,826 |
Poverty in Capitan
Income Below Poverty by Sex and Age in Capitan
With 11.7% poverty level for males and 17.3% for females among the residents of Capitan, 12 to 14 year old males and 15 year old females are the most vulnerable to poverty, with 11 males (78.6%) and 10 females (100.0%) in their respective age groups living below the poverty level.
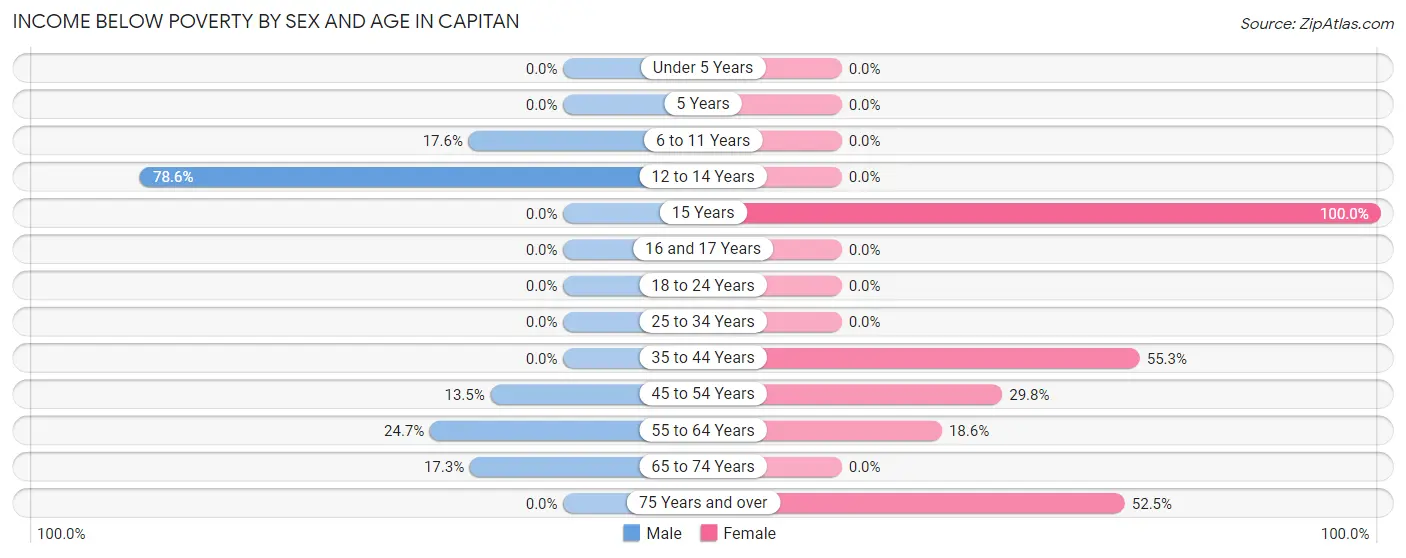
| Age Bracket | Male | Female |
| Under 5 Years | 0 (0.0%) | 0 (0.0%) |
| 5 Years | 0 (0.0%) | 0 (0.0%) |
| 6 to 11 Years | 23 (17.6%) | 0 (0.0%) |
| 12 to 14 Years | 11 (78.6%) | 0 (0.0%) |
| 15 Years | 0 (0.0%) | 10 (100.0%) |
| 16 and 17 Years | 0 (0.0%) | 0 (0.0%) |
| 18 to 24 Years | 0 (0.0%) | 0 (0.0%) |
| 25 to 34 Years | 0 (0.0%) | 0 (0.0%) |
| 35 to 44 Years | 0 (0.0%) | 26 (55.3%) |
| 45 to 54 Years | 10 (13.5%) | 14 (29.8%) |
| 55 to 64 Years | 23 (24.7%) | 32 (18.6%) |
| 65 to 74 Years | 13 (17.3%) | 0 (0.0%) |
| 75 Years and over | 0 (0.0%) | 31 (52.5%) |
| Total | 80 (11.7%) | 113 (17.3%) |
Income Above Poverty by Sex and Age in Capitan
According to the poverty statistics in Capitan, males aged under 5 years and females aged under 5 years are the age groups that are most secure financially, with 100.0% of males and 100.0% of females in these age groups living above the poverty line.
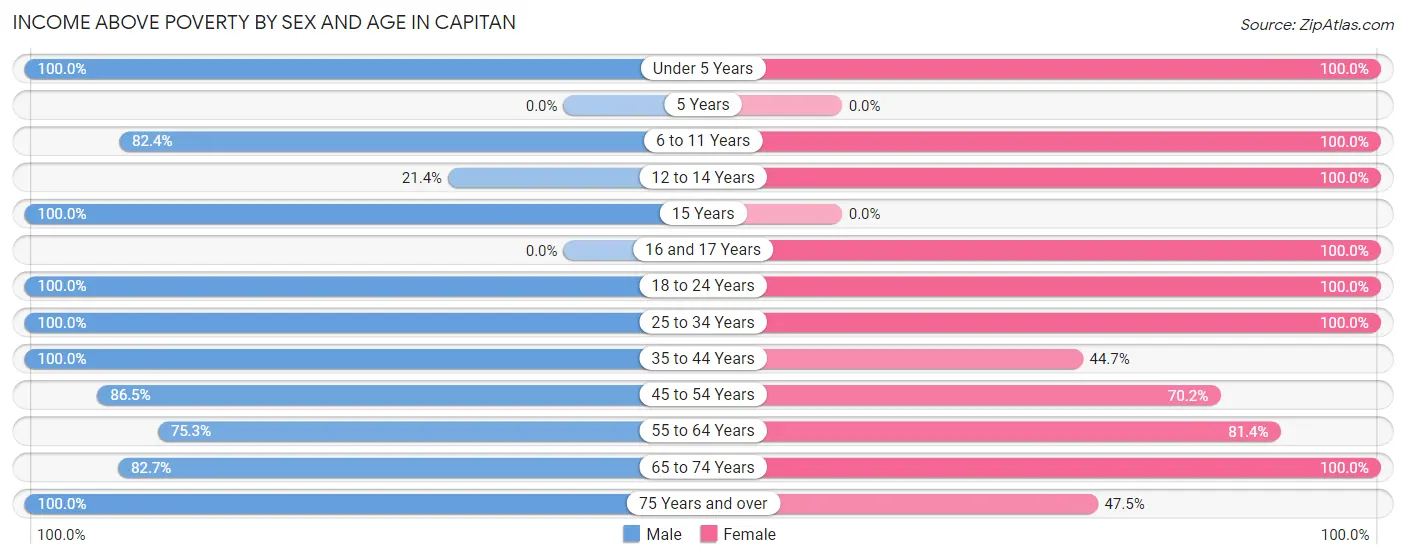
| Age Bracket | Male | Female |
| Under 5 Years | 30 (100.0%) | 3 (100.0%) |
| 5 Years | 0 (0.0%) | 0 (0.0%) |
| 6 to 11 Years | 108 (82.4%) | 2 (100.0%) |
| 12 to 14 Years | 3 (21.4%) | 33 (100.0%) |
| 15 Years | 17 (100.0%) | 0 (0.0%) |
| 16 and 17 Years | 0 (0.0%) | 11 (100.0%) |
| 18 to 24 Years | 45 (100.0%) | 16 (100.0%) |
| 25 to 34 Years | 53 (100.0%) | 74 (100.0%) |
| 35 to 44 Years | 117 (100.0%) | 21 (44.7%) |
| 45 to 54 Years | 64 (86.5%) | 33 (70.2%) |
| 55 to 64 Years | 70 (75.3%) | 140 (81.4%) |
| 65 to 74 Years | 62 (82.7%) | 178 (100.0%) |
| 75 Years and over | 32 (100.0%) | 28 (47.5%) |
| Total | 601 (88.2%) | 539 (82.7%) |
Income Below Poverty Among Married-Couple Families in Capitan
The poverty statistics for married-couple families in Capitan show that 14.9% or 33 of the total 221 families live below the poverty line. Families with 1 or 2 children have the highest poverty rate of 57.9%, comprising of 33 families. On the other hand, families with no children have the lowest poverty rate of 0.0%, which includes 0 families.
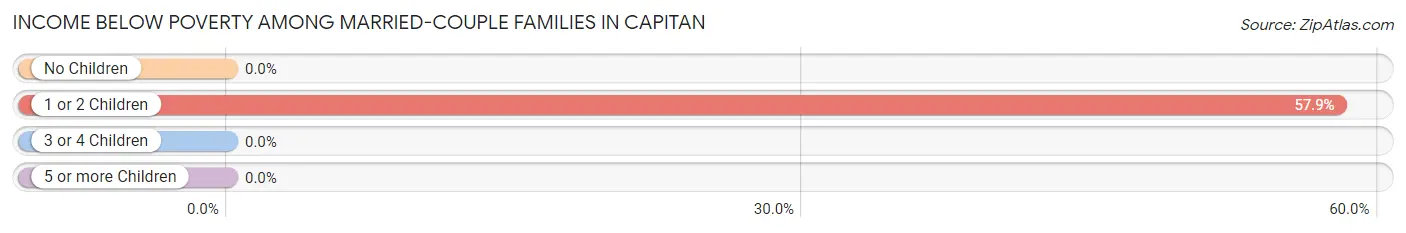
| Children | Above Poverty | Below Poverty |
| No Children | 149 (100.0%) | 0 (0.0%) |
| 1 or 2 Children | 24 (42.1%) | 33 (57.9%) |
| 3 or 4 Children | 15 (100.0%) | 0 (0.0%) |
| 5 or more Children | 0 (0.0%) | 0 (0.0%) |
| Total | 188 (85.1%) | 33 (14.9%) |
Income Below Poverty Among Single-Parent Households in Capitan
According to the poverty data in Capitan, 17.7% or 11 single-father households and 31.8% or 14 single-mother households are living below the poverty line. Among single-father households, those with no children have the highest poverty rate, with 11 households (45.8%) experiencing poverty. Likewise, among single-mother households, those with no children have the highest poverty rate, with 14 households (73.7%) falling below the poverty line.
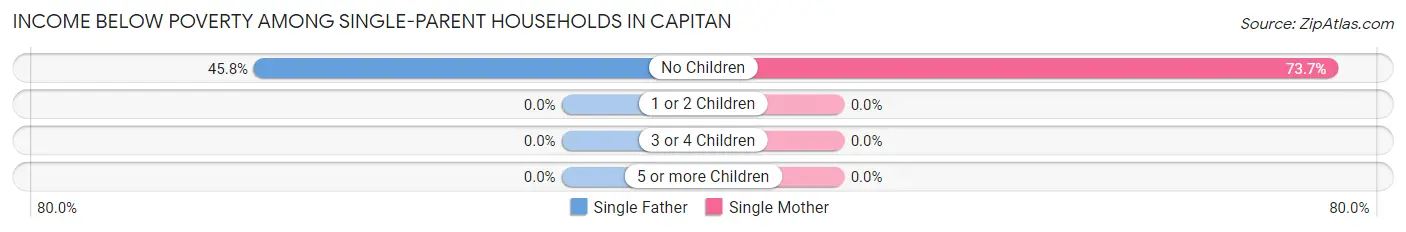
| Children | Single Father | Single Mother |
| No Children | 11 (45.8%) | 14 (73.7%) |
| 1 or 2 Children | 0 (0.0%) | 0 (0.0%) |
| 3 or 4 Children | 0 (0.0%) | 0 (0.0%) |
| 5 or more Children | 0 (0.0%) | 0 (0.0%) |
| Total | 11 (17.7%) | 14 (31.8%) |
Income Below Poverty Among Married-Couple vs Single-Parent Households in Capitan
The poverty data for Capitan shows that 33 of the married-couple family households (14.9%) and 25 of the single-parent households (23.6%) are living below the poverty level. Within the married-couple family households, those with 1 or 2 children have the highest poverty rate, with 33 households (57.9%) falling below the poverty line. Among the single-parent households, those with no children have the highest poverty rate, with 25 household (58.1%) living below poverty.
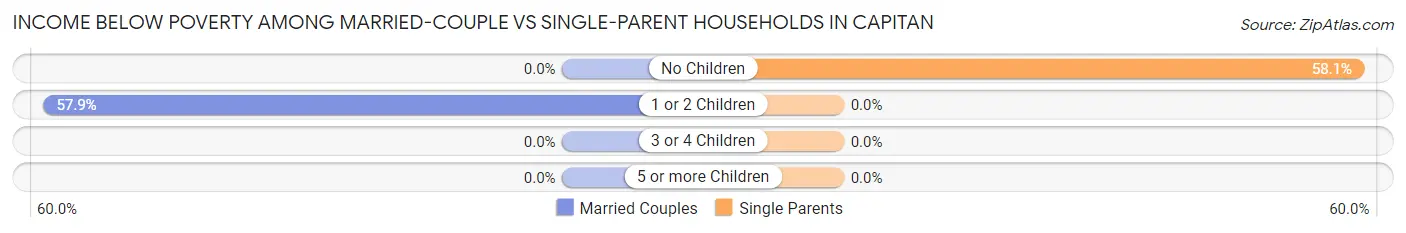
| Children | Married-Couple Families | Single-Parent Households |
| No Children | 0 (0.0%) | 25 (58.1%) |
| 1 or 2 Children | 33 (57.9%) | 0 (0.0%) |
| 3 or 4 Children | 0 (0.0%) | 0 (0.0%) |
| 5 or more Children | 0 (0.0%) | 0 (0.0%) |
| Total | 33 (14.9%) | 25 (23.6%) |
Race in Capitan
The most populous races in Capitan are White / Caucasian (1,258 | 91.1%), Hispanic or Latino (562 | 40.7%), and Two or more Races (116 | 8.4%).
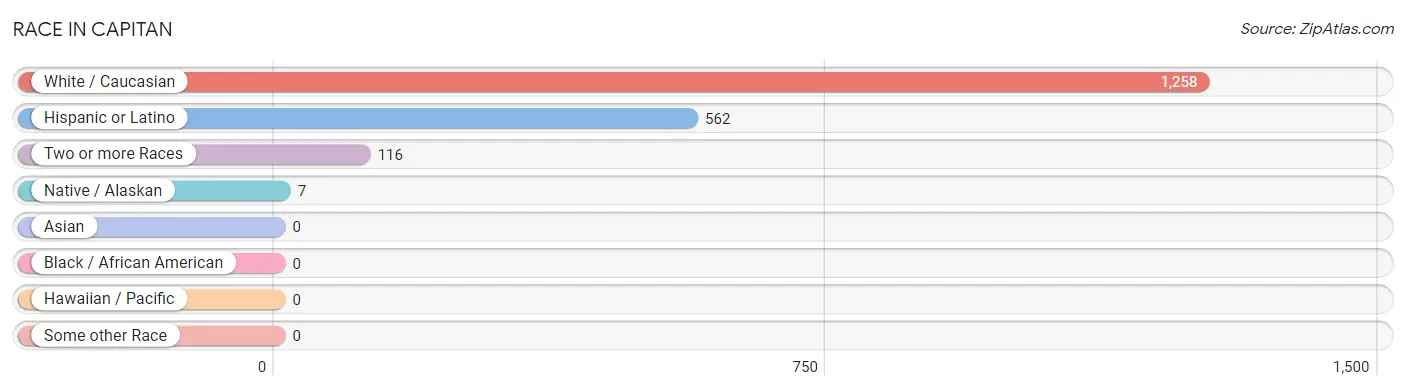
| Race | # Population | % Population |
| Asian | 0 | 0.0% |
| Black / African American | 0 | 0.0% |
| Hawaiian / Pacific | 0 | 0.0% |
| Hispanic or Latino | 562 | 40.7% |
| Native / Alaskan | 7 | 0.5% |
| White / Caucasian | 1,258 | 91.1% |
| Two or more Races | 116 | 8.4% |
| Some other Race | 0 | 0.0% |
| Total | 1,381 | 100.0% |
Ancestry in Capitan
The most populous ancestries reported in Capitan are Mexican (520 | 37.7%), American (320 | 23.2%), German (131 | 9.5%), English (100 | 7.2%), and Irish (79 | 5.7%), together accounting for 83.3% of all Capitan residents.
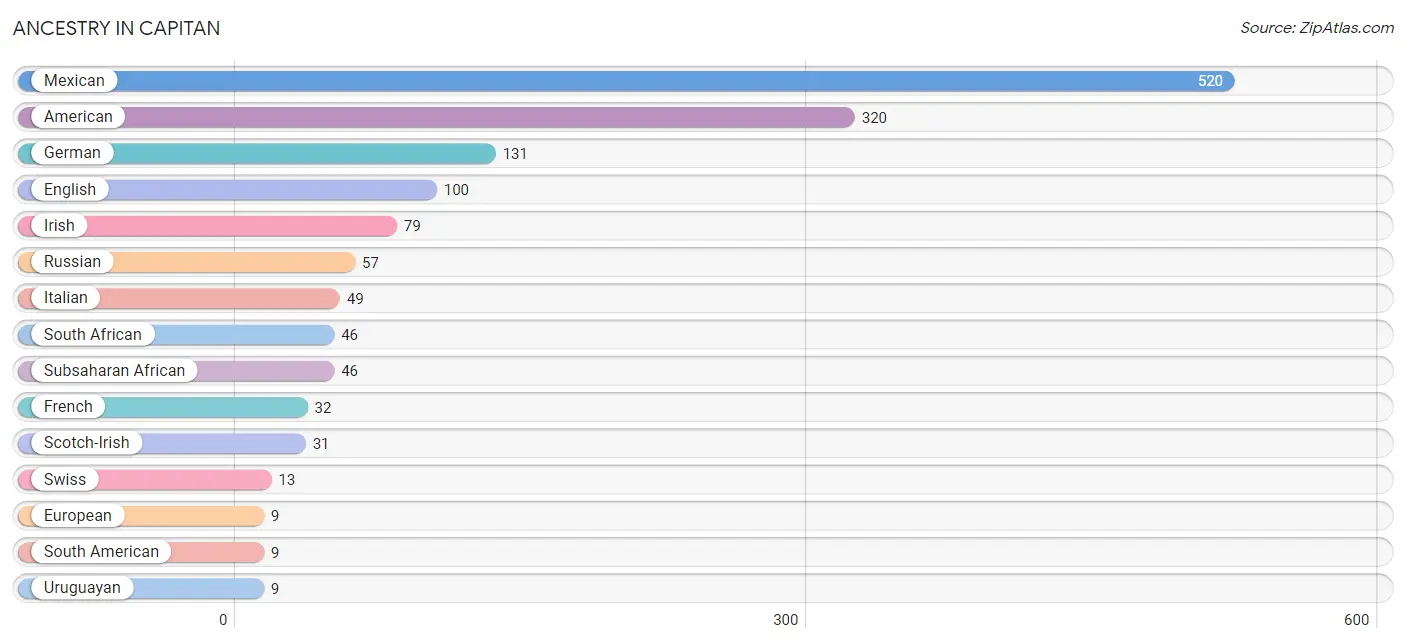
| Ancestry | # Population | % Population |
| American | 320 | 23.2% |
| Apache | 7 | 0.5% |
| Chickasaw | 5 | 0.4% |
| Czech | 5 | 0.4% |
| Dutch | 6 | 0.4% |
| Eastern European | 2 | 0.1% |
| English | 100 | 7.2% |
| European | 9 | 0.6% |
| French | 32 | 2.3% |
| German | 131 | 9.5% |
| Hungarian | 2 | 0.1% |
| Irish | 79 | 5.7% |
| Italian | 49 | 3.5% |
| Mexican | 520 | 37.7% |
| Portuguese | 2 | 0.1% |
| Russian | 57 | 4.1% |
| Scotch-Irish | 31 | 2.2% |
| Scottish | 3 | 0.2% |
| South African | 46 | 3.3% |
| South American | 9 | 0.6% |
| Subsaharan African | 46 | 3.3% |
| Swiss | 13 | 0.9% |
| Uruguayan | 9 | 0.6% | View All 23 Rows |
Immigrants in Capitan
The most numerous immigrant groups reported in Capitan came from Europe (20 | 1.5%), Central America (16 | 1.2%), Latin America (16 | 1.2%), Mexico (16 | 1.2%), and Eastern Europe (15 | 1.1%), together accounting for 6.0% of all Capitan residents.
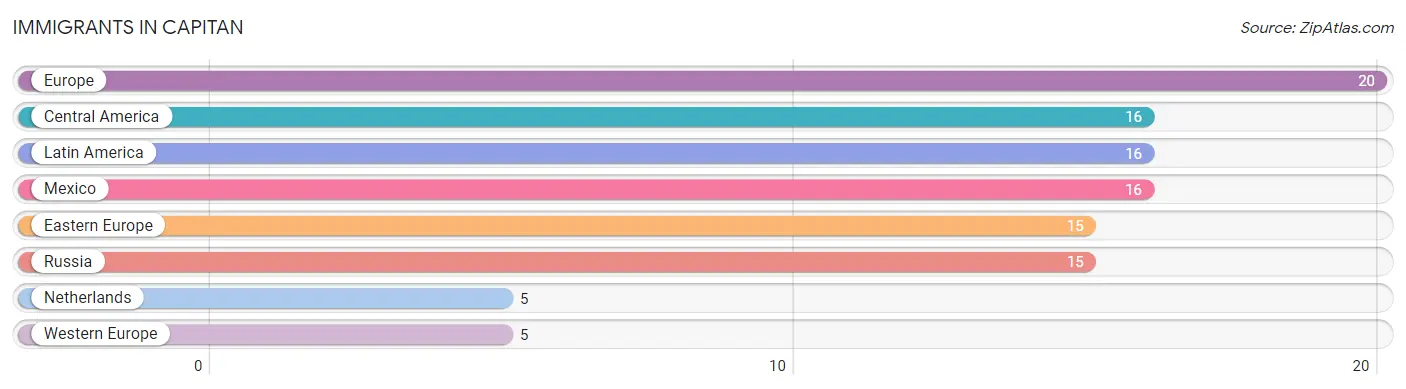
| Immigration Origin | # Population | % Population |
| Central America | 16 | 1.2% |
| Eastern Europe | 15 | 1.1% |
| Europe | 20 | 1.5% |
| Latin America | 16 | 1.2% |
| Mexico | 16 | 1.2% |
| Netherlands | 5 | 0.4% |
| Russia | 15 | 1.1% |
| Western Europe | 5 | 0.4% | View All 8 Rows |
Sex and Age in Capitan
Sex and Age in Capitan
The most populous age groups in Capitan are 10 to 14 Years (149 | 20.4%) for men and 65 to 69 Years (115 | 17.6%) for women.
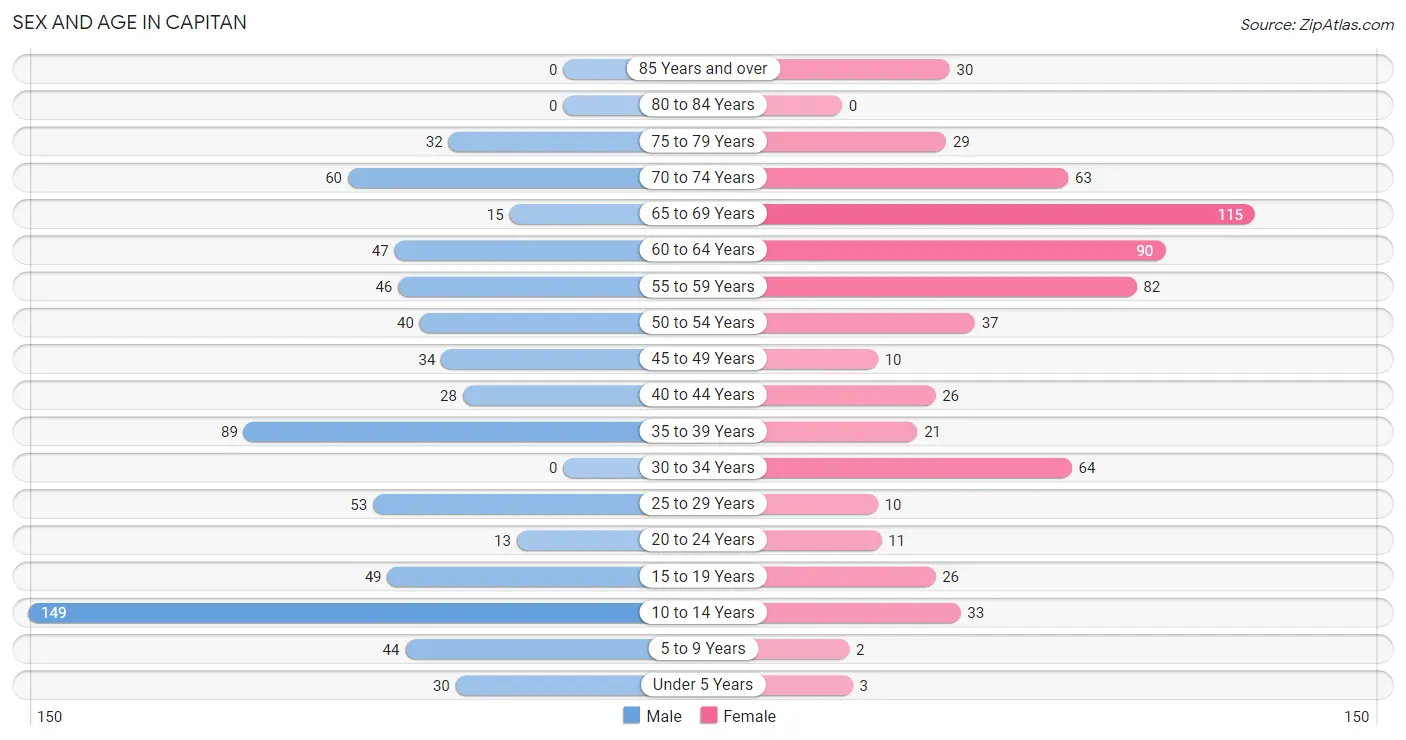
| Age Bracket | Male | Female |
| Under 5 Years | 30 (4.1%) | 3 (0.5%) |
| 5 to 9 Years | 44 (6.0%) | 2 (0.3%) |
| 10 to 14 Years | 149 (20.4%) | 33 (5.1%) |
| 15 to 19 Years | 49 (6.7%) | 26 (4.0%) |
| 20 to 24 Years | 13 (1.8%) | 11 (1.7%) |
| 25 to 29 Years | 53 (7.3%) | 10 (1.5%) |
| 30 to 34 Years | 0 (0.0%) | 64 (9.8%) |
| 35 to 39 Years | 89 (12.2%) | 21 (3.2%) |
| 40 to 44 Years | 28 (3.8%) | 26 (4.0%) |
| 45 to 49 Years | 34 (4.7%) | 10 (1.5%) |
| 50 to 54 Years | 40 (5.5%) | 37 (5.7%) |
| 55 to 59 Years | 46 (6.3%) | 82 (12.6%) |
| 60 to 64 Years | 47 (6.5%) | 90 (13.8%) |
| 65 to 69 Years | 15 (2.1%) | 115 (17.6%) |
| 70 to 74 Years | 60 (8.2%) | 63 (9.7%) |
| 75 to 79 Years | 32 (4.4%) | 29 (4.4%) |
| 80 to 84 Years | 0 (0.0%) | 0 (0.0%) |
| 85 Years and over | 0 (0.0%) | 30 (4.6%) |
| Total | 729 (100.0%) | 652 (100.0%) |
Families and Households in Capitan
Median Family Size in Capitan
The median family size in Capitan is 2.91 persons per family, with single female/mother families (44 | 13.5%) accounting for the largest median family size of 3.84 persons per family. On the other hand, single male/father families (62 | 19.0%) represent the smallest median family size with 2.21 persons per family.
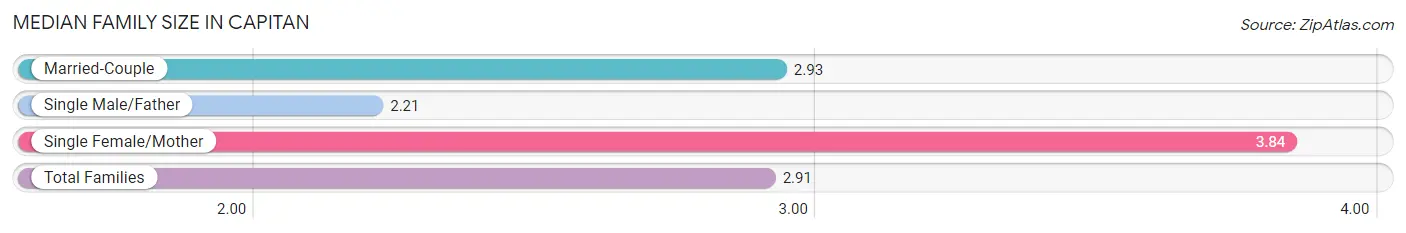
| Family Type | # Families | Family Size |
| Married-Couple | 221 (67.6%) | 2.93 |
| Single Male/Father | 62 (19.0%) | 2.21 |
| Single Female/Mother | 44 (13.5%) | 3.84 |
| Total Families | 327 (100.0%) | 2.91 |
Median Household Size in Capitan
The median household size in Capitan is 2.25 persons per household, with single female/mother households (44 | 7.2%) accounting for the largest median household size of 5.98 persons per household. non-family households (285 | 46.6%) represent the smallest median household size with 1.07 persons per household.
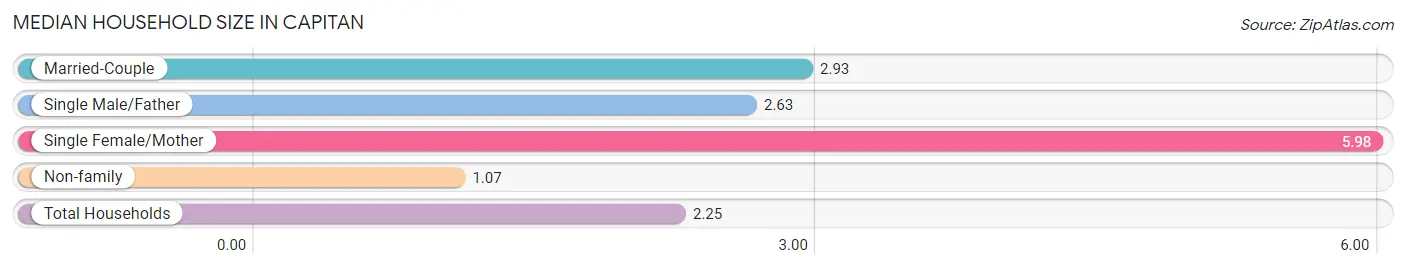
| Household Type | # Households | Household Size |
| Married-Couple | 221 (36.1%) | 2.93 |
| Single Male/Father | 62 (10.1%) | 2.63 |
| Single Female/Mother | 44 (7.2%) | 5.98 |
| Non-family | 285 (46.6%) | 1.07 |
| Total Households | 612 (100.0%) | 2.25 |
Household Size by Marriage Status in Capitan
Out of a total of 612 households in Capitan, 327 (53.4%) are family households, while 285 (46.6%) are nonfamily households. The most numerous type of family households are 2-person households, comprising 162, and the most common type of nonfamily households are 1-person households, comprising 260.
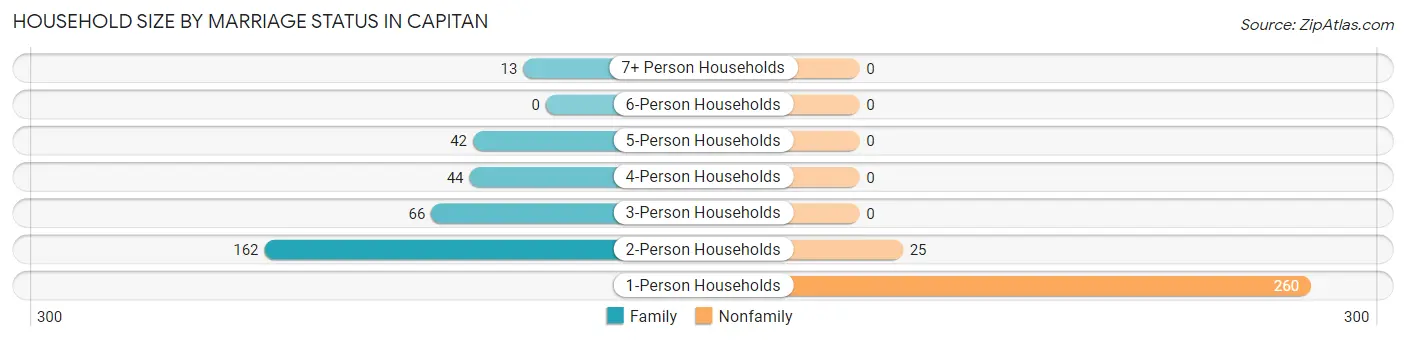
| Household Size | Family Households | Nonfamily Households |
| 1-Person Households | - | 260 (42.5%) |
| 2-Person Households | 162 (26.5%) | 25 (4.1%) |
| 3-Person Households | 66 (10.8%) | 0 (0.0%) |
| 4-Person Households | 44 (7.2%) | 0 (0.0%) |
| 5-Person Households | 42 (6.9%) | 0 (0.0%) |
| 6-Person Households | 0 (0.0%) | 0 (0.0%) |
| 7+ Person Households | 13 (2.1%) | 0 (0.0%) |
| Total | 327 (53.4%) | 285 (46.6%) |
Female Fertility in Capitan
Fertility by Age in Capitan
Average fertility rate in Capitan is 63.0 births per 1,000 women. Women in the age bracket of 20 to 34 years have the highest fertility rate with 129.0 births per 1,000 women. Women in the age bracket of 20 to 34 years acount for 100.0% of all women with births.
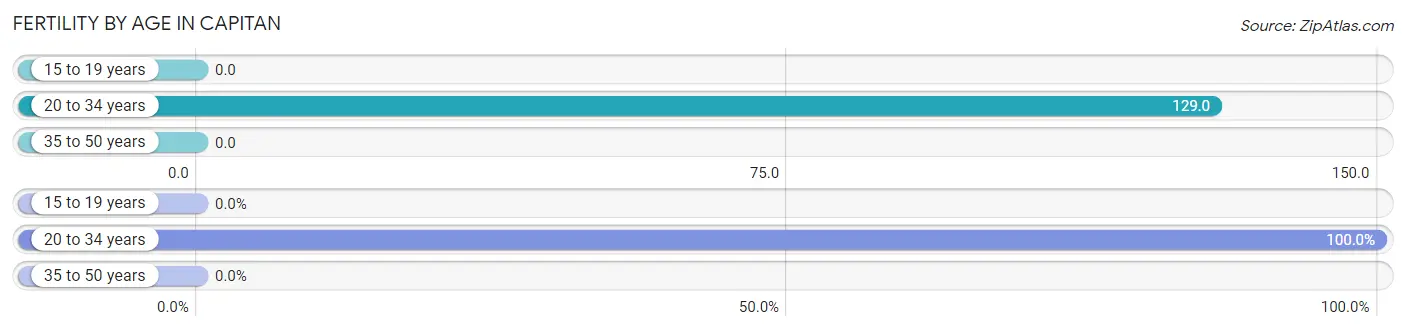
| Age Bracket | Women with Births | Births / 1,000 Women |
| 15 to 19 years | 0 (0.0%) | 0.0 |
| 20 to 34 years | 11 (100.0%) | 129.0 |
| 35 to 50 years | 0 (0.0%) | 0.0 |
| Total | 11 (100.0%) | 63.0 |
Fertility by Age by Marriage Status in Capitan
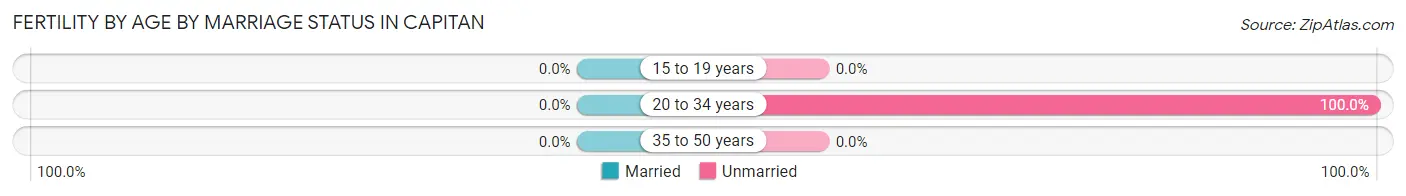
| Age Bracket | Married | Unmarried |
| 15 to 19 years | 0 (0.0%) | 0 (0.0%) |
| 20 to 34 years | 0 (0.0%) | 11 (100.0%) |
| 35 to 50 years | 0 (0.0%) | 0 (0.0%) |
| Total | 0 (0.0%) | 11 (100.0%) |
Fertility by Education in Capitan
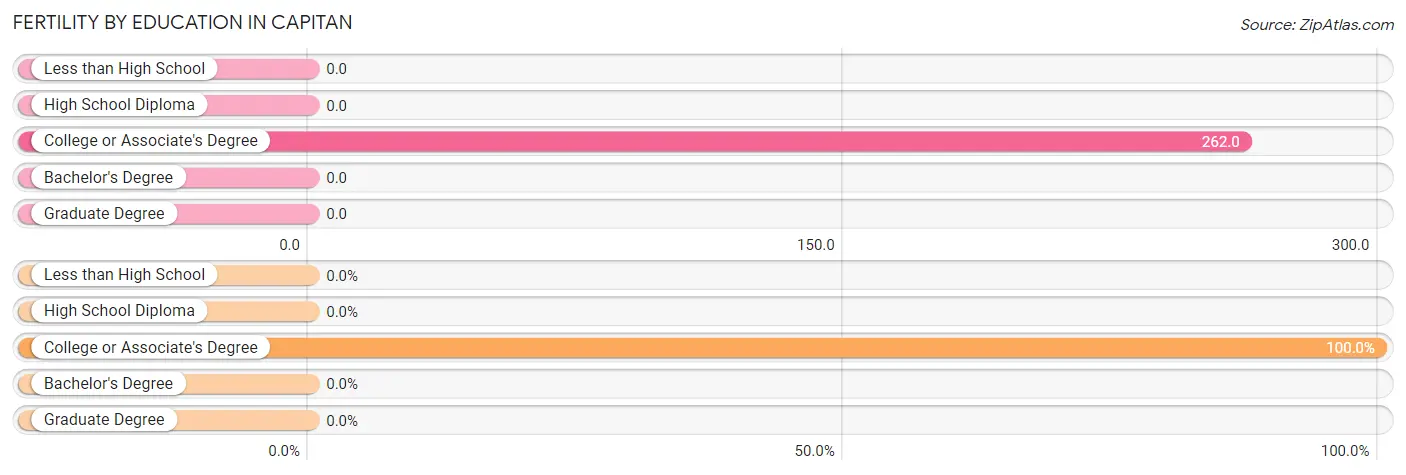
| Educational Attainment | Women with Births | Births / 1,000 Women |
| Less than High School | 0 (0.0%) | 0.0 |
| High School Diploma | 0 (0.0%) | 0.0 |
| College or Associate's Degree | 11 (100.0%) | 262.0 |
| Bachelor's Degree | 0 (0.0%) | 0.0 |
| Graduate Degree | 0 (0.0%) | 0.0 |
| Total | 11 (100.0%) | 63.0 |
Fertility by Education by Marriage Status in Capitan
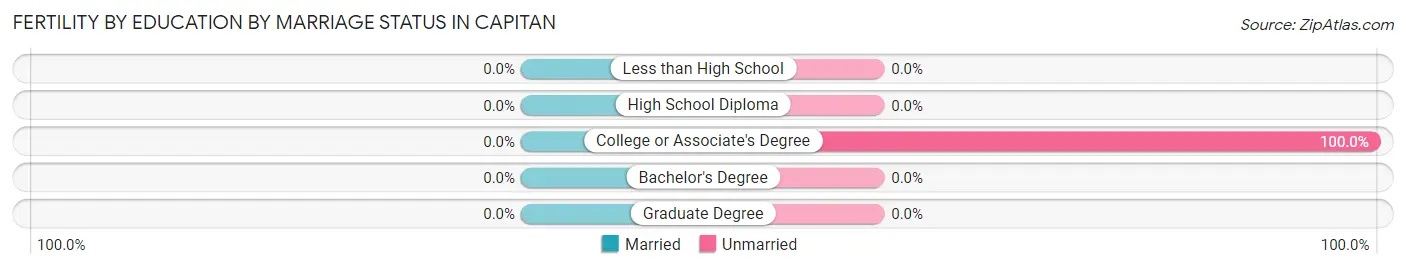
| Educational Attainment | Married | Unmarried |
| Less than High School | 0 (0.0%) | 0 (0.0%) |
| High School Diploma | 0 (0.0%) | 0 (0.0%) |
| College or Associate's Degree | 0 (0.0%) | 11 (100.0%) |
| Bachelor's Degree | 0 (0.0%) | 0 (0.0%) |
| Graduate Degree | 0 (0.0%) | 0 (0.0%) |
| Total | 0 (0.0%) | 11 (100.0%) |
Employment Characteristics in Capitan
Employment by Class of Employer in Capitan
Among the 539 employed individuals in Capitan, private company employees (337 | 62.5%), local government employees (93 | 17.2%), and state government employees (59 | 11.0%) make up the most common classes of employment.
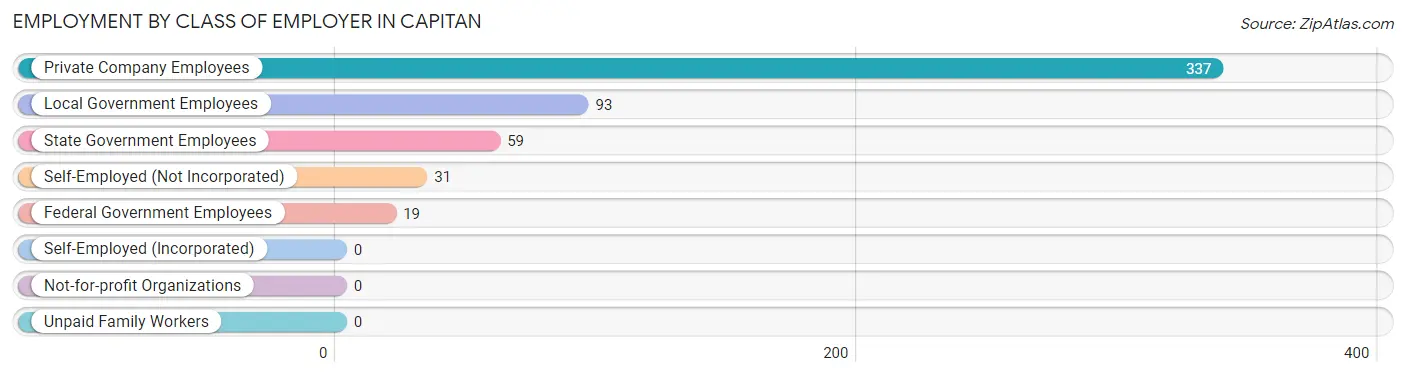
| Employer Class | # Employees | % Employees |
| Private Company Employees | 337 | 62.5% |
| Self-Employed (Incorporated) | 0 | 0.0% |
| Self-Employed (Not Incorporated) | 31 | 5.8% |
| Not-for-profit Organizations | 0 | 0.0% |
| Local Government Employees | 93 | 17.2% |
| State Government Employees | 59 | 11.0% |
| Federal Government Employees | 19 | 3.5% |
| Unpaid Family Workers | 0 | 0.0% |
| Total | 539 | 100.0% |
Employment Status by Age in Capitan
According to the labor force statistics for Capitan, out of the total population over 16 years of age (1,093), 50.8% or 555 individuals are in the labor force, with 2.9% or 16 of them unemployed. The age group with the highest labor force participation rate is 20 to 24 years, with 100.0% or 24 individuals in the labor force. Within the labor force, the 55 to 59 years age range has the highest percentage of unemployed individuals, with 40.0% or 16 of them being unemployed.
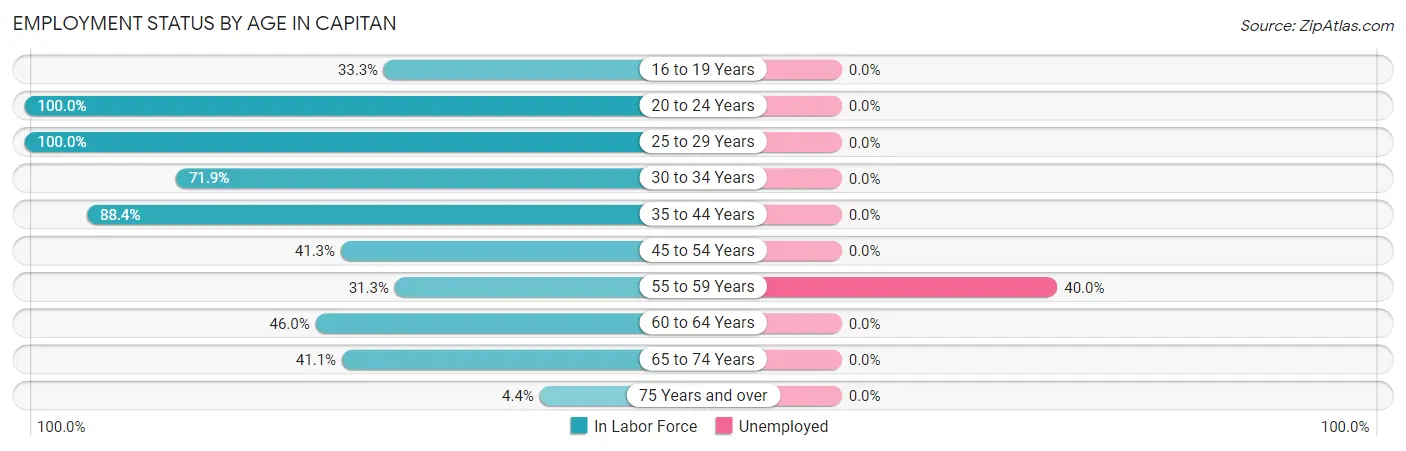
| Age Bracket | In Labor Force | Unemployed |
| 16 to 19 Years | 16 (33.3%) | 0 (0.0%) |
| 20 to 24 Years | 24 (100.0%) | 0 (0.0%) |
| 25 to 29 Years | 63 (100.0%) | 0 (0.0%) |
| 30 to 34 Years | 46 (71.9%) | 0 (0.0%) |
| 35 to 44 Years | 145 (88.4%) | 0 (0.0%) |
| 45 to 54 Years | 50 (41.3%) | 0 (0.0%) |
| 55 to 59 Years | 40 (31.3%) | 16 (40.0%) |
| 60 to 64 Years | 63 (46.0%) | 0 (0.0%) |
| 65 to 74 Years | 104 (41.1%) | 0 (0.0%) |
| 75 Years and over | 4 (4.4%) | 0 (0.0%) |
| Total | 555 (50.8%) | 16 (2.9%) |
Employment Status by Educational Attainment in Capitan
According to labor force statistics for Capitan, 60.1% of individuals (407) out of the total population between 25 and 64 years of age (677) are in the labor force, with 3.9% or 16 of them being unemployed. The group with the highest labor force participation rate are those with the educational attainment of bachelor's degree or higher, with 73.6% or 81 individuals in the labor force. Within the labor force, individuals with college / associate degree education have the highest percentage of unemployment, with 9.9% or 16 of them being unemployed.
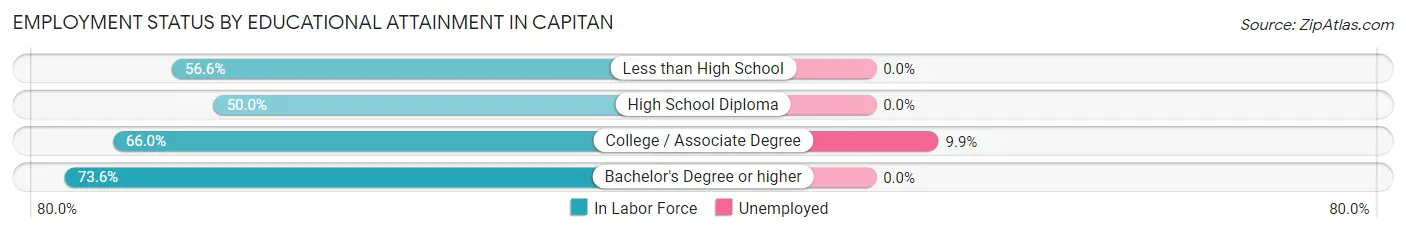
| Educational Attainment | In Labor Force | Unemployed |
| Less than High School | 30 (56.6%) | 0 (0.0%) |
| High School Diploma | 135 (50.0%) | 0 (0.0%) |
| College / Associate Degree | 161 (66.0%) | 24 (9.9%) |
| Bachelor's Degree or higher | 81 (73.6%) | 0 (0.0%) |
| Total | 407 (60.1%) | 26 (3.9%) |
Employment Occupations by Sex in Capitan
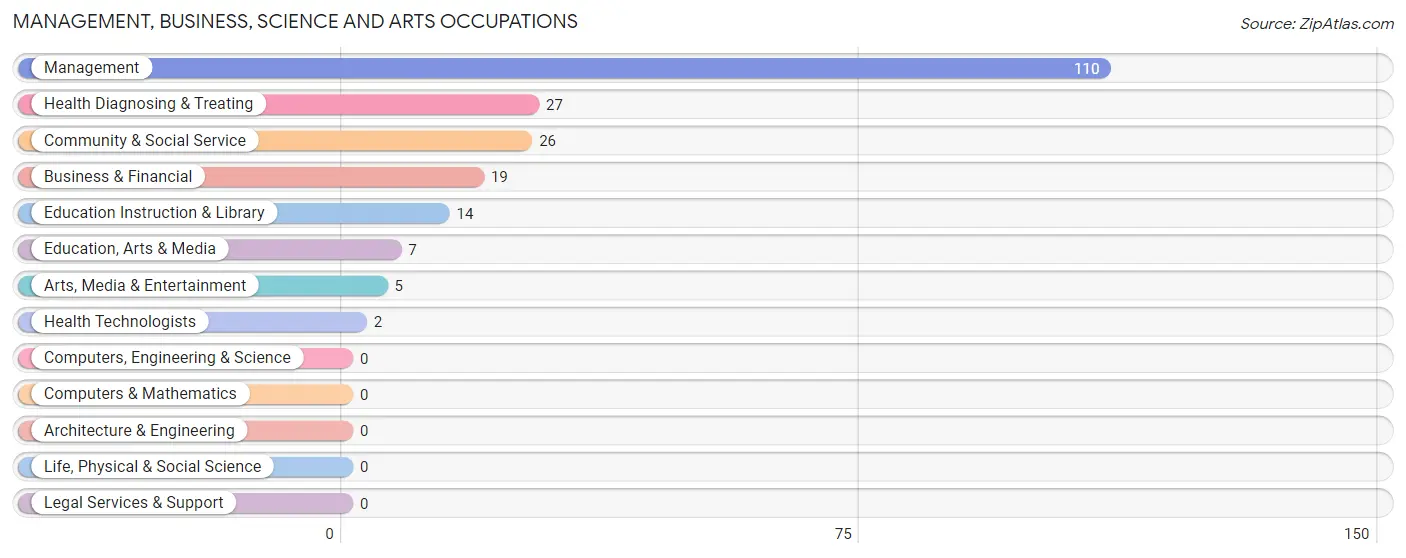
Management, Business, Science and Arts Occupations
The most common Management, Business, Science and Arts occupations in Capitan are Management (110 | 20.4%), Health Diagnosing & Treating (27 | 5.0%), Community & Social Service (26 | 4.8%), Business & Financial (19 | 3.5%), and Education Instruction & Library (14 | 2.6%).
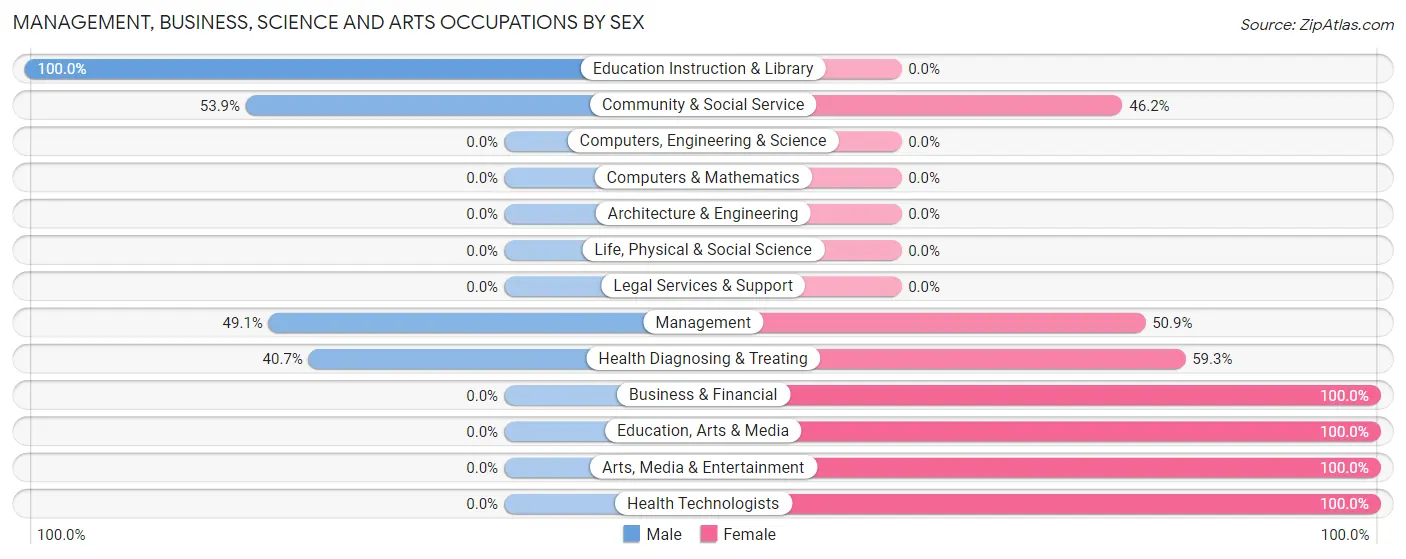
Management, Business, Science and Arts Occupations by Sex
Within the Management, Business, Science and Arts occupations in Capitan, the most male-oriented occupations are Education Instruction & Library (100.0%), Community & Social Service (53.8%), and Management (49.1%), while the most female-oriented occupations are Business & Financial (100.0%), Education, Arts & Media (100.0%), and Arts, Media & Entertainment (100.0%).
| Occupation | Male | Female |
| Management | 54 (49.1%) | 56 (50.9%) |
| Business & Financial | 0 (0.0%) | 19 (100.0%) |
| Computers, Engineering & Science | 0 (0.0%) | 0 (0.0%) |
| Computers & Mathematics | 0 (0.0%) | 0 (0.0%) |
| Architecture & Engineering | 0 (0.0%) | 0 (0.0%) |
| Life, Physical & Social Science | 0 (0.0%) | 0 (0.0%) |
| Community & Social Service | 14 (53.8%) | 12 (46.2%) |
| Education, Arts & Media | 0 (0.0%) | 7 (100.0%) |
| Legal Services & Support | 0 (0.0%) | 0 (0.0%) |
| Education Instruction & Library | 14 (100.0%) | 0 (0.0%) |
| Arts, Media & Entertainment | 0 (0.0%) | 5 (100.0%) |
| Health Diagnosing & Treating | 11 (40.7%) | 16 (59.3%) |
| Health Technologists | 0 (0.0%) | 2 (100.0%) |
| Total (Category) | 79 (43.4%) | 103 (56.6%) |
| Total (Overall) | 249 (46.2%) | 290 (53.8%) |
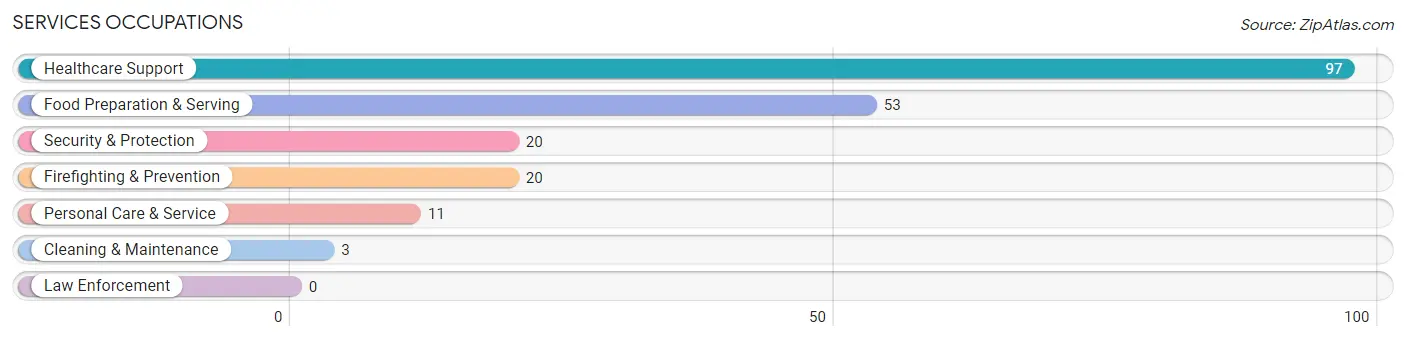
Services Occupations
The most common Services occupations in Capitan are Healthcare Support (97 | 18.0%), Food Preparation & Serving (53 | 9.8%), Security & Protection (20 | 3.7%), Firefighting & Prevention (20 | 3.7%), and Personal Care & Service (11 | 2.0%).
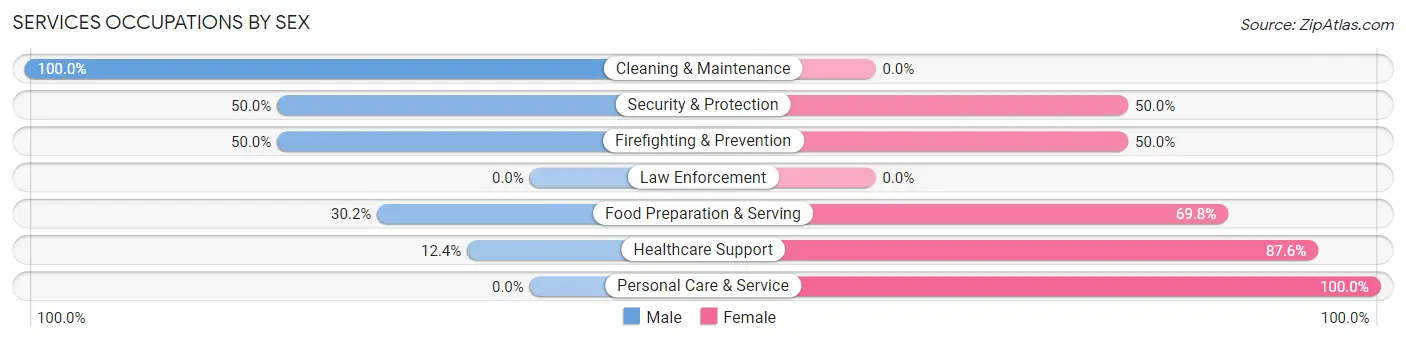
Services Occupations by Sex
Within the Services occupations in Capitan, the most male-oriented occupations are Cleaning & Maintenance (100.0%), Security & Protection (50.0%), and Firefighting & Prevention (50.0%), while the most female-oriented occupations are Personal Care & Service (100.0%), Healthcare Support (87.6%), and Food Preparation & Serving (69.8%).
| Occupation | Male | Female |
| Healthcare Support | 12 (12.4%) | 85 (87.6%) |
| Security & Protection | 10 (50.0%) | 10 (50.0%) |
| Firefighting & Prevention | 10 (50.0%) | 10 (50.0%) |
| Law Enforcement | 0 (0.0%) | 0 (0.0%) |
| Food Preparation & Serving | 16 (30.2%) | 37 (69.8%) |
| Cleaning & Maintenance | 3 (100.0%) | 0 (0.0%) |
| Personal Care & Service | 0 (0.0%) | 11 (100.0%) |
| Total (Category) | 41 (22.3%) | 143 (77.7%) |
| Total (Overall) | 249 (46.2%) | 290 (53.8%) |
Sales and Office Occupations
The most common Sales and Office occupations in Capitan are , and Sales & Related (50 | 9.3%).
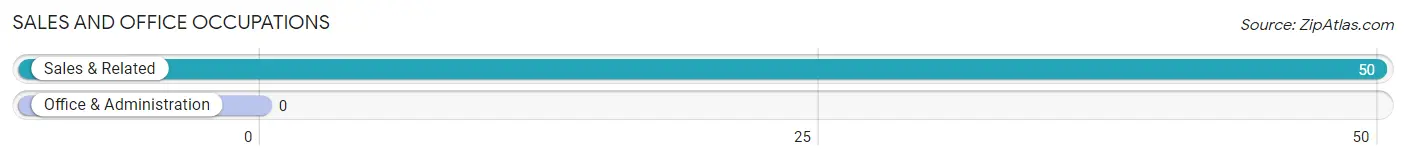
Sales and Office Occupations by Sex
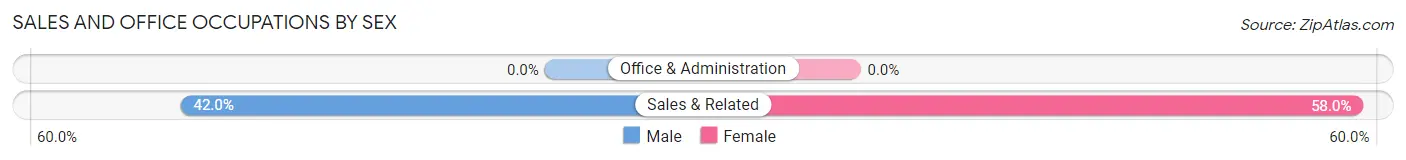
| Occupation | Male | Female |
| Sales & Related | 21 (42.0%) | 29 (58.0%) |
| Office & Administration | 0 (0.0%) | 0 (0.0%) |
| Total (Category) | 21 (42.0%) | 29 (58.0%) |
| Total (Overall) | 249 (46.2%) | 290 (53.8%) |
Natural Resources, Construction and Maintenance Occupations
The most common Natural Resources, Construction and Maintenance occupations in Capitan are Construction & Extraction (76 | 14.1%), and Installation, Maintenance & Repair (20 | 3.7%).
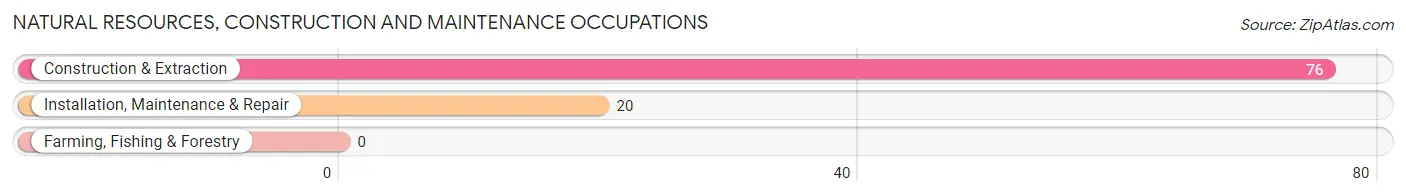
Natural Resources, Construction and Maintenance Occupations by Sex
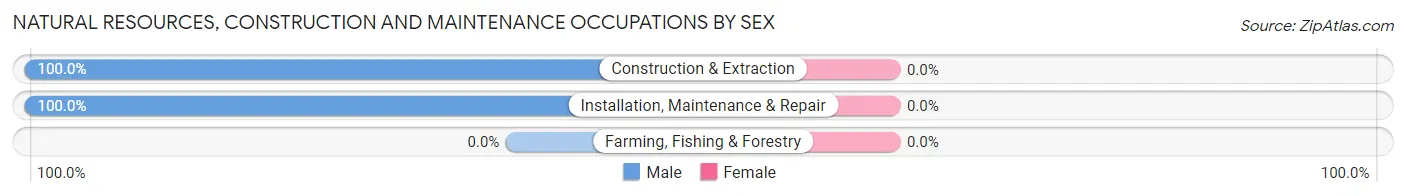
| Occupation | Male | Female |
| Farming, Fishing & Forestry | 0 (0.0%) | 0 (0.0%) |
| Construction & Extraction | 76 (100.0%) | 0 (0.0%) |
| Installation, Maintenance & Repair | 20 (100.0%) | 0 (0.0%) |
| Total (Category) | 96 (100.0%) | 0 (0.0%) |
| Total (Overall) | 249 (46.2%) | 290 (53.8%) |
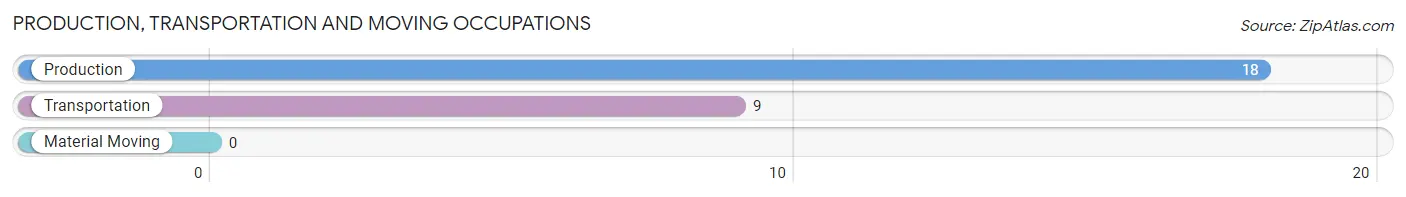
Production, Transportation and Moving Occupations
The most common Production, Transportation and Moving occupations in Capitan are Production (18 | 3.3%), and Transportation (9 | 1.7%).
Production, Transportation and Moving Occupations by Sex
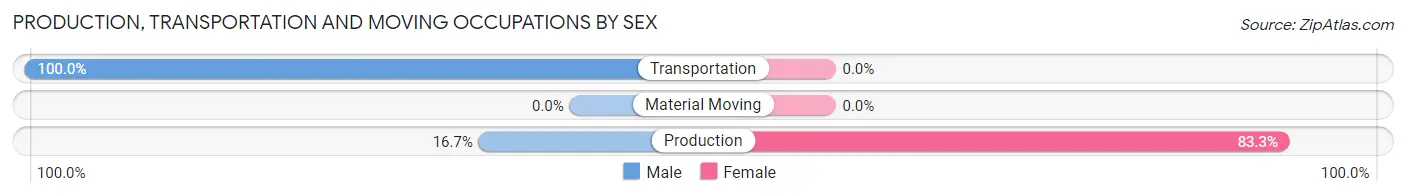
| Occupation | Male | Female |
| Production | 3 (16.7%) | 15 (83.3%) |
| Transportation | 9 (100.0%) | 0 (0.0%) |
| Material Moving | 0 (0.0%) | 0 (0.0%) |
| Total (Category) | 12 (44.4%) | 15 (55.6%) |
| Total (Overall) | 249 (46.2%) | 290 (53.8%) |
Employment Industries by Sex in Capitan
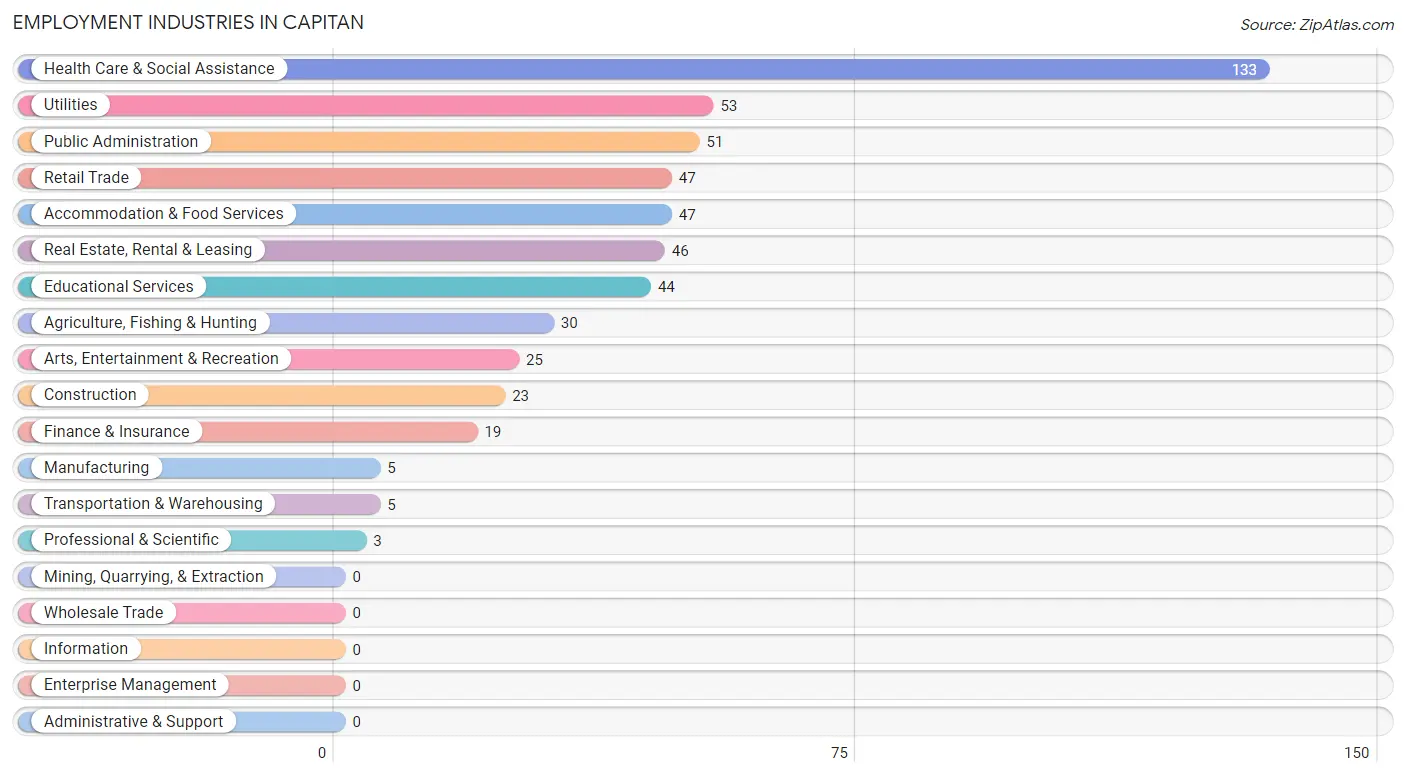
Employment Industries in Capitan
The major employment industries in Capitan include Health Care & Social Assistance (133 | 24.7%), Utilities (53 | 9.8%), Public Administration (51 | 9.5%), Retail Trade (47 | 8.7%), and Accommodation & Food Services (47 | 8.7%).
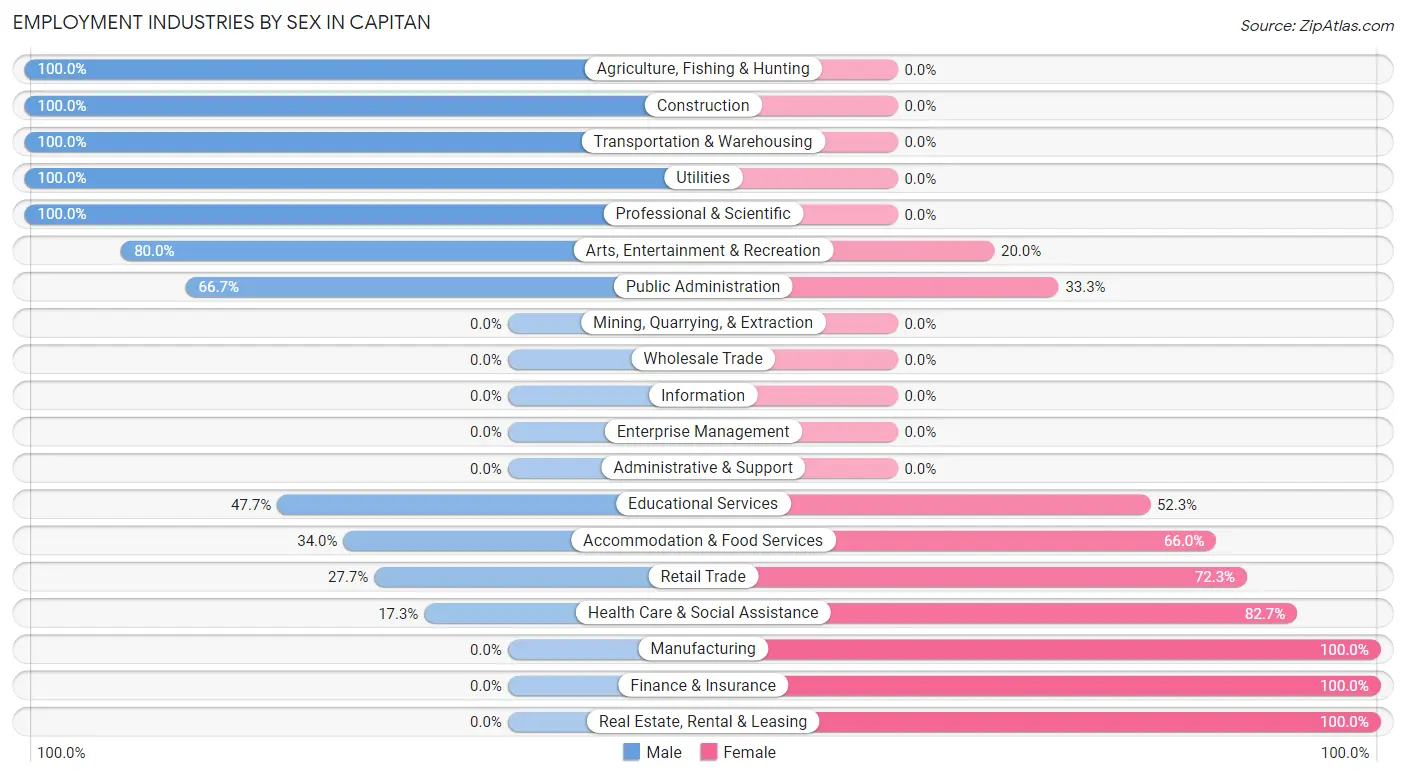
Employment Industries by Sex in Capitan
The Capitan industries that see more men than women are Agriculture, Fishing & Hunting (100.0%), Construction (100.0%), and Transportation & Warehousing (100.0%), whereas the industries that tend to have a higher number of women are Manufacturing (100.0%), Finance & Insurance (100.0%), and Real Estate, Rental & Leasing (100.0%).
| Industry | Male | Female |
| Agriculture, Fishing & Hunting | 30 (100.0%) | 0 (0.0%) |
| Mining, Quarrying, & Extraction | 0 (0.0%) | 0 (0.0%) |
| Construction | 23 (100.0%) | 0 (0.0%) |
| Manufacturing | 0 (0.0%) | 5 (100.0%) |
| Wholesale Trade | 0 (0.0%) | 0 (0.0%) |
| Retail Trade | 13 (27.7%) | 34 (72.3%) |
| Transportation & Warehousing | 5 (100.0%) | 0 (0.0%) |
| Utilities | 53 (100.0%) | 0 (0.0%) |
| Information | 0 (0.0%) | 0 (0.0%) |
| Finance & Insurance | 0 (0.0%) | 19 (100.0%) |
| Real Estate, Rental & Leasing | 0 (0.0%) | 46 (100.0%) |
| Professional & Scientific | 3 (100.0%) | 0 (0.0%) |
| Enterprise Management | 0 (0.0%) | 0 (0.0%) |
| Administrative & Support | 0 (0.0%) | 0 (0.0%) |
| Educational Services | 21 (47.7%) | 23 (52.3%) |
| Health Care & Social Assistance | 23 (17.3%) | 110 (82.7%) |
| Arts, Entertainment & Recreation | 20 (80.0%) | 5 (20.0%) |
| Accommodation & Food Services | 16 (34.0%) | 31 (66.0%) |
| Public Administration | 34 (66.7%) | 17 (33.3%) |
| Total | 249 (46.2%) | 290 (53.8%) |
Education in Capitan
School Enrollment in Capitan
The most common levels of schooling among the 239 students in Capitan are middle school (131 | 54.8%), high school (57 | 23.8%), and elementary school (46 | 19.3%).
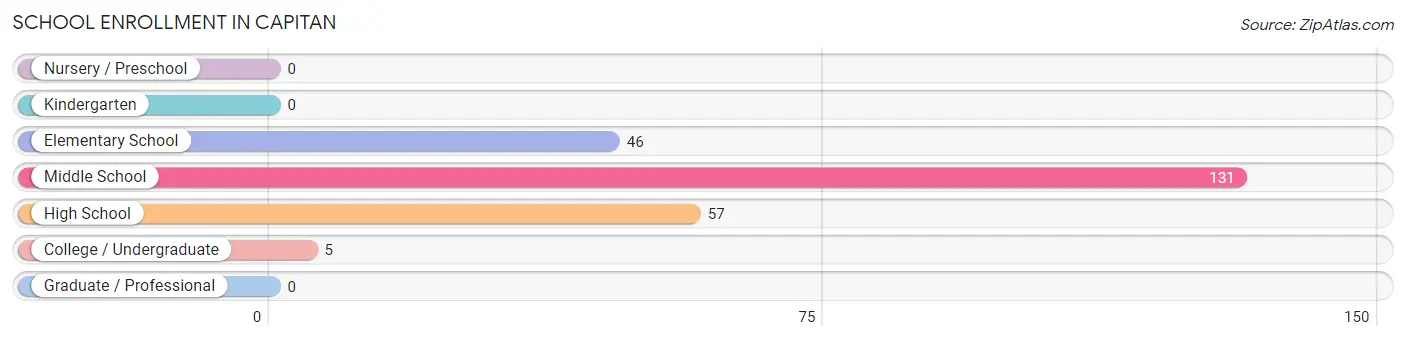
| School Level | # Students | % Students |
| Nursery / Preschool | 0 | 0.0% |
| Kindergarten | 0 | 0.0% |
| Elementary School | 46 | 19.3% |
| Middle School | 131 | 54.8% |
| High School | 57 | 23.8% |
| College / Undergraduate | 5 | 2.1% |
| Graduate / Professional | 0 | 0.0% |
| Total | 239 | 100.0% |
School Enrollment by Age by Funding Source in Capitan
Out of a total of 239 students who are enrolled in schools in Capitan, 5 (2.1%) attend a private institution, while the remaining 234 (97.9%) are enrolled in public schools. The age group of 18 to 19 year olds has the highest likelihood of being enrolled in private schools, with 5 (23.8% in the age bracket) enrolled. Conversely, the age group of 5 to 9 year old has the lowest likelihood of being enrolled in a private school, with 46 (100.0% in the age bracket) attending a public institution.
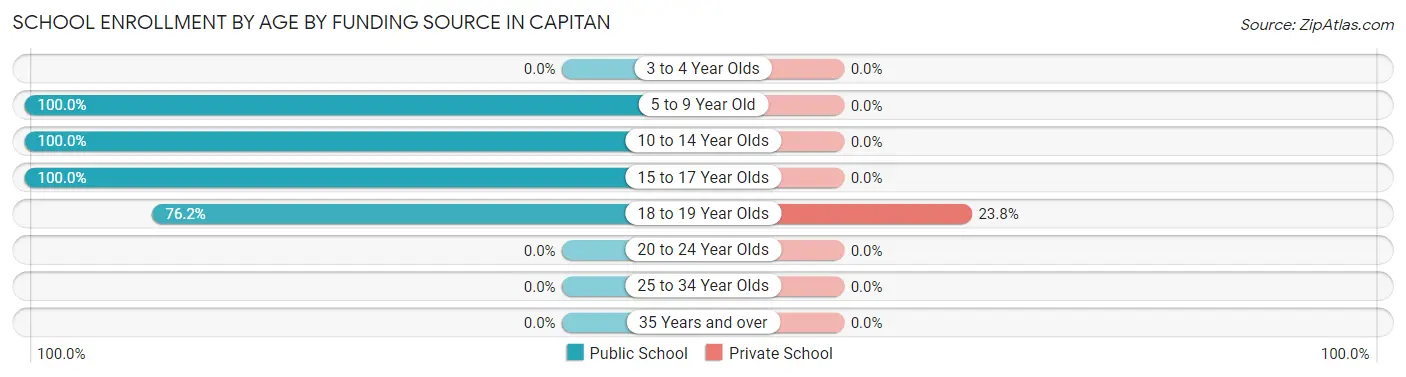
| Age Bracket | Public School | Private School |
| 3 to 4 Year Olds | 0 (0.0%) | 0 (0.0%) |
| 5 to 9 Year Old | 46 (100.0%) | 0 (0.0%) |
| 10 to 14 Year Olds | 134 (100.0%) | 0 (0.0%) |
| 15 to 17 Year Olds | 38 (100.0%) | 0 (0.0%) |
| 18 to 19 Year Olds | 16 (76.2%) | 5 (23.8%) |
| 20 to 24 Year Olds | 0 (0.0%) | 0 (0.0%) |
| 25 to 34 Year Olds | 0 (0.0%) | 0 (0.0%) |
| 35 Years and over | 0 (0.0%) | 0 (0.0%) |
| Total | 234 (97.9%) | 5 (2.1%) |
Educational Attainment by Field of Study in Capitan
Education (51 | 29.0%), social sciences (25 | 14.2%), arts & humanities (22 | 12.5%), bio, nature & agricultural (21 | 11.9%), and science & technology (20 | 11.4%) are the most common fields of study among 176 individuals in Capitan who have obtained a bachelor's degree or higher.
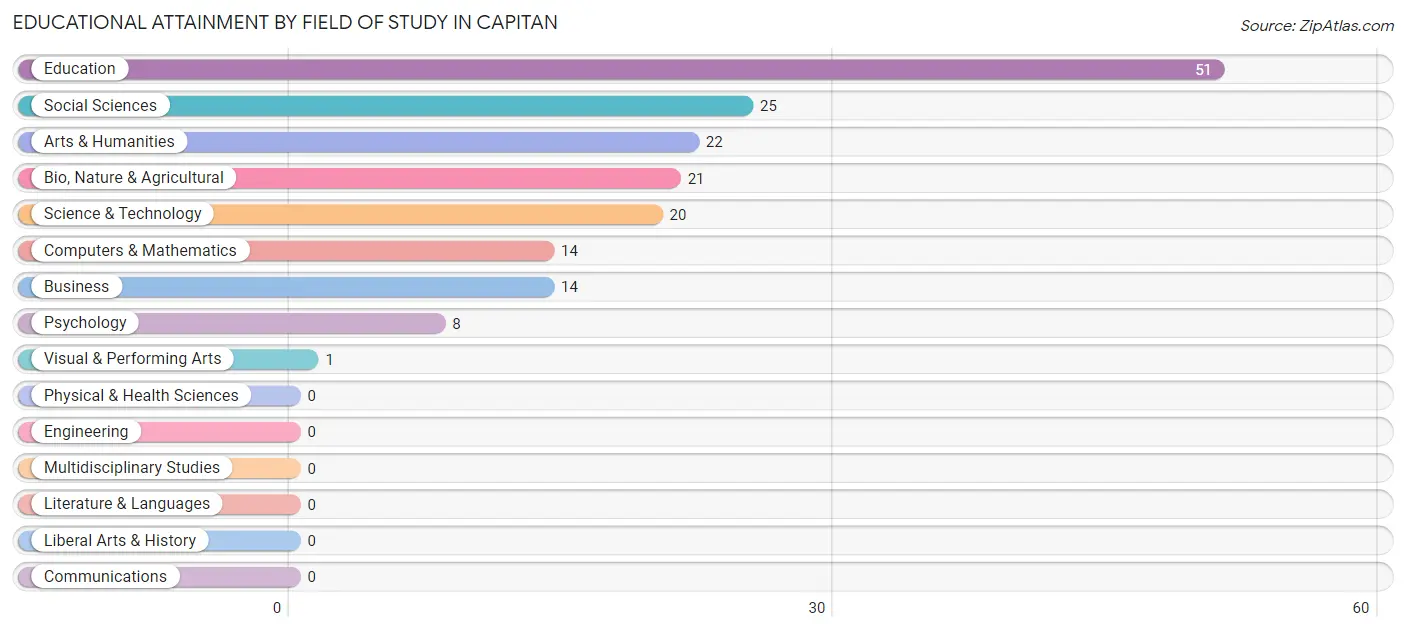
| Field of Study | # Graduates | % Graduates |
| Computers & Mathematics | 14 | 8.0% |
| Bio, Nature & Agricultural | 21 | 11.9% |
| Physical & Health Sciences | 0 | 0.0% |
| Psychology | 8 | 4.5% |
| Social Sciences | 25 | 14.2% |
| Engineering | 0 | 0.0% |
| Multidisciplinary Studies | 0 | 0.0% |
| Science & Technology | 20 | 11.4% |
| Business | 14 | 8.0% |
| Education | 51 | 29.0% |
| Literature & Languages | 0 | 0.0% |
| Liberal Arts & History | 0 | 0.0% |
| Visual & Performing Arts | 1 | 0.6% |
| Communications | 0 | 0.0% |
| Arts & Humanities | 22 | 12.5% |
| Total | 176 | 100.0% |
Transportation & Commute in Capitan
Vehicle Availability by Sex in Capitan
The most prevalent vehicle ownership categories in Capitan are males with 3 vehicles (135, accounting for 54.9%) and females with 3 vehicles (102, making up 46.6%).
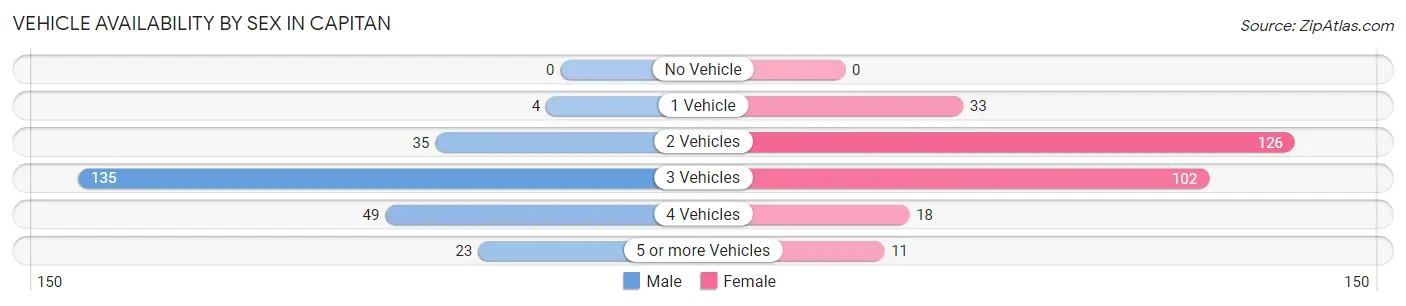
| Vehicles Available | Male | Female |
| No Vehicle | 0 (0.0%) | 0 (0.0%) |
| 1 Vehicle | 4 (1.6%) | 33 (11.4%) |
| 2 Vehicles | 35 (14.2%) | 126 (43.4%) |
| 3 Vehicles | 135 (54.9%) | 102 (35.2%) |
| 4 Vehicles | 49 (19.9%) | 18 (6.2%) |
| 5 or more Vehicles | 23 (9.3%) | 11 (3.8%) |
| Total | 246 (100.0%) | 290 (100.0%) |
Commute Time in Capitan
The most frequently occuring commute durations in Capitan are 30 to 34 minutes (282 commuters, 55.7%), 15 to 19 minutes (68 commuters, 13.4%), and 5 to 9 minutes (48 commuters, 9.5%).
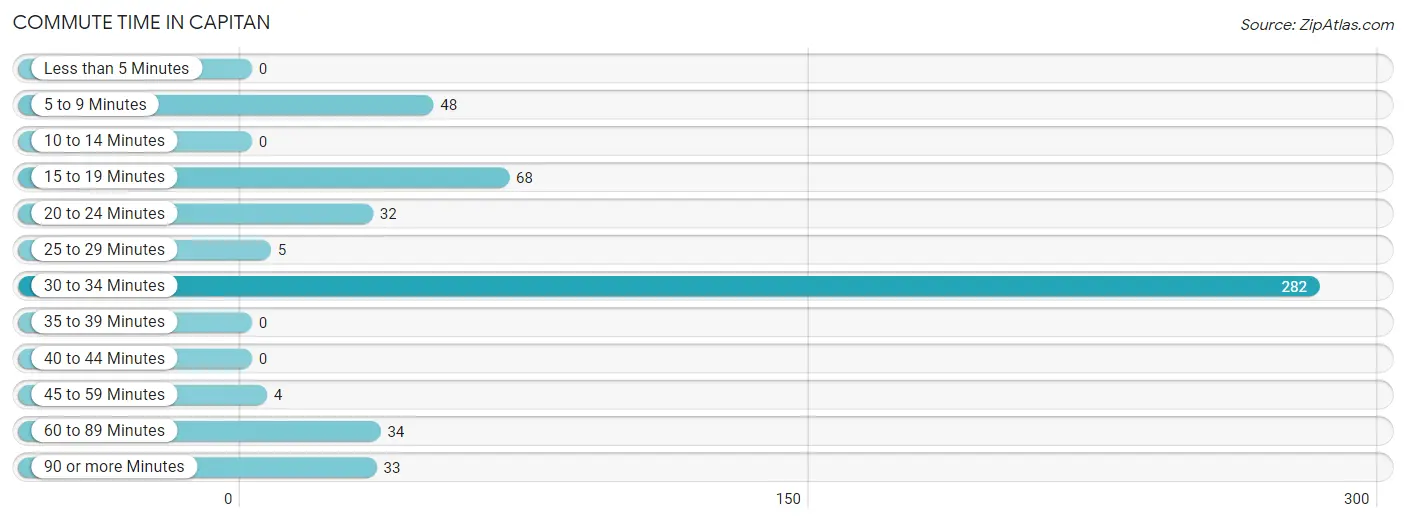
| Commute Time | # Commuters | % Commuters |
| Less than 5 Minutes | 0 | 0.0% |
| 5 to 9 Minutes | 48 | 9.5% |
| 10 to 14 Minutes | 0 | 0.0% |
| 15 to 19 Minutes | 68 | 13.4% |
| 20 to 24 Minutes | 32 | 6.3% |
| 25 to 29 Minutes | 5 | 1.0% |
| 30 to 34 Minutes | 282 | 55.7% |
| 35 to 39 Minutes | 0 | 0.0% |
| 40 to 44 Minutes | 0 | 0.0% |
| 45 to 59 Minutes | 4 | 0.8% |
| 60 to 89 Minutes | 34 | 6.7% |
| 90 or more Minutes | 33 | 6.5% |
Commute Time by Sex in Capitan
The most common commute times in Capitan are 30 to 34 minutes (96 commuters, 38.6%) for males and 30 to 34 minutes (186 commuters, 72.4%) for females.
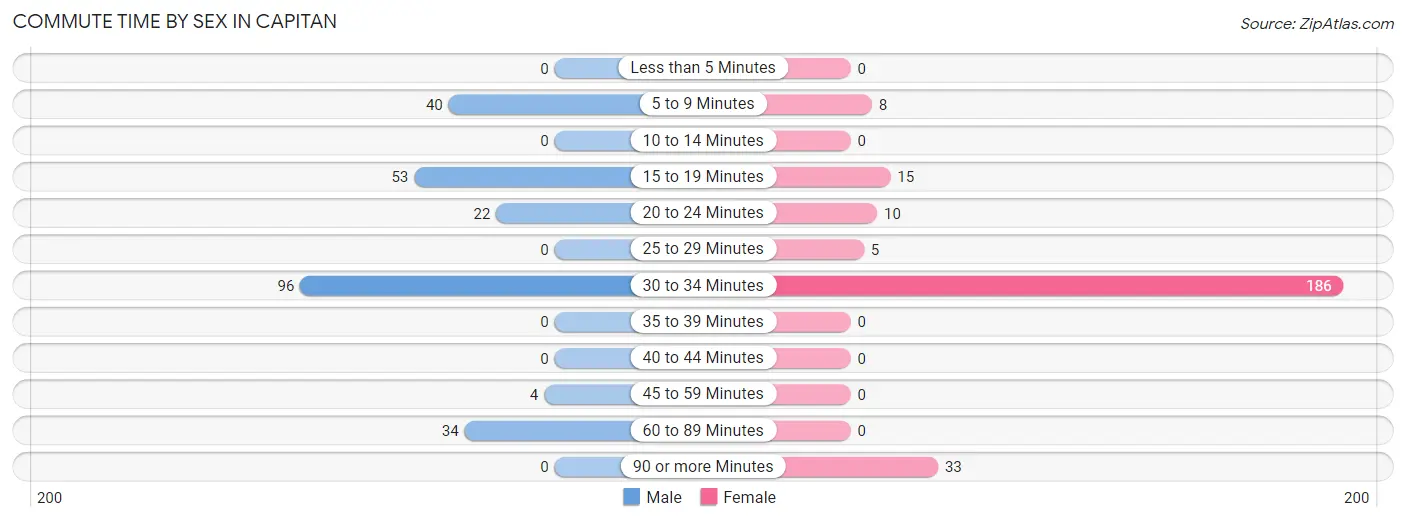
| Commute Time | Male | Female |
| Less than 5 Minutes | 0 (0.0%) | 0 (0.0%) |
| 5 to 9 Minutes | 40 (16.1%) | 8 (3.1%) |
| 10 to 14 Minutes | 0 (0.0%) | 0 (0.0%) |
| 15 to 19 Minutes | 53 (21.3%) | 15 (5.8%) |
| 20 to 24 Minutes | 22 (8.8%) | 10 (3.9%) |
| 25 to 29 Minutes | 0 (0.0%) | 5 (1.9%) |
| 30 to 34 Minutes | 96 (38.6%) | 186 (72.4%) |
| 35 to 39 Minutes | 0 (0.0%) | 0 (0.0%) |
| 40 to 44 Minutes | 0 (0.0%) | 0 (0.0%) |
| 45 to 59 Minutes | 4 (1.6%) | 0 (0.0%) |
| 60 to 89 Minutes | 34 (13.7%) | 0 (0.0%) |
| 90 or more Minutes | 0 (0.0%) | 33 (12.8%) |
Time of Departure to Work by Sex in Capitan
The most frequent times of departure to work in Capitan are 7:30 AM to 7:59 AM (83, 33.3%) for males and 12:00 PM to 3:59 PM (93, 36.2%) for females.
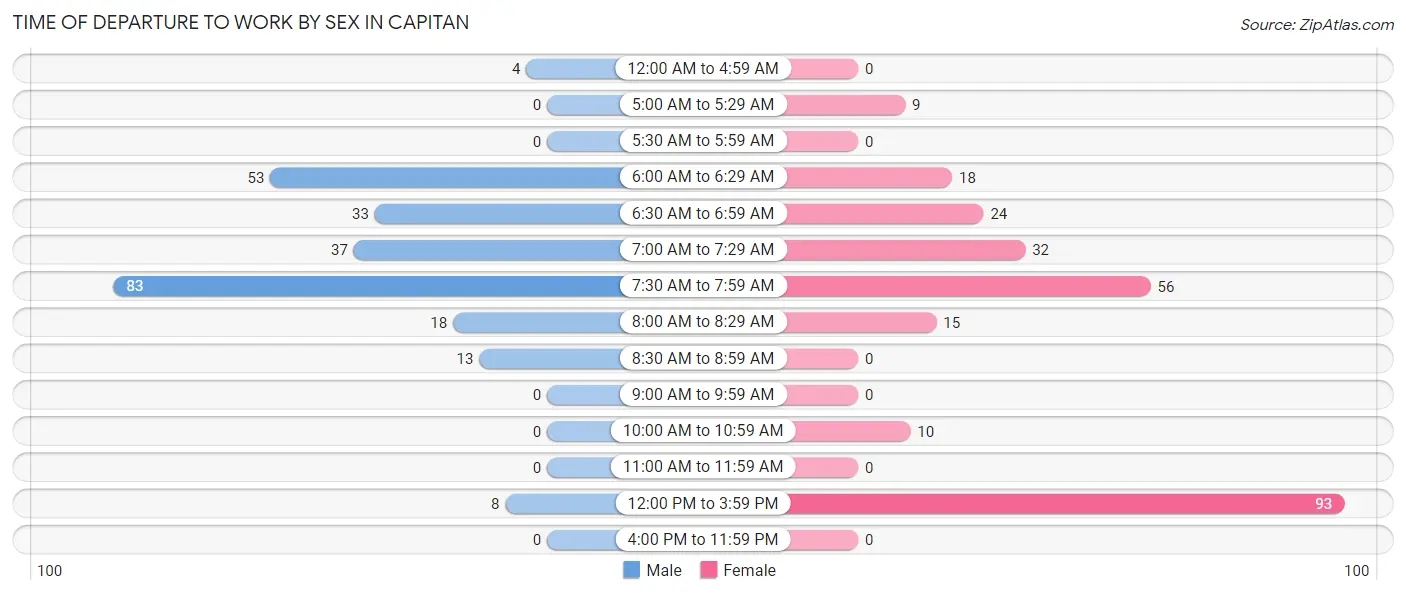
| Time of Departure | Male | Female |
| 12:00 AM to 4:59 AM | 4 (1.6%) | 0 (0.0%) |
| 5:00 AM to 5:29 AM | 0 (0.0%) | 9 (3.5%) |
| 5:30 AM to 5:59 AM | 0 (0.0%) | 0 (0.0%) |
| 6:00 AM to 6:29 AM | 53 (21.3%) | 18 (7.0%) |
| 6:30 AM to 6:59 AM | 33 (13.3%) | 24 (9.3%) |
| 7:00 AM to 7:29 AM | 37 (14.9%) | 32 (12.4%) |
| 7:30 AM to 7:59 AM | 83 (33.3%) | 56 (21.8%) |
| 8:00 AM to 8:29 AM | 18 (7.2%) | 15 (5.8%) |
| 8:30 AM to 8:59 AM | 13 (5.2%) | 0 (0.0%) |
| 9:00 AM to 9:59 AM | 0 (0.0%) | 0 (0.0%) |
| 10:00 AM to 10:59 AM | 0 (0.0%) | 10 (3.9%) |
| 11:00 AM to 11:59 AM | 0 (0.0%) | 0 (0.0%) |
| 12:00 PM to 3:59 PM | 8 (3.2%) | 93 (36.2%) |
| 4:00 PM to 11:59 PM | 0 (0.0%) | 0 (0.0%) |
| Total | 249 (100.0%) | 257 (100.0%) |
Housing Occupancy in Capitan
Occupancy by Ownership in Capitan
Of the total 612 dwellings in Capitan, owner-occupied units account for 544 (88.9%), while renter-occupied units make up 68 (11.1%).
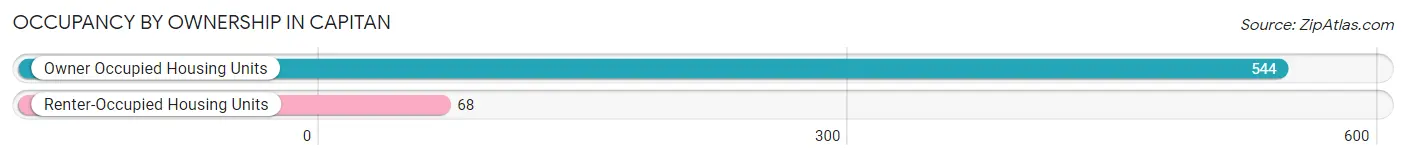
| Occupancy | # Housing Units | % Housing Units |
| Owner Occupied Housing Units | 544 | 88.9% |
| Renter-Occupied Housing Units | 68 | 11.1% |
| Total Occupied Housing Units | 612 | 100.0% |
Occupancy by Household Size in Capitan
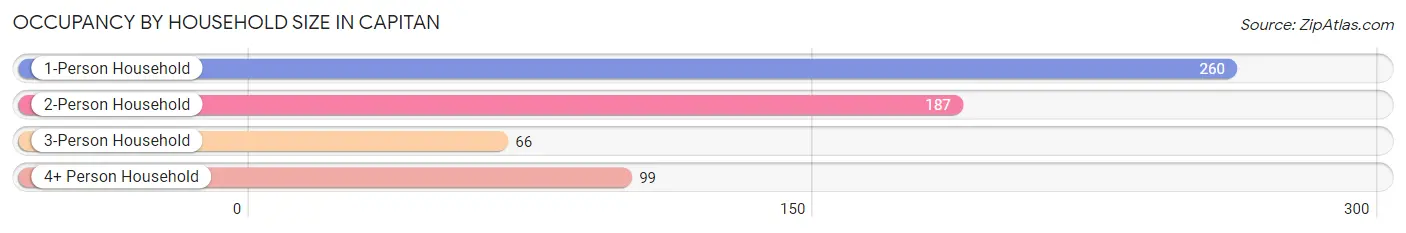
| Household Size | # Housing Units | % Housing Units |
| 1-Person Household | 260 | 42.5% |
| 2-Person Household | 187 | 30.6% |
| 3-Person Household | 66 | 10.8% |
| 4+ Person Household | 99 | 16.2% |
| Total Housing Units | 612 | 100.0% |
Occupancy by Ownership by Household Size in Capitan
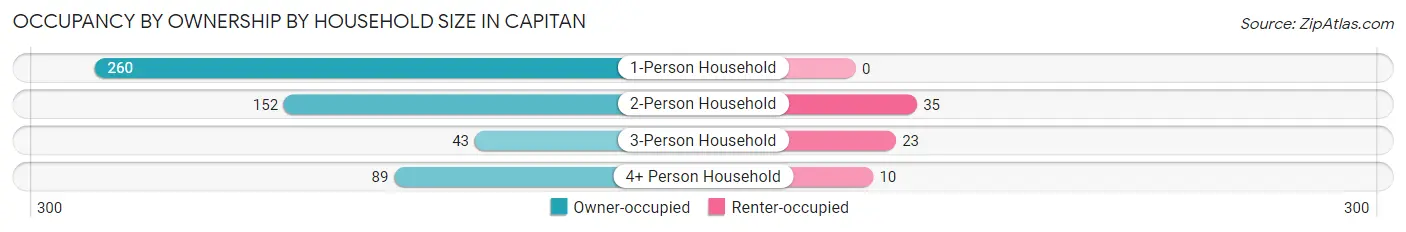
| Household Size | Owner-occupied | Renter-occupied |
| 1-Person Household | 260 (100.0%) | 0 (0.0%) |
| 2-Person Household | 152 (81.3%) | 35 (18.7%) |
| 3-Person Household | 43 (65.1%) | 23 (34.8%) |
| 4+ Person Household | 89 (89.9%) | 10 (10.1%) |
| Total Housing Units | 544 (88.9%) | 68 (11.1%) |
Occupancy by Educational Attainment in Capitan
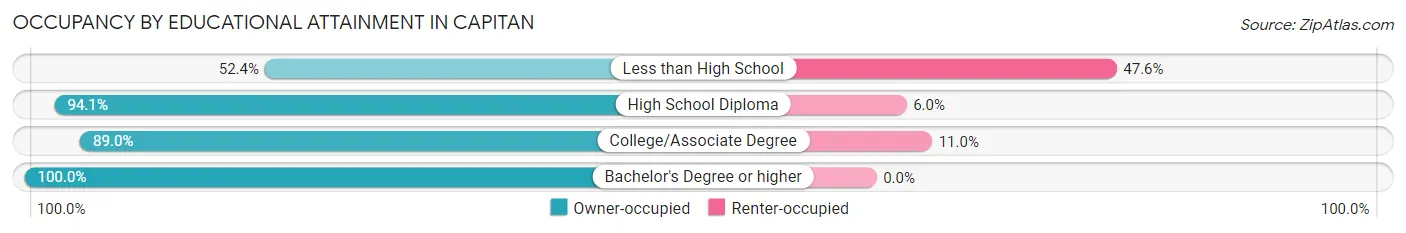
| Household Size | Owner-occupied | Renter-occupied |
| Less than High School | 33 (52.4%) | 30 (47.6%) |
| High School Diploma | 158 (94.1%) | 10 (5.9%) |
| College/Associate Degree | 226 (89.0%) | 28 (11.0%) |
| Bachelor's Degree or higher | 127 (100.0%) | 0 (0.0%) |
Occupancy by Age of Householder in Capitan
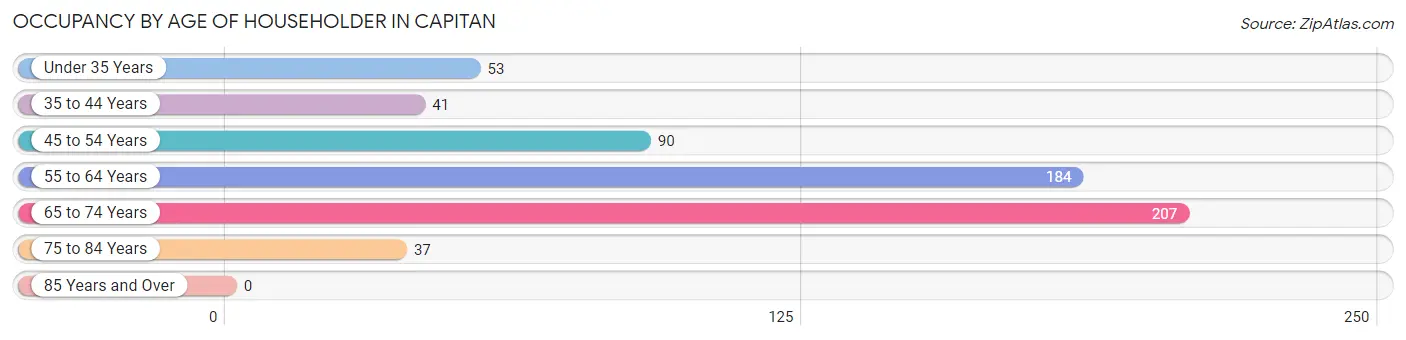
| Age Bracket | # Households | % Households |
| Under 35 Years | 53 | 8.7% |
| 35 to 44 Years | 41 | 6.7% |
| 45 to 54 Years | 90 | 14.7% |
| 55 to 64 Years | 184 | 30.1% |
| 65 to 74 Years | 207 | 33.8% |
| 75 to 84 Years | 37 | 6.0% |
| 85 Years and Over | 0 | 0.0% |
| Total | 612 | 100.0% |
Housing Finances in Capitan
Median Income by Occupancy in Capitan
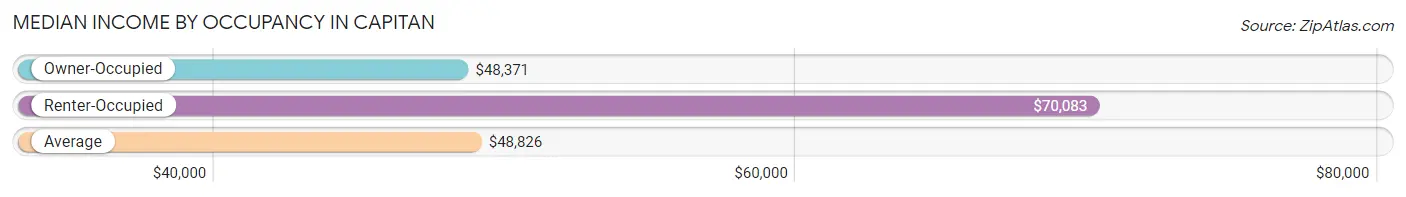
| Occupancy Type | # Households | Median Income |
| Owner-Occupied | 544 (88.9%) | $48,371 |
| Renter-Occupied | 68 (11.1%) | $70,083 |
| Average | 612 (100.0%) | $48,826 |
Occupancy by Householder Income Bracket in Capitan
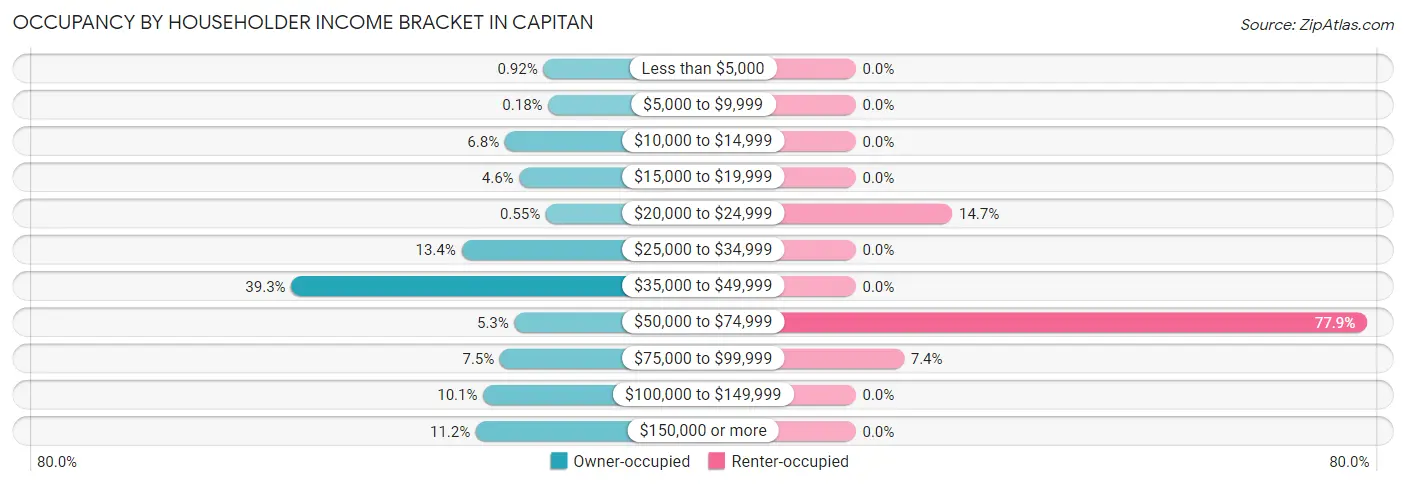
| Income Bracket | Owner-occupied | Renter-occupied |
| Less than $5,000 | 5 (0.9%) | 0 (0.0%) |
| $5,000 to $9,999 | 1 (0.2%) | 0 (0.0%) |
| $10,000 to $14,999 | 37 (6.8%) | 0 (0.0%) |
| $15,000 to $19,999 | 25 (4.6%) | 0 (0.0%) |
| $20,000 to $24,999 | 3 (0.5%) | 10 (14.7%) |
| $25,000 to $34,999 | 73 (13.4%) | 0 (0.0%) |
| $35,000 to $49,999 | 214 (39.3%) | 0 (0.0%) |
| $50,000 to $74,999 | 29 (5.3%) | 53 (77.9%) |
| $75,000 to $99,999 | 41 (7.5%) | 5 (7.3%) |
| $100,000 to $149,999 | 55 (10.1%) | 0 (0.0%) |
| $150,000 or more | 61 (11.2%) | 0 (0.0%) |
| Total | 544 (100.0%) | 68 (100.0%) |
Monthly Housing Cost Tiers in Capitan
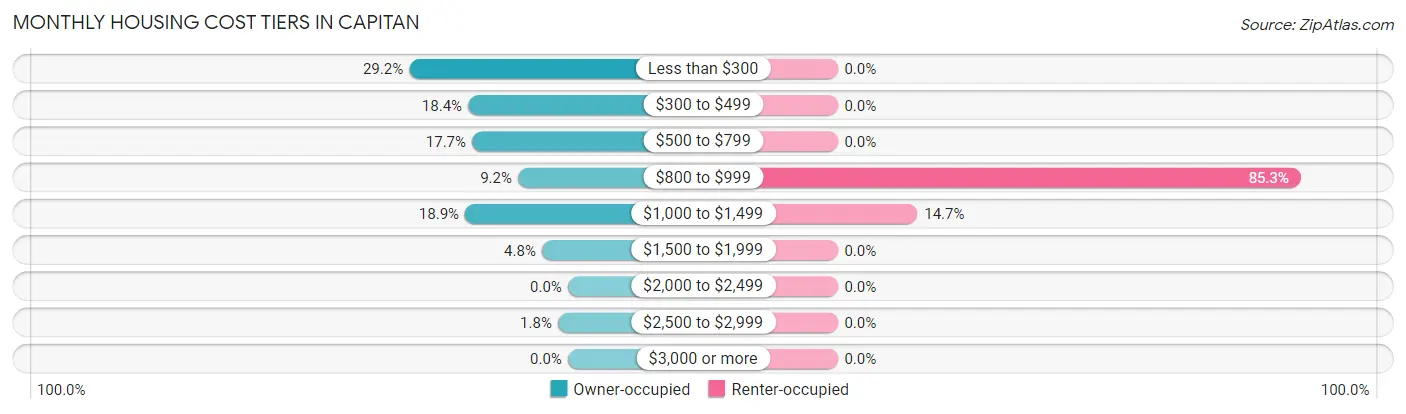
| Monthly Cost | Owner-occupied | Renter-occupied |
| Less than $300 | 159 (29.2%) | 0 (0.0%) |
| $300 to $499 | 100 (18.4%) | 0 (0.0%) |
| $500 to $799 | 96 (17.6%) | 0 (0.0%) |
| $800 to $999 | 50 (9.2%) | 58 (85.3%) |
| $1,000 to $1,499 | 103 (18.9%) | 10 (14.7%) |
| $1,500 to $1,999 | 26 (4.8%) | 0 (0.0%) |
| $2,000 to $2,499 | 0 (0.0%) | 0 (0.0%) |
| $2,500 to $2,999 | 10 (1.8%) | 0 (0.0%) |
| $3,000 or more | 0 (0.0%) | 0 (0.0%) |
| Total | 544 (100.0%) | 68 (100.0%) |
Physical Housing Characteristics in Capitan
Housing Structures in Capitan
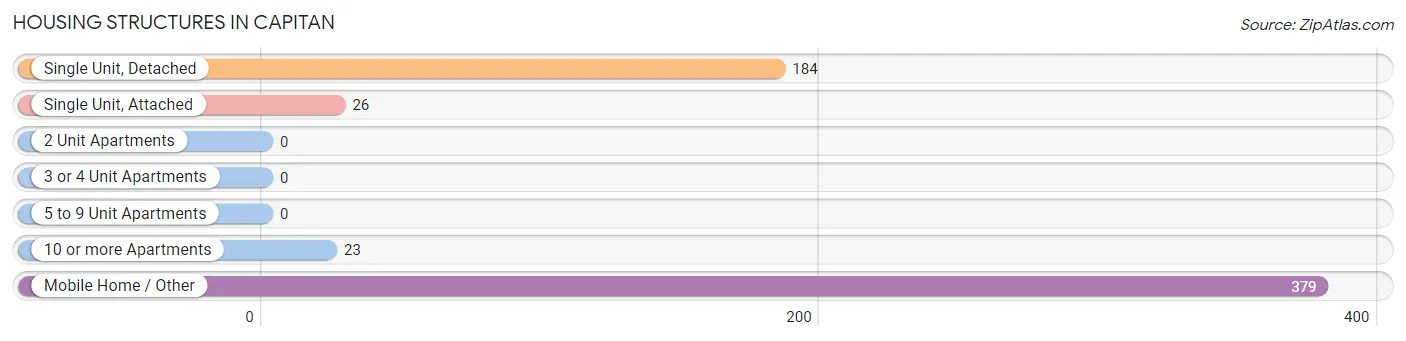
| Structure Type | # Housing Units | % Housing Units |
| Single Unit, Detached | 184 | 30.1% |
| Single Unit, Attached | 26 | 4.3% |
| 2 Unit Apartments | 0 | 0.0% |
| 3 or 4 Unit Apartments | 0 | 0.0% |
| 5 to 9 Unit Apartments | 0 | 0.0% |
| 10 or more Apartments | 23 | 3.8% |
| Mobile Home / Other | 379 | 61.9% |
| Total | 612 | 100.0% |
Housing Structures by Occupancy in Capitan
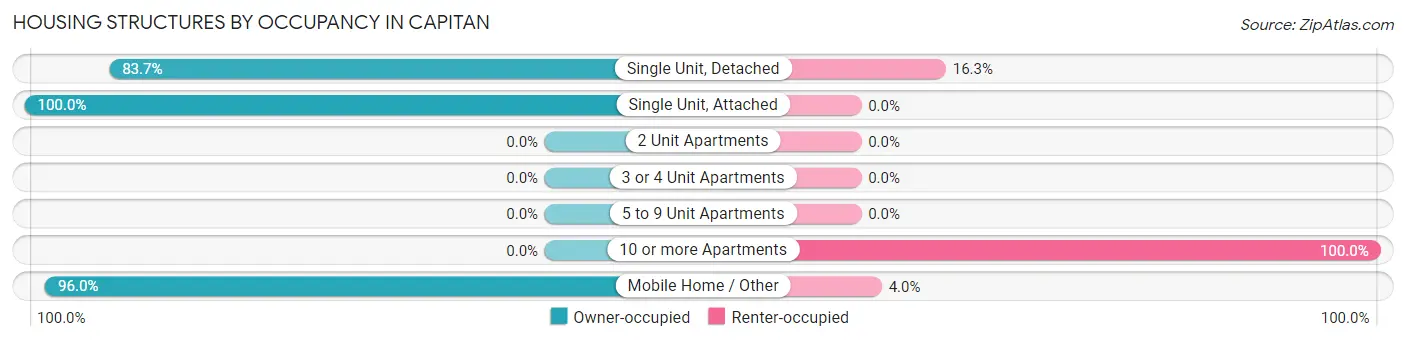
| Structure Type | Owner-occupied | Renter-occupied |
| Single Unit, Detached | 154 (83.7%) | 30 (16.3%) |
| Single Unit, Attached | 26 (100.0%) | 0 (0.0%) |
| 2 Unit Apartments | 0 (0.0%) | 0 (0.0%) |
| 3 or 4 Unit Apartments | 0 (0.0%) | 0 (0.0%) |
| 5 to 9 Unit Apartments | 0 (0.0%) | 0 (0.0%) |
| 10 or more Apartments | 0 (0.0%) | 23 (100.0%) |
| Mobile Home / Other | 364 (96.0%) | 15 (4.0%) |
| Total | 544 (88.9%) | 68 (11.1%) |
Housing Structures by Number of Rooms in Capitan
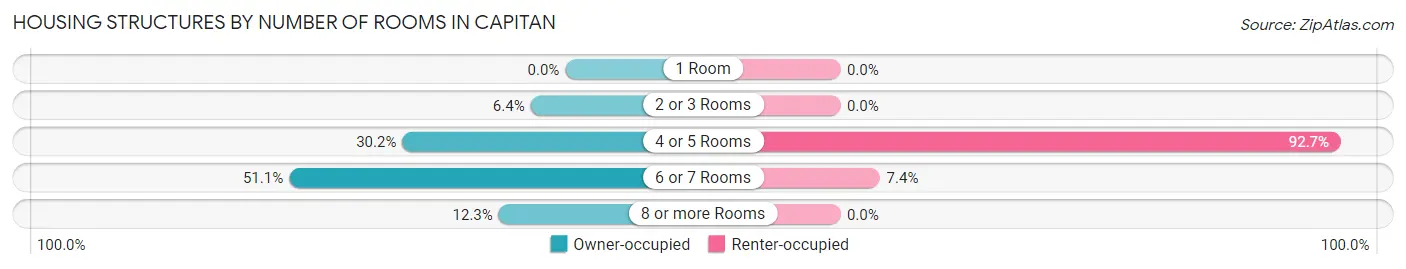
| Number of Rooms | Owner-occupied | Renter-occupied |
| 1 Room | 0 (0.0%) | 0 (0.0%) |
| 2 or 3 Rooms | 35 (6.4%) | 0 (0.0%) |
| 4 or 5 Rooms | 164 (30.1%) | 63 (92.6%) |
| 6 or 7 Rooms | 278 (51.1%) | 5 (7.3%) |
| 8 or more Rooms | 67 (12.3%) | 0 (0.0%) |
| Total | 544 (100.0%) | 68 (100.0%) |
Housing Structure by Heating Type in Capitan
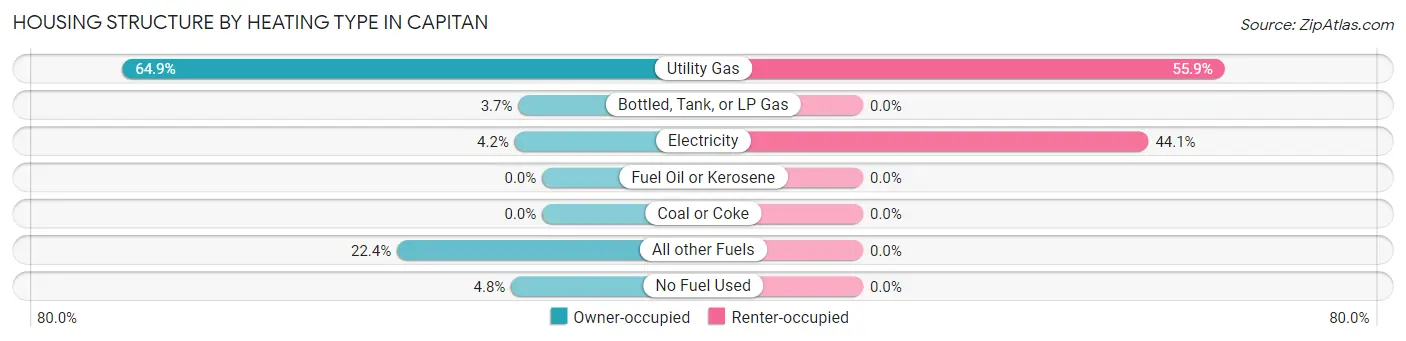
| Heating Type | Owner-occupied | Renter-occupied |
| Utility Gas | 353 (64.9%) | 38 (55.9%) |
| Bottled, Tank, or LP Gas | 20 (3.7%) | 0 (0.0%) |
| Electricity | 23 (4.2%) | 30 (44.1%) |
| Fuel Oil or Kerosene | 0 (0.0%) | 0 (0.0%) |
| Coal or Coke | 0 (0.0%) | 0 (0.0%) |
| All other Fuels | 122 (22.4%) | 0 (0.0%) |
| No Fuel Used | 26 (4.8%) | 0 (0.0%) |
| Total | 544 (100.0%) | 68 (100.0%) |
Household Vehicle Usage in Capitan
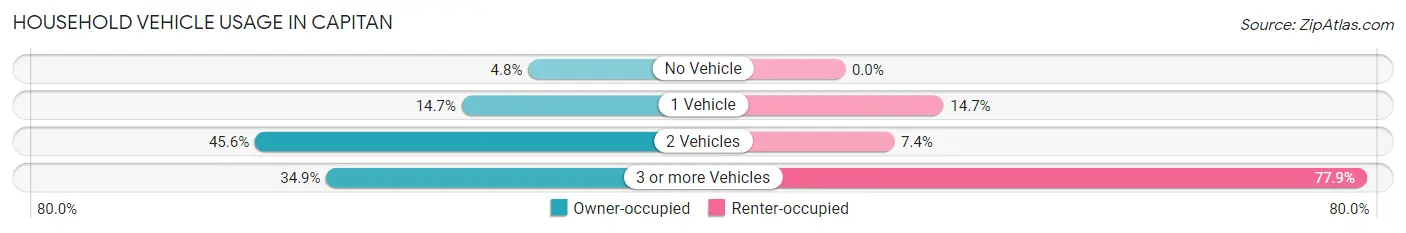
| Vehicles per Household | Owner-occupied | Renter-occupied |
| No Vehicle | 26 (4.8%) | 0 (0.0%) |
| 1 Vehicle | 80 (14.7%) | 10 (14.7%) |
| 2 Vehicles | 248 (45.6%) | 5 (7.3%) |
| 3 or more Vehicles | 190 (34.9%) | 53 (77.9%) |
| Total | 544 (100.0%) | 68 (100.0%) |
Real Estate & Mortgages in Capitan
Real Estate and Mortgage Overview in Capitan
| Characteristic | Without Mortgage | With Mortgage |
| Housing Units | 344 | 200 |
| Median Property Value | $91,800 | $170,500 |
| Median Household Income | $42,500 | $22 |
| Monthly Housing Costs | $361 | $0 |
| Real Estate Taxes | $502 | $43 |
Property Value by Mortgage Status in Capitan
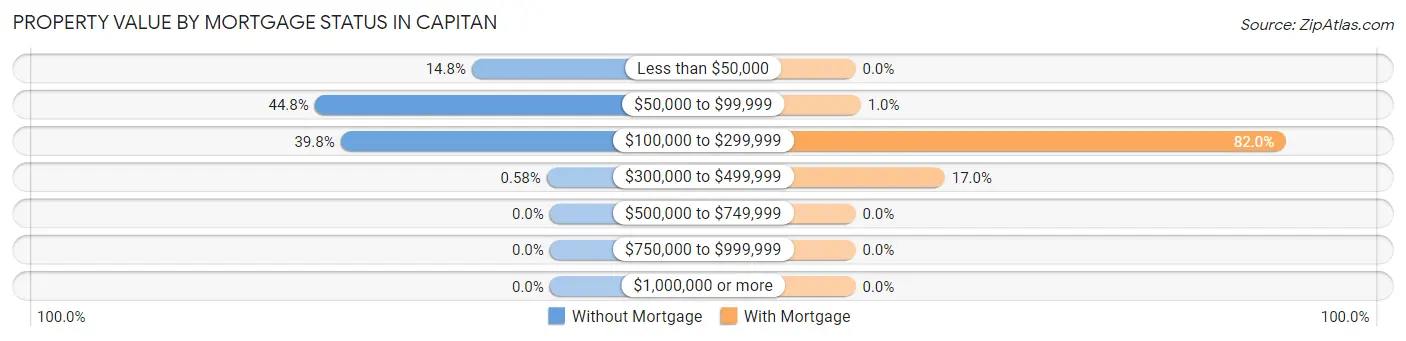
| Property Value | Without Mortgage | With Mortgage |
| Less than $50,000 | 51 (14.8%) | 0 (0.0%) |
| $50,000 to $99,999 | 154 (44.8%) | 2 (1.0%) |
| $100,000 to $299,999 | 137 (39.8%) | 164 (82.0%) |
| $300,000 to $499,999 | 2 (0.6%) | 34 (17.0%) |
| $500,000 to $749,999 | 0 (0.0%) | 0 (0.0%) |
| $750,000 to $999,999 | 0 (0.0%) | 0 (0.0%) |
| $1,000,000 or more | 0 (0.0%) | 0 (0.0%) |
| Total | 344 (100.0%) | 200 (100.0%) |
Household Income by Mortgage Status in Capitan
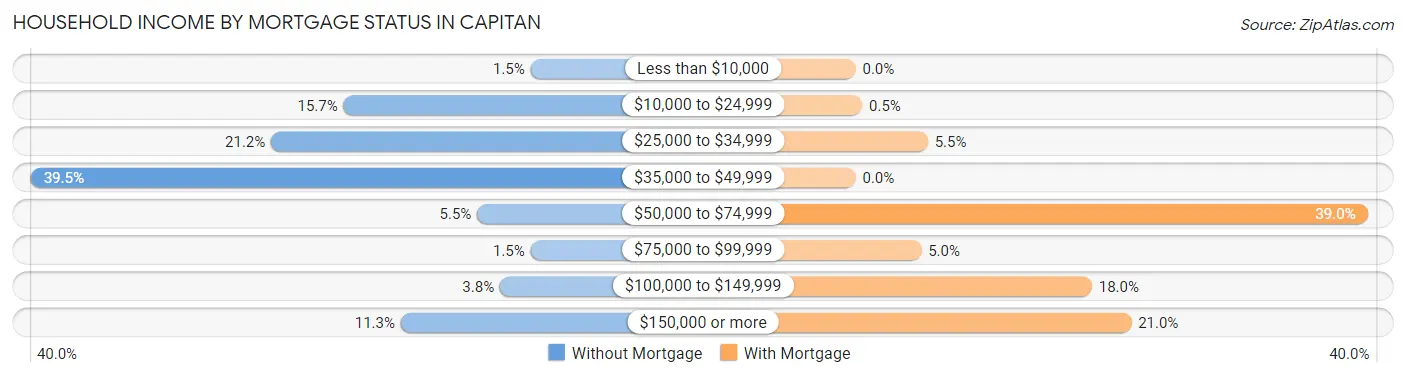
| Household Income | Without Mortgage | With Mortgage |
| Less than $10,000 | 5 (1.5%) | 0 (0.0%) |
| $10,000 to $24,999 | 54 (15.7%) | 1 (0.5%) |
| $25,000 to $34,999 | 73 (21.2%) | 11 (5.5%) |
| $35,000 to $49,999 | 136 (39.5%) | 0 (0.0%) |
| $50,000 to $74,999 | 19 (5.5%) | 78 (39.0%) |
| $75,000 to $99,999 | 5 (1.5%) | 10 (5.0%) |
| $100,000 to $149,999 | 13 (3.8%) | 36 (18.0%) |
| $150,000 or more | 39 (11.3%) | 42 (21.0%) |
| Total | 344 (100.0%) | 200 (100.0%) |
Property Value to Household Income Ratio in Capitan
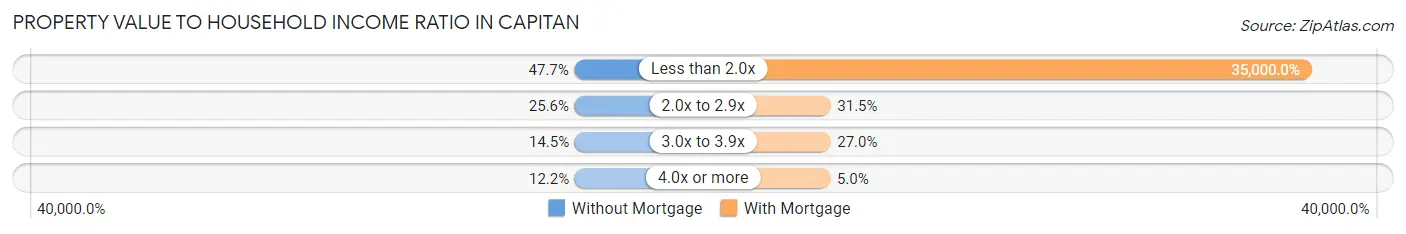
| Value-to-Income Ratio | Without Mortgage | With Mortgage |
| Less than 2.0x | 164 (47.7%) | 70,000 (35,000.0%) |
| 2.0x to 2.9x | 88 (25.6%) | 63 (31.5%) |
| 3.0x to 3.9x | 50 (14.5%) | 54 (27.0%) |
| 4.0x or more | 42 (12.2%) | 10 (5.0%) |
| Total | 344 (100.0%) | 200 (100.0%) |
Real Estate Taxes by Mortgage Status in Capitan
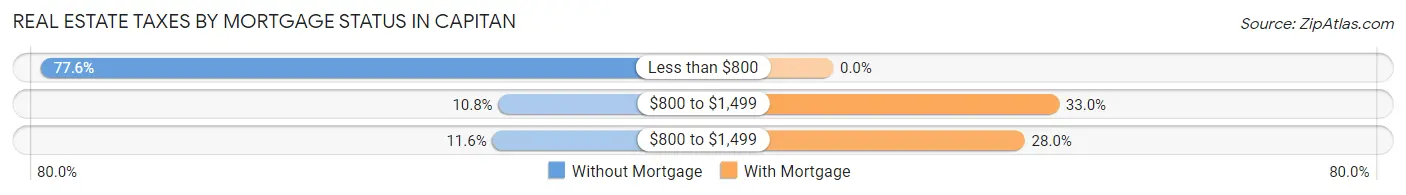
| Property Taxes | Without Mortgage | With Mortgage |
| Less than $800 | 267 (77.6%) | 0 (0.0%) |
| $800 to $1,499 | 37 (10.8%) | 66 (33.0%) |
| $800 to $1,499 | 40 (11.6%) | 56 (28.0%) |
| Total | 344 (100.0%) | 200 (100.0%) |
Health & Disability in Capitan
Health Insurance Coverage by Age in Capitan
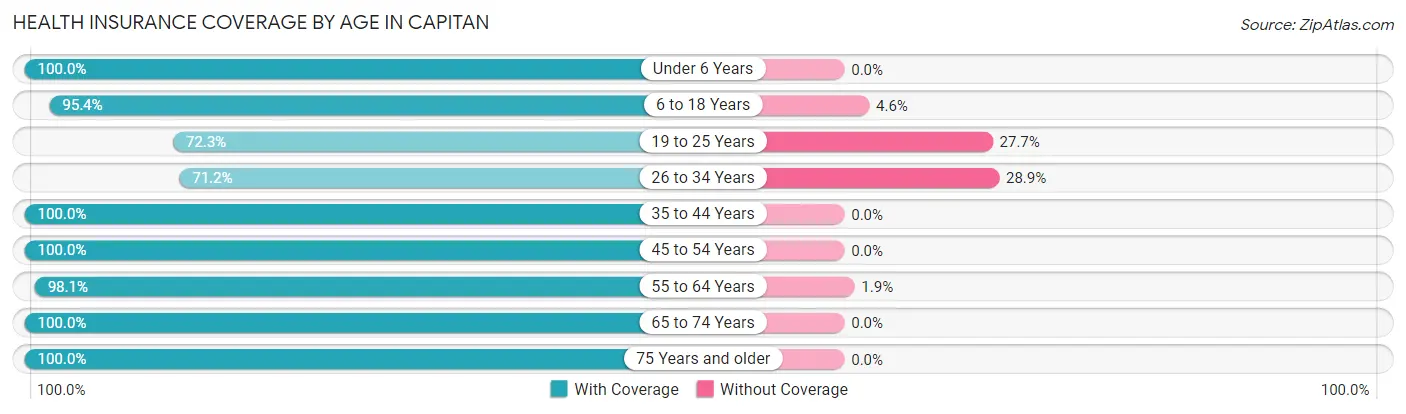
| Age Bracket | With Coverage | Without Coverage |
| Under 6 Years | 33 (100.0%) | 0 (0.0%) |
| 6 to 18 Years | 289 (95.4%) | 14 (4.6%) |
| 19 to 25 Years | 34 (72.3%) | 13 (27.7%) |
| 26 to 34 Years | 74 (71.2%) | 30 (28.8%) |
| 35 to 44 Years | 164 (100.0%) | 0 (0.0%) |
| 45 to 54 Years | 121 (100.0%) | 0 (0.0%) |
| 55 to 64 Years | 260 (98.1%) | 5 (1.9%) |
| 65 to 74 Years | 253 (100.0%) | 0 (0.0%) |
| 75 Years and older | 91 (100.0%) | 0 (0.0%) |
| Total | 1,319 (95.5%) | 62 (4.5%) |
Health Insurance Coverage by Citizenship Status in Capitan
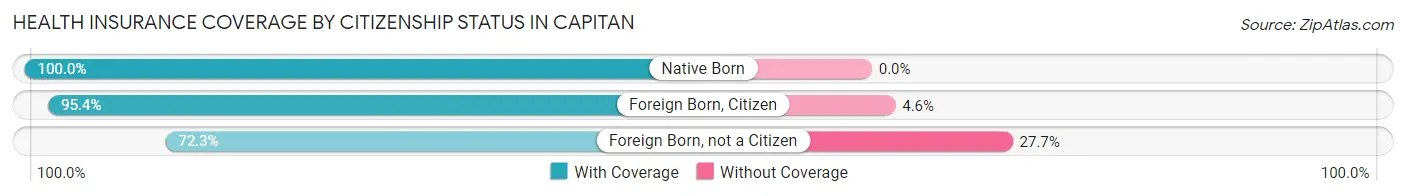
| Citizenship Status | With Coverage | Without Coverage |
| Native Born | 33 (100.0%) | 0 (0.0%) |
| Foreign Born, Citizen | 289 (95.4%) | 14 (4.6%) |
| Foreign Born, not a Citizen | 34 (72.3%) | 13 (27.7%) |
Health Insurance Coverage by Household Income in Capitan
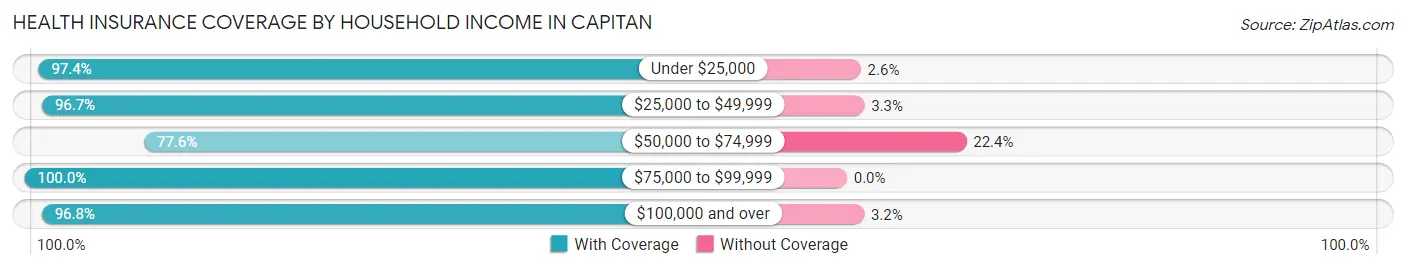
| Household Income | With Coverage | Without Coverage |
| Under $25,000 | 187 (97.4%) | 5 (2.6%) |
| $25,000 to $49,999 | 416 (96.7%) | 14 (3.3%) |
| $50,000 to $74,999 | 104 (77.6%) | 30 (22.4%) |
| $75,000 to $99,999 | 217 (100.0%) | 0 (0.0%) |
| $100,000 and over | 392 (96.8%) | 13 (3.2%) |
Public vs Private Health Insurance Coverage by Age in Capitan
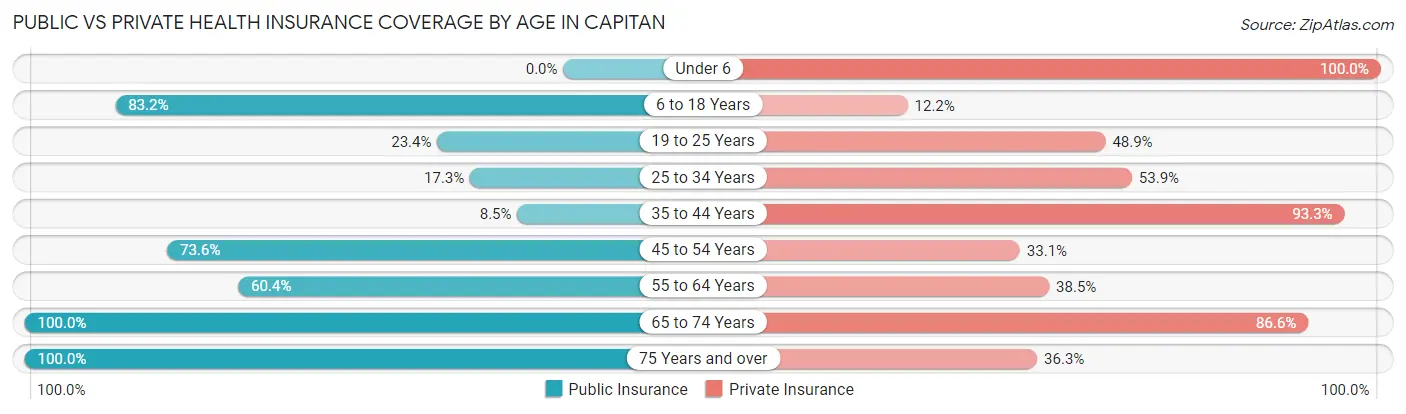
| Age Bracket | Public Insurance | Private Insurance |
| Under 6 | 0 (0.0%) | 33 (100.0%) |
| 6 to 18 Years | 252 (83.2%) | 37 (12.2%) |
| 19 to 25 Years | 11 (23.4%) | 23 (48.9%) |
| 25 to 34 Years | 18 (17.3%) | 56 (53.8%) |
| 35 to 44 Years | 14 (8.5%) | 153 (93.3%) |
| 45 to 54 Years | 89 (73.6%) | 40 (33.1%) |
| 55 to 64 Years | 160 (60.4%) | 102 (38.5%) |
| 65 to 74 Years | 253 (100.0%) | 219 (86.6%) |
| 75 Years and over | 91 (100.0%) | 33 (36.3%) |
| Total | 888 (64.3%) | 696 (50.4%) |
Disability Status by Sex by Age in Capitan
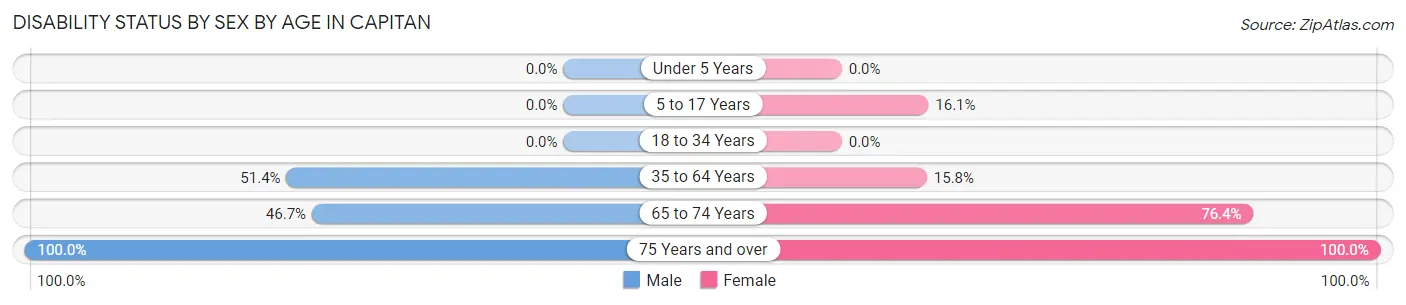
| Age Bracket | Male | Female |
| Under 5 Years | 0 (0.0%) | 0 (0.0%) |
| 5 to 17 Years | 0 (0.0%) | 9 (16.1%) |
| 18 to 34 Years | 0 (0.0%) | 0 (0.0%) |
| 35 to 64 Years | 146 (51.4%) | 42 (15.8%) |
| 65 to 74 Years | 35 (46.7%) | 136 (76.4%) |
| 75 Years and over | 32 (100.0%) | 59 (100.0%) |
Disability Class by Sex by Age in Capitan
Disability Class: Hearing Difficulty
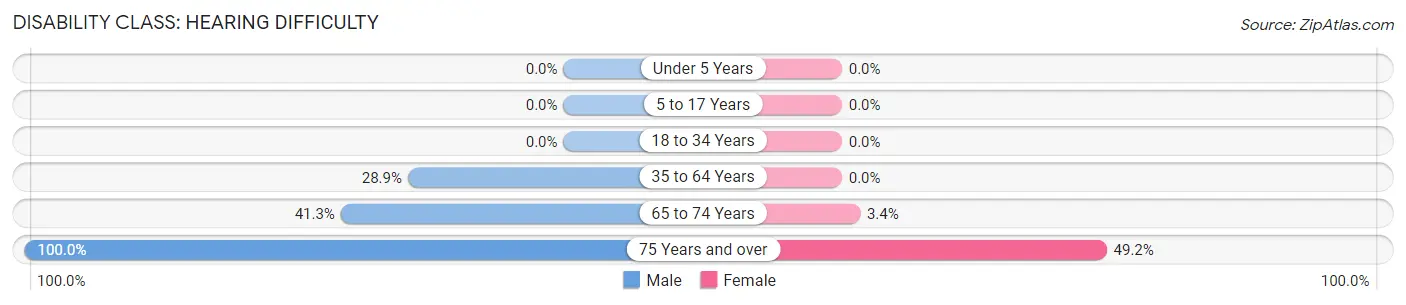
| Age Bracket | Male | Female |
| Under 5 Years | 0 (0.0%) | 0 (0.0%) |
| 5 to 17 Years | 0 (0.0%) | 0 (0.0%) |
| 18 to 34 Years | 0 (0.0%) | 0 (0.0%) |
| 35 to 64 Years | 82 (28.9%) | 0 (0.0%) |
| 65 to 74 Years | 31 (41.3%) | 6 (3.4%) |
| 75 Years and over | 32 (100.0%) | 29 (49.1%) |
Disability Class: Vision Difficulty
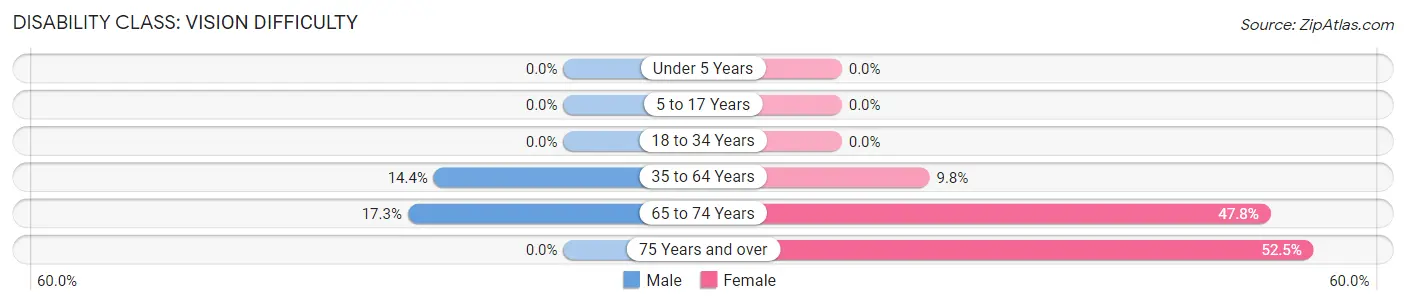
| Age Bracket | Male | Female |
| Under 5 Years | 0 (0.0%) | 0 (0.0%) |
| 5 to 17 Years | 0 (0.0%) | 0 (0.0%) |
| 18 to 34 Years | 0 (0.0%) | 0 (0.0%) |
| 35 to 64 Years | 41 (14.4%) | 26 (9.8%) |
| 65 to 74 Years | 13 (17.3%) | 85 (47.7%) |
| 75 Years and over | 0 (0.0%) | 31 (52.5%) |
Disability Class: Cognitive Difficulty
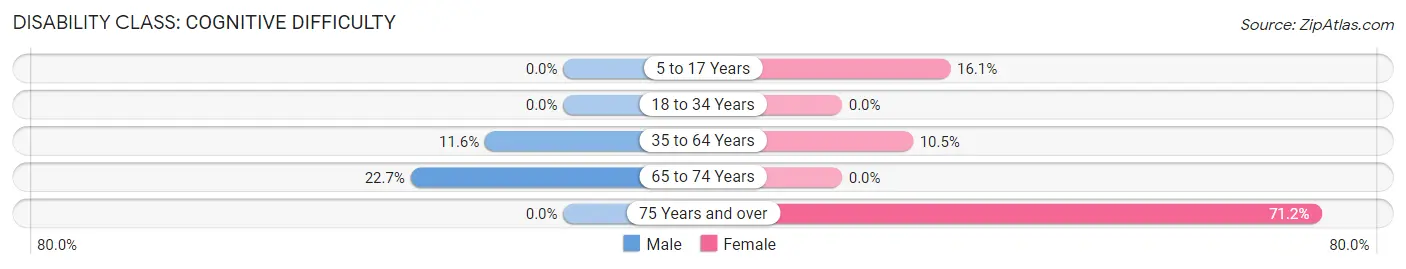
| Age Bracket | Male | Female |
| 5 to 17 Years | 0 (0.0%) | 9 (16.1%) |
| 18 to 34 Years | 0 (0.0%) | 0 (0.0%) |
| 35 to 64 Years | 33 (11.6%) | 28 (10.5%) |
| 65 to 74 Years | 17 (22.7%) | 0 (0.0%) |
| 75 Years and over | 0 (0.0%) | 42 (71.2%) |
Disability Class: Ambulatory Difficulty
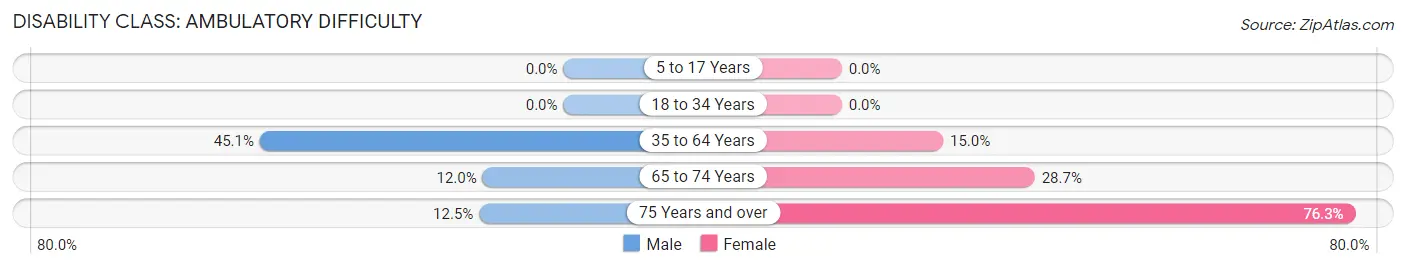
| Age Bracket | Male | Female |
| 5 to 17 Years | 0 (0.0%) | 0 (0.0%) |
| 18 to 34 Years | 0 (0.0%) | 0 (0.0%) |
| 35 to 64 Years | 128 (45.1%) | 40 (15.0%) |
| 65 to 74 Years | 9 (12.0%) | 51 (28.6%) |
| 75 Years and over | 4 (12.5%) | 45 (76.3%) |
Disability Class: Self-Care Difficulty
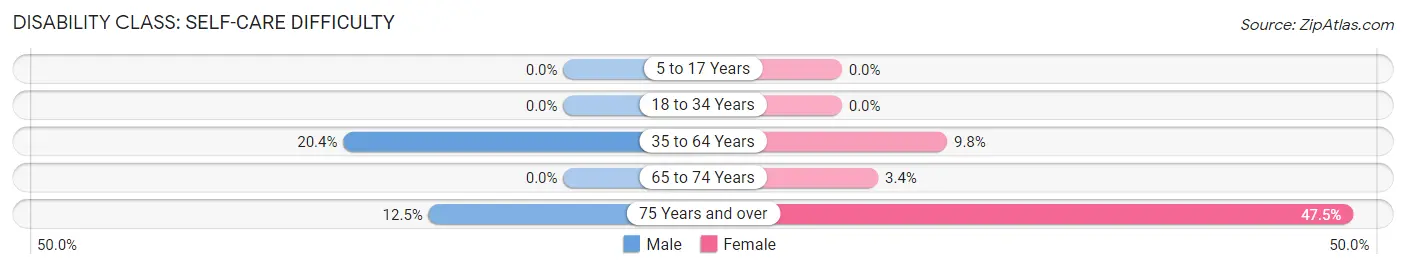
| Age Bracket | Male | Female |
| 5 to 17 Years | 0 (0.0%) | 0 (0.0%) |
| 18 to 34 Years | 0 (0.0%) | 0 (0.0%) |
| 35 to 64 Years | 58 (20.4%) | 26 (9.8%) |
| 65 to 74 Years | 0 (0.0%) | 6 (3.4%) |
| 75 Years and over | 4 (12.5%) | 28 (47.5%) |
Technology Access in Capitan
Computing Device Access in Capitan
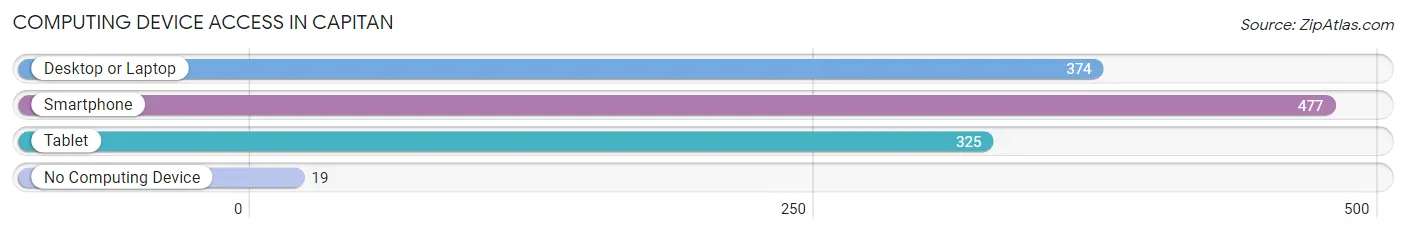
| Device Type | # Households | % Households |
| Desktop or Laptop | 374 | 61.1% |
| Smartphone | 477 | 77.9% |
| Tablet | 325 | 53.1% |
| No Computing Device | 19 | 3.1% |
| Total | 612 | 100.0% |
Internet Access in Capitan
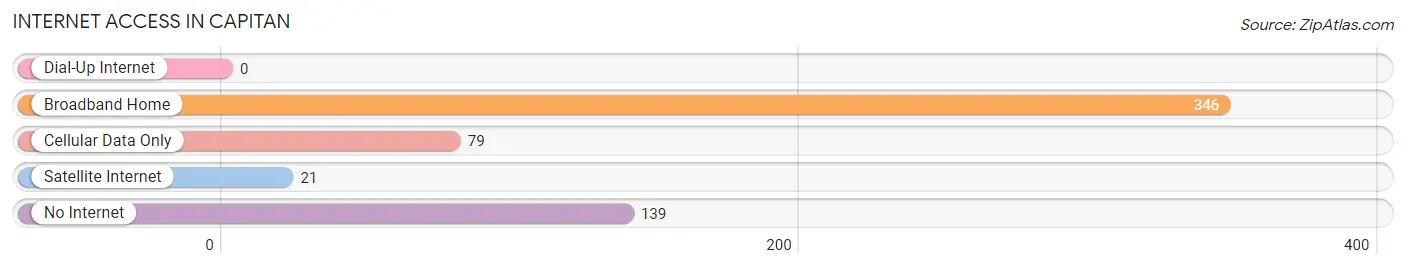
| Internet Type | # Households | % Households |
| Dial-Up Internet | 0 | 0.0% |
| Broadband Home | 346 | 56.5% |
| Cellular Data Only | 79 | 12.9% |
| Satellite Internet | 21 | 3.4% |
| No Internet | 139 | 22.7% |
| Total | 612 | 100.0% |
Capitan Summary
Capitan, New Mexico is a small town located in Lincoln County, in the south-central part of the state. It is situated in the foothills of the Sacramento Mountains, at an elevation of 6,400 feet. The town was founded in 1884, when the Atchison, Topeka and Santa Fe Railway built a line through the area. The town was named after the nearby Capitan Mountains, which were named after the Spanish word for “captain.”
Geography
Capitan is located in the foothills of the Sacramento Mountains, at an elevation of 6,400 feet. The town is situated in a valley surrounded by the Capitan Mountains to the east, the Sierra Blanca Mountains to the west, and the Capitan Gap to the south. The town is located approximately 25 miles east of Roswell, New Mexico, and approximately 50 miles south of Carlsbad, New Mexico.
The climate in Capitan is semi-arid, with hot summers and cold winters. The average annual temperature is approximately 57 degrees Fahrenheit, with an average high of 79 degrees Fahrenheit in the summer and an average low of 35 degrees Fahrenheit in the winter. The average annual precipitation is approximately 12 inches, with most of the precipitation occurring in the summer months.
Economy
The economy of Capitan is largely based on agriculture and tourism. The town is home to several small farms, which produce a variety of crops, including alfalfa, corn, wheat, and hay. The town is also home to several small businesses, including restaurants, shops, and a few small manufacturing companies.
Tourism is an important part of the economy of Capitan. The town is home to several attractions, including the Capitan Gap, which is a popular spot for hiking and camping. The town is also home to the Capitan Museum, which houses a variety of artifacts from the area’s history.
Demographics
As of the 2010 census, the population of Capitan was 1,092. The racial makeup of the town was 94.3% White, 0.7% African American, 0.7% Native American, 0.3% Asian, 0.1% Pacific Islander, 2.2% from other races, and 1.9% from two or more races. Hispanic or Latino of any race were 8.2% of the population.
The median household income in Capitan was $31,250, and the median family income was $37,500. The per capita income for the town was $15,945. About 16.2% of the population was below the poverty line.
Conclusion
Capitan, New Mexico is a small town located in Lincoln County, in the south-central part of the state. It is situated in the foothills of the Sacramento Mountains, at an elevation of 6,400 feet. The town was founded in 1884, when the Atchison, Topeka and Santa Fe Railway built a line through the area. The economy of Capitan is largely based on agriculture and tourism, and the town is home to several attractions, including the Capitan Gap and the Capitan Museum. As of the 2010 census, the population of Capitan was 1,092, with a median household income of $31,250 and a median family income of $37,500.
Common Questions
What is Per Capita Income in Capitan?
Per Capita income in Capitan is $30,118.
What is the Median Family Income in Capitan?
Median Family Income in Capitan is $68,750.
What is the Median Household income in Capitan?
Median Household Income in Capitan is $48,826.
What is Income or Wage Gap in Capitan?
Income or Wage Gap in Capitan is 33.2%.
Women in Capitan earn 66.8 cents for every dollar earned by a man.
What is Inequality or Gini Index in Capitan?
Inequality or Gini Index in Capitan is 0.38.
What is the Total Population of Capitan?
Total Population of Capitan is 1,381.
What is the Total Male Population of Capitan?
Total Male Population of Capitan is 729.
What is the Total Female Population of Capitan?
Total Female Population of Capitan is 652.
What is the Ratio of Males per 100 Females in Capitan?
There are 111.81 Males per 100 Females in Capitan.
What is the Ratio of Females per 100 Males in Capitan?
There are 89.44 Females per 100 Males in Capitan.
What is the Median Population Age in Capitan?
Median Population Age in Capitan is 49.4 Years.
What is the Average Family Size in Capitan
Average Family Size in Capitan is 2.9 People.
What is the Average Household Size in Capitan
Average Household Size in Capitan is 2.2 People.
How Large is the Labor Force in Capitan?
There are 555 People in the Labor Forcein in Capitan.
What is the Percentage of People in the Labor Force in Capitan?
50.8% of People are in the Labor Force in Capitan.
What is the Unemployment Rate in Capitan?
Unemployment Rate in Capitan is 2.9%.