Irvington, VA Map & Demographics
Irvington Map
Irvington Overview
$90,555
PER CAPITA INCOME
$157,500
AVG FAMILY INCOME
$118,750
AVG HOUSEHOLD INCOME
0.54
INEQUALITY / GINI INDEX
519
TOTAL POPULATION
273
MALE POPULATION
246
FEMALE POPULATION
110.98
MALES / 100 FEMALES
90.11
FEMALES / 100 MALES
58.6
MEDIAN AGE
2.3
AVG FAMILY SIZE
2.0
AVG HOUSEHOLD SIZE
264
LABOR FORCE [ PEOPLE ]
56.8%
PERCENT IN LABOR FORCE
1.5%
UNEMPLOYMENT RATE
Irvington Zip Codes
Irvington Area Codes
Income in Irvington
Income Overview in Irvington
Per Capita Income in Irvington is $90,555, while median incomes of families and households are $157,500 and $118,750 respectively.
| Characteristic | Number | Measure |
| Per Capita Income | 519 | $90,555 |
| Median Family Income | 178 | $157,500 |
| Mean Family Income | 178 | $242,174 |
| Median Household Income | 260 | $118,750 |
| Mean Household Income | 260 | $184,398 |
| Income Deficit | 178 | $0 |
| Wage / Income Gap (%) | 519 | 0.00% |
| Wage / Income Gap ($) | 519 | 100.00¢ per $1 |
| Gini / Inequality Index | 519 | 0.54 |
Earnings by Sex in Irvington
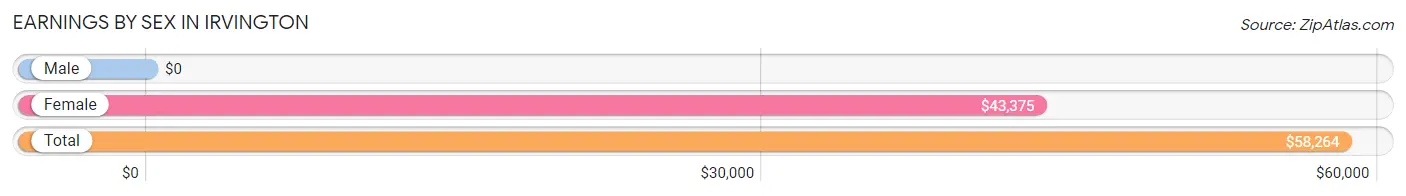
| Sex | Number | Average Earnings |
| Male | 150 (51.5%) | $0 |
| Female | 141 (48.4%) | $43,375 |
| Total | 291 (100.0%) | $58,264 |
Earnings by Sex by Income Bracket in Irvington
The most common earnings brackets in Irvington are $100,000+ for men (70 | 46.7%) and $100,000+ for women (27 | 19.2%).
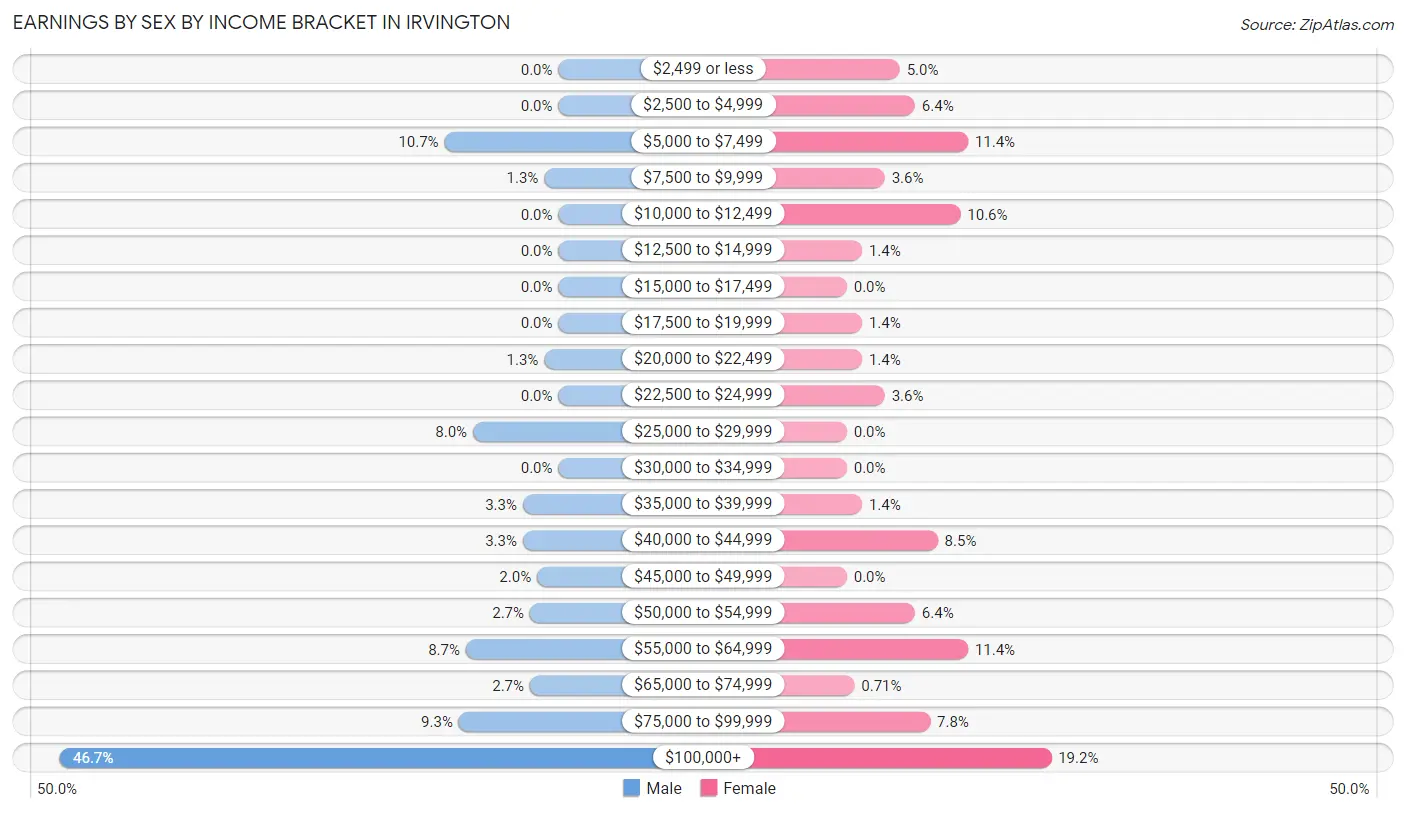
| Income | Male | Female |
| $2,499 or less | 0 (0.0%) | 7 (5.0%) |
| $2,500 to $4,999 | 0 (0.0%) | 9 (6.4%) |
| $5,000 to $7,499 | 16 (10.7%) | 16 (11.4%) |
| $7,500 to $9,999 | 2 (1.3%) | 5 (3.5%) |
| $10,000 to $12,499 | 0 (0.0%) | 15 (10.6%) |
| $12,500 to $14,999 | 0 (0.0%) | 2 (1.4%) |
| $15,000 to $17,499 | 0 (0.0%) | 0 (0.0%) |
| $17,500 to $19,999 | 0 (0.0%) | 2 (1.4%) |
| $20,000 to $22,499 | 2 (1.3%) | 2 (1.4%) |
| $22,500 to $24,999 | 0 (0.0%) | 5 (3.5%) |
| $25,000 to $29,999 | 12 (8.0%) | 0 (0.0%) |
| $30,000 to $34,999 | 0 (0.0%) | 0 (0.0%) |
| $35,000 to $39,999 | 5 (3.3%) | 2 (1.4%) |
| $40,000 to $44,999 | 5 (3.3%) | 12 (8.5%) |
| $45,000 to $49,999 | 3 (2.0%) | 0 (0.0%) |
| $50,000 to $54,999 | 4 (2.7%) | 9 (6.4%) |
| $55,000 to $64,999 | 13 (8.7%) | 16 (11.4%) |
| $65,000 to $74,999 | 4 (2.7%) | 1 (0.7%) |
| $75,000 to $99,999 | 14 (9.3%) | 11 (7.8%) |
| $100,000+ | 70 (46.7%) | 27 (19.2%) |
| Total | 150 (100.0%) | 141 (100.0%) |
Earnings by Sex by Educational Attainment in Irvington
Average earnings in Irvington are $124,688 for men and $44,500 for women, a difference of 64.3%. Men with an educational attainment of bachelor's degree enjoy the highest average annual earnings of $131,875, while those with high school diploma education earn the least with $59,167. Women with an educational attainment of bachelor's degree earn the most with the average annual earnings of $59,063, while those with bachelor's degree education have the smallest earnings of $59,063.
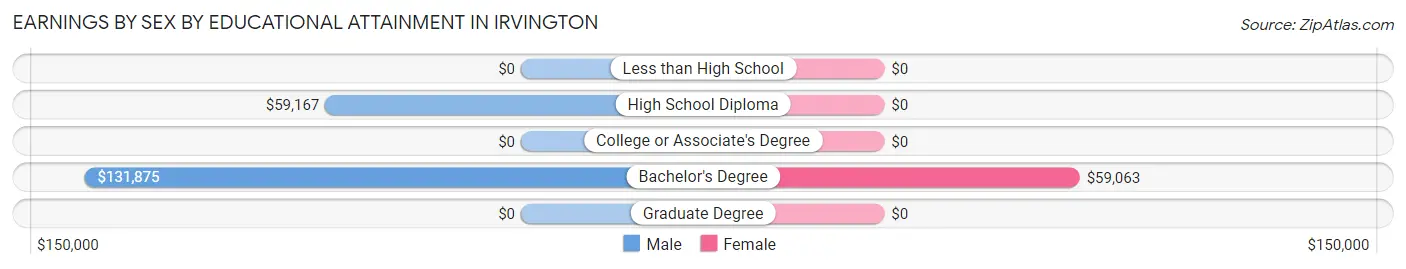
| Educational Attainment | Male Income | Female Income |
| Less than High School | - | - |
| High School Diploma | $59,167 | $0 |
| College or Associate's Degree | - | - |
| Bachelor's Degree | $131,875 | $59,063 |
| Graduate Degree | - | - |
| Total | $124,688 | $44,500 |
Family Income in Irvington
Family Income Brackets in Irvington
According to the Irvington family income data, there are 66 families falling into the $200,000+ income range, which is the most common income bracket and makes up 37.1% of all families.
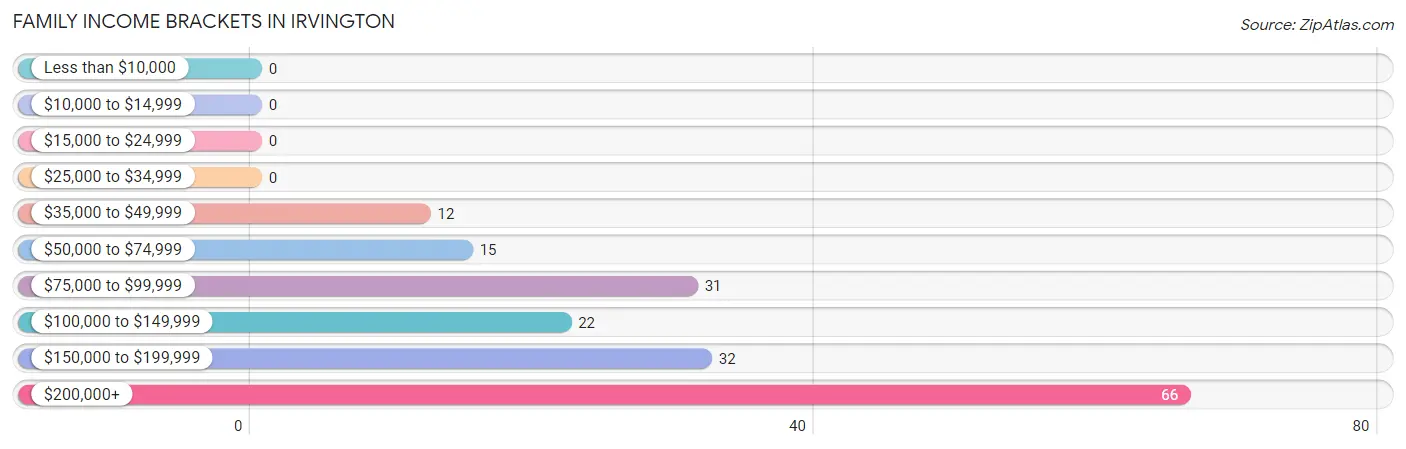
| Income Bracket | # Families | % Families |
| Less than $10,000 | 0 | 0.0% |
| $10,000 to $14,999 | 0 | 0.0% |
| $15,000 to $24,999 | 0 | 0.0% |
| $25,000 to $34,999 | 0 | 0.0% |
| $35,000 to $49,999 | 12 | 6.7% |
| $50,000 to $74,999 | 15 | 8.4% |
| $75,000 to $99,999 | 31 | 17.4% |
| $100,000 to $149,999 | 22 | 12.4% |
| $150,000 to $199,999 | 32 | 18.0% |
| $200,000+ | 66 | 37.1% |
Family Income by Famaliy Size in Irvington
2-person families (140 | 78.6%) account for the highest median family income in Irvington with $182,917 per family, while 2-person families (140 | 78.6%) have the highest median income of $91,458 per family member.
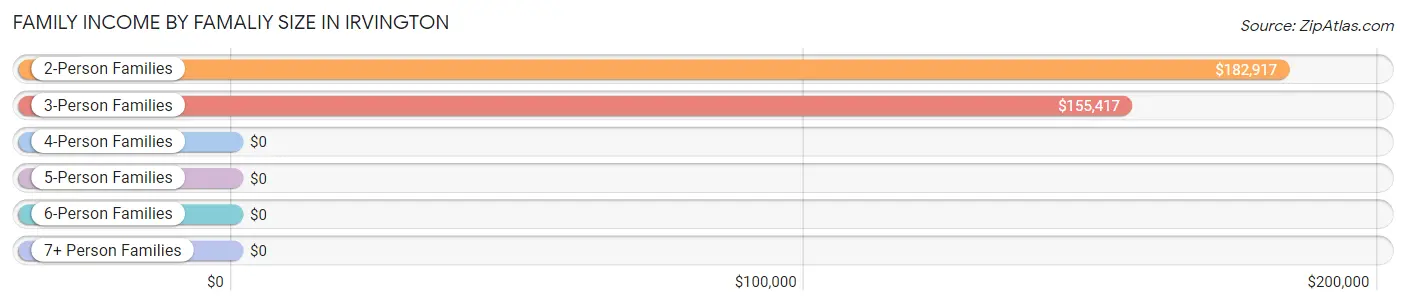
| Income Bracket | # Families | Median Income |
| 2-Person Families | 140 (78.6%) | $182,917 |
| 3-Person Families | 15 (8.4%) | $155,417 |
| 4-Person Families | 22 (12.4%) | $0 |
| 5-Person Families | 1 (0.6%) | $0 |
| 6-Person Families | 0 (0.0%) | $0 |
| 7+ Person Families | 0 (0.0%) | $0 |
| Total | 178 (100.0%) | $157,500 |
Family Income by Number of Earners in Irvington
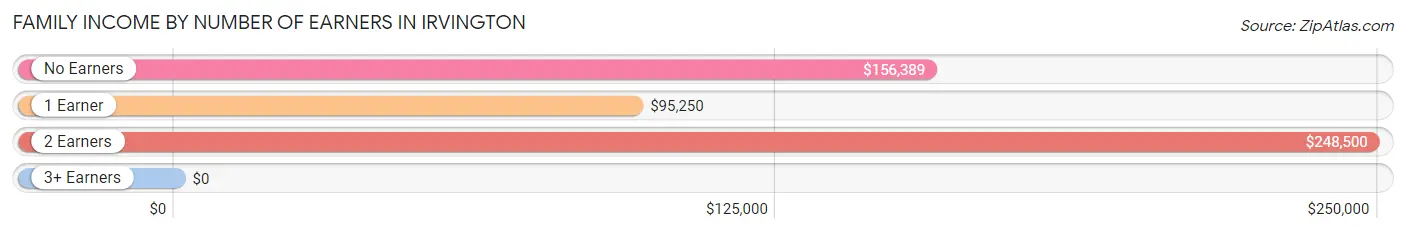
| Number of Earners | # Families | Median Income |
| No Earners | 44 (24.7%) | $156,389 |
| 1 Earner | 34 (19.1%) | $95,250 |
| 2 Earners | 92 (51.7%) | $248,500 |
| 3+ Earners | 8 (4.5%) | $0 |
| Total | 178 (100.0%) | $157,500 |
Household Income in Irvington
Household Income Brackets in Irvington
With 67 households falling in the category, the $200,000+ income range is the most frequent in Irvington, accounting for 25.8% of all households. In contrast, only 2 households (0.8%) fall into the $25,000 to $34,999 income bracket, making it the least populous group.
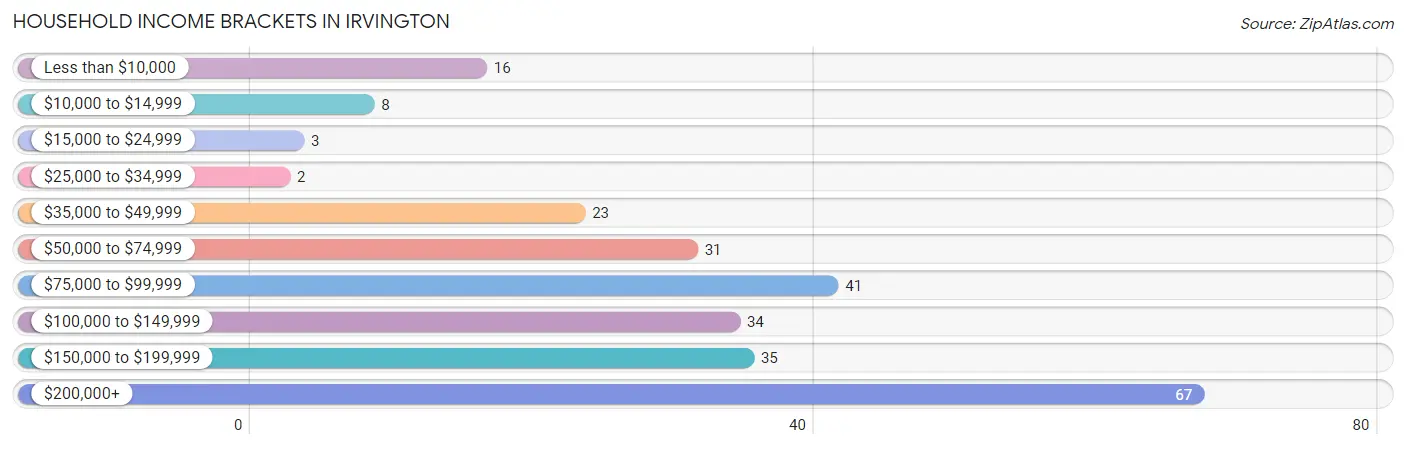
| Income Bracket | # Households | % Households |
| Less than $10,000 | 16 | 6.2% |
| $10,000 to $14,999 | 8 | 3.1% |
| $15,000 to $24,999 | 3 | 1.2% |
| $25,000 to $34,999 | 2 | 0.8% |
| $35,000 to $49,999 | 23 | 8.8% |
| $50,000 to $74,999 | 31 | 11.9% |
| $75,000 to $99,999 | 41 | 15.8% |
| $100,000 to $149,999 | 34 | 13.1% |
| $150,000 to $199,999 | 35 | 13.5% |
| $200,000+ | 67 | 25.8% |
Household Income by Householder Age in Irvington
The median household income in Irvington is $118,750, with the highest median household income of $182,708 found in the 45 to 64 years age bracket for the primary householder. A total of 107 households (41.1%) fall into this category.
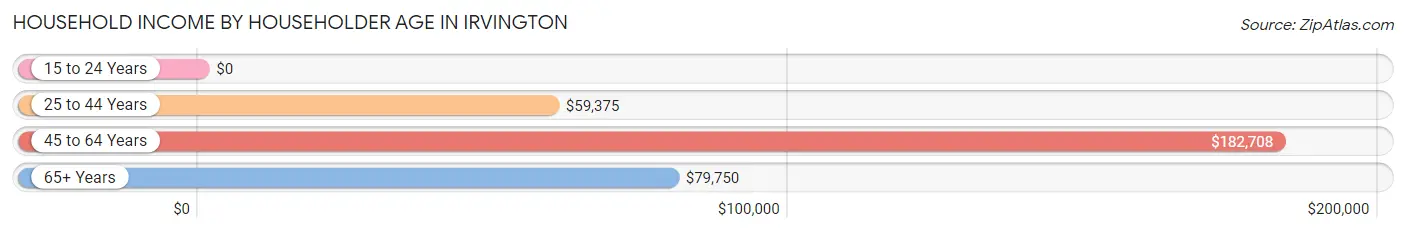
| Income Bracket | # Households | Median Income |
| 15 to 24 Years | 0 (0.0%) | $0 |
| 25 to 44 Years | 40 (15.4%) | $59,375 |
| 45 to 64 Years | 107 (41.1%) | $182,708 |
| 65+ Years | 113 (43.5%) | $79,750 |
| Total | 260 (100.0%) | $118,750 |
Poverty in Irvington
Income Below Poverty by Sex and Age in Irvington
With 1.8% poverty level for males and 7.7% for females among the residents of Irvington, 75 year old and over males and 75 year old and over females are the most vulnerable to poverty, with 5 males (17.9%) and 11 females (42.3%) in their respective age groups living below the poverty level.
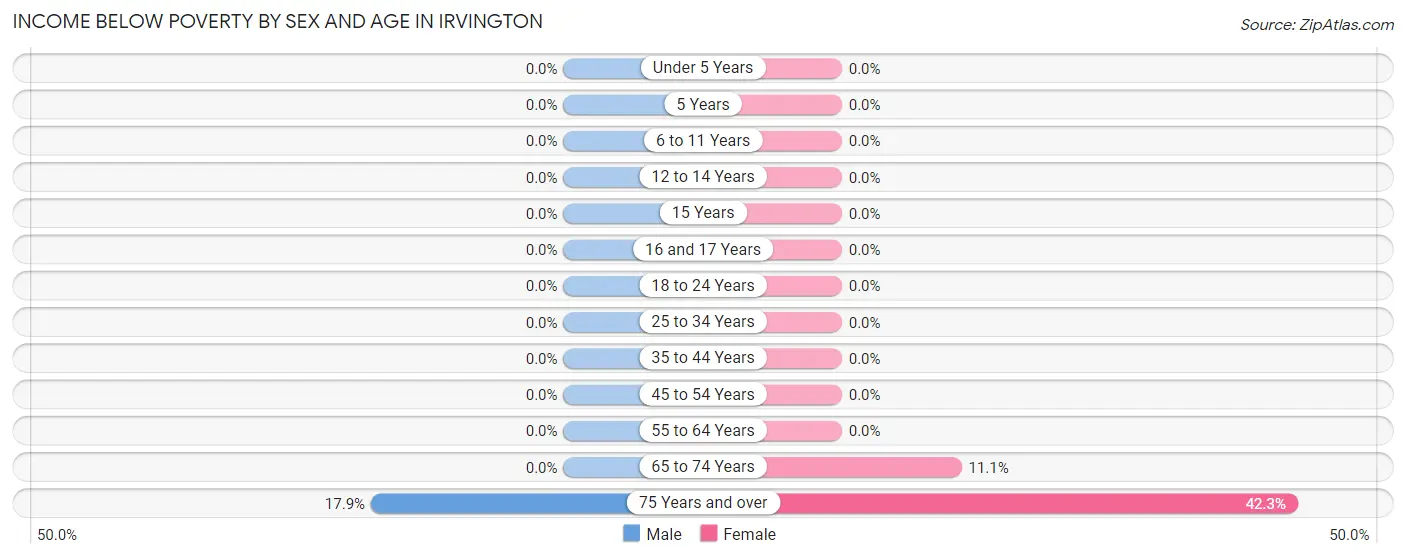
| Age Bracket | Male | Female |
| Under 5 Years | 0 (0.0%) | 0 (0.0%) |
| 5 Years | 0 (0.0%) | 0 (0.0%) |
| 6 to 11 Years | 0 (0.0%) | 0 (0.0%) |
| 12 to 14 Years | 0 (0.0%) | 0 (0.0%) |
| 15 Years | 0 (0.0%) | 0 (0.0%) |
| 16 and 17 Years | 0 (0.0%) | 0 (0.0%) |
| 18 to 24 Years | 0 (0.0%) | 0 (0.0%) |
| 25 to 34 Years | 0 (0.0%) | 0 (0.0%) |
| 35 to 44 Years | 0 (0.0%) | 0 (0.0%) |
| 45 to 54 Years | 0 (0.0%) | 0 (0.0%) |
| 55 to 64 Years | 0 (0.0%) | 0 (0.0%) |
| 65 to 74 Years | 0 (0.0%) | 8 (11.1%) |
| 75 Years and over | 5 (17.9%) | 11 (42.3%) |
| Total | 5 (1.8%) | 19 (7.7%) |
Income Above Poverty by Sex and Age in Irvington
According to the poverty statistics in Irvington, males aged under 5 years and females aged under 5 years are the age groups that are most secure financially, with 100.0% of males and 100.0% of females in these age groups living above the poverty line.
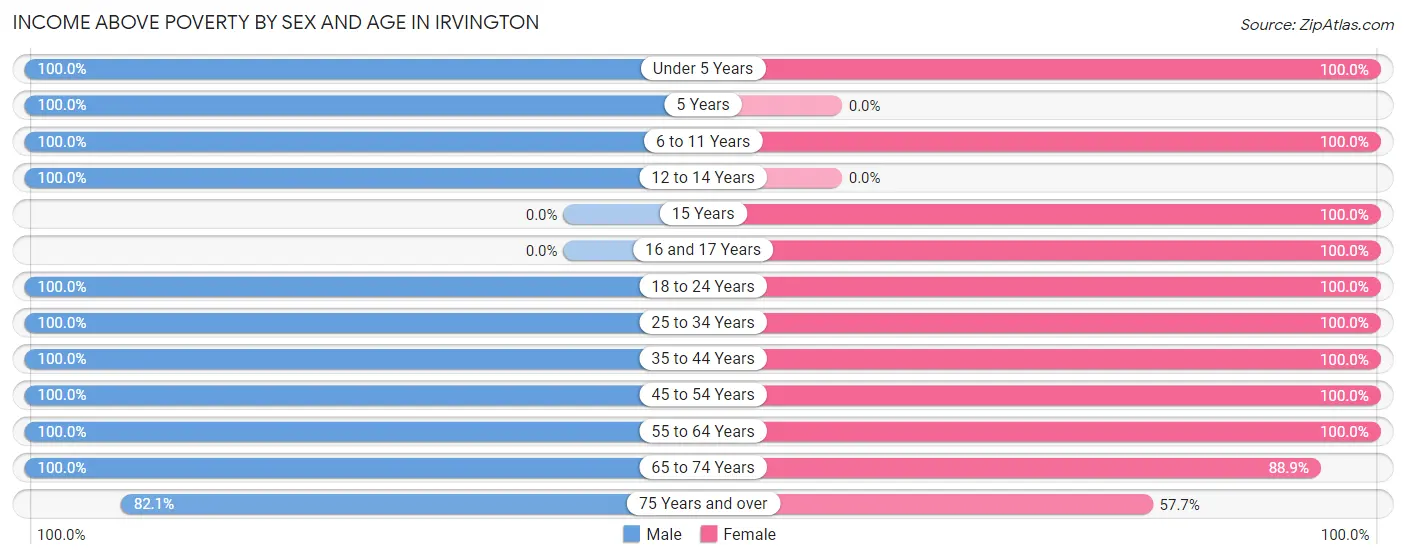
| Age Bracket | Male | Female |
| Under 5 Years | 9 (100.0%) | 4 (100.0%) |
| 5 Years | 3 (100.0%) | 0 (0.0%) |
| 6 to 11 Years | 7 (100.0%) | 14 (100.0%) |
| 12 to 14 Years | 14 (100.0%) | 0 (0.0%) |
| 15 Years | 0 (0.0%) | 3 (100.0%) |
| 16 and 17 Years | 0 (0.0%) | 4 (100.0%) |
| 18 to 24 Years | 17 (100.0%) | 5 (100.0%) |
| 25 to 34 Years | 16 (100.0%) | 26 (100.0%) |
| 35 to 44 Years | 9 (100.0%) | 17 (100.0%) |
| 45 to 54 Years | 44 (100.0%) | 23 (100.0%) |
| 55 to 64 Years | 68 (100.0%) | 52 (100.0%) |
| 65 to 74 Years | 58 (100.0%) | 64 (88.9%) |
| 75 Years and over | 23 (82.1%) | 15 (57.7%) |
| Total | 268 (98.2%) | 227 (92.3%) |
Income Below Poverty Among Married-Couple Families in Irvington
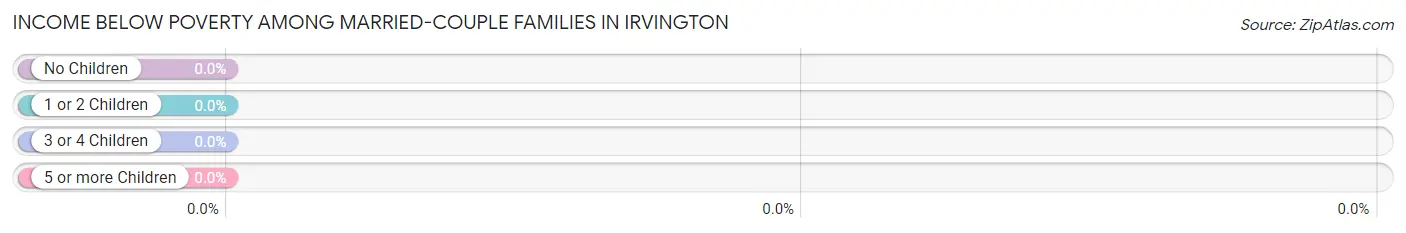
| Children | Above Poverty | Below Poverty |
| No Children | 152 (100.0%) | 0 (0.0%) |
| 1 or 2 Children | 16 (100.0%) | 0 (0.0%) |
| 3 or 4 Children | 1 (100.0%) | 0 (0.0%) |
| 5 or more Children | 0 (0.0%) | 0 (0.0%) |
| Total | 169 (100.0%) | 0 (0.0%) |
Income Below Poverty Among Single-Parent Households in Irvington
| Children | Single Father | Single Mother |
| No Children | 0 (0.0%) | 0 (0.0%) |
| 1 or 2 Children | 0 (0.0%) | 0 (0.0%) |
| 3 or 4 Children | 0 (0.0%) | 0 (0.0%) |
| 5 or more Children | 0 (0.0%) | 0 (0.0%) |
| Total | 0 (0.0%) | 0 (0.0%) |
Income Below Poverty Among Married-Couple vs Single-Parent Households in Irvington
| Children | Married-Couple Families | Single-Parent Households |
| No Children | 0 (0.0%) | 0 (0.0%) |
| 1 or 2 Children | 0 (0.0%) | 0 (0.0%) |
| 3 or 4 Children | 0 (0.0%) | 0 (0.0%) |
| 5 or more Children | 0 (0.0%) | 0 (0.0%) |
| Total | 0 (0.0%) | 0 (0.0%) |
Race in Irvington
The most populous races in Irvington are White / Caucasian (495 | 95.4%), Two or more Races (22 | 4.2%), and Hispanic or Latino (5 | 1.0%).
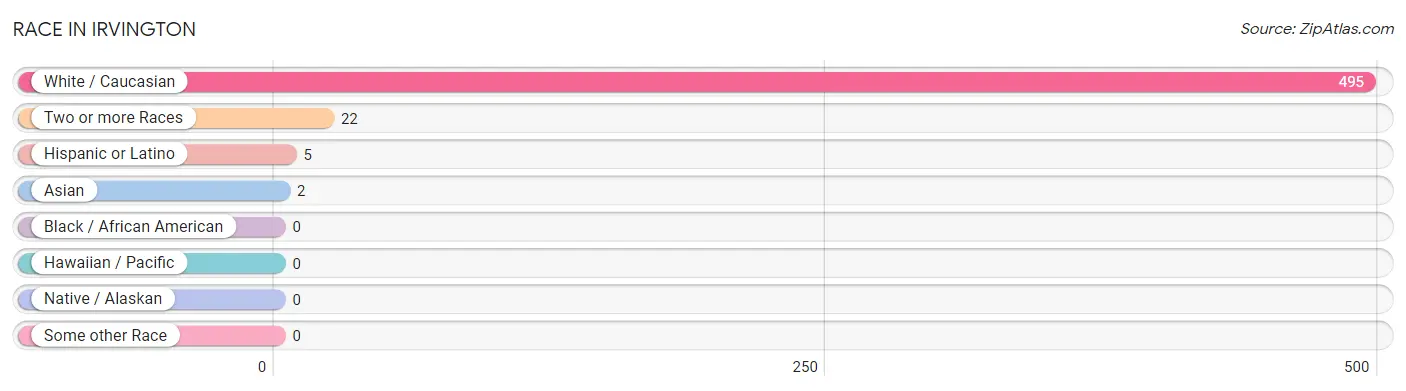
| Race | # Population | % Population |
| Asian | 2 | 0.4% |
| Black / African American | 0 | 0.0% |
| Hawaiian / Pacific | 0 | 0.0% |
| Hispanic or Latino | 5 | 1.0% |
| Native / Alaskan | 0 | 0.0% |
| White / Caucasian | 495 | 95.4% |
| Two or more Races | 22 | 4.2% |
| Some other Race | 0 | 0.0% |
| Total | 519 | 100.0% |
Ancestry in Irvington
The most populous ancestries reported in Irvington are English (153 | 29.5%), American (90 | 17.3%), Irish (63 | 12.1%), German (37 | 7.1%), and Scottish (29 | 5.6%), together accounting for 71.7% of all Irvington residents.
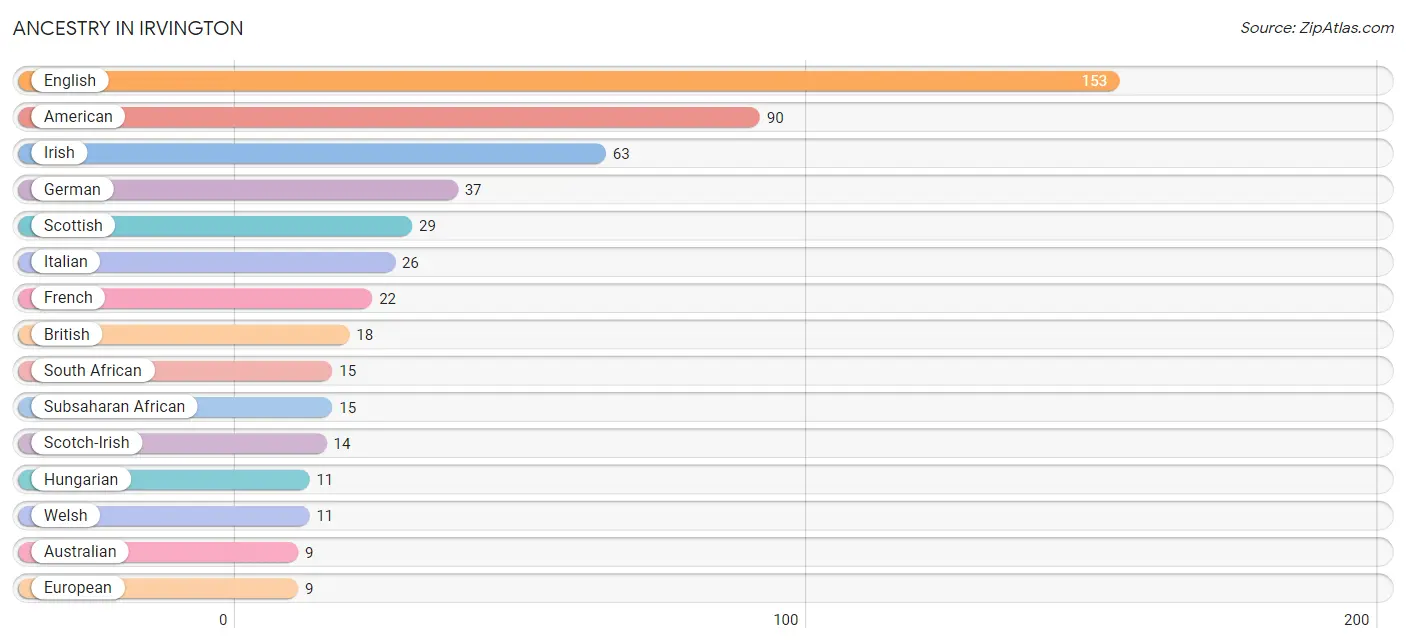
| Ancestry | # Population | % Population |
| American | 90 | 17.3% |
| Arab | 2 | 0.4% |
| Australian | 9 | 1.7% |
| British | 18 | 3.5% |
| Czech | 2 | 0.4% |
| Danish | 2 | 0.4% |
| Dutch | 4 | 0.8% |
| English | 153 | 29.5% |
| European | 9 | 1.7% |
| French | 22 | 4.2% |
| German | 37 | 7.1% |
| Hungarian | 11 | 2.1% |
| Icelander | 2 | 0.4% |
| Irish | 63 | 12.1% |
| Italian | 26 | 5.0% |
| Korean | 4 | 0.8% |
| Lebanese | 2 | 0.4% |
| Norwegian | 1 | 0.2% |
| Peruvian | 5 | 1.0% |
| Polish | 5 | 1.0% |
| Scotch-Irish | 14 | 2.7% |
| Scottish | 29 | 5.6% |
| South African | 15 | 2.9% |
| South American | 5 | 1.0% |
| Subsaharan African | 15 | 2.9% |
| Swedish | 6 | 1.2% |
| Swiss | 3 | 0.6% |
| Welsh | 11 | 2.1% | View All 28 Rows |
Immigrants in Irvington
The most numerous immigrant groups reported in Irvington came from Africa (16 | 3.1%), South Africa (16 | 3.1%), Australia (9 | 1.7%), Oceania (9 | 1.7%), and Canada (6 | 1.2%), together accounting for 10.8% of all Irvington residents.
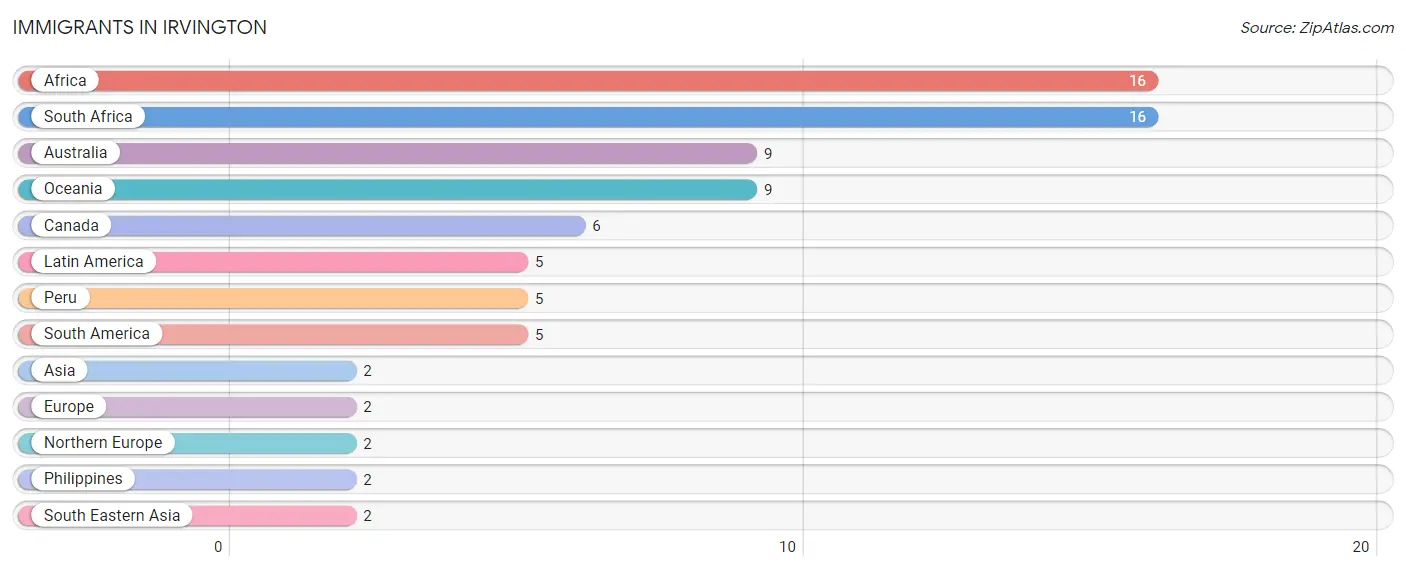
| Immigration Origin | # Population | % Population |
| Africa | 16 | 3.1% |
| Asia | 2 | 0.4% |
| Australia | 9 | 1.7% |
| Canada | 6 | 1.2% |
| Europe | 2 | 0.4% |
| Latin America | 5 | 1.0% |
| Northern Europe | 2 | 0.4% |
| Oceania | 9 | 1.7% |
| Peru | 5 | 1.0% |
| Philippines | 2 | 0.4% |
| South Africa | 16 | 3.1% |
| South America | 5 | 1.0% |
| South Eastern Asia | 2 | 0.4% | View All 13 Rows |
Sex and Age in Irvington
Sex and Age in Irvington
The most populous age groups in Irvington are 70 to 74 Years (37 | 13.6%) for men and 65 to 69 Years (45 | 18.3%) for women.
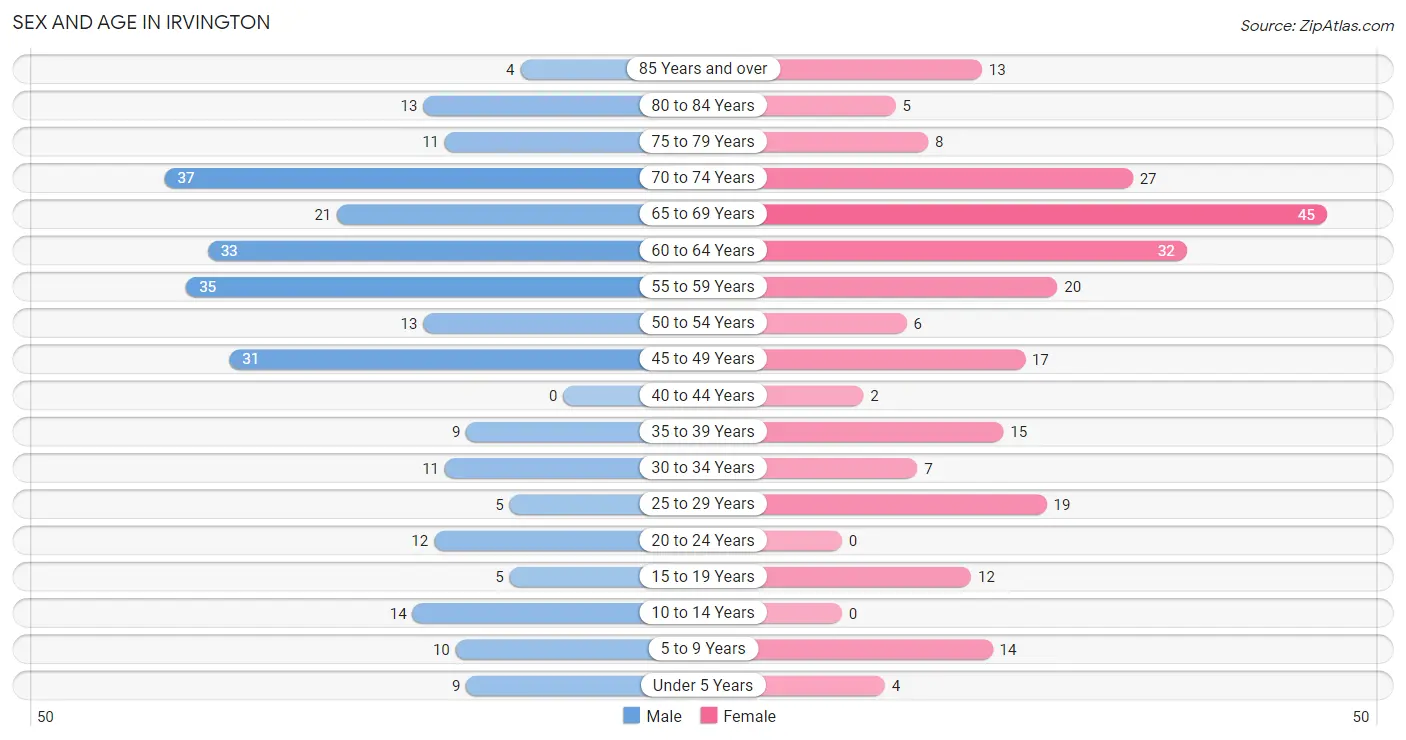
| Age Bracket | Male | Female |
| Under 5 Years | 9 (3.3%) | 4 (1.6%) |
| 5 to 9 Years | 10 (3.7%) | 14 (5.7%) |
| 10 to 14 Years | 14 (5.1%) | 0 (0.0%) |
| 15 to 19 Years | 5 (1.8%) | 12 (4.9%) |
| 20 to 24 Years | 12 (4.4%) | 0 (0.0%) |
| 25 to 29 Years | 5 (1.8%) | 19 (7.7%) |
| 30 to 34 Years | 11 (4.0%) | 7 (2.9%) |
| 35 to 39 Years | 9 (3.3%) | 15 (6.1%) |
| 40 to 44 Years | 0 (0.0%) | 2 (0.8%) |
| 45 to 49 Years | 31 (11.4%) | 17 (6.9%) |
| 50 to 54 Years | 13 (4.8%) | 6 (2.4%) |
| 55 to 59 Years | 35 (12.8%) | 20 (8.1%) |
| 60 to 64 Years | 33 (12.1%) | 32 (13.0%) |
| 65 to 69 Years | 21 (7.7%) | 45 (18.3%) |
| 70 to 74 Years | 37 (13.6%) | 27 (11.0%) |
| 75 to 79 Years | 11 (4.0%) | 8 (3.3%) |
| 80 to 84 Years | 13 (4.8%) | 5 (2.0%) |
| 85 Years and over | 4 (1.5%) | 13 (5.3%) |
| Total | 273 (100.0%) | 246 (100.0%) |
Families and Households in Irvington
Median Family Size in Irvington
The median family size in Irvington is 2.34 persons per family, with single male/father families (5 | 2.8%) accounting for the largest median family size of 3.4 persons per family. On the other hand, married-couple families (169 | 94.9%) represent the smallest median family size with 2.29 persons per family.
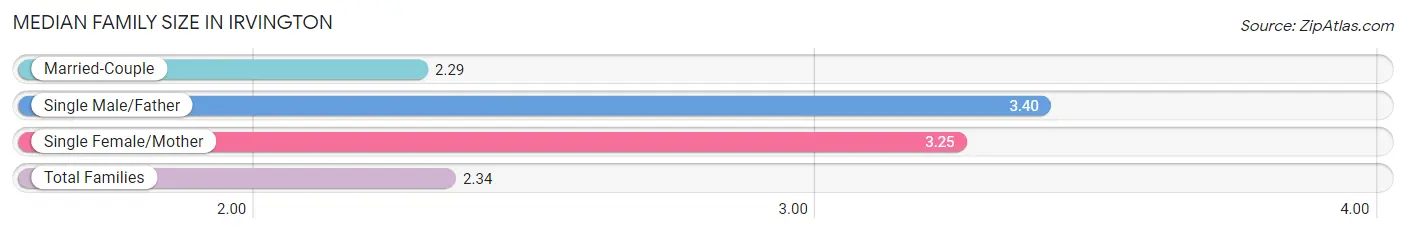
| Family Type | # Families | Family Size |
| Married-Couple | 169 (94.9%) | 2.29 |
| Single Male/Father | 5 (2.8%) | 3.40 |
| Single Female/Mother | 4 (2.2%) | 3.25 |
| Total Families | 178 (100.0%) | 2.34 |
Median Household Size in Irvington
The median household size in Irvington is 2.00 persons per household, with single male/father households (5 | 1.9%) accounting for the largest median household size of 3.8 persons per household. non-family households (82 | 31.5%) represent the smallest median household size with 1.22 persons per household.
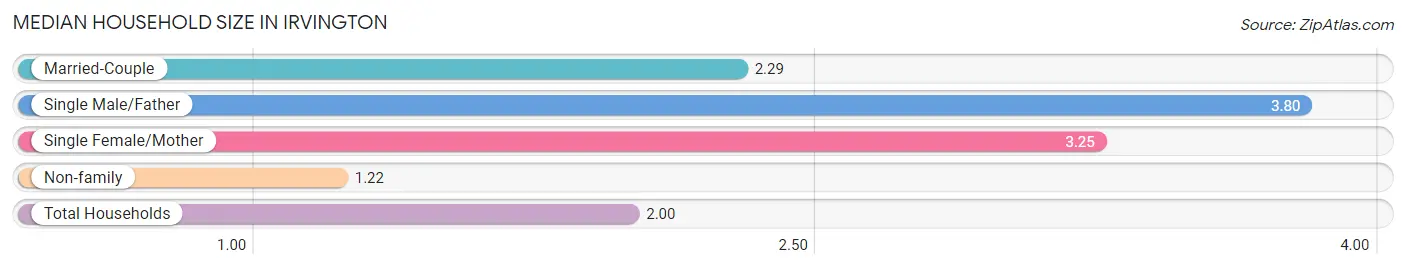
| Household Type | # Households | Household Size |
| Married-Couple | 169 (65.0%) | 2.29 |
| Single Male/Father | 5 (1.9%) | 3.80 |
| Single Female/Mother | 4 (1.5%) | 3.25 |
| Non-family | 82 (31.5%) | 1.22 |
| Total Households | 260 (100.0%) | 2.00 |
Household Size by Marriage Status in Irvington
Out of a total of 260 households in Irvington, 178 (68.5%) are family households, while 82 (31.5%) are nonfamily households. The most numerous type of family households are 2-person households, comprising 137, and the most common type of nonfamily households are 1-person households, comprising 66.
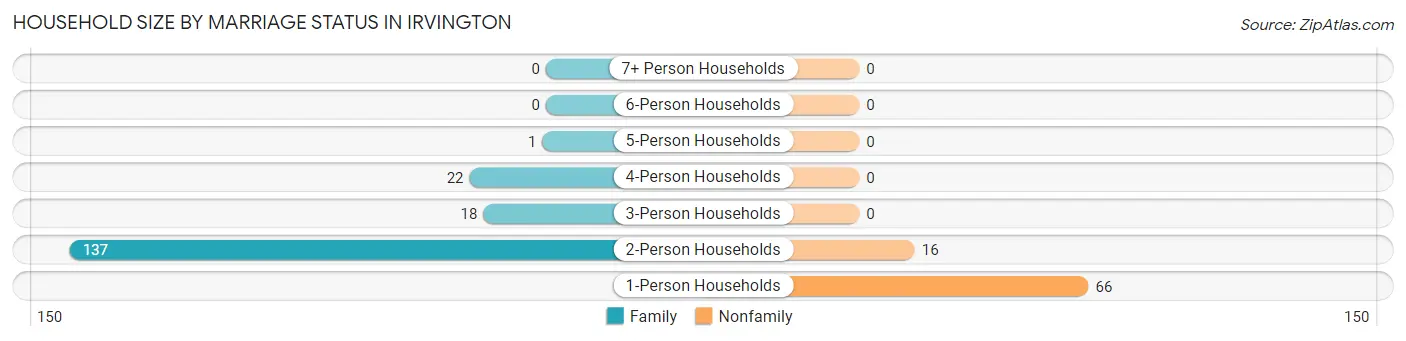
| Household Size | Family Households | Nonfamily Households |
| 1-Person Households | - | 66 (25.4%) |
| 2-Person Households | 137 (52.7%) | 16 (6.1%) |
| 3-Person Households | 18 (6.9%) | 0 (0.0%) |
| 4-Person Households | 22 (8.5%) | 0 (0.0%) |
| 5-Person Households | 1 (0.4%) | 0 (0.0%) |
| 6-Person Households | 0 (0.0%) | 0 (0.0%) |
| 7+ Person Households | 0 (0.0%) | 0 (0.0%) |
| Total | 178 (68.5%) | 82 (31.5%) |
Female Fertility in Irvington
Fertility by Age in Irvington
| Age Bracket | Women with Births | Births / 1,000 Women |
| 15 to 19 years | 0 (0.0%) | 0.0 |
| 20 to 34 years | 0 (0.0%) | 0.0 |
| 35 to 50 years | 0 (0.0%) | 0.0 |
| Total | 0 (0.0%) | 0.0 |
Fertility by Age by Marriage Status in Irvington
| Age Bracket | Married | Unmarried |
| 15 to 19 years | 0 (0.0%) | 0 (0.0%) |
| 20 to 34 years | 0 (0.0%) | 0 (0.0%) |
| 35 to 50 years | 0 (0.0%) | 0 (0.0%) |
| Total | 0 (0.0%) | 0 (0.0%) |
Fertility by Education in Irvington
| Educational Attainment | Women with Births | Births / 1,000 Women |
| Less than High School | 0 (0.0%) | 0.0 |
| High School Diploma | 0 (0.0%) | 0.0 |
| College or Associate's Degree | 0 (0.0%) | 0.0 |
| Bachelor's Degree | 0 (0.0%) | 0.0 |
| Graduate Degree | 0 (0.0%) | 0.0 |
| Total | 0 (0.0%) | 0.0 |
Fertility by Education by Marriage Status in Irvington
| Educational Attainment | Married | Unmarried |
| Less than High School | 0 (0.0%) | 0 (0.0%) |
| High School Diploma | 0 (0.0%) | 0 (0.0%) |
| College or Associate's Degree | 0 (0.0%) | 0 (0.0%) |
| Bachelor's Degree | 0 (0.0%) | 0 (0.0%) |
| Graduate Degree | 0 (0.0%) | 0 (0.0%) |
| Total | 0 (0.0%) | 0 (0.0%) |
Employment Characteristics in Irvington
Employment by Class of Employer in Irvington
Among the 260 employed individuals in Irvington, private company employees (107 | 41.1%), not-for-profit organizations (61 | 23.5%), and self-employed (not incorporated) (33 | 12.7%) make up the most common classes of employment.
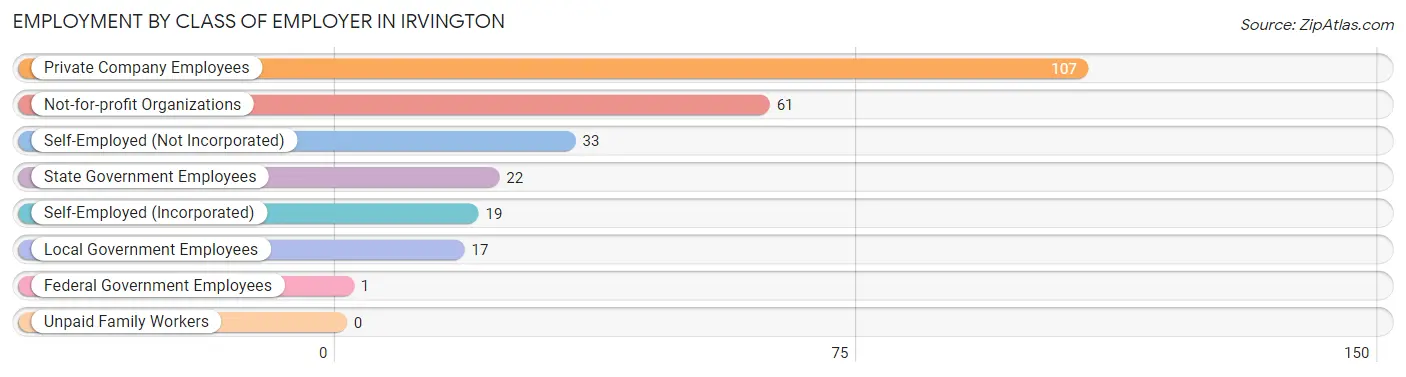
| Employer Class | # Employees | % Employees |
| Private Company Employees | 107 | 41.1% |
| Self-Employed (Incorporated) | 19 | 7.3% |
| Self-Employed (Not Incorporated) | 33 | 12.7% |
| Not-for-profit Organizations | 61 | 23.5% |
| Local Government Employees | 17 | 6.5% |
| State Government Employees | 22 | 8.5% |
| Federal Government Employees | 1 | 0.4% |
| Unpaid Family Workers | 0 | 0.0% |
| Total | 260 | 100.0% |
Employment Status by Age in Irvington
According to the labor force statistics for Irvington, out of the total population over 16 years of age (465), 56.8% or 264 individuals are in the labor force, with 1.5% or 4 of them unemployed. The age group with the highest labor force participation rate is 16 to 19 years, with 100.0% or 14 individuals in the labor force. Within the labor force, the 30 to 34 years age range has the highest percentage of unemployed individuals, with 22.2% or 4 of them being unemployed.
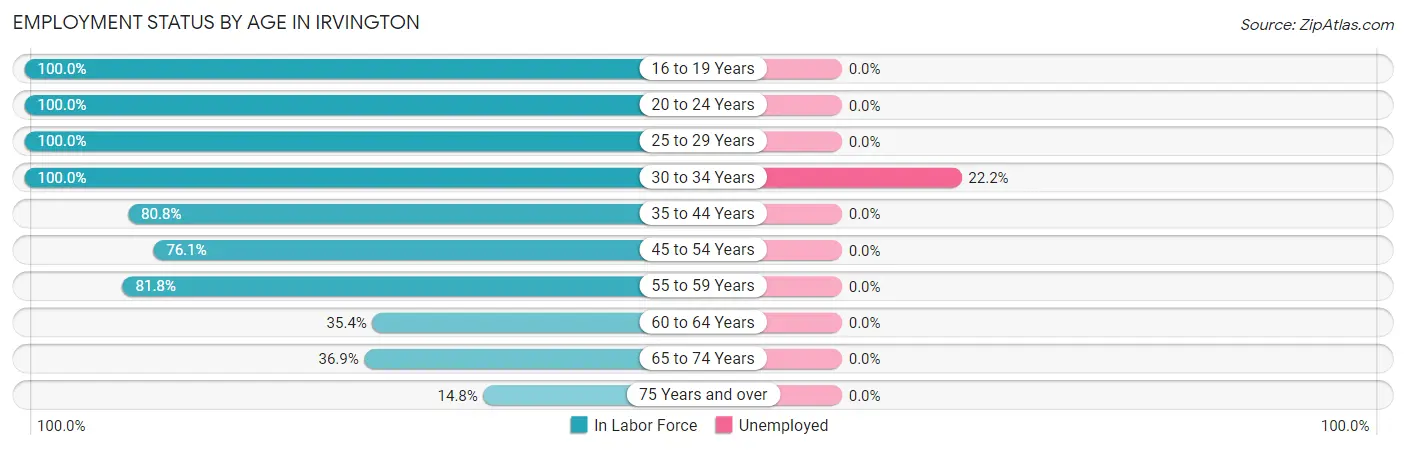
| Age Bracket | In Labor Force | Unemployed |
| 16 to 19 Years | 14 (100.0%) | 0 (0.0%) |
| 20 to 24 Years | 12 (100.0%) | 0 (0.0%) |
| 25 to 29 Years | 24 (100.0%) | 0 (0.0%) |
| 30 to 34 Years | 18 (100.0%) | 4 (22.2%) |
| 35 to 44 Years | 21 (80.8%) | 0 (0.0%) |
| 45 to 54 Years | 51 (76.1%) | 0 (0.0%) |
| 55 to 59 Years | 45 (81.8%) | 0 (0.0%) |
| 60 to 64 Years | 23 (35.4%) | 0 (0.0%) |
| 65 to 74 Years | 48 (36.9%) | 0 (0.0%) |
| 75 Years and over | 8 (14.8%) | 0 (0.0%) |
| Total | 264 (56.8%) | 4 (1.5%) |
Employment Status by Educational Attainment in Irvington
According to labor force statistics for Irvington, 71.4% of individuals (182) out of the total population between 25 and 64 years of age (255) are in the labor force, with 2.2% or 4 of them being unemployed. The group with the highest labor force participation rate are those with the educational attainment of high school diploma, with 94.6% or 35 individuals in the labor force. Within the labor force, individuals with college / associate degree education have the highest percentage of unemployment, with 16.7% or 4 of them being unemployed.
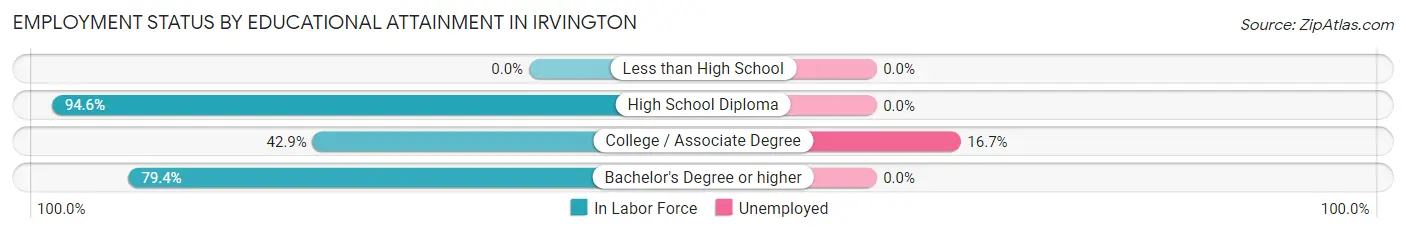
| Educational Attainment | In Labor Force | Unemployed |
| Less than High School | 0 (0.0%) | 0 (0.0%) |
| High School Diploma | 35 (94.6%) | 0 (0.0%) |
| College / Associate Degree | 24 (42.9%) | 9 (16.7%) |
| Bachelor's Degree or higher | 123 (79.4%) | 0 (0.0%) |
| Total | 182 (71.4%) | 6 (2.2%) |
Employment Occupations by Sex in Irvington
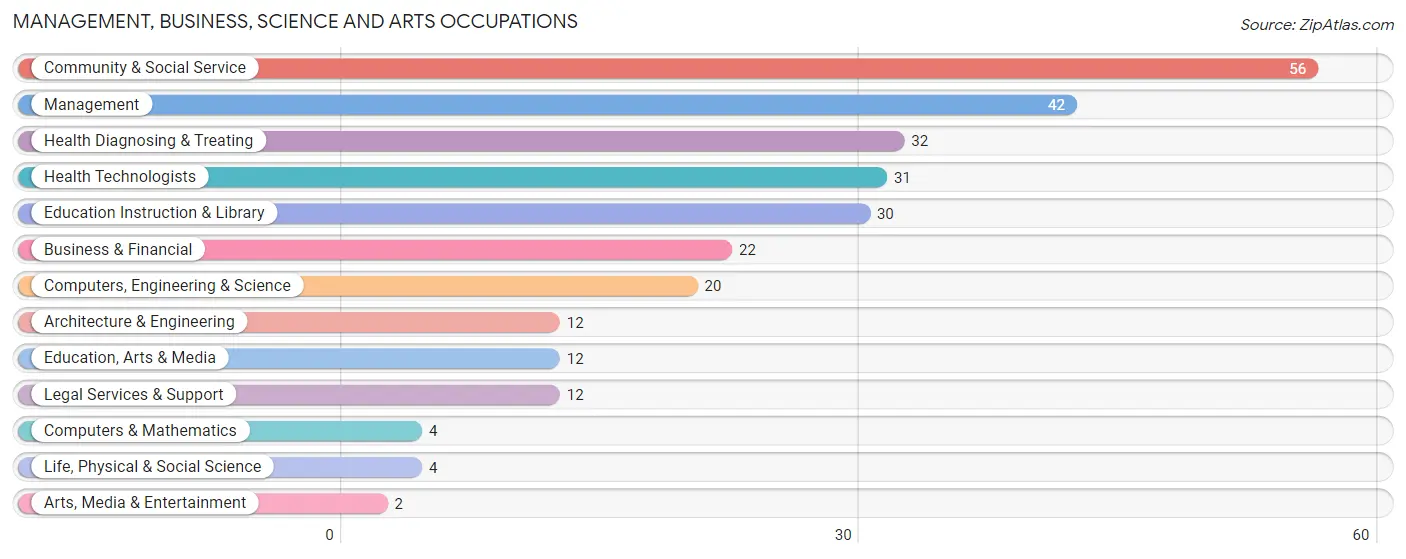
Management, Business, Science and Arts Occupations
The most common Management, Business, Science and Arts occupations in Irvington are Community & Social Service (56 | 21.5%), Management (42 | 16.2%), Health Diagnosing & Treating (32 | 12.3%), Health Technologists (31 | 11.9%), and Education Instruction & Library (30 | 11.5%).
Management, Business, Science and Arts Occupations by Sex
Within the Management, Business, Science and Arts occupations in Irvington, the most male-oriented occupations are Legal Services & Support (100.0%), Health Technologists (77.4%), and Management (76.2%), while the most female-oriented occupations are Architecture & Engineering (100.0%), Life, Physical & Social Science (100.0%), and Arts, Media & Entertainment (100.0%).
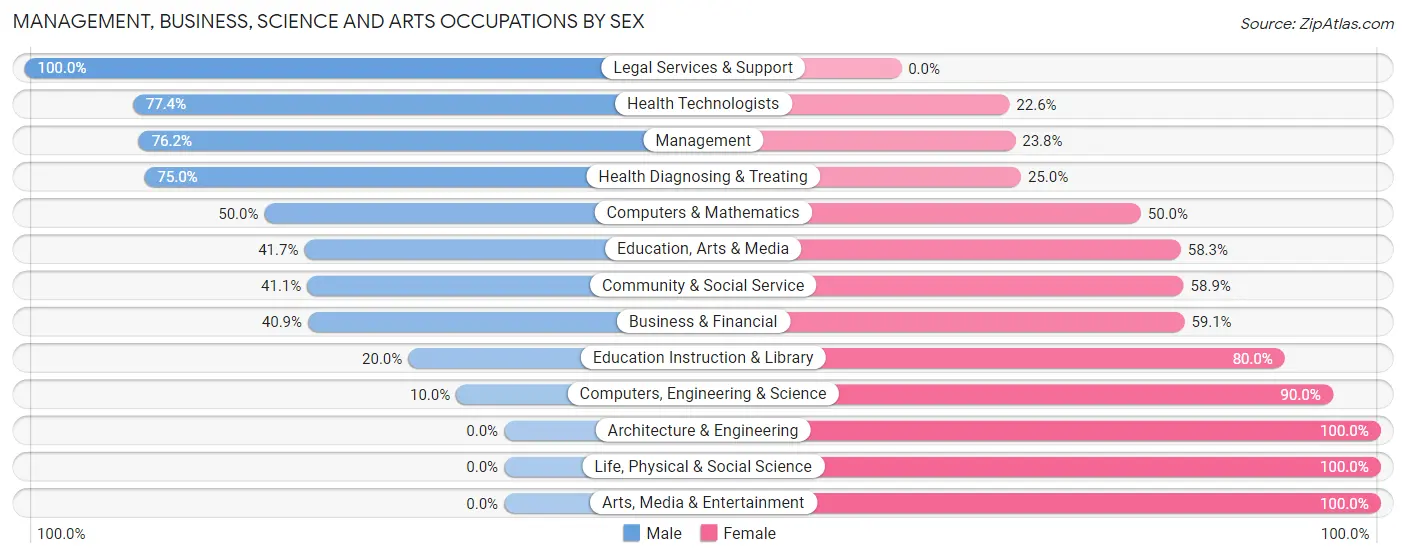
| Occupation | Male | Female |
| Management | 32 (76.2%) | 10 (23.8%) |
| Business & Financial | 9 (40.9%) | 13 (59.1%) |
| Computers, Engineering & Science | 2 (10.0%) | 18 (90.0%) |
| Computers & Mathematics | 2 (50.0%) | 2 (50.0%) |
| Architecture & Engineering | 0 (0.0%) | 12 (100.0%) |
| Life, Physical & Social Science | 0 (0.0%) | 4 (100.0%) |
| Community & Social Service | 23 (41.1%) | 33 (58.9%) |
| Education, Arts & Media | 5 (41.7%) | 7 (58.3%) |
| Legal Services & Support | 12 (100.0%) | 0 (0.0%) |
| Education Instruction & Library | 6 (20.0%) | 24 (80.0%) |
| Arts, Media & Entertainment | 0 (0.0%) | 2 (100.0%) |
| Health Diagnosing & Treating | 24 (75.0%) | 8 (25.0%) |
| Health Technologists | 24 (77.4%) | 7 (22.6%) |
| Total (Category) | 90 (52.3%) | 82 (47.7%) |
| Total (Overall) | 147 (56.5%) | 113 (43.5%) |
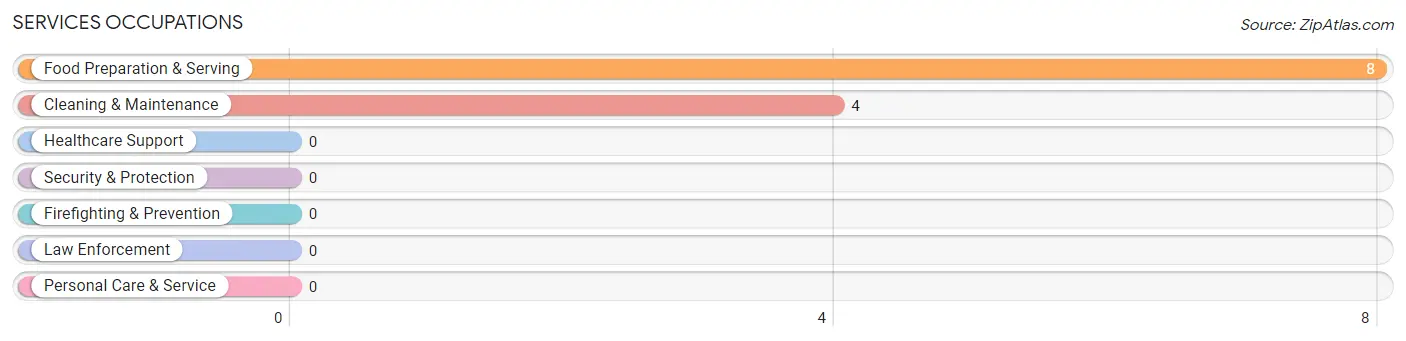
Services Occupations
The most common Services occupations in Irvington are Food Preparation & Serving (8 | 3.1%), and Cleaning & Maintenance (4 | 1.5%).
Services Occupations by Sex
Within the Services occupations in Irvington, the most male-oriented occupations are Cleaning & Maintenance (75.0%), and Food Preparation & Serving (50.0%), while the most female-oriented occupations are Food Preparation & Serving (50.0%), and Cleaning & Maintenance (25.0%).
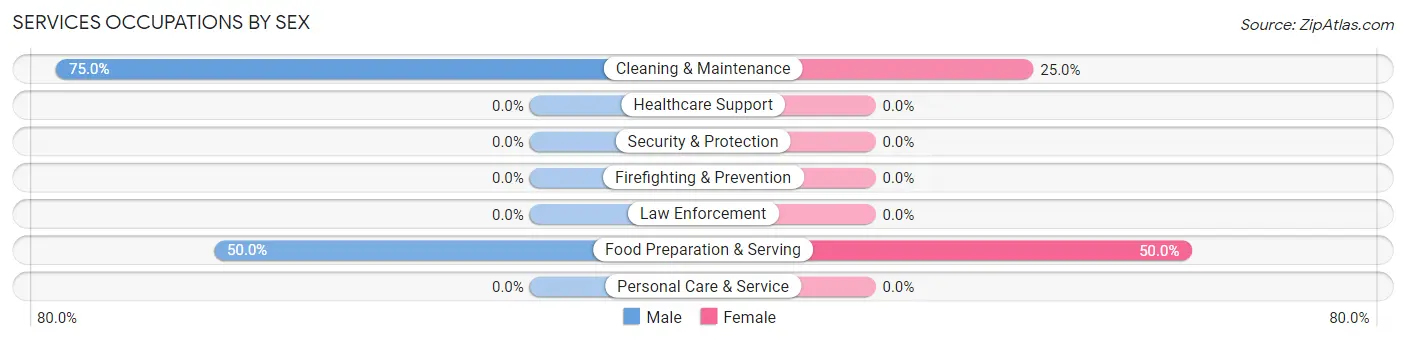
| Occupation | Male | Female |
| Healthcare Support | 0 (0.0%) | 0 (0.0%) |
| Security & Protection | 0 (0.0%) | 0 (0.0%) |
| Firefighting & Prevention | 0 (0.0%) | 0 (0.0%) |
| Law Enforcement | 0 (0.0%) | 0 (0.0%) |
| Food Preparation & Serving | 4 (50.0%) | 4 (50.0%) |
| Cleaning & Maintenance | 3 (75.0%) | 1 (25.0%) |
| Personal Care & Service | 0 (0.0%) | 0 (0.0%) |
| Total (Category) | 7 (58.3%) | 5 (41.7%) |
| Total (Overall) | 147 (56.5%) | 113 (43.5%) |
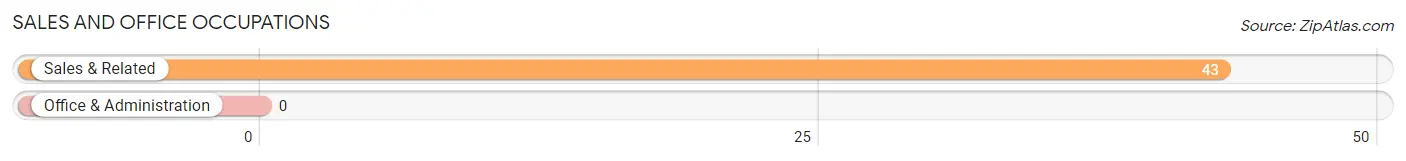
Sales and Office Occupations
The most common Sales and Office occupations in Irvington are , and Sales & Related (43 | 16.5%).
Sales and Office Occupations by Sex
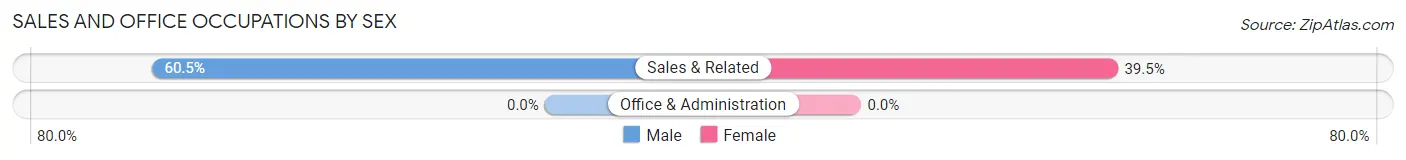
| Occupation | Male | Female |
| Sales & Related | 26 (60.5%) | 17 (39.5%) |
| Office & Administration | 0 (0.0%) | 0 (0.0%) |
| Total (Category) | 26 (60.5%) | 17 (39.5%) |
| Total (Overall) | 147 (56.5%) | 113 (43.5%) |
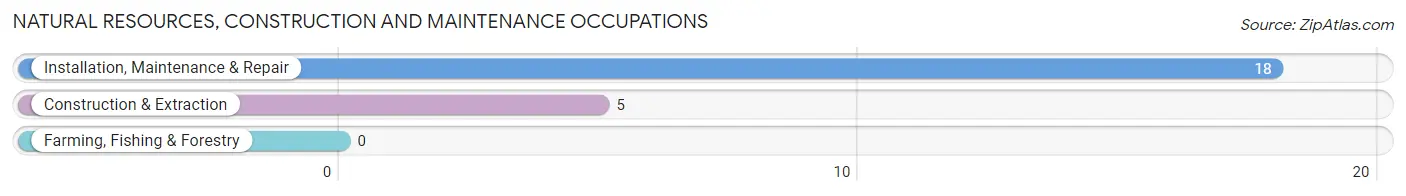
Natural Resources, Construction and Maintenance Occupations
The most common Natural Resources, Construction and Maintenance occupations in Irvington are Installation, Maintenance & Repair (18 | 6.9%), and Construction & Extraction (5 | 1.9%).
Natural Resources, Construction and Maintenance Occupations by Sex
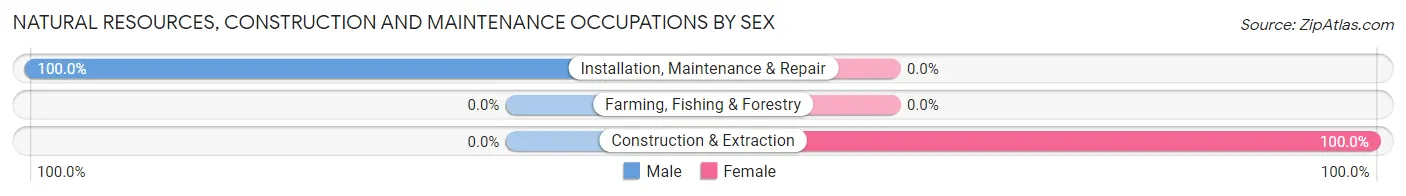
| Occupation | Male | Female |
| Farming, Fishing & Forestry | 0 (0.0%) | 0 (0.0%) |
| Construction & Extraction | 0 (0.0%) | 5 (100.0%) |
| Installation, Maintenance & Repair | 18 (100.0%) | 0 (0.0%) |
| Total (Category) | 18 (78.3%) | 5 (21.7%) |
| Total (Overall) | 147 (56.5%) | 113 (43.5%) |
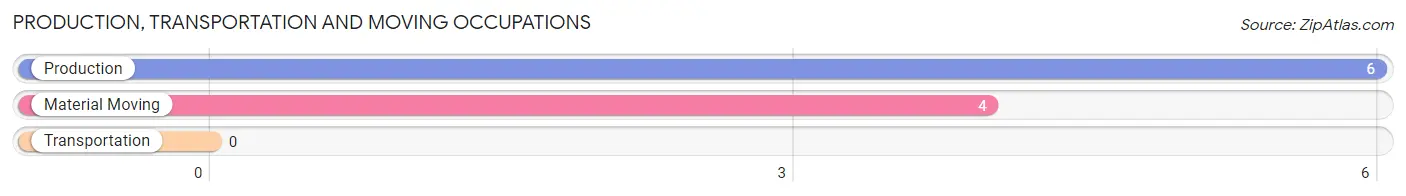
Production, Transportation and Moving Occupations
The most common Production, Transportation and Moving occupations in Irvington are Production (6 | 2.3%), and Material Moving (4 | 1.5%).
Production, Transportation and Moving Occupations by Sex
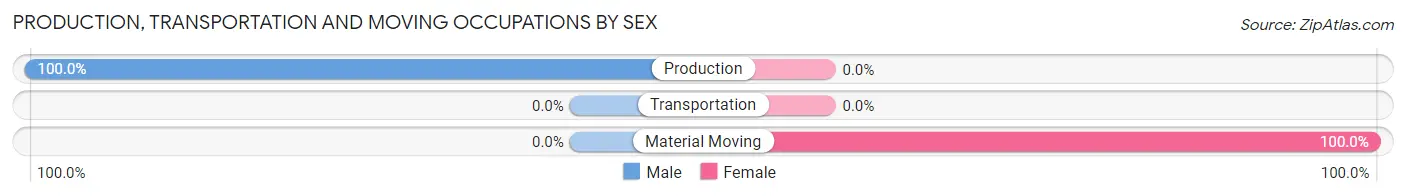
| Occupation | Male | Female |
| Production | 6 (100.0%) | 0 (0.0%) |
| Transportation | 0 (0.0%) | 0 (0.0%) |
| Material Moving | 0 (0.0%) | 4 (100.0%) |
| Total (Category) | 6 (60.0%) | 4 (40.0%) |
| Total (Overall) | 147 (56.5%) | 113 (43.5%) |
Employment Industries by Sex in Irvington
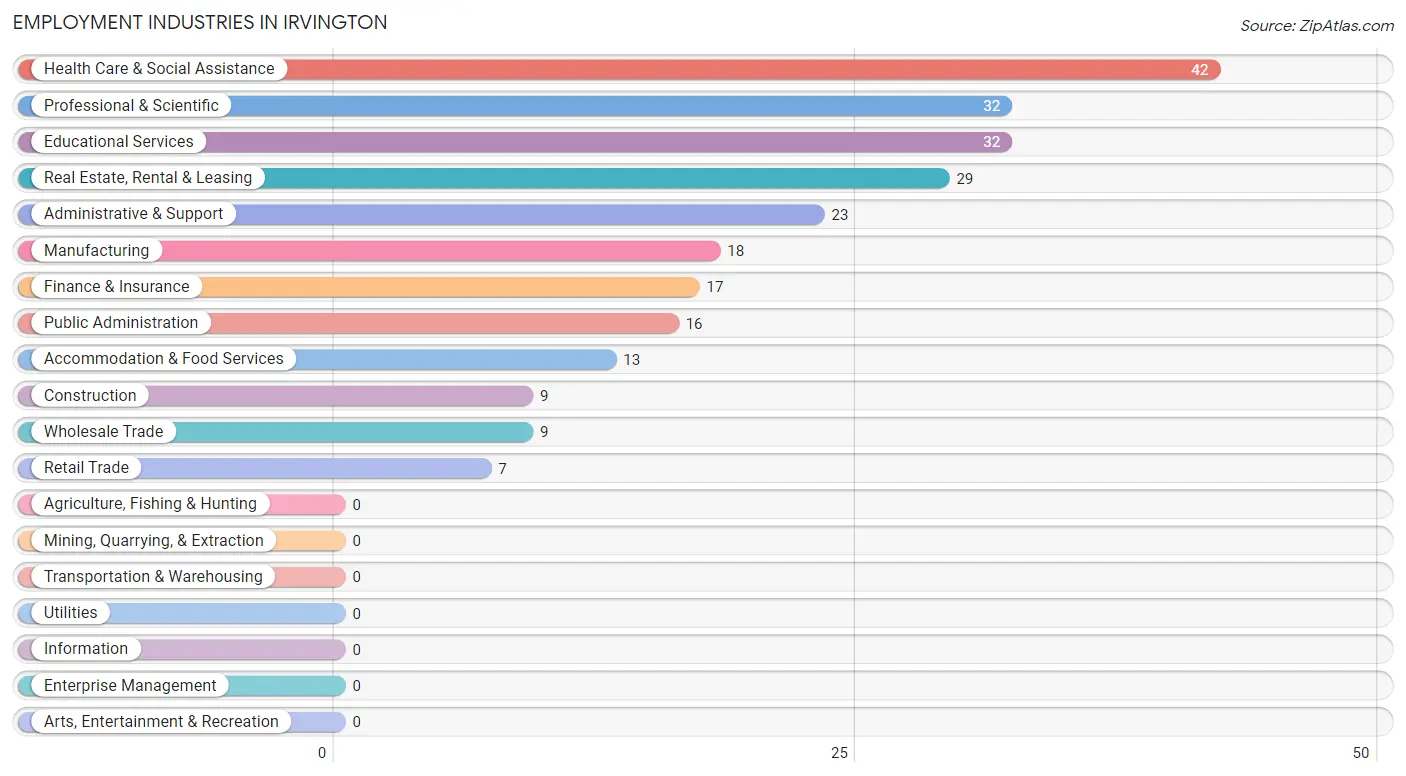
Employment Industries in Irvington
The major employment industries in Irvington include Health Care & Social Assistance (42 | 16.2%), Professional & Scientific (32 | 12.3%), Educational Services (32 | 12.3%), Real Estate, Rental & Leasing (29 | 11.2%), and Administrative & Support (23 | 8.8%).
Employment Industries by Sex in Irvington
The Irvington industries that see more men than women are Wholesale Trade (100.0%), Health Care & Social Assistance (85.7%), and Manufacturing (77.8%), whereas the industries that tend to have a higher number of women are Retail Trade (100.0%), Educational Services (81.2%), and Professional & Scientific (62.5%).
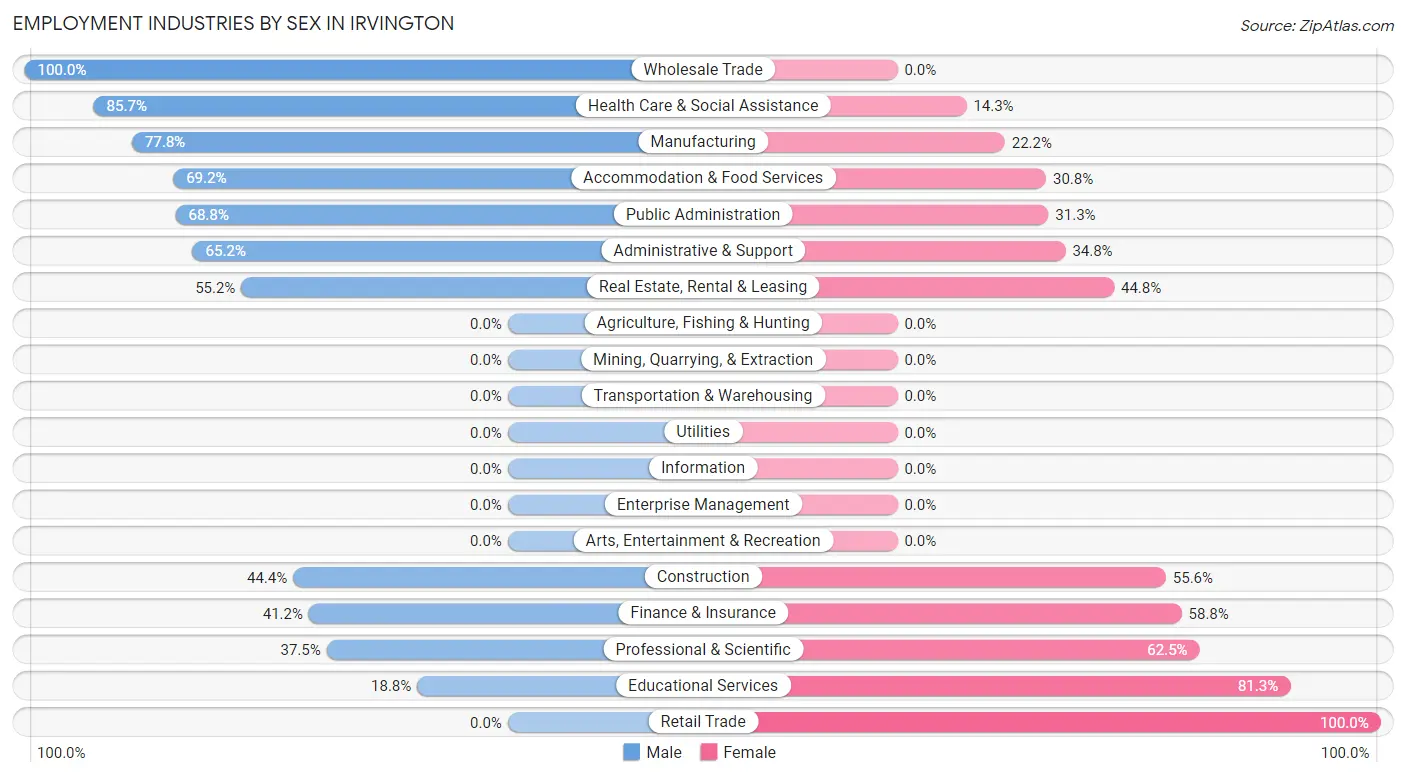
| Industry | Male | Female |
| Agriculture, Fishing & Hunting | 0 (0.0%) | 0 (0.0%) |
| Mining, Quarrying, & Extraction | 0 (0.0%) | 0 (0.0%) |
| Construction | 4 (44.4%) | 5 (55.6%) |
| Manufacturing | 14 (77.8%) | 4 (22.2%) |
| Wholesale Trade | 9 (100.0%) | 0 (0.0%) |
| Retail Trade | 0 (0.0%) | 7 (100.0%) |
| Transportation & Warehousing | 0 (0.0%) | 0 (0.0%) |
| Utilities | 0 (0.0%) | 0 (0.0%) |
| Information | 0 (0.0%) | 0 (0.0%) |
| Finance & Insurance | 7 (41.2%) | 10 (58.8%) |
| Real Estate, Rental & Leasing | 16 (55.2%) | 13 (44.8%) |
| Professional & Scientific | 12 (37.5%) | 20 (62.5%) |
| Enterprise Management | 0 (0.0%) | 0 (0.0%) |
| Administrative & Support | 15 (65.2%) | 8 (34.8%) |
| Educational Services | 6 (18.8%) | 26 (81.2%) |
| Health Care & Social Assistance | 36 (85.7%) | 6 (14.3%) |
| Arts, Entertainment & Recreation | 0 (0.0%) | 0 (0.0%) |
| Accommodation & Food Services | 9 (69.2%) | 4 (30.8%) |
| Public Administration | 11 (68.8%) | 5 (31.2%) |
| Total | 147 (56.5%) | 113 (43.5%) |
Education in Irvington
School Enrollment in Irvington
The most common levels of schooling among the 65 students in Irvington are elementary school (21 | 32.3%), middle school (14 | 21.5%), and high school (12 | 18.5%).
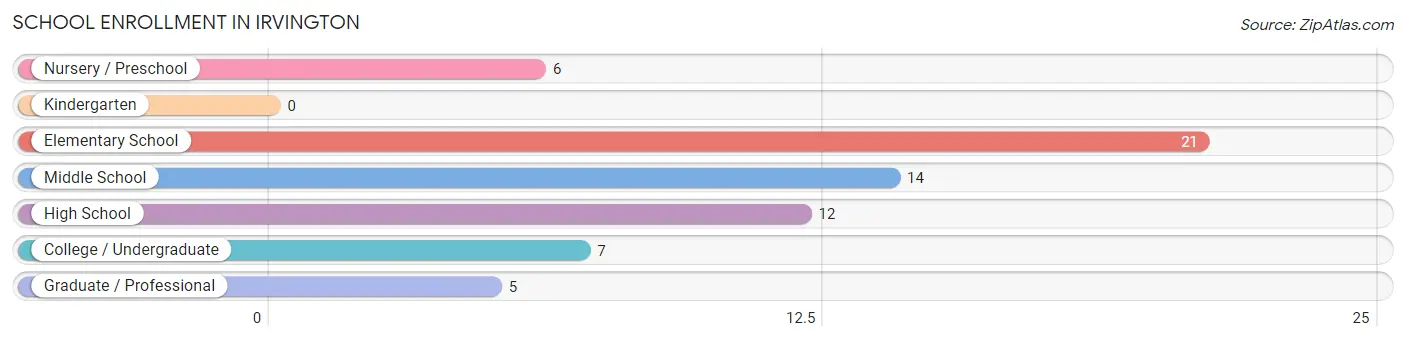
| School Level | # Students | % Students |
| Nursery / Preschool | 6 | 9.2% |
| Kindergarten | 0 | 0.0% |
| Elementary School | 21 | 32.3% |
| Middle School | 14 | 21.5% |
| High School | 12 | 18.5% |
| College / Undergraduate | 7 | 10.8% |
| Graduate / Professional | 5 | 7.7% |
| Total | 65 | 100.0% |
School Enrollment by Age by Funding Source in Irvington
Out of a total of 65 students who are enrolled in schools in Irvington, 29 (44.6%) attend a private institution, while the remaining 36 (55.4%) are enrolled in public schools. The age group of 18 to 19 year olds has the highest likelihood of being enrolled in private schools, with 5 (100.0% in the age bracket) enrolled. Conversely, the age group of 10 to 14 year olds has the lowest likelihood of being enrolled in a private school, with 10 (71.4% in the age bracket) attending a public institution.
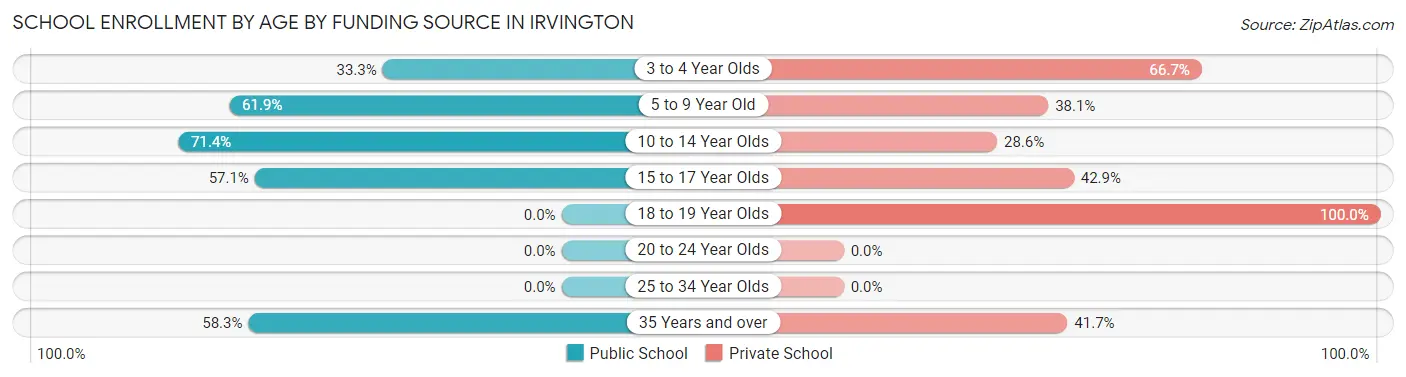
| Age Bracket | Public School | Private School |
| 3 to 4 Year Olds | 2 (33.3%) | 4 (66.7%) |
| 5 to 9 Year Old | 13 (61.9%) | 8 (38.1%) |
| 10 to 14 Year Olds | 10 (71.4%) | 4 (28.6%) |
| 15 to 17 Year Olds | 4 (57.1%) | 3 (42.9%) |
| 18 to 19 Year Olds | 0 (0.0%) | 5 (100.0%) |
| 20 to 24 Year Olds | 0 (0.0%) | 0 (0.0%) |
| 25 to 34 Year Olds | 0 (0.0%) | 0 (0.0%) |
| 35 Years and over | 7 (58.3%) | 5 (41.7%) |
| Total | 36 (55.4%) | 29 (44.6%) |
Educational Attainment by Field of Study in Irvington
Social sciences (58 | 19.1%), business (41 | 13.5%), bio, nature & agricultural (30 | 9.9%), science & technology (28 | 9.2%), and education (27 | 8.9%) are the most common fields of study among 304 individuals in Irvington who have obtained a bachelor's degree or higher.
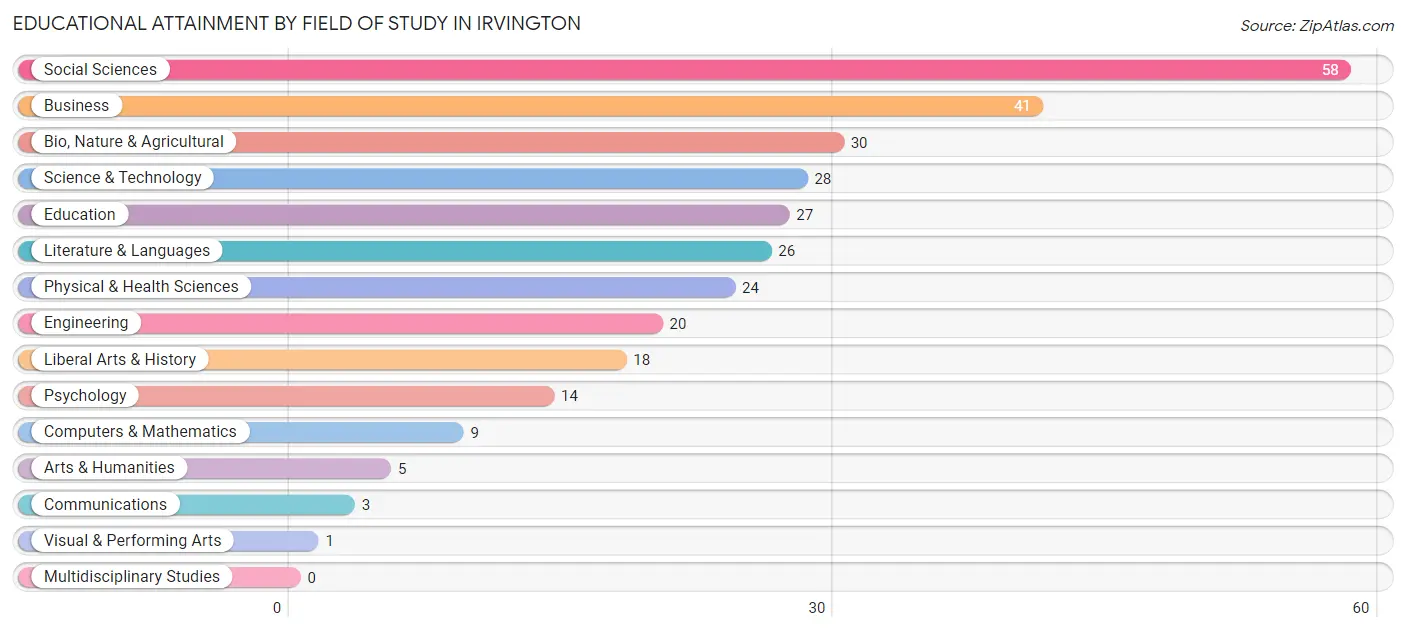
| Field of Study | # Graduates | % Graduates |
| Computers & Mathematics | 9 | 3.0% |
| Bio, Nature & Agricultural | 30 | 9.9% |
| Physical & Health Sciences | 24 | 7.9% |
| Psychology | 14 | 4.6% |
| Social Sciences | 58 | 19.1% |
| Engineering | 20 | 6.6% |
| Multidisciplinary Studies | 0 | 0.0% |
| Science & Technology | 28 | 9.2% |
| Business | 41 | 13.5% |
| Education | 27 | 8.9% |
| Literature & Languages | 26 | 8.6% |
| Liberal Arts & History | 18 | 5.9% |
| Visual & Performing Arts | 1 | 0.3% |
| Communications | 3 | 1.0% |
| Arts & Humanities | 5 | 1.6% |
| Total | 304 | 100.0% |
Transportation & Commute in Irvington
Vehicle Availability by Sex in Irvington
The most prevalent vehicle ownership categories in Irvington are males with 2 vehicles (74, accounting for 50.3%) and females with 2 vehicles (41, making up 65.5%).
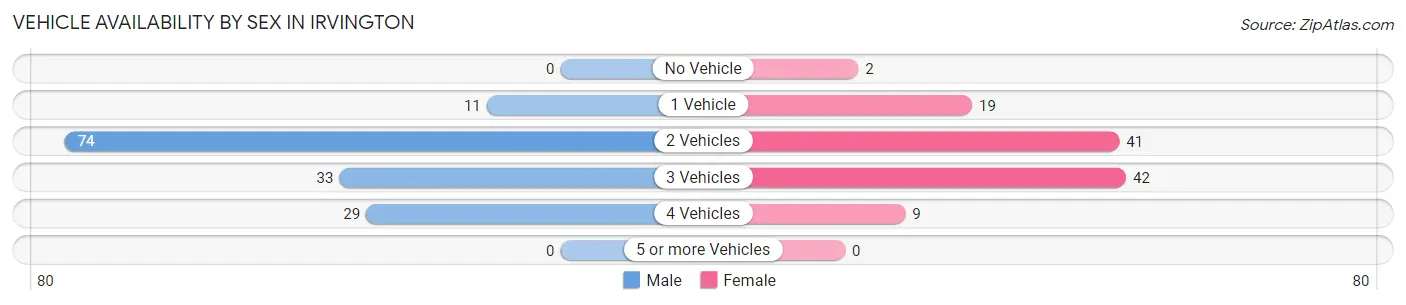
| Vehicles Available | Male | Female |
| No Vehicle | 0 (0.0%) | 2 (1.8%) |
| 1 Vehicle | 11 (7.5%) | 19 (16.8%) |
| 2 Vehicles | 74 (50.3%) | 41 (36.3%) |
| 3 Vehicles | 33 (22.5%) | 42 (37.2%) |
| 4 Vehicles | 29 (19.7%) | 9 (8.0%) |
| 5 or more Vehicles | 0 (0.0%) | 0 (0.0%) |
| Total | 147 (100.0%) | 113 (100.0%) |
Commute Time in Irvington
The most frequently occuring commute durations in Irvington are 5 to 9 minutes (47 commuters, 20.9%), less than 5 minutes (31 commuters, 13.8%), and 45 to 59 minutes (27 commuters, 12.0%).
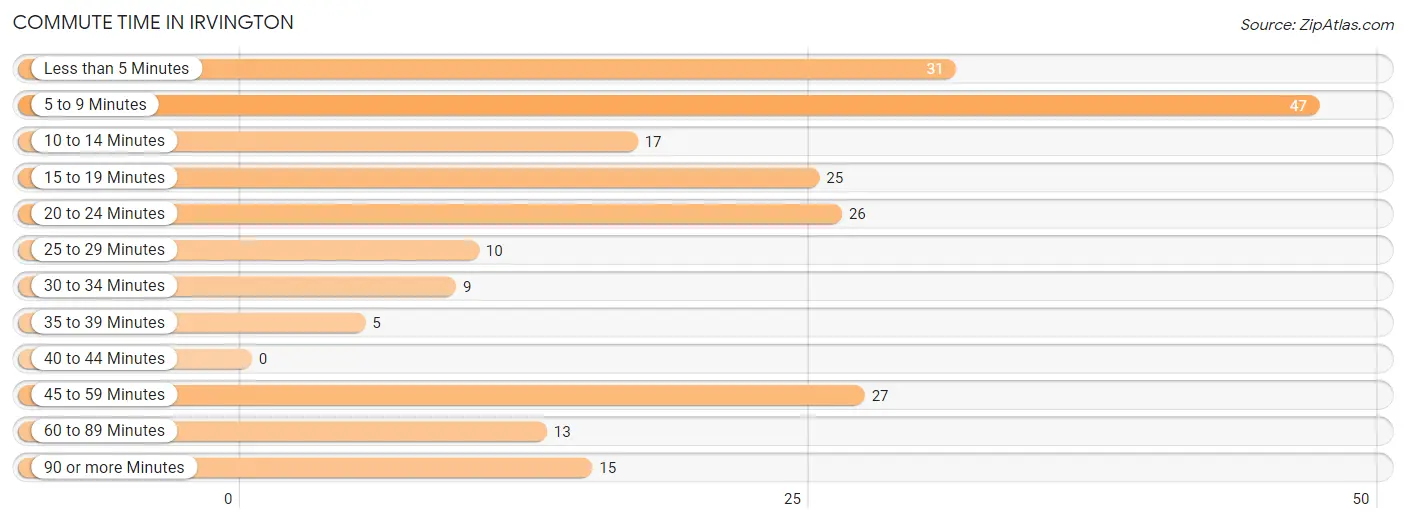
| Commute Time | # Commuters | % Commuters |
| Less than 5 Minutes | 31 | 13.8% |
| 5 to 9 Minutes | 47 | 20.9% |
| 10 to 14 Minutes | 17 | 7.6% |
| 15 to 19 Minutes | 25 | 11.1% |
| 20 to 24 Minutes | 26 | 11.6% |
| 25 to 29 Minutes | 10 | 4.4% |
| 30 to 34 Minutes | 9 | 4.0% |
| 35 to 39 Minutes | 5 | 2.2% |
| 40 to 44 Minutes | 0 | 0.0% |
| 45 to 59 Minutes | 27 | 12.0% |
| 60 to 89 Minutes | 13 | 5.8% |
| 90 or more Minutes | 15 | 6.7% |
Commute Time by Sex in Irvington
The most common commute times in Irvington are 5 to 9 minutes (32 commuters, 24.6%) for males and 15 to 19 minutes (16 commuters, 16.8%) for females.
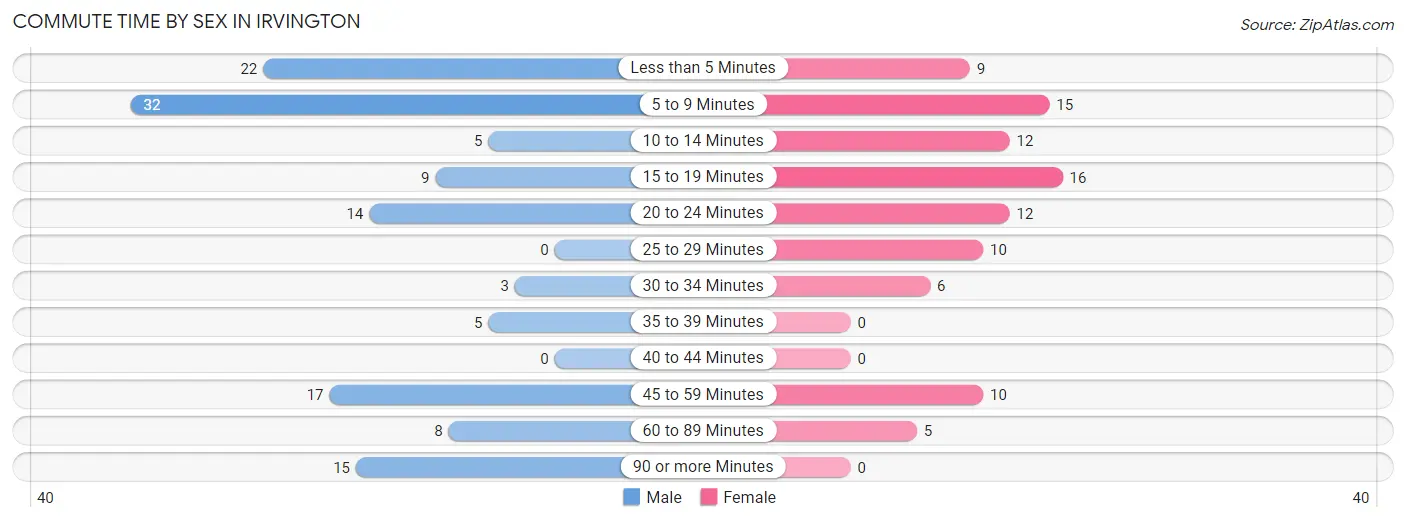
| Commute Time | Male | Female |
| Less than 5 Minutes | 22 (16.9%) | 9 (9.5%) |
| 5 to 9 Minutes | 32 (24.6%) | 15 (15.8%) |
| 10 to 14 Minutes | 5 (3.8%) | 12 (12.6%) |
| 15 to 19 Minutes | 9 (6.9%) | 16 (16.8%) |
| 20 to 24 Minutes | 14 (10.8%) | 12 (12.6%) |
| 25 to 29 Minutes | 0 (0.0%) | 10 (10.5%) |
| 30 to 34 Minutes | 3 (2.3%) | 6 (6.3%) |
| 35 to 39 Minutes | 5 (3.8%) | 0 (0.0%) |
| 40 to 44 Minutes | 0 (0.0%) | 0 (0.0%) |
| 45 to 59 Minutes | 17 (13.1%) | 10 (10.5%) |
| 60 to 89 Minutes | 8 (6.1%) | 5 (5.3%) |
| 90 or more Minutes | 15 (11.5%) | 0 (0.0%) |
Time of Departure to Work by Sex in Irvington
The most frequent times of departure to work in Irvington are 8:00 AM to 8:29 AM (52, 40.0%) for males and 7:00 AM to 7:29 AM (23, 24.2%) for females.
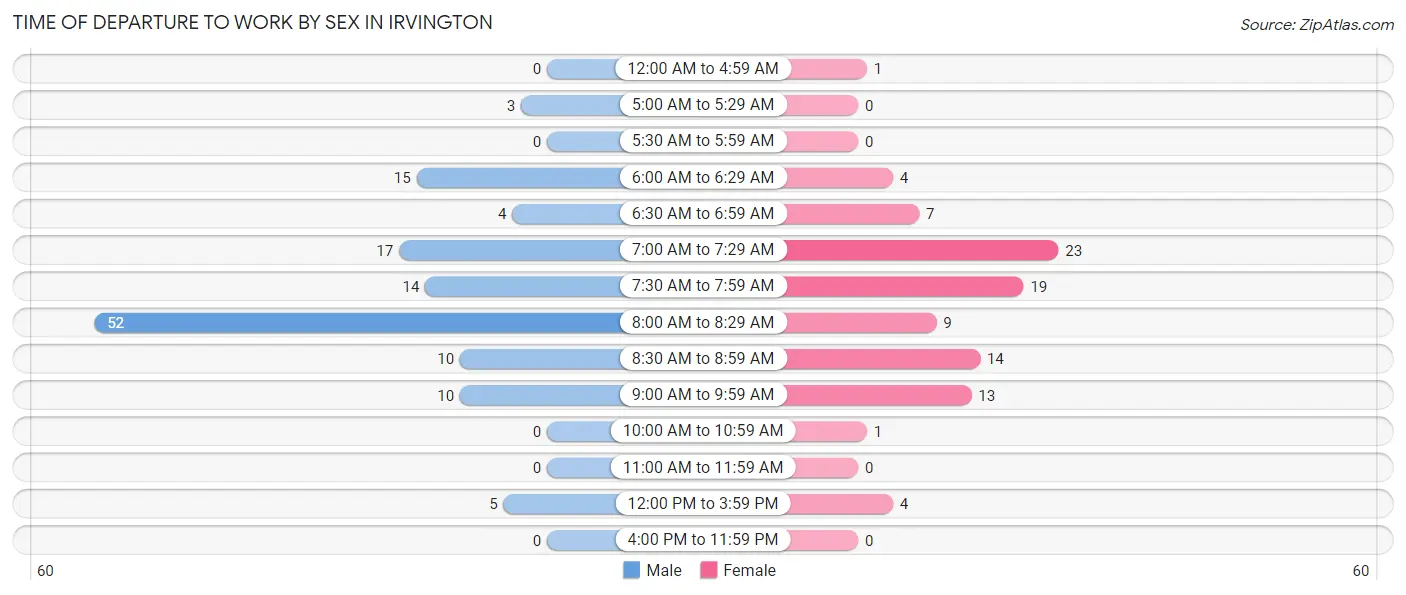
| Time of Departure | Male | Female |
| 12:00 AM to 4:59 AM | 0 (0.0%) | 1 (1.1%) |
| 5:00 AM to 5:29 AM | 3 (2.3%) | 0 (0.0%) |
| 5:30 AM to 5:59 AM | 0 (0.0%) | 0 (0.0%) |
| 6:00 AM to 6:29 AM | 15 (11.5%) | 4 (4.2%) |
| 6:30 AM to 6:59 AM | 4 (3.1%) | 7 (7.4%) |
| 7:00 AM to 7:29 AM | 17 (13.1%) | 23 (24.2%) |
| 7:30 AM to 7:59 AM | 14 (10.8%) | 19 (20.0%) |
| 8:00 AM to 8:29 AM | 52 (40.0%) | 9 (9.5%) |
| 8:30 AM to 8:59 AM | 10 (7.7%) | 14 (14.7%) |
| 9:00 AM to 9:59 AM | 10 (7.7%) | 13 (13.7%) |
| 10:00 AM to 10:59 AM | 0 (0.0%) | 1 (1.1%) |
| 11:00 AM to 11:59 AM | 0 (0.0%) | 0 (0.0%) |
| 12:00 PM to 3:59 PM | 5 (3.8%) | 4 (4.2%) |
| 4:00 PM to 11:59 PM | 0 (0.0%) | 0 (0.0%) |
| Total | 130 (100.0%) | 95 (100.0%) |
Housing Occupancy in Irvington
Occupancy by Ownership in Irvington
Of the total 260 dwellings in Irvington, owner-occupied units account for 232 (89.2%), while renter-occupied units make up 28 (10.8%).
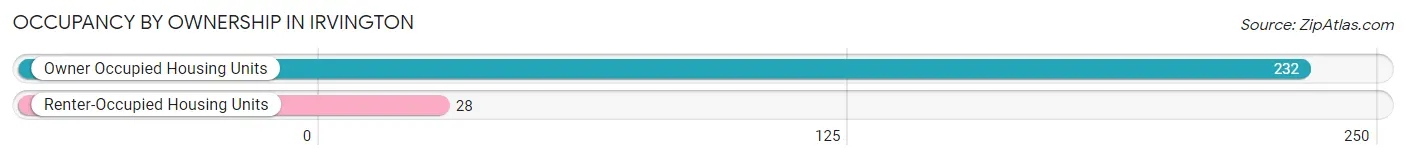
| Occupancy | # Housing Units | % Housing Units |
| Owner Occupied Housing Units | 232 | 89.2% |
| Renter-Occupied Housing Units | 28 | 10.8% |
| Total Occupied Housing Units | 260 | 100.0% |
Occupancy by Household Size in Irvington
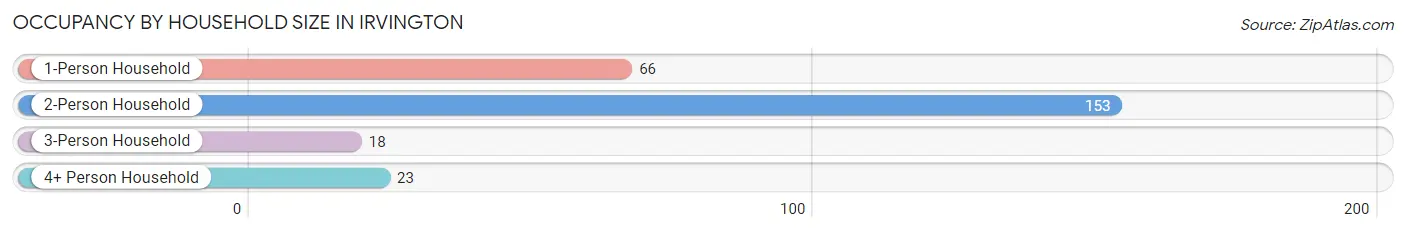
| Household Size | # Housing Units | % Housing Units |
| 1-Person Household | 66 | 25.4% |
| 2-Person Household | 153 | 58.9% |
| 3-Person Household | 18 | 6.9% |
| 4+ Person Household | 23 | 8.8% |
| Total Housing Units | 260 | 100.0% |
Occupancy by Ownership by Household Size in Irvington
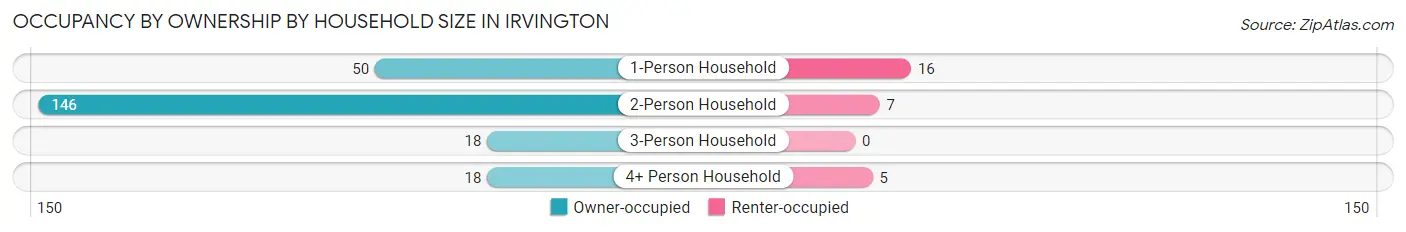
| Household Size | Owner-occupied | Renter-occupied |
| 1-Person Household | 50 (75.8%) | 16 (24.2%) |
| 2-Person Household | 146 (95.4%) | 7 (4.6%) |
| 3-Person Household | 18 (100.0%) | 0 (0.0%) |
| 4+ Person Household | 18 (78.3%) | 5 (21.7%) |
| Total Housing Units | 232 (89.2%) | 28 (10.8%) |
Occupancy by Educational Attainment in Irvington
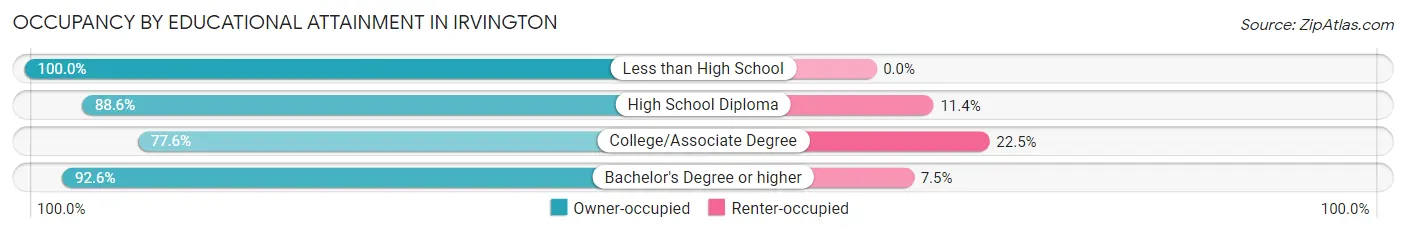
| Household Size | Owner-occupied | Renter-occupied |
| Less than High School | 6 (100.0%) | 0 (0.0%) |
| High School Diploma | 39 (88.6%) | 5 (11.4%) |
| College/Associate Degree | 38 (77.5%) | 11 (22.5%) |
| Bachelor's Degree or higher | 149 (92.5%) | 12 (7.4%) |
Occupancy by Age of Householder in Irvington
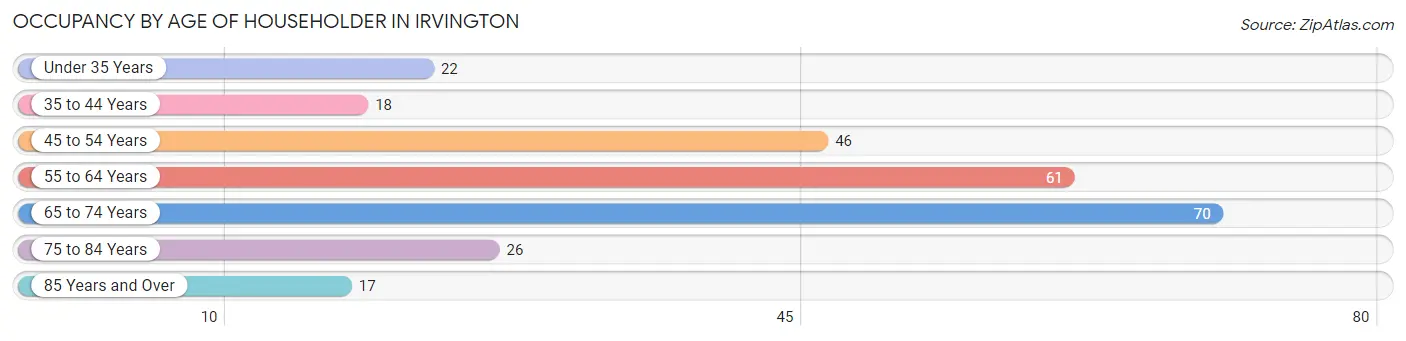
| Age Bracket | # Households | % Households |
| Under 35 Years | 22 | 8.5% |
| 35 to 44 Years | 18 | 6.9% |
| 45 to 54 Years | 46 | 17.7% |
| 55 to 64 Years | 61 | 23.5% |
| 65 to 74 Years | 70 | 26.9% |
| 75 to 84 Years | 26 | 10.0% |
| 85 Years and Over | 17 | 6.5% |
| Total | 260 | 100.0% |
Housing Finances in Irvington
Median Income by Occupancy in Irvington
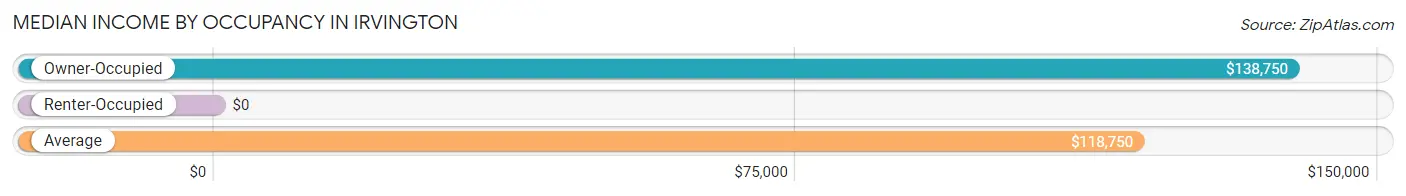
| Occupancy Type | # Households | Median Income |
| Owner-Occupied | 232 (89.2%) | $138,750 |
| Renter-Occupied | 28 (10.8%) | $0 |
| Average | 260 (100.0%) | $118,750 |
Occupancy by Householder Income Bracket in Irvington
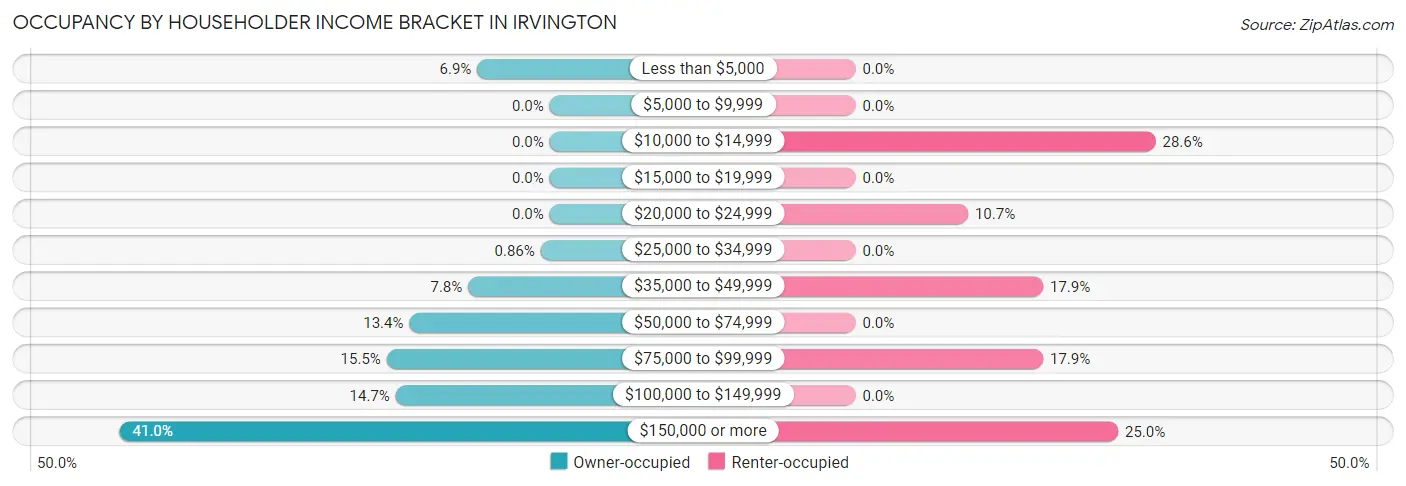
| Income Bracket | Owner-occupied | Renter-occupied |
| Less than $5,000 | 16 (6.9%) | 0 (0.0%) |
| $5,000 to $9,999 | 0 (0.0%) | 0 (0.0%) |
| $10,000 to $14,999 | 0 (0.0%) | 8 (28.6%) |
| $15,000 to $19,999 | 0 (0.0%) | 0 (0.0%) |
| $20,000 to $24,999 | 0 (0.0%) | 3 (10.7%) |
| $25,000 to $34,999 | 2 (0.9%) | 0 (0.0%) |
| $35,000 to $49,999 | 18 (7.8%) | 5 (17.9%) |
| $50,000 to $74,999 | 31 (13.4%) | 0 (0.0%) |
| $75,000 to $99,999 | 36 (15.5%) | 5 (17.9%) |
| $100,000 to $149,999 | 34 (14.7%) | 0 (0.0%) |
| $150,000 or more | 95 (40.9%) | 7 (25.0%) |
| Total | 232 (100.0%) | 28 (100.0%) |
Monthly Housing Cost Tiers in Irvington
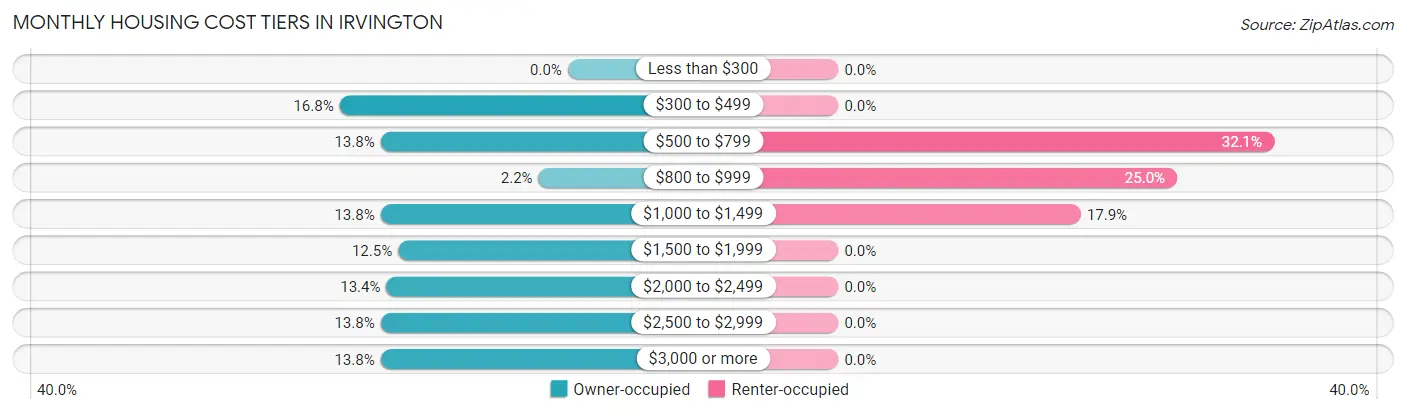
| Monthly Cost | Owner-occupied | Renter-occupied |
| Less than $300 | 0 (0.0%) | 0 (0.0%) |
| $300 to $499 | 39 (16.8%) | 0 (0.0%) |
| $500 to $799 | 32 (13.8%) | 9 (32.1%) |
| $800 to $999 | 5 (2.2%) | 7 (25.0%) |
| $1,000 to $1,499 | 32 (13.8%) | 5 (17.9%) |
| $1,500 to $1,999 | 29 (12.5%) | 0 (0.0%) |
| $2,000 to $2,499 | 31 (13.4%) | 0 (0.0%) |
| $2,500 to $2,999 | 32 (13.8%) | 0 (0.0%) |
| $3,000 or more | 32 (13.8%) | 0 (0.0%) |
| Total | 232 (100.0%) | 28 (100.0%) |
Physical Housing Characteristics in Irvington
Housing Structures in Irvington
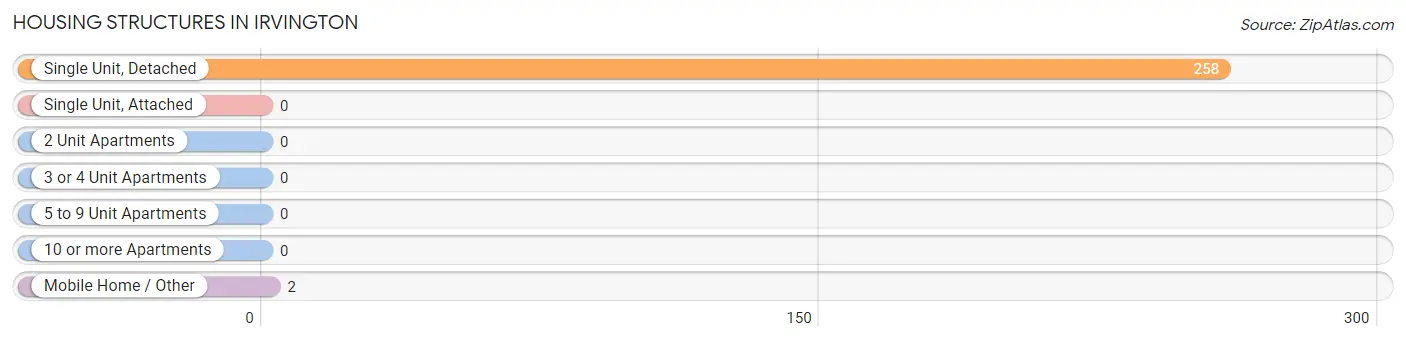
| Structure Type | # Housing Units | % Housing Units |
| Single Unit, Detached | 258 | 99.2% |
| Single Unit, Attached | 0 | 0.0% |
| 2 Unit Apartments | 0 | 0.0% |
| 3 or 4 Unit Apartments | 0 | 0.0% |
| 5 to 9 Unit Apartments | 0 | 0.0% |
| 10 or more Apartments | 0 | 0.0% |
| Mobile Home / Other | 2 | 0.8% |
| Total | 260 | 100.0% |
Housing Structures by Occupancy in Irvington
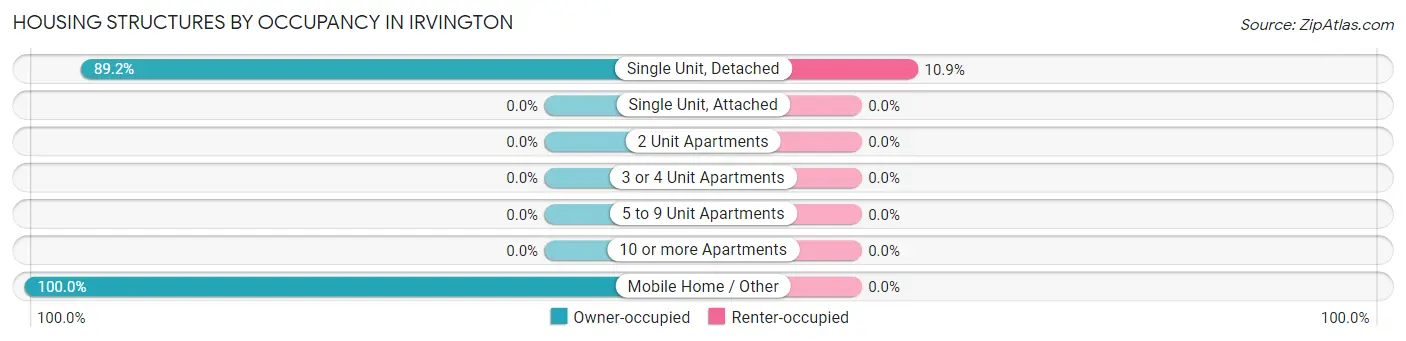
| Structure Type | Owner-occupied | Renter-occupied |
| Single Unit, Detached | 230 (89.1%) | 28 (10.8%) |
| Single Unit, Attached | 0 (0.0%) | 0 (0.0%) |
| 2 Unit Apartments | 0 (0.0%) | 0 (0.0%) |
| 3 or 4 Unit Apartments | 0 (0.0%) | 0 (0.0%) |
| 5 to 9 Unit Apartments | 0 (0.0%) | 0 (0.0%) |
| 10 or more Apartments | 0 (0.0%) | 0 (0.0%) |
| Mobile Home / Other | 2 (100.0%) | 0 (0.0%) |
| Total | 232 (89.2%) | 28 (10.8%) |
Housing Structures by Number of Rooms in Irvington
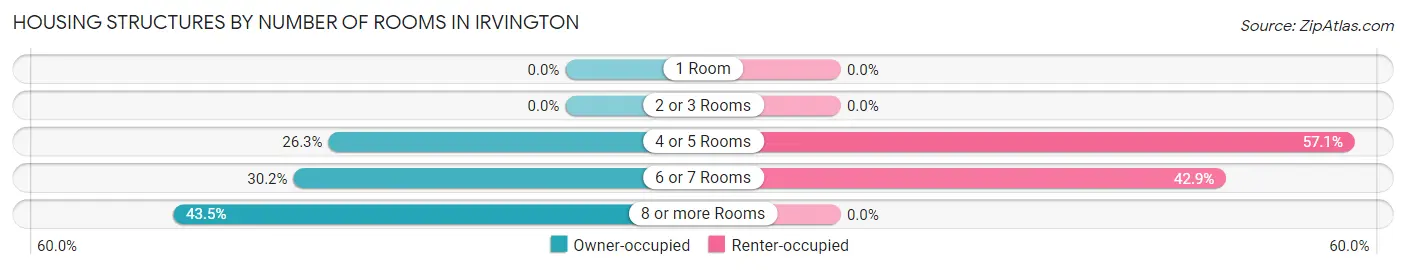
| Number of Rooms | Owner-occupied | Renter-occupied |
| 1 Room | 0 (0.0%) | 0 (0.0%) |
| 2 or 3 Rooms | 0 (0.0%) | 0 (0.0%) |
| 4 or 5 Rooms | 61 (26.3%) | 16 (57.1%) |
| 6 or 7 Rooms | 70 (30.2%) | 12 (42.9%) |
| 8 or more Rooms | 101 (43.5%) | 0 (0.0%) |
| Total | 232 (100.0%) | 28 (100.0%) |
Housing Structure by Heating Type in Irvington
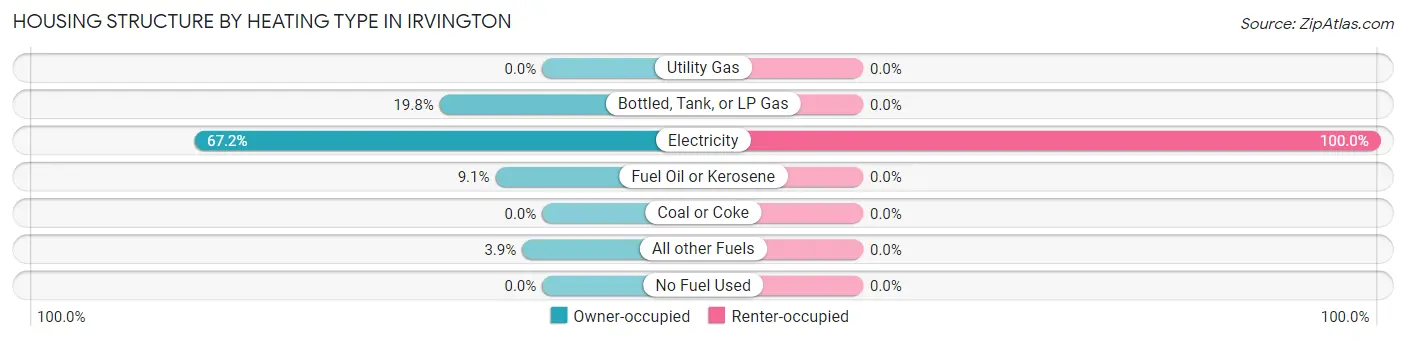
| Heating Type | Owner-occupied | Renter-occupied |
| Utility Gas | 0 (0.0%) | 0 (0.0%) |
| Bottled, Tank, or LP Gas | 46 (19.8%) | 0 (0.0%) |
| Electricity | 156 (67.2%) | 28 (100.0%) |
| Fuel Oil or Kerosene | 21 (9.0%) | 0 (0.0%) |
| Coal or Coke | 0 (0.0%) | 0 (0.0%) |
| All other Fuels | 9 (3.9%) | 0 (0.0%) |
| No Fuel Used | 0 (0.0%) | 0 (0.0%) |
| Total | 232 (100.0%) | 28 (100.0%) |
Household Vehicle Usage in Irvington
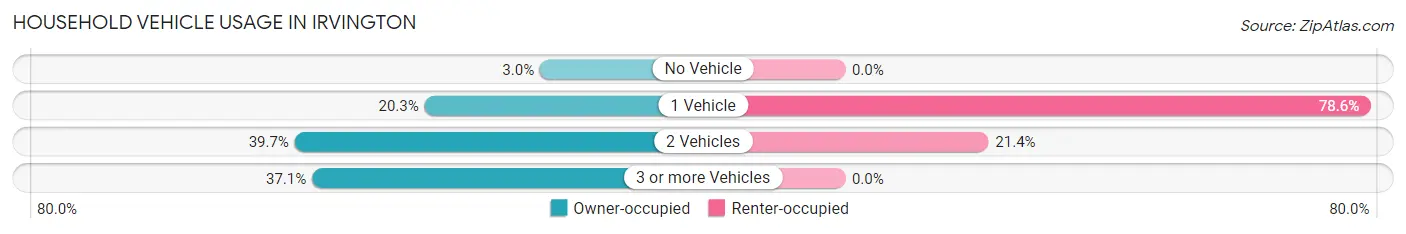
| Vehicles per Household | Owner-occupied | Renter-occupied |
| No Vehicle | 7 (3.0%) | 0 (0.0%) |
| 1 Vehicle | 47 (20.3%) | 22 (78.6%) |
| 2 Vehicles | 92 (39.7%) | 6 (21.4%) |
| 3 or more Vehicles | 86 (37.1%) | 0 (0.0%) |
| Total | 232 (100.0%) | 28 (100.0%) |
Real Estate & Mortgages in Irvington
Real Estate and Mortgage Overview in Irvington
| Characteristic | Without Mortgage | With Mortgage |
| Housing Units | 60 | 172 |
| Median Property Value | $300,000 | $339,400 |
| Median Household Income | $59,643 | $87 |
| Monthly Housing Costs | $564 | $32 |
| Real Estate Taxes | $1,400 | $0 |
Property Value by Mortgage Status in Irvington
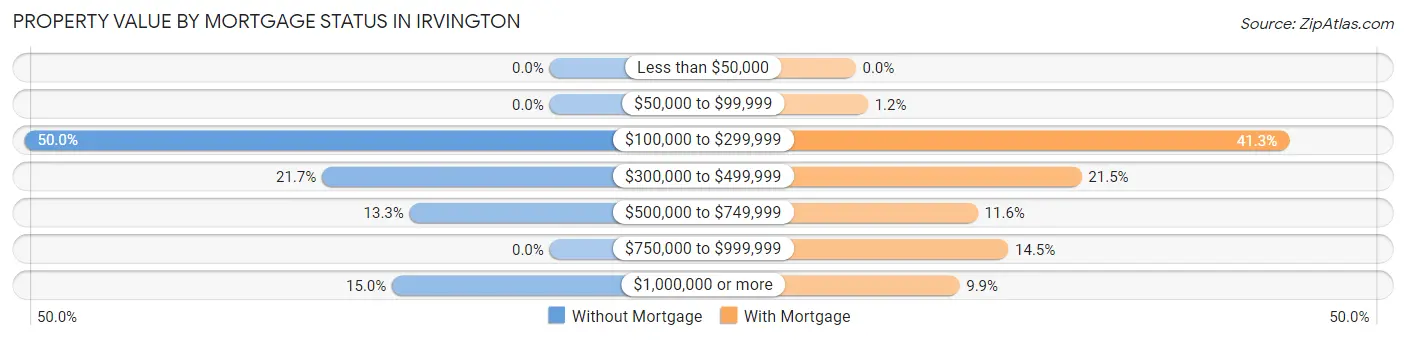
| Property Value | Without Mortgage | With Mortgage |
| Less than $50,000 | 0 (0.0%) | 0 (0.0%) |
| $50,000 to $99,999 | 0 (0.0%) | 2 (1.2%) |
| $100,000 to $299,999 | 30 (50.0%) | 71 (41.3%) |
| $300,000 to $499,999 | 13 (21.7%) | 37 (21.5%) |
| $500,000 to $749,999 | 8 (13.3%) | 20 (11.6%) |
| $750,000 to $999,999 | 0 (0.0%) | 25 (14.5%) |
| $1,000,000 or more | 9 (15.0%) | 17 (9.9%) |
| Total | 60 (100.0%) | 172 (100.0%) |
Household Income by Mortgage Status in Irvington
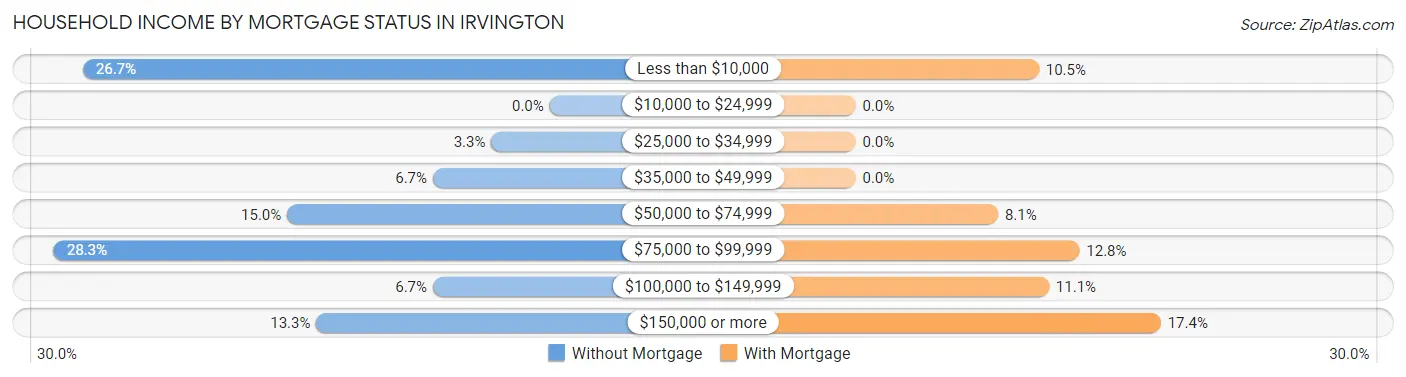
| Household Income | Without Mortgage | With Mortgage |
| Less than $10,000 | 16 (26.7%) | 18 (10.5%) |
| $10,000 to $24,999 | 0 (0.0%) | 0 (0.0%) |
| $25,000 to $34,999 | 2 (3.3%) | 0 (0.0%) |
| $35,000 to $49,999 | 4 (6.7%) | 0 (0.0%) |
| $50,000 to $74,999 | 9 (15.0%) | 14 (8.1%) |
| $75,000 to $99,999 | 17 (28.3%) | 22 (12.8%) |
| $100,000 to $149,999 | 4 (6.7%) | 19 (11.1%) |
| $150,000 or more | 8 (13.3%) | 30 (17.4%) |
| Total | 60 (100.0%) | 172 (100.0%) |
Property Value to Household Income Ratio in Irvington
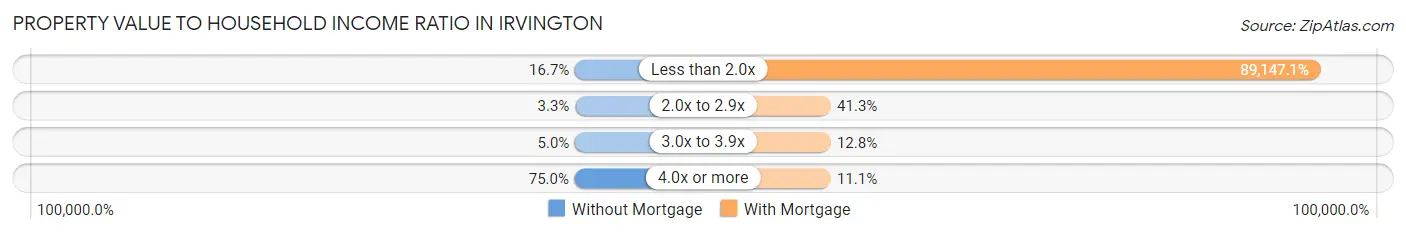
| Value-to-Income Ratio | Without Mortgage | With Mortgage |
| Less than 2.0x | 10 (16.7%) | 153,333 (89,147.1%) |
| 2.0x to 2.9x | 2 (3.3%) | 71 (41.3%) |
| 3.0x to 3.9x | 3 (5.0%) | 22 (12.8%) |
| 4.0x or more | 45 (75.0%) | 19 (11.1%) |
| Total | 60 (100.0%) | 172 (100.0%) |
Real Estate Taxes by Mortgage Status in Irvington
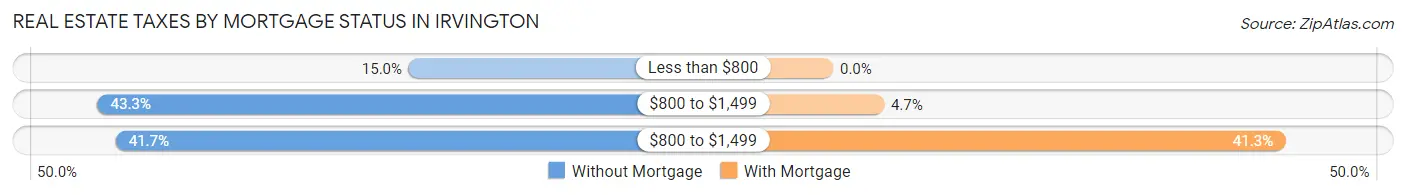
| Property Taxes | Without Mortgage | With Mortgage |
| Less than $800 | 9 (15.0%) | 0 (0.0%) |
| $800 to $1,499 | 26 (43.3%) | 8 (4.6%) |
| $800 to $1,499 | 25 (41.7%) | 71 (41.3%) |
| Total | 60 (100.0%) | 172 (100.0%) |
Health & Disability in Irvington
Health Insurance Coverage by Age in Irvington
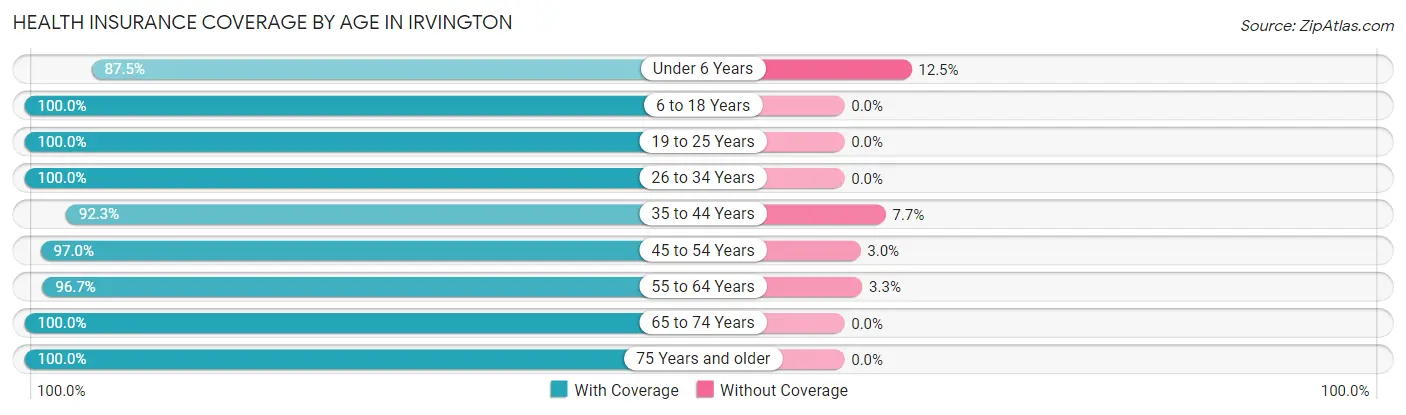
| Age Bracket | With Coverage | Without Coverage |
| Under 6 Years | 14 (87.5%) | 2 (12.5%) |
| 6 to 18 Years | 47 (100.0%) | 0 (0.0%) |
| 19 to 25 Years | 34 (100.0%) | 0 (0.0%) |
| 26 to 34 Years | 25 (100.0%) | 0 (0.0%) |
| 35 to 44 Years | 24 (92.3%) | 2 (7.7%) |
| 45 to 54 Years | 65 (97.0%) | 2 (3.0%) |
| 55 to 64 Years | 116 (96.7%) | 4 (3.3%) |
| 65 to 74 Years | 130 (100.0%) | 0 (0.0%) |
| 75 Years and older | 54 (100.0%) | 0 (0.0%) |
| Total | 509 (98.1%) | 10 (1.9%) |
Health Insurance Coverage by Citizenship Status in Irvington
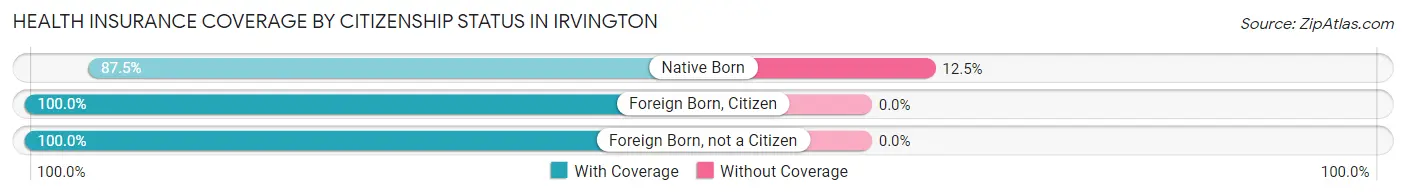
| Citizenship Status | With Coverage | Without Coverage |
| Native Born | 14 (87.5%) | 2 (12.5%) |
| Foreign Born, Citizen | 47 (100.0%) | 0 (0.0%) |
| Foreign Born, not a Citizen | 34 (100.0%) | 0 (0.0%) |
Health Insurance Coverage by Household Income in Irvington
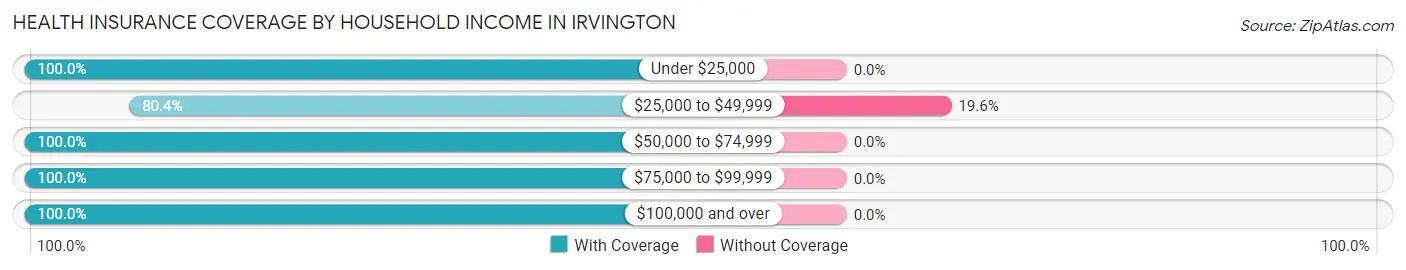
| Household Income | With Coverage | Without Coverage |
| Under $25,000 | 27 (100.0%) | 0 (0.0%) |
| $25,000 to $49,999 | 41 (80.4%) | 10 (19.6%) |
| $50,000 to $74,999 | 55 (100.0%) | 0 (0.0%) |
| $75,000 to $99,999 | 99 (100.0%) | 0 (0.0%) |
| $100,000 and over | 287 (100.0%) | 0 (0.0%) |
Public vs Private Health Insurance Coverage by Age in Irvington

| Age Bracket | Public Insurance | Private Insurance |
| Under 6 | 0 (0.0%) | 14 (87.5%) |
| 6 to 18 Years | 0 (0.0%) | 47 (100.0%) |
| 19 to 25 Years | 0 (0.0%) | 34 (100.0%) |
| 25 to 34 Years | 4 (16.0%) | 21 (84.0%) |
| 35 to 44 Years | 0 (0.0%) | 24 (92.3%) |
| 45 to 54 Years | 0 (0.0%) | 65 (97.0%) |
| 55 to 64 Years | 4 (3.3%) | 114 (95.0%) |
| 65 to 74 Years | 125 (96.2%) | 71 (54.6%) |
| 75 Years and over | 54 (100.0%) | 48 (88.9%) |
| Total | 187 (36.0%) | 438 (84.4%) |
Disability Status by Sex by Age in Irvington
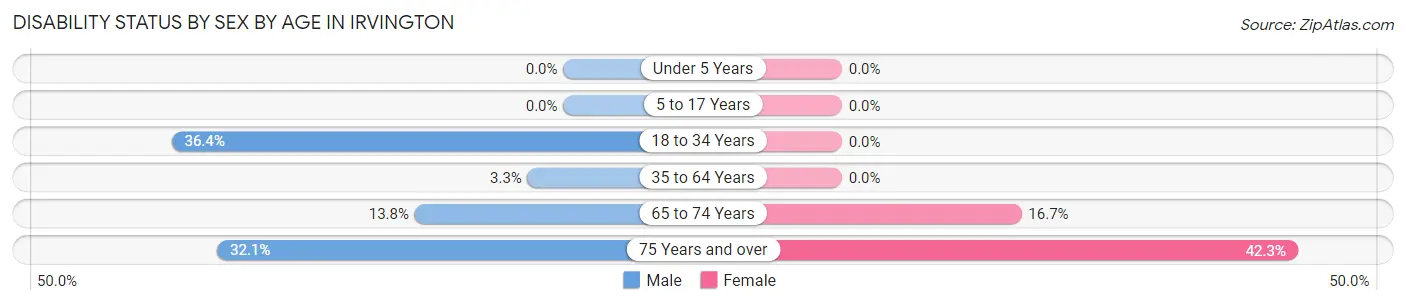
| Age Bracket | Male | Female |
| Under 5 Years | 0 (0.0%) | 0 (0.0%) |
| 5 to 17 Years | 0 (0.0%) | 0 (0.0%) |
| 18 to 34 Years | 12 (36.4%) | 0 (0.0%) |
| 35 to 64 Years | 4 (3.3%) | 0 (0.0%) |
| 65 to 74 Years | 8 (13.8%) | 12 (16.7%) |
| 75 Years and over | 9 (32.1%) | 11 (42.3%) |
Disability Class by Sex by Age in Irvington
Disability Class: Hearing Difficulty
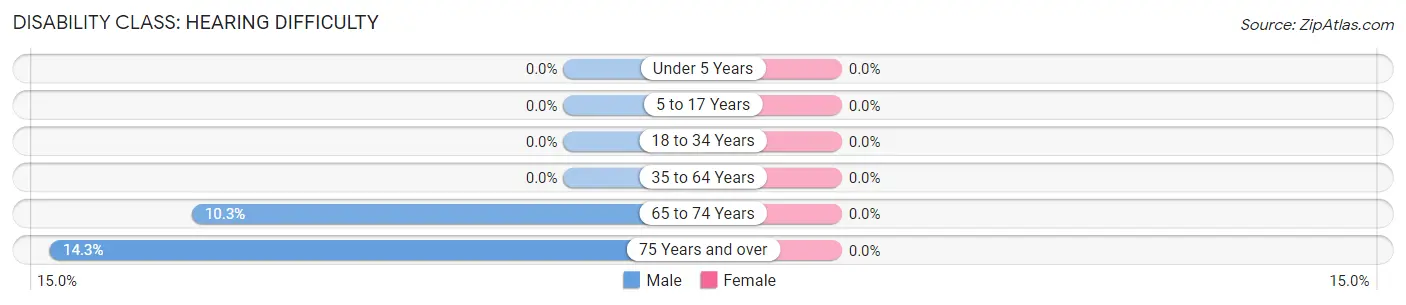
| Age Bracket | Male | Female |
| Under 5 Years | 0 (0.0%) | 0 (0.0%) |
| 5 to 17 Years | 0 (0.0%) | 0 (0.0%) |
| 18 to 34 Years | 0 (0.0%) | 0 (0.0%) |
| 35 to 64 Years | 0 (0.0%) | 0 (0.0%) |
| 65 to 74 Years | 6 (10.3%) | 0 (0.0%) |
| 75 Years and over | 4 (14.3%) | 0 (0.0%) |
Disability Class: Vision Difficulty
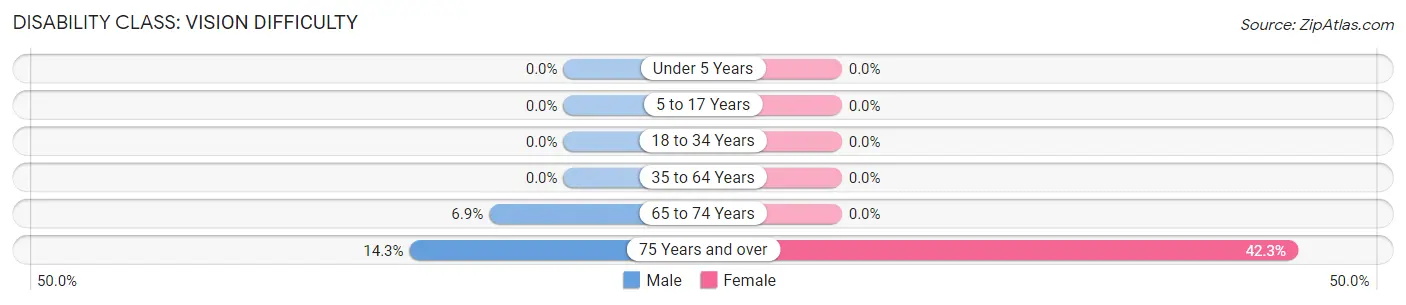
| Age Bracket | Male | Female |
| Under 5 Years | 0 (0.0%) | 0 (0.0%) |
| 5 to 17 Years | 0 (0.0%) | 0 (0.0%) |
| 18 to 34 Years | 0 (0.0%) | 0 (0.0%) |
| 35 to 64 Years | 0 (0.0%) | 0 (0.0%) |
| 65 to 74 Years | 4 (6.9%) | 0 (0.0%) |
| 75 Years and over | 4 (14.3%) | 11 (42.3%) |
Disability Class: Cognitive Difficulty
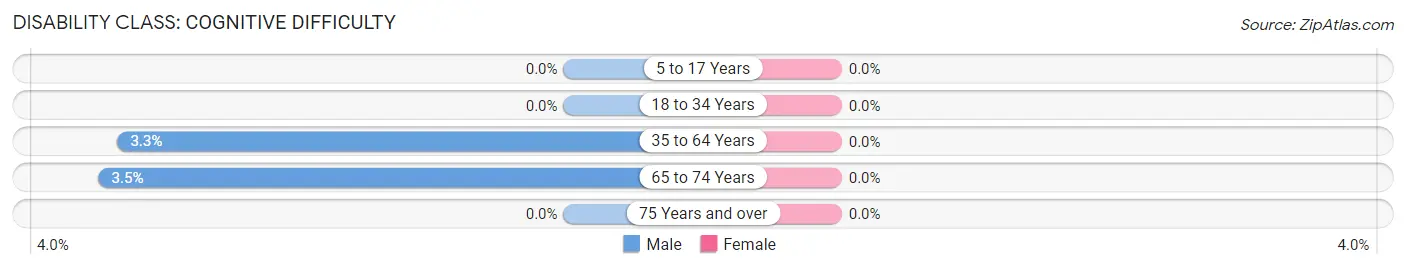
| Age Bracket | Male | Female |
| 5 to 17 Years | 0 (0.0%) | 0 (0.0%) |
| 18 to 34 Years | 0 (0.0%) | 0 (0.0%) |
| 35 to 64 Years | 4 (3.3%) | 0 (0.0%) |
| 65 to 74 Years | 2 (3.5%) | 0 (0.0%) |
| 75 Years and over | 0 (0.0%) | 0 (0.0%) |
Disability Class: Ambulatory Difficulty
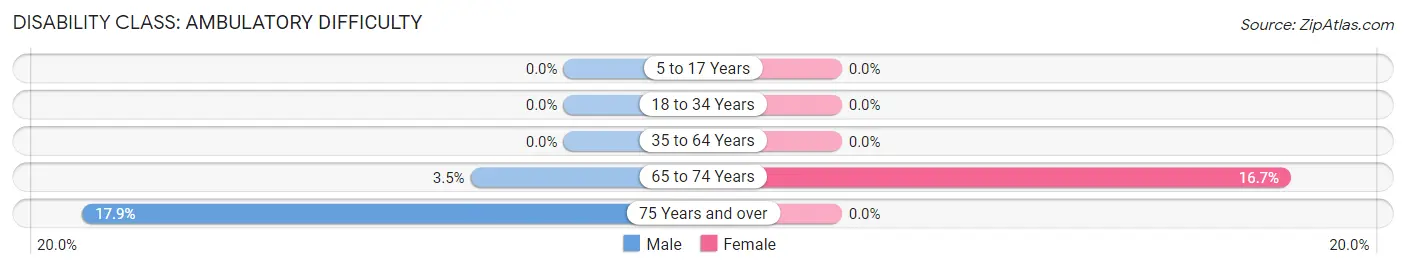
| Age Bracket | Male | Female |
| 5 to 17 Years | 0 (0.0%) | 0 (0.0%) |
| 18 to 34 Years | 0 (0.0%) | 0 (0.0%) |
| 35 to 64 Years | 0 (0.0%) | 0 (0.0%) |
| 65 to 74 Years | 2 (3.5%) | 12 (16.7%) |
| 75 Years and over | 5 (17.9%) | 0 (0.0%) |
Disability Class: Self-Care Difficulty

| Age Bracket | Male | Female |
| 5 to 17 Years | 0 (0.0%) | 0 (0.0%) |
| 18 to 34 Years | 12 (36.4%) | 0 (0.0%) |
| 35 to 64 Years | 0 (0.0%) | 0 (0.0%) |
| 65 to 74 Years | 0 (0.0%) | 0 (0.0%) |
| 75 Years and over | 0 (0.0%) | 0 (0.0%) |
Technology Access in Irvington
Computing Device Access in Irvington
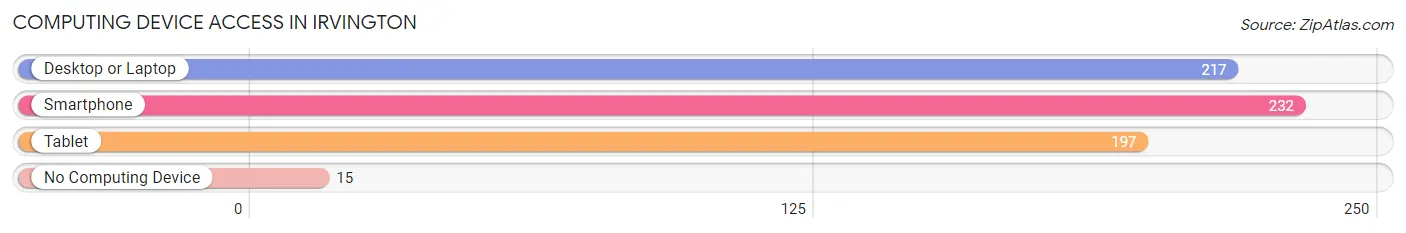
| Device Type | # Households | % Households |
| Desktop or Laptop | 217 | 83.5% |
| Smartphone | 232 | 89.2% |
| Tablet | 197 | 75.8% |
| No Computing Device | 15 | 5.8% |
| Total | 260 | 100.0% |
Internet Access in Irvington
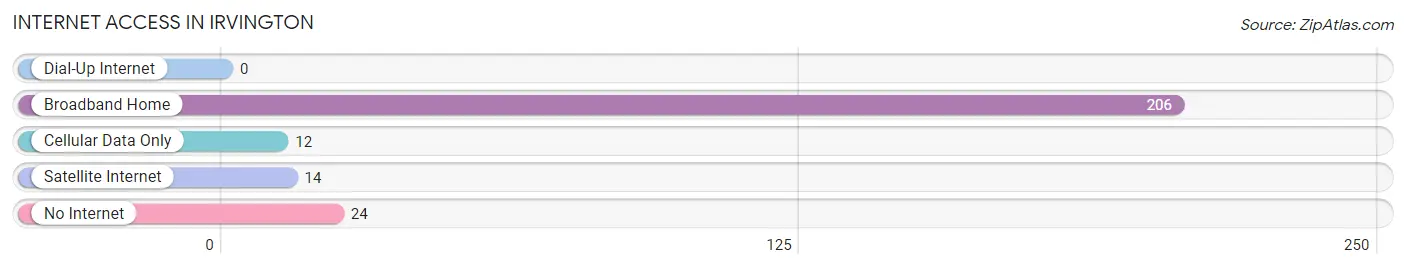
| Internet Type | # Households | % Households |
| Dial-Up Internet | 0 | 0.0% |
| Broadband Home | 206 | 79.2% |
| Cellular Data Only | 12 | 4.6% |
| Satellite Internet | 14 | 5.4% |
| No Internet | 24 | 9.2% |
| Total | 260 | 100.0% |
Irvington Summary
Irvington, Virginia is a small town located in Lancaster County, Virginia. It is situated on the Rappahannock River, approximately 50 miles north of Richmond. The town was founded in 1750 and is named after the famous American author Washington Irving. The town has a population of approximately 1,000 people and is known for its quaint charm and historic buildings.
Geography
Irvington is located in the Northern Neck of Virginia, which is a peninsula between the Potomac and Rappahannock Rivers. The town is situated on the Rappahannock River, which is a major tributary of the Chesapeake Bay. The town is surrounded by lush forests and rolling hills, and is home to a variety of wildlife. The town is also located near the Chesapeake Bay Bridge-Tunnel, which connects the Eastern Shore of Virginia to the mainland.
Economy
The economy of Irvington is largely based on tourism and agriculture. The town is home to several wineries, which attract visitors from all over the country. The town is also home to a variety of small businesses, including restaurants, shops, and galleries. The town is also home to a number of historic sites, including the Irvington Historic District, which is listed on the National Register of Historic Places.
Demographics
As of the 2010 census, Irvington had a population of 1,000 people. The racial makeup of the town was 94.2% White, 2.2% African American, 0.2% Native American, 0.7% Asian, 0.1% Pacific Islander, 0.7% from other races, and 1.9% from two or more races. The median household income was $45,000, and the median family income was $50,000.
History
Irvington was founded in 1750 by William Irving, a prominent landowner in the area. The town was named after his son, Washington Irving, who was a famous American author. The town was an important port during the Revolutionary War, and was the site of several battles. During the Civil War, the town was occupied by Union forces, and the town was burned to the ground. After the war, the town was rebuilt and became a popular tourist destination. Today, Irvington is a popular destination for visitors looking to experience the charm of a small town.
Common Questions
What is Per Capita Income in Irvington?
Per Capita income in Irvington is $90,555.
What is the Median Family Income in Irvington?
Median Family Income in Irvington is $157,500.
What is the Median Household income in Irvington?
Median Household Income in Irvington is $118,750.
What is Inequality or Gini Index in Irvington?
Inequality or Gini Index in Irvington is 0.54.
What is the Total Population of Irvington?
Total Population of Irvington is 519.
What is the Total Male Population of Irvington?
Total Male Population of Irvington is 273.
What is the Total Female Population of Irvington?
Total Female Population of Irvington is 246.
What is the Ratio of Males per 100 Females in Irvington?
There are 110.98 Males per 100 Females in Irvington.
What is the Ratio of Females per 100 Males in Irvington?
There are 90.11 Females per 100 Males in Irvington.
What is the Median Population Age in Irvington?
Median Population Age in Irvington is 58.6 Years.
What is the Average Family Size in Irvington
Average Family Size in Irvington is 2.3 People.
What is the Average Household Size in Irvington
Average Household Size in Irvington is 2.0 People.
How Large is the Labor Force in Irvington?
There are 264 People in the Labor Forcein in Irvington.
What is the Percentage of People in the Labor Force in Irvington?
56.8% of People are in the Labor Force in Irvington.
What is the Unemployment Rate in Irvington?
Unemployment Rate in Irvington is 1.5%.