Red Hook, NY Map & Demographics
Red Hook Map
Red Hook Overview
$54,154
PER CAPITA INCOME
$105,000
AVG FAMILY INCOME
$90,750
AVG HOUSEHOLD INCOME
27.1%
WAGE / INCOME GAP [ % ]
72.9¢/ $1
WAGE / INCOME GAP [ $ ]
0.46
INEQUALITY / GINI INDEX
1,816
TOTAL POPULATION
852
MALE POPULATION
964
FEMALE POPULATION
88.38
MALES / 100 FEMALES
113.15
FEMALES / 100 MALES
44.1
MEDIAN AGE
2.9
AVG FAMILY SIZE
2.1
AVG HOUSEHOLD SIZE
1,003
LABOR FORCE [ PEOPLE ]
64.6%
PERCENT IN LABOR FORCE
2.6%
UNEMPLOYMENT RATE
Red Hook Zip Codes
Red Hook Area Codes
Income in Red Hook
Income Overview in Red Hook
Per Capita Income in Red Hook is $54,154, while median incomes of families and households are $105,000 and $90,750 respectively.
| Characteristic | Number | Measure |
| Per Capita Income | 1,816 | $54,154 |
| Median Family Income | 398 | $105,000 |
| Mean Family Income | 398 | $138,970 |
| Median Household Income | 865 | $90,750 |
| Mean Household Income | 865 | $111,937 |
| Income Deficit | 398 | $0 |
| Wage / Income Gap (%) | 1,816 | 27.14% |
| Wage / Income Gap ($) | 1,816 | 72.86¢ per $1 |
| Gini / Inequality Index | 1,816 | 0.46 |
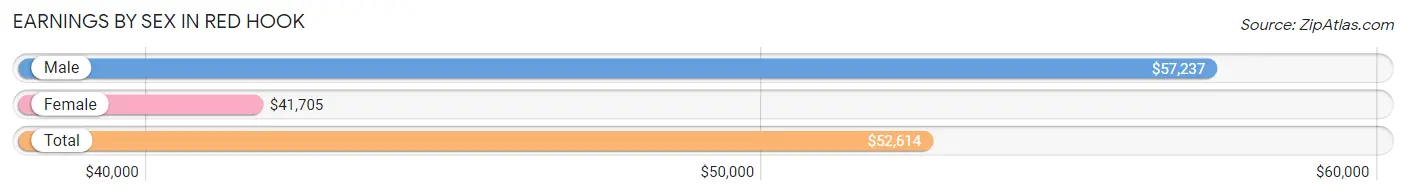
Earnings by Sex in Red Hook
Average Earnings in Red Hook are $52,614, $57,237 for men and $41,705 for women, a difference of 27.1%.
| Sex | Number | Average Earnings |
| Male | 568 (53.1%) | $57,237 |
| Female | 502 (46.9%) | $41,705 |
| Total | 1,070 (100.0%) | $52,614 |
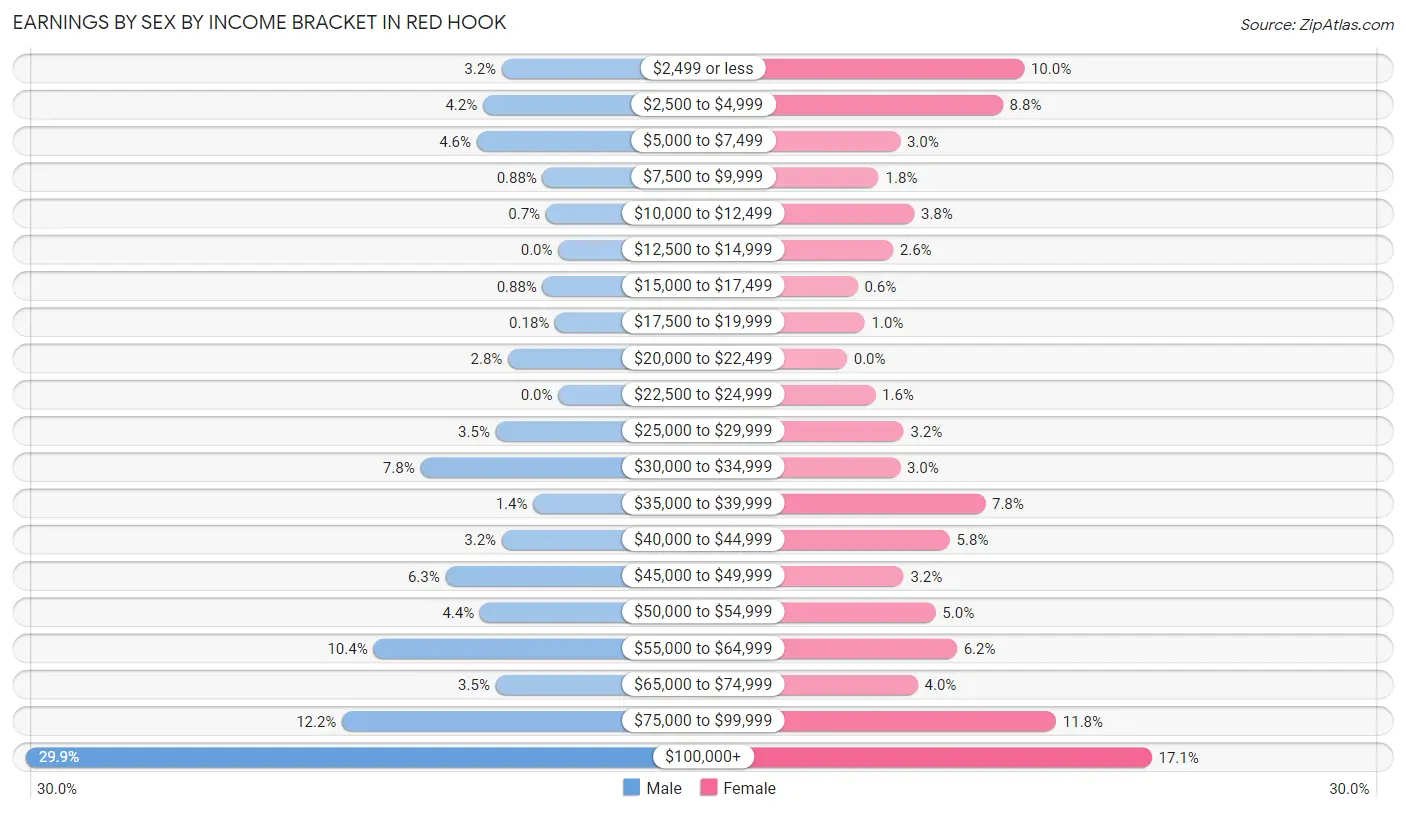
Earnings by Sex by Income Bracket in Red Hook
The most common earnings brackets in Red Hook are $100,000+ for men (170 | 29.9%) and $100,000+ for women (86 | 17.1%).
| Income | Male | Female |
| $2,499 or less | 18 (3.2%) | 50 (10.0%) |
| $2,500 to $4,999 | 24 (4.2%) | 44 (8.8%) |
| $5,000 to $7,499 | 26 (4.6%) | 15 (3.0%) |
| $7,500 to $9,999 | 5 (0.9%) | 9 (1.8%) |
| $10,000 to $12,499 | 4 (0.7%) | 19 (3.8%) |
| $12,500 to $14,999 | 0 (0.0%) | 13 (2.6%) |
| $15,000 to $17,499 | 5 (0.9%) | 3 (0.6%) |
| $17,500 to $19,999 | 1 (0.2%) | 5 (1.0%) |
| $20,000 to $22,499 | 16 (2.8%) | 0 (0.0%) |
| $22,500 to $24,999 | 0 (0.0%) | 8 (1.6%) |
| $25,000 to $29,999 | 20 (3.5%) | 16 (3.2%) |
| $30,000 to $34,999 | 44 (7.7%) | 15 (3.0%) |
| $35,000 to $39,999 | 8 (1.4%) | 39 (7.8%) |
| $40,000 to $44,999 | 18 (3.2%) | 29 (5.8%) |
| $45,000 to $49,999 | 36 (6.3%) | 16 (3.2%) |
| $50,000 to $54,999 | 25 (4.4%) | 25 (5.0%) |
| $55,000 to $64,999 | 59 (10.4%) | 31 (6.2%) |
| $65,000 to $74,999 | 20 (3.5%) | 20 (4.0%) |
| $75,000 to $99,999 | 69 (12.1%) | 59 (11.7%) |
| $100,000+ | 170 (29.9%) | 86 (17.1%) |
| Total | 568 (100.0%) | 502 (100.0%) |
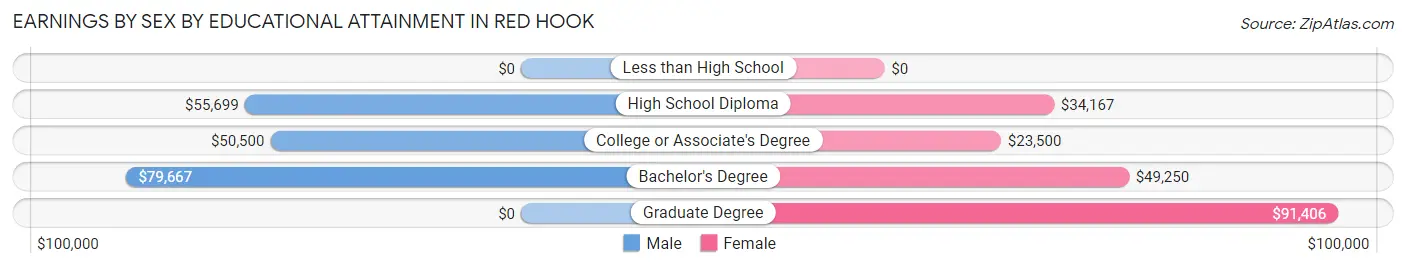
Earnings by Sex by Educational Attainment in Red Hook
Average earnings in Red Hook are $71,429 for men and $56,364 for women, a difference of 21.1%. Men with an educational attainment of bachelor's degree enjoy the highest average annual earnings of $79,667, while those with college or associate's degree education earn the least with $50,500. Women with an educational attainment of graduate degree earn the most with the average annual earnings of $91,406, while those with college or associate's degree education have the smallest earnings of $23,500.
| Educational Attainment | Male Income | Female Income |
| Less than High School | - | - |
| High School Diploma | $55,699 | $34,167 |
| College or Associate's Degree | $50,500 | $23,500 |
| Bachelor's Degree | $79,667 | $49,250 |
| Graduate Degree | - | - |
| Total | $71,429 | $56,364 |
Family Income in Red Hook
Family Income Brackets in Red Hook
According to the Red Hook family income data, there are 147 families falling into the $100,000 to $149,999 income range, which is the most common income bracket and makes up 36.9% of all families.
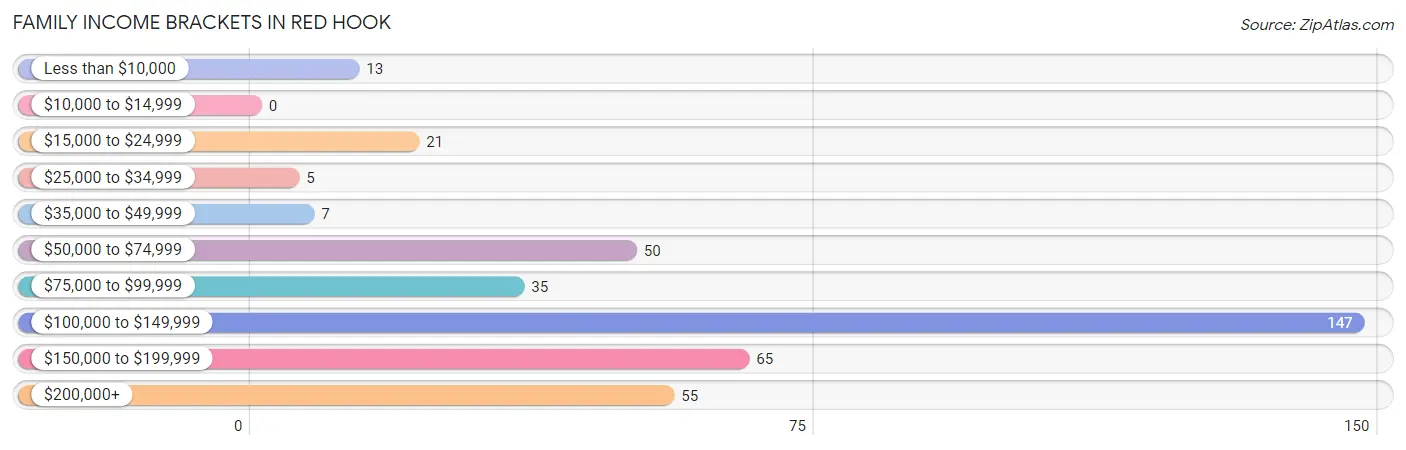
| Income Bracket | # Families | % Families |
| Less than $10,000 | 13 | 3.3% |
| $10,000 to $14,999 | 0 | 0.0% |
| $15,000 to $24,999 | 21 | 5.3% |
| $25,000 to $34,999 | 5 | 1.3% |
| $35,000 to $49,999 | 7 | 1.8% |
| $50,000 to $74,999 | 50 | 12.6% |
| $75,000 to $99,999 | 35 | 8.8% |
| $100,000 to $149,999 | 147 | 36.9% |
| $150,000 to $199,999 | 65 | 16.3% |
| $200,000+ | 55 | 13.8% |
Family Income by Famaliy Size in Red Hook
5-person families (34 | 8.5%) account for the highest median family income in Red Hook with $197,639 per family, while 5-person families (34 | 8.5%) have the highest median income of $39,528 per family member.
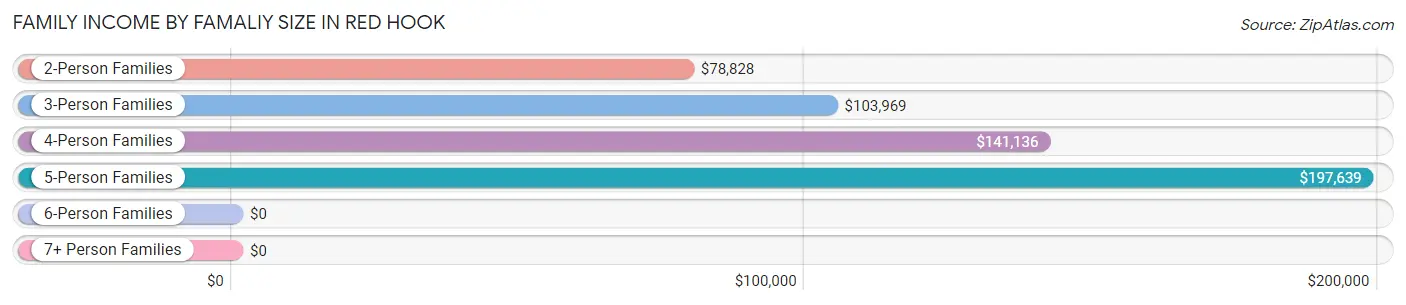
| Income Bracket | # Families | Median Income |
| 2-Person Families | 181 (45.5%) | $78,828 |
| 3-Person Families | 117 (29.4%) | $103,969 |
| 4-Person Families | 66 (16.6%) | $141,136 |
| 5-Person Families | 34 (8.5%) | $197,639 |
| 6-Person Families | 0 (0.0%) | $0 |
| 7+ Person Families | 0 (0.0%) | $0 |
| Total | 398 (100.0%) | $105,000 |
Family Income by Number of Earners in Red Hook
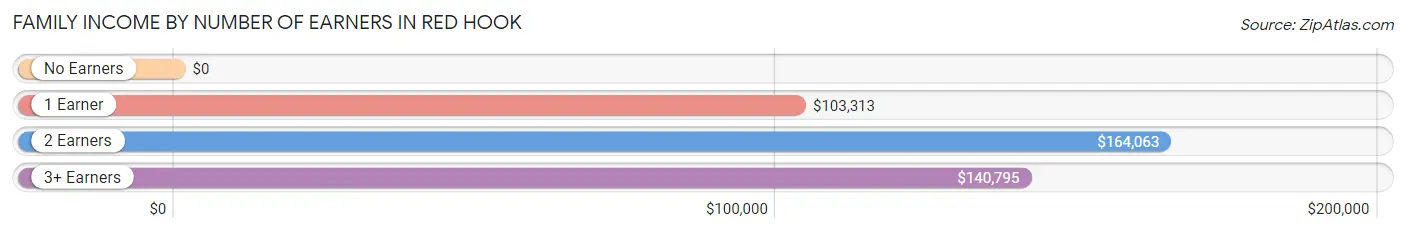
| Number of Earners | # Families | Median Income |
| No Earners | 50 (12.6%) | $0 |
| 1 Earner | 134 (33.7%) | $103,313 |
| 2 Earners | 163 (40.9%) | $164,063 |
| 3+ Earners | 51 (12.8%) | $140,795 |
| Total | 398 (100.0%) | $105,000 |
Household Income in Red Hook
Household Income Brackets in Red Hook
With 169 households falling in the category, the $100,000 to $149,999 income range is the most frequent in Red Hook, accounting for 19.5% of all households. In contrast, only 21 households (2.4%) fall into the $10,000 to $14,999 income bracket, making it the least populous group.
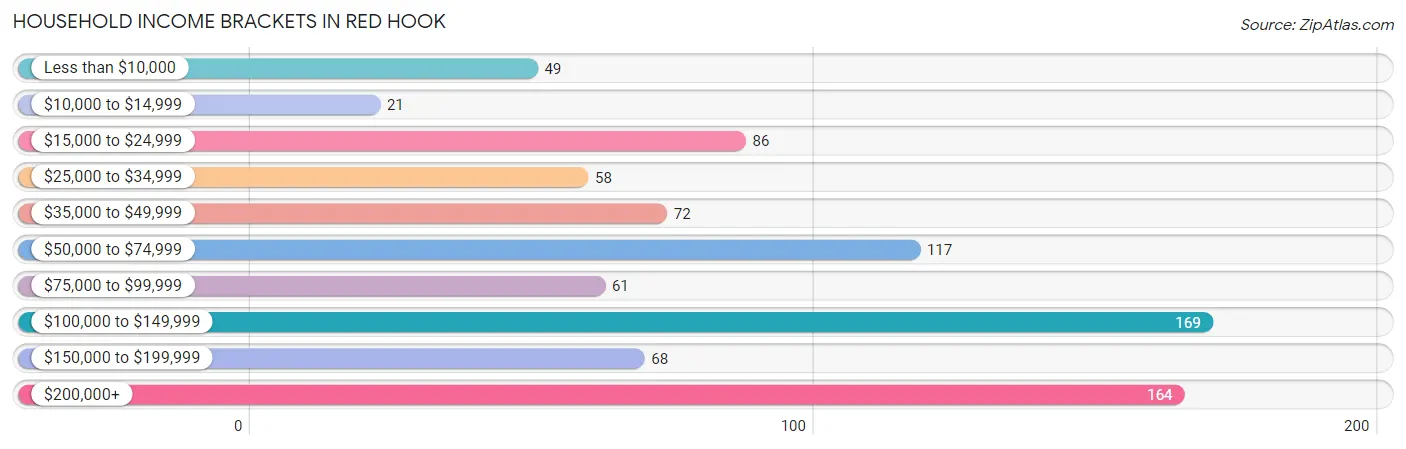
| Income Bracket | # Households | % Households |
| Less than $10,000 | 49 | 5.7% |
| $10,000 to $14,999 | 21 | 2.4% |
| $15,000 to $24,999 | 86 | 9.9% |
| $25,000 to $34,999 | 58 | 6.7% |
| $35,000 to $49,999 | 72 | 8.3% |
| $50,000 to $74,999 | 117 | 13.5% |
| $75,000 to $99,999 | 61 | 7.1% |
| $100,000 to $149,999 | 169 | 19.5% |
| $150,000 to $199,999 | 68 | 7.9% |
| $200,000+ | 164 | 19.0% |
Household Income by Householder Age in Red Hook
The median household income in Red Hook is $90,750, with the highest median household income of $103,000 found in the 25 to 44 years age bracket for the primary householder. A total of 210 households (24.3%) fall into this category. Meanwhile, the 65+ years age bracket for the primary householder has the lowest median household income of $0, with 317 households (36.6%) in this group.
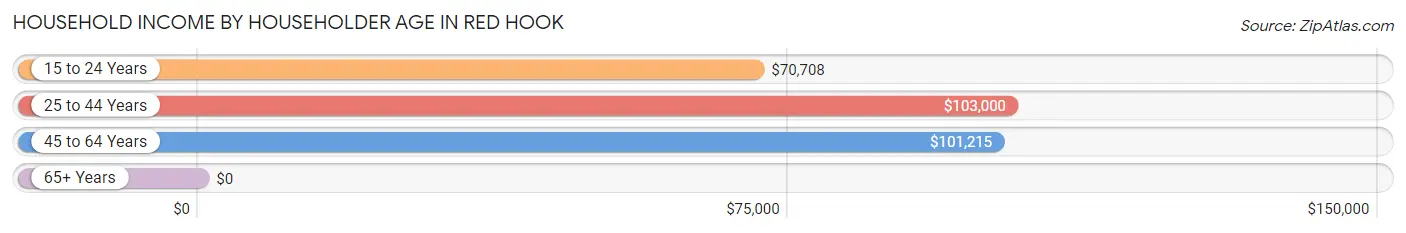
| Income Bracket | # Households | Median Income |
| 15 to 24 Years | 75 (8.7%) | $70,708 |
| 25 to 44 Years | 210 (24.3%) | $103,000 |
| 45 to 64 Years | 263 (30.4%) | $101,215 |
| 65+ Years | 317 (36.6%) | $0 |
| Total | 865 (100.0%) | $90,750 |
Poverty in Red Hook
Income Below Poverty by Sex and Age in Red Hook
With 5.3% poverty level for males and 11.4% for females among the residents of Red Hook, 18 to 24 year old males and 25 to 34 year old females are the most vulnerable to poverty, with 21 males (21.0%) and 49 females (51.6%) in their respective age groups living below the poverty level.
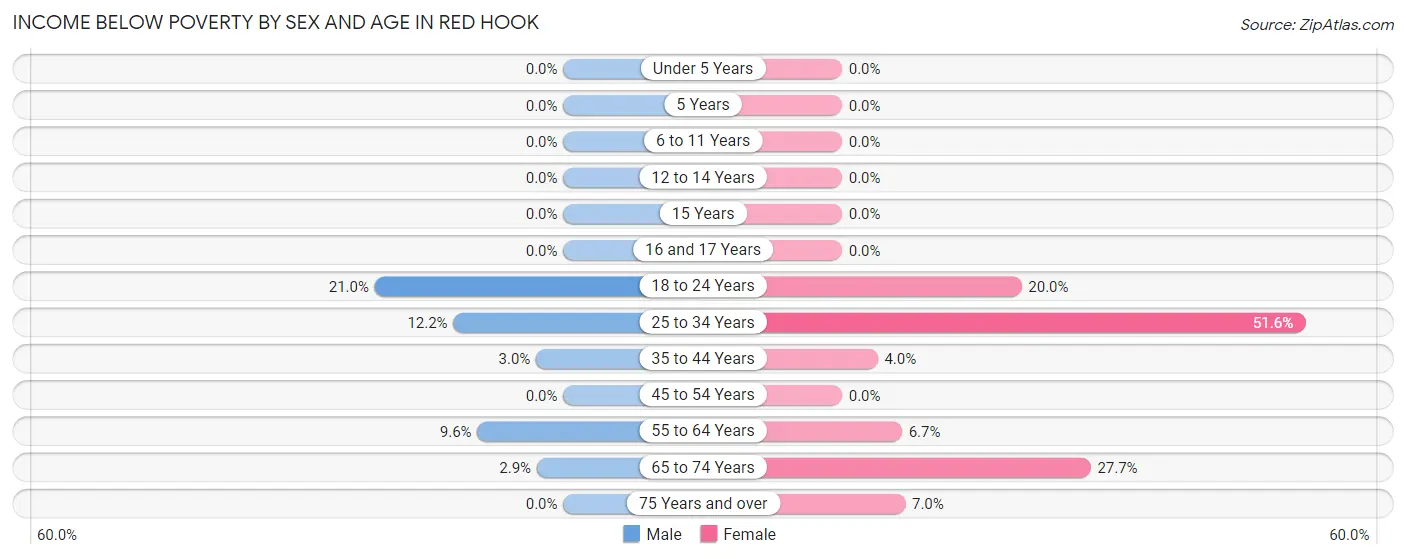
| Age Bracket | Male | Female |
| Under 5 Years | 0 (0.0%) | 0 (0.0%) |
| 5 Years | 0 (0.0%) | 0 (0.0%) |
| 6 to 11 Years | 0 (0.0%) | 0 (0.0%) |
| 12 to 14 Years | 0 (0.0%) | 0 (0.0%) |
| 15 Years | 0 (0.0%) | 0 (0.0%) |
| 16 and 17 Years | 0 (0.0%) | 0 (0.0%) |
| 18 to 24 Years | 21 (21.0%) | 23 (20.0%) |
| 25 to 34 Years | 6 (12.2%) | 49 (51.6%) |
| 35 to 44 Years | 4 (3.0%) | 5 (4.0%) |
| 45 to 54 Years | 0 (0.0%) | 0 (0.0%) |
| 55 to 64 Years | 9 (9.6%) | 5 (6.7%) |
| 65 to 74 Years | 5 (2.9%) | 18 (27.7%) |
| 75 Years and over | 0 (0.0%) | 10 (7.0%) |
| Total | 45 (5.3%) | 110 (11.4%) |
Income Above Poverty by Sex and Age in Red Hook
According to the poverty statistics in Red Hook, males aged under 5 years and females aged under 5 years are the age groups that are most secure financially, with 100.0% of males and 100.0% of females in these age groups living above the poverty line.
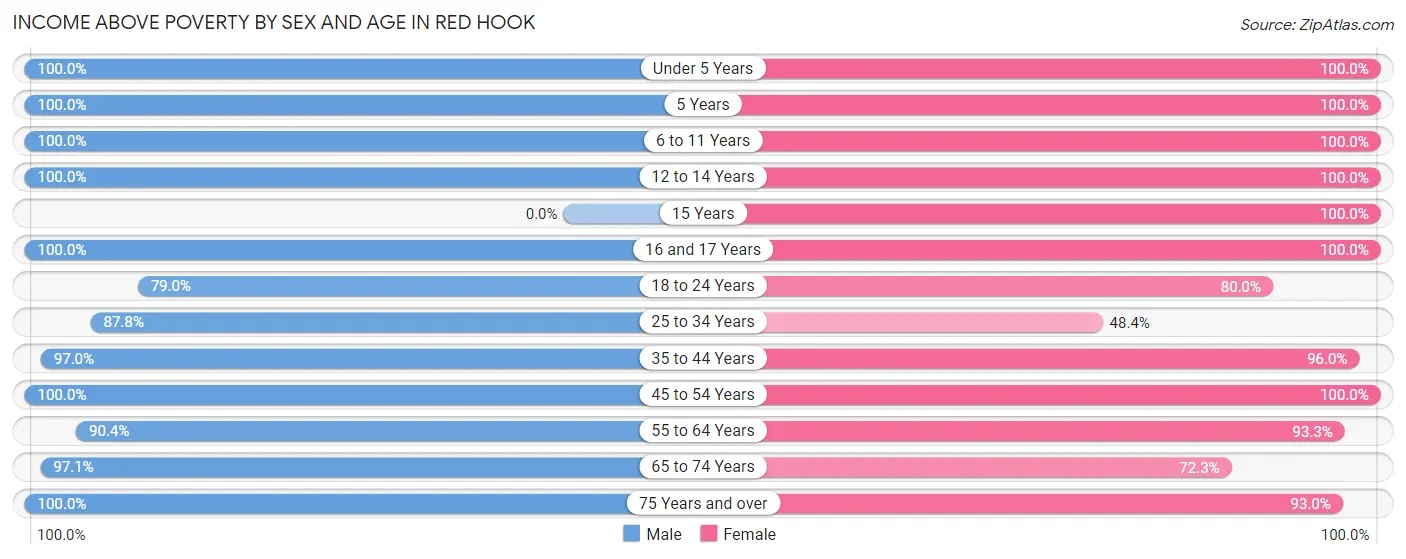
| Age Bracket | Male | Female |
| Under 5 Years | 26 (100.0%) | 28 (100.0%) |
| 5 Years | 2 (100.0%) | 5 (100.0%) |
| 6 to 11 Years | 61 (100.0%) | 106 (100.0%) |
| 12 to 14 Years | 18 (100.0%) | 6 (100.0%) |
| 15 Years | 0 (0.0%) | 8 (100.0%) |
| 16 and 17 Years | 42 (100.0%) | 35 (100.0%) |
| 18 to 24 Years | 79 (79.0%) | 92 (80.0%) |
| 25 to 34 Years | 43 (87.8%) | 46 (48.4%) |
| 35 to 44 Years | 128 (97.0%) | 121 (96.0%) |
| 45 to 54 Years | 104 (100.0%) | 158 (100.0%) |
| 55 to 64 Years | 85 (90.4%) | 70 (93.3%) |
| 65 to 74 Years | 165 (97.1%) | 47 (72.3%) |
| 75 Years and over | 51 (100.0%) | 132 (93.0%) |
| Total | 804 (94.7%) | 854 (88.6%) |
Income Below Poverty Among Married-Couple Families in Red Hook
The poverty statistics for married-couple families in Red Hook show that 3.8% or 10 of the total 264 families live below the poverty line. Families with no children have the highest poverty rate of 6.3%, comprising of 10 families. On the other hand, families with 1 or 2 children have the lowest poverty rate of 0.0%, which includes 0 families.
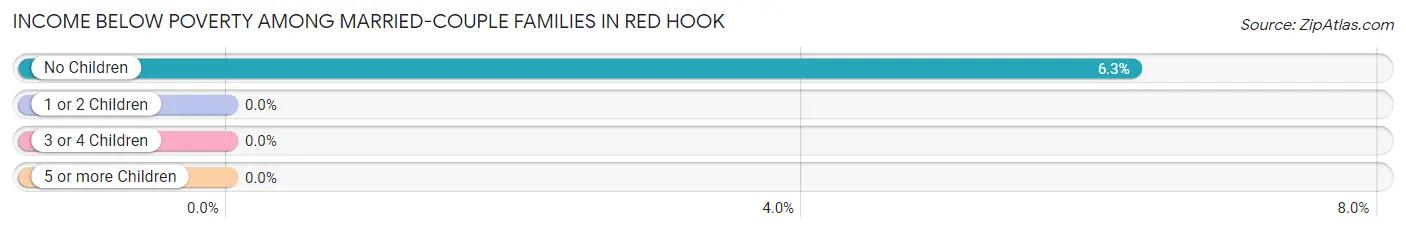
| Children | Above Poverty | Below Poverty |
| No Children | 149 (93.7%) | 10 (6.3%) |
| 1 or 2 Children | 82 (100.0%) | 0 (0.0%) |
| 3 or 4 Children | 23 (100.0%) | 0 (0.0%) |
| 5 or more Children | 0 (0.0%) | 0 (0.0%) |
| Total | 254 (96.2%) | 10 (3.8%) |
Income Below Poverty Among Single-Parent Households in Red Hook
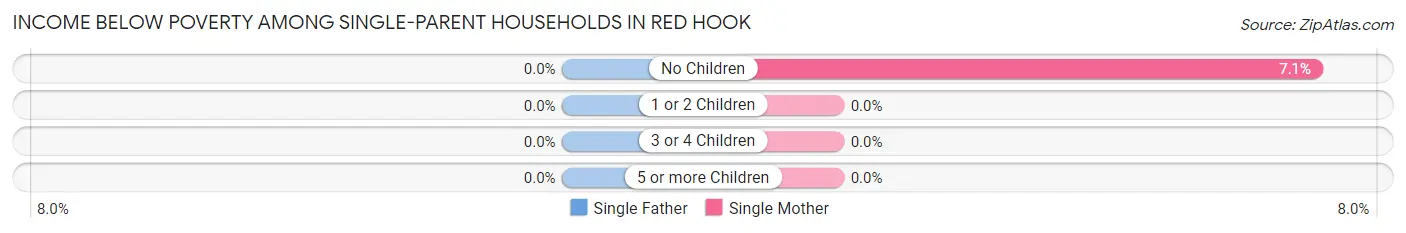
| Children | Single Father | Single Mother |
| No Children | 0 (0.0%) | 3 (7.1%) |
| 1 or 2 Children | 0 (0.0%) | 0 (0.0%) |
| 3 or 4 Children | 0 (0.0%) | 0 (0.0%) |
| 5 or more Children | 0 (0.0%) | 0 (0.0%) |
| Total | 0 (0.0%) | 3 (2.5%) |
Income Below Poverty Among Married-Couple vs Single-Parent Households in Red Hook
The poverty data for Red Hook shows that 10 of the married-couple family households (3.8%) and 3 of the single-parent households (2.2%) are living below the poverty level. Within the married-couple family households, those with no children have the highest poverty rate, with 10 households (6.3%) falling below the poverty line. Among the single-parent households, those with no children have the highest poverty rate, with 3 household (7.1%) living below poverty.
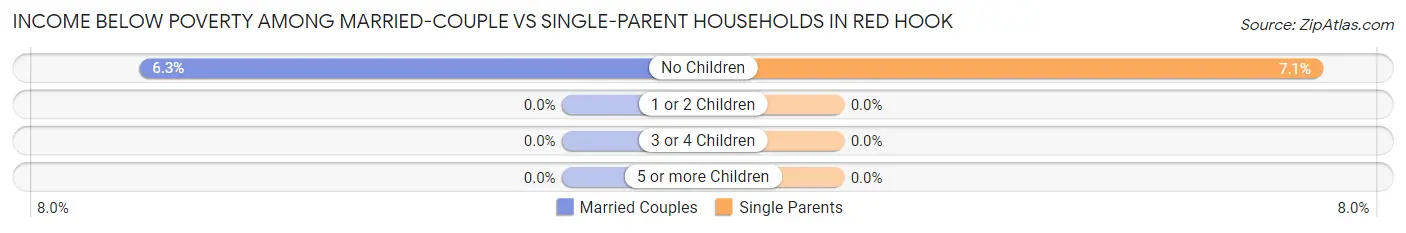
| Children | Married-Couple Families | Single-Parent Households |
| No Children | 10 (6.3%) | 3 (7.1%) |
| 1 or 2 Children | 0 (0.0%) | 0 (0.0%) |
| 3 or 4 Children | 0 (0.0%) | 0 (0.0%) |
| 5 or more Children | 0 (0.0%) | 0 (0.0%) |
| Total | 10 (3.8%) | 3 (2.2%) |
Race in Red Hook
The most populous races in Red Hook are White / Caucasian (1,632 | 89.9%), Two or more Races (70 | 3.8%), and Some other Race (44 | 2.4%).
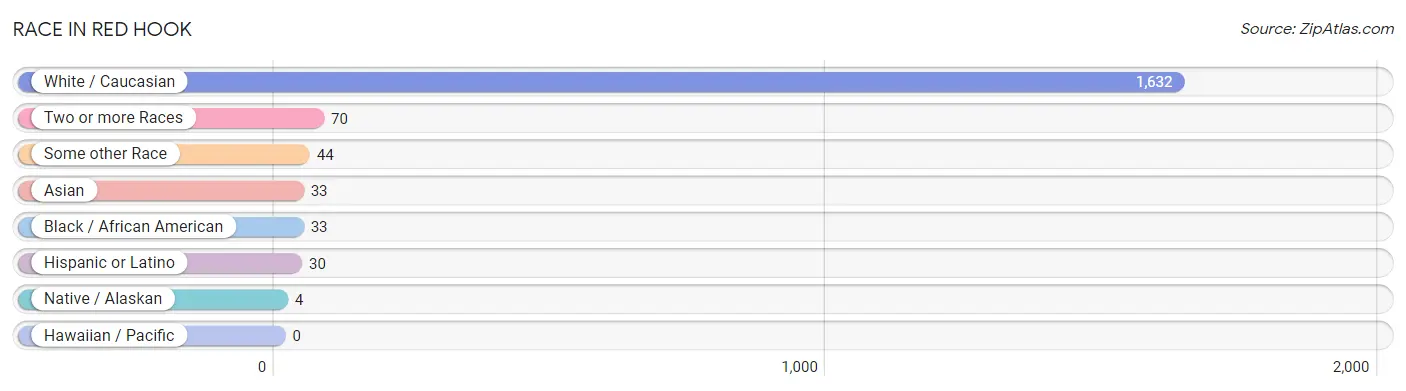
| Race | # Population | % Population |
| Asian | 33 | 1.8% |
| Black / African American | 33 | 1.8% |
| Hawaiian / Pacific | 0 | 0.0% |
| Hispanic or Latino | 30 | 1.7% |
| Native / Alaskan | 4 | 0.2% |
| White / Caucasian | 1,632 | 89.9% |
| Two or more Races | 70 | 3.8% |
| Some other Race | 44 | 2.4% |
| Total | 1,816 | 100.0% |
Ancestry in Red Hook
The most populous ancestries reported in Red Hook are Irish (421 | 23.2%), English (298 | 16.4%), German (284 | 15.6%), Italian (233 | 12.8%), and European (114 | 6.3%), together accounting for 74.3% of all Red Hook residents.
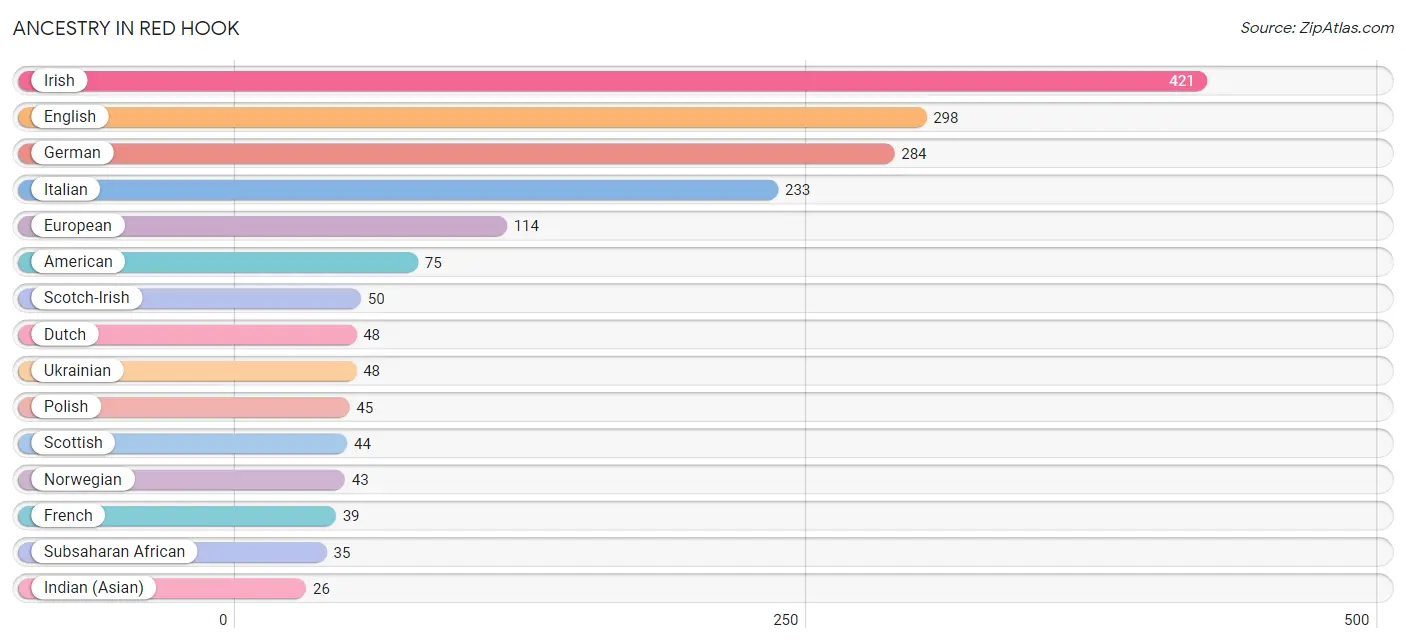
| Ancestry | # Population | % Population |
| American | 75 | 4.1% |
| Arab | 14 | 0.8% |
| Austrian | 12 | 0.7% |
| Bhutanese | 2 | 0.1% |
| British | 21 | 1.2% |
| Burmese | 2 | 0.1% |
| Canadian | 17 | 0.9% |
| Celtic | 9 | 0.5% |
| Central American | 9 | 0.5% |
| Central American Indian | 4 | 0.2% |
| Croatian | 16 | 0.9% |
| Czech | 17 | 0.9% |
| Dominican | 9 | 0.5% |
| Dutch | 48 | 2.6% |
| Eastern European | 6 | 0.3% |
| English | 298 | 16.4% |
| European | 114 | 6.3% |
| French | 39 | 2.1% |
| German | 284 | 15.6% |
| Guatemalan | 9 | 0.5% |
| Hungarian | 5 | 0.3% |
| Indian (Asian) | 26 | 1.4% |
| Irish | 421 | 23.2% |
| Italian | 233 | 12.8% |
| Lithuanian | 8 | 0.4% |
| Mongolian | 2 | 0.1% |
| Nigerian | 11 | 0.6% |
| Norwegian | 43 | 2.4% |
| Palestinian | 14 | 0.8% |
| Polish | 45 | 2.5% |
| Portuguese | 6 | 0.3% |
| Puerto Rican | 12 | 0.7% |
| Scotch-Irish | 50 | 2.8% |
| Scottish | 44 | 2.4% |
| Slavic | 12 | 0.7% |
| Slovak | 4 | 0.2% |
| South African | 24 | 1.3% |
| Subsaharan African | 35 | 1.9% |
| Swedish | 20 | 1.1% |
| Thai | 9 | 0.5% |
| Ukrainian | 48 | 2.6% |
| Welsh | 16 | 0.9% |
| Yugoslavian | 10 | 0.5% | View All 43 Rows |
Immigrants in Red Hook
The most numerous immigrant groups reported in Red Hook came from Asia (77 | 4.2%), Europe (59 | 3.3%), South Central Asia (49 | 2.7%), Canada (32 | 1.8%), and Iran (31 | 1.7%), together accounting for 13.7% of all Red Hook residents.
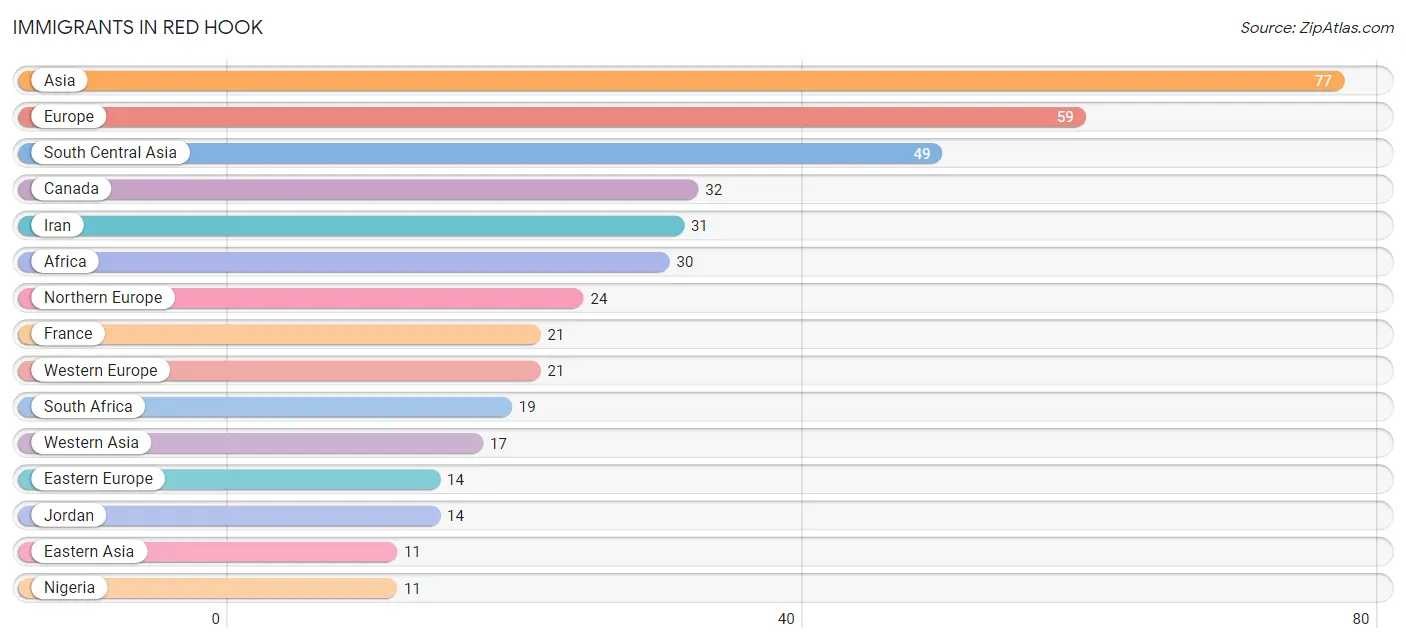
| Immigration Origin | # Population | % Population |
| Africa | 30 | 1.7% |
| Asia | 77 | 4.2% |
| Canada | 32 | 1.8% |
| Caribbean | 9 | 0.5% |
| China | 7 | 0.4% |
| Croatia | 6 | 0.3% |
| Dominican Republic | 9 | 0.5% |
| Eastern Asia | 11 | 0.6% |
| Eastern Europe | 14 | 0.8% |
| Europe | 59 | 3.3% |
| France | 21 | 1.2% |
| India | 6 | 0.3% |
| Iran | 31 | 1.7% |
| Japan | 2 | 0.1% |
| Jordan | 14 | 0.8% |
| Korea | 2 | 0.1% |
| Latin America | 9 | 0.5% |
| Nigeria | 11 | 0.6% |
| Northern Europe | 24 | 1.3% |
| Scotland | 10 | 0.5% |
| South Africa | 19 | 1.1% |
| South Central Asia | 49 | 2.7% |
| Ukraine | 2 | 0.1% |
| Western Africa | 11 | 0.6% |
| Western Asia | 17 | 0.9% |
| Western Europe | 21 | 1.2% | View All 26 Rows |
Sex and Age in Red Hook
Sex and Age in Red Hook
The most populous age groups in Red Hook are 65 to 69 Years (136 | 16.0%) for men and 20 to 24 Years (95 | 9.9%) for women.
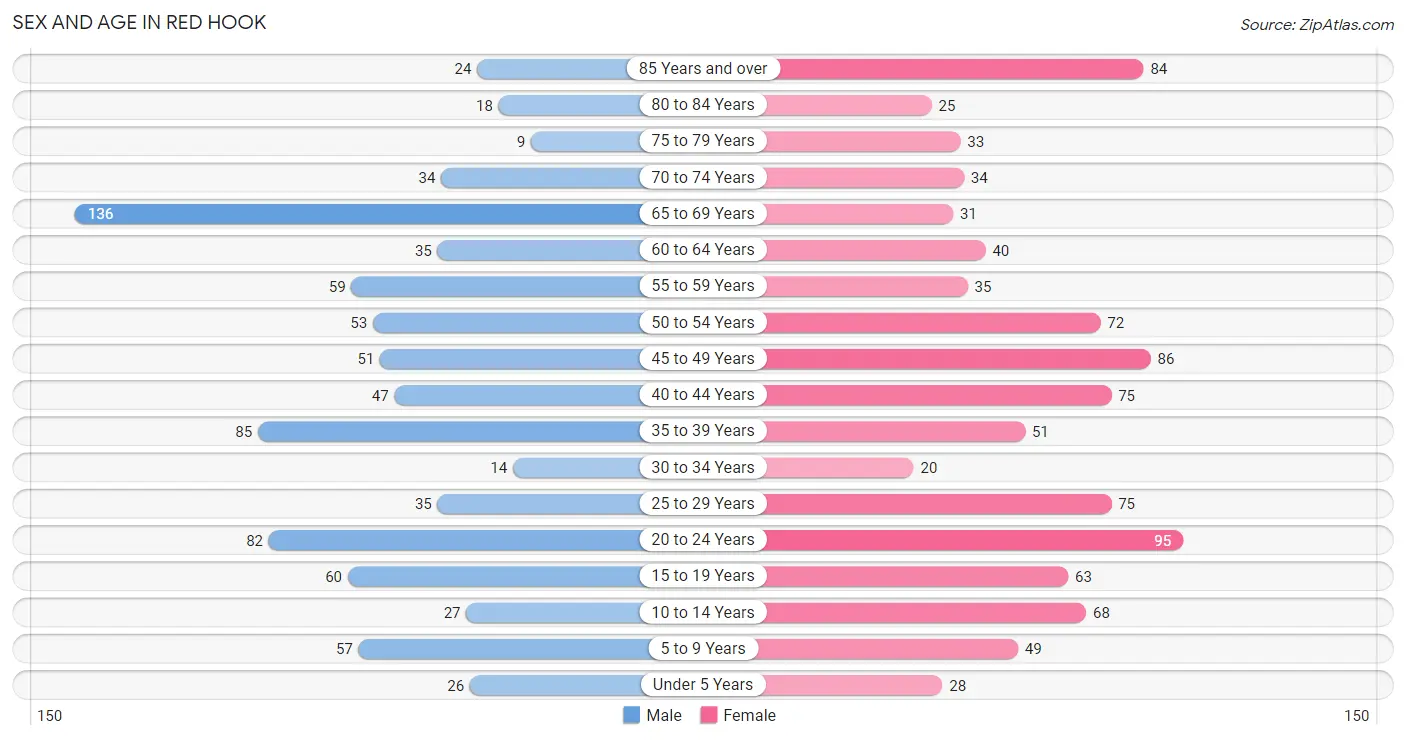
| Age Bracket | Male | Female |
| Under 5 Years | 26 (3.0%) | 28 (2.9%) |
| 5 to 9 Years | 57 (6.7%) | 49 (5.1%) |
| 10 to 14 Years | 27 (3.2%) | 68 (7.0%) |
| 15 to 19 Years | 60 (7.0%) | 63 (6.5%) |
| 20 to 24 Years | 82 (9.6%) | 95 (9.9%) |
| 25 to 29 Years | 35 (4.1%) | 75 (7.8%) |
| 30 to 34 Years | 14 (1.6%) | 20 (2.1%) |
| 35 to 39 Years | 85 (10.0%) | 51 (5.3%) |
| 40 to 44 Years | 47 (5.5%) | 75 (7.8%) |
| 45 to 49 Years | 51 (6.0%) | 86 (8.9%) |
| 50 to 54 Years | 53 (6.2%) | 72 (7.5%) |
| 55 to 59 Years | 59 (6.9%) | 35 (3.6%) |
| 60 to 64 Years | 35 (4.1%) | 40 (4.2%) |
| 65 to 69 Years | 136 (16.0%) | 31 (3.2%) |
| 70 to 74 Years | 34 (4.0%) | 34 (3.5%) |
| 75 to 79 Years | 9 (1.1%) | 33 (3.4%) |
| 80 to 84 Years | 18 (2.1%) | 25 (2.6%) |
| 85 Years and over | 24 (2.8%) | 84 (8.7%) |
| Total | 852 (100.0%) | 964 (100.0%) |
Families and Households in Red Hook
Median Family Size in Red Hook
The median family size in Red Hook is 2.92 persons per family, with single male/father families (15 | 3.8%) accounting for the largest median family size of 3.67 persons per family. On the other hand, single female/mother families (119 | 29.9%) represent the smallest median family size with 2.64 persons per family.
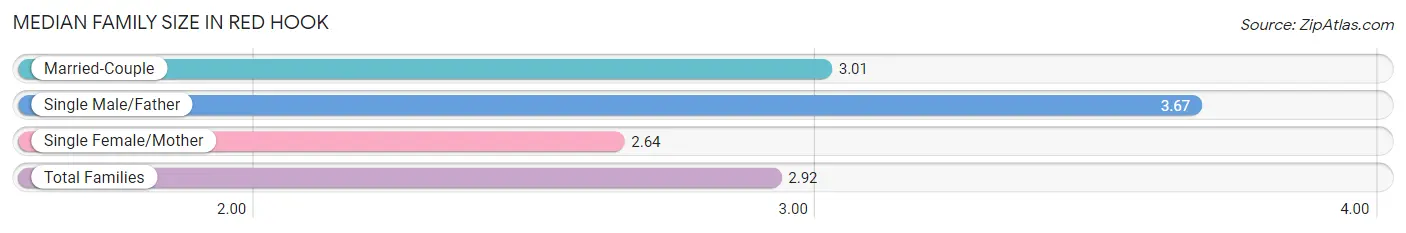
| Family Type | # Families | Family Size |
| Married-Couple | 264 (66.3%) | 3.01 |
| Single Male/Father | 15 (3.8%) | 3.67 |
| Single Female/Mother | 119 (29.9%) | 2.64 |
| Total Families | 398 (100.0%) | 2.92 |
Median Household Size in Red Hook
The median household size in Red Hook is 2.09 persons per household, with single male/father households (15 | 1.7%) accounting for the largest median household size of 3.93 persons per household. non-family households (467 | 54.0%) represent the smallest median household size with 1.35 persons per household.
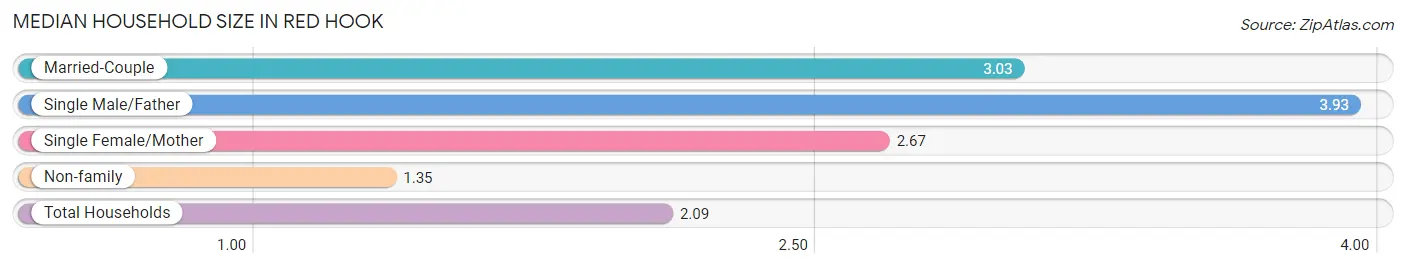
| Household Type | # Households | Household Size |
| Married-Couple | 264 (30.5%) | 3.03 |
| Single Male/Father | 15 (1.7%) | 3.93 |
| Single Female/Mother | 119 (13.8%) | 2.67 |
| Non-family | 467 (54.0%) | 1.35 |
| Total Households | 865 (100.0%) | 2.09 |
Household Size by Marriage Status in Red Hook
Out of a total of 865 households in Red Hook, 398 (46.0%) are family households, while 467 (54.0%) are nonfamily households. The most numerous type of family households are 2-person households, comprising 178, and the most common type of nonfamily households are 1-person households, comprising 344.
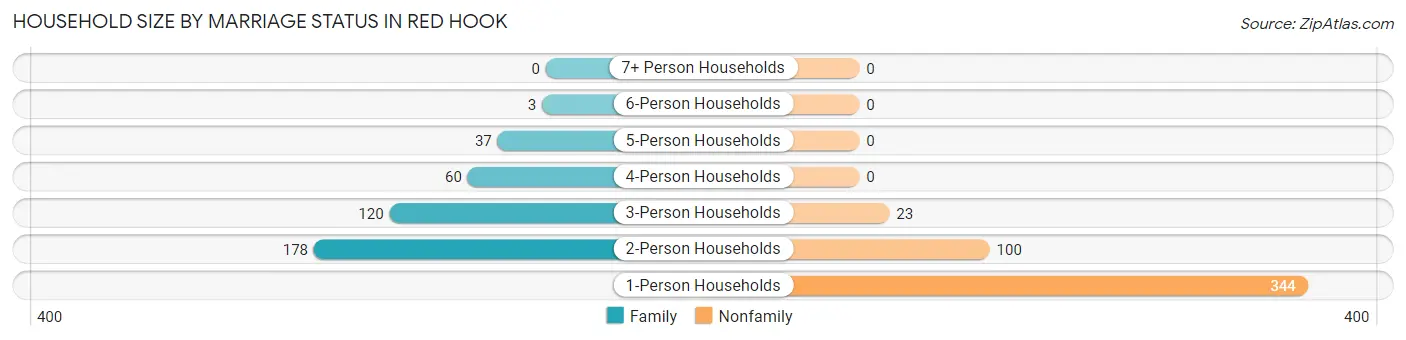
| Household Size | Family Households | Nonfamily Households |
| 1-Person Households | - | 344 (39.8%) |
| 2-Person Households | 178 (20.6%) | 100 (11.6%) |
| 3-Person Households | 120 (13.9%) | 23 (2.7%) |
| 4-Person Households | 60 (6.9%) | 0 (0.0%) |
| 5-Person Households | 37 (4.3%) | 0 (0.0%) |
| 6-Person Households | 3 (0.4%) | 0 (0.0%) |
| 7+ Person Households | 0 (0.0%) | 0 (0.0%) |
| Total | 398 (46.0%) | 467 (54.0%) |
Female Fertility in Red Hook
Fertility by Age in Red Hook
Average fertility rate in Red Hook is 58.0 births per 1,000 women. Women in the age bracket of 35 to 50 years have the highest fertility rate with 125.0 births per 1,000 women. Women in the age bracket of 35 to 50 years acount for 100.0% of all women with births.
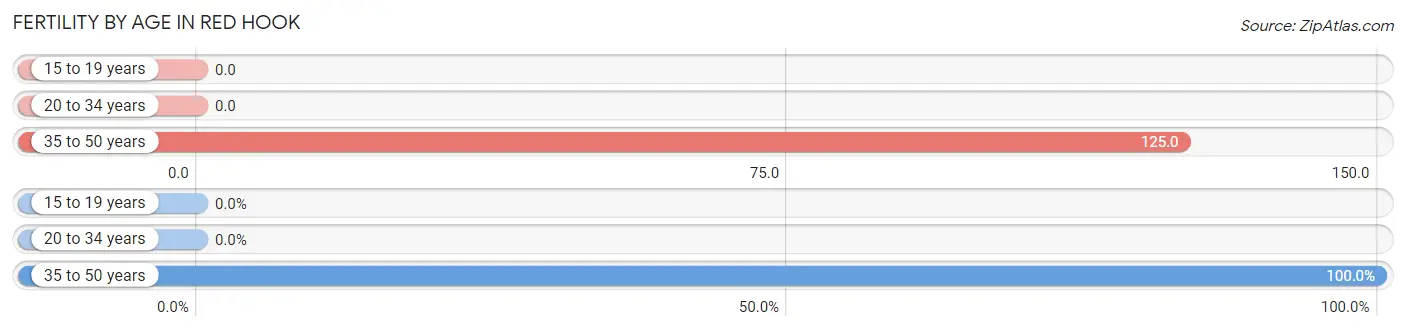
| Age Bracket | Women with Births | Births / 1,000 Women |
| 15 to 19 years | 0 (0.0%) | 0.0 |
| 20 to 34 years | 0 (0.0%) | 0.0 |
| 35 to 50 years | 27 (100.0%) | 125.0 |
| Total | 27 (100.0%) | 58.0 |
Fertility by Age by Marriage Status in Red Hook
55.6% of women with births (27) in Red Hook are married. The highest percentage of unmarried women with births falls into 35 to 50 years age bracket with 44.4% of them unmarried at the time of birth, while the lowest percentage of unmarried women with births belong to 35 to 50 years age bracket with 44.4% of them unmarried.
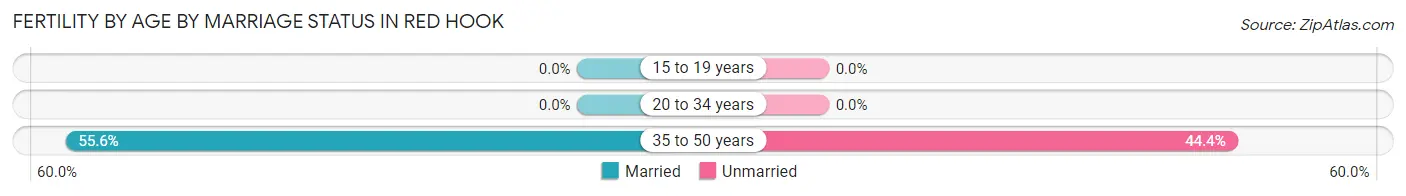
| Age Bracket | Married | Unmarried |
| 15 to 19 years | 0 (0.0%) | 0 (0.0%) |
| 20 to 34 years | 0 (0.0%) | 0 (0.0%) |
| 35 to 50 years | 15 (55.6%) | 12 (44.4%) |
| Total | 15 (55.6%) | 12 (44.4%) |
Fertility by Education in Red Hook
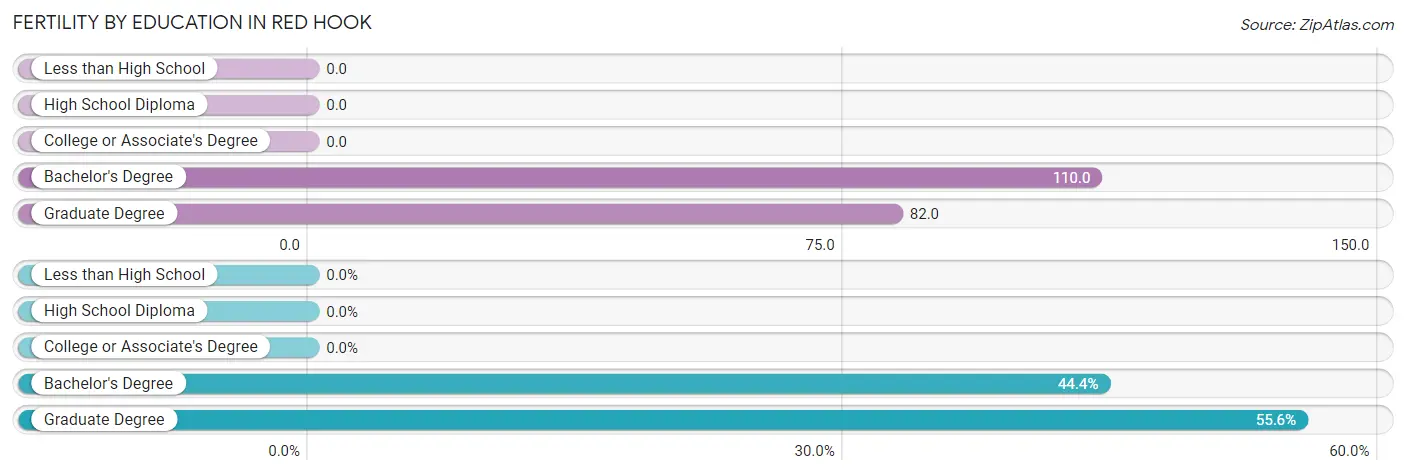
| Educational Attainment | Women with Births | Births / 1,000 Women |
| Less than High School | 0 (0.0%) | 0.0 |
| High School Diploma | 0 (0.0%) | 0.0 |
| College or Associate's Degree | 0 (0.0%) | 0.0 |
| Bachelor's Degree | 12 (44.4%) | 110.0 |
| Graduate Degree | 15 (55.6%) | 82.0 |
| Total | 27 (100.0%) | 58.0 |
Fertility by Education by Marriage Status in Red Hook
44.4% of women with births in Red Hook are unmarried. Women with the educational attainment of graduate degree are most likely to be married with 100.0% of them married at childbirth, while women with the educational attainment of bachelor's degree are least likely to be married with 100.0% of them unmarried at childbirth.
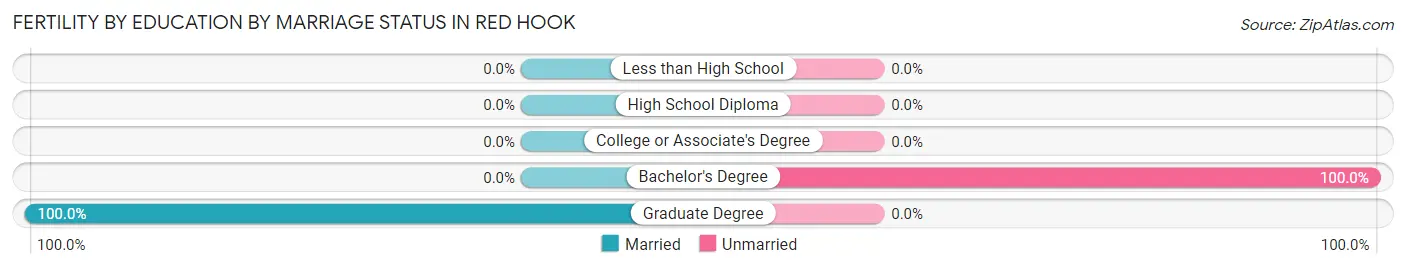
| Educational Attainment | Married | Unmarried |
| Less than High School | 0 (0.0%) | 0 (0.0%) |
| High School Diploma | 0 (0.0%) | 0 (0.0%) |
| College or Associate's Degree | 0 (0.0%) | 0 (0.0%) |
| Bachelor's Degree | 0 (0.0%) | 12 (100.0%) |
| Graduate Degree | 15 (100.0%) | 0 (0.0%) |
| Total | 15 (55.6%) | 12 (44.4%) |
Employment Characteristics in Red Hook
Employment by Class of Employer in Red Hook
Among the 978 employed individuals in Red Hook, private company employees (484 | 49.5%), not-for-profit organizations (263 | 26.9%), and local government employees (119 | 12.2%) make up the most common classes of employment.
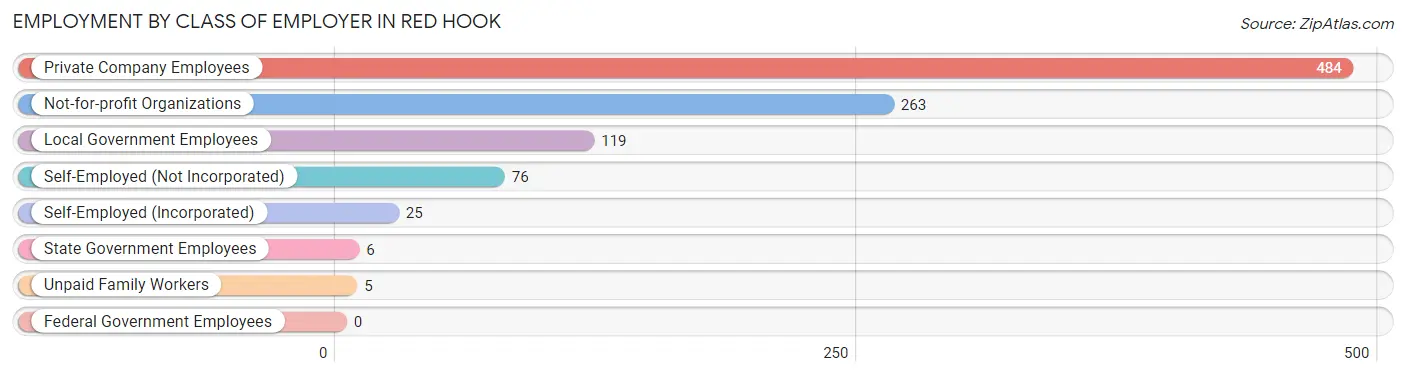
| Employer Class | # Employees | % Employees |
| Private Company Employees | 484 | 49.5% |
| Self-Employed (Incorporated) | 25 | 2.6% |
| Self-Employed (Not Incorporated) | 76 | 7.8% |
| Not-for-profit Organizations | 263 | 26.9% |
| Local Government Employees | 119 | 12.2% |
| State Government Employees | 6 | 0.6% |
| Federal Government Employees | 0 | 0.0% |
| Unpaid Family Workers | 5 | 0.5% |
| Total | 978 | 100.0% |
Employment Status by Age in Red Hook
According to the labor force statistics for Red Hook, out of the total population over 16 years of age (1,553), 64.6% or 1,003 individuals are in the labor force, with 2.6% or 26 of them unemployed. The age group with the highest labor force participation rate is 35 to 44 years, with 95.0% or 245 individuals in the labor force. Within the labor force, the 60 to 64 years age range has the highest percentage of unemployed individuals, with 9.8% or 5 of them being unemployed.
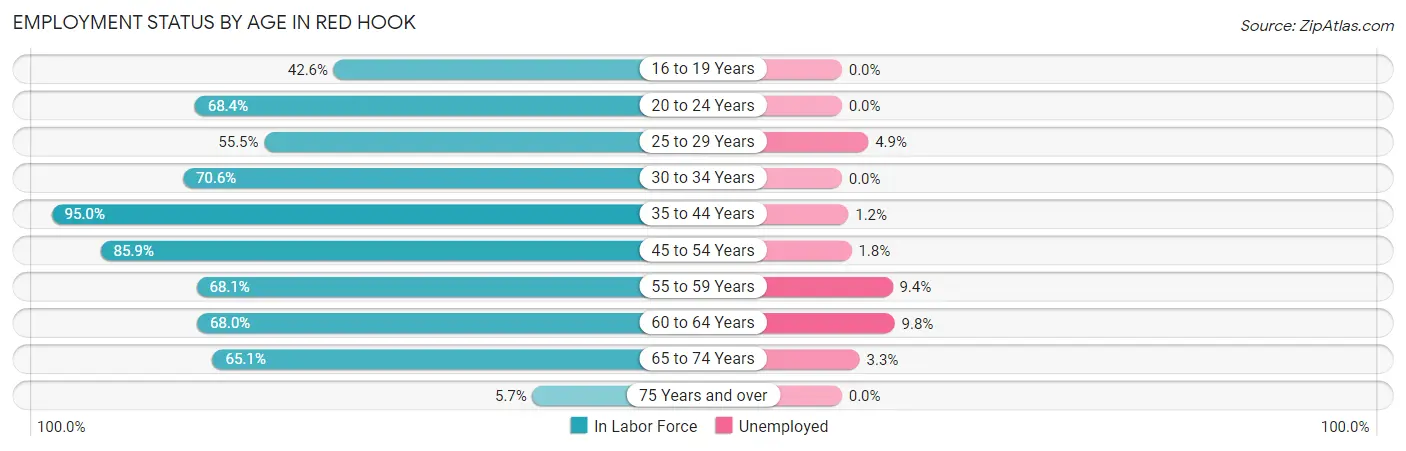
| Age Bracket | In Labor Force | Unemployed |
| 16 to 19 Years | 49 (42.6%) | 0 (0.0%) |
| 20 to 24 Years | 121 (68.4%) | 0 (0.0%) |
| 25 to 29 Years | 61 (55.5%) | 3 (4.9%) |
| 30 to 34 Years | 24 (70.6%) | 0 (0.0%) |
| 35 to 44 Years | 245 (95.0%) | 3 (1.2%) |
| 45 to 54 Years | 225 (85.9%) | 4 (1.8%) |
| 55 to 59 Years | 64 (68.1%) | 6 (9.4%) |
| 60 to 64 Years | 51 (68.0%) | 5 (9.8%) |
| 65 to 74 Years | 153 (65.1%) | 5 (3.3%) |
| 75 Years and over | 11 (5.7%) | 0 (0.0%) |
| Total | 1,003 (64.6%) | 26 (2.6%) |
Employment Status by Educational Attainment in Red Hook
According to labor force statistics for Red Hook, 80.4% of individuals (670) out of the total population between 25 and 64 years of age (833) are in the labor force, with 3.1% or 21 of them being unemployed. The group with the highest labor force participation rate are those with the educational attainment of bachelor's degree or higher, with 84.8% or 446 individuals in the labor force. Within the labor force, individuals with high school diploma education have the highest percentage of unemployment, with 11.9% or 12 of them being unemployed.
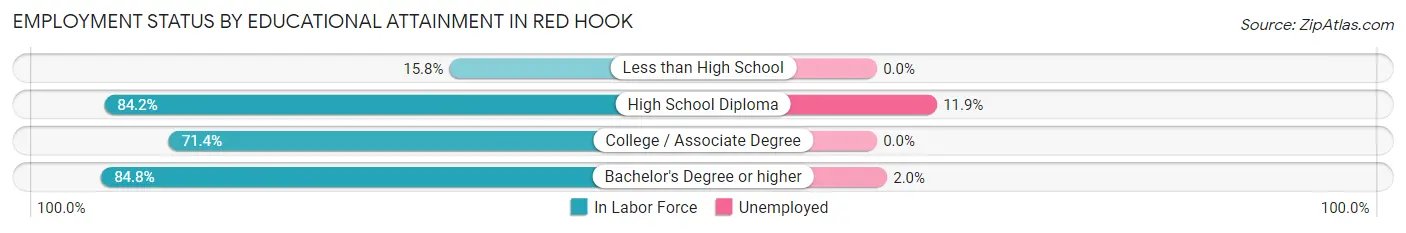
| Educational Attainment | In Labor Force | Unemployed |
| Less than High School | 3 (15.8%) | 0 (0.0%) |
| High School Diploma | 101 (84.2%) | 14 (11.9%) |
| College / Associate Degree | 120 (71.4%) | 0 (0.0%) |
| Bachelor's Degree or higher | 446 (84.8%) | 11 (2.0%) |
| Total | 670 (80.4%) | 26 (3.1%) |
Employment Occupations by Sex in Red Hook
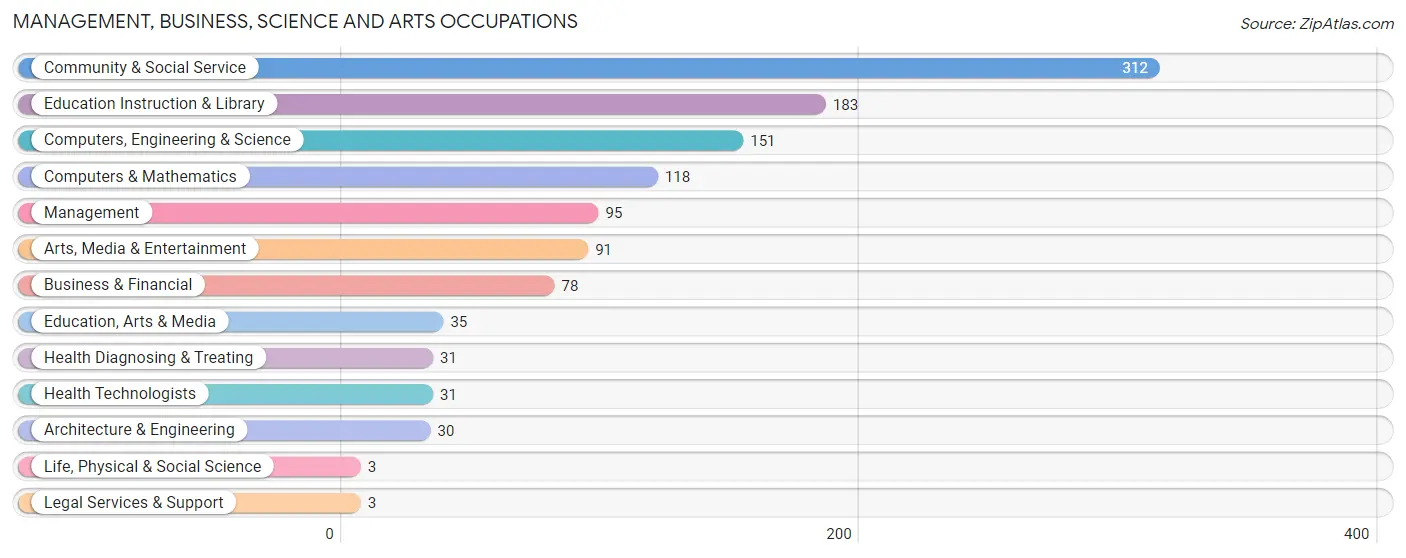
Management, Business, Science and Arts Occupations
The most common Management, Business, Science and Arts occupations in Red Hook are Community & Social Service (312 | 31.9%), Education Instruction & Library (183 | 18.7%), Computers, Engineering & Science (151 | 15.4%), Computers & Mathematics (118 | 12.1%), and Management (95 | 9.7%).
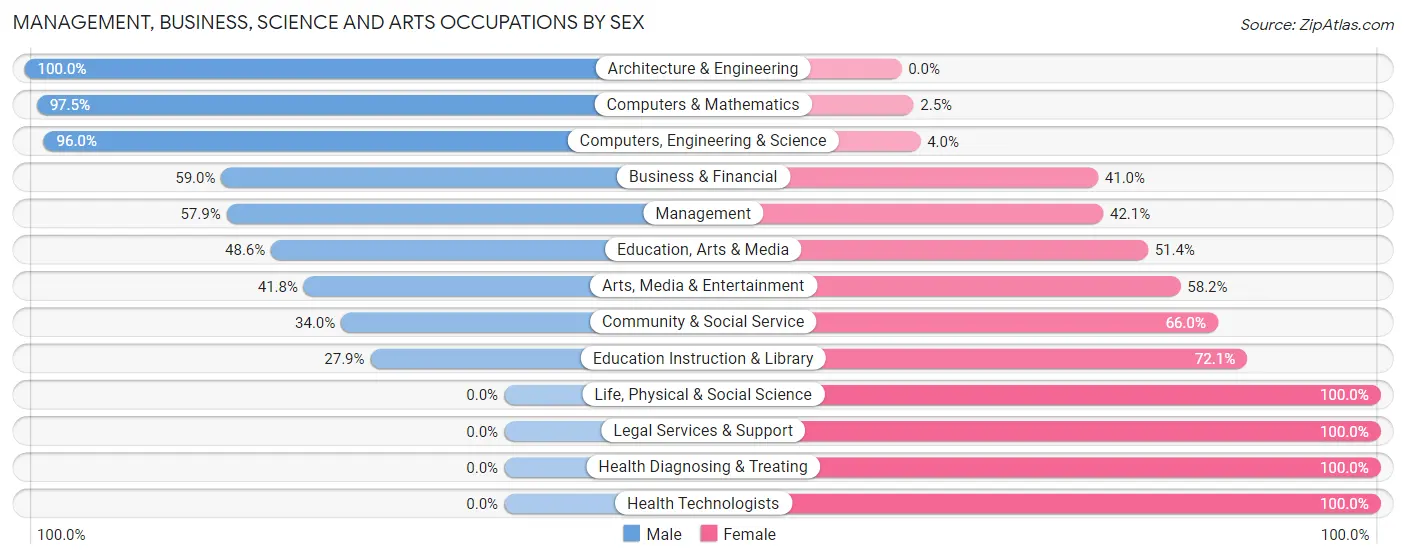
Management, Business, Science and Arts Occupations by Sex
Within the Management, Business, Science and Arts occupations in Red Hook, the most male-oriented occupations are Architecture & Engineering (100.0%), Computers & Mathematics (97.5%), and Computers, Engineering & Science (96.0%), while the most female-oriented occupations are Life, Physical & Social Science (100.0%), Legal Services & Support (100.0%), and Health Diagnosing & Treating (100.0%).
| Occupation | Male | Female |
| Management | 55 (57.9%) | 40 (42.1%) |
| Business & Financial | 46 (59.0%) | 32 (41.0%) |
| Computers, Engineering & Science | 145 (96.0%) | 6 (4.0%) |
| Computers & Mathematics | 115 (97.5%) | 3 (2.5%) |
| Architecture & Engineering | 30 (100.0%) | 0 (0.0%) |
| Life, Physical & Social Science | 0 (0.0%) | 3 (100.0%) |
| Community & Social Service | 106 (34.0%) | 206 (66.0%) |
| Education, Arts & Media | 17 (48.6%) | 18 (51.4%) |
| Legal Services & Support | 0 (0.0%) | 3 (100.0%) |
| Education Instruction & Library | 51 (27.9%) | 132 (72.1%) |
| Arts, Media & Entertainment | 38 (41.8%) | 53 (58.2%) |
| Health Diagnosing & Treating | 0 (0.0%) | 31 (100.0%) |
| Health Technologists | 0 (0.0%) | 31 (100.0%) |
| Total (Category) | 352 (52.8%) | 315 (47.2%) |
| Total (Overall) | 497 (50.8%) | 481 (49.2%) |
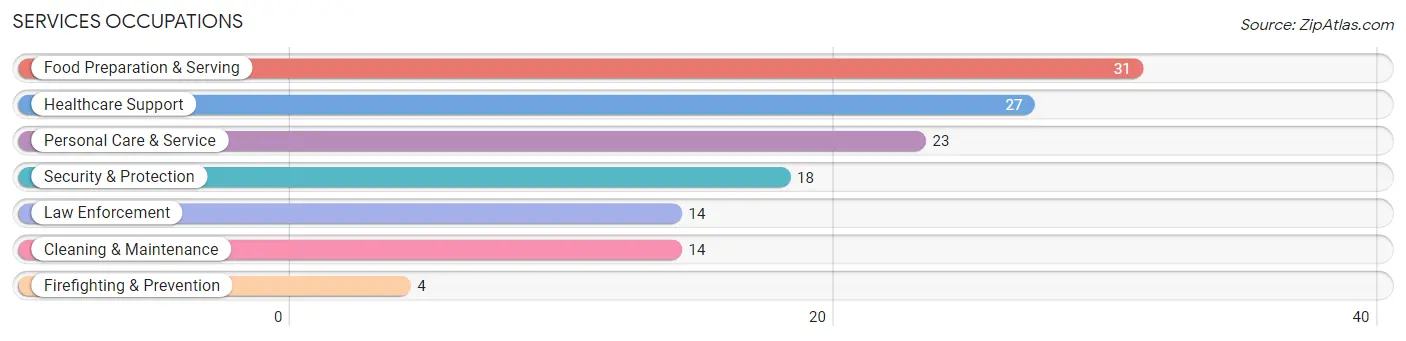
Services Occupations
The most common Services occupations in Red Hook are Food Preparation & Serving (31 | 3.2%), Healthcare Support (27 | 2.8%), Personal Care & Service (23 | 2.4%), Security & Protection (18 | 1.8%), and Law Enforcement (14 | 1.4%).
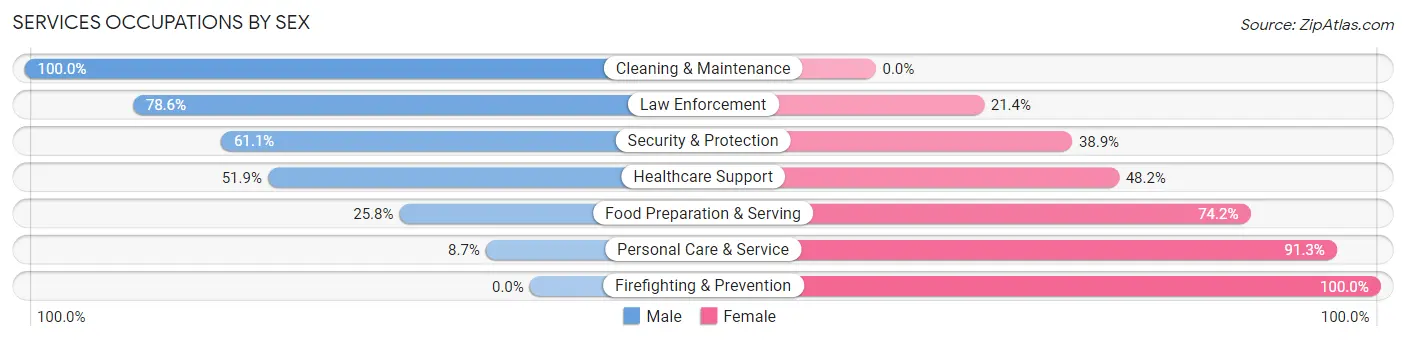
Services Occupations by Sex
Within the Services occupations in Red Hook, the most male-oriented occupations are Cleaning & Maintenance (100.0%), Law Enforcement (78.6%), and Security & Protection (61.1%), while the most female-oriented occupations are Firefighting & Prevention (100.0%), Personal Care & Service (91.3%), and Food Preparation & Serving (74.2%).
| Occupation | Male | Female |
| Healthcare Support | 14 (51.8%) | 13 (48.1%) |
| Security & Protection | 11 (61.1%) | 7 (38.9%) |
| Firefighting & Prevention | 0 (0.0%) | 4 (100.0%) |
| Law Enforcement | 11 (78.6%) | 3 (21.4%) |
| Food Preparation & Serving | 8 (25.8%) | 23 (74.2%) |
| Cleaning & Maintenance | 14 (100.0%) | 0 (0.0%) |
| Personal Care & Service | 2 (8.7%) | 21 (91.3%) |
| Total (Category) | 49 (43.4%) | 64 (56.6%) |
| Total (Overall) | 497 (50.8%) | 481 (49.2%) |
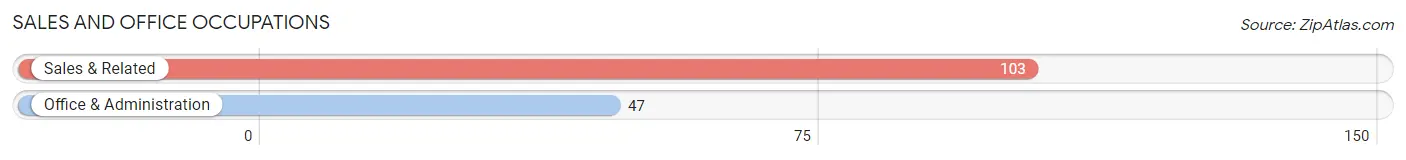
Sales and Office Occupations
The most common Sales and Office occupations in Red Hook are Sales & Related (103 | 10.5%), and Office & Administration (47 | 4.8%).
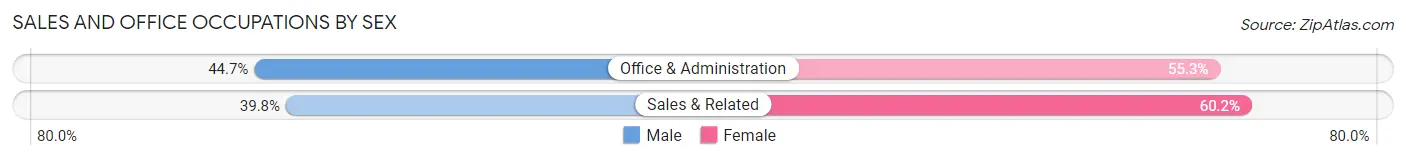
Sales and Office Occupations by Sex
| Occupation | Male | Female |
| Sales & Related | 41 (39.8%) | 62 (60.2%) |
| Office & Administration | 21 (44.7%) | 26 (55.3%) |
| Total (Category) | 62 (41.3%) | 88 (58.7%) |
| Total (Overall) | 497 (50.8%) | 481 (49.2%) |
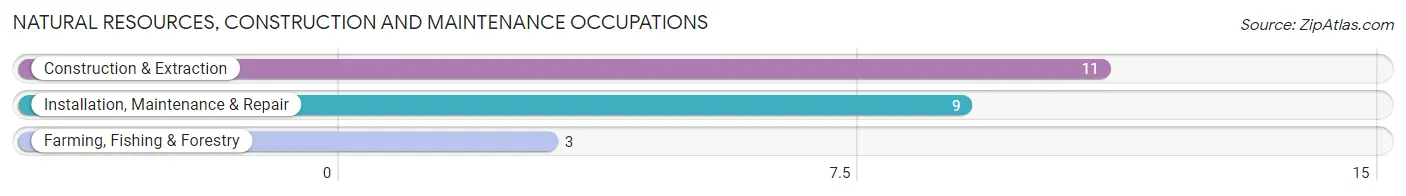
Natural Resources, Construction and Maintenance Occupations
The most common Natural Resources, Construction and Maintenance occupations in Red Hook are Construction & Extraction (11 | 1.1%), Installation, Maintenance & Repair (9 | 0.9%), and Farming, Fishing & Forestry (3 | 0.3%).
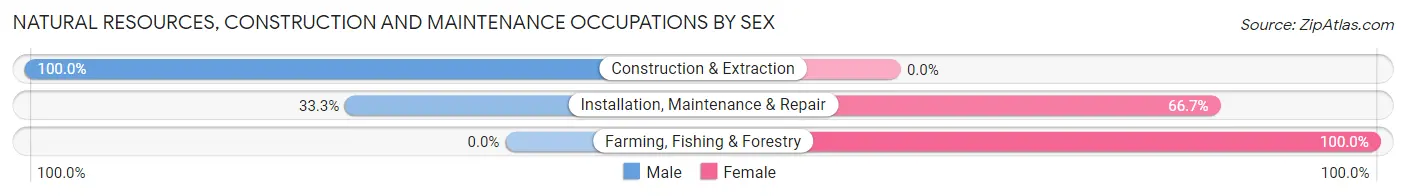
Natural Resources, Construction and Maintenance Occupations by Sex
| Occupation | Male | Female |
| Farming, Fishing & Forestry | 0 (0.0%) | 3 (100.0%) |
| Construction & Extraction | 11 (100.0%) | 0 (0.0%) |
| Installation, Maintenance & Repair | 3 (33.3%) | 6 (66.7%) |
| Total (Category) | 14 (60.9%) | 9 (39.1%) |
| Total (Overall) | 497 (50.8%) | 481 (49.2%) |
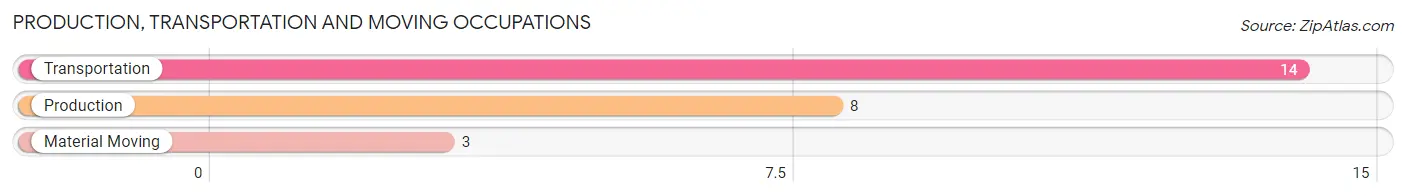
Production, Transportation and Moving Occupations
The most common Production, Transportation and Moving occupations in Red Hook are Transportation (14 | 1.4%), Production (8 | 0.8%), and Material Moving (3 | 0.3%).
Production, Transportation and Moving Occupations by Sex
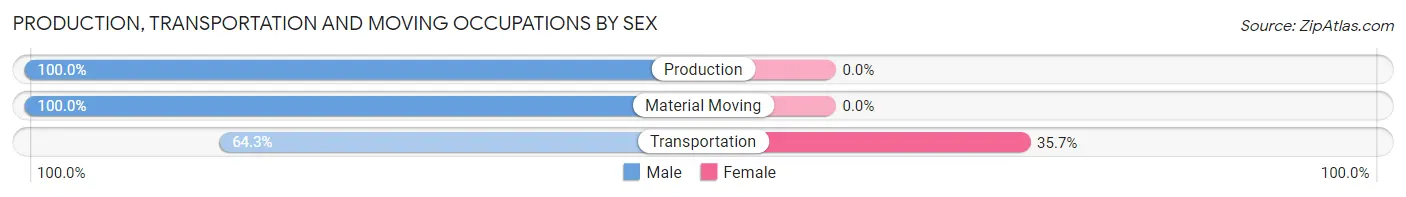
| Occupation | Male | Female |
| Production | 8 (100.0%) | 0 (0.0%) |
| Transportation | 9 (64.3%) | 5 (35.7%) |
| Material Moving | 3 (100.0%) | 0 (0.0%) |
| Total (Category) | 20 (80.0%) | 5 (20.0%) |
| Total (Overall) | 497 (50.8%) | 481 (49.2%) |
Employment Industries by Sex in Red Hook
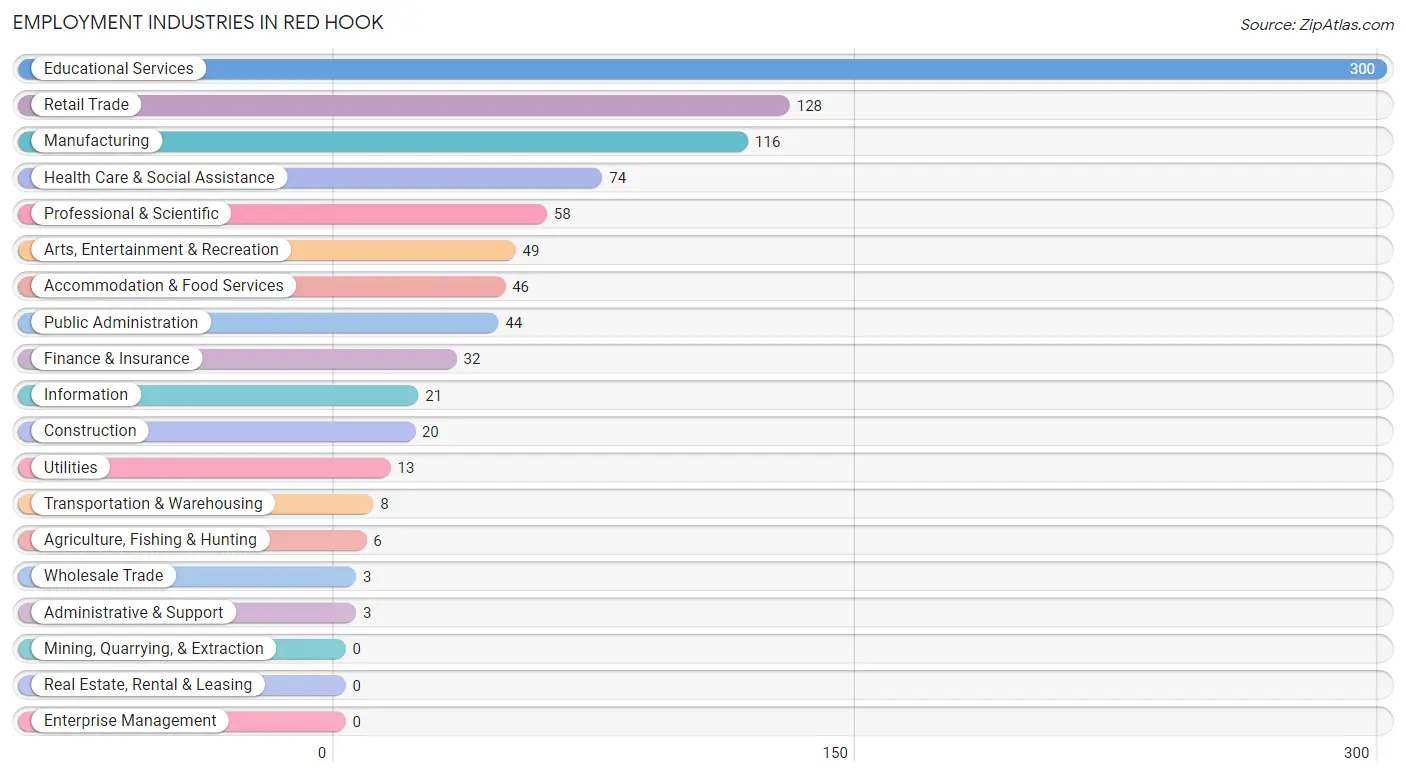
Employment Industries in Red Hook
The major employment industries in Red Hook include Educational Services (300 | 30.7%), Retail Trade (128 | 13.1%), Manufacturing (116 | 11.9%), Health Care & Social Assistance (74 | 7.6%), and Professional & Scientific (58 | 5.9%).
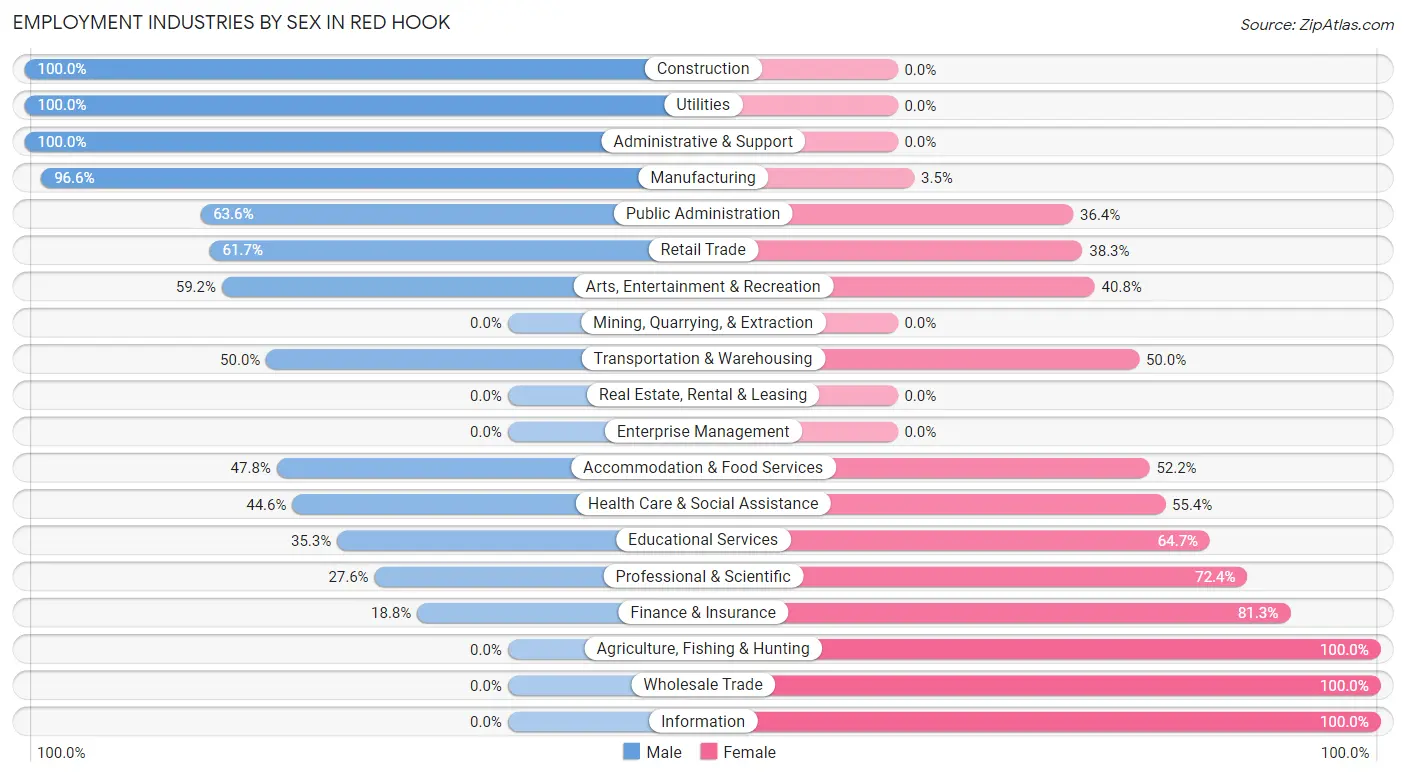
Employment Industries by Sex in Red Hook
The Red Hook industries that see more men than women are Construction (100.0%), Utilities (100.0%), and Administrative & Support (100.0%), whereas the industries that tend to have a higher number of women are Agriculture, Fishing & Hunting (100.0%), Wholesale Trade (100.0%), and Information (100.0%).
| Industry | Male | Female |
| Agriculture, Fishing & Hunting | 0 (0.0%) | 6 (100.0%) |
| Mining, Quarrying, & Extraction | 0 (0.0%) | 0 (0.0%) |
| Construction | 20 (100.0%) | 0 (0.0%) |
| Manufacturing | 112 (96.6%) | 4 (3.5%) |
| Wholesale Trade | 0 (0.0%) | 3 (100.0%) |
| Retail Trade | 79 (61.7%) | 49 (38.3%) |
| Transportation & Warehousing | 4 (50.0%) | 4 (50.0%) |
| Utilities | 13 (100.0%) | 0 (0.0%) |
| Information | 0 (0.0%) | 21 (100.0%) |
| Finance & Insurance | 6 (18.8%) | 26 (81.2%) |
| Real Estate, Rental & Leasing | 0 (0.0%) | 0 (0.0%) |
| Professional & Scientific | 16 (27.6%) | 42 (72.4%) |
| Enterprise Management | 0 (0.0%) | 0 (0.0%) |
| Administrative & Support | 3 (100.0%) | 0 (0.0%) |
| Educational Services | 106 (35.3%) | 194 (64.7%) |
| Health Care & Social Assistance | 33 (44.6%) | 41 (55.4%) |
| Arts, Entertainment & Recreation | 29 (59.2%) | 20 (40.8%) |
| Accommodation & Food Services | 22 (47.8%) | 24 (52.2%) |
| Public Administration | 28 (63.6%) | 16 (36.4%) |
| Total | 497 (50.8%) | 481 (49.2%) |
Education in Red Hook
School Enrollment in Red Hook
The most common levels of schooling among the 488 students in Red Hook are elementary school (137 | 28.1%), high school (102 | 20.9%), and college / undergraduate (86 | 17.6%).
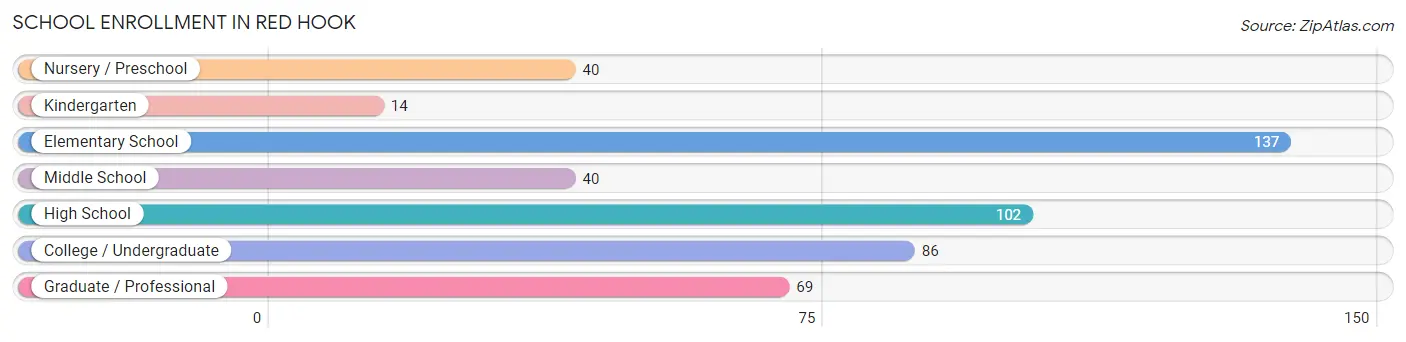
| School Level | # Students | % Students |
| Nursery / Preschool | 40 | 8.2% |
| Kindergarten | 14 | 2.9% |
| Elementary School | 137 | 28.1% |
| Middle School | 40 | 8.2% |
| High School | 102 | 20.9% |
| College / Undergraduate | 86 | 17.6% |
| Graduate / Professional | 69 | 14.1% |
| Total | 488 | 100.0% |
School Enrollment by Age by Funding Source in Red Hook
Out of a total of 488 students who are enrolled in schools in Red Hook, 152 (31.1%) attend a private institution, while the remaining 336 (68.9%) are enrolled in public schools. The age group of 25 to 34 year olds has the highest likelihood of being enrolled in private schools, with 60 (96.8% in the age bracket) enrolled. Conversely, the age group of 10 to 14 year olds has the lowest likelihood of being enrolled in a private school, with 95 (100.0% in the age bracket) attending a public institution.
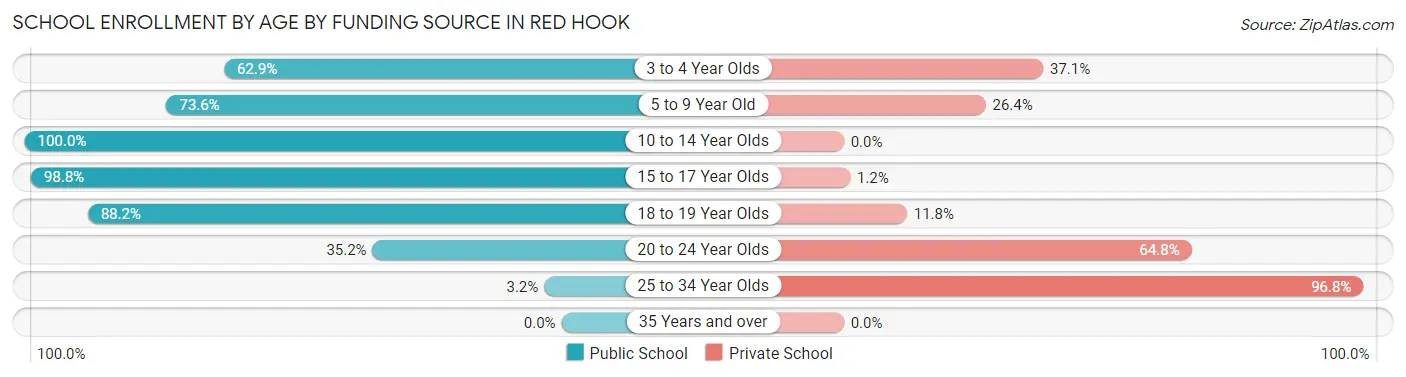
| Age Bracket | Public School | Private School |
| 3 to 4 Year Olds | 22 (62.9%) | 13 (37.1%) |
| 5 to 9 Year Old | 78 (73.6%) | 28 (26.4%) |
| 10 to 14 Year Olds | 95 (100.0%) | 0 (0.0%) |
| 15 to 17 Year Olds | 84 (98.8%) | 1 (1.2%) |
| 18 to 19 Year Olds | 30 (88.2%) | 4 (11.8%) |
| 20 to 24 Year Olds | 25 (35.2%) | 46 (64.8%) |
| 25 to 34 Year Olds | 2 (3.2%) | 60 (96.8%) |
| 35 Years and over | 0 (0.0%) | 0 (0.0%) |
| Total | 336 (68.9%) | 152 (31.1%) |
Educational Attainment by Field of Study in Red Hook
Visual & performing arts (147 | 16.7%), social sciences (139 | 15.8%), computers & mathematics (111 | 12.6%), education (87 | 9.9%), and liberal arts & history (87 | 9.9%) are the most common fields of study among 882 individuals in Red Hook who have obtained a bachelor's degree or higher.
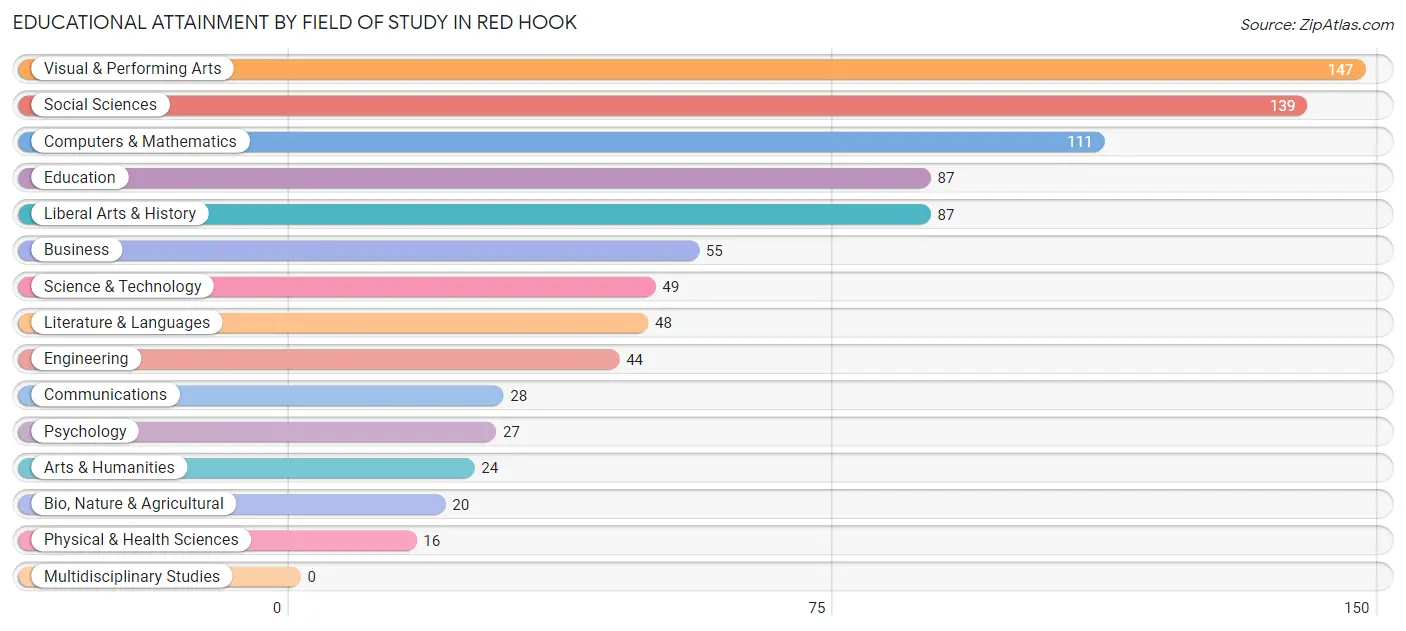
| Field of Study | # Graduates | % Graduates |
| Computers & Mathematics | 111 | 12.6% |
| Bio, Nature & Agricultural | 20 | 2.3% |
| Physical & Health Sciences | 16 | 1.8% |
| Psychology | 27 | 3.1% |
| Social Sciences | 139 | 15.8% |
| Engineering | 44 | 5.0% |
| Multidisciplinary Studies | 0 | 0.0% |
| Science & Technology | 49 | 5.6% |
| Business | 55 | 6.2% |
| Education | 87 | 9.9% |
| Literature & Languages | 48 | 5.4% |
| Liberal Arts & History | 87 | 9.9% |
| Visual & Performing Arts | 147 | 16.7% |
| Communications | 28 | 3.2% |
| Arts & Humanities | 24 | 2.7% |
| Total | 882 | 100.0% |
Transportation & Commute in Red Hook
Vehicle Availability by Sex in Red Hook
The most prevalent vehicle ownership categories in Red Hook are males with 2 vehicles (141, accounting for 28.4%) and females with 2 vehicles (203, making up 29.3%).
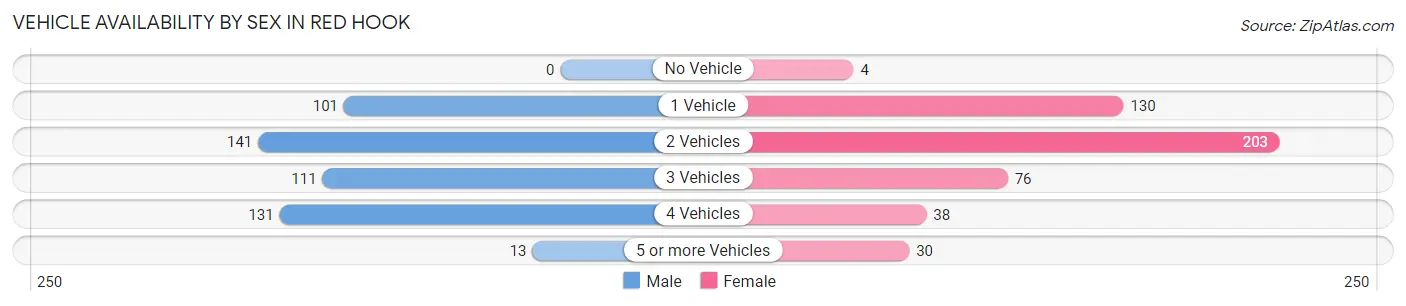
| Vehicles Available | Male | Female |
| No Vehicle | 0 (0.0%) | 4 (0.8%) |
| 1 Vehicle | 101 (20.3%) | 130 (27.0%) |
| 2 Vehicles | 141 (28.4%) | 203 (42.2%) |
| 3 Vehicles | 111 (22.3%) | 76 (15.8%) |
| 4 Vehicles | 131 (26.4%) | 38 (7.9%) |
| 5 or more Vehicles | 13 (2.6%) | 30 (6.2%) |
| Total | 497 (100.0%) | 481 (100.0%) |
Commute Time in Red Hook
The most frequently occuring commute durations in Red Hook are 10 to 14 minutes (299 commuters, 36.0%), 30 to 34 minutes (103 commuters, 12.4%), and 5 to 9 minutes (101 commuters, 12.2%).
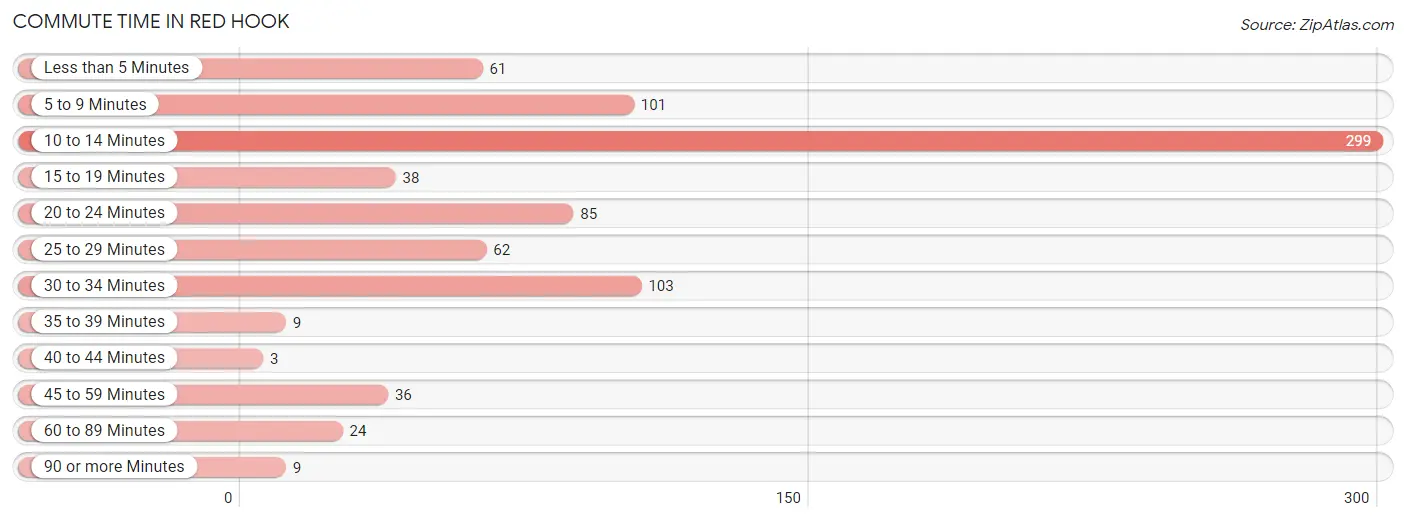
| Commute Time | # Commuters | % Commuters |
| Less than 5 Minutes | 61 | 7.3% |
| 5 to 9 Minutes | 101 | 12.2% |
| 10 to 14 Minutes | 299 | 36.0% |
| 15 to 19 Minutes | 38 | 4.6% |
| 20 to 24 Minutes | 85 | 10.2% |
| 25 to 29 Minutes | 62 | 7.5% |
| 30 to 34 Minutes | 103 | 12.4% |
| 35 to 39 Minutes | 9 | 1.1% |
| 40 to 44 Minutes | 3 | 0.4% |
| 45 to 59 Minutes | 36 | 4.3% |
| 60 to 89 Minutes | 24 | 2.9% |
| 90 or more Minutes | 9 | 1.1% |
Commute Time by Sex in Red Hook
The most common commute times in Red Hook are 10 to 14 minutes (159 commuters, 38.2%) for males and 10 to 14 minutes (140 commuters, 33.8%) for females.
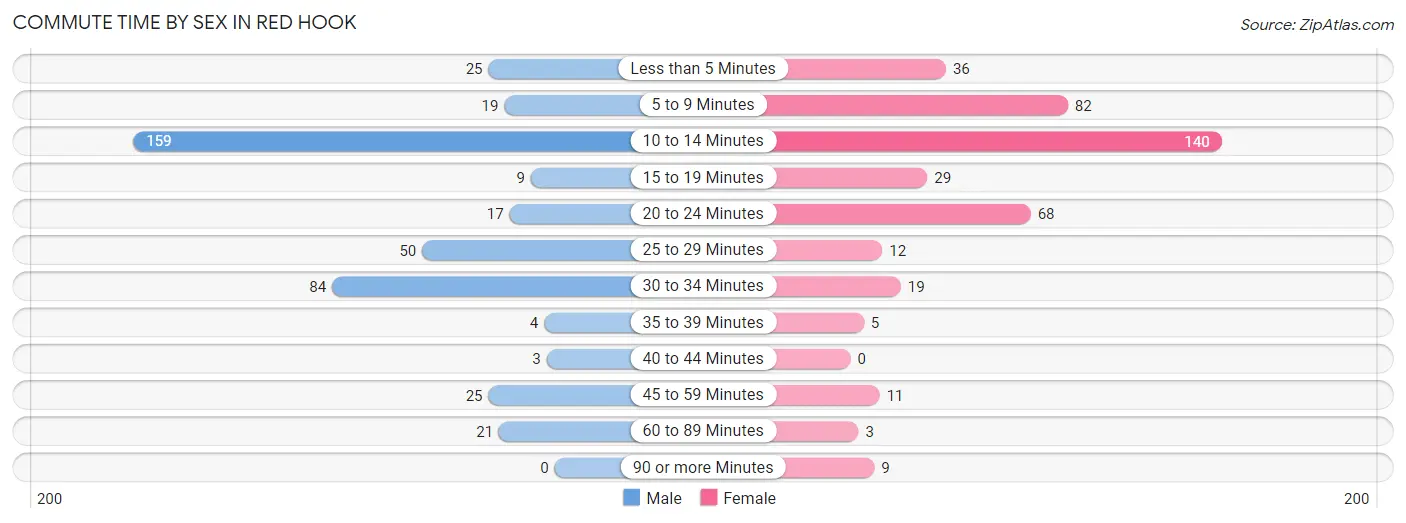
| Commute Time | Male | Female |
| Less than 5 Minutes | 25 (6.0%) | 36 (8.7%) |
| 5 to 9 Minutes | 19 (4.6%) | 82 (19.8%) |
| 10 to 14 Minutes | 159 (38.2%) | 140 (33.8%) |
| 15 to 19 Minutes | 9 (2.2%) | 29 (7.0%) |
| 20 to 24 Minutes | 17 (4.1%) | 68 (16.4%) |
| 25 to 29 Minutes | 50 (12.0%) | 12 (2.9%) |
| 30 to 34 Minutes | 84 (20.2%) | 19 (4.6%) |
| 35 to 39 Minutes | 4 (1.0%) | 5 (1.2%) |
| 40 to 44 Minutes | 3 (0.7%) | 0 (0.0%) |
| 45 to 59 Minutes | 25 (6.0%) | 11 (2.7%) |
| 60 to 89 Minutes | 21 (5.1%) | 3 (0.7%) |
| 90 or more Minutes | 0 (0.0%) | 9 (2.2%) |
Time of Departure to Work by Sex in Red Hook
The most frequent times of departure to work in Red Hook are 5:30 AM to 5:59 AM (103, 24.8%) for males and 7:30 AM to 7:59 AM (106, 25.6%) for females.
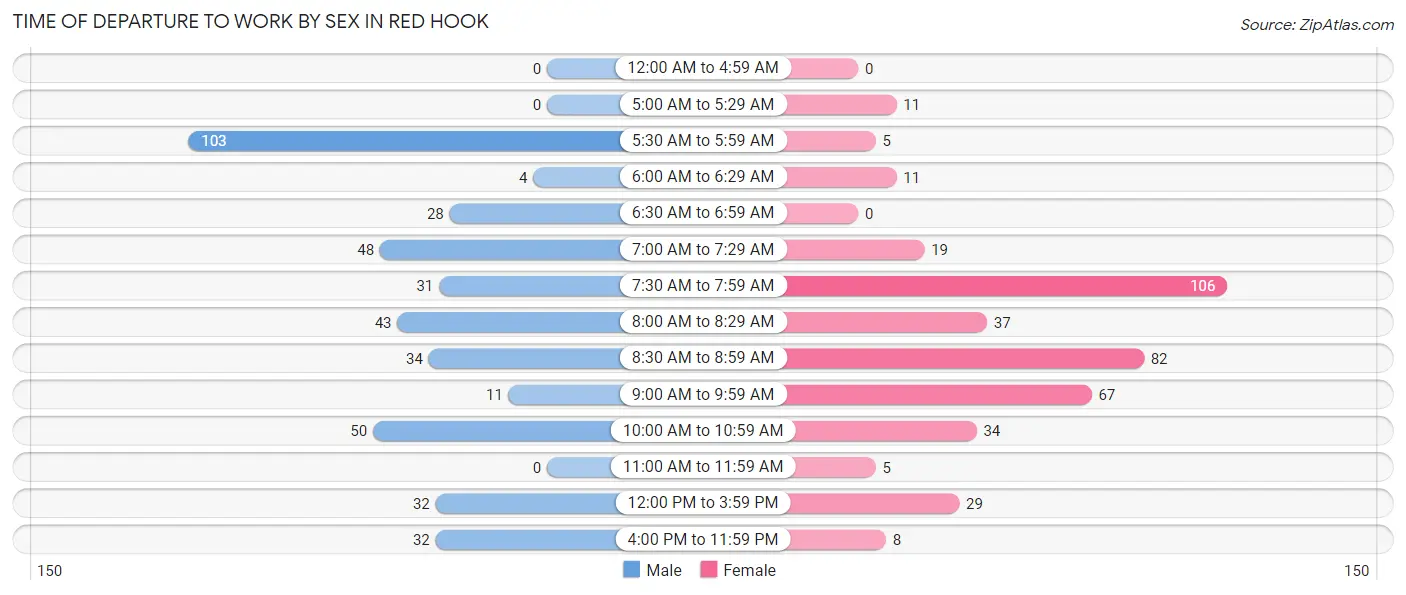
| Time of Departure | Male | Female |
| 12:00 AM to 4:59 AM | 0 (0.0%) | 0 (0.0%) |
| 5:00 AM to 5:29 AM | 0 (0.0%) | 11 (2.7%) |
| 5:30 AM to 5:59 AM | 103 (24.8%) | 5 (1.2%) |
| 6:00 AM to 6:29 AM | 4 (1.0%) | 11 (2.7%) |
| 6:30 AM to 6:59 AM | 28 (6.7%) | 0 (0.0%) |
| 7:00 AM to 7:29 AM | 48 (11.5%) | 19 (4.6%) |
| 7:30 AM to 7:59 AM | 31 (7.4%) | 106 (25.6%) |
| 8:00 AM to 8:29 AM | 43 (10.3%) | 37 (8.9%) |
| 8:30 AM to 8:59 AM | 34 (8.2%) | 82 (19.8%) |
| 9:00 AM to 9:59 AM | 11 (2.6%) | 67 (16.2%) |
| 10:00 AM to 10:59 AM | 50 (12.0%) | 34 (8.2%) |
| 11:00 AM to 11:59 AM | 0 (0.0%) | 5 (1.2%) |
| 12:00 PM to 3:59 PM | 32 (7.7%) | 29 (7.0%) |
| 4:00 PM to 11:59 PM | 32 (7.7%) | 8 (1.9%) |
| Total | 416 (100.0%) | 414 (100.0%) |
Housing Occupancy in Red Hook
Occupancy by Ownership in Red Hook
Of the total 865 dwellings in Red Hook, owner-occupied units account for 547 (63.2%), while renter-occupied units make up 318 (36.8%).
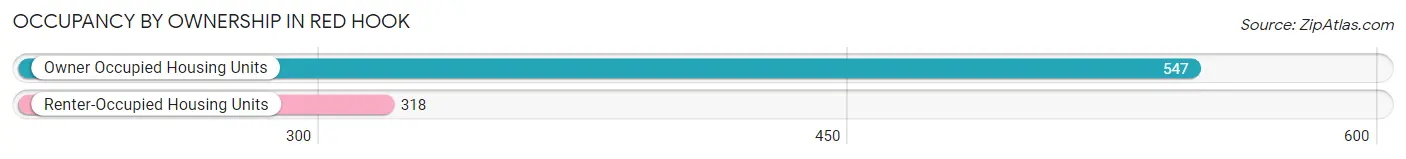
| Occupancy | # Housing Units | % Housing Units |
| Owner Occupied Housing Units | 547 | 63.2% |
| Renter-Occupied Housing Units | 318 | 36.8% |
| Total Occupied Housing Units | 865 | 100.0% |
Occupancy by Household Size in Red Hook
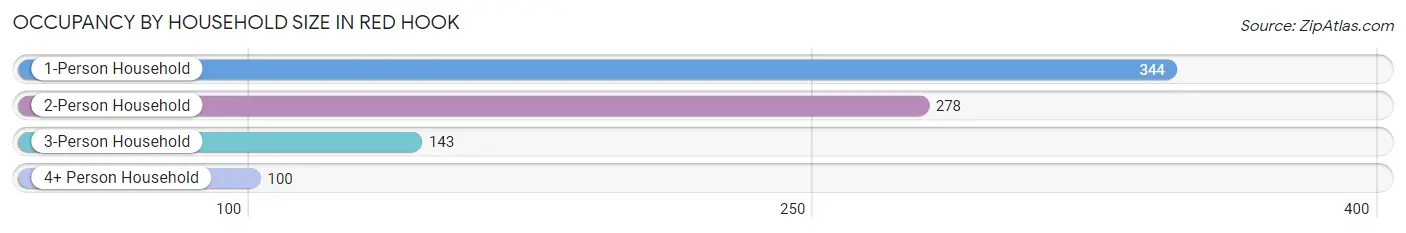
| Household Size | # Housing Units | % Housing Units |
| 1-Person Household | 344 | 39.8% |
| 2-Person Household | 278 | 32.1% |
| 3-Person Household | 143 | 16.5% |
| 4+ Person Household | 100 | 11.6% |
| Total Housing Units | 865 | 100.0% |
Occupancy by Ownership by Household Size in Red Hook
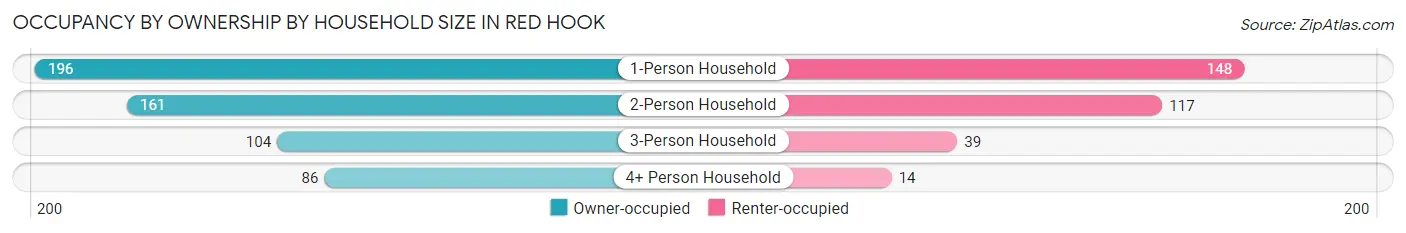
| Household Size | Owner-occupied | Renter-occupied |
| 1-Person Household | 196 (57.0%) | 148 (43.0%) |
| 2-Person Household | 161 (57.9%) | 117 (42.1%) |
| 3-Person Household | 104 (72.7%) | 39 (27.3%) |
| 4+ Person Household | 86 (86.0%) | 14 (14.0%) |
| Total Housing Units | 547 (63.2%) | 318 (36.8%) |
Occupancy by Educational Attainment in Red Hook
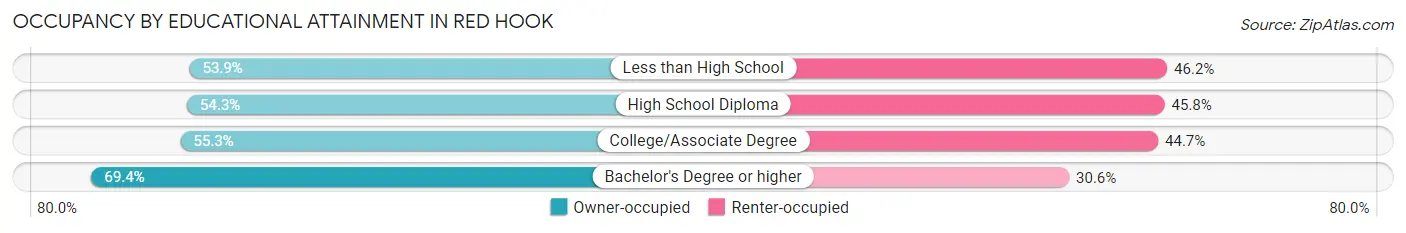
| Household Size | Owner-occupied | Renter-occupied |
| Less than High School | 7 (53.8%) | 6 (46.2%) |
| High School Diploma | 83 (54.2%) | 70 (45.8%) |
| College/Associate Degree | 110 (55.3%) | 89 (44.7%) |
| Bachelor's Degree or higher | 347 (69.4%) | 153 (30.6%) |
Occupancy by Age of Householder in Red Hook
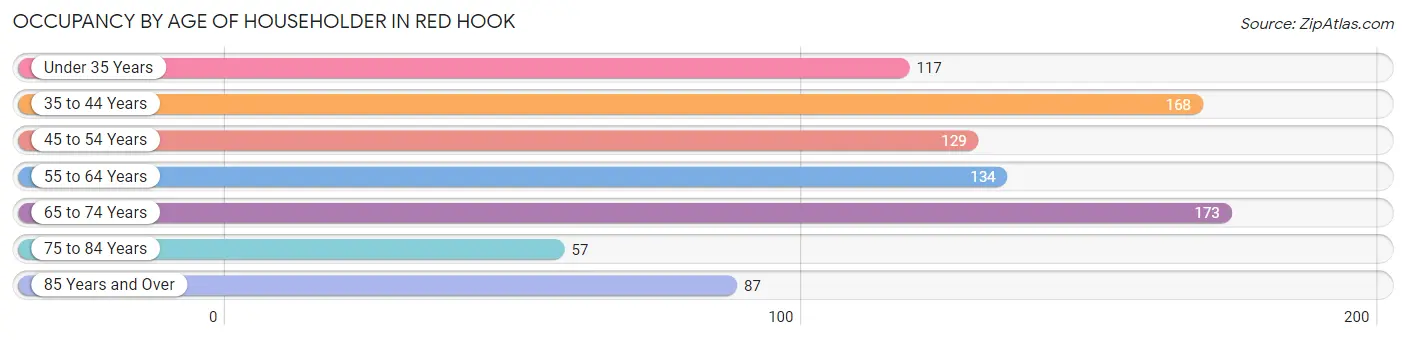
| Age Bracket | # Households | % Households |
| Under 35 Years | 117 | 13.5% |
| 35 to 44 Years | 168 | 19.4% |
| 45 to 54 Years | 129 | 14.9% |
| 55 to 64 Years | 134 | 15.5% |
| 65 to 74 Years | 173 | 20.0% |
| 75 to 84 Years | 57 | 6.6% |
| 85 Years and Over | 87 | 10.1% |
| Total | 865 | 100.0% |
Housing Finances in Red Hook
Median Income by Occupancy in Red Hook
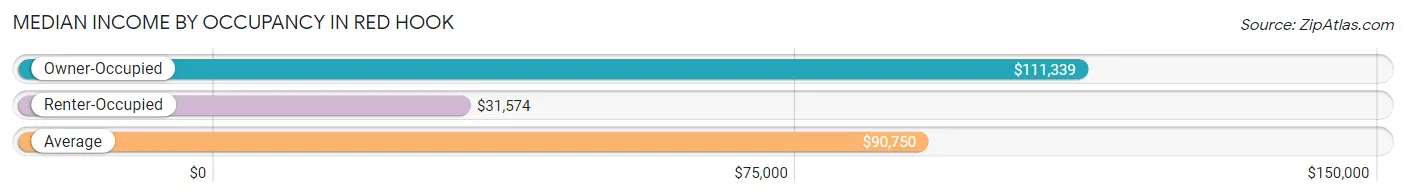
| Occupancy Type | # Households | Median Income |
| Owner-Occupied | 547 (63.2%) | $111,339 |
| Renter-Occupied | 318 (36.8%) | $31,574 |
| Average | 865 (100.0%) | $90,750 |
Occupancy by Householder Income Bracket in Red Hook
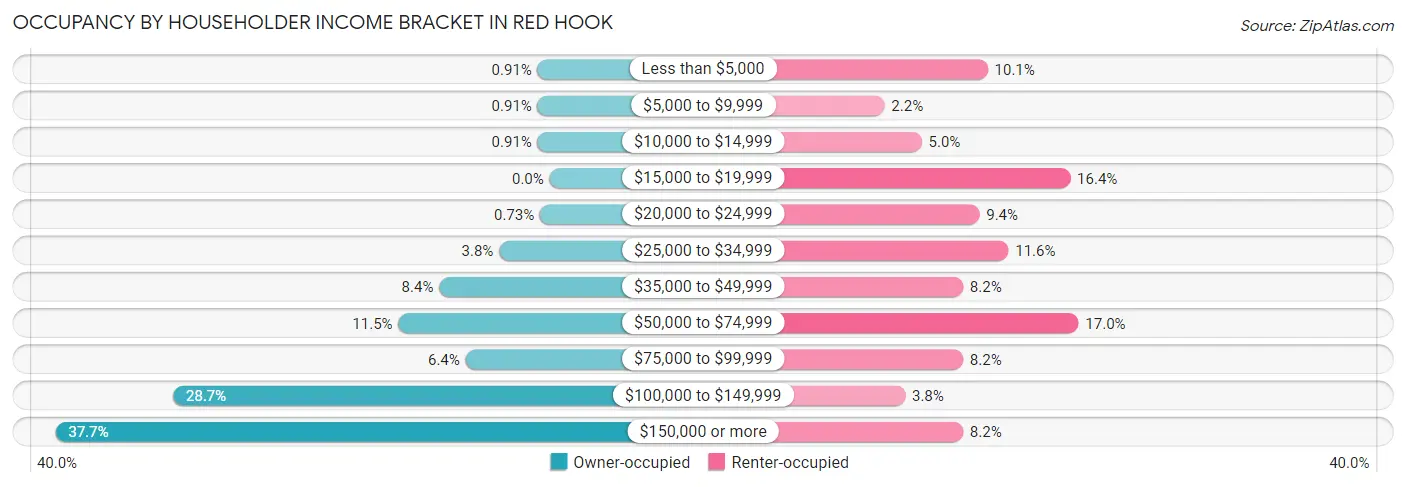
| Income Bracket | Owner-occupied | Renter-occupied |
| Less than $5,000 | 5 (0.9%) | 32 (10.1%) |
| $5,000 to $9,999 | 5 (0.9%) | 7 (2.2%) |
| $10,000 to $14,999 | 5 (0.9%) | 16 (5.0%) |
| $15,000 to $19,999 | 0 (0.0%) | 52 (16.4%) |
| $20,000 to $24,999 | 4 (0.7%) | 30 (9.4%) |
| $25,000 to $34,999 | 21 (3.8%) | 37 (11.6%) |
| $35,000 to $49,999 | 46 (8.4%) | 26 (8.2%) |
| $50,000 to $74,999 | 63 (11.5%) | 54 (17.0%) |
| $75,000 to $99,999 | 35 (6.4%) | 26 (8.2%) |
| $100,000 to $149,999 | 157 (28.7%) | 12 (3.8%) |
| $150,000 or more | 206 (37.7%) | 26 (8.2%) |
| Total | 547 (100.0%) | 318 (100.0%) |
Monthly Housing Cost Tiers in Red Hook
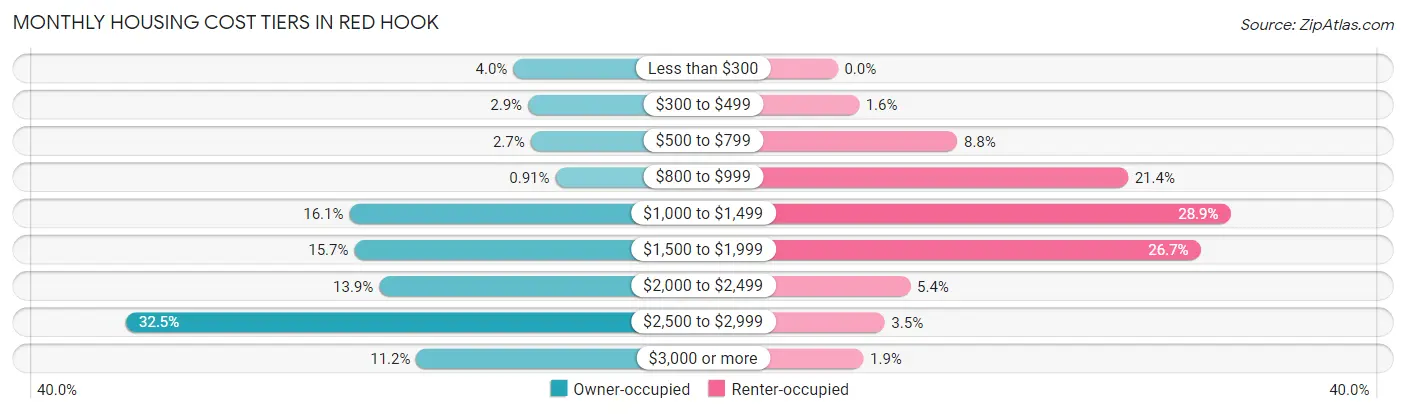
| Monthly Cost | Owner-occupied | Renter-occupied |
| Less than $300 | 22 (4.0%) | 0 (0.0%) |
| $300 to $499 | 16 (2.9%) | 5 (1.6%) |
| $500 to $799 | 15 (2.7%) | 28 (8.8%) |
| $800 to $999 | 5 (0.9%) | 68 (21.4%) |
| $1,000 to $1,499 | 88 (16.1%) | 92 (28.9%) |
| $1,500 to $1,999 | 86 (15.7%) | 85 (26.7%) |
| $2,000 to $2,499 | 76 (13.9%) | 17 (5.3%) |
| $2,500 to $2,999 | 178 (32.5%) | 11 (3.5%) |
| $3,000 or more | 61 (11.2%) | 6 (1.9%) |
| Total | 547 (100.0%) | 318 (100.0%) |
Physical Housing Characteristics in Red Hook
Housing Structures in Red Hook
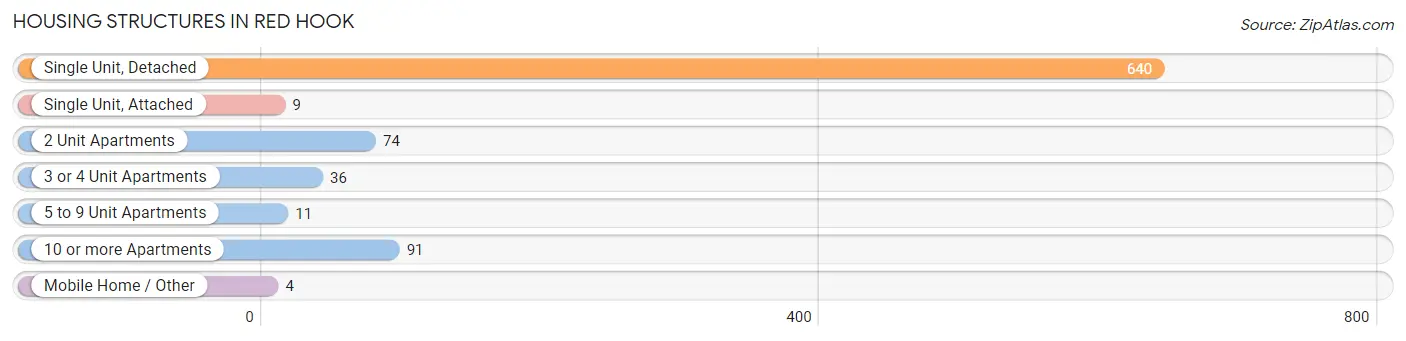
| Structure Type | # Housing Units | % Housing Units |
| Single Unit, Detached | 640 | 74.0% |
| Single Unit, Attached | 9 | 1.0% |
| 2 Unit Apartments | 74 | 8.6% |
| 3 or 4 Unit Apartments | 36 | 4.2% |
| 5 to 9 Unit Apartments | 11 | 1.3% |
| 10 or more Apartments | 91 | 10.5% |
| Mobile Home / Other | 4 | 0.5% |
| Total | 865 | 100.0% |
Housing Structures by Occupancy in Red Hook
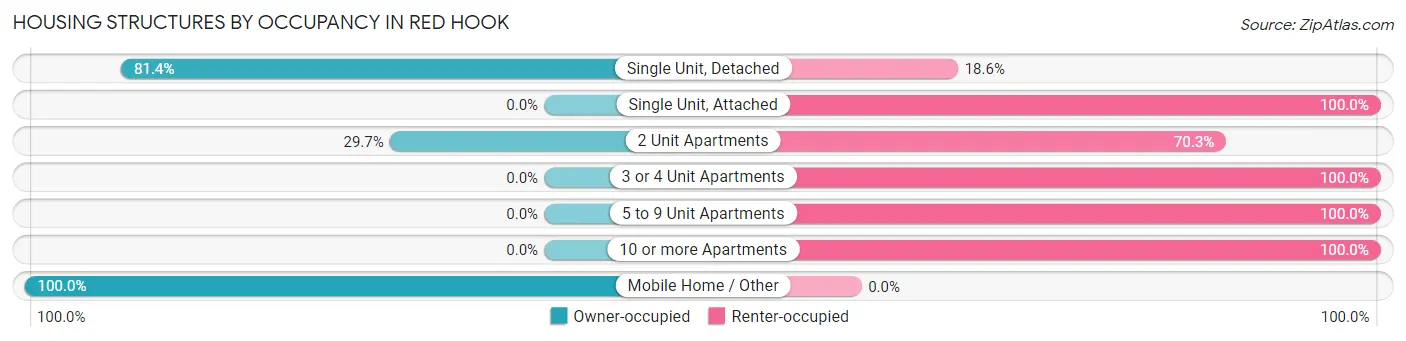
| Structure Type | Owner-occupied | Renter-occupied |
| Single Unit, Detached | 521 (81.4%) | 119 (18.6%) |
| Single Unit, Attached | 0 (0.0%) | 9 (100.0%) |
| 2 Unit Apartments | 22 (29.7%) | 52 (70.3%) |
| 3 or 4 Unit Apartments | 0 (0.0%) | 36 (100.0%) |
| 5 to 9 Unit Apartments | 0 (0.0%) | 11 (100.0%) |
| 10 or more Apartments | 0 (0.0%) | 91 (100.0%) |
| Mobile Home / Other | 4 (100.0%) | 0 (0.0%) |
| Total | 547 (63.2%) | 318 (36.8%) |
Housing Structures by Number of Rooms in Red Hook
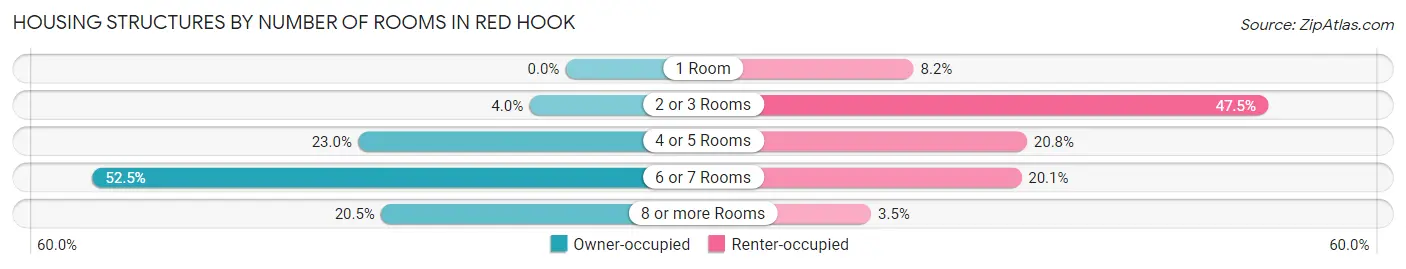
| Number of Rooms | Owner-occupied | Renter-occupied |
| 1 Room | 0 (0.0%) | 26 (8.2%) |
| 2 or 3 Rooms | 22 (4.0%) | 151 (47.5%) |
| 4 or 5 Rooms | 126 (23.0%) | 66 (20.7%) |
| 6 or 7 Rooms | 287 (52.5%) | 64 (20.1%) |
| 8 or more Rooms | 112 (20.5%) | 11 (3.5%) |
| Total | 547 (100.0%) | 318 (100.0%) |
Housing Structure by Heating Type in Red Hook
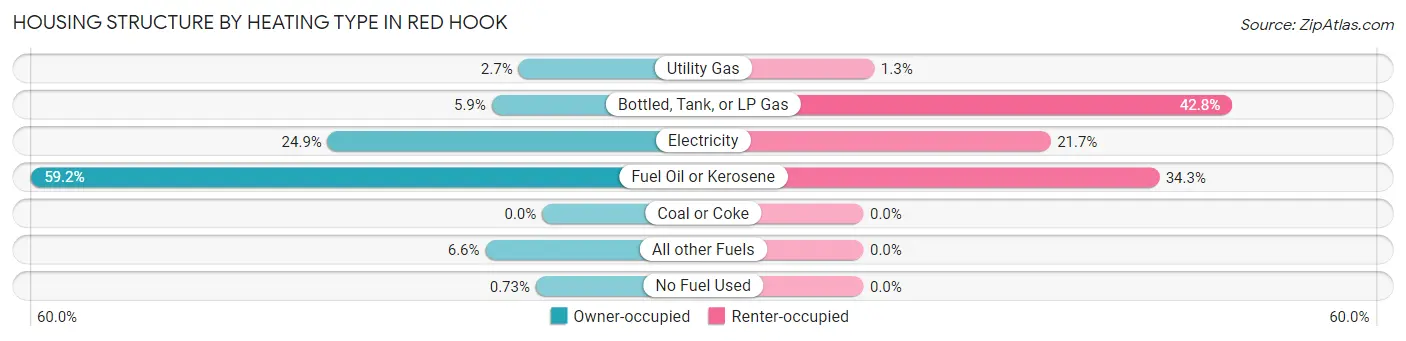
| Heating Type | Owner-occupied | Renter-occupied |
| Utility Gas | 15 (2.7%) | 4 (1.3%) |
| Bottled, Tank, or LP Gas | 32 (5.9%) | 136 (42.8%) |
| Electricity | 136 (24.9%) | 69 (21.7%) |
| Fuel Oil or Kerosene | 324 (59.2%) | 109 (34.3%) |
| Coal or Coke | 0 (0.0%) | 0 (0.0%) |
| All other Fuels | 36 (6.6%) | 0 (0.0%) |
| No Fuel Used | 4 (0.7%) | 0 (0.0%) |
| Total | 547 (100.0%) | 318 (100.0%) |
Household Vehicle Usage in Red Hook
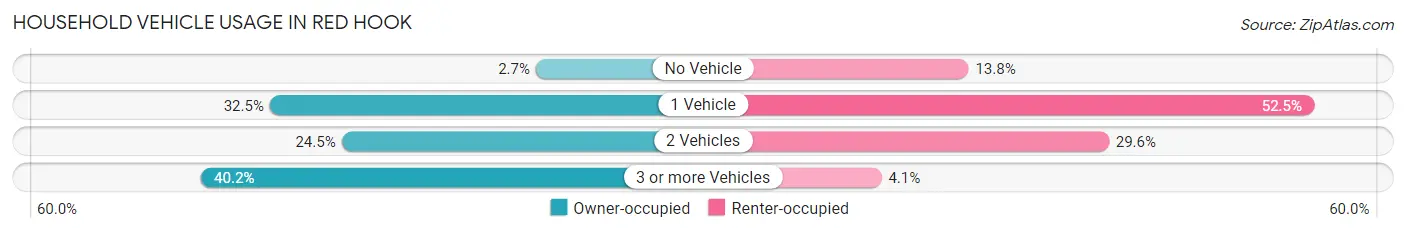
| Vehicles per Household | Owner-occupied | Renter-occupied |
| No Vehicle | 15 (2.7%) | 44 (13.8%) |
| 1 Vehicle | 178 (32.5%) | 167 (52.5%) |
| 2 Vehicles | 134 (24.5%) | 94 (29.6%) |
| 3 or more Vehicles | 220 (40.2%) | 13 (4.1%) |
| Total | 547 (100.0%) | 318 (100.0%) |
Real Estate & Mortgages in Red Hook
Real Estate and Mortgage Overview in Red Hook
| Characteristic | Without Mortgage | With Mortgage |
| Housing Units | 167 | 380 |
| Median Property Value | $293,800 | $326,000 |
| Median Household Income | $50,795 | $193 |
| Monthly Housing Costs | $1,105 | $61 |
| Real Estate Taxes | $7,375 | $11 |
Property Value by Mortgage Status in Red Hook
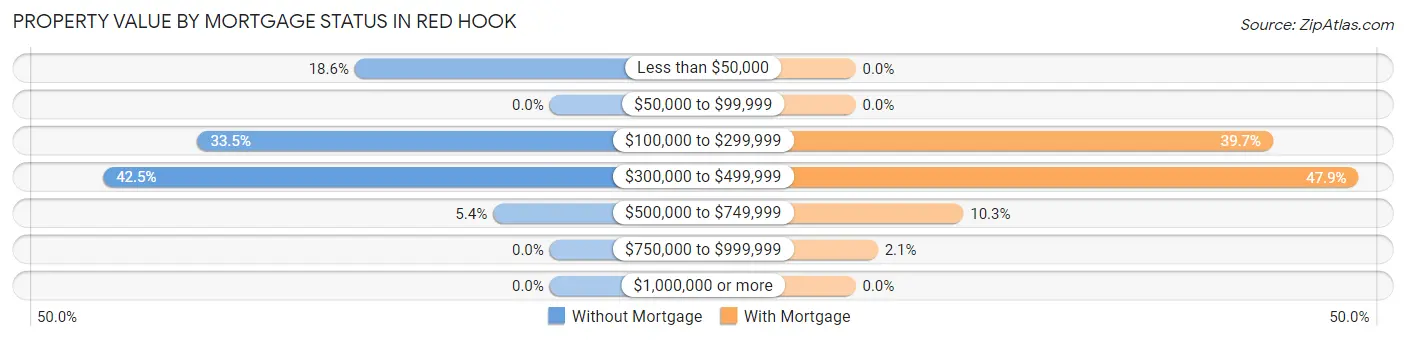
| Property Value | Without Mortgage | With Mortgage |
| Less than $50,000 | 31 (18.6%) | 0 (0.0%) |
| $50,000 to $99,999 | 0 (0.0%) | 0 (0.0%) |
| $100,000 to $299,999 | 56 (33.5%) | 151 (39.7%) |
| $300,000 to $499,999 | 71 (42.5%) | 182 (47.9%) |
| $500,000 to $749,999 | 9 (5.4%) | 39 (10.3%) |
| $750,000 to $999,999 | 0 (0.0%) | 8 (2.1%) |
| $1,000,000 or more | 0 (0.0%) | 0 (0.0%) |
| Total | 167 (100.0%) | 380 (100.0%) |
Household Income by Mortgage Status in Red Hook
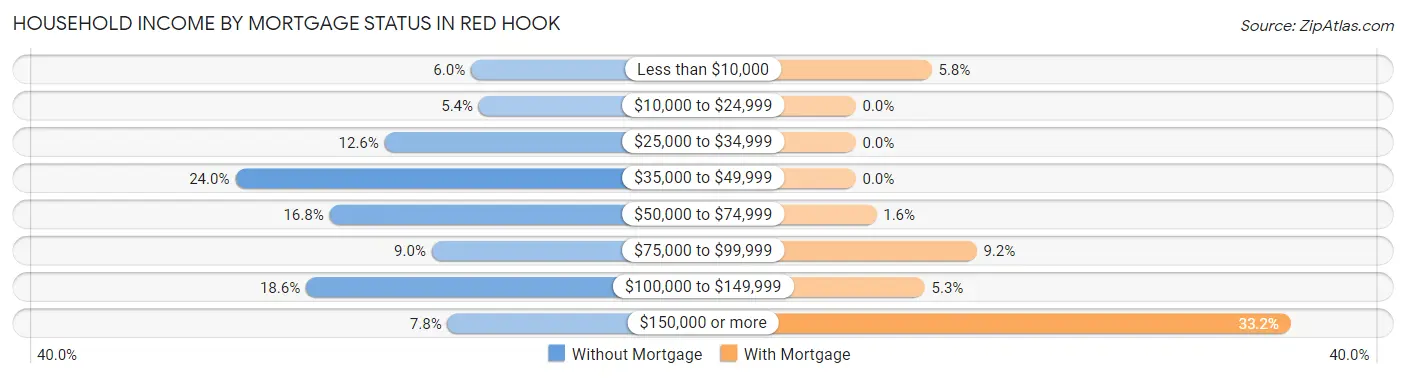
| Household Income | Without Mortgage | With Mortgage |
| Less than $10,000 | 10 (6.0%) | 22 (5.8%) |
| $10,000 to $24,999 | 9 (5.4%) | 0 (0.0%) |
| $25,000 to $34,999 | 21 (12.6%) | 0 (0.0%) |
| $35,000 to $49,999 | 40 (23.9%) | 0 (0.0%) |
| $50,000 to $74,999 | 28 (16.8%) | 6 (1.6%) |
| $75,000 to $99,999 | 15 (9.0%) | 35 (9.2%) |
| $100,000 to $149,999 | 31 (18.6%) | 20 (5.3%) |
| $150,000 or more | 13 (7.8%) | 126 (33.2%) |
| Total | 167 (100.0%) | 380 (100.0%) |
Property Value to Household Income Ratio in Red Hook
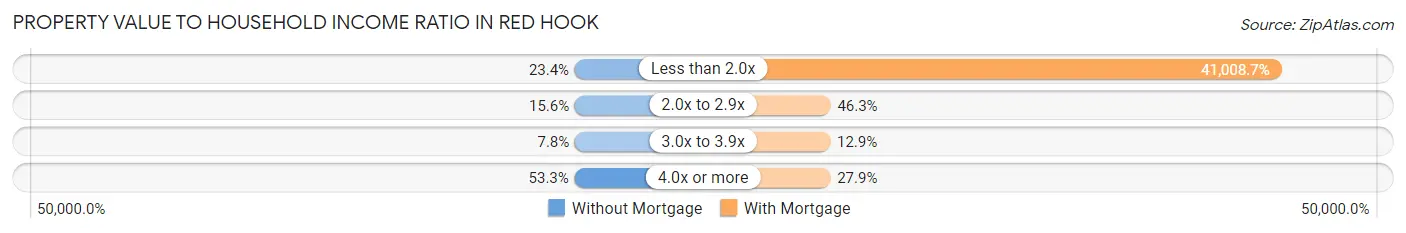
| Value-to-Income Ratio | Without Mortgage | With Mortgage |
| Less than 2.0x | 39 (23.4%) | 155,833 (41,008.7%) |
| 2.0x to 2.9x | 26 (15.6%) | 176 (46.3%) |
| 3.0x to 3.9x | 13 (7.8%) | 49 (12.9%) |
| 4.0x or more | 89 (53.3%) | 106 (27.9%) |
| Total | 167 (100.0%) | 380 (100.0%) |
Real Estate Taxes by Mortgage Status in Red Hook
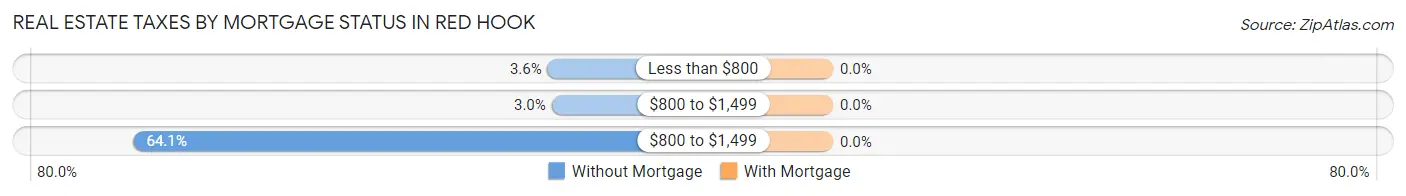
| Property Taxes | Without Mortgage | With Mortgage |
| Less than $800 | 6 (3.6%) | 0 (0.0%) |
| $800 to $1,499 | 5 (3.0%) | 0 (0.0%) |
| $800 to $1,499 | 107 (64.1%) | 0 (0.0%) |
| Total | 167 (100.0%) | 380 (100.0%) |
Health & Disability in Red Hook
Health Insurance Coverage by Age in Red Hook
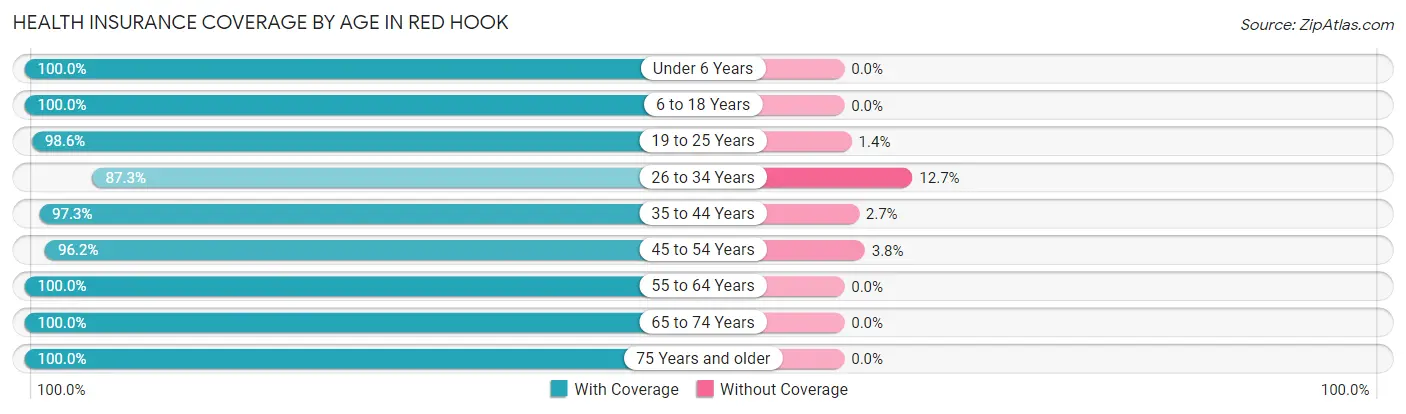
| Age Bracket | With Coverage | Without Coverage |
| Under 6 Years | 61 (100.0%) | 0 (0.0%) |
| 6 to 18 Years | 293 (100.0%) | 0 (0.0%) |
| 19 to 25 Years | 216 (98.6%) | 3 (1.4%) |
| 26 to 34 Years | 110 (87.3%) | 16 (12.7%) |
| 35 to 44 Years | 251 (97.3%) | 7 (2.7%) |
| 45 to 54 Years | 252 (96.2%) | 10 (3.8%) |
| 55 to 64 Years | 169 (100.0%) | 0 (0.0%) |
| 65 to 74 Years | 235 (100.0%) | 0 (0.0%) |
| 75 Years and older | 193 (100.0%) | 0 (0.0%) |
| Total | 1,780 (98.0%) | 36 (2.0%) |
Health Insurance Coverage by Citizenship Status in Red Hook
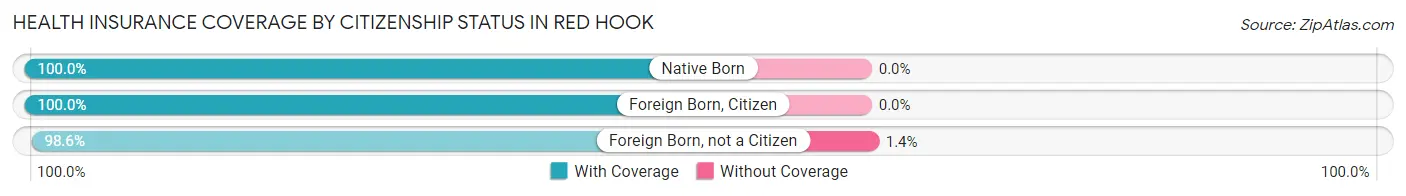
| Citizenship Status | With Coverage | Without Coverage |
| Native Born | 61 (100.0%) | 0 (0.0%) |
| Foreign Born, Citizen | 293 (100.0%) | 0 (0.0%) |
| Foreign Born, not a Citizen | 216 (98.6%) | 3 (1.4%) |
Health Insurance Coverage by Household Income in Red Hook
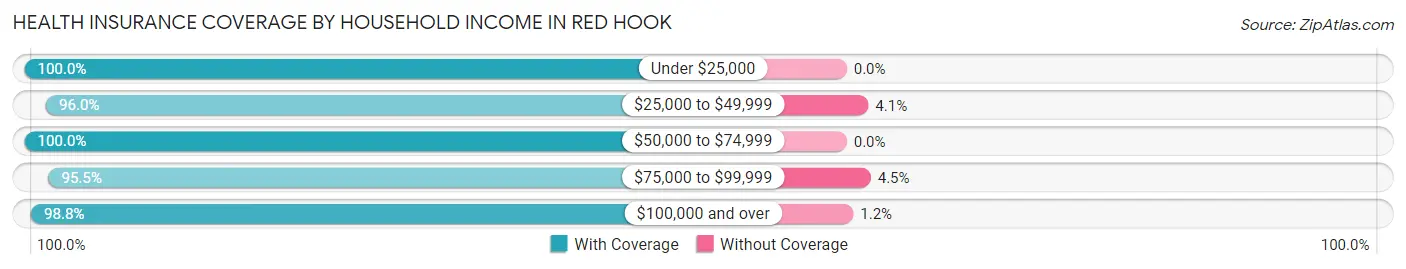
| Household Income | With Coverage | Without Coverage |
| Under $25,000 | 218 (100.0%) | 0 (0.0%) |
| $25,000 to $49,999 | 142 (96.0%) | 6 (4.1%) |
| $50,000 to $74,999 | 229 (100.0%) | 0 (0.0%) |
| $75,000 to $99,999 | 149 (95.5%) | 7 (4.5%) |
| $100,000 and over | 1,042 (98.8%) | 13 (1.2%) |
Public vs Private Health Insurance Coverage by Age in Red Hook
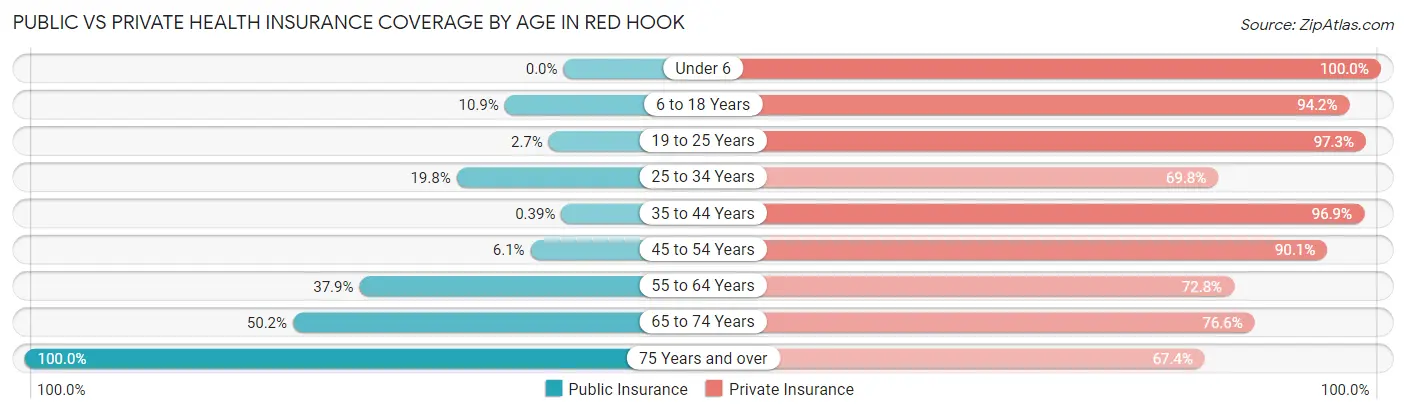
| Age Bracket | Public Insurance | Private Insurance |
| Under 6 | 0 (0.0%) | 61 (100.0%) |
| 6 to 18 Years | 32 (10.9%) | 276 (94.2%) |
| 19 to 25 Years | 6 (2.7%) | 213 (97.3%) |
| 25 to 34 Years | 25 (19.8%) | 88 (69.8%) |
| 35 to 44 Years | 1 (0.4%) | 250 (96.9%) |
| 45 to 54 Years | 16 (6.1%) | 236 (90.1%) |
| 55 to 64 Years | 64 (37.9%) | 123 (72.8%) |
| 65 to 74 Years | 118 (50.2%) | 180 (76.6%) |
| 75 Years and over | 193 (100.0%) | 130 (67.4%) |
| Total | 455 (25.1%) | 1,557 (85.7%) |
Disability Status by Sex by Age in Red Hook
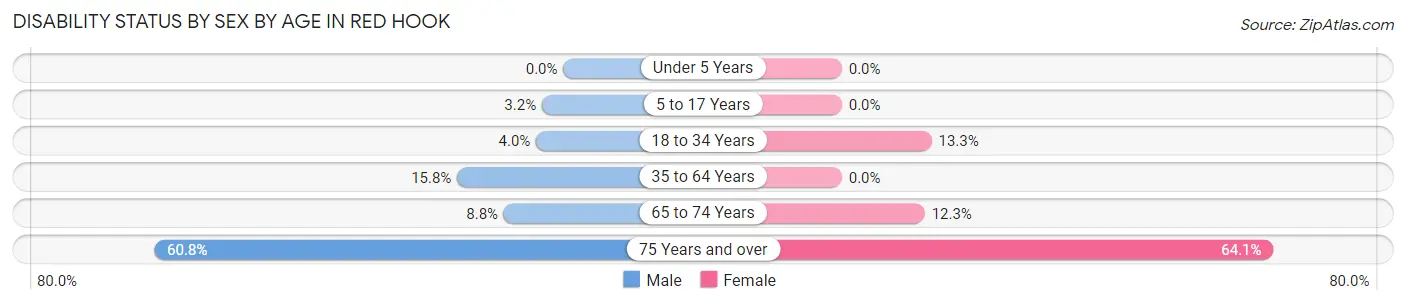
| Age Bracket | Male | Female |
| Under 5 Years | 0 (0.0%) | 0 (0.0%) |
| 5 to 17 Years | 4 (3.2%) | 0 (0.0%) |
| 18 to 34 Years | 6 (4.0%) | 28 (13.3%) |
| 35 to 64 Years | 52 (15.8%) | 0 (0.0%) |
| 65 to 74 Years | 15 (8.8%) | 8 (12.3%) |
| 75 Years and over | 31 (60.8%) | 91 (64.1%) |
Disability Class by Sex by Age in Red Hook
Disability Class: Hearing Difficulty
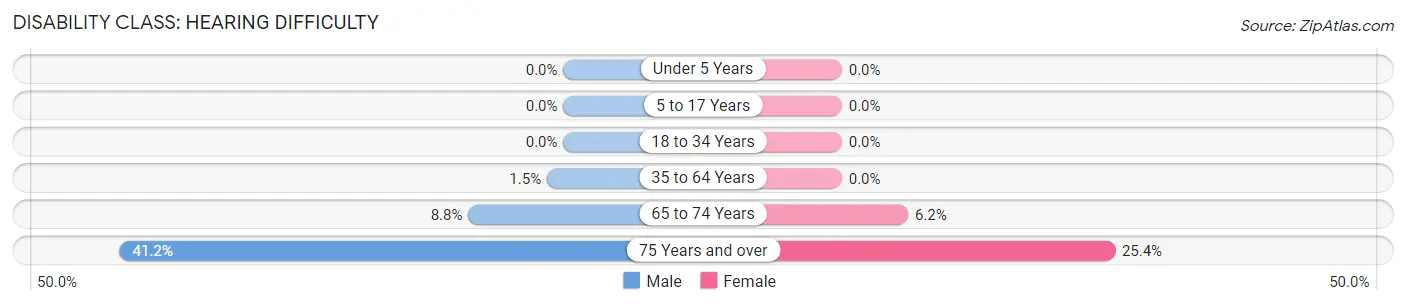
| Age Bracket | Male | Female |
| Under 5 Years | 0 (0.0%) | 0 (0.0%) |
| 5 to 17 Years | 0 (0.0%) | 0 (0.0%) |
| 18 to 34 Years | 0 (0.0%) | 0 (0.0%) |
| 35 to 64 Years | 5 (1.5%) | 0 (0.0%) |
| 65 to 74 Years | 15 (8.8%) | 4 (6.1%) |
| 75 Years and over | 21 (41.2%) | 36 (25.4%) |
Disability Class: Vision Difficulty
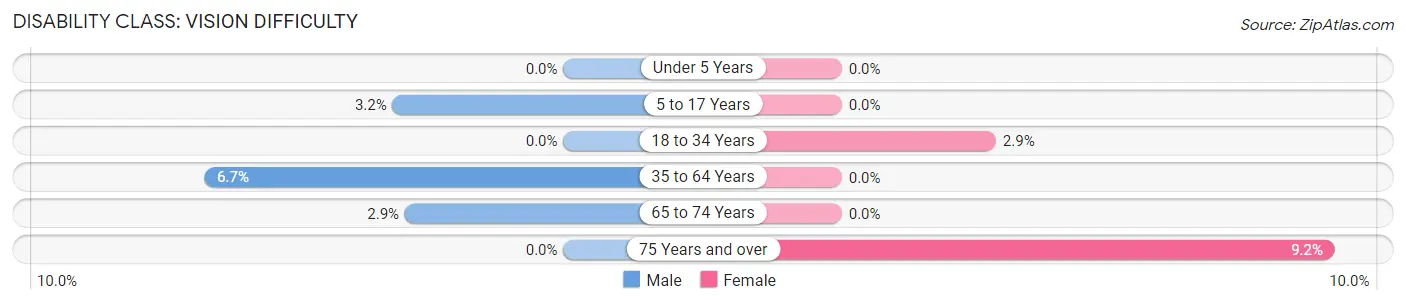
| Age Bracket | Male | Female |
| Under 5 Years | 0 (0.0%) | 0 (0.0%) |
| 5 to 17 Years | 4 (3.2%) | 0 (0.0%) |
| 18 to 34 Years | 0 (0.0%) | 6 (2.9%) |
| 35 to 64 Years | 22 (6.7%) | 0 (0.0%) |
| 65 to 74 Years | 5 (2.9%) | 0 (0.0%) |
| 75 Years and over | 0 (0.0%) | 13 (9.1%) |
Disability Class: Cognitive Difficulty
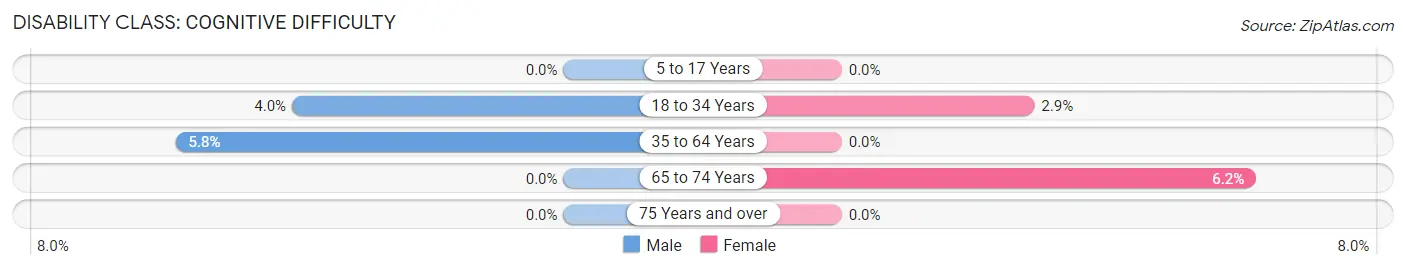
| Age Bracket | Male | Female |
| 5 to 17 Years | 0 (0.0%) | 0 (0.0%) |
| 18 to 34 Years | 6 (4.0%) | 6 (2.9%) |
| 35 to 64 Years | 19 (5.8%) | 0 (0.0%) |
| 65 to 74 Years | 0 (0.0%) | 4 (6.1%) |
| 75 Years and over | 0 (0.0%) | 0 (0.0%) |
Disability Class: Ambulatory Difficulty
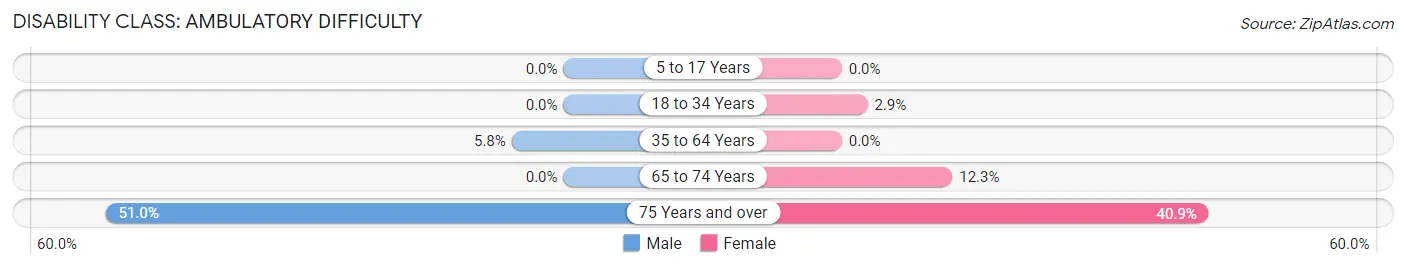
| Age Bracket | Male | Female |
| 5 to 17 Years | 0 (0.0%) | 0 (0.0%) |
| 18 to 34 Years | 0 (0.0%) | 6 (2.9%) |
| 35 to 64 Years | 19 (5.8%) | 0 (0.0%) |
| 65 to 74 Years | 0 (0.0%) | 8 (12.3%) |
| 75 Years and over | 26 (51.0%) | 58 (40.8%) |
Disability Class: Self-Care Difficulty
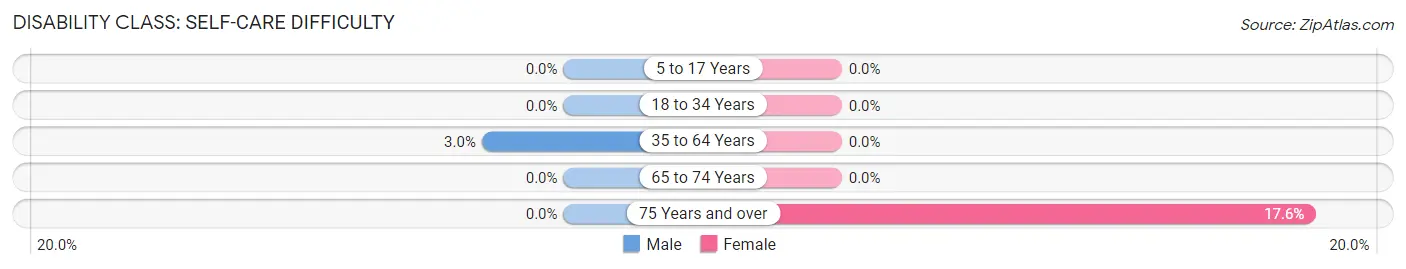
| Age Bracket | Male | Female |
| 5 to 17 Years | 0 (0.0%) | 0 (0.0%) |
| 18 to 34 Years | 0 (0.0%) | 0 (0.0%) |
| 35 to 64 Years | 10 (3.0%) | 0 (0.0%) |
| 65 to 74 Years | 0 (0.0%) | 0 (0.0%) |
| 75 Years and over | 0 (0.0%) | 25 (17.6%) |
Technology Access in Red Hook
Computing Device Access in Red Hook
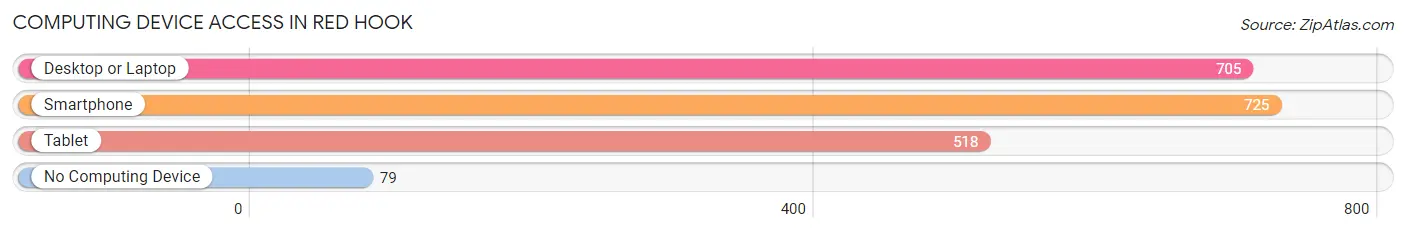
| Device Type | # Households | % Households |
| Desktop or Laptop | 705 | 81.5% |
| Smartphone | 725 | 83.8% |
| Tablet | 518 | 59.9% |
| No Computing Device | 79 | 9.1% |
| Total | 865 | 100.0% |
Internet Access in Red Hook
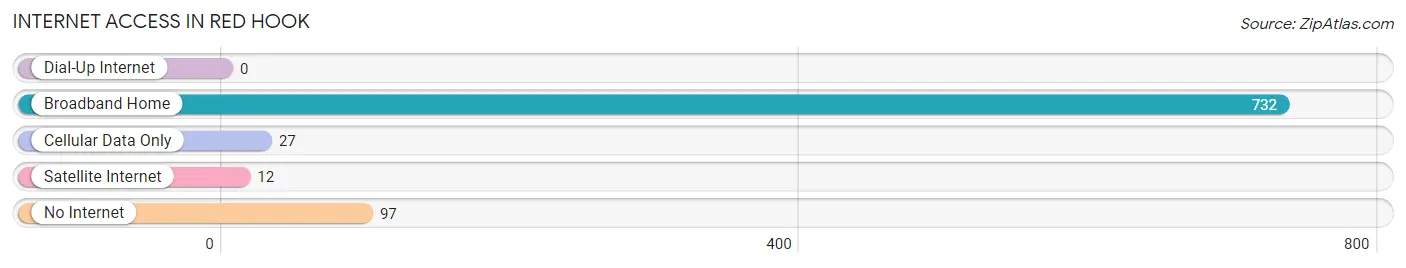
| Internet Type | # Households | % Households |
| Dial-Up Internet | 0 | 0.0% |
| Broadband Home | 732 | 84.6% |
| Cellular Data Only | 27 | 3.1% |
| Satellite Internet | 12 | 1.4% |
| No Internet | 97 | 11.2% |
| Total | 865 | 100.0% |
Red Hook Summary
HISTORY
Red Hook, New York is a small town located in Dutchess County, New York. It is situated on the east bank of the Hudson River, about two miles south of the city of Hudson. The town was first settled in the late 17th century by Dutch settlers, who named it “Roode Hoek”, meaning “red corner” in Dutch. The town was officially incorporated in 1788.
Red Hook has a rich history, and has been home to many notable people throughout its history. The town was the birthplace of the first American president, George Washington, who was born in 1732. The town was also home to the first African-American to serve in the United States Congress, James Charles Matthews, who was born in Red Hook in 1812.
Red Hook was also the site of the Battle of Red Hook, which took place during the Revolutionary War in 1777. The battle was a major victory for the American forces, and helped to secure the Hudson Valley for the American cause.
Red Hook has also been home to many notable businesses throughout its history. The town was the birthplace of the first American brewery, the Red Hook Brewery, which was founded in 1838. The brewery was a major employer in the town for many years, and was the first to produce lager beer in the United States.
Red Hook was also home to the first American paper mill, the Red Hook Paper Mill, which was founded in 1845. The paper mill was a major employer in the town for many years, and was the first to produce paper from wood pulp in the United States.
Red Hook was also home to the first American canning factory, the Red Hook Canning Factory, which was founded in 1876. The canning factory was a major employer in the town for many years, and was the first to produce canned goods in the United States.
GEOGRAPHY
Red Hook is located in Dutchess County, New York, on the east bank of the Hudson River. The town is situated about two miles south of the city of Hudson. The town is bordered by the towns of Rhinebeck to the north, Milan to the east, and Tivoli to the south.
The town of Red Hook covers an area of approximately 8.5 square miles, and has a population of approximately 4,500 people. The town is mostly rural, with a few small villages and hamlets scattered throughout the area. The town is home to several parks and recreational areas, including the Red Hook Recreation Area, which offers a variety of outdoor activities such as hiking, fishing, and camping.
The town of Red Hook is located in the Hudson Valley region of New York, and is part of the Hudson River Valley National Heritage Area. The town is located within the Hudson River Valley AVA, which is an American Viticultural Area designated by the United States Department of the Treasury.
ECONOMY
The economy of Red Hook is largely based on agriculture and tourism. The town is home to several farms, which produce a variety of crops, including apples, cherries, and grapes. The town is also home to several wineries, which produce a variety of wines.
The town is also home to several small businesses, including restaurants, shops, and galleries. The town is also home to several bed and breakfasts, which cater to tourists visiting the area.
The town is also home to several manufacturing companies, which produce a variety of products, including paper products, canned goods, and beer. The town is also home to several technology companies, which produce a variety of software and hardware products.
DEMOGRAPHICS
As of the 2010 census, the population of Red Hook was 4,541 people. The population is largely white, with approximately 90% of the population being white. The town is also home to a small Hispanic population, with approximately 5% of the population being Hispanic.
The median household income in Red Hook is $50,945, and the median family income is $60,945. The town has a poverty rate of 11.3%, which is slightly higher than the national average. The town also has a high rate of educational attainment, with approximately 90% of the population having a high school diploma or higher.
Common Questions
What is Per Capita Income in Red Hook?
Per Capita income in Red Hook is $54,154.
What is the Median Family Income in Red Hook?
Median Family Income in Red Hook is $105,000.
What is the Median Household income in Red Hook?
Median Household Income in Red Hook is $90,750.
What is Income or Wage Gap in Red Hook?
Income or Wage Gap in Red Hook is 27.1%.
Women in Red Hook earn 72.9 cents for every dollar earned by a man.
What is Inequality or Gini Index in Red Hook?
Inequality or Gini Index in Red Hook is 0.46.
What is the Total Population of Red Hook?
Total Population of Red Hook is 1,816.
What is the Total Male Population of Red Hook?
Total Male Population of Red Hook is 852.
What is the Total Female Population of Red Hook?
Total Female Population of Red Hook is 964.
What is the Ratio of Males per 100 Females in Red Hook?
There are 88.38 Males per 100 Females in Red Hook.
What is the Ratio of Females per 100 Males in Red Hook?
There are 113.15 Females per 100 Males in Red Hook.
What is the Median Population Age in Red Hook?
Median Population Age in Red Hook is 44.1 Years.
What is the Average Family Size in Red Hook
Average Family Size in Red Hook is 2.9 People.
What is the Average Household Size in Red Hook
Average Household Size in Red Hook is 2.1 People.
How Large is the Labor Force in Red Hook?
There are 1,003 People in the Labor Forcein in Red Hook.
What is the Percentage of People in the Labor Force in Red Hook?
64.6% of People are in the Labor Force in Red Hook.
What is the Unemployment Rate in Red Hook?
Unemployment Rate in Red Hook is 2.6%.