Aurora, UT Map & Demographics
Aurora Map
Aurora Overview
$38,644
PER CAPITA INCOME
$106,250
AVG FAMILY INCOME
$96,484
AVG HOUSEHOLD INCOME
47.1%
WAGE / INCOME GAP [ % ]
52.9¢/ $1
WAGE / INCOME GAP [ $ ]
0.31
INEQUALITY / GINI INDEX
898
TOTAL POPULATION
468
MALE POPULATION
430
FEMALE POPULATION
108.84
MALES / 100 FEMALES
91.88
FEMALES / 100 MALES
43.3
MEDIAN AGE
3.2
AVG FAMILY SIZE
2.9
AVG HOUSEHOLD SIZE
489
LABOR FORCE [ PEOPLE ]
67.2%
PERCENT IN LABOR FORCE
0.6%
UNEMPLOYMENT RATE
Aurora Zip Codes
Aurora Area Codes
Income in Aurora
Income Overview in Aurora
Per Capita Income in Aurora is $38,644, while median incomes of families and households are $106,250 and $96,484 respectively.
| Characteristic | Number | Measure |
| Per Capita Income | 898 | $38,644 |
| Median Family Income | 247 | $106,250 |
| Mean Family Income | 247 | $108,104 |
| Median Household Income | 313 | $96,484 |
| Mean Household Income | 313 | $102,936 |
| Income Deficit | 247 | $0 |
| Wage / Income Gap (%) | 898 | 47.10% |
| Wage / Income Gap ($) | 898 | 52.90¢ per $1 |
| Gini / Inequality Index | 898 | 0.31 |
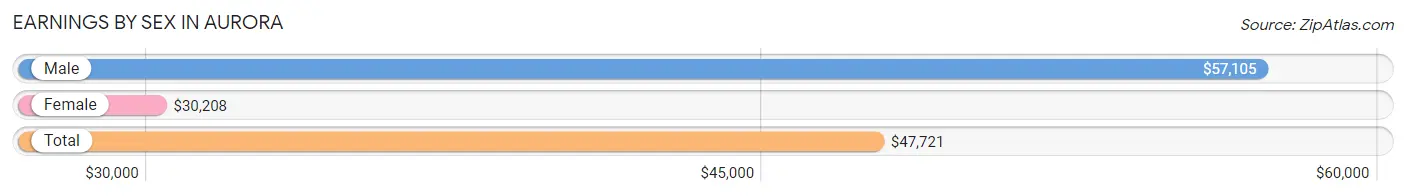
Earnings by Sex in Aurora
Average Earnings in Aurora are $47,721, $57,105 for men and $30,208 for women, a difference of 47.1%.
| Sex | Number | Average Earnings |
| Male | 282 (52.5%) | $57,105 |
| Female | 255 (47.5%) | $30,208 |
| Total | 537 (100.0%) | $47,721 |
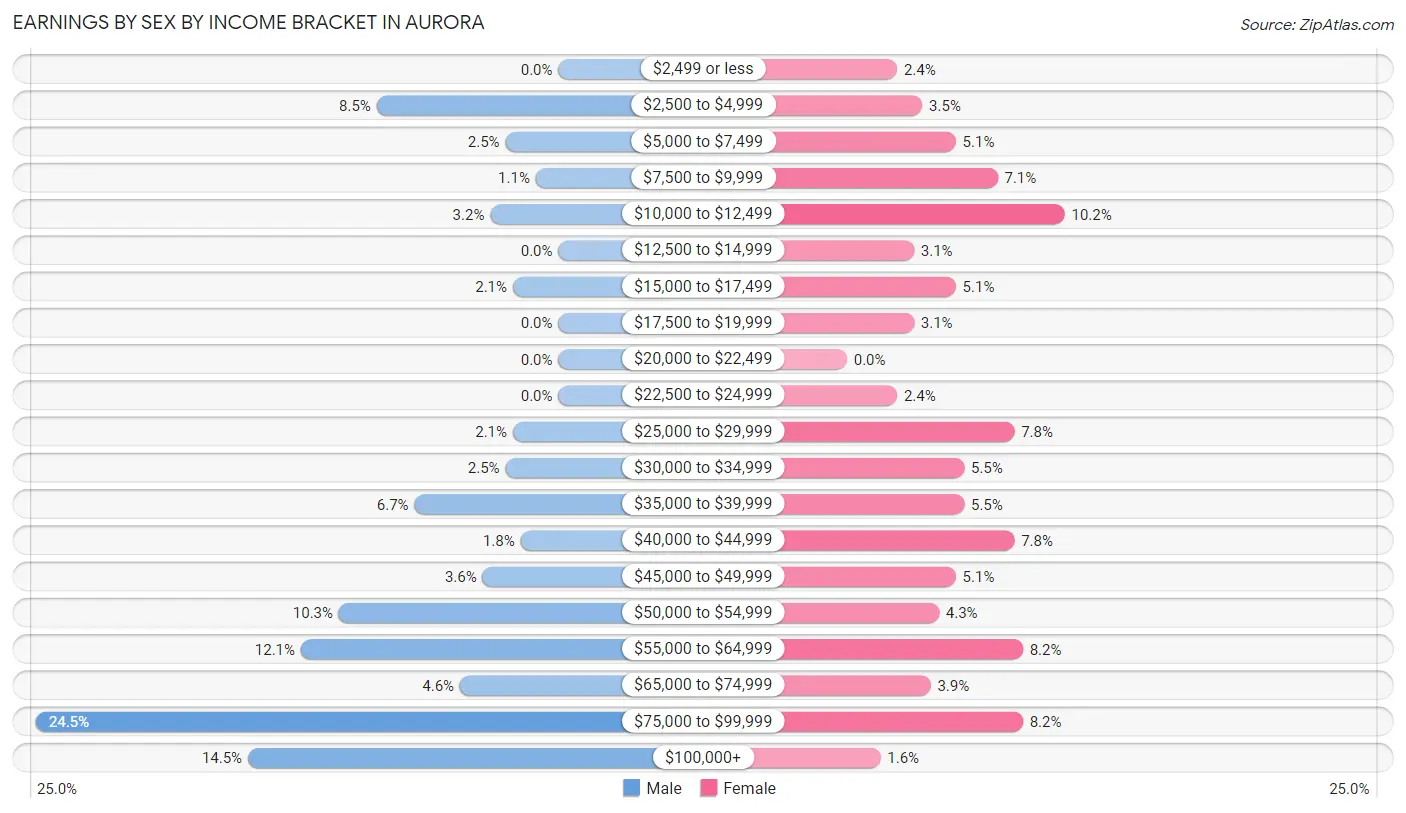
Earnings by Sex by Income Bracket in Aurora
The most common earnings brackets in Aurora are $75,000 to $99,999 for men (69 | 24.5%) and $10,000 to $12,499 for women (26 | 10.2%).
| Income | Male | Female |
| $2,499 or less | 0 (0.0%) | 6 (2.4%) |
| $2,500 to $4,999 | 24 (8.5%) | 9 (3.5%) |
| $5,000 to $7,499 | 7 (2.5%) | 13 (5.1%) |
| $7,500 to $9,999 | 3 (1.1%) | 18 (7.1%) |
| $10,000 to $12,499 | 9 (3.2%) | 26 (10.2%) |
| $12,500 to $14,999 | 0 (0.0%) | 8 (3.1%) |
| $15,000 to $17,499 | 6 (2.1%) | 13 (5.1%) |
| $17,500 to $19,999 | 0 (0.0%) | 8 (3.1%) |
| $20,000 to $22,499 | 0 (0.0%) | 0 (0.0%) |
| $22,500 to $24,999 | 0 (0.0%) | 6 (2.4%) |
| $25,000 to $29,999 | 6 (2.1%) | 20 (7.8%) |
| $30,000 to $34,999 | 7 (2.5%) | 14 (5.5%) |
| $35,000 to $39,999 | 19 (6.7%) | 14 (5.5%) |
| $40,000 to $44,999 | 5 (1.8%) | 20 (7.8%) |
| $45,000 to $49,999 | 10 (3.5%) | 13 (5.1%) |
| $50,000 to $54,999 | 29 (10.3%) | 11 (4.3%) |
| $55,000 to $64,999 | 34 (12.1%) | 21 (8.2%) |
| $65,000 to $74,999 | 13 (4.6%) | 10 (3.9%) |
| $75,000 to $99,999 | 69 (24.5%) | 21 (8.2%) |
| $100,000+ | 41 (14.5%) | 4 (1.6%) |
| Total | 282 (100.0%) | 255 (100.0%) |
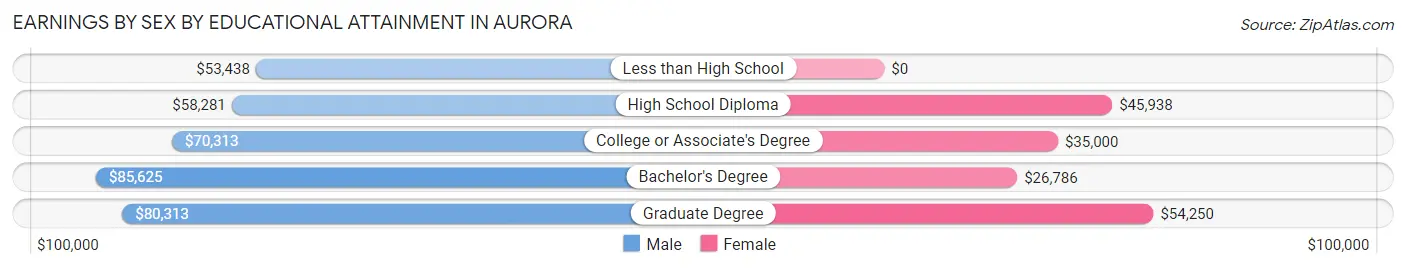
Earnings by Sex by Educational Attainment in Aurora
Average earnings in Aurora are $70,417 for men and $39,063 for women, a difference of 44.5%. Men with an educational attainment of bachelor's degree enjoy the highest average annual earnings of $85,625, while those with less than high school education earn the least with $53,438. Women with an educational attainment of graduate degree earn the most with the average annual earnings of $54,250, while those with bachelor's degree education have the smallest earnings of $26,786.
| Educational Attainment | Male Income | Female Income |
| Less than High School | $53,438 | $0 |
| High School Diploma | $58,281 | $45,938 |
| College or Associate's Degree | $70,313 | $35,000 |
| Bachelor's Degree | $85,625 | $26,786 |
| Graduate Degree | $80,313 | $54,250 |
| Total | $70,417 | $39,063 |
Family Income in Aurora
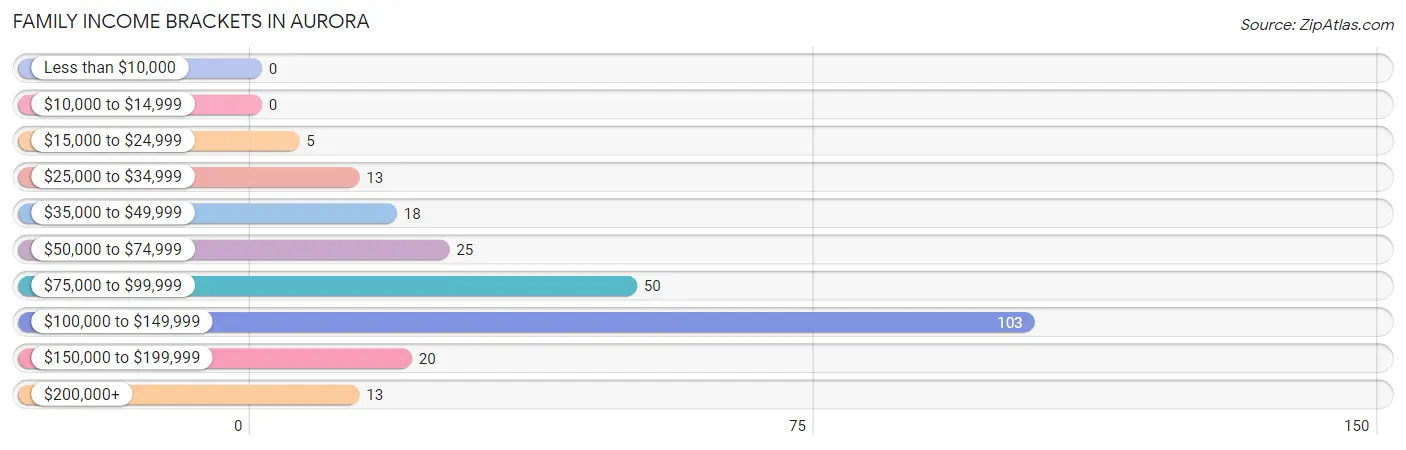
Family Income Brackets in Aurora
According to the Aurora family income data, there are 103 families falling into the $100,000 to $149,999 income range, which is the most common income bracket and makes up 41.7% of all families.
| Income Bracket | # Families | % Families |
| Less than $10,000 | 0 | 0.0% |
| $10,000 to $14,999 | 0 | 0.0% |
| $15,000 to $24,999 | 5 | 2.0% |
| $25,000 to $34,999 | 13 | 5.3% |
| $35,000 to $49,999 | 18 | 7.3% |
| $50,000 to $74,999 | 25 | 10.1% |
| $75,000 to $99,999 | 50 | 20.2% |
| $100,000 to $149,999 | 103 | 41.7% |
| $150,000 to $199,999 | 20 | 8.1% |
| $200,000+ | 13 | 5.3% |
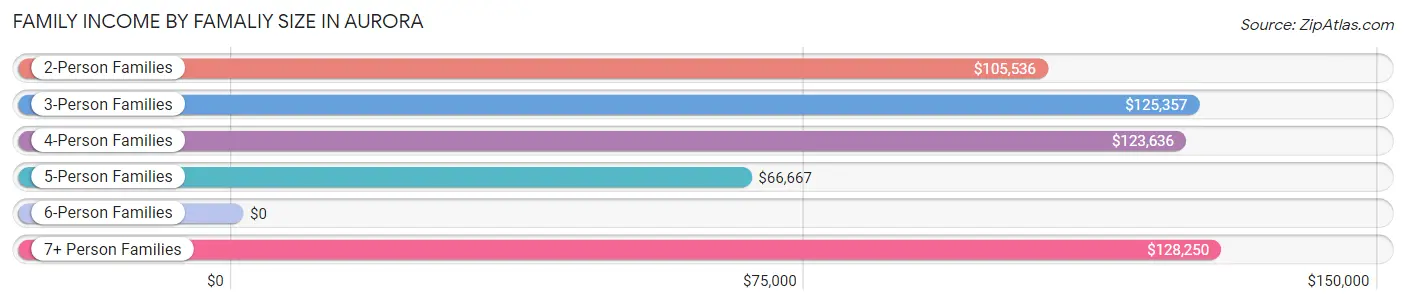
Family Income by Famaliy Size in Aurora
7+ person families (11 | 4.4%) account for the highest median family income in Aurora with $128,250 per family, while 2-person families (139 | 56.3%) have the highest median income of $52,768 per family member.
| Income Bracket | # Families | Median Income |
| 2-Person Families | 139 (56.3%) | $105,536 |
| 3-Person Families | 28 (11.3%) | $125,357 |
| 4-Person Families | 36 (14.6%) | $123,636 |
| 5-Person Families | 22 (8.9%) | $66,667 |
| 6-Person Families | 11 (4.4%) | $0 |
| 7+ Person Families | 11 (4.4%) | $128,250 |
| Total | 247 (100.0%) | $106,250 |
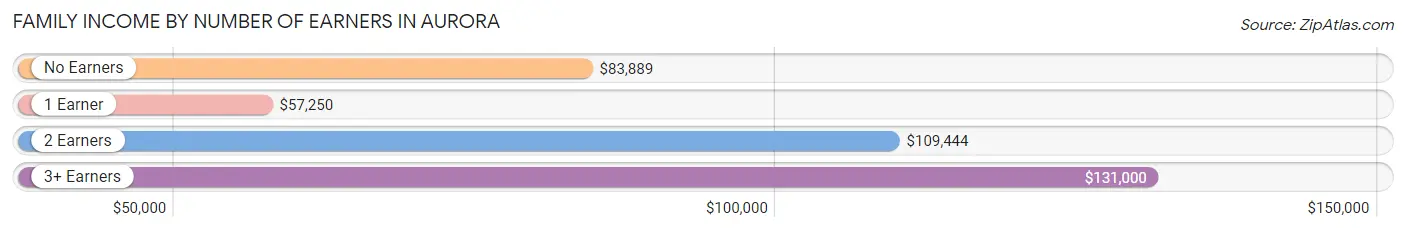
Family Income by Number of Earners in Aurora
The median family income in Aurora is $106,250, with families comprising 3+ earners (48) having the highest median family income of $131,000, while families with 1 earner (41) have the lowest median family income of $57,250, accounting for 19.4% and 16.6% of families, respectively.
| Number of Earners | # Families | Median Income |
| No Earners | 54 (21.9%) | $83,889 |
| 1 Earner | 41 (16.6%) | $57,250 |
| 2 Earners | 104 (42.1%) | $109,444 |
| 3+ Earners | 48 (19.4%) | $131,000 |
| Total | 247 (100.0%) | $106,250 |
Household Income in Aurora
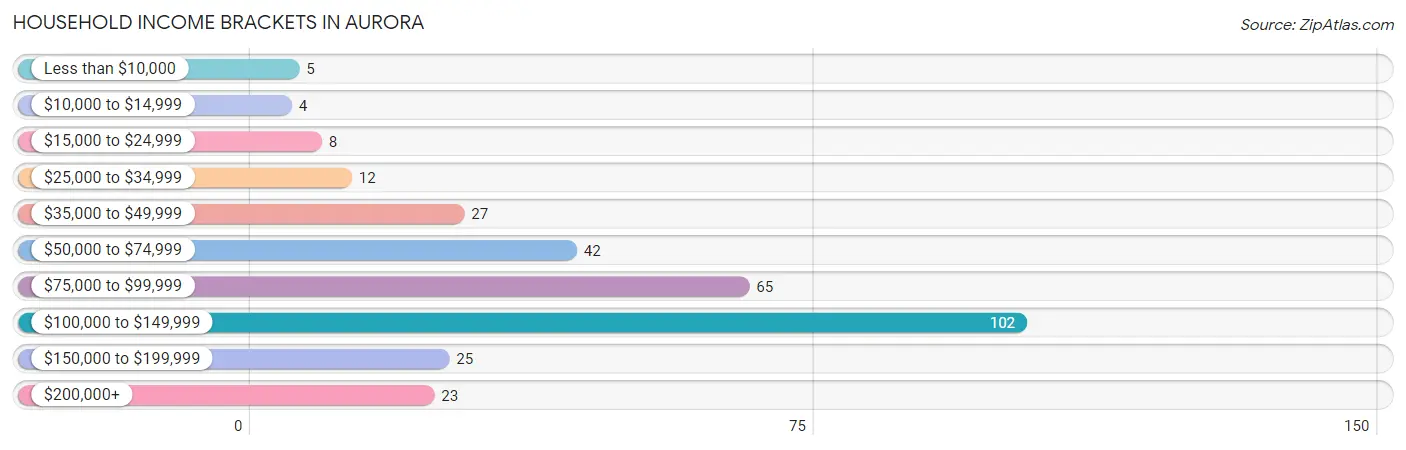
Household Income Brackets in Aurora
With 102 households falling in the category, the $100,000 to $149,999 income range is the most frequent in Aurora, accounting for 32.6% of all households. In contrast, only 4 households (1.3%) fall into the $10,000 to $14,999 income bracket, making it the least populous group.
| Income Bracket | # Households | % Households |
| Less than $10,000 | 5 | 1.6% |
| $10,000 to $14,999 | 4 | 1.3% |
| $15,000 to $24,999 | 8 | 2.6% |
| $25,000 to $34,999 | 12 | 3.8% |
| $35,000 to $49,999 | 27 | 8.6% |
| $50,000 to $74,999 | 42 | 13.4% |
| $75,000 to $99,999 | 65 | 20.8% |
| $100,000 to $149,999 | 102 | 32.6% |
| $150,000 to $199,999 | 25 | 8.0% |
| $200,000+ | 23 | 7.3% |
Household Income by Householder Age in Aurora
The median household income in Aurora is $96,484, with the highest median household income of $107,778 found in the 45 to 64 years age bracket for the primary householder. A total of 156 households (49.8%) fall into this category. Meanwhile, the 15 to 24 years age bracket for the primary householder has the lowest median household income of $0, with 11 households (3.5%) in this group.
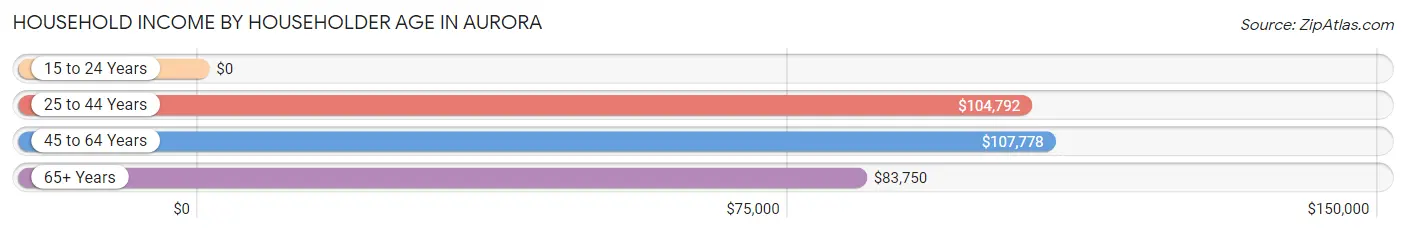
| Income Bracket | # Households | Median Income |
| 15 to 24 Years | 11 (3.5%) | $0 |
| 25 to 44 Years | 73 (23.3%) | $104,792 |
| 45 to 64 Years | 156 (49.8%) | $107,778 |
| 65+ Years | 73 (23.3%) | $83,750 |
| Total | 313 (100.0%) | $96,484 |
Poverty in Aurora
Income Below Poverty by Sex and Age in Aurora
With 3.2% poverty level for males and 6.0% for females among the residents of Aurora, 5 year old males and 6 to 11 year old females are the most vulnerable to poverty, with 4 males (100.0%) and 5 females (31.2%) in their respective age groups living below the poverty level.
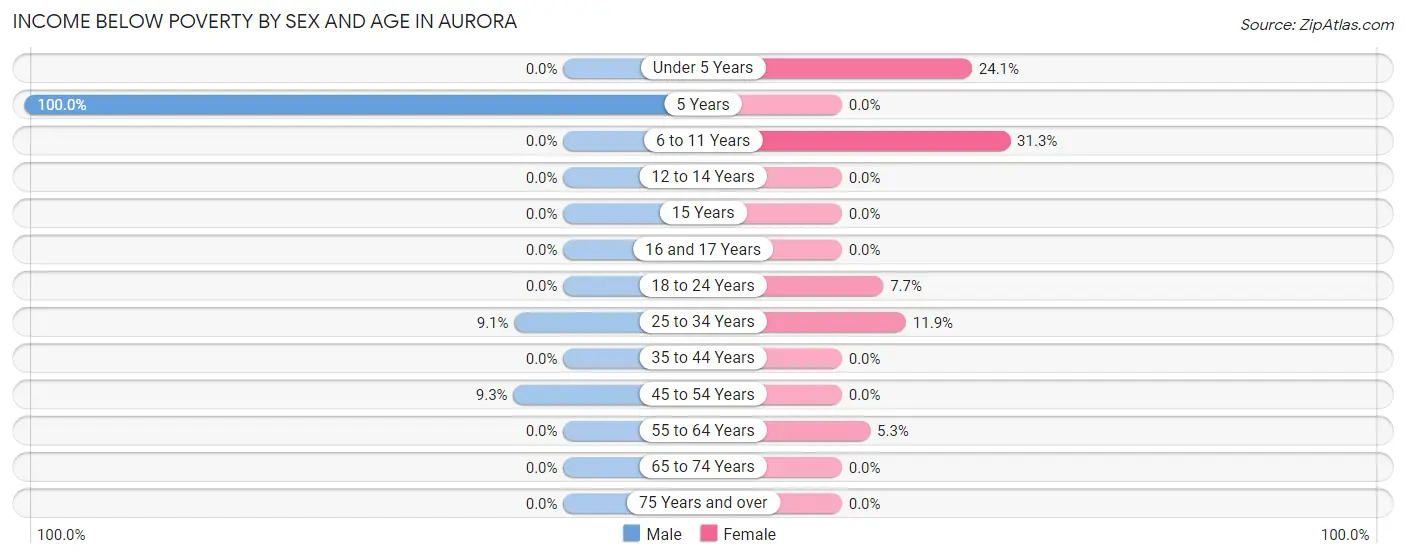
| Age Bracket | Male | Female |
| Under 5 Years | 0 (0.0%) | 7 (24.1%) |
| 5 Years | 4 (100.0%) | 0 (0.0%) |
| 6 to 11 Years | 0 (0.0%) | 5 (31.2%) |
| 12 to 14 Years | 0 (0.0%) | 0 (0.0%) |
| 15 Years | 0 (0.0%) | 0 (0.0%) |
| 16 and 17 Years | 0 (0.0%) | 0 (0.0%) |
| 18 to 24 Years | 0 (0.0%) | 4 (7.7%) |
| 25 to 34 Years | 6 (9.1%) | 5 (11.9%) |
| 35 to 44 Years | 0 (0.0%) | 0 (0.0%) |
| 45 to 54 Years | 5 (9.3%) | 0 (0.0%) |
| 55 to 64 Years | 0 (0.0%) | 5 (5.3%) |
| 65 to 74 Years | 0 (0.0%) | 0 (0.0%) |
| 75 Years and over | 0 (0.0%) | 0 (0.0%) |
| Total | 15 (3.2%) | 26 (6.0%) |
Income Above Poverty by Sex and Age in Aurora
According to the poverty statistics in Aurora, males aged under 5 years and females aged 5 years are the age groups that are most secure financially, with 100.0% of males and 100.0% of females in these age groups living above the poverty line.
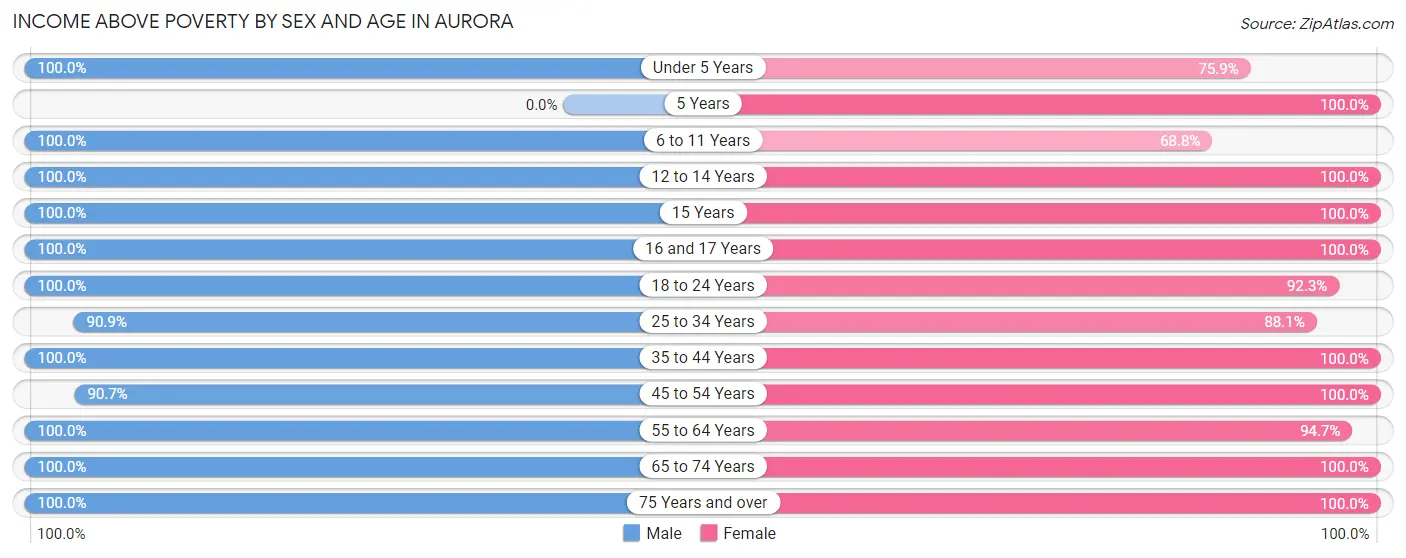
| Age Bracket | Male | Female |
| Under 5 Years | 26 (100.0%) | 22 (75.9%) |
| 5 Years | 0 (0.0%) | 8 (100.0%) |
| 6 to 11 Years | 42 (100.0%) | 11 (68.8%) |
| 12 to 14 Years | 19 (100.0%) | 10 (100.0%) |
| 15 Years | 11 (100.0%) | 5 (100.0%) |
| 16 and 17 Years | 5 (100.0%) | 9 (100.0%) |
| 18 to 24 Years | 47 (100.0%) | 48 (92.3%) |
| 25 to 34 Years | 60 (90.9%) | 37 (88.1%) |
| 35 to 44 Years | 42 (100.0%) | 30 (100.0%) |
| 45 to 54 Years | 49 (90.7%) | 57 (100.0%) |
| 55 to 64 Years | 83 (100.0%) | 90 (94.7%) |
| 65 to 74 Years | 33 (100.0%) | 45 (100.0%) |
| 75 Years and over | 36 (100.0%) | 32 (100.0%) |
| Total | 453 (96.8%) | 404 (94.0%) |
Income Below Poverty Among Married-Couple Families in Aurora
The poverty statistics for married-couple families in Aurora show that 2.4% or 5 of the total 209 families live below the poverty line. Families with 3 or 4 children have the highest poverty rate of 25.0%, comprising of 5 families. On the other hand, families with no children have the lowest poverty rate of 0.0%, which includes 0 families.
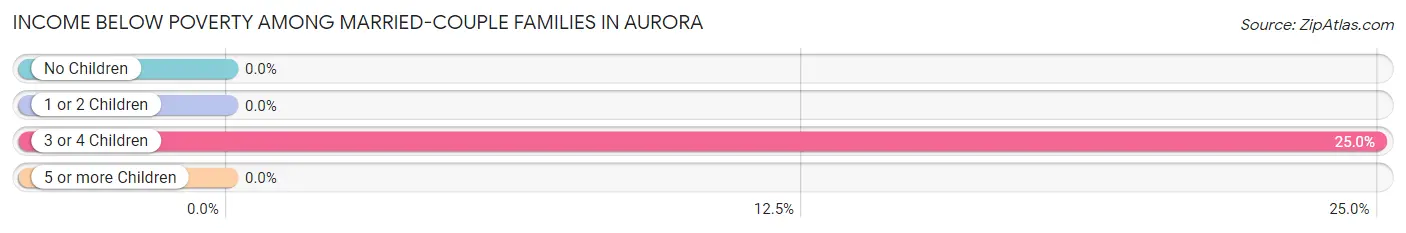
| Children | Above Poverty | Below Poverty |
| No Children | 144 (100.0%) | 0 (0.0%) |
| 1 or 2 Children | 38 (100.0%) | 0 (0.0%) |
| 3 or 4 Children | 15 (75.0%) | 5 (25.0%) |
| 5 or more Children | 7 (100.0%) | 0 (0.0%) |
| Total | 204 (97.6%) | 5 (2.4%) |
Income Below Poverty Among Single-Parent Households in Aurora
| Children | Single Father | Single Mother |
| No Children | 0 (0.0%) | 0 (0.0%) |
| 1 or 2 Children | 0 (0.0%) | 0 (0.0%) |
| 3 or 4 Children | 0 (0.0%) | 0 (0.0%) |
| 5 or more Children | 0 (0.0%) | 0 (0.0%) |
| Total | 0 (0.0%) | 0 (0.0%) |
Income Below Poverty Among Married-Couple vs Single-Parent Households in Aurora
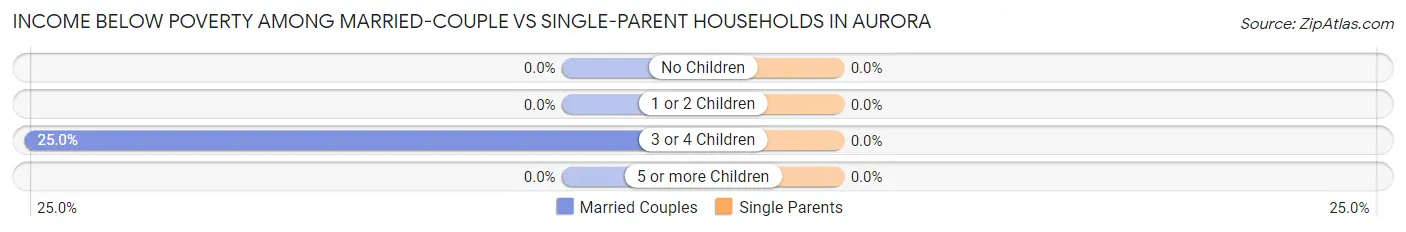
| Children | Married-Couple Families | Single-Parent Households |
| No Children | 0 (0.0%) | 0 (0.0%) |
| 1 or 2 Children | 0 (0.0%) | 0 (0.0%) |
| 3 or 4 Children | 5 (25.0%) | 0 (0.0%) |
| 5 or more Children | 0 (0.0%) | 0 (0.0%) |
| Total | 5 (2.4%) | 0 (0.0%) |
Race in Aurora
The most populous races in Aurora are White / Caucasian (846 | 94.2%), Hispanic or Latino (26 | 2.9%), and Some other Race (23 | 2.6%).
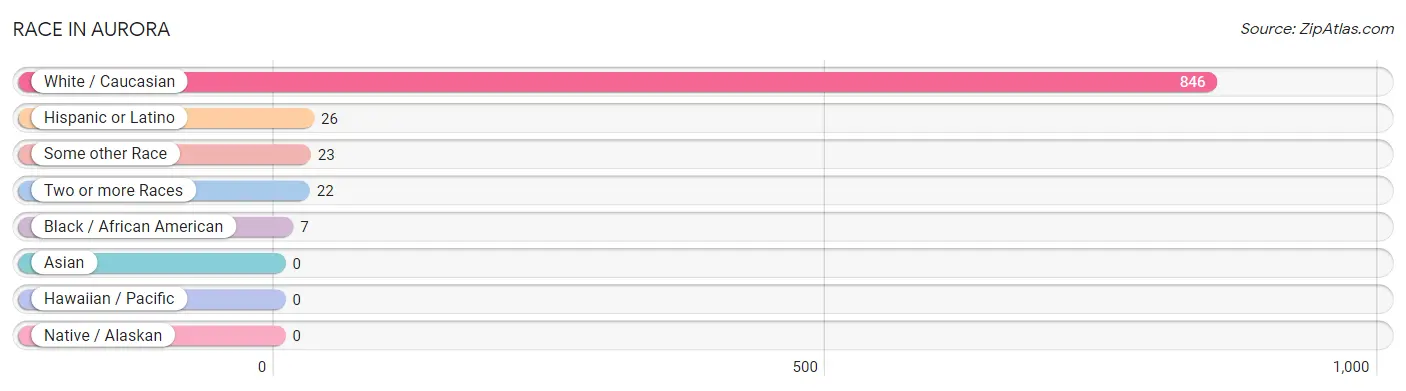
| Race | # Population | % Population |
| Asian | 0 | 0.0% |
| Black / African American | 7 | 0.8% |
| Hawaiian / Pacific | 0 | 0.0% |
| Hispanic or Latino | 26 | 2.9% |
| Native / Alaskan | 0 | 0.0% |
| White / Caucasian | 846 | 94.2% |
| Two or more Races | 22 | 2.5% |
| Some other Race | 23 | 2.6% |
| Total | 898 | 100.0% |
Ancestry in Aurora
The most populous ancestries reported in Aurora are English (276 | 30.7%), Danish (106 | 11.8%), German (63 | 7.0%), Swedish (63 | 7.0%), and American (38 | 4.2%), together accounting for 60.8% of all Aurora residents.
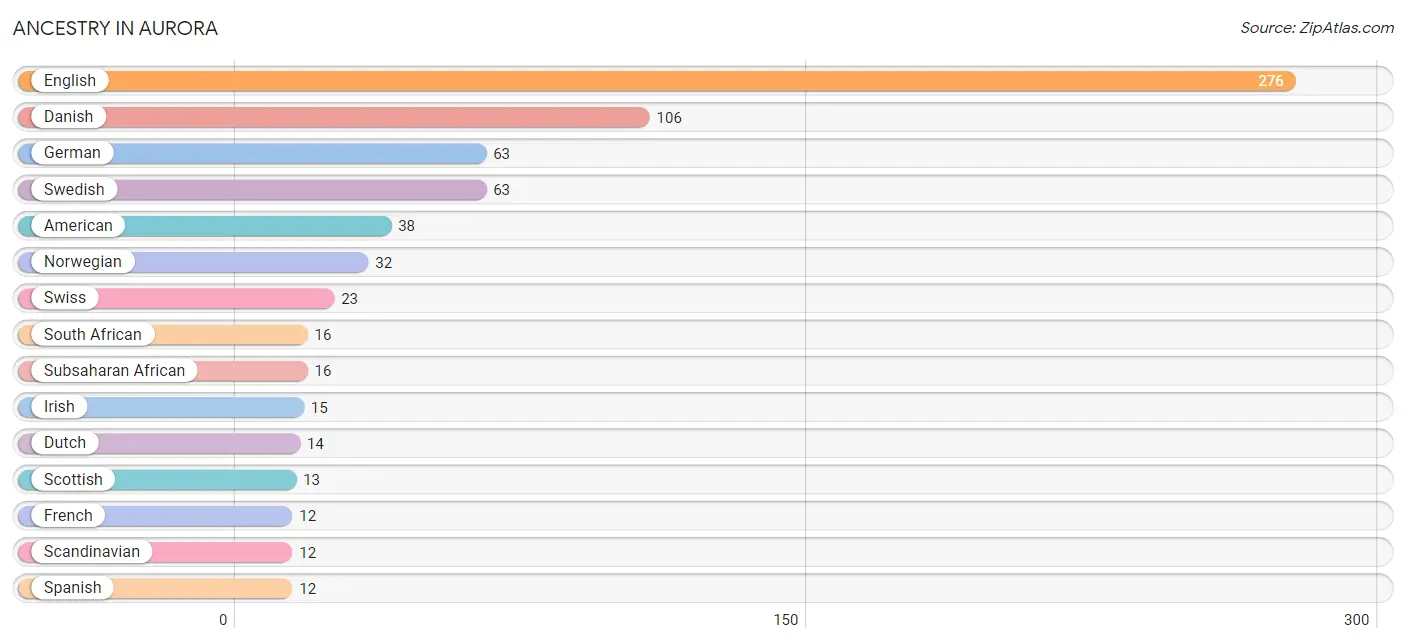
| Ancestry | # Population | % Population |
| American | 38 | 4.2% |
| Central American | 3 | 0.3% |
| Danish | 106 | 11.8% |
| Dominican | 3 | 0.3% |
| Dutch | 14 | 1.6% |
| English | 276 | 30.7% |
| European | 9 | 1.0% |
| French | 12 | 1.3% |
| German | 63 | 7.0% |
| Irish | 15 | 1.7% |
| Mexican | 3 | 0.3% |
| Norwegian | 32 | 3.6% |
| Polish | 3 | 0.3% |
| Puerto Rican | 5 | 0.6% |
| Salvadoran | 3 | 0.3% |
| Scandinavian | 12 | 1.3% |
| Scottish | 13 | 1.5% |
| South African | 16 | 1.8% |
| Spanish | 12 | 1.3% |
| Subsaharan African | 16 | 1.8% |
| Swedish | 63 | 7.0% |
| Swiss | 23 | 2.6% | View All 22 Rows |
Immigrants in Aurora

| Immigration Origin | # Population | % Population | View All 0 Rows |
Sex and Age in Aurora
Sex and Age in Aurora
The most populous age groups in Aurora are 60 to 64 Years (55 | 11.7%) for men and 55 to 59 Years (59 | 13.7%) for women.
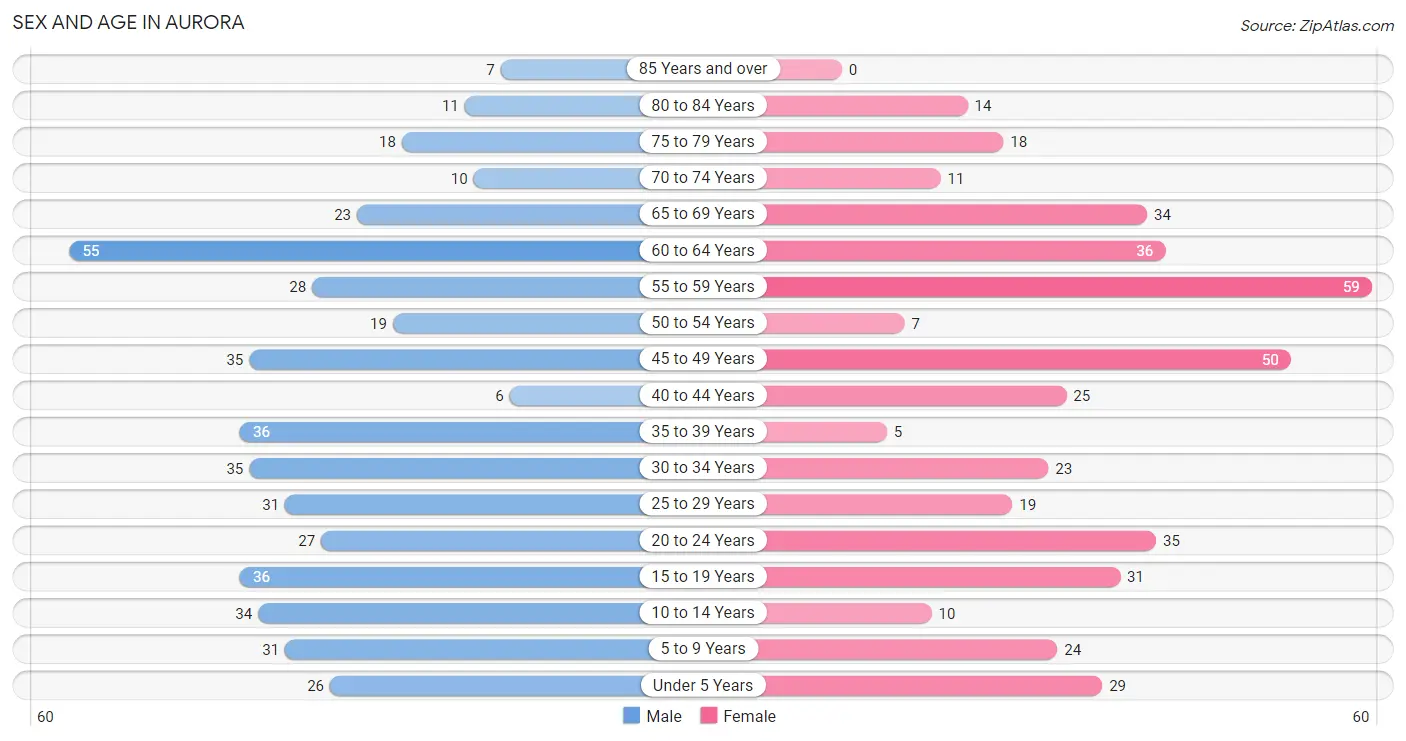
| Age Bracket | Male | Female |
| Under 5 Years | 26 (5.6%) | 29 (6.7%) |
| 5 to 9 Years | 31 (6.6%) | 24 (5.6%) |
| 10 to 14 Years | 34 (7.3%) | 10 (2.3%) |
| 15 to 19 Years | 36 (7.7%) | 31 (7.2%) |
| 20 to 24 Years | 27 (5.8%) | 35 (8.1%) |
| 25 to 29 Years | 31 (6.6%) | 19 (4.4%) |
| 30 to 34 Years | 35 (7.5%) | 23 (5.3%) |
| 35 to 39 Years | 36 (7.7%) | 5 (1.2%) |
| 40 to 44 Years | 6 (1.3%) | 25 (5.8%) |
| 45 to 49 Years | 35 (7.5%) | 50 (11.6%) |
| 50 to 54 Years | 19 (4.1%) | 7 (1.6%) |
| 55 to 59 Years | 28 (6.0%) | 59 (13.7%) |
| 60 to 64 Years | 55 (11.7%) | 36 (8.4%) |
| 65 to 69 Years | 23 (4.9%) | 34 (7.9%) |
| 70 to 74 Years | 10 (2.1%) | 11 (2.6%) |
| 75 to 79 Years | 18 (3.8%) | 18 (4.2%) |
| 80 to 84 Years | 11 (2.4%) | 14 (3.3%) |
| 85 Years and over | 7 (1.5%) | 0 (0.0%) |
| Total | 468 (100.0%) | 430 (100.0%) |
Families and Households in Aurora
Median Family Size in Aurora
The median family size in Aurora is 3.21 persons per family, with married-couple families (209 | 84.6%) accounting for the largest median family size of 3.33 persons per family. On the other hand, single female/mother families (28 | 11.3%) represent the smallest median family size with 2.36 persons per family.
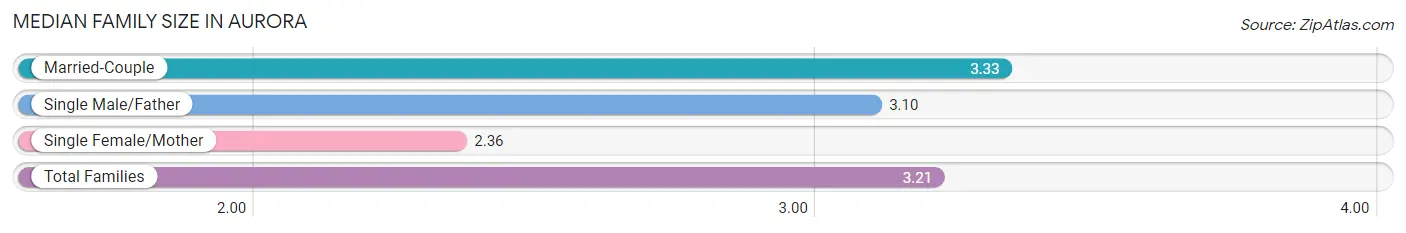
| Family Type | # Families | Family Size |
| Married-Couple | 209 (84.6%) | 3.33 |
| Single Male/Father | 10 (4.1%) | 3.10 |
| Single Female/Mother | 28 (11.3%) | 2.36 |
| Total Families | 247 (100.0%) | 3.21 |
Median Household Size in Aurora
The median household size in Aurora is 2.87 persons per household, with single male/father households (10 | 3.2%) accounting for the largest median household size of 3.8 persons per household. non-family households (66 | 21.1%) represent the smallest median household size with 1.12 persons per household.
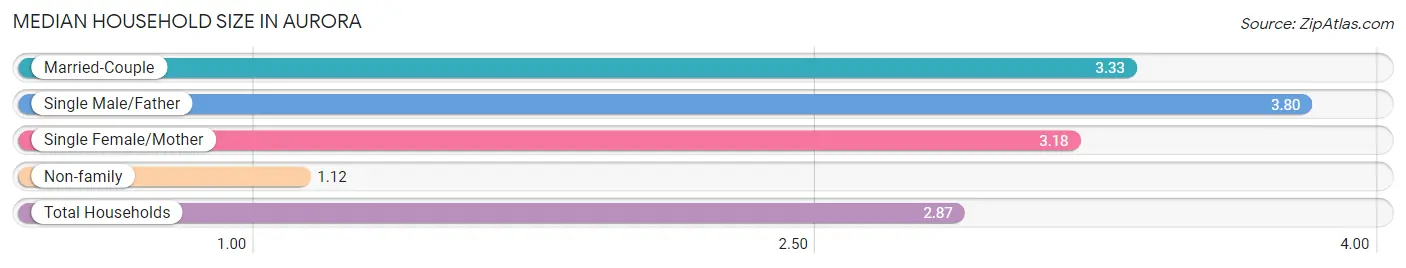
| Household Type | # Households | Household Size |
| Married-Couple | 209 (66.8%) | 3.33 |
| Single Male/Father | 10 (3.2%) | 3.80 |
| Single Female/Mother | 28 (8.9%) | 3.18 |
| Non-family | 66 (21.1%) | 1.12 |
| Total Households | 313 (100.0%) | 2.87 |
Household Size by Marriage Status in Aurora
Out of a total of 313 households in Aurora, 247 (78.9%) are family households, while 66 (21.1%) are nonfamily households. The most numerous type of family households are 2-person households, comprising 131, and the most common type of nonfamily households are 1-person households, comprising 55.
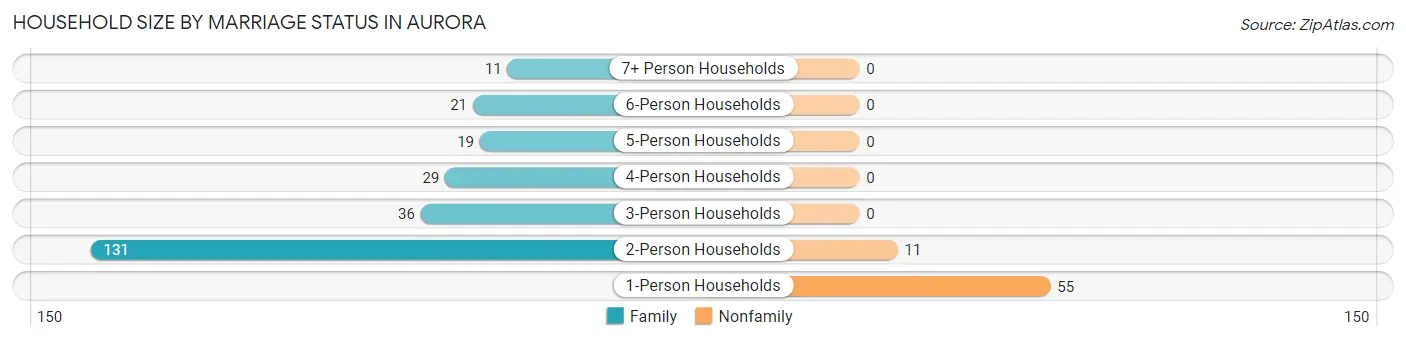
| Household Size | Family Households | Nonfamily Households |
| 1-Person Households | - | 55 (17.6%) |
| 2-Person Households | 131 (41.8%) | 11 (3.5%) |
| 3-Person Households | 36 (11.5%) | 0 (0.0%) |
| 4-Person Households | 29 (9.3%) | 0 (0.0%) |
| 5-Person Households | 19 (6.1%) | 0 (0.0%) |
| 6-Person Households | 21 (6.7%) | 0 (0.0%) |
| 7+ Person Households | 11 (3.5%) | 0 (0.0%) |
| Total | 247 (78.9%) | 66 (21.1%) |
Female Fertility in Aurora
Fertility by Age in Aurora
Average fertility rate in Aurora is 64.0 births per 1,000 women. Women in the age bracket of 20 to 34 years have the highest fertility rate with 156.0 births per 1,000 women. Women in the age bracket of 20 to 34 years acount for 100.0% of all women with births.
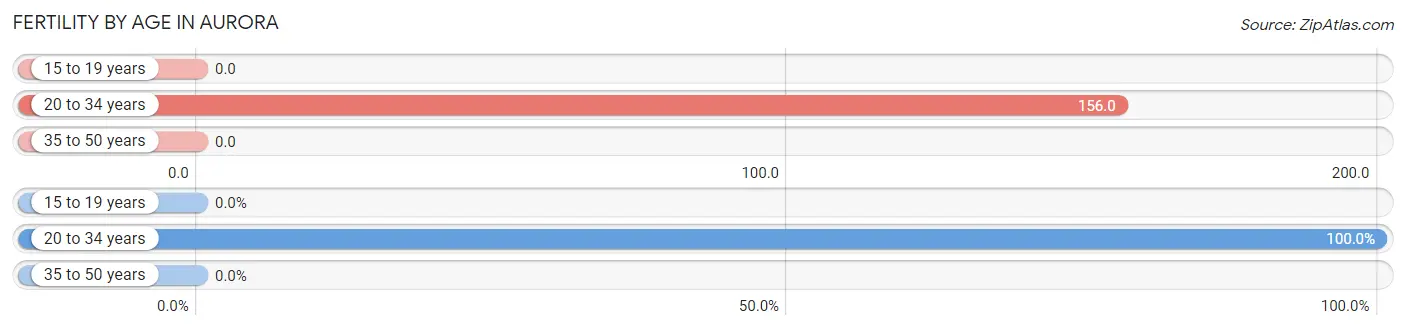
| Age Bracket | Women with Births | Births / 1,000 Women |
| 15 to 19 years | 0 (0.0%) | 0.0 |
| 20 to 34 years | 12 (100.0%) | 156.0 |
| 35 to 50 years | 0 (0.0%) | 0.0 |
| Total | 12 (100.0%) | 64.0 |
Fertility by Age by Marriage Status in Aurora
41.7% of women with births (12) in Aurora are married. The highest percentage of unmarried women with births falls into 20 to 34 years age bracket with 58.3% of them unmarried at the time of birth, while the lowest percentage of unmarried women with births belong to 20 to 34 years age bracket with 58.3% of them unmarried.
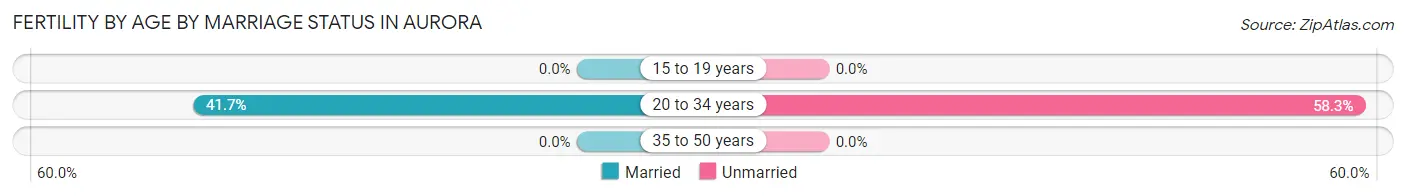
| Age Bracket | Married | Unmarried |
| 15 to 19 years | 0 (0.0%) | 0 (0.0%) |
| 20 to 34 years | 5 (41.7%) | 7 (58.3%) |
| 35 to 50 years | 0 (0.0%) | 0 (0.0%) |
| Total | 5 (41.7%) | 7 (58.3%) |
Fertility by Education in Aurora
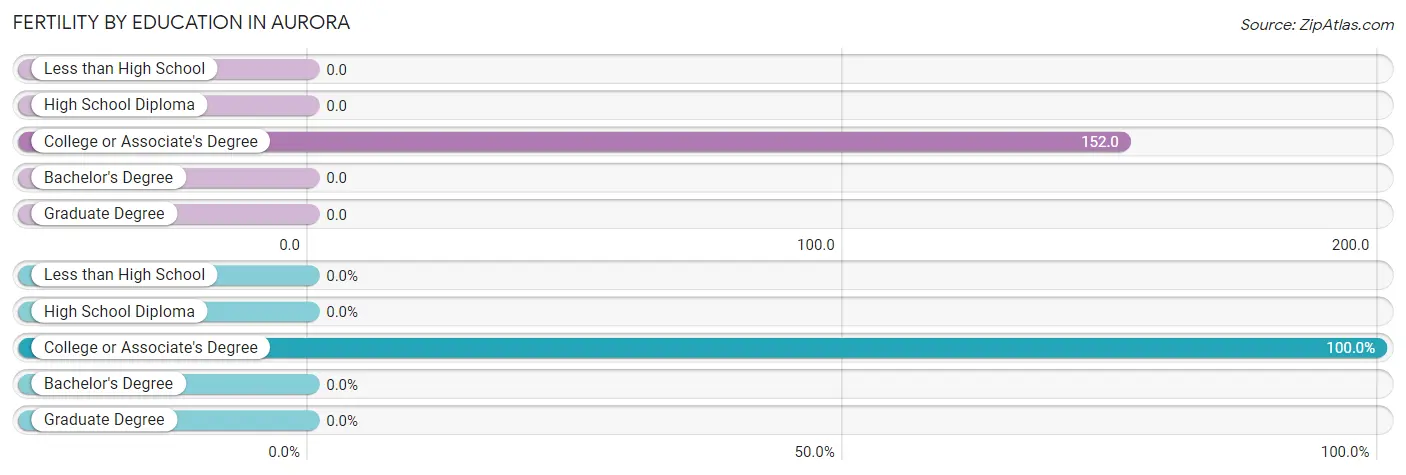
| Educational Attainment | Women with Births | Births / 1,000 Women |
| Less than High School | 0 (0.0%) | 0.0 |
| High School Diploma | 0 (0.0%) | 0.0 |
| College or Associate's Degree | 12 (100.0%) | 152.0 |
| Bachelor's Degree | 0 (0.0%) | 0.0 |
| Graduate Degree | 0 (0.0%) | 0.0 |
| Total | 12 (100.0%) | 64.0 |
Fertility by Education by Marriage Status in Aurora
58.3% of women with births in Aurora are unmarried. Women with the educational attainment of college or associate's degree are most likely to be married with 41.7% of them married at childbirth, while women with the educational attainment of college or associate's degree are least likely to be married with 58.3% of them unmarried at childbirth.
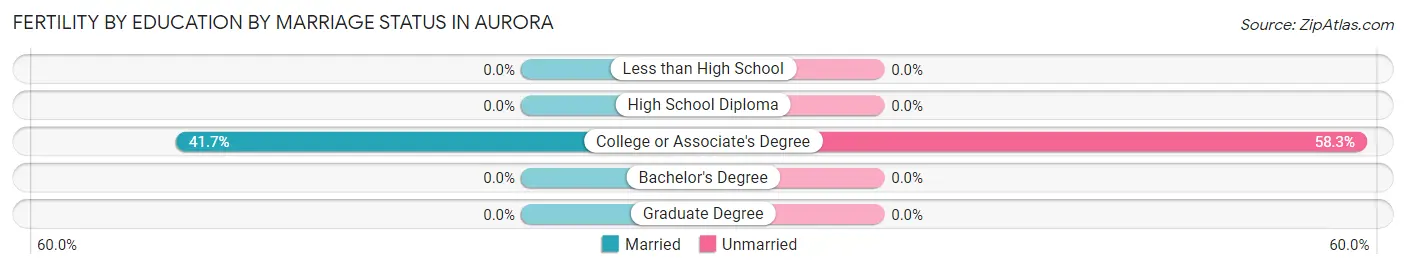
| Educational Attainment | Married | Unmarried |
| Less than High School | 0 (0.0%) | 0 (0.0%) |
| High School Diploma | 0 (0.0%) | 0 (0.0%) |
| College or Associate's Degree | 5 (41.7%) | 7 (58.3%) |
| Bachelor's Degree | 0 (0.0%) | 0 (0.0%) |
| Graduate Degree | 0 (0.0%) | 0 (0.0%) |
| Total | 5 (41.7%) | 7 (58.3%) |
Employment Characteristics in Aurora
Employment by Class of Employer in Aurora
Among the 481 employed individuals in Aurora, private company employees (295 | 61.3%), state government employees (63 | 13.1%), and local government employees (51 | 10.6%) make up the most common classes of employment.
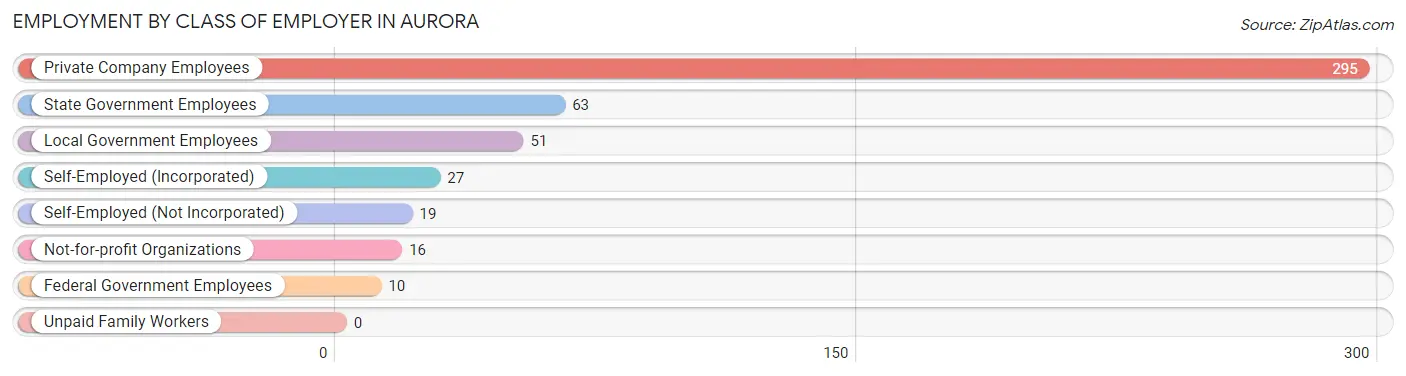
| Employer Class | # Employees | % Employees |
| Private Company Employees | 295 | 61.3% |
| Self-Employed (Incorporated) | 27 | 5.6% |
| Self-Employed (Not Incorporated) | 19 | 4.0% |
| Not-for-profit Organizations | 16 | 3.3% |
| Local Government Employees | 51 | 10.6% |
| State Government Employees | 63 | 13.1% |
| Federal Government Employees | 10 | 2.1% |
| Unpaid Family Workers | 0 | 0.0% |
| Total | 481 | 100.0% |
Employment Status by Age in Aurora
According to the labor force statistics for Aurora, out of the total population over 16 years of age (728), 67.2% or 489 individuals are in the labor force, with 0.6% or 3 of them unemployed. The age group with the highest labor force participation rate is 25 to 29 years, with 94.0% or 47 individuals in the labor force. Within the labor force, the 60 to 64 years age range has the highest percentage of unemployed individuals, with 5.7% or 3 of them being unemployed.
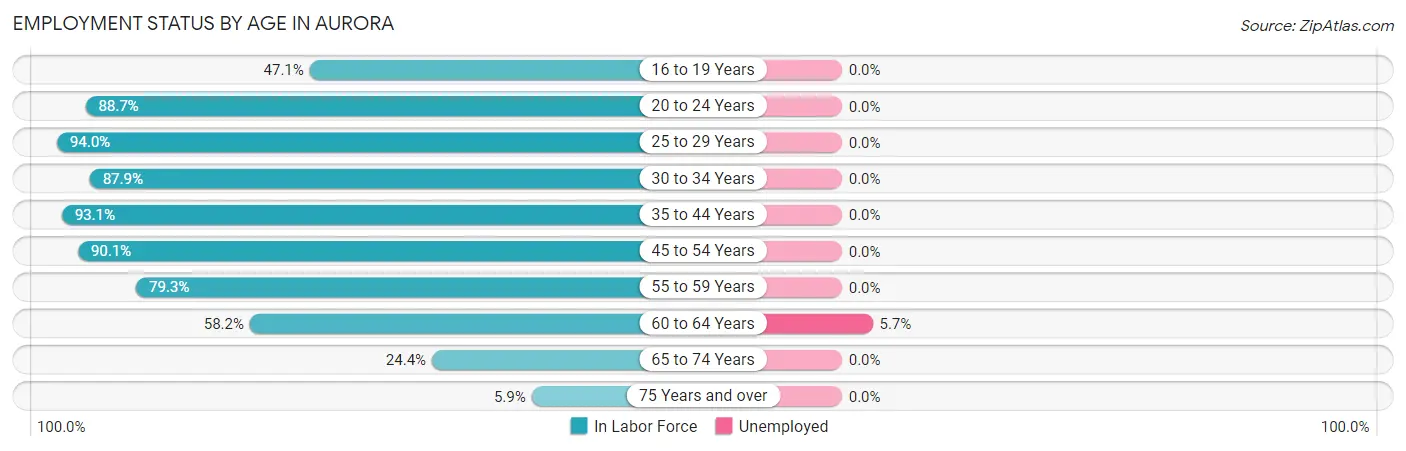
| Age Bracket | In Labor Force | Unemployed |
| 16 to 19 Years | 24 (47.1%) | 0 (0.0%) |
| 20 to 24 Years | 55 (88.7%) | 0 (0.0%) |
| 25 to 29 Years | 47 (94.0%) | 0 (0.0%) |
| 30 to 34 Years | 51 (87.9%) | 0 (0.0%) |
| 35 to 44 Years | 67 (93.1%) | 0 (0.0%) |
| 45 to 54 Years | 100 (90.1%) | 0 (0.0%) |
| 55 to 59 Years | 69 (79.3%) | 0 (0.0%) |
| 60 to 64 Years | 53 (58.2%) | 3 (5.7%) |
| 65 to 74 Years | 19 (24.4%) | 0 (0.0%) |
| 75 Years and over | 4 (5.9%) | 0 (0.0%) |
| Total | 489 (67.2%) | 3 (0.6%) |
Employment Status by Educational Attainment in Aurora
According to labor force statistics for Aurora, 82.5% of individuals (387) out of the total population between 25 and 64 years of age (469) are in the labor force, with 0.8% or 3 of them being unemployed. The group with the highest labor force participation rate are those with the educational attainment of less than high school, with 100.0% or 25 individuals in the labor force. Within the labor force, individuals with high school diploma education have the highest percentage of unemployment, with 2.1% or 3 of them being unemployed.
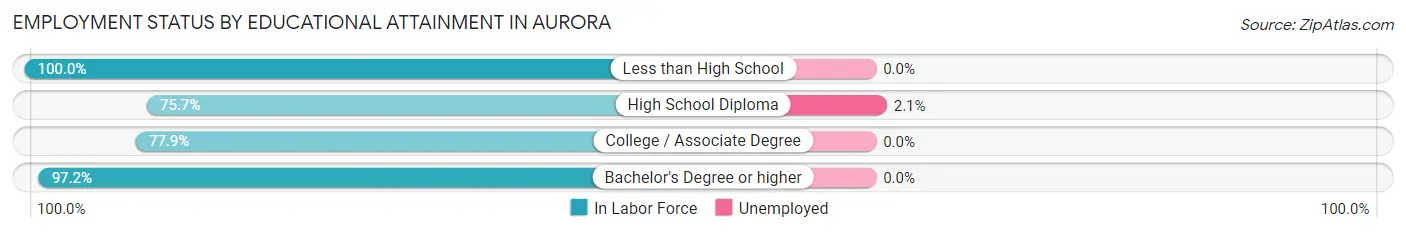
| Educational Attainment | In Labor Force | Unemployed |
| Less than High School | 25 (100.0%) | 0 (0.0%) |
| High School Diploma | 143 (75.7%) | 4 (2.1%) |
| College / Associate Degree | 116 (77.9%) | 0 (0.0%) |
| Bachelor's Degree or higher | 103 (97.2%) | 0 (0.0%) |
| Total | 387 (82.5%) | 4 (0.8%) |
Employment Occupations by Sex in Aurora
Management, Business, Science and Arts Occupations
The most common Management, Business, Science and Arts occupations in Aurora are Management (68 | 14.0%), Community & Social Service (44 | 9.0%), Business & Financial (43 | 8.8%), Education Instruction & Library (31 | 6.4%), and Health Diagnosing & Treating (17 | 3.5%).
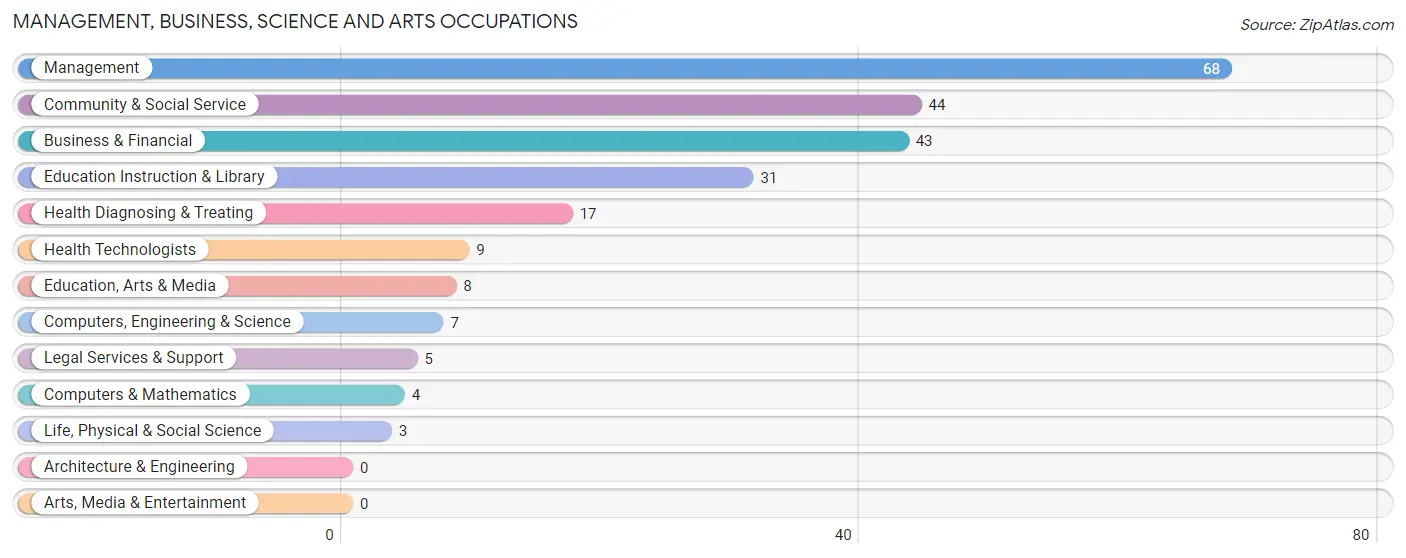
Management, Business, Science and Arts Occupations by Sex
Within the Management, Business, Science and Arts occupations in Aurora, the most male-oriented occupations are Computers & Mathematics (100.0%), Business & Financial (67.4%), and Management (60.3%), while the most female-oriented occupations are Life, Physical & Social Science (100.0%), Education, Arts & Media (100.0%), and Legal Services & Support (100.0%).
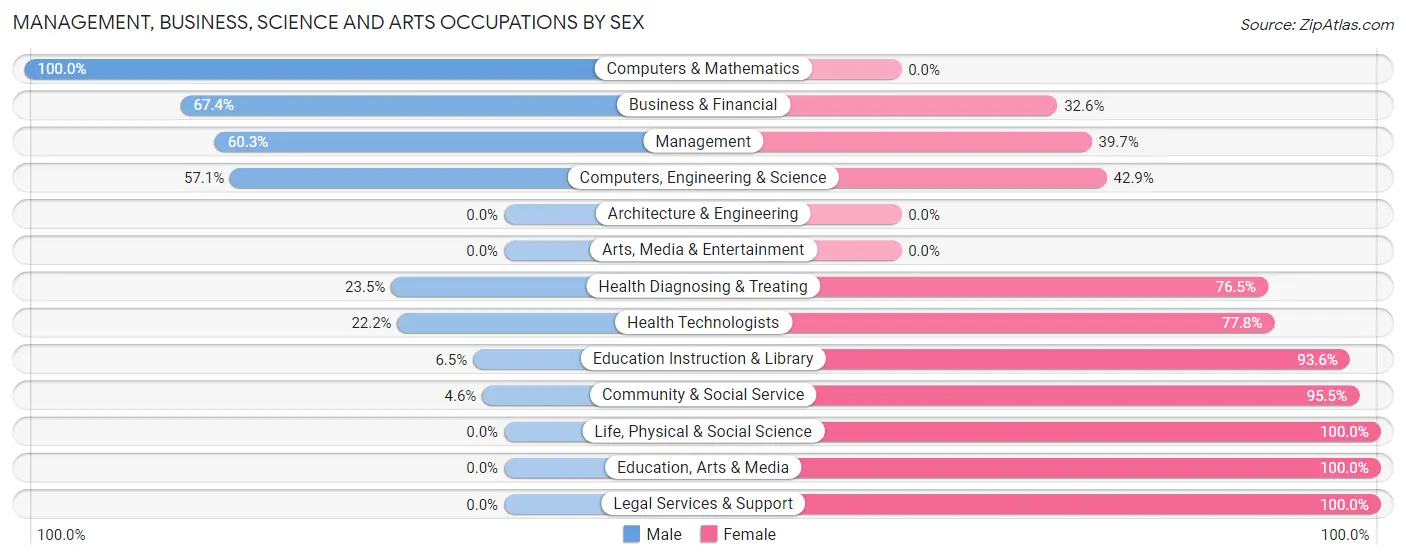
| Occupation | Male | Female |
| Management | 41 (60.3%) | 27 (39.7%) |
| Business & Financial | 29 (67.4%) | 14 (32.6%) |
| Computers, Engineering & Science | 4 (57.1%) | 3 (42.9%) |
| Computers & Mathematics | 4 (100.0%) | 0 (0.0%) |
| Architecture & Engineering | 0 (0.0%) | 0 (0.0%) |
| Life, Physical & Social Science | 0 (0.0%) | 3 (100.0%) |
| Community & Social Service | 2 (4.5%) | 42 (95.5%) |
| Education, Arts & Media | 0 (0.0%) | 8 (100.0%) |
| Legal Services & Support | 0 (0.0%) | 5 (100.0%) |
| Education Instruction & Library | 2 (6.5%) | 29 (93.5%) |
| Arts, Media & Entertainment | 0 (0.0%) | 0 (0.0%) |
| Health Diagnosing & Treating | 4 (23.5%) | 13 (76.5%) |
| Health Technologists | 2 (22.2%) | 7 (77.8%) |
| Total (Category) | 80 (44.7%) | 99 (55.3%) |
| Total (Overall) | 253 (52.1%) | 233 (47.9%) |
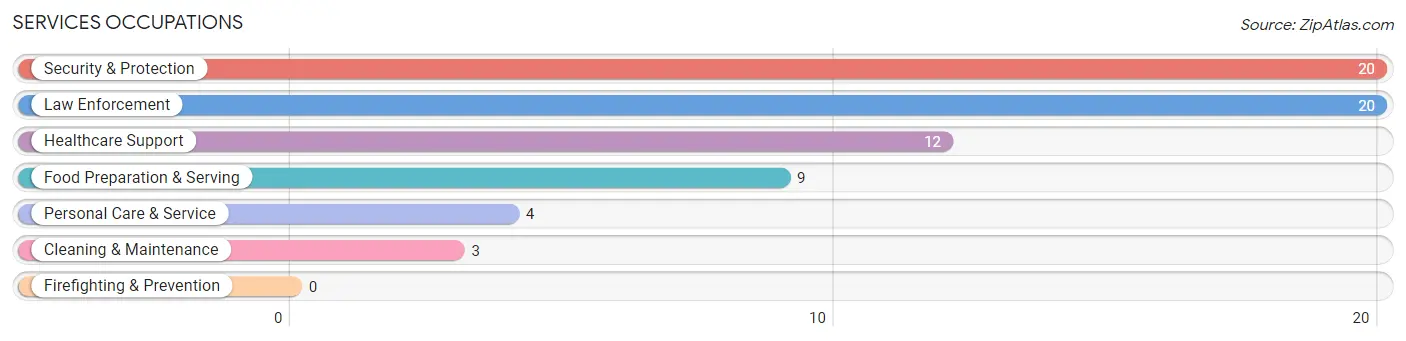
Services Occupations
The most common Services occupations in Aurora are Security & Protection (20 | 4.1%), Law Enforcement (20 | 4.1%), Healthcare Support (12 | 2.5%), Food Preparation & Serving (9 | 1.8%), and Personal Care & Service (4 | 0.8%).
Services Occupations by Sex
Within the Services occupations in Aurora, the most male-oriented occupations are Security & Protection (100.0%), and Law Enforcement (100.0%), while the most female-oriented occupations are Healthcare Support (100.0%), Food Preparation & Serving (100.0%), and Cleaning & Maintenance (100.0%).
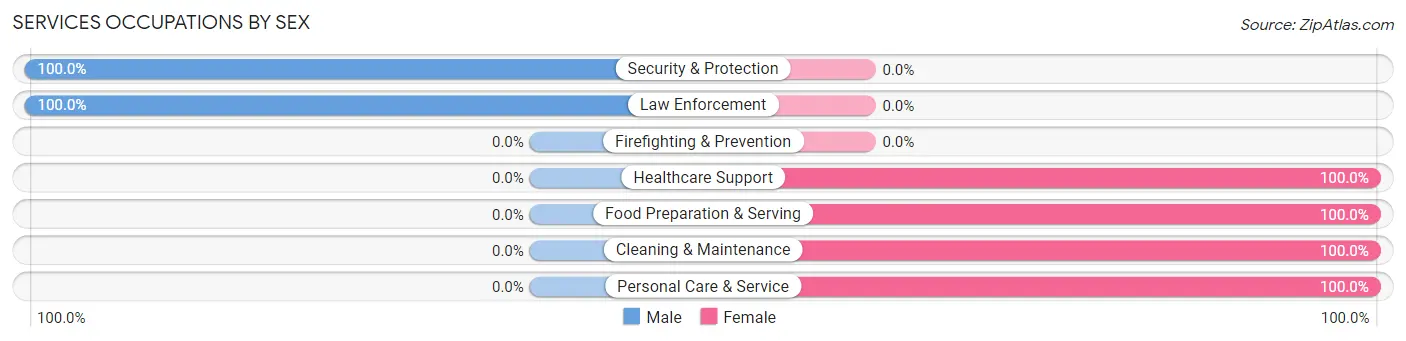
| Occupation | Male | Female |
| Healthcare Support | 0 (0.0%) | 12 (100.0%) |
| Security & Protection | 20 (100.0%) | 0 (0.0%) |
| Firefighting & Prevention | 0 (0.0%) | 0 (0.0%) |
| Law Enforcement | 20 (100.0%) | 0 (0.0%) |
| Food Preparation & Serving | 0 (0.0%) | 9 (100.0%) |
| Cleaning & Maintenance | 0 (0.0%) | 3 (100.0%) |
| Personal Care & Service | 0 (0.0%) | 4 (100.0%) |
| Total (Category) | 20 (41.7%) | 28 (58.3%) |
| Total (Overall) | 253 (52.1%) | 233 (47.9%) |
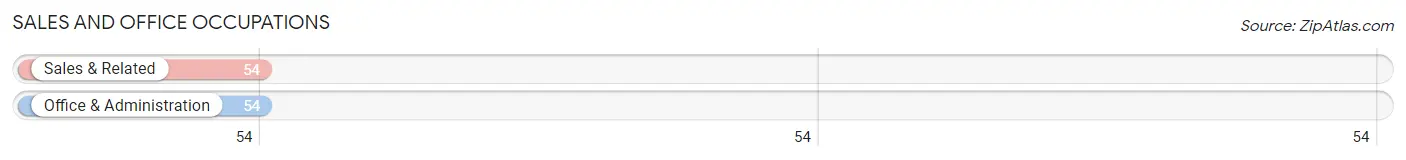
Sales and Office Occupations
The most common Sales and Office occupations in Aurora are Sales & Related (54 | 11.1%), and Office & Administration (54 | 11.1%).
Sales and Office Occupations by Sex

| Occupation | Male | Female |
| Sales & Related | 15 (27.8%) | 39 (72.2%) |
| Office & Administration | 10 (18.5%) | 44 (81.5%) |
| Total (Category) | 25 (23.2%) | 83 (76.8%) |
| Total (Overall) | 253 (52.1%) | 233 (47.9%) |
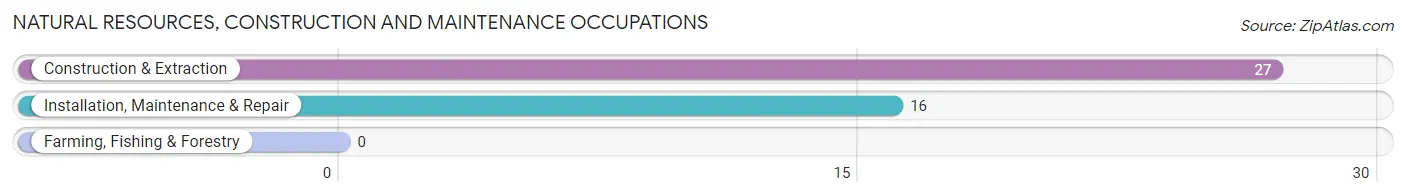
Natural Resources, Construction and Maintenance Occupations
The most common Natural Resources, Construction and Maintenance occupations in Aurora are Construction & Extraction (27 | 5.6%), and Installation, Maintenance & Repair (16 | 3.3%).
Natural Resources, Construction and Maintenance Occupations by Sex
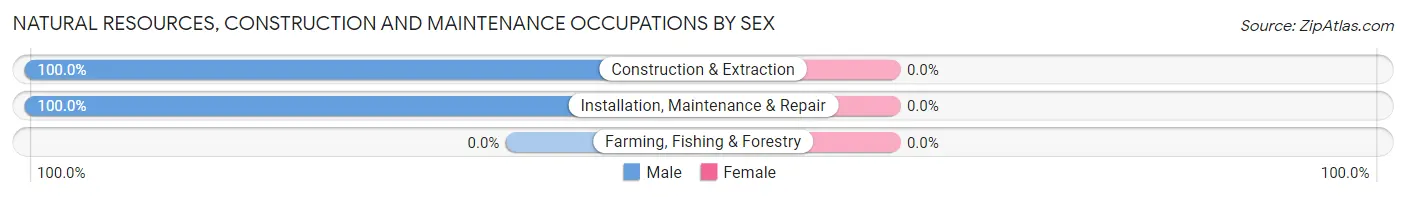
| Occupation | Male | Female |
| Farming, Fishing & Forestry | 0 (0.0%) | 0 (0.0%) |
| Construction & Extraction | 27 (100.0%) | 0 (0.0%) |
| Installation, Maintenance & Repair | 16 (100.0%) | 0 (0.0%) |
| Total (Category) | 43 (100.0%) | 0 (0.0%) |
| Total (Overall) | 253 (52.1%) | 233 (47.9%) |
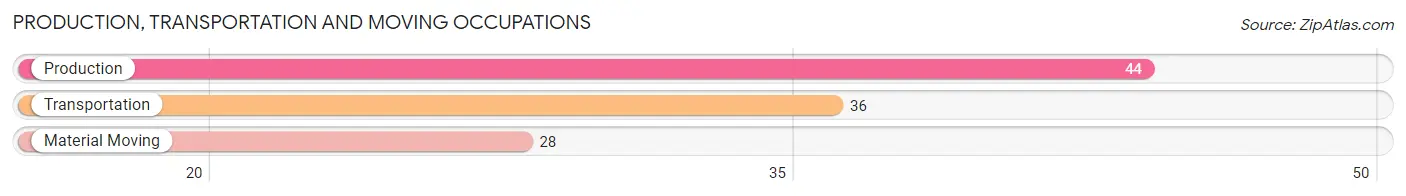
Production, Transportation and Moving Occupations
The most common Production, Transportation and Moving occupations in Aurora are Production (44 | 9.0%), Transportation (36 | 7.4%), and Material Moving (28 | 5.8%).
Production, Transportation and Moving Occupations by Sex
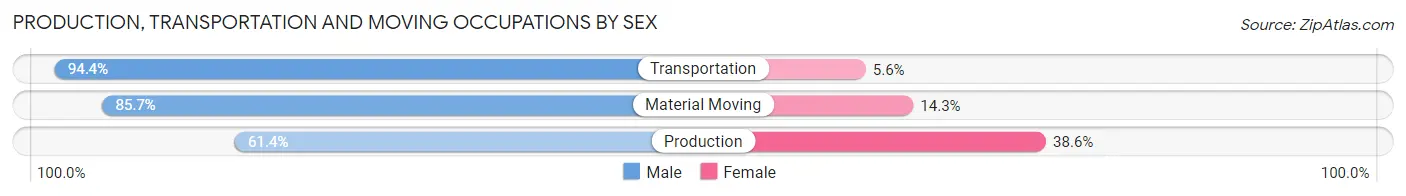
| Occupation | Male | Female |
| Production | 27 (61.4%) | 17 (38.6%) |
| Transportation | 34 (94.4%) | 2 (5.6%) |
| Material Moving | 24 (85.7%) | 4 (14.3%) |
| Total (Category) | 85 (78.7%) | 23 (21.3%) |
| Total (Overall) | 253 (52.1%) | 233 (47.9%) |
Employment Industries by Sex in Aurora
Employment Industries in Aurora
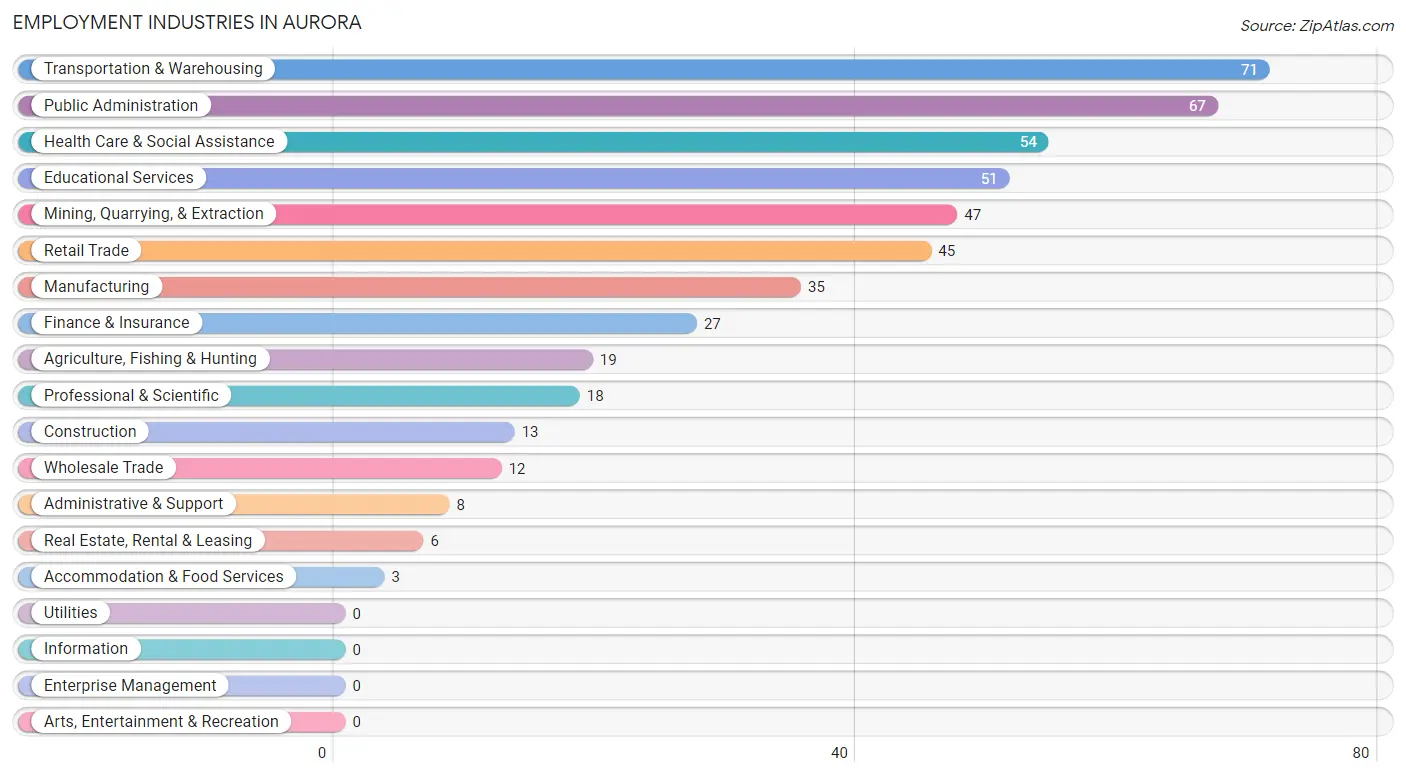
The major employment industries in Aurora include Transportation & Warehousing (71 | 14.6%), Public Administration (67 | 13.8%), Health Care & Social Assistance (54 | 11.1%), Educational Services (51 | 10.5%), and Mining, Quarrying, & Extraction (47 | 9.7%).
Employment Industries by Sex in Aurora
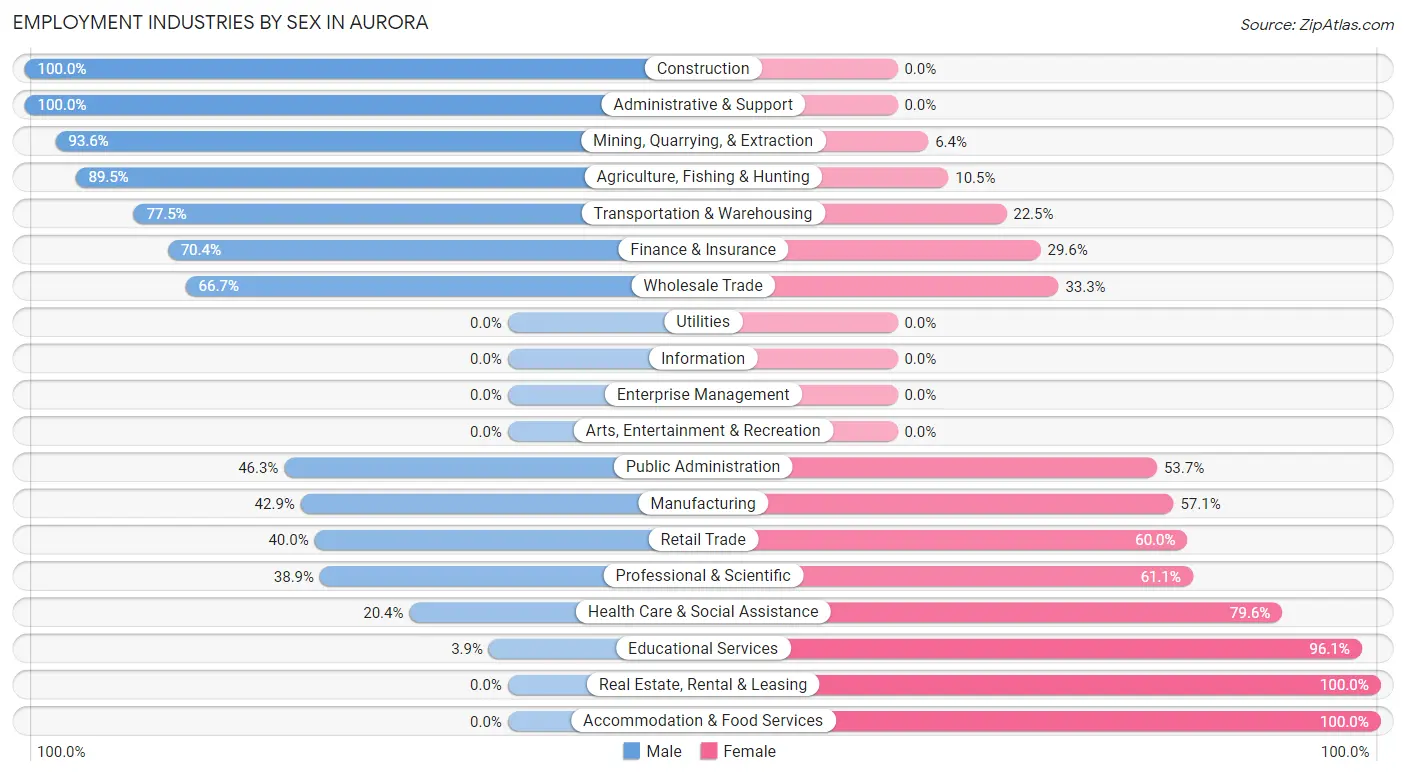
The Aurora industries that see more men than women are Construction (100.0%), Administrative & Support (100.0%), and Mining, Quarrying, & Extraction (93.6%), whereas the industries that tend to have a higher number of women are Real Estate, Rental & Leasing (100.0%), Accommodation & Food Services (100.0%), and Educational Services (96.1%).
| Industry | Male | Female |
| Agriculture, Fishing & Hunting | 17 (89.5%) | 2 (10.5%) |
| Mining, Quarrying, & Extraction | 44 (93.6%) | 3 (6.4%) |
| Construction | 13 (100.0%) | 0 (0.0%) |
| Manufacturing | 15 (42.9%) | 20 (57.1%) |
| Wholesale Trade | 8 (66.7%) | 4 (33.3%) |
| Retail Trade | 18 (40.0%) | 27 (60.0%) |
| Transportation & Warehousing | 55 (77.5%) | 16 (22.5%) |
| Utilities | 0 (0.0%) | 0 (0.0%) |
| Information | 0 (0.0%) | 0 (0.0%) |
| Finance & Insurance | 19 (70.4%) | 8 (29.6%) |
| Real Estate, Rental & Leasing | 0 (0.0%) | 6 (100.0%) |
| Professional & Scientific | 7 (38.9%) | 11 (61.1%) |
| Enterprise Management | 0 (0.0%) | 0 (0.0%) |
| Administrative & Support | 8 (100.0%) | 0 (0.0%) |
| Educational Services | 2 (3.9%) | 49 (96.1%) |
| Health Care & Social Assistance | 11 (20.4%) | 43 (79.6%) |
| Arts, Entertainment & Recreation | 0 (0.0%) | 0 (0.0%) |
| Accommodation & Food Services | 0 (0.0%) | 3 (100.0%) |
| Public Administration | 31 (46.3%) | 36 (53.7%) |
| Total | 253 (52.1%) | 233 (47.9%) |
Education in Aurora
School Enrollment in Aurora
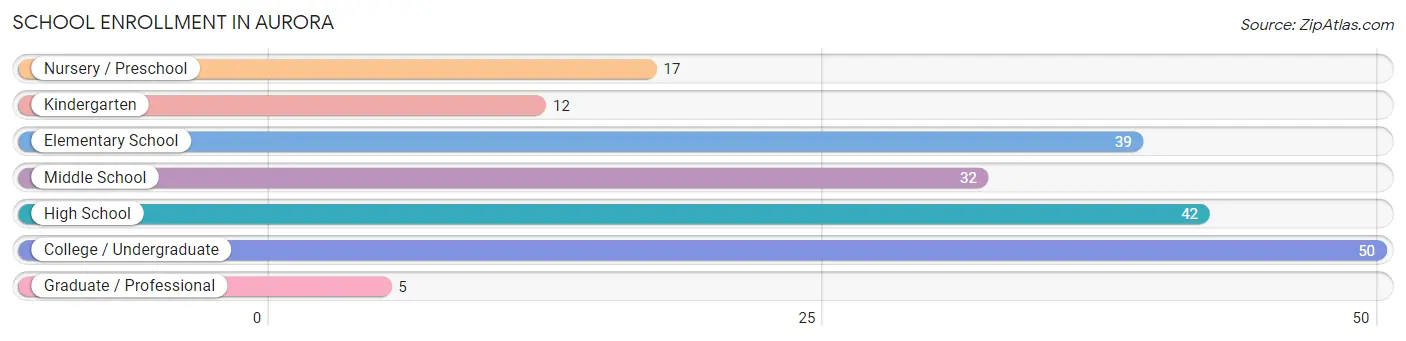
The most common levels of schooling among the 197 students in Aurora are college / undergraduate (50 | 25.4%), high school (42 | 21.3%), and elementary school (39 | 19.8%).
| School Level | # Students | % Students |
| Nursery / Preschool | 17 | 8.6% |
| Kindergarten | 12 | 6.1% |
| Elementary School | 39 | 19.8% |
| Middle School | 32 | 16.2% |
| High School | 42 | 21.3% |
| College / Undergraduate | 50 | 25.4% |
| Graduate / Professional | 5 | 2.5% |
| Total | 197 | 100.0% |
School Enrollment by Age by Funding Source in Aurora
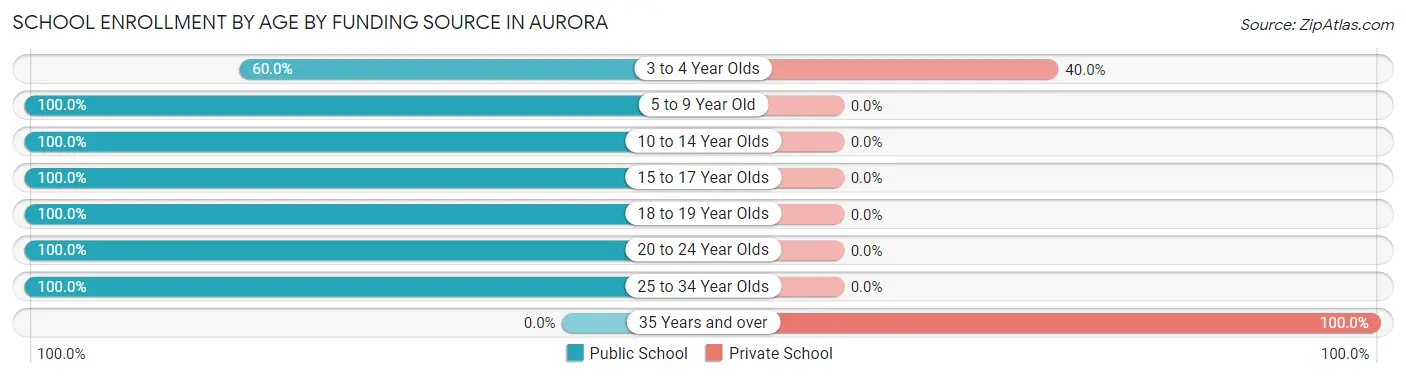
Out of a total of 197 students who are enrolled in schools in Aurora, 13 (6.6%) attend a private institution, while the remaining 184 (93.4%) are enrolled in public schools. The age group of 35 years and over has the highest likelihood of being enrolled in private schools, with 9 (100.0% in the age bracket) enrolled. Conversely, the age group of 5 to 9 year old has the lowest likelihood of being enrolled in a private school, with 55 (100.0% in the age bracket) attending a public institution.
| Age Bracket | Public School | Private School |
| 3 to 4 Year Olds | 6 (60.0%) | 4 (40.0%) |
| 5 to 9 Year Old | 55 (100.0%) | 0 (0.0%) |
| 10 to 14 Year Olds | 44 (100.0%) | 0 (0.0%) |
| 15 to 17 Year Olds | 30 (100.0%) | 0 (0.0%) |
| 18 to 19 Year Olds | 32 (100.0%) | 0 (0.0%) |
| 20 to 24 Year Olds | 14 (100.0%) | 0 (0.0%) |
| 25 to 34 Year Olds | 3 (100.0%) | 0 (0.0%) |
| 35 Years and over | 0 (0.0%) | 9 (100.0%) |
| Total | 184 (93.4%) | 13 (6.6%) |
Educational Attainment by Field of Study in Aurora
Education (31 | 26.1%), bio, nature & agricultural (25 | 21.0%), business (17 | 14.3%), arts & humanities (14 | 11.8%), and multidisciplinary studies (11 | 9.2%) are the most common fields of study among 119 individuals in Aurora who have obtained a bachelor's degree or higher.
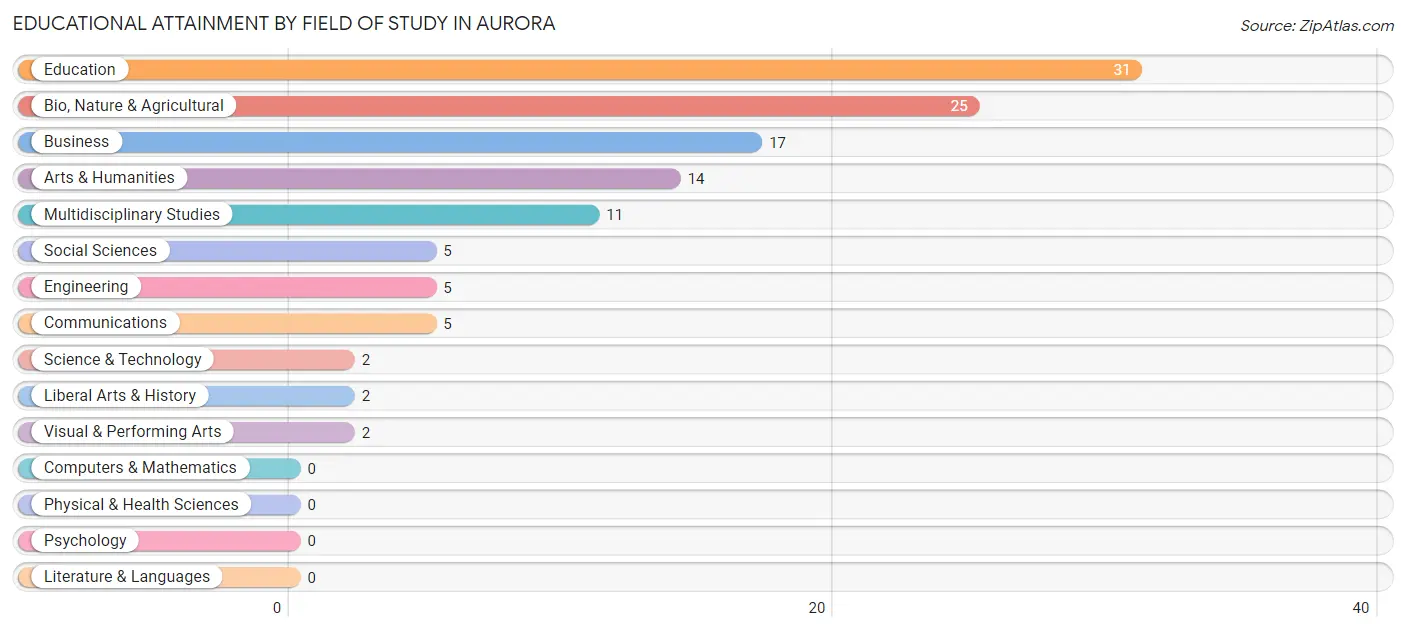
| Field of Study | # Graduates | % Graduates |
| Computers & Mathematics | 0 | 0.0% |
| Bio, Nature & Agricultural | 25 | 21.0% |
| Physical & Health Sciences | 0 | 0.0% |
| Psychology | 0 | 0.0% |
| Social Sciences | 5 | 4.2% |
| Engineering | 5 | 4.2% |
| Multidisciplinary Studies | 11 | 9.2% |
| Science & Technology | 2 | 1.7% |
| Business | 17 | 14.3% |
| Education | 31 | 26.1% |
| Literature & Languages | 0 | 0.0% |
| Liberal Arts & History | 2 | 1.7% |
| Visual & Performing Arts | 2 | 1.7% |
| Communications | 5 | 4.2% |
| Arts & Humanities | 14 | 11.8% |
| Total | 119 | 100.0% |
Transportation & Commute in Aurora
Vehicle Availability by Sex in Aurora
The most prevalent vehicle ownership categories in Aurora are males with 2 vehicles (79, accounting for 31.2%) and females with 2 vehicles (69, making up 34.6%).
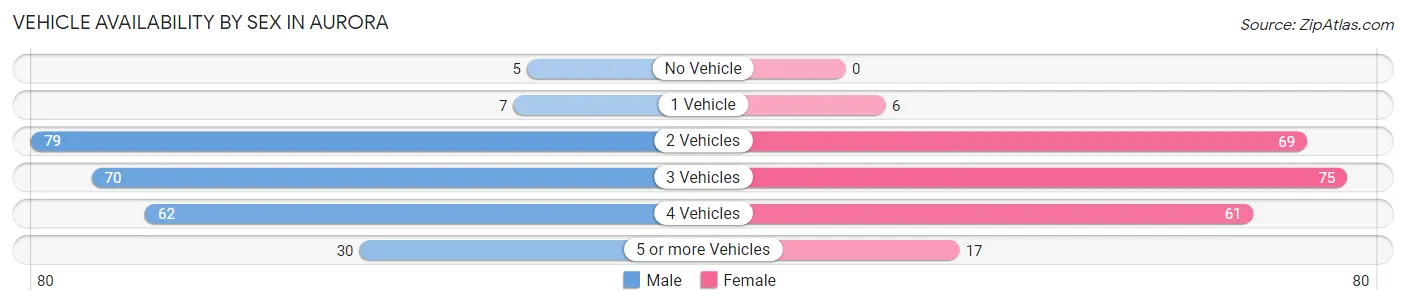
| Vehicles Available | Male | Female |
| No Vehicle | 5 (2.0%) | 0 (0.0%) |
| 1 Vehicle | 7 (2.8%) | 6 (2.6%) |
| 2 Vehicles | 79 (31.2%) | 69 (30.3%) |
| 3 Vehicles | 70 (27.7%) | 75 (32.9%) |
| 4 Vehicles | 62 (24.5%) | 61 (26.8%) |
| 5 or more Vehicles | 30 (11.9%) | 17 (7.5%) |
| Total | 253 (100.0%) | 228 (100.0%) |
Commute Time in Aurora
The most frequently occuring commute durations in Aurora are 15 to 19 minutes (110 commuters, 24.2%), 10 to 14 minutes (106 commuters, 23.4%), and 20 to 24 minutes (65 commuters, 14.3%).
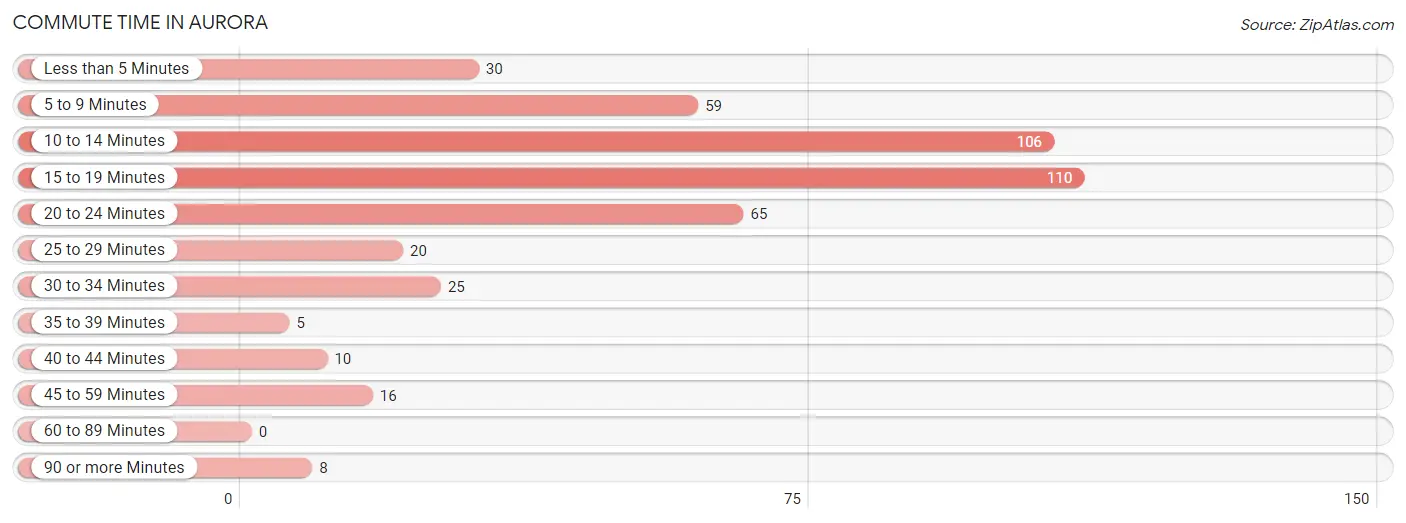
| Commute Time | # Commuters | % Commuters |
| Less than 5 Minutes | 30 | 6.6% |
| 5 to 9 Minutes | 59 | 13.0% |
| 10 to 14 Minutes | 106 | 23.4% |
| 15 to 19 Minutes | 110 | 24.2% |
| 20 to 24 Minutes | 65 | 14.3% |
| 25 to 29 Minutes | 20 | 4.4% |
| 30 to 34 Minutes | 25 | 5.5% |
| 35 to 39 Minutes | 5 | 1.1% |
| 40 to 44 Minutes | 10 | 2.2% |
| 45 to 59 Minutes | 16 | 3.5% |
| 60 to 89 Minutes | 0 | 0.0% |
| 90 or more Minutes | 8 | 1.8% |
Commute Time by Sex in Aurora
The most common commute times in Aurora are 10 to 14 minutes (67 commuters, 27.6%) for males and 15 to 19 minutes (58 commuters, 27.5%) for females.
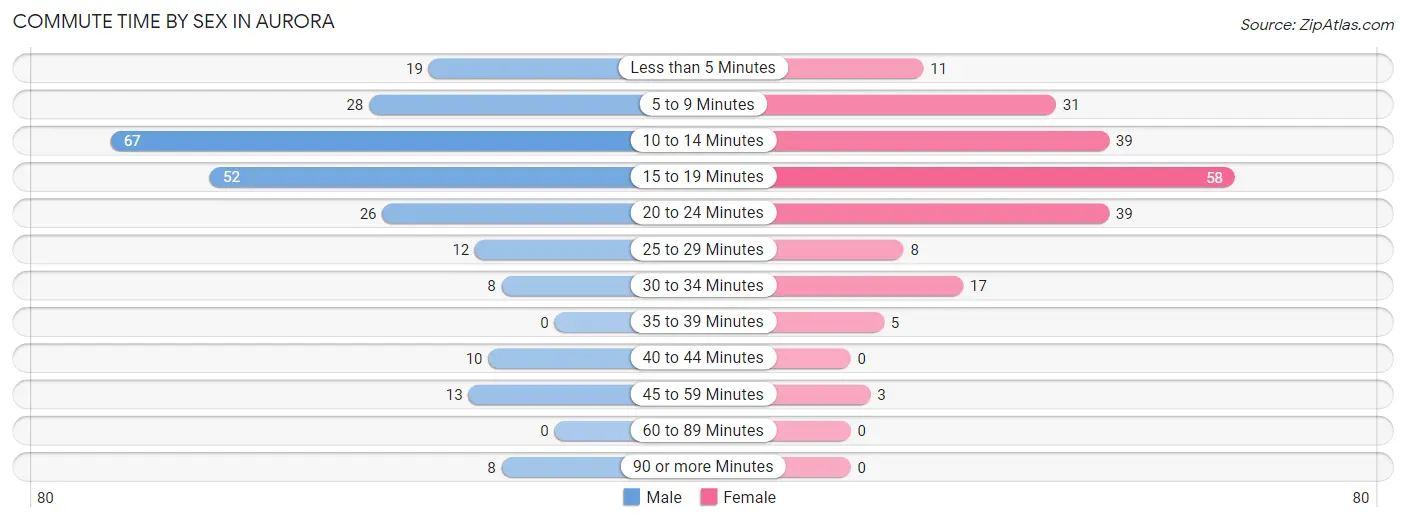
| Commute Time | Male | Female |
| Less than 5 Minutes | 19 (7.8%) | 11 (5.2%) |
| 5 to 9 Minutes | 28 (11.5%) | 31 (14.7%) |
| 10 to 14 Minutes | 67 (27.6%) | 39 (18.5%) |
| 15 to 19 Minutes | 52 (21.4%) | 58 (27.5%) |
| 20 to 24 Minutes | 26 (10.7%) | 39 (18.5%) |
| 25 to 29 Minutes | 12 (4.9%) | 8 (3.8%) |
| 30 to 34 Minutes | 8 (3.3%) | 17 (8.1%) |
| 35 to 39 Minutes | 0 (0.0%) | 5 (2.4%) |
| 40 to 44 Minutes | 10 (4.1%) | 0 (0.0%) |
| 45 to 59 Minutes | 13 (5.3%) | 3 (1.4%) |
| 60 to 89 Minutes | 0 (0.0%) | 0 (0.0%) |
| 90 or more Minutes | 8 (3.3%) | 0 (0.0%) |
Time of Departure to Work by Sex in Aurora
The most frequent times of departure to work in Aurora are 7:30 AM to 7:59 AM (55, 22.6%) for males and 7:30 AM to 7:59 AM (59, 28.0%) for females.
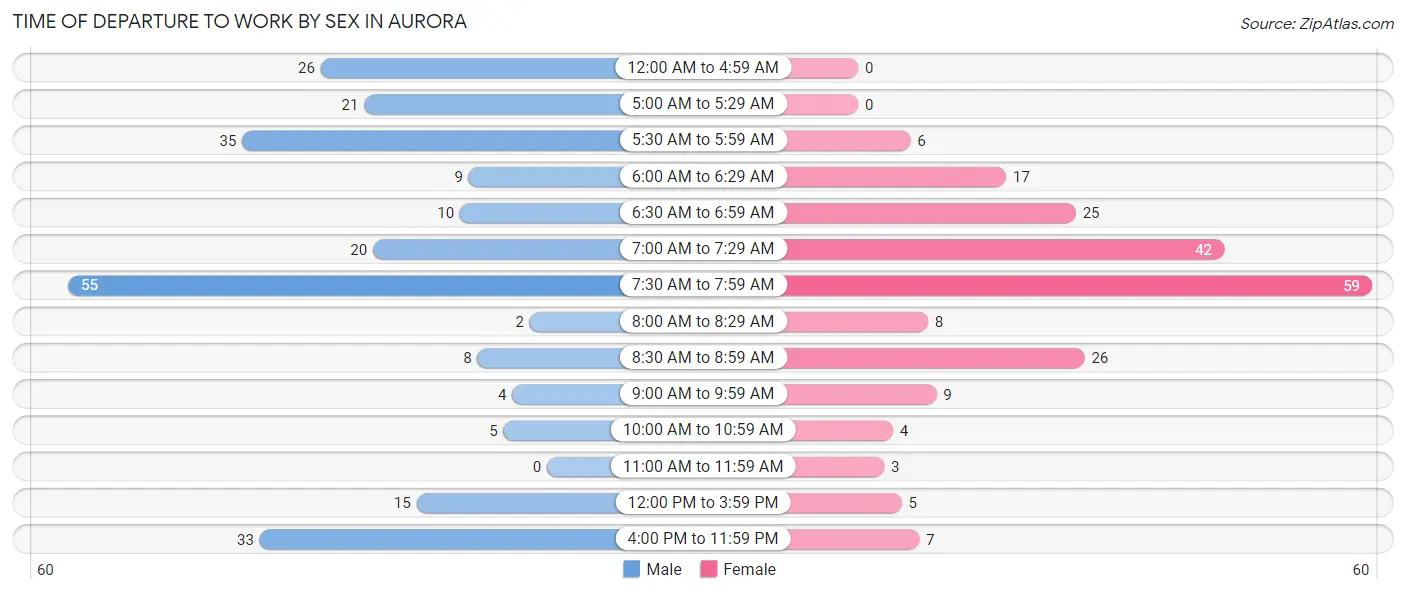
| Time of Departure | Male | Female |
| 12:00 AM to 4:59 AM | 26 (10.7%) | 0 (0.0%) |
| 5:00 AM to 5:29 AM | 21 (8.6%) | 0 (0.0%) |
| 5:30 AM to 5:59 AM | 35 (14.4%) | 6 (2.8%) |
| 6:00 AM to 6:29 AM | 9 (3.7%) | 17 (8.1%) |
| 6:30 AM to 6:59 AM | 10 (4.1%) | 25 (11.8%) |
| 7:00 AM to 7:29 AM | 20 (8.2%) | 42 (19.9%) |
| 7:30 AM to 7:59 AM | 55 (22.6%) | 59 (28.0%) |
| 8:00 AM to 8:29 AM | 2 (0.8%) | 8 (3.8%) |
| 8:30 AM to 8:59 AM | 8 (3.3%) | 26 (12.3%) |
| 9:00 AM to 9:59 AM | 4 (1.7%) | 9 (4.3%) |
| 10:00 AM to 10:59 AM | 5 (2.1%) | 4 (1.9%) |
| 11:00 AM to 11:59 AM | 0 (0.0%) | 3 (1.4%) |
| 12:00 PM to 3:59 PM | 15 (6.2%) | 5 (2.4%) |
| 4:00 PM to 11:59 PM | 33 (13.6%) | 7 (3.3%) |
| Total | 243 (100.0%) | 211 (100.0%) |
Housing Occupancy in Aurora
Occupancy by Ownership in Aurora
Of the total 313 dwellings in Aurora, owner-occupied units account for 294 (93.9%), while renter-occupied units make up 19 (6.1%).
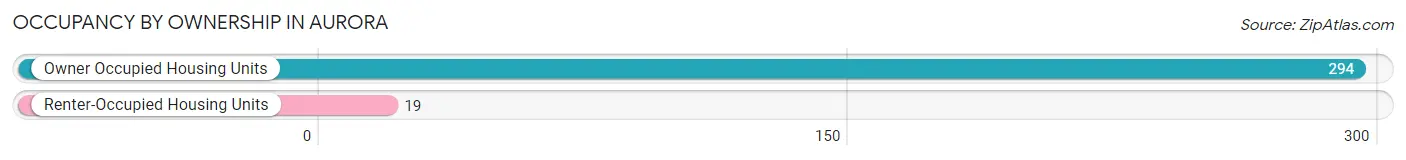
| Occupancy | # Housing Units | % Housing Units |
| Owner Occupied Housing Units | 294 | 93.9% |
| Renter-Occupied Housing Units | 19 | 6.1% |
| Total Occupied Housing Units | 313 | 100.0% |
Occupancy by Household Size in Aurora
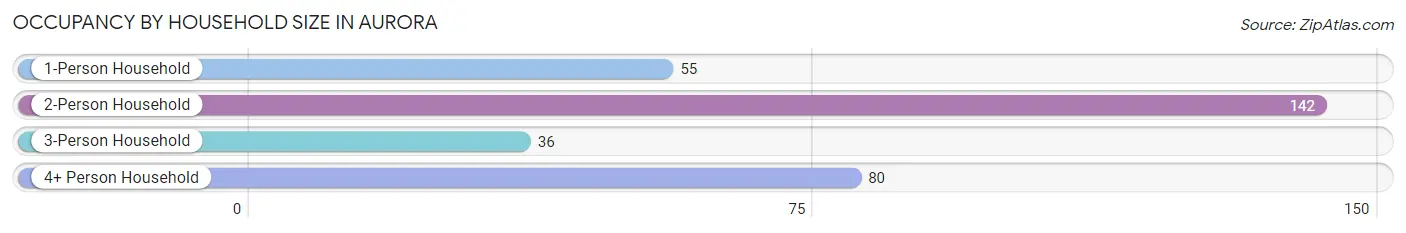
| Household Size | # Housing Units | % Housing Units |
| 1-Person Household | 55 | 17.6% |
| 2-Person Household | 142 | 45.4% |
| 3-Person Household | 36 | 11.5% |
| 4+ Person Household | 80 | 25.6% |
| Total Housing Units | 313 | 100.0% |
Occupancy by Ownership by Household Size in Aurora
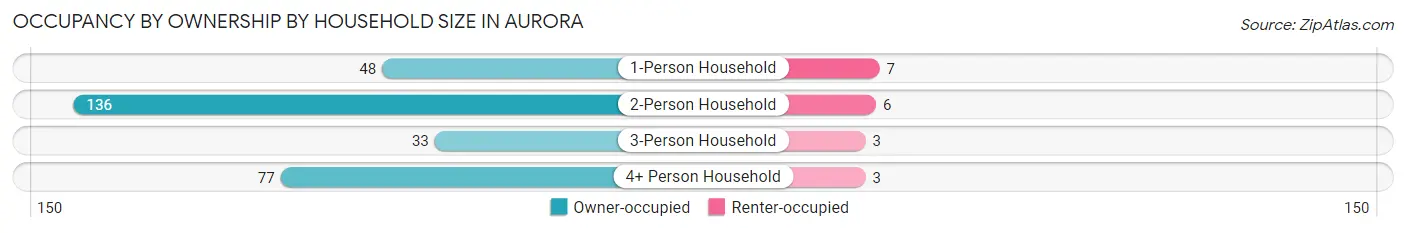
| Household Size | Owner-occupied | Renter-occupied |
| 1-Person Household | 48 (87.3%) | 7 (12.7%) |
| 2-Person Household | 136 (95.8%) | 6 (4.2%) |
| 3-Person Household | 33 (91.7%) | 3 (8.3%) |
| 4+ Person Household | 77 (96.3%) | 3 (3.7%) |
| Total Housing Units | 294 (93.9%) | 19 (6.1%) |
Occupancy by Educational Attainment in Aurora
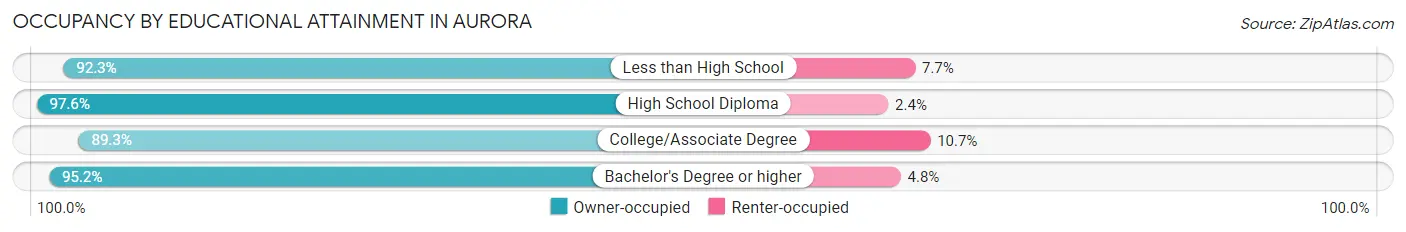
| Household Size | Owner-occupied | Renter-occupied |
| Less than High School | 12 (92.3%) | 1 (7.7%) |
| High School Diploma | 123 (97.6%) | 3 (2.4%) |
| College/Associate Degree | 100 (89.3%) | 12 (10.7%) |
| Bachelor's Degree or higher | 59 (95.2%) | 3 (4.8%) |
Occupancy by Age of Householder in Aurora
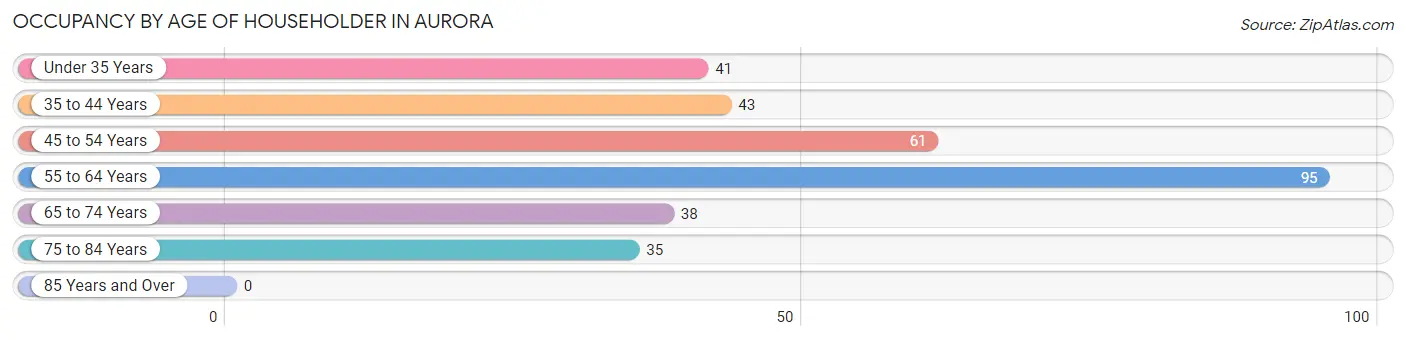
| Age Bracket | # Households | % Households |
| Under 35 Years | 41 | 13.1% |
| 35 to 44 Years | 43 | 13.7% |
| 45 to 54 Years | 61 | 19.5% |
| 55 to 64 Years | 95 | 30.3% |
| 65 to 74 Years | 38 | 12.1% |
| 75 to 84 Years | 35 | 11.2% |
| 85 Years and Over | 0 | 0.0% |
| Total | 313 | 100.0% |
Housing Finances in Aurora
Median Income by Occupancy in Aurora
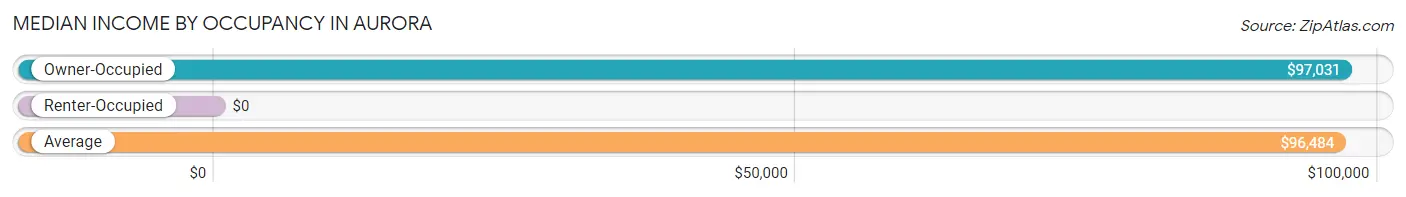
| Occupancy Type | # Households | Median Income |
| Owner-Occupied | 294 (93.9%) | $97,031 |
| Renter-Occupied | 19 (6.1%) | $0 |
| Average | 313 (100.0%) | $96,484 |
Occupancy by Householder Income Bracket in Aurora
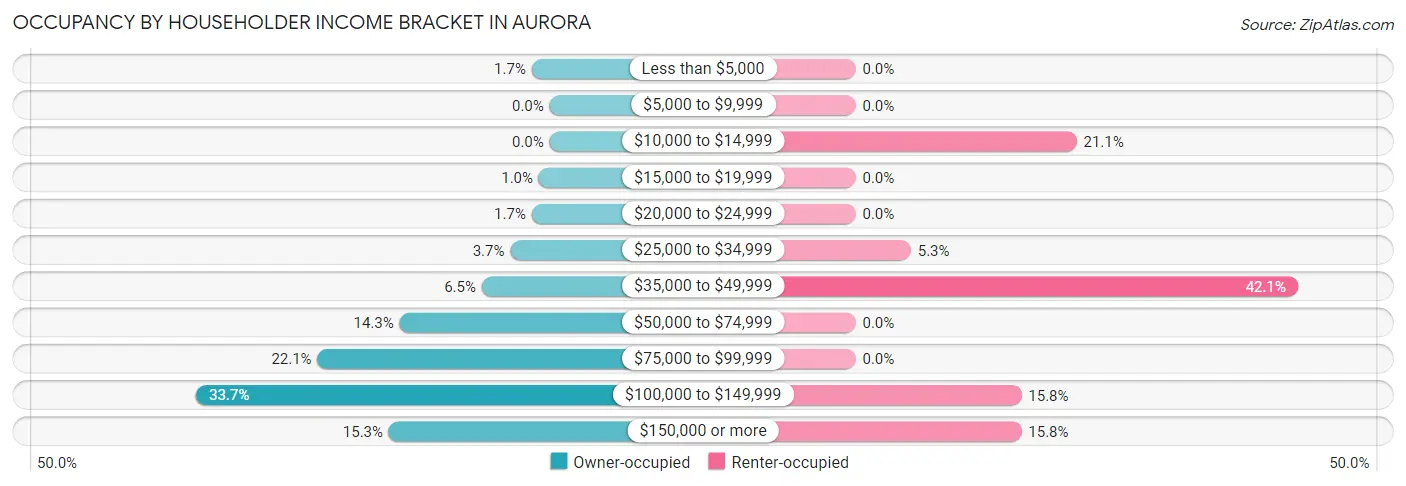
| Income Bracket | Owner-occupied | Renter-occupied |
| Less than $5,000 | 5 (1.7%) | 0 (0.0%) |
| $5,000 to $9,999 | 0 (0.0%) | 0 (0.0%) |
| $10,000 to $14,999 | 0 (0.0%) | 4 (21.0%) |
| $15,000 to $19,999 | 3 (1.0%) | 0 (0.0%) |
| $20,000 to $24,999 | 5 (1.7%) | 0 (0.0%) |
| $25,000 to $34,999 | 11 (3.7%) | 1 (5.3%) |
| $35,000 to $49,999 | 19 (6.5%) | 8 (42.1%) |
| $50,000 to $74,999 | 42 (14.3%) | 0 (0.0%) |
| $75,000 to $99,999 | 65 (22.1%) | 0 (0.0%) |
| $100,000 to $149,999 | 99 (33.7%) | 3 (15.8%) |
| $150,000 or more | 45 (15.3%) | 3 (15.8%) |
| Total | 294 (100.0%) | 19 (100.0%) |
Monthly Housing Cost Tiers in Aurora
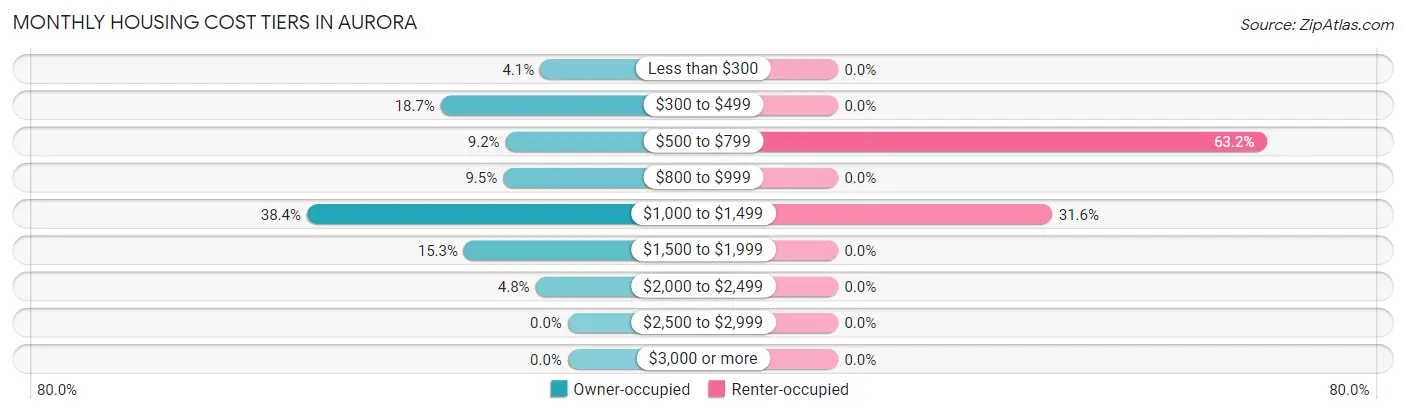
| Monthly Cost | Owner-occupied | Renter-occupied |
| Less than $300 | 12 (4.1%) | 0 (0.0%) |
| $300 to $499 | 55 (18.7%) | 0 (0.0%) |
| $500 to $799 | 27 (9.2%) | 12 (63.2%) |
| $800 to $999 | 28 (9.5%) | 0 (0.0%) |
| $1,000 to $1,499 | 113 (38.4%) | 6 (31.6%) |
| $1,500 to $1,999 | 45 (15.3%) | 0 (0.0%) |
| $2,000 to $2,499 | 14 (4.8%) | 0 (0.0%) |
| $2,500 to $2,999 | 0 (0.0%) | 0 (0.0%) |
| $3,000 or more | 0 (0.0%) | 0 (0.0%) |
| Total | 294 (100.0%) | 19 (100.0%) |
Physical Housing Characteristics in Aurora
Housing Structures in Aurora
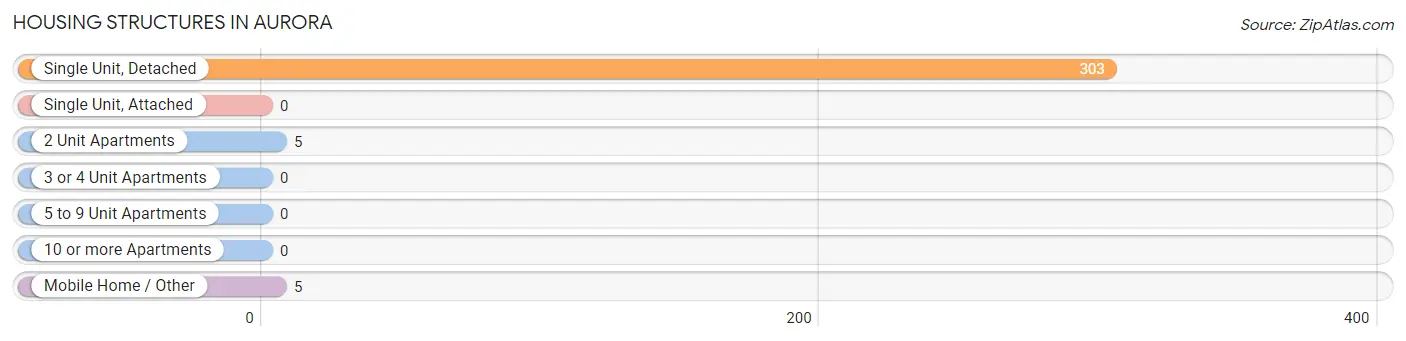
| Structure Type | # Housing Units | % Housing Units |
| Single Unit, Detached | 303 | 96.8% |
| Single Unit, Attached | 0 | 0.0% |
| 2 Unit Apartments | 5 | 1.6% |
| 3 or 4 Unit Apartments | 0 | 0.0% |
| 5 to 9 Unit Apartments | 0 | 0.0% |
| 10 or more Apartments | 0 | 0.0% |
| Mobile Home / Other | 5 | 1.6% |
| Total | 313 | 100.0% |
Housing Structures by Occupancy in Aurora
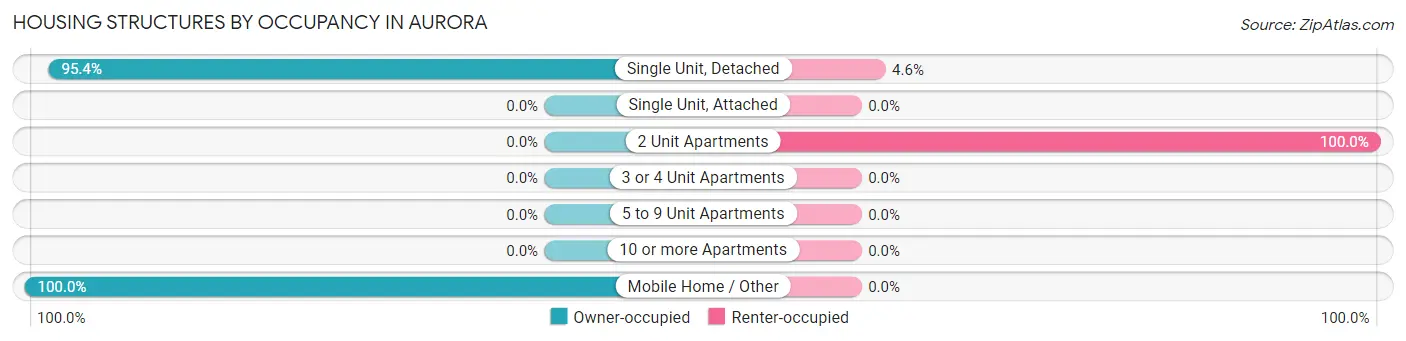
| Structure Type | Owner-occupied | Renter-occupied |
| Single Unit, Detached | 289 (95.4%) | 14 (4.6%) |
| Single Unit, Attached | 0 (0.0%) | 0 (0.0%) |
| 2 Unit Apartments | 0 (0.0%) | 5 (100.0%) |
| 3 or 4 Unit Apartments | 0 (0.0%) | 0 (0.0%) |
| 5 to 9 Unit Apartments | 0 (0.0%) | 0 (0.0%) |
| 10 or more Apartments | 0 (0.0%) | 0 (0.0%) |
| Mobile Home / Other | 5 (100.0%) | 0 (0.0%) |
| Total | 294 (93.9%) | 19 (6.1%) |
Housing Structures by Number of Rooms in Aurora
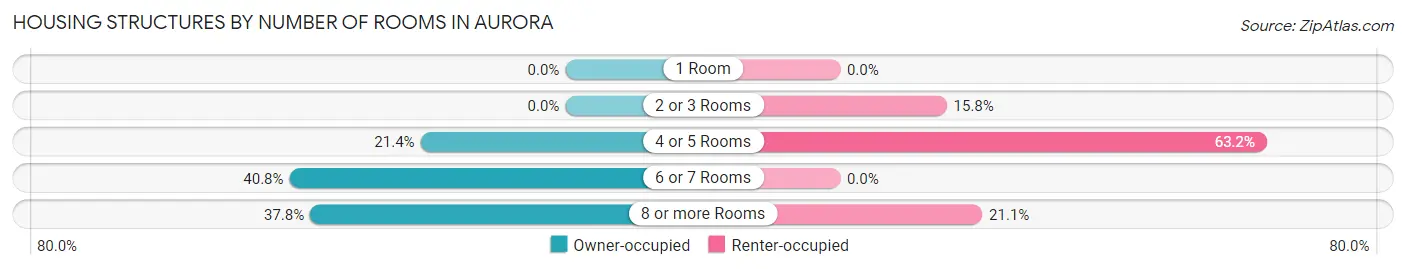
| Number of Rooms | Owner-occupied | Renter-occupied |
| 1 Room | 0 (0.0%) | 0 (0.0%) |
| 2 or 3 Rooms | 0 (0.0%) | 3 (15.8%) |
| 4 or 5 Rooms | 63 (21.4%) | 12 (63.2%) |
| 6 or 7 Rooms | 120 (40.8%) | 0 (0.0%) |
| 8 or more Rooms | 111 (37.8%) | 4 (21.0%) |
| Total | 294 (100.0%) | 19 (100.0%) |
Housing Structure by Heating Type in Aurora
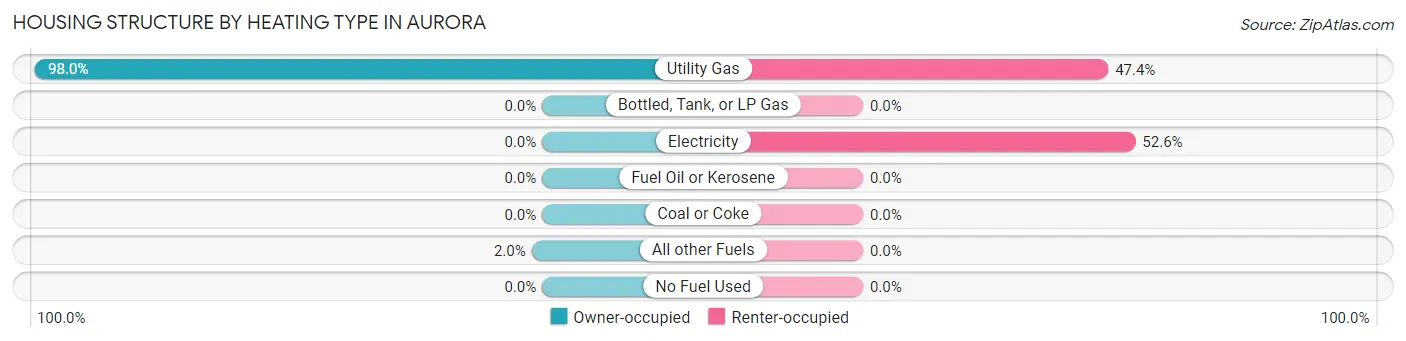
| Heating Type | Owner-occupied | Renter-occupied |
| Utility Gas | 288 (98.0%) | 9 (47.4%) |
| Bottled, Tank, or LP Gas | 0 (0.0%) | 0 (0.0%) |
| Electricity | 0 (0.0%) | 10 (52.6%) |
| Fuel Oil or Kerosene | 0 (0.0%) | 0 (0.0%) |
| Coal or Coke | 0 (0.0%) | 0 (0.0%) |
| All other Fuels | 6 (2.0%) | 0 (0.0%) |
| No Fuel Used | 0 (0.0%) | 0 (0.0%) |
| Total | 294 (100.0%) | 19 (100.0%) |
Household Vehicle Usage in Aurora
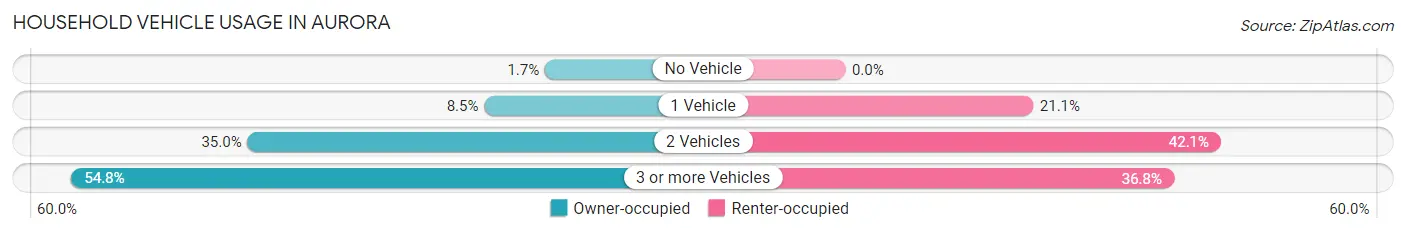
| Vehicles per Household | Owner-occupied | Renter-occupied |
| No Vehicle | 5 (1.7%) | 0 (0.0%) |
| 1 Vehicle | 25 (8.5%) | 4 (21.0%) |
| 2 Vehicles | 103 (35.0%) | 8 (42.1%) |
| 3 or more Vehicles | 161 (54.8%) | 7 (36.8%) |
| Total | 294 (100.0%) | 19 (100.0%) |
Real Estate & Mortgages in Aurora
Real Estate and Mortgage Overview in Aurora
| Characteristic | Without Mortgage | With Mortgage |
| Housing Units | 82 | 212 |
| Median Property Value | $253,000 | $239,200 |
| Median Household Income | $101,250 | $32 |
| Monthly Housing Costs | $410 | $0 |
| Real Estate Taxes | $1,385 | $0 |
Property Value by Mortgage Status in Aurora
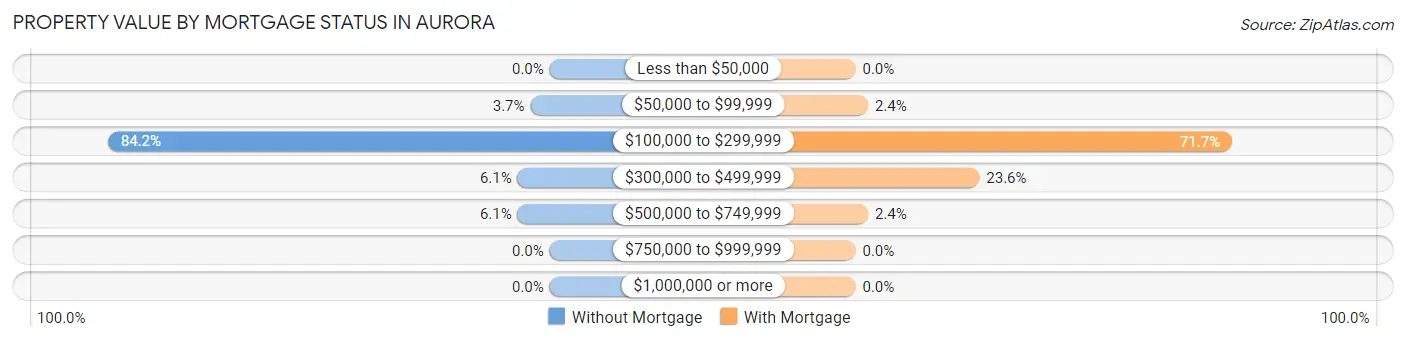
| Property Value | Without Mortgage | With Mortgage |
| Less than $50,000 | 0 (0.0%) | 0 (0.0%) |
| $50,000 to $99,999 | 3 (3.7%) | 5 (2.4%) |
| $100,000 to $299,999 | 69 (84.2%) | 152 (71.7%) |
| $300,000 to $499,999 | 5 (6.1%) | 50 (23.6%) |
| $500,000 to $749,999 | 5 (6.1%) | 5 (2.4%) |
| $750,000 to $999,999 | 0 (0.0%) | 0 (0.0%) |
| $1,000,000 or more | 0 (0.0%) | 0 (0.0%) |
| Total | 82 (100.0%) | 212 (100.0%) |
Household Income by Mortgage Status in Aurora
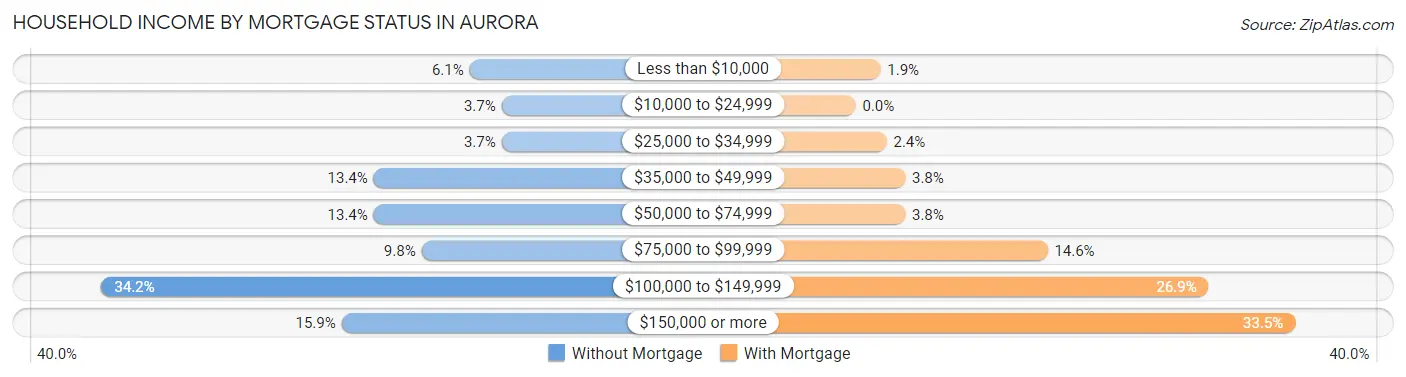
| Household Income | Without Mortgage | With Mortgage |
| Less than $10,000 | 5 (6.1%) | 4 (1.9%) |
| $10,000 to $24,999 | 3 (3.7%) | 0 (0.0%) |
| $25,000 to $34,999 | 3 (3.7%) | 5 (2.4%) |
| $35,000 to $49,999 | 11 (13.4%) | 8 (3.8%) |
| $50,000 to $74,999 | 11 (13.4%) | 8 (3.8%) |
| $75,000 to $99,999 | 8 (9.8%) | 31 (14.6%) |
| $100,000 to $149,999 | 28 (34.2%) | 57 (26.9%) |
| $150,000 or more | 13 (15.9%) | 71 (33.5%) |
| Total | 82 (100.0%) | 212 (100.0%) |
Property Value to Household Income Ratio in Aurora
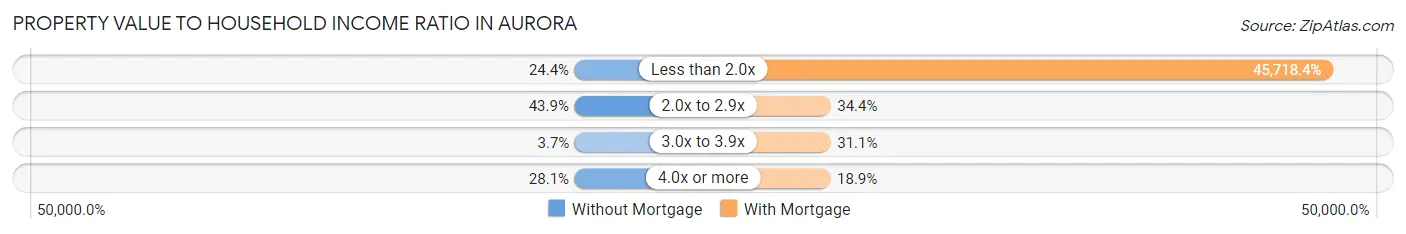
| Value-to-Income Ratio | Without Mortgage | With Mortgage |
| Less than 2.0x | 20 (24.4%) | 96,923 (45,718.4%) |
| 2.0x to 2.9x | 36 (43.9%) | 73 (34.4%) |
| 3.0x to 3.9x | 3 (3.7%) | 66 (31.1%) |
| 4.0x or more | 23 (28.1%) | 40 (18.9%) |
| Total | 82 (100.0%) | 212 (100.0%) |
Real Estate Taxes by Mortgage Status in Aurora
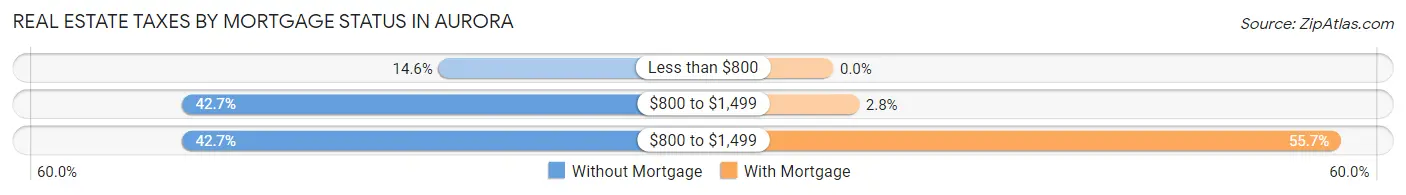
| Property Taxes | Without Mortgage | With Mortgage |
| Less than $800 | 12 (14.6%) | 0 (0.0%) |
| $800 to $1,499 | 35 (42.7%) | 6 (2.8%) |
| $800 to $1,499 | 35 (42.7%) | 118 (55.7%) |
| Total | 82 (100.0%) | 212 (100.0%) |
Health & Disability in Aurora
Health Insurance Coverage by Age in Aurora
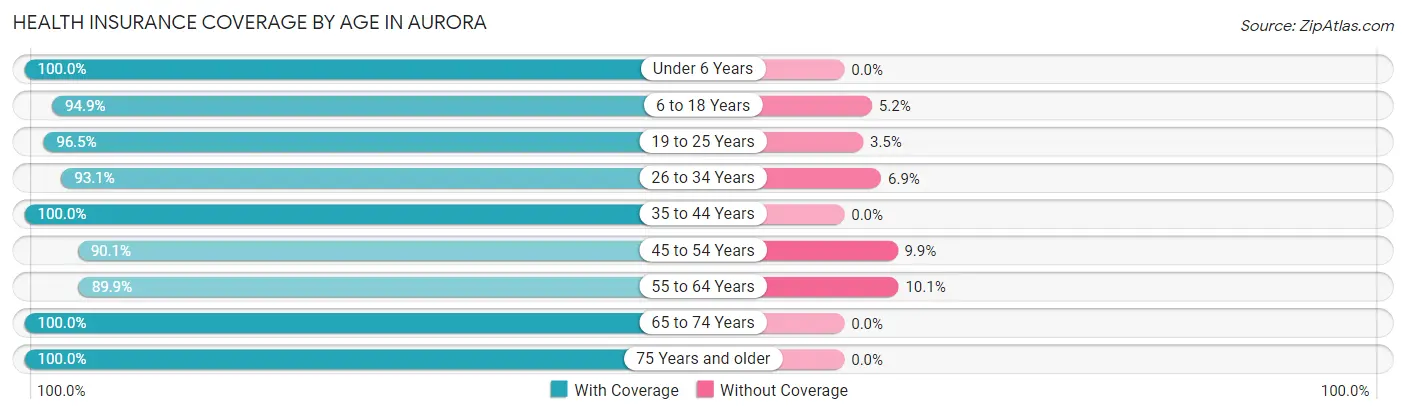
| Age Bracket | With Coverage | Without Coverage |
| Under 6 Years | 67 (100.0%) | 0 (0.0%) |
| 6 to 18 Years | 129 (94.9%) | 7 (5.1%) |
| 19 to 25 Years | 83 (96.5%) | 3 (3.5%) |
| 26 to 34 Years | 95 (93.1%) | 7 (6.9%) |
| 35 to 44 Years | 72 (100.0%) | 0 (0.0%) |
| 45 to 54 Years | 100 (90.1%) | 11 (9.9%) |
| 55 to 64 Years | 160 (89.9%) | 18 (10.1%) |
| 65 to 74 Years | 78 (100.0%) | 0 (0.0%) |
| 75 Years and older | 68 (100.0%) | 0 (0.0%) |
| Total | 852 (94.9%) | 46 (5.1%) |
Health Insurance Coverage by Citizenship Status in Aurora
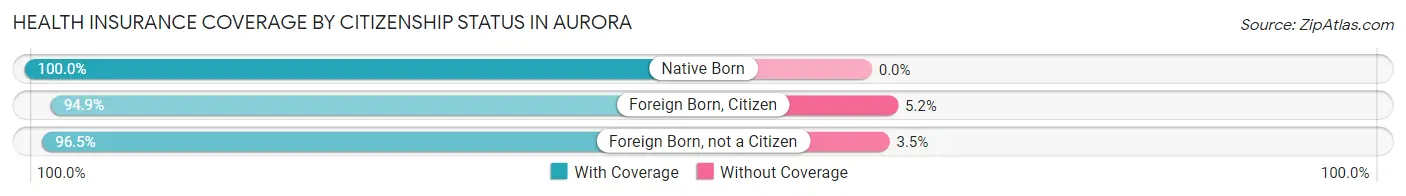
| Citizenship Status | With Coverage | Without Coverage |
| Native Born | 67 (100.0%) | 0 (0.0%) |
| Foreign Born, Citizen | 129 (94.9%) | 7 (5.1%) |
| Foreign Born, not a Citizen | 83 (96.5%) | 3 (3.5%) |
Health Insurance Coverage by Household Income in Aurora
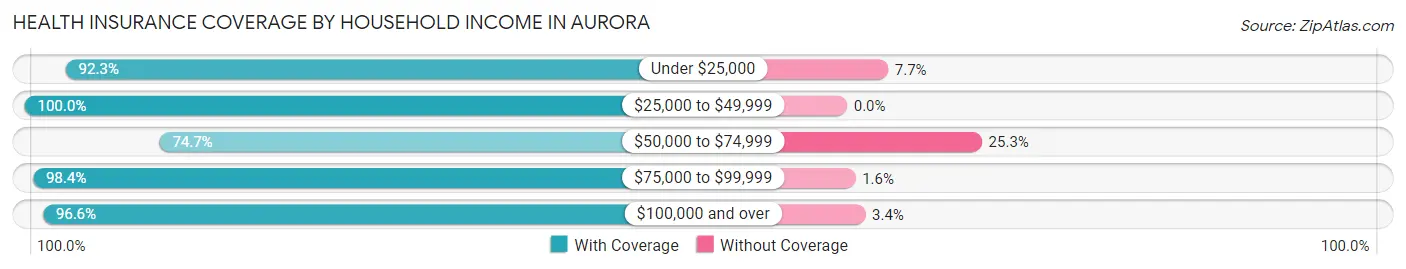
| Household Income | With Coverage | Without Coverage |
| Under $25,000 | 36 (92.3%) | 3 (7.7%) |
| $25,000 to $49,999 | 82 (100.0%) | 0 (0.0%) |
| $50,000 to $74,999 | 68 (74.7%) | 23 (25.3%) |
| $75,000 to $99,999 | 187 (98.4%) | 3 (1.6%) |
| $100,000 and over | 479 (96.6%) | 17 (3.4%) |
Public vs Private Health Insurance Coverage by Age in Aurora
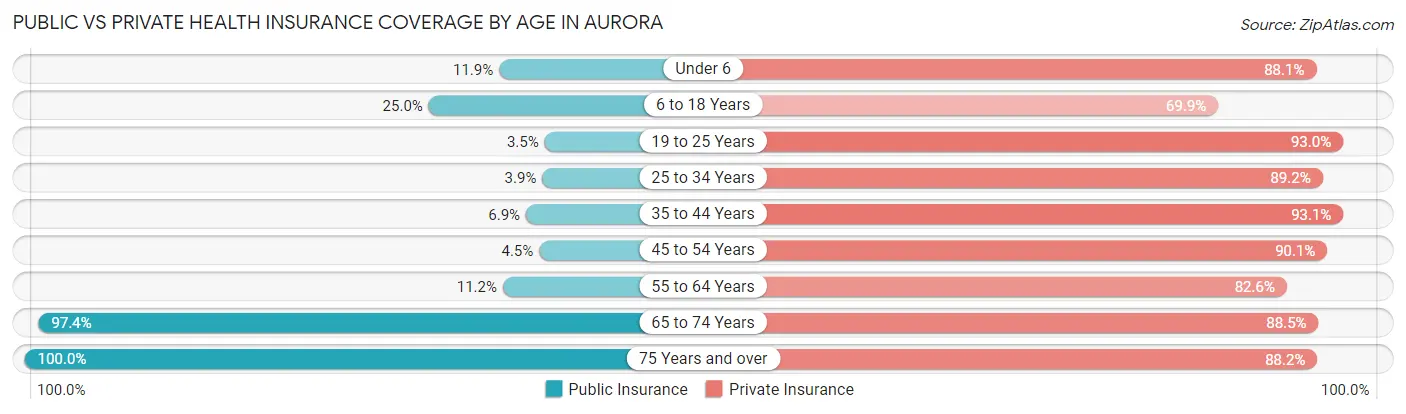
| Age Bracket | Public Insurance | Private Insurance |
| Under 6 | 8 (11.9%) | 59 (88.1%) |
| 6 to 18 Years | 34 (25.0%) | 95 (69.9%) |
| 19 to 25 Years | 3 (3.5%) | 80 (93.0%) |
| 25 to 34 Years | 4 (3.9%) | 91 (89.2%) |
| 35 to 44 Years | 5 (6.9%) | 67 (93.1%) |
| 45 to 54 Years | 5 (4.5%) | 100 (90.1%) |
| 55 to 64 Years | 20 (11.2%) | 147 (82.6%) |
| 65 to 74 Years | 76 (97.4%) | 69 (88.5%) |
| 75 Years and over | 68 (100.0%) | 60 (88.2%) |
| Total | 223 (24.8%) | 768 (85.5%) |
Disability Status by Sex by Age in Aurora
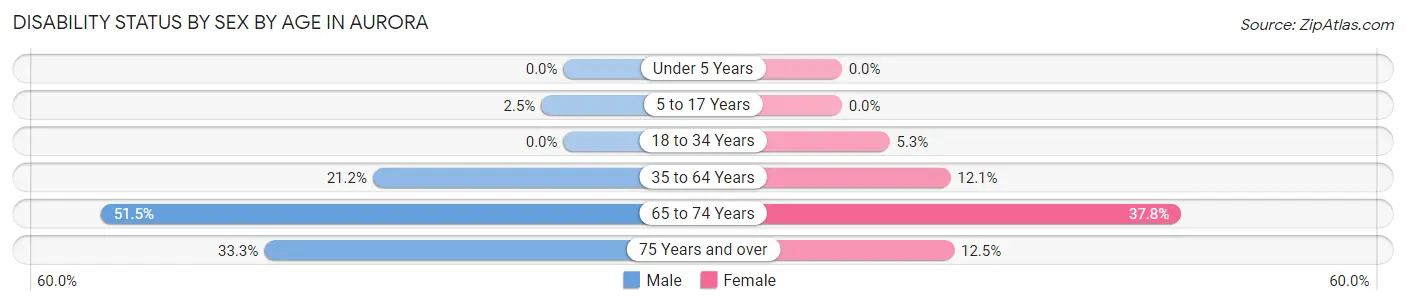
| Age Bracket | Male | Female |
| Under 5 Years | 0 (0.0%) | 0 (0.0%) |
| 5 to 17 Years | 2 (2.5%) | 0 (0.0%) |
| 18 to 34 Years | 0 (0.0%) | 5 (5.3%) |
| 35 to 64 Years | 38 (21.2%) | 22 (12.1%) |
| 65 to 74 Years | 17 (51.5%) | 17 (37.8%) |
| 75 Years and over | 12 (33.3%) | 4 (12.5%) |
Disability Class by Sex by Age in Aurora
Disability Class: Hearing Difficulty
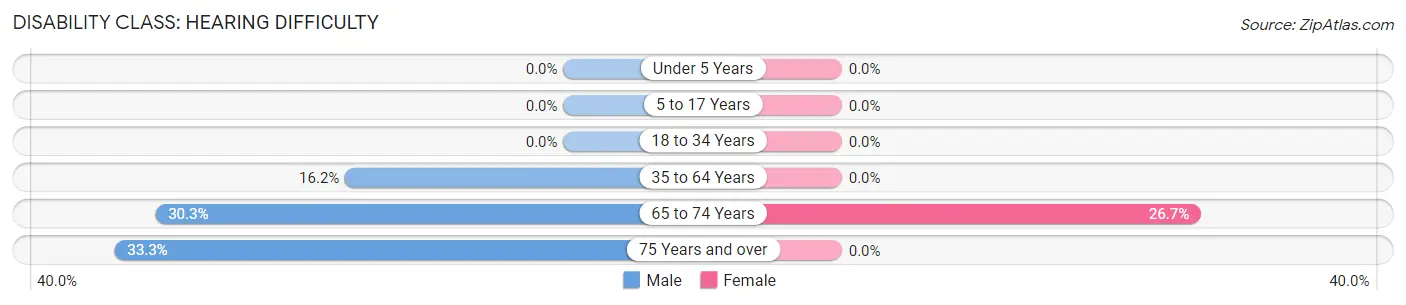
| Age Bracket | Male | Female |
| Under 5 Years | 0 (0.0%) | 0 (0.0%) |
| 5 to 17 Years | 0 (0.0%) | 0 (0.0%) |
| 18 to 34 Years | 0 (0.0%) | 0 (0.0%) |
| 35 to 64 Years | 29 (16.2%) | 0 (0.0%) |
| 65 to 74 Years | 10 (30.3%) | 12 (26.7%) |
| 75 Years and over | 12 (33.3%) | 0 (0.0%) |
Disability Class: Vision Difficulty
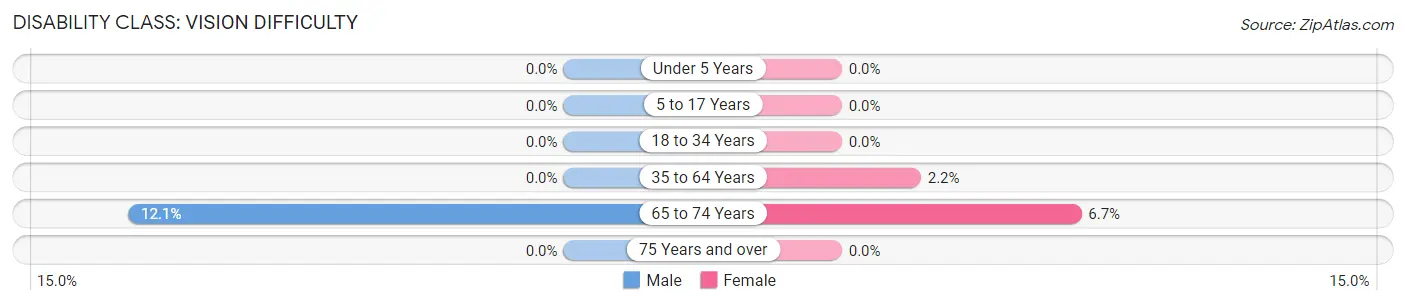
| Age Bracket | Male | Female |
| Under 5 Years | 0 (0.0%) | 0 (0.0%) |
| 5 to 17 Years | 0 (0.0%) | 0 (0.0%) |
| 18 to 34 Years | 0 (0.0%) | 0 (0.0%) |
| 35 to 64 Years | 0 (0.0%) | 4 (2.2%) |
| 65 to 74 Years | 4 (12.1%) | 3 (6.7%) |
| 75 Years and over | 0 (0.0%) | 0 (0.0%) |
Disability Class: Cognitive Difficulty
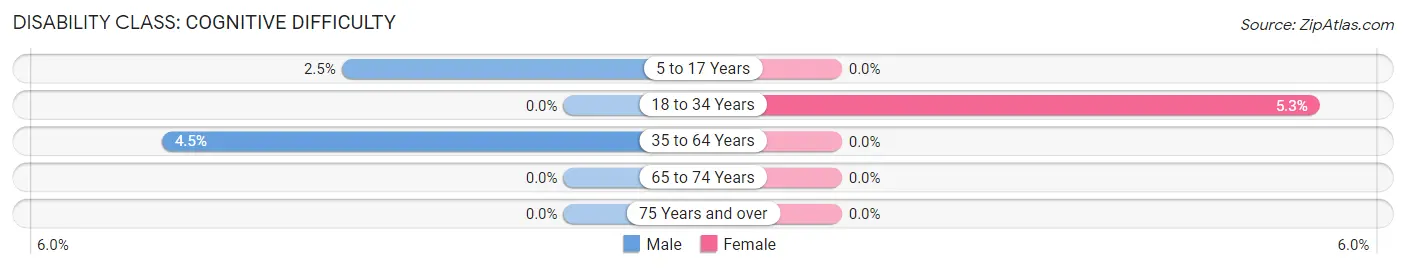
| Age Bracket | Male | Female |
| 5 to 17 Years | 2 (2.5%) | 0 (0.0%) |
| 18 to 34 Years | 0 (0.0%) | 5 (5.3%) |
| 35 to 64 Years | 8 (4.5%) | 0 (0.0%) |
| 65 to 74 Years | 0 (0.0%) | 0 (0.0%) |
| 75 Years and over | 0 (0.0%) | 0 (0.0%) |
Disability Class: Ambulatory Difficulty
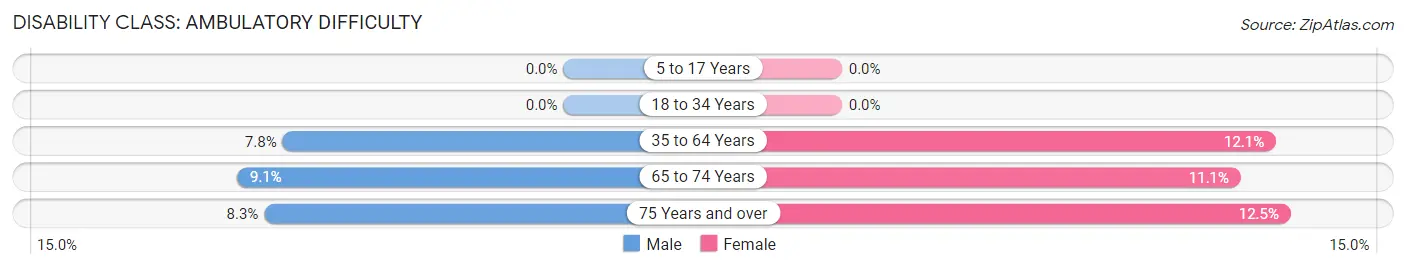
| Age Bracket | Male | Female |
| 5 to 17 Years | 0 (0.0%) | 0 (0.0%) |
| 18 to 34 Years | 0 (0.0%) | 0 (0.0%) |
| 35 to 64 Years | 14 (7.8%) | 22 (12.1%) |
| 65 to 74 Years | 3 (9.1%) | 5 (11.1%) |
| 75 Years and over | 3 (8.3%) | 4 (12.5%) |
Disability Class: Self-Care Difficulty
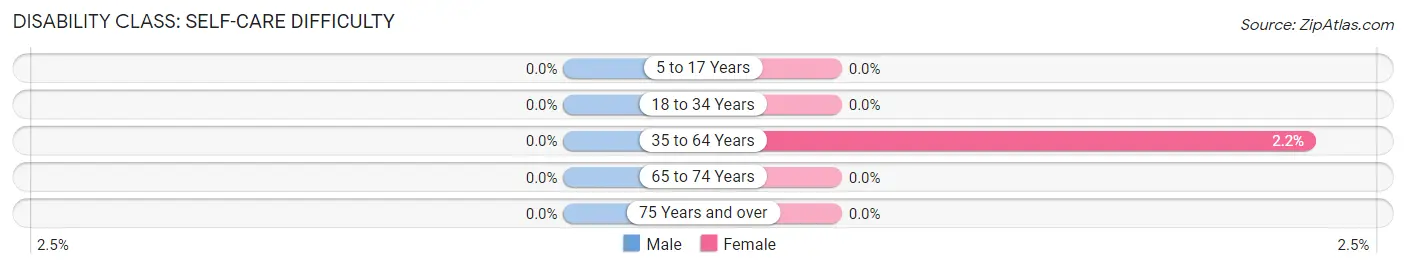
| Age Bracket | Male | Female |
| 5 to 17 Years | 0 (0.0%) | 0 (0.0%) |
| 18 to 34 Years | 0 (0.0%) | 0 (0.0%) |
| 35 to 64 Years | 0 (0.0%) | 4 (2.2%) |
| 65 to 74 Years | 0 (0.0%) | 0 (0.0%) |
| 75 Years and over | 0 (0.0%) | 0 (0.0%) |
Technology Access in Aurora
Computing Device Access in Aurora
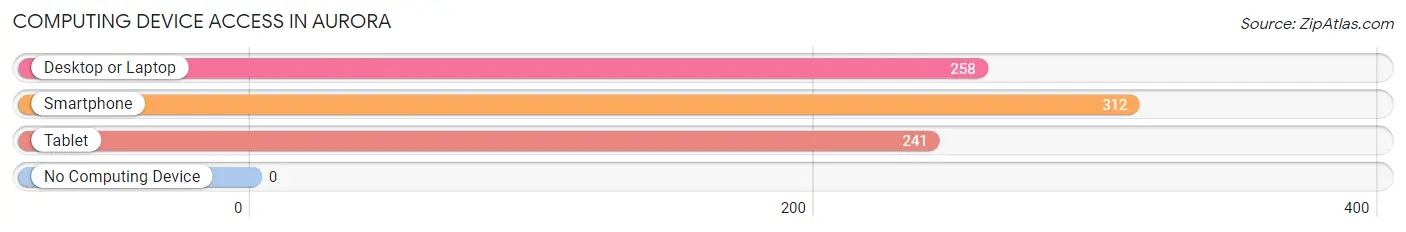
| Device Type | # Households | % Households |
| Desktop or Laptop | 258 | 82.4% |
| Smartphone | 312 | 99.7% |
| Tablet | 241 | 77.0% |
| No Computing Device | 0 | 0.0% |
| Total | 313 | 100.0% |
Internet Access in Aurora
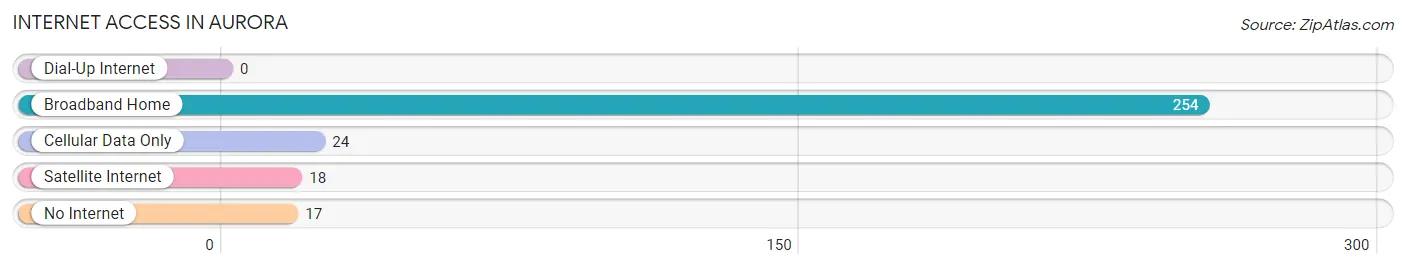
| Internet Type | # Households | % Households |
| Dial-Up Internet | 0 | 0.0% |
| Broadband Home | 254 | 81.1% |
| Cellular Data Only | 24 | 7.7% |
| Satellite Internet | 18 | 5.8% |
| No Internet | 17 | 5.4% |
| Total | 313 | 100.0% |
Aurora Summary
Aurora, Utah is a small town located in the southwestern corner of the state, near the Arizona border. It is part of the larger San Juan County, and is situated in the Four Corners region of the United States. The town has a population of just over 1,000 people, and is the smallest incorporated town in the state.
Geography
Aurora is located in the extreme southwestern corner of Utah, near the Arizona border. It is situated in the Four Corners region of the United States, and is part of the larger San Juan County. The town is located in a desert climate, with hot summers and mild winters. The area is known for its red sandstone formations, and is home to the Valley of the Gods, a popular tourist destination.
The town is situated at an elevation of 4,890 feet, and is surrounded by the Abajo Mountains to the east and the La Sal Mountains to the west. The town is located near the San Juan River, which provides a source of water for the area.
History
Aurora was founded in 1876 by Mormon settlers, who were looking for a place to settle in the Four Corners region. The town was named after the Roman goddess of the dawn, Aurora. The town was originally a farming community, and the settlers grew crops such as wheat, corn, and potatoes.
In the early 1900s, the town began to grow and develop. The first school was built in 1906, and the first post office was established in 1907. The town was incorporated in 1909, and the first mayor was elected in 1910.
Economy
Aurora’s economy is largely based on tourism and agriculture. The town is home to several tourist attractions, including the Valley of the Gods and the San Juan River. The town is also home to several farms, which produce a variety of crops, including wheat, corn, and potatoes.
The town is also home to several small businesses, including restaurants, shops, and a gas station. The town is also home to a small airport, which serves the area.
Demographics
As of the 2010 census, Aurora had a population of 1,082 people. The town is predominantly white, with a small Hispanic population. The median household income is $37,500, and the median home value is $125,000.
The town is served by the San Juan School District, which includes two elementary schools, a middle school, and a high school. The town is also home to a branch of the San Juan County Library.
Conclusion
Aurora, Utah is a small town located in the southwestern corner of the state, near the Arizona border. It is part of the larger San Juan County, and is situated in the Four Corners region of the United States. The town has a population of just over 1,000 people, and is the smallest incorporated town in the state. The town’s economy is largely based on tourism and agriculture, and the town is home to several tourist attractions and farms. The town is predominantly white, with a small Hispanic population, and is served by the San Juan School District.
Common Questions
What is Per Capita Income in Aurora?
Per Capita income in Aurora is $38,644.
What is the Median Family Income in Aurora?
Median Family Income in Aurora is $106,250.
What is the Median Household income in Aurora?
Median Household Income in Aurora is $96,484.
What is Income or Wage Gap in Aurora?
Income or Wage Gap in Aurora is 47.1%.
Women in Aurora earn 52.9 cents for every dollar earned by a man.
What is Inequality or Gini Index in Aurora?
Inequality or Gini Index in Aurora is 0.31.
What is the Total Population of Aurora?
Total Population of Aurora is 898.
What is the Total Male Population of Aurora?
Total Male Population of Aurora is 468.
What is the Total Female Population of Aurora?
Total Female Population of Aurora is 430.
What is the Ratio of Males per 100 Females in Aurora?
There are 108.84 Males per 100 Females in Aurora.
What is the Ratio of Females per 100 Males in Aurora?
There are 91.88 Females per 100 Males in Aurora.
What is the Median Population Age in Aurora?
Median Population Age in Aurora is 43.3 Years.
What is the Average Family Size in Aurora
Average Family Size in Aurora is 3.2 People.
What is the Average Household Size in Aurora
Average Household Size in Aurora is 2.9 People.
How Large is the Labor Force in Aurora?
There are 489 People in the Labor Forcein in Aurora.
What is the Percentage of People in the Labor Force in Aurora?
67.2% of People are in the Labor Force in Aurora.
What is the Unemployment Rate in Aurora?
Unemployment Rate in Aurora is 0.6%.