Groveland, CA Map & Demographics
Groveland Map
Groveland Overview
$49,017
PER CAPITA INCOME
$68,304
AVG FAMILY INCOME
$55,313
AVG HOUSEHOLD INCOME
0.56
INEQUALITY / GINI INDEX
591
TOTAL POPULATION
253
MALE POPULATION
338
FEMALE POPULATION
74.85
MALES / 100 FEMALES
133.60
FEMALES / 100 MALES
63.6
MEDIAN AGE
2.4
AVG FAMILY SIZE
2.0
AVG HOUSEHOLD SIZE
165
LABOR FORCE [ PEOPLE ]
29.8%
PERCENT IN LABOR FORCE
Groveland Zip Codes
Groveland Area Codes
Income in Groveland
Income Overview in Groveland
Per Capita Income in Groveland is $49,017, while median incomes of families and households are $68,304 and $55,313 respectively.
| Characteristic | Number | Measure |
| Per Capita Income | 591 | $49,017 |
| Median Family Income | 153 | $68,304 |
| Mean Family Income | 153 | $76,046 |
| Median Household Income | 302 | $55,313 |
| Mean Household Income | 302 | $95,921 |
| Income Deficit | 153 | $0 |
| Wage / Income Gap (%) | 591 | 0.00% |
| Wage / Income Gap ($) | 591 | 100.00¢ per $1 |
| Gini / Inequality Index | 591 | 0.56 |
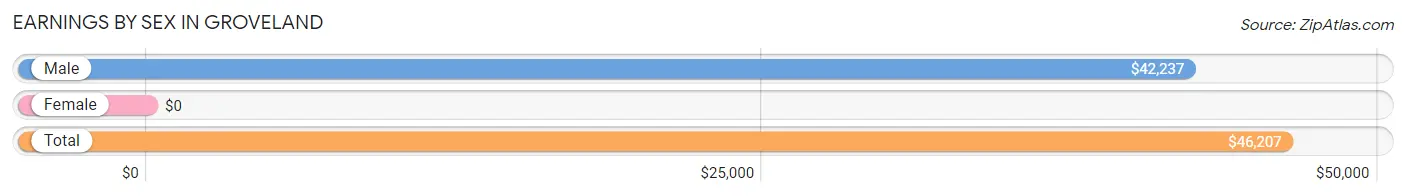
Earnings by Sex in Groveland
| Sex | Number | Average Earnings |
| Male | 112 (54.9%) | $42,237 |
| Female | 92 (45.1%) | $0 |
| Total | 204 (100.0%) | $46,207 |
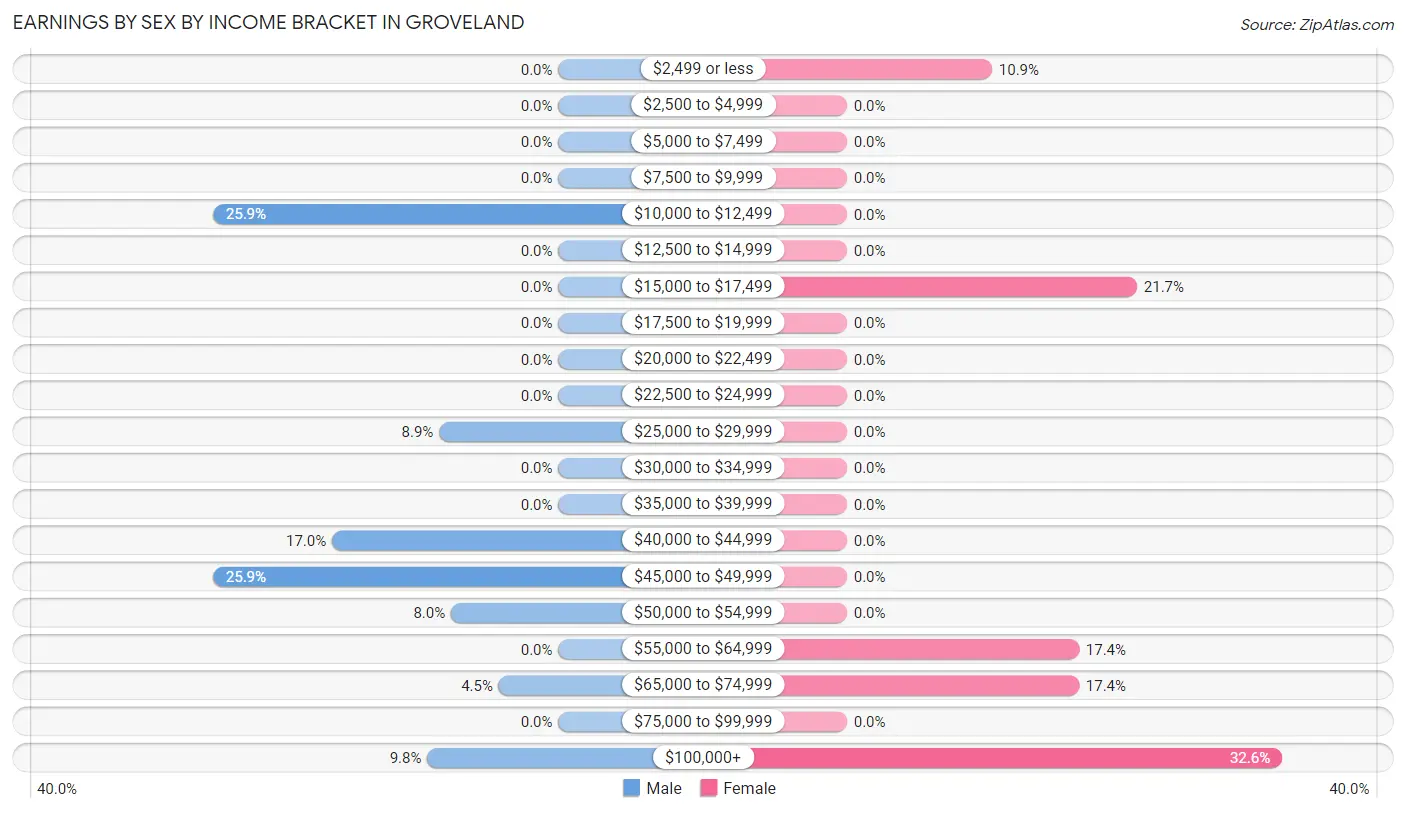
Earnings by Sex by Income Bracket in Groveland
The most common earnings brackets in Groveland are $10,000 to $12,499 for men (29 | 25.9%) and $100,000+ for women (30 | 32.6%).
| Income | Male | Female |
| $2,499 or less | 0 (0.0%) | 10 (10.9%) |
| $2,500 to $4,999 | 0 (0.0%) | 0 (0.0%) |
| $5,000 to $7,499 | 0 (0.0%) | 0 (0.0%) |
| $7,500 to $9,999 | 0 (0.0%) | 0 (0.0%) |
| $10,000 to $12,499 | 29 (25.9%) | 0 (0.0%) |
| $12,500 to $14,999 | 0 (0.0%) | 0 (0.0%) |
| $15,000 to $17,499 | 0 (0.0%) | 20 (21.7%) |
| $17,500 to $19,999 | 0 (0.0%) | 0 (0.0%) |
| $20,000 to $22,499 | 0 (0.0%) | 0 (0.0%) |
| $22,500 to $24,999 | 0 (0.0%) | 0 (0.0%) |
| $25,000 to $29,999 | 10 (8.9%) | 0 (0.0%) |
| $30,000 to $34,999 | 0 (0.0%) | 0 (0.0%) |
| $35,000 to $39,999 | 0 (0.0%) | 0 (0.0%) |
| $40,000 to $44,999 | 19 (17.0%) | 0 (0.0%) |
| $45,000 to $49,999 | 29 (25.9%) | 0 (0.0%) |
| $50,000 to $54,999 | 9 (8.0%) | 0 (0.0%) |
| $55,000 to $64,999 | 0 (0.0%) | 16 (17.4%) |
| $65,000 to $74,999 | 5 (4.5%) | 16 (17.4%) |
| $75,000 to $99,999 | 0 (0.0%) | 0 (0.0%) |
| $100,000+ | 11 (9.8%) | 30 (32.6%) |
| Total | 112 (100.0%) | 92 (100.0%) |
Earnings by Sex by Educational Attainment in Groveland
| Educational Attainment | Male Income | Female Income |
| Less than High School | - | - |
| High School Diploma | - | - |
| College or Associate's Degree | - | - |
| Bachelor's Degree | - | - |
| Graduate Degree | - | - |
| Total | $42,237 | $0 |
Family Income in Groveland
Family Income Brackets in Groveland
According to the Groveland family income data, there are 57 families falling into the $35,000 to $49,999 income range, which is the most common income bracket and makes up 37.2% of all families.
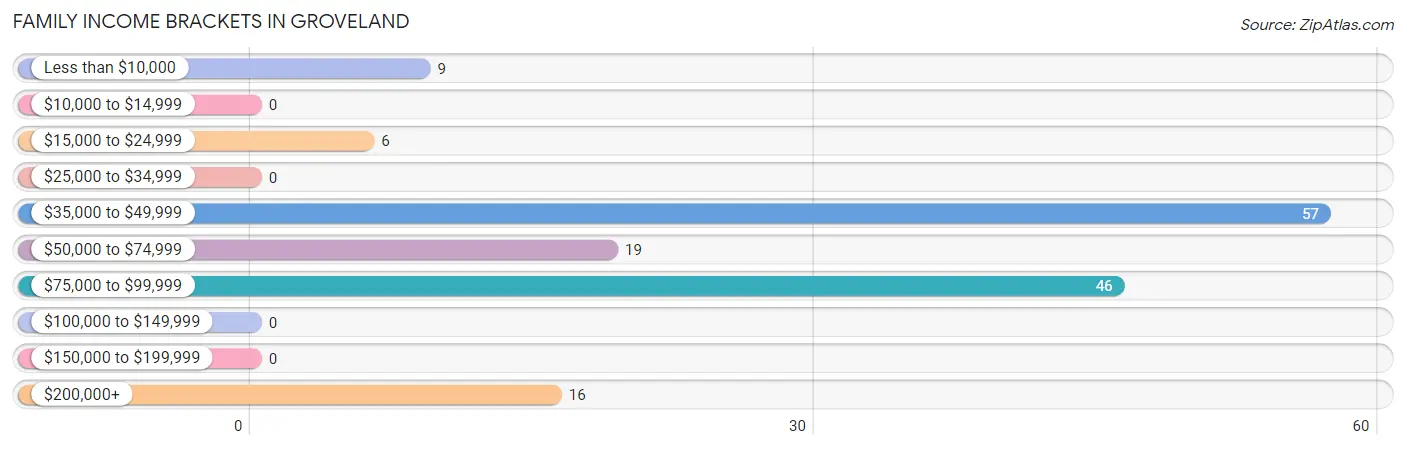
| Income Bracket | # Families | % Families |
| Less than $10,000 | 9 | 5.9% |
| $10,000 to $14,999 | 0 | 0.0% |
| $15,000 to $24,999 | 6 | 3.9% |
| $25,000 to $34,999 | 0 | 0.0% |
| $35,000 to $49,999 | 57 | 37.3% |
| $50,000 to $74,999 | 19 | 12.4% |
| $75,000 to $99,999 | 46 | 30.1% |
| $100,000 to $149,999 | 0 | 0.0% |
| $150,000 to $199,999 | 0 | 0.0% |
| $200,000+ | 16 | 10.5% |
Family Income by Famaliy Size in Groveland
| Income Bracket | # Families | Median Income |
| 2-Person Families | 103 (67.3%) | $0 |
| 3-Person Families | 44 (28.8%) | $0 |
| 4-Person Families | 6 (3.9%) | $0 |
| 5-Person Families | 0 (0.0%) | $0 |
| 6-Person Families | 0 (0.0%) | $0 |
| 7+ Person Families | 0 (0.0%) | $0 |
| Total | 153 (100.0%) | $68,304 |
Family Income by Number of Earners in Groveland
| Number of Earners | # Families | Median Income |
| No Earners | 56 (36.6%) | $0 |
| 1 Earner | 67 (43.8%) | $0 |
| 2 Earners | 30 (19.6%) | $0 |
| 3+ Earners | 0 (0.0%) | $0 |
| Total | 153 (100.0%) | $68,304 |
Household Income in Groveland
Household Income Brackets in Groveland
With 76 households falling in the category, the $15,000 to $24,999 income range is the most frequent in Groveland, accounting for 25.2% of all households.
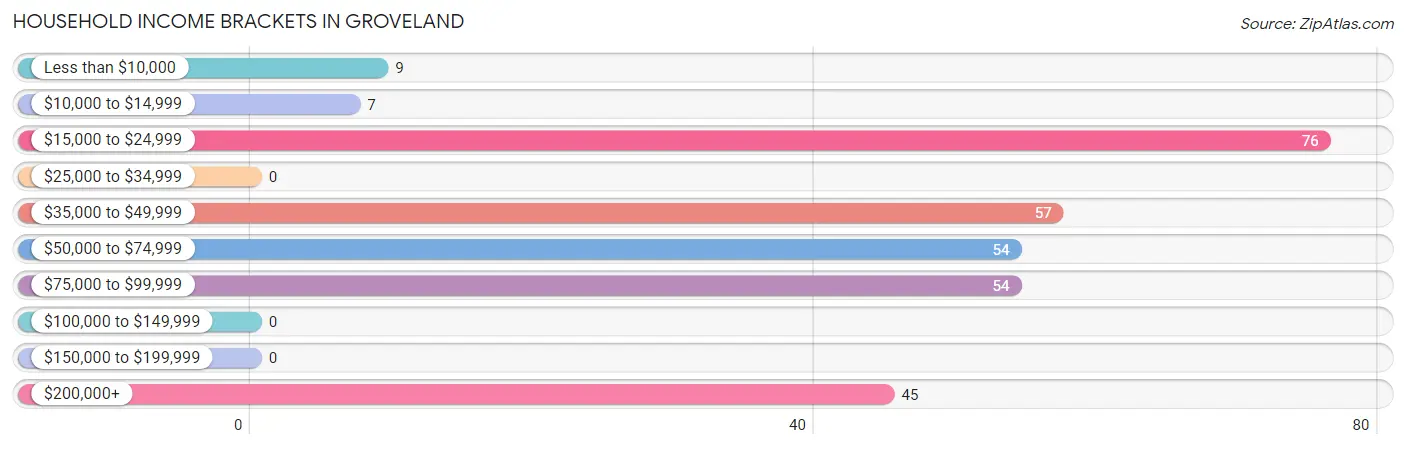
| Income Bracket | # Households | % Households |
| Less than $10,000 | 9 | 3.0% |
| $10,000 to $14,999 | 7 | 2.3% |
| $15,000 to $24,999 | 76 | 25.2% |
| $25,000 to $34,999 | 0 | 0.0% |
| $35,000 to $49,999 | 57 | 18.9% |
| $50,000 to $74,999 | 54 | 17.9% |
| $75,000 to $99,999 | 54 | 17.9% |
| $100,000 to $149,999 | 0 | 0.0% |
| $150,000 to $199,999 | 0 | 0.0% |
| $200,000+ | 45 | 14.9% |
Household Income by Householder Age in Groveland
The median household income in Groveland is $55,313, with the highest median household income of $38,973 found in the 65+ years age bracket for the primary householder. A total of 173 households (57.3%) fall into this category.
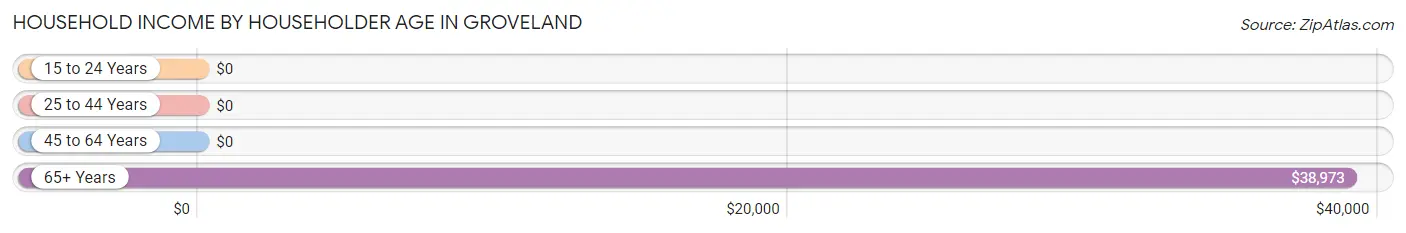
| Income Bracket | # Households | Median Income |
| 15 to 24 Years | 0 (0.0%) | $0 |
| 25 to 44 Years | 14 (4.6%) | $0 |
| 45 to 64 Years | 115 (38.1%) | $0 |
| 65+ Years | 173 (57.3%) | $38,973 |
| Total | 302 (100.0%) | $55,313 |
Poverty in Groveland
Income Below Poverty by Sex and Age in Groveland
With 3.6% poverty level for males and 26.0% for females among the residents of Groveland, 55 to 64 year old males and under 5 year old females are the most vulnerable to poverty, with 9 males (16.7%) and 7 females (100.0%) in their respective age groups living below the poverty level.
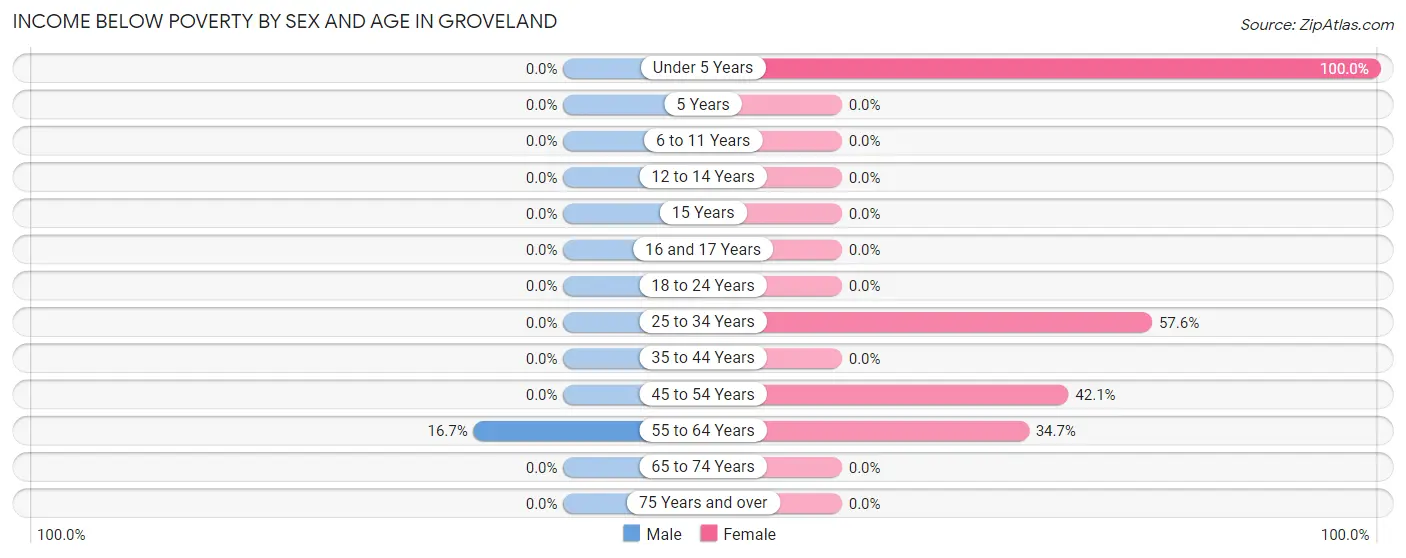
| Age Bracket | Male | Female |
| Under 5 Years | 0 (0.0%) | 7 (100.0%) |
| 5 Years | 0 (0.0%) | 0 (0.0%) |
| 6 to 11 Years | 0 (0.0%) | 0 (0.0%) |
| 12 to 14 Years | 0 (0.0%) | 0 (0.0%) |
| 15 Years | 0 (0.0%) | 0 (0.0%) |
| 16 and 17 Years | 0 (0.0%) | 0 (0.0%) |
| 18 to 24 Years | 0 (0.0%) | 0 (0.0%) |
| 25 to 34 Years | 0 (0.0%) | 19 (57.6%) |
| 35 to 44 Years | 0 (0.0%) | 0 (0.0%) |
| 45 to 54 Years | 0 (0.0%) | 45 (42.1%) |
| 55 to 64 Years | 9 (16.7%) | 17 (34.7%) |
| 65 to 74 Years | 0 (0.0%) | 0 (0.0%) |
| 75 Years and over | 0 (0.0%) | 0 (0.0%) |
| Total | 9 (3.6%) | 88 (26.0%) |
Income Above Poverty by Sex and Age in Groveland
According to the poverty statistics in Groveland, males aged 6 to 11 years and females aged 5 years are the age groups that are most secure financially, with 100.0% of males and 100.0% of females in these age groups living above the poverty line.
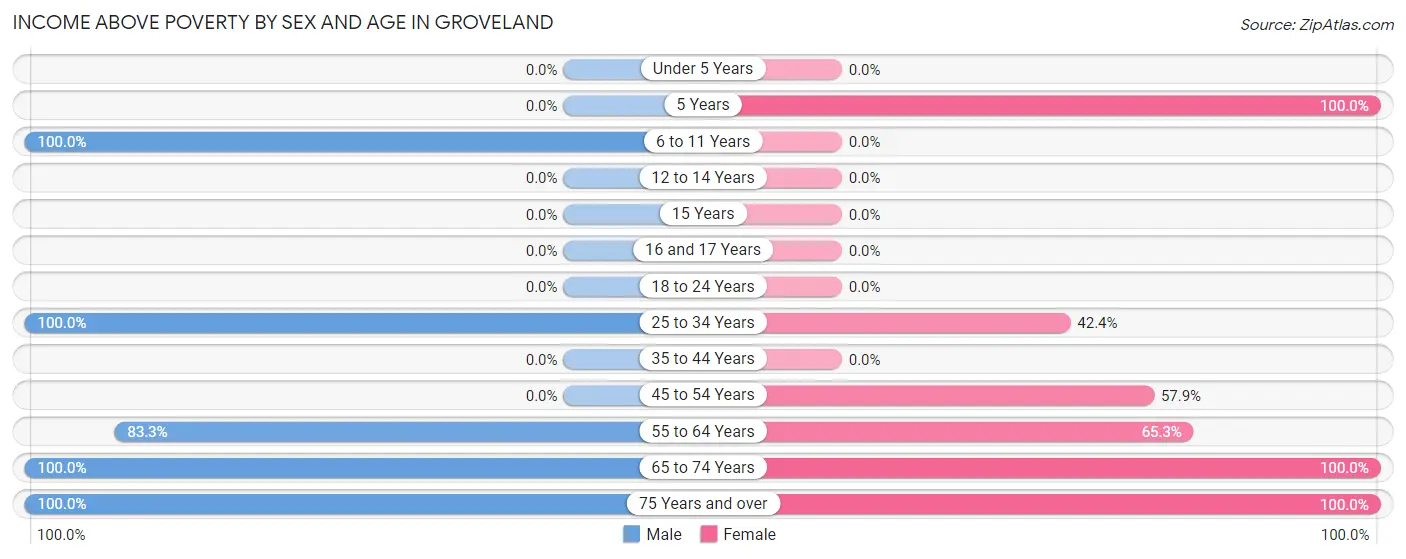
| Age Bracket | Male | Female |
| Under 5 Years | 0 (0.0%) | 0 (0.0%) |
| 5 Years | 0 (0.0%) | 18 (100.0%) |
| 6 to 11 Years | 13 (100.0%) | 0 (0.0%) |
| 12 to 14 Years | 0 (0.0%) | 0 (0.0%) |
| 15 Years | 0 (0.0%) | 0 (0.0%) |
| 16 and 17 Years | 0 (0.0%) | 0 (0.0%) |
| 18 to 24 Years | 0 (0.0%) | 0 (0.0%) |
| 25 to 34 Years | 19 (100.0%) | 14 (42.4%) |
| 35 to 44 Years | 0 (0.0%) | 0 (0.0%) |
| 45 to 54 Years | 0 (0.0%) | 62 (57.9%) |
| 55 to 64 Years | 45 (83.3%) | 32 (65.3%) |
| 65 to 74 Years | 125 (100.0%) | 95 (100.0%) |
| 75 Years and over | 42 (100.0%) | 29 (100.0%) |
| Total | 244 (96.4%) | 250 (74.0%) |
Income Below Poverty Among Married-Couple Families in Groveland
The poverty statistics for married-couple families in Groveland show that 6.1% or 9 of the total 147 families live below the poverty line. Families with no children have the highest poverty rate of 7.0%, comprising of 9 families. On the other hand, families with 1 or 2 children have the lowest poverty rate of 0.0%, which includes 0 families.
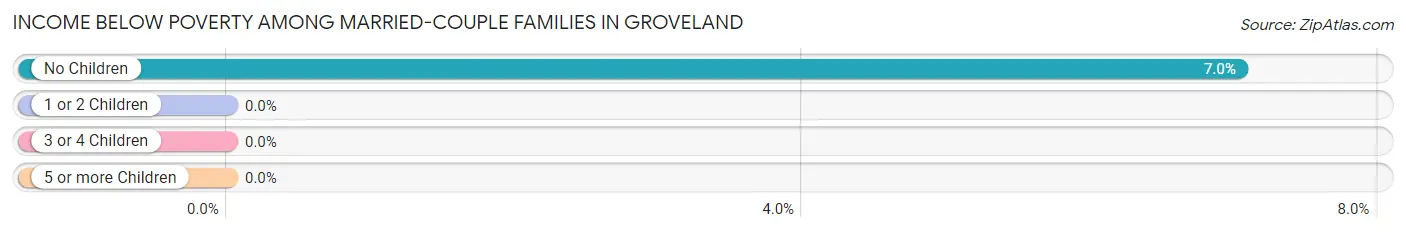
| Children | Above Poverty | Below Poverty |
| No Children | 119 (93.0%) | 9 (7.0%) |
| 1 or 2 Children | 19 (100.0%) | 0 (0.0%) |
| 3 or 4 Children | 0 (0.0%) | 0 (0.0%) |
| 5 or more Children | 0 (0.0%) | 0 (0.0%) |
| Total | 138 (93.9%) | 9 (6.1%) |
Income Below Poverty Among Single-Parent Households in Groveland
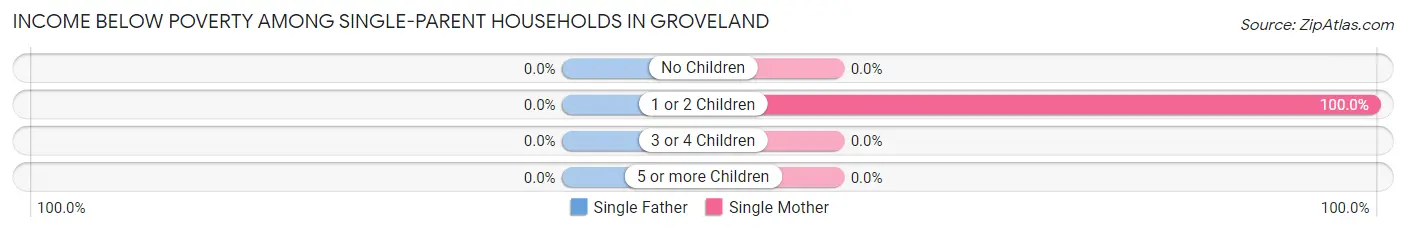
| Children | Single Father | Single Mother |
| No Children | 0 (0.0%) | 0 (0.0%) |
| 1 or 2 Children | 0 (0.0%) | 6 (100.0%) |
| 3 or 4 Children | 0 (0.0%) | 0 (0.0%) |
| 5 or more Children | 0 (0.0%) | 0 (0.0%) |
| Total | 0 (0.0%) | 6 (100.0%) |
Income Below Poverty Among Married-Couple vs Single-Parent Households in Groveland
The poverty data for Groveland shows that 9 of the married-couple family households (6.1%) and 6 of the single-parent households (100.0%) are living below the poverty level. Within the married-couple family households, those with no children have the highest poverty rate, with 9 households (7.0%) falling below the poverty line. Among the single-parent households, those with 1 or 2 children have the highest poverty rate, with 6 household (100.0%) living below poverty.
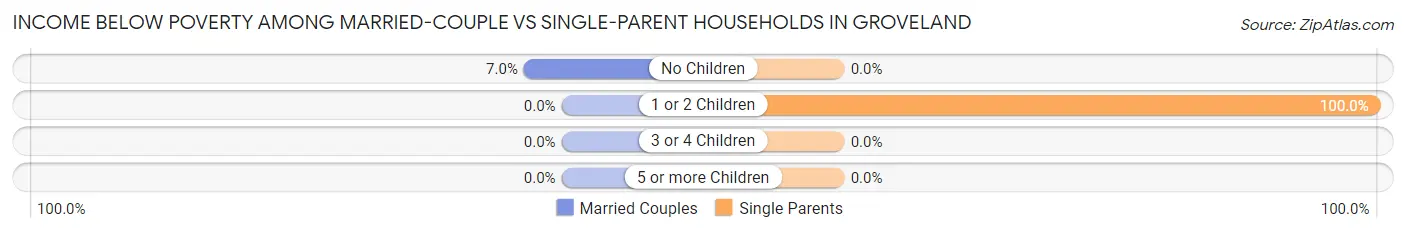
| Children | Married-Couple Families | Single-Parent Households |
| No Children | 9 (7.0%) | 0 (0.0%) |
| 1 or 2 Children | 0 (0.0%) | 6 (100.0%) |
| 3 or 4 Children | 0 (0.0%) | 0 (0.0%) |
| 5 or more Children | 0 (0.0%) | 0 (0.0%) |
| Total | 9 (6.1%) | 6 (100.0%) |
Race in Groveland
The most populous races in Groveland are White / Caucasian (495 | 83.8%), Two or more Races (61 | 10.3%), and Hispanic or Latino (17 | 2.9%).
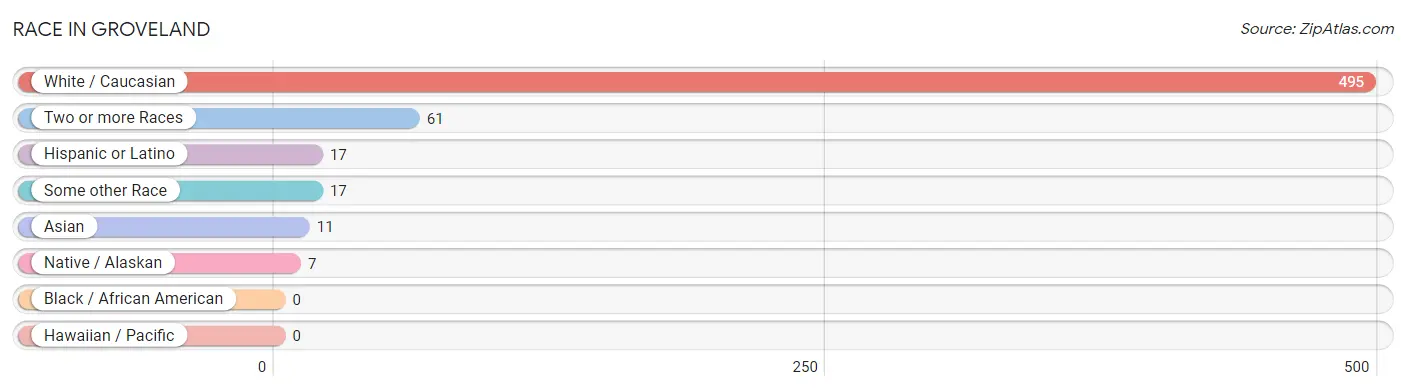
| Race | # Population | % Population |
| Asian | 11 | 1.9% |
| Black / African American | 0 | 0.0% |
| Hawaiian / Pacific | 0 | 0.0% |
| Hispanic or Latino | 17 | 2.9% |
| Native / Alaskan | 7 | 1.2% |
| White / Caucasian | 495 | 83.8% |
| Two or more Races | 61 | 10.3% |
| Some other Race | 17 | 2.9% |
| Total | 591 | 100.0% |
Ancestry in Groveland
The most populous ancestries reported in Groveland are English (209 | 35.4%), German (169 | 28.6%), French (68 | 11.5%), Irish (66 | 11.2%), and Cherokee (61 | 10.3%), together accounting for 97.0% of all Groveland residents.
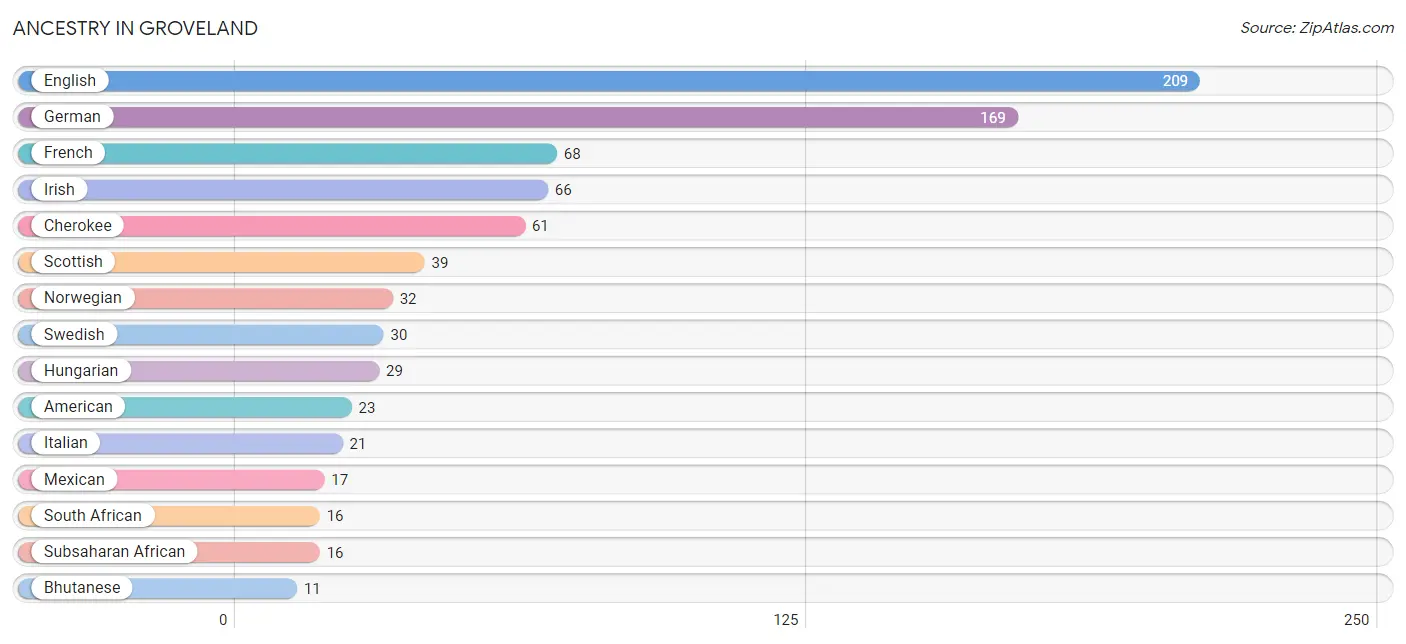
| Ancestry | # Population | % Population |
| American | 23 | 3.9% |
| Bhutanese | 11 | 1.9% |
| Cherokee | 61 | 10.3% |
| Danish | 11 | 1.9% |
| English | 209 | 35.4% |
| French | 68 | 11.5% |
| German | 169 | 28.6% |
| Hungarian | 29 | 4.9% |
| Irish | 66 | 11.2% |
| Italian | 21 | 3.5% |
| Mexican | 17 | 2.9% |
| Norwegian | 32 | 5.4% |
| Polish | 11 | 1.9% |
| Scottish | 39 | 6.6% |
| South African | 16 | 2.7% |
| Subsaharan African | 16 | 2.7% |
| Swedish | 30 | 5.1% |
| Welsh | 8 | 1.3% | View All 18 Rows |
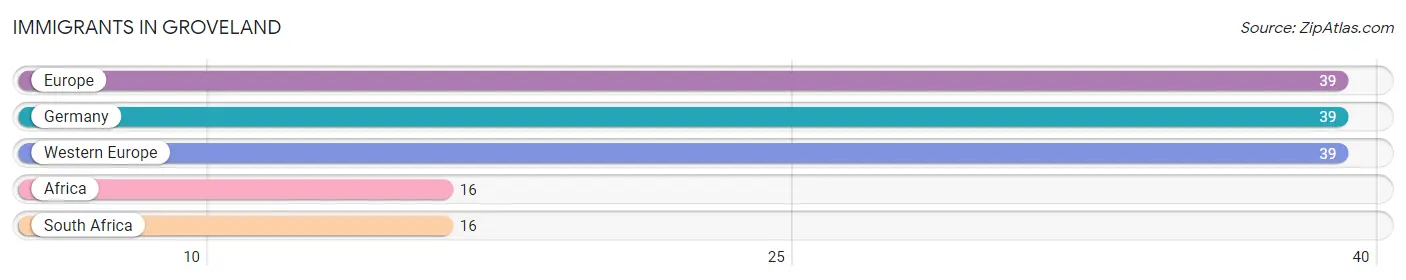
Immigrants in Groveland
The most numerous immigrant groups reported in Groveland came from Europe (39 | 6.6%), Germany (39 | 6.6%), Western Europe (39 | 6.6%), Africa (16 | 2.7%), and South Africa (16 | 2.7%), together accounting for 25.2% of all Groveland residents.
| Immigration Origin | # Population | % Population |
| Africa | 16 | 2.7% |
| Europe | 39 | 6.6% |
| Germany | 39 | 6.6% |
| South Africa | 16 | 2.7% |
| Western Europe | 39 | 6.6% | View All 5 Rows |
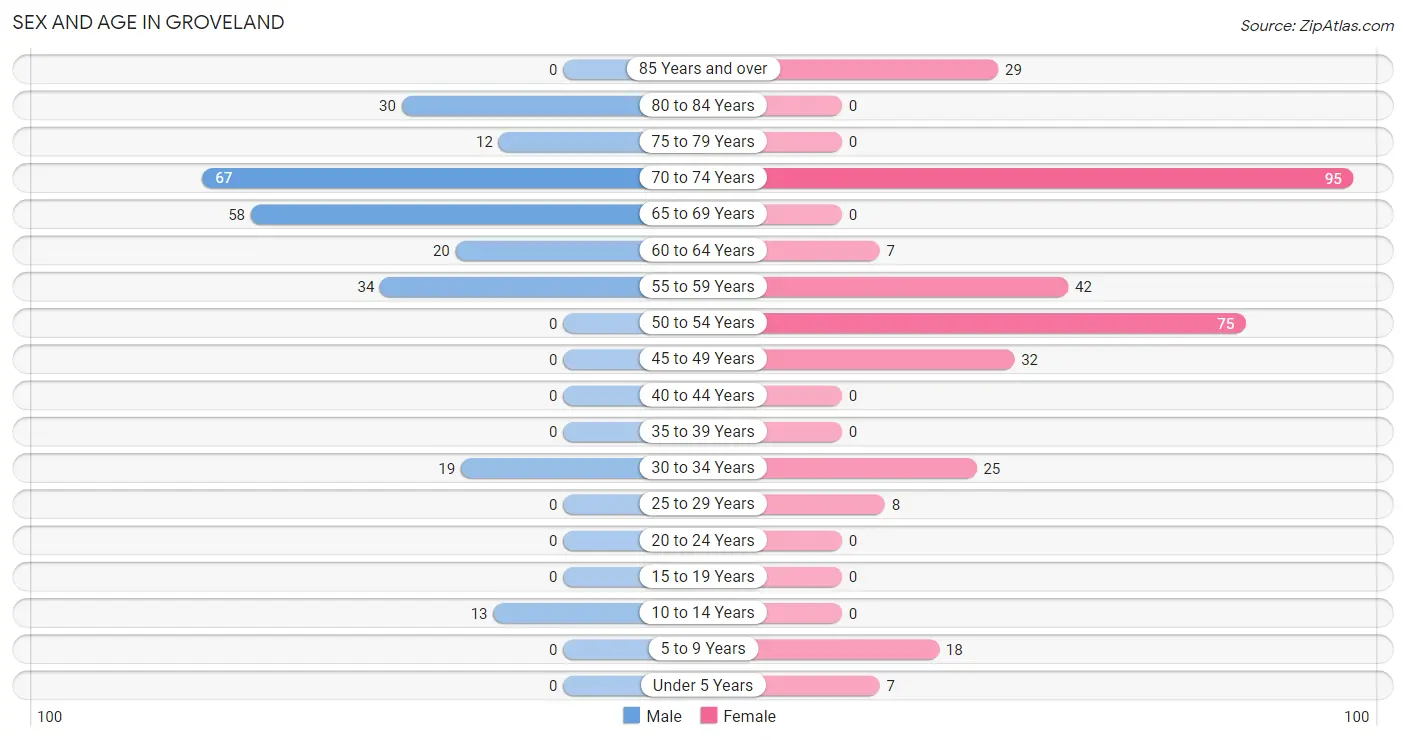
Sex and Age in Groveland
Sex and Age in Groveland
The most populous age groups in Groveland are 70 to 74 Years (67 | 26.5%) for men and 70 to 74 Years (95 | 28.1%) for women.
| Age Bracket | Male | Female |
| Under 5 Years | 0 (0.0%) | 7 (2.1%) |
| 5 to 9 Years | 0 (0.0%) | 18 (5.3%) |
| 10 to 14 Years | 13 (5.1%) | 0 (0.0%) |
| 15 to 19 Years | 0 (0.0%) | 0 (0.0%) |
| 20 to 24 Years | 0 (0.0%) | 0 (0.0%) |
| 25 to 29 Years | 0 (0.0%) | 8 (2.4%) |
| 30 to 34 Years | 19 (7.5%) | 25 (7.4%) |
| 35 to 39 Years | 0 (0.0%) | 0 (0.0%) |
| 40 to 44 Years | 0 (0.0%) | 0 (0.0%) |
| 45 to 49 Years | 0 (0.0%) | 32 (9.5%) |
| 50 to 54 Years | 0 (0.0%) | 75 (22.2%) |
| 55 to 59 Years | 34 (13.4%) | 42 (12.4%) |
| 60 to 64 Years | 20 (7.9%) | 7 (2.1%) |
| 65 to 69 Years | 58 (22.9%) | 0 (0.0%) |
| 70 to 74 Years | 67 (26.5%) | 95 (28.1%) |
| 75 to 79 Years | 12 (4.7%) | 0 (0.0%) |
| 80 to 84 Years | 30 (11.9%) | 0 (0.0%) |
| 85 Years and over | 0 (0.0%) | 29 (8.6%) |
| Total | 253 (100.0%) | 338 (100.0%) |
Families and Households in Groveland
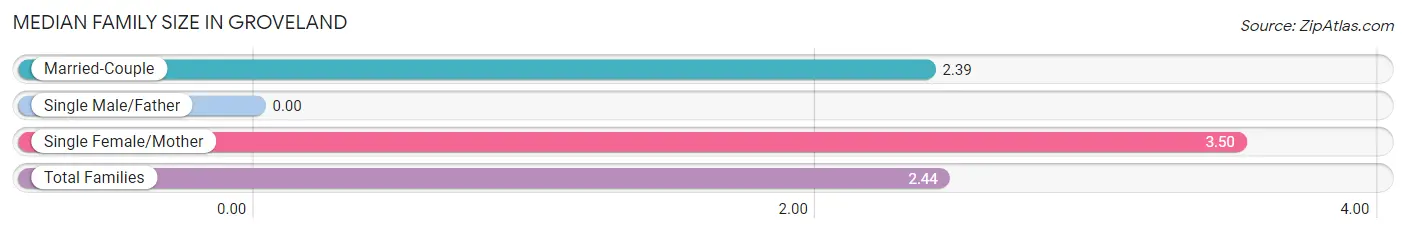
Median Family Size in Groveland
| Family Type | # Families | Family Size |
| Married-Couple | 147 (96.1%) | 2.39 |
| Single Male/Father | 0 (0.0%) | - |
| Single Female/Mother | 6 (3.9%) | 3.50 |
| Total Families | 153 (100.0%) | 2.44 |
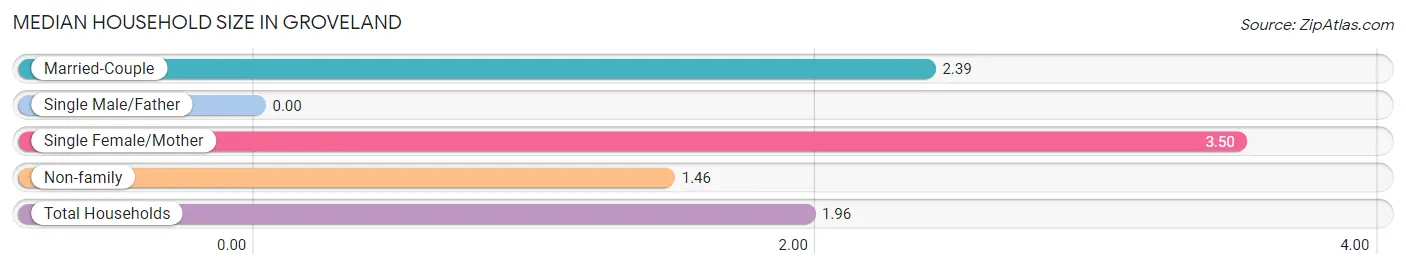
Median Household Size in Groveland
| Household Type | # Households | Household Size |
| Married-Couple | 147 (48.7%) | 2.39 |
| Single Male/Father | 0 (0.0%) | - |
| Single Female/Mother | 6 (2.0%) | 3.50 |
| Non-family | 149 (49.3%) | 1.46 |
| Total Households | 302 (100.0%) | 1.96 |
Household Size by Marriage Status in Groveland
Out of a total of 302 households in Groveland, 153 (50.7%) are family households, while 149 (49.3%) are nonfamily households. The most numerous type of family households are 2-person households, comprising 103, and the most common type of nonfamily households are 1-person households, comprising 90.
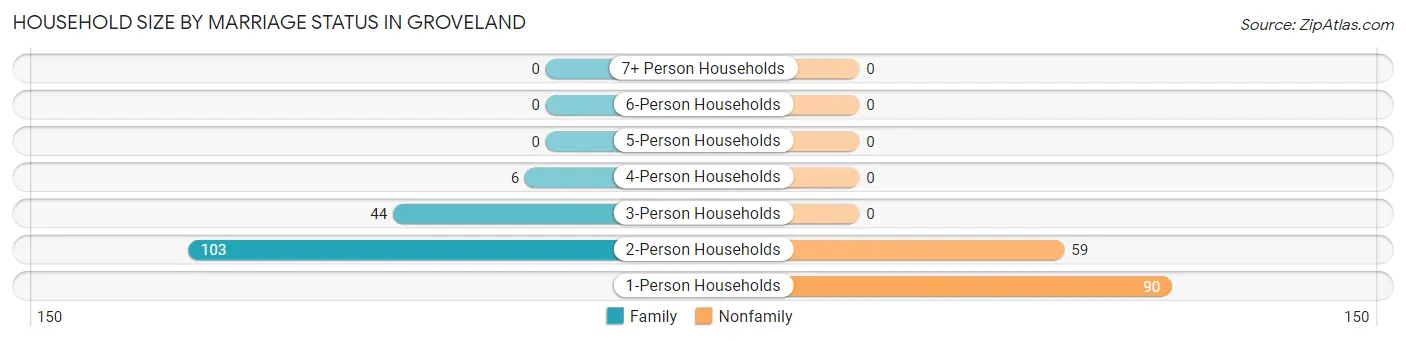
| Household Size | Family Households | Nonfamily Households |
| 1-Person Households | - | 90 (29.8%) |
| 2-Person Households | 103 (34.1%) | 59 (19.5%) |
| 3-Person Households | 44 (14.6%) | 0 (0.0%) |
| 4-Person Households | 6 (2.0%) | 0 (0.0%) |
| 5-Person Households | 0 (0.0%) | 0 (0.0%) |
| 6-Person Households | 0 (0.0%) | 0 (0.0%) |
| 7+ Person Households | 0 (0.0%) | 0 (0.0%) |
| Total | 153 (50.7%) | 149 (49.3%) |
Female Fertility in Groveland
Fertility by Age in Groveland
Average fertility rate in Groveland is 113.0 births per 1,000 women. Women in the age bracket of 20 to 34 years have the highest fertility rate with 242.0 births per 1,000 women. Women in the age bracket of 20 to 34 years acount for 100.0% of all women with births.
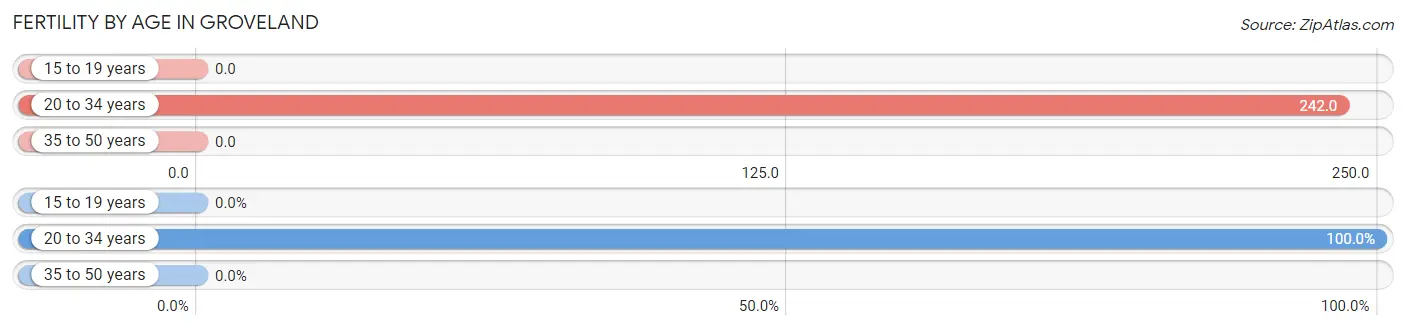
| Age Bracket | Women with Births | Births / 1,000 Women |
| 15 to 19 years | 0 (0.0%) | 0.0 |
| 20 to 34 years | 8 (100.0%) | 242.0 |
| 35 to 50 years | 0 (0.0%) | 0.0 |
| Total | 8 (100.0%) | 113.0 |
Fertility by Age by Marriage Status in Groveland
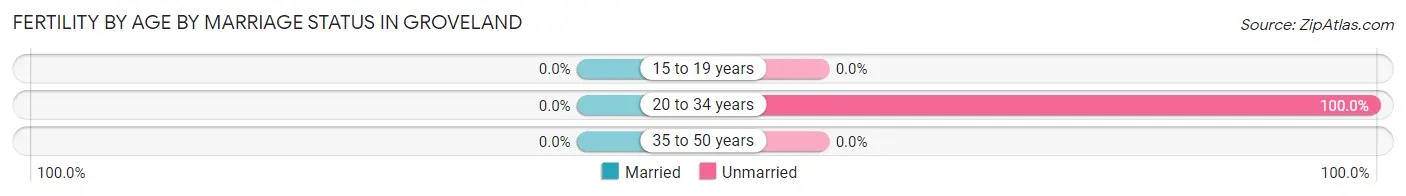
| Age Bracket | Married | Unmarried |
| 15 to 19 years | 0 (0.0%) | 0 (0.0%) |
| 20 to 34 years | 0 (0.0%) | 8 (100.0%) |
| 35 to 50 years | 0 (0.0%) | 0 (0.0%) |
| Total | 0 (0.0%) | 8 (100.0%) |
Fertility by Education in Groveland
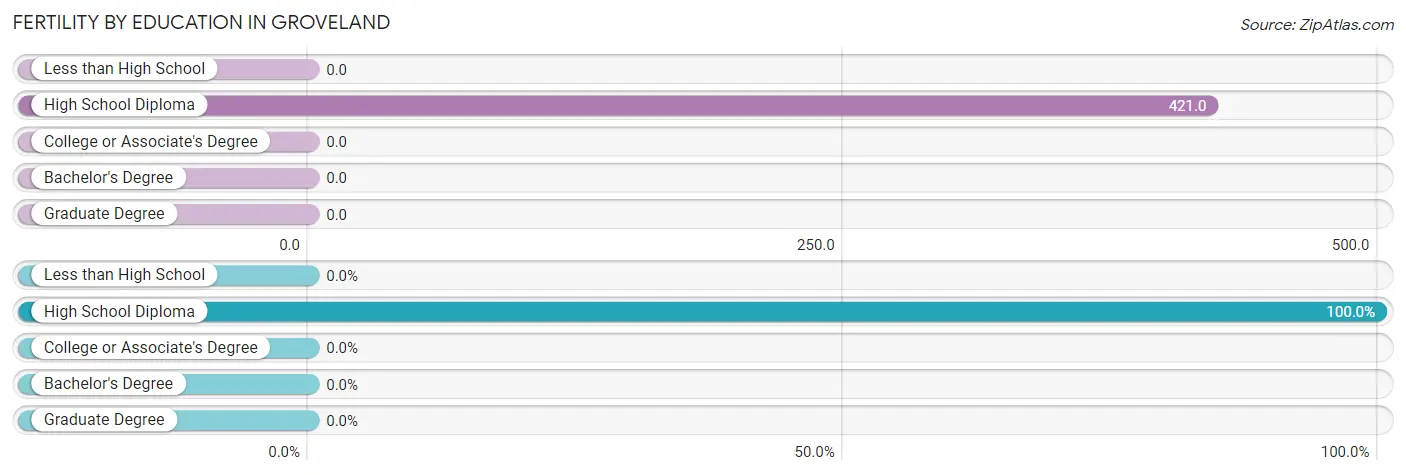
| Educational Attainment | Women with Births | Births / 1,000 Women |
| Less than High School | 0 (0.0%) | 0.0 |
| High School Diploma | 8 (100.0%) | 421.0 |
| College or Associate's Degree | 0 (0.0%) | 0.0 |
| Bachelor's Degree | 0 (0.0%) | 0.0 |
| Graduate Degree | 0 (0.0%) | 0.0 |
| Total | 8 (100.0%) | 113.0 |
Fertility by Education by Marriage Status in Groveland
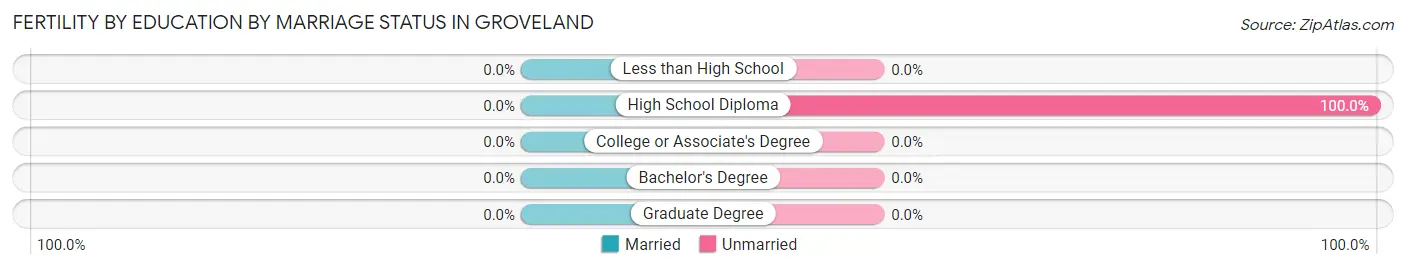
| Educational Attainment | Married | Unmarried |
| Less than High School | 0 (0.0%) | 0 (0.0%) |
| High School Diploma | 0 (0.0%) | 8 (100.0%) |
| College or Associate's Degree | 0 (0.0%) | 0 (0.0%) |
| Bachelor's Degree | 0 (0.0%) | 0 (0.0%) |
| Graduate Degree | 0 (0.0%) | 0 (0.0%) |
| Total | 0 (0.0%) | 8 (100.0%) |
Employment Characteristics in Groveland
Employment by Class of Employer in Groveland
Among the 156 employed individuals in Groveland, private company employees (102 | 65.4%), unpaid family workers (30 | 19.2%), and local government employees (14 | 9.0%) make up the most common classes of employment.
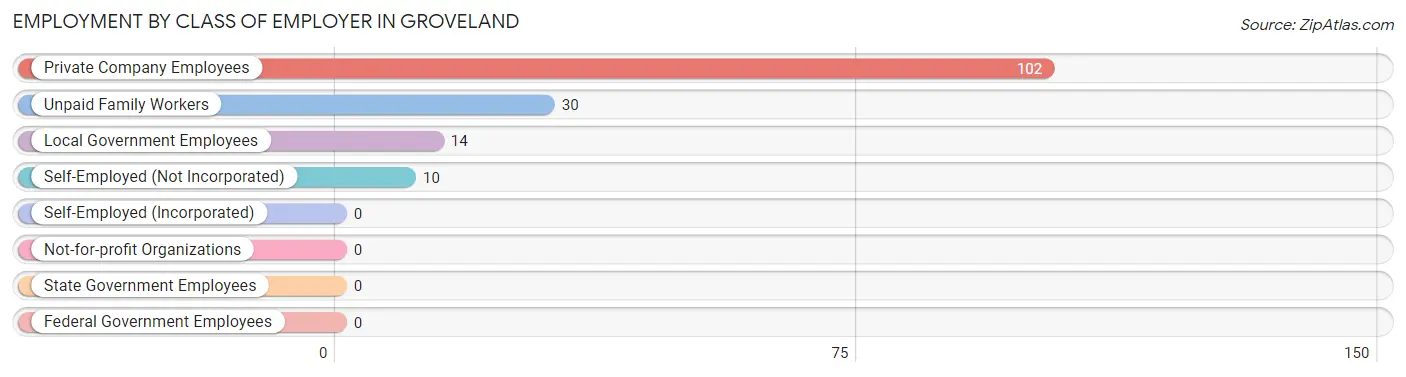
| Employer Class | # Employees | % Employees |
| Private Company Employees | 102 | 65.4% |
| Self-Employed (Incorporated) | 0 | 0.0% |
| Self-Employed (Not Incorporated) | 10 | 6.4% |
| Not-for-profit Organizations | 0 | 0.0% |
| Local Government Employees | 14 | 9.0% |
| State Government Employees | 0 | 0.0% |
| Federal Government Employees | 0 | 0.0% |
| Unpaid Family Workers | 30 | 19.2% |
| Total | 156 | 100.0% |
Employment Status by Age in Groveland
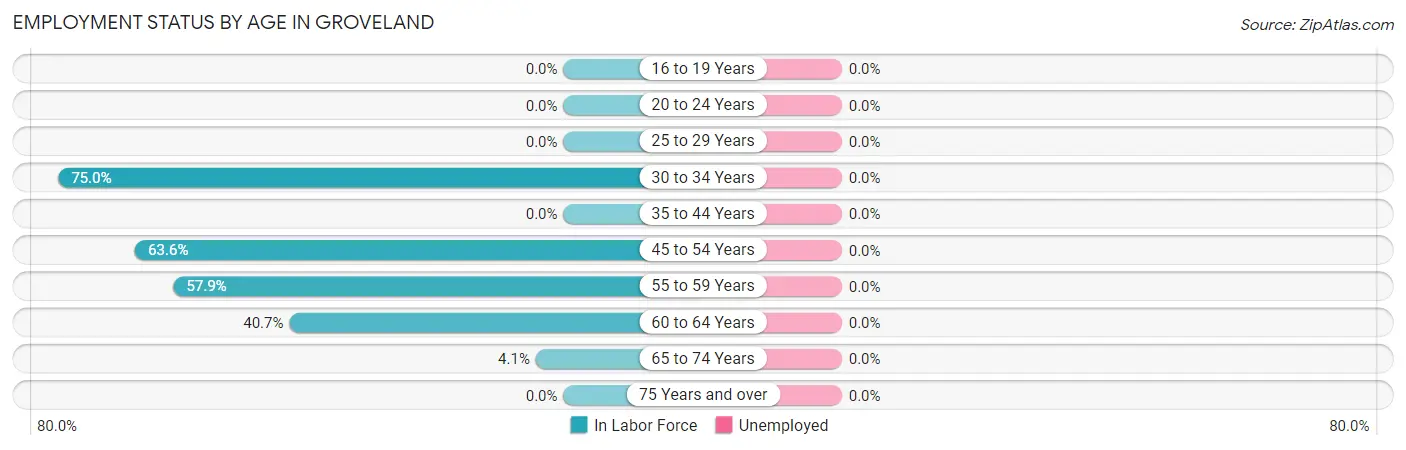
| Age Bracket | In Labor Force | Unemployed |
| 16 to 19 Years | 0 (0.0%) | 0 (0.0%) |
| 20 to 24 Years | 0 (0.0%) | 0 (0.0%) |
| 25 to 29 Years | 0 (0.0%) | 0 (0.0%) |
| 30 to 34 Years | 33 (75.0%) | 0 (0.0%) |
| 35 to 44 Years | 0 (0.0%) | 0 (0.0%) |
| 45 to 54 Years | 68 (63.6%) | 0 (0.0%) |
| 55 to 59 Years | 44 (57.9%) | 0 (0.0%) |
| 60 to 64 Years | 11 (40.7%) | 0 (0.0%) |
| 65 to 74 Years | 9 (4.1%) | 0 (0.0%) |
| 75 Years and over | 0 (0.0%) | 0 (0.0%) |
| Total | 165 (29.8%) | 0 (0.0%) |
Employment Status by Educational Attainment in Groveland
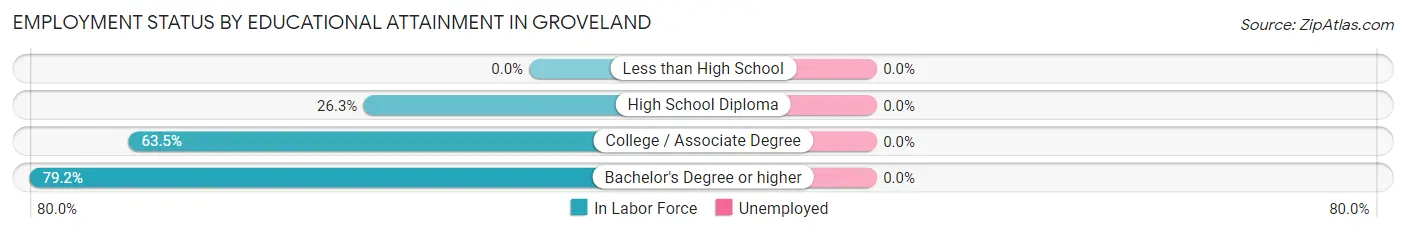
| Educational Attainment | In Labor Force | Unemployed |
| Less than High School | 0 (0.0%) | 0 (0.0%) |
| High School Diploma | 10 (26.3%) | 0 (0.0%) |
| College / Associate Degree | 127 (63.5%) | 0 (0.0%) |
| Bachelor's Degree or higher | 19 (79.2%) | 0 (0.0%) |
| Total | 156 (59.5%) | 0 (0.0%) |
Employment Occupations by Sex in Groveland
Management, Business, Science and Arts Occupations
The most common Management, Business, Science and Arts occupations in Groveland are Management (62 | 37.6%), Computers, Engineering & Science (9 | 5.4%), and Architecture & Engineering (9 | 5.4%).
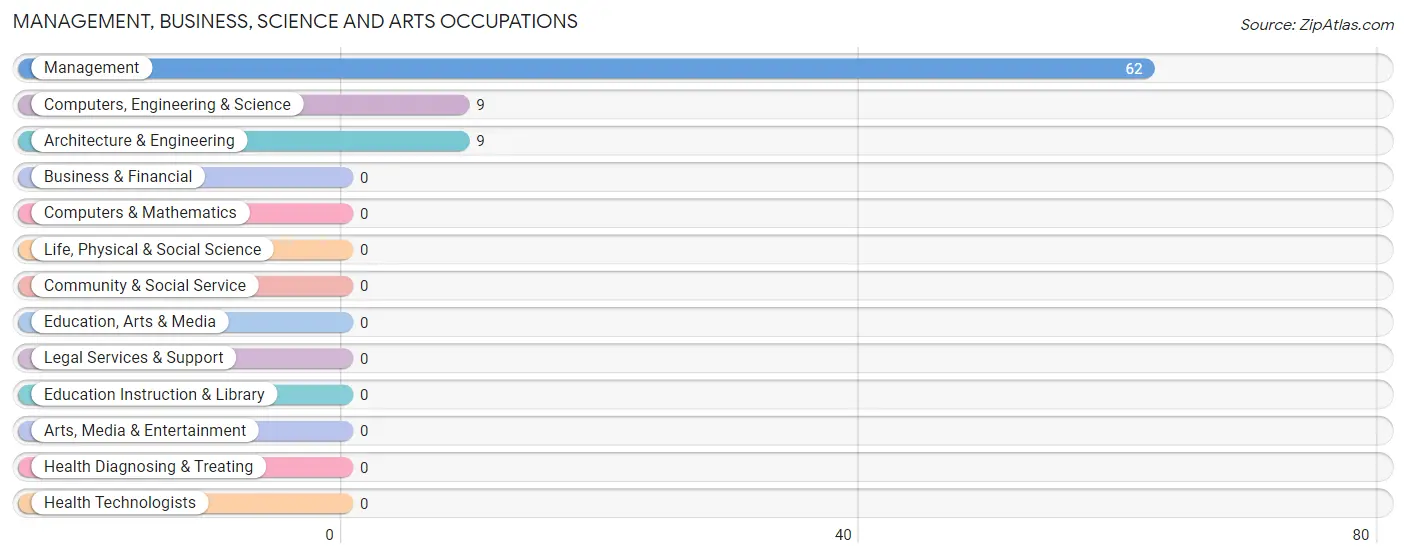
Management, Business, Science and Arts Occupations by Sex
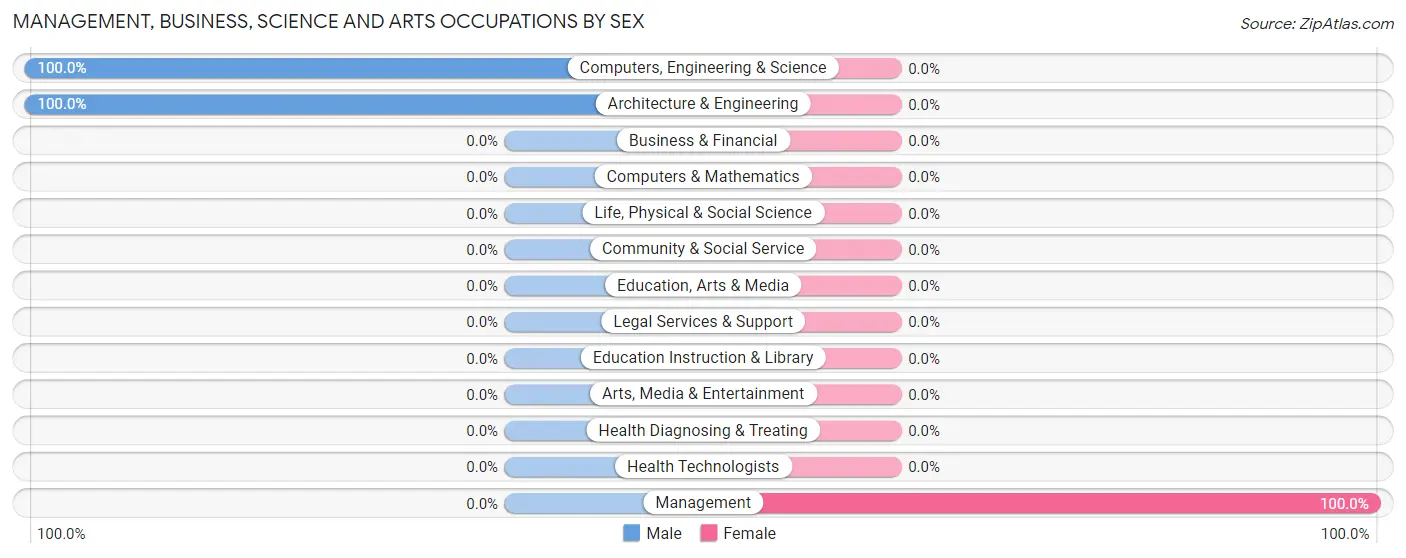
| Occupation | Male | Female |
| Management | 0 (0.0%) | 62 (100.0%) |
| Business & Financial | 0 (0.0%) | 0 (0.0%) |
| Computers, Engineering & Science | 9 (100.0%) | 0 (0.0%) |
| Computers & Mathematics | 0 (0.0%) | 0 (0.0%) |
| Architecture & Engineering | 9 (100.0%) | 0 (0.0%) |
| Life, Physical & Social Science | 0 (0.0%) | 0 (0.0%) |
| Community & Social Service | 0 (0.0%) | 0 (0.0%) |
| Education, Arts & Media | 0 (0.0%) | 0 (0.0%) |
| Legal Services & Support | 0 (0.0%) | 0 (0.0%) |
| Education Instruction & Library | 0 (0.0%) | 0 (0.0%) |
| Arts, Media & Entertainment | 0 (0.0%) | 0 (0.0%) |
| Health Diagnosing & Treating | 0 (0.0%) | 0 (0.0%) |
| Health Technologists | 0 (0.0%) | 0 (0.0%) |
| Total (Category) | 9 (12.7%) | 62 (87.3%) |
| Total (Overall) | 73 (44.2%) | 92 (55.8%) |
Services Occupations
The most common Services occupations in Groveland are Food Preparation & Serving (25 | 15.1%), and Cleaning & Maintenance (10 | 6.1%).
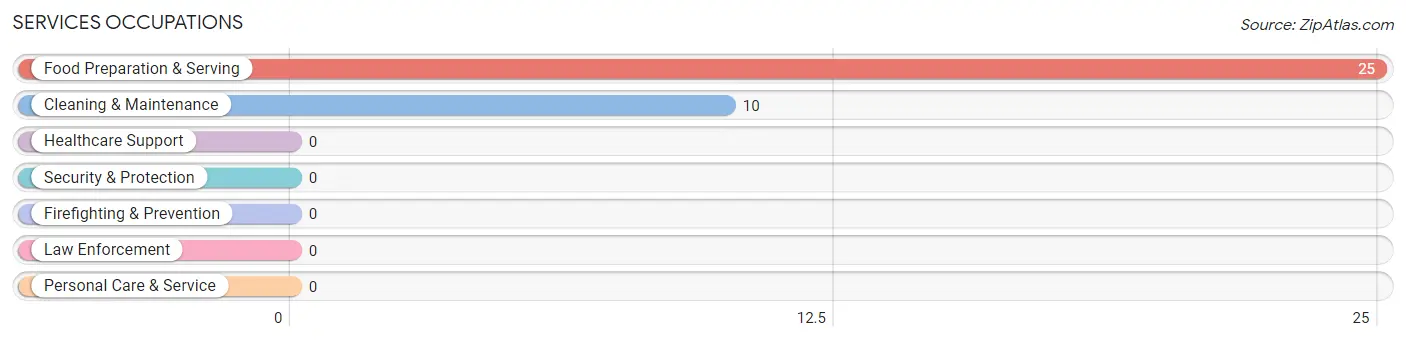
Services Occupations by Sex
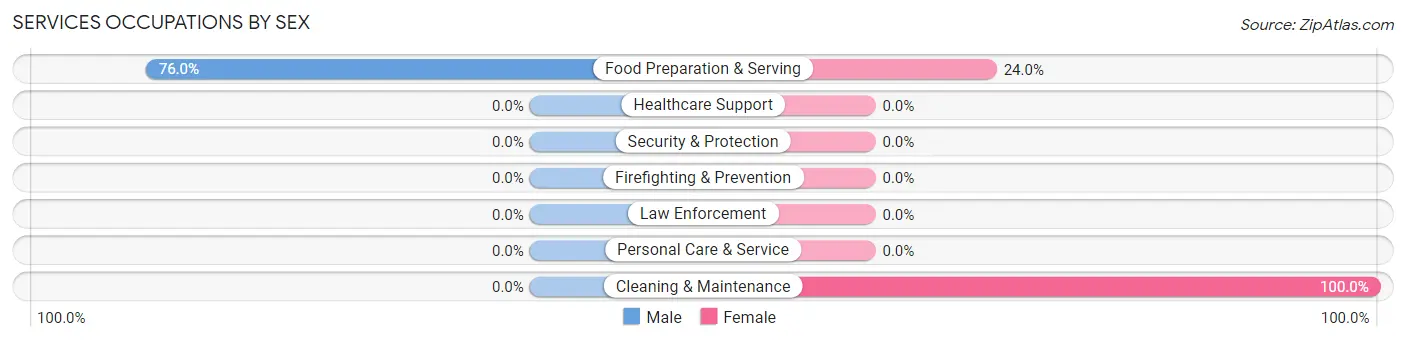
| Occupation | Male | Female |
| Healthcare Support | 0 (0.0%) | 0 (0.0%) |
| Security & Protection | 0 (0.0%) | 0 (0.0%) |
| Firefighting & Prevention | 0 (0.0%) | 0 (0.0%) |
| Law Enforcement | 0 (0.0%) | 0 (0.0%) |
| Food Preparation & Serving | 19 (76.0%) | 6 (24.0%) |
| Cleaning & Maintenance | 0 (0.0%) | 10 (100.0%) |
| Personal Care & Service | 0 (0.0%) | 0 (0.0%) |
| Total (Category) | 19 (54.3%) | 16 (45.7%) |
| Total (Overall) | 73 (44.2%) | 92 (55.8%) |
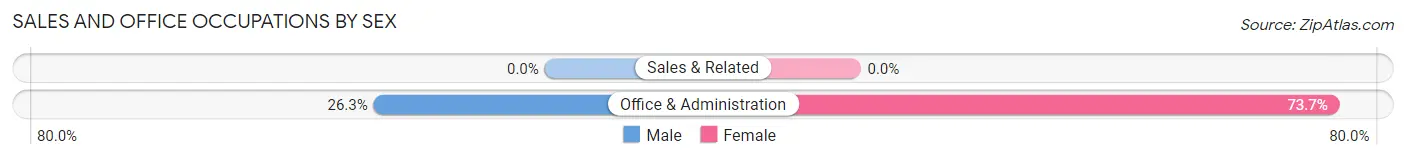
Sales and Office Occupations
The most common Sales and Office occupations in Groveland are , and Office & Administration (19 | 11.5%).
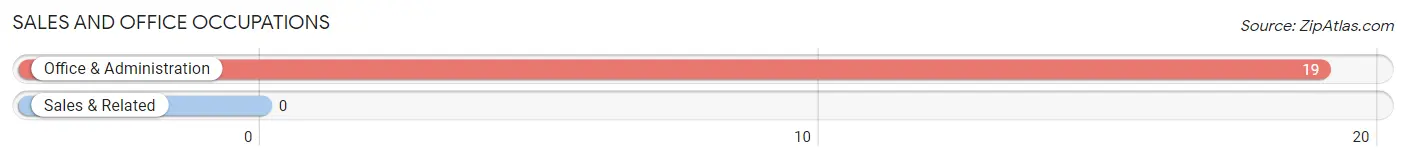
Sales and Office Occupations by Sex
| Occupation | Male | Female |
| Sales & Related | 0 (0.0%) | 0 (0.0%) |
| Office & Administration | 5 (26.3%) | 14 (73.7%) |
| Total (Category) | 5 (26.3%) | 14 (73.7%) |
| Total (Overall) | 73 (44.2%) | 92 (55.8%) |
Natural Resources, Construction and Maintenance Occupations
The most common Natural Resources, Construction and Maintenance occupations in Groveland are Construction & Extraction (29 | 17.6%), and Installation, Maintenance & Repair (11 | 6.7%).
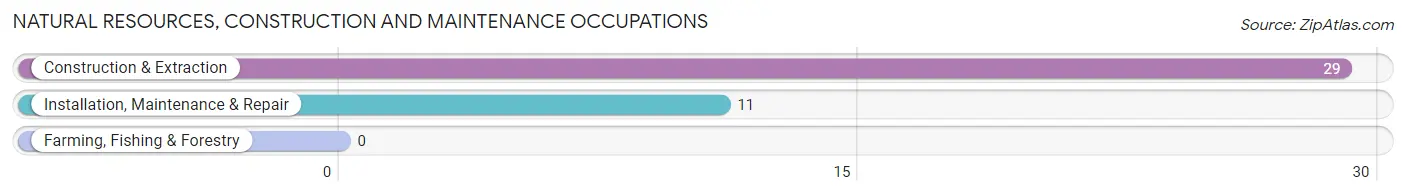
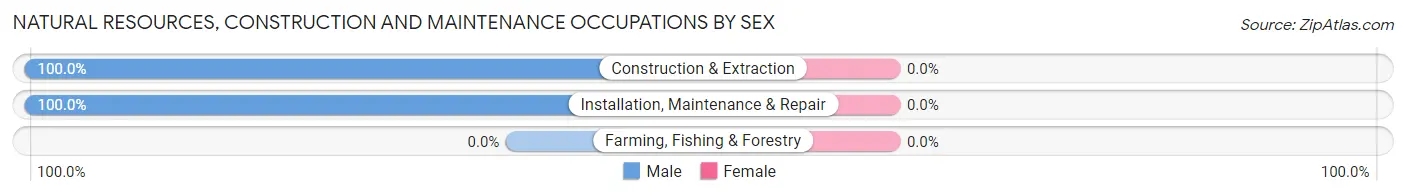
Natural Resources, Construction and Maintenance Occupations by Sex
| Occupation | Male | Female |
| Farming, Fishing & Forestry | 0 (0.0%) | 0 (0.0%) |
| Construction & Extraction | 29 (100.0%) | 0 (0.0%) |
| Installation, Maintenance & Repair | 11 (100.0%) | 0 (0.0%) |
| Total (Category) | 40 (100.0%) | 0 (0.0%) |
| Total (Overall) | 73 (44.2%) | 92 (55.8%) |
Production, Transportation and Moving Occupations
Production, Transportation and Moving Occupations by Sex
| Occupation | Male | Female |
| Production | 0 (0.0%) | 0 (0.0%) |
| Transportation | 0 (0.0%) | 0 (0.0%) |
| Material Moving | 0 (0.0%) | 0 (0.0%) |
| Total (Category) | 0 (0.0%) | 0 (0.0%) |
| Total (Overall) | 73 (44.2%) | 92 (55.8%) |
Employment Industries by Sex in Groveland
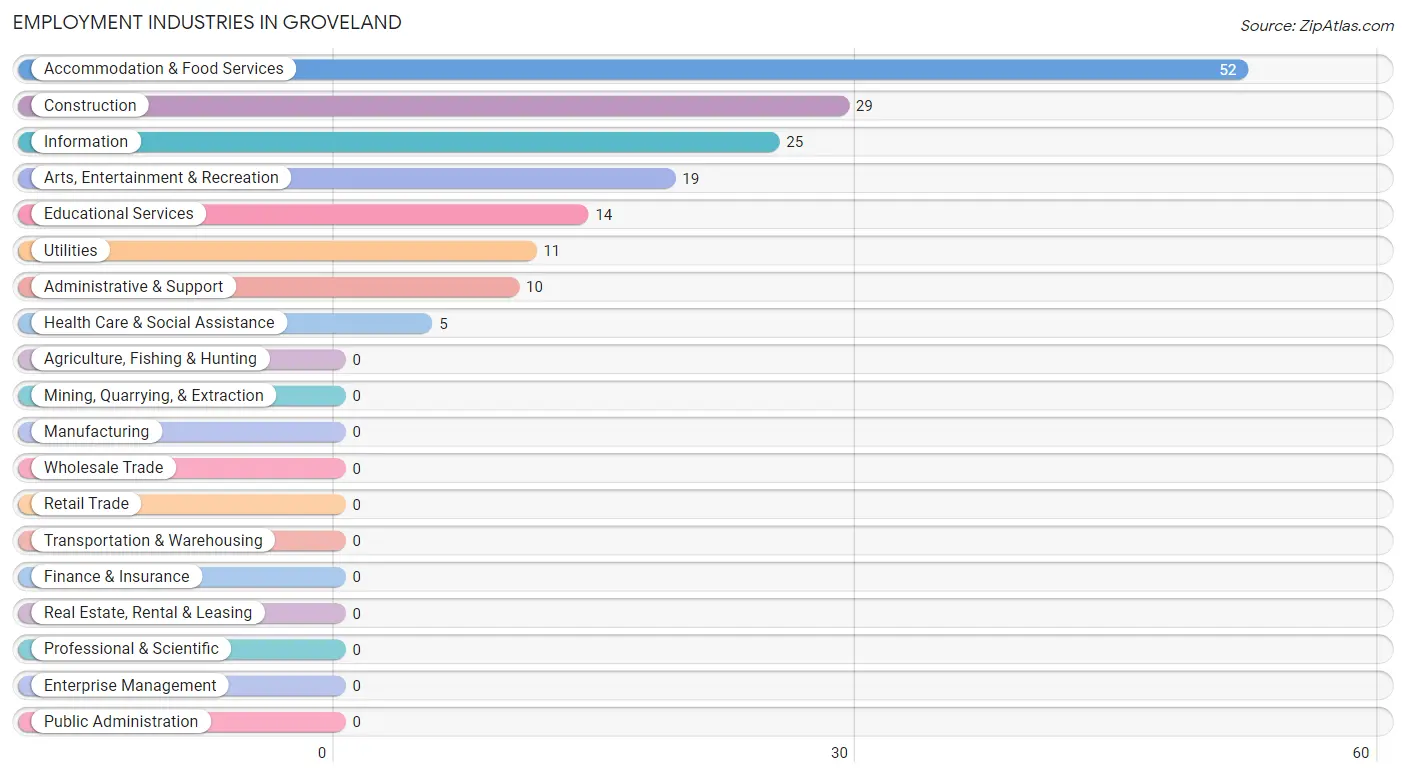
Employment Industries in Groveland
The major employment industries in Groveland include Accommodation & Food Services (52 | 31.5%), Construction (29 | 17.6%), Information (25 | 15.1%), Arts, Entertainment & Recreation (19 | 11.5%), and Educational Services (14 | 8.5%).
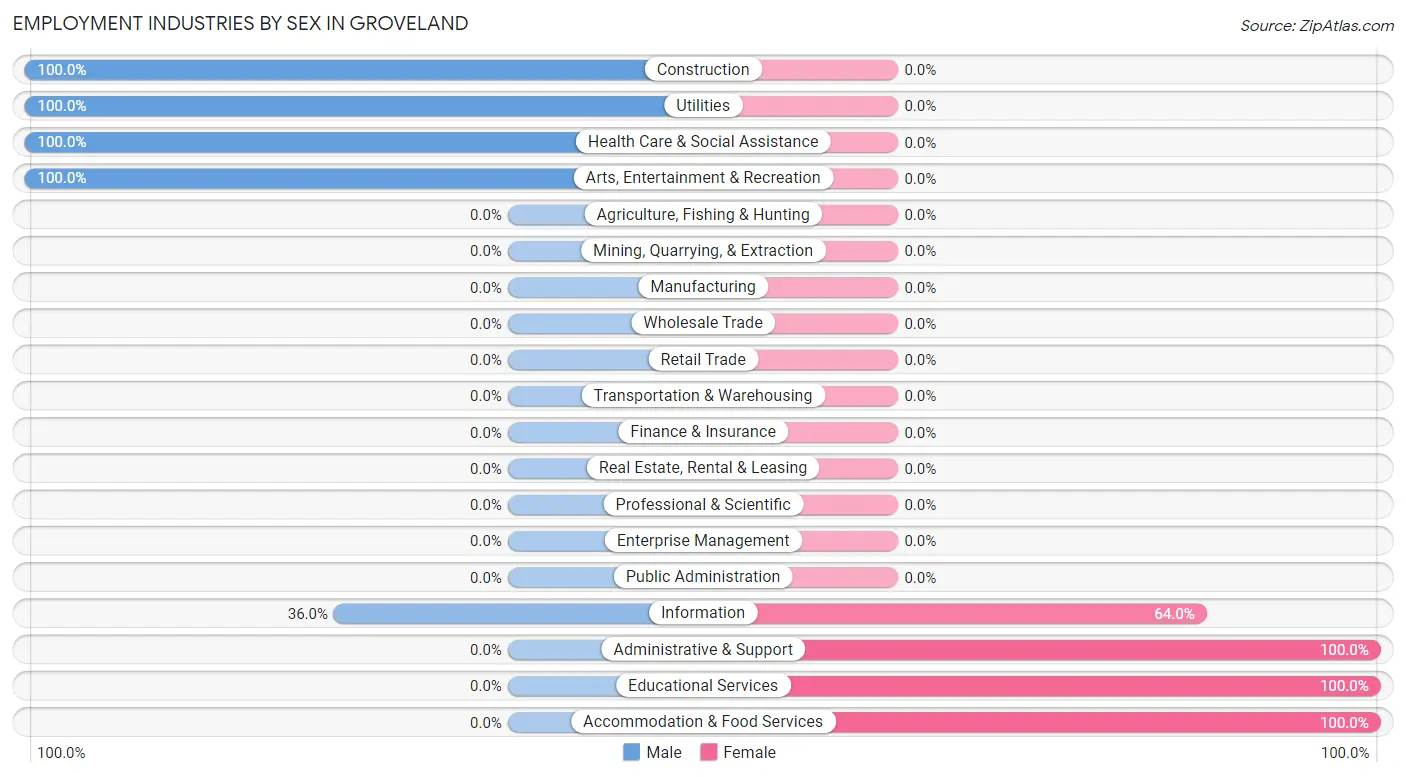
Employment Industries by Sex in Groveland
The Groveland industries that see more men than women are Construction (100.0%), Utilities (100.0%), and Health Care & Social Assistance (100.0%), whereas the industries that tend to have a higher number of women are Administrative & Support (100.0%), Educational Services (100.0%), and Accommodation & Food Services (100.0%).
| Industry | Male | Female |
| Agriculture, Fishing & Hunting | 0 (0.0%) | 0 (0.0%) |
| Mining, Quarrying, & Extraction | 0 (0.0%) | 0 (0.0%) |
| Construction | 29 (100.0%) | 0 (0.0%) |
| Manufacturing | 0 (0.0%) | 0 (0.0%) |
| Wholesale Trade | 0 (0.0%) | 0 (0.0%) |
| Retail Trade | 0 (0.0%) | 0 (0.0%) |
| Transportation & Warehousing | 0 (0.0%) | 0 (0.0%) |
| Utilities | 11 (100.0%) | 0 (0.0%) |
| Information | 9 (36.0%) | 16 (64.0%) |
| Finance & Insurance | 0 (0.0%) | 0 (0.0%) |
| Real Estate, Rental & Leasing | 0 (0.0%) | 0 (0.0%) |
| Professional & Scientific | 0 (0.0%) | 0 (0.0%) |
| Enterprise Management | 0 (0.0%) | 0 (0.0%) |
| Administrative & Support | 0 (0.0%) | 10 (100.0%) |
| Educational Services | 0 (0.0%) | 14 (100.0%) |
| Health Care & Social Assistance | 5 (100.0%) | 0 (0.0%) |
| Arts, Entertainment & Recreation | 19 (100.0%) | 0 (0.0%) |
| Accommodation & Food Services | 0 (0.0%) | 52 (100.0%) |
| Public Administration | 0 (0.0%) | 0 (0.0%) |
| Total | 73 (44.2%) | 92 (55.8%) |
Education in Groveland
School Enrollment in Groveland
The most common levels of schooling among the 31 students in Groveland are kindergarten (18 | 58.1%), and elementary school (13 | 41.9%).
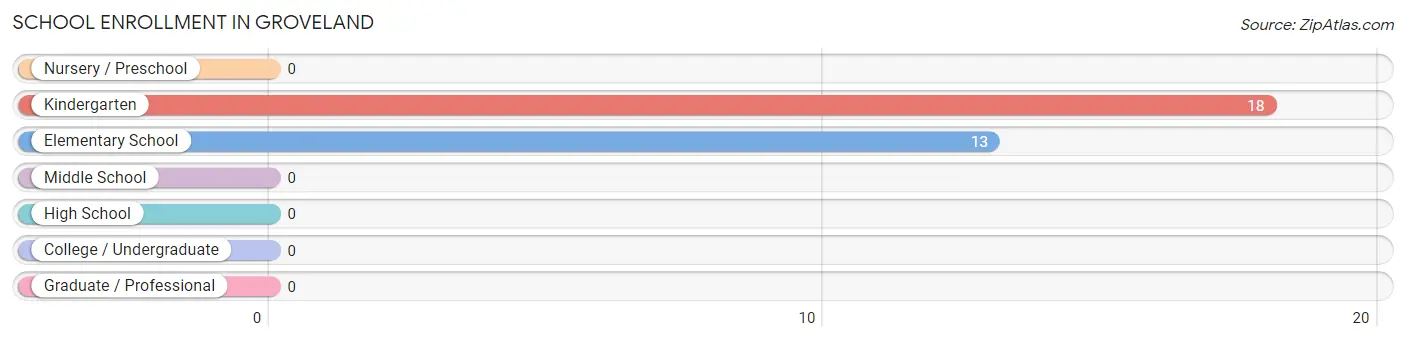
| School Level | # Students | % Students |
| Nursery / Preschool | 0 | 0.0% |
| Kindergarten | 18 | 58.1% |
| Elementary School | 13 | 41.9% |
| Middle School | 0 | 0.0% |
| High School | 0 | 0.0% |
| College / Undergraduate | 0 | 0.0% |
| Graduate / Professional | 0 | 0.0% |
| Total | 31 | 100.0% |
School Enrollment by Age by Funding Source in Groveland
Out of a total of 31 students who are enrolled in schools in Groveland, 18 (58.1%) attend a private institution, while the remaining 13 (41.9%) are enrolled in public schools. The age group of 5 to 9 year old has the highest likelihood of being enrolled in private schools, with 18 (100.0% in the age bracket) enrolled. Conversely, the age group of 10 to 14 year olds has the lowest likelihood of being enrolled in a private school, with 13 (100.0% in the age bracket) attending a public institution.
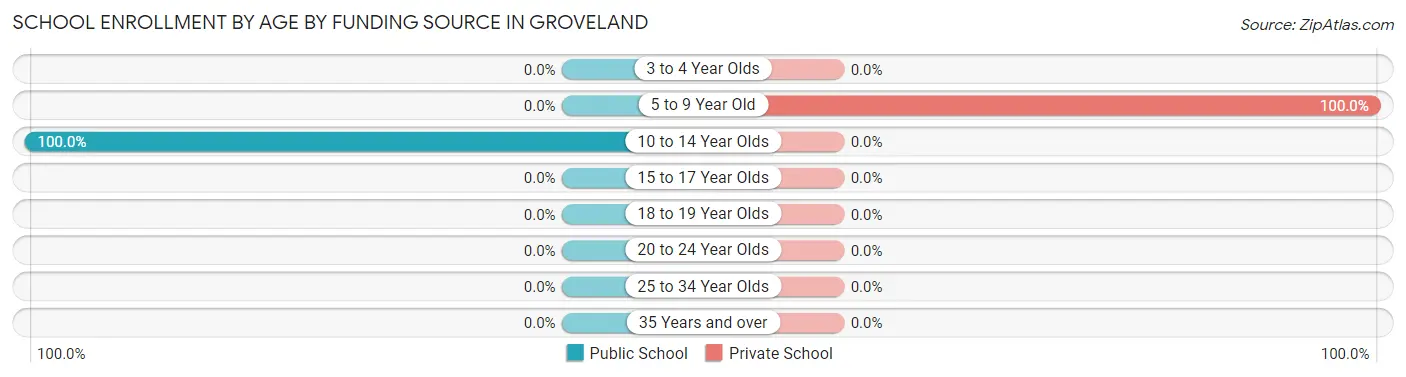
| Age Bracket | Public School | Private School |
| 3 to 4 Year Olds | 0 (0.0%) | 0 (0.0%) |
| 5 to 9 Year Old | 0 (0.0%) | 18 (100.0%) |
| 10 to 14 Year Olds | 13 (100.0%) | 0 (0.0%) |
| 15 to 17 Year Olds | 0 (0.0%) | 0 (0.0%) |
| 18 to 19 Year Olds | 0 (0.0%) | 0 (0.0%) |
| 20 to 24 Year Olds | 0 (0.0%) | 0 (0.0%) |
| 25 to 34 Year Olds | 0 (0.0%) | 0 (0.0%) |
| 35 Years and over | 0 (0.0%) | 0 (0.0%) |
| Total | 13 (41.9%) | 18 (58.1%) |
Educational Attainment by Field of Study in Groveland
Business (48 | 52.7%), social sciences (19 | 20.9%), engineering (19 | 20.9%), and education (5 | 5.5%) are the most common fields of study among 91 individuals in Groveland who have obtained a bachelor's degree or higher.
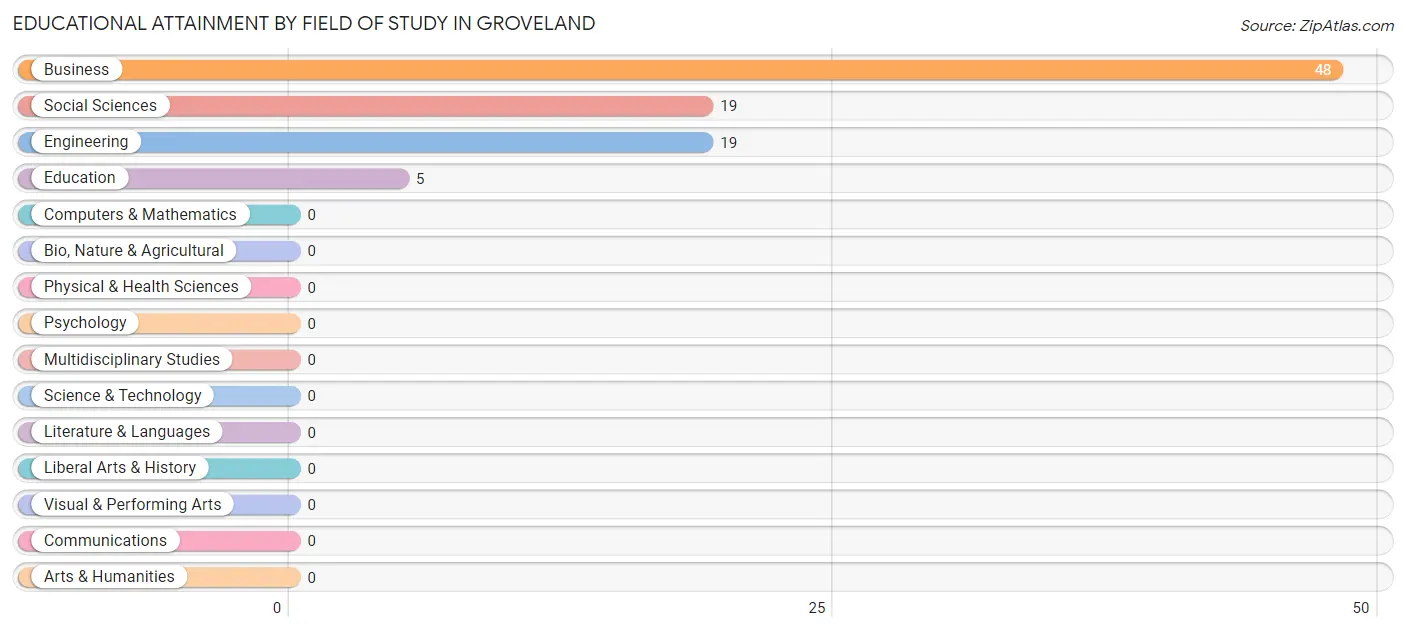
| Field of Study | # Graduates | % Graduates |
| Computers & Mathematics | 0 | 0.0% |
| Bio, Nature & Agricultural | 0 | 0.0% |
| Physical & Health Sciences | 0 | 0.0% |
| Psychology | 0 | 0.0% |
| Social Sciences | 19 | 20.9% |
| Engineering | 19 | 20.9% |
| Multidisciplinary Studies | 0 | 0.0% |
| Science & Technology | 0 | 0.0% |
| Business | 48 | 52.7% |
| Education | 5 | 5.5% |
| Literature & Languages | 0 | 0.0% |
| Liberal Arts & History | 0 | 0.0% |
| Visual & Performing Arts | 0 | 0.0% |
| Communications | 0 | 0.0% |
| Arts & Humanities | 0 | 0.0% |
| Total | 91 | 100.0% |
Transportation & Commute in Groveland
Vehicle Availability by Sex in Groveland
The most prevalent vehicle ownership categories in Groveland are males with 2 vehicles (29, accounting for 45.3%) and females with 2 vehicles (46, making up 31.5%).
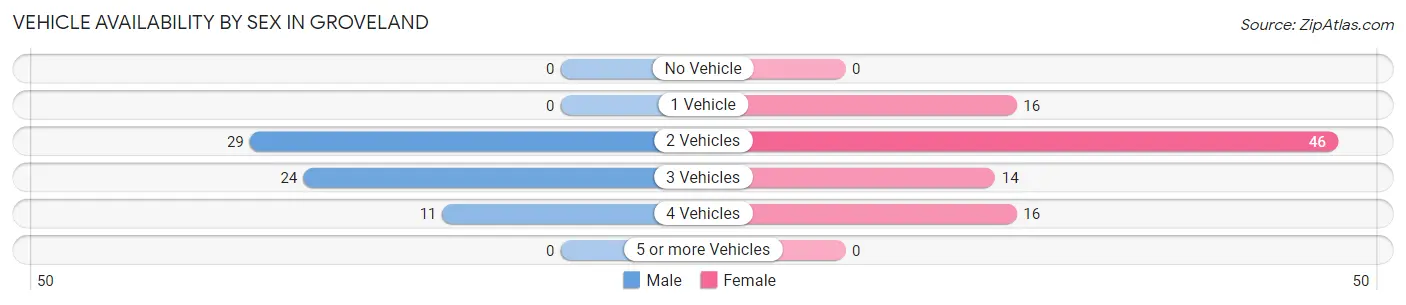
| Vehicles Available | Male | Female |
| No Vehicle | 0 (0.0%) | 0 (0.0%) |
| 1 Vehicle | 0 (0.0%) | 16 (17.4%) |
| 2 Vehicles | 29 (45.3%) | 46 (50.0%) |
| 3 Vehicles | 24 (37.5%) | 14 (15.2%) |
| 4 Vehicles | 11 (17.2%) | 16 (17.4%) |
| 5 or more Vehicles | 0 (0.0%) | 0 (0.0%) |
| Total | 64 (100.0%) | 92 (100.0%) |
Commute Time in Groveland
The most frequently occuring commute durations in Groveland are 10 to 14 minutes (44 commuters, 28.2%), 30 to 34 minutes (36 commuters, 23.1%), and less than 5 minutes (30 commuters, 19.2%).
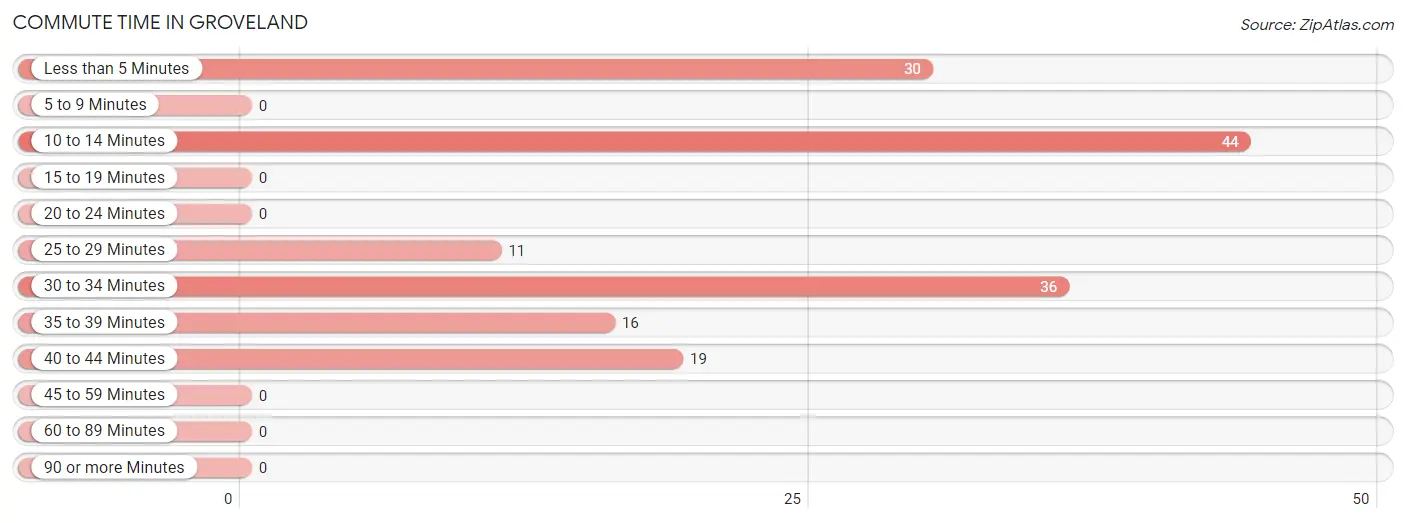
| Commute Time | # Commuters | % Commuters |
| Less than 5 Minutes | 30 | 19.2% |
| 5 to 9 Minutes | 0 | 0.0% |
| 10 to 14 Minutes | 44 | 28.2% |
| 15 to 19 Minutes | 0 | 0.0% |
| 20 to 24 Minutes | 0 | 0.0% |
| 25 to 29 Minutes | 11 | 7.0% |
| 30 to 34 Minutes | 36 | 23.1% |
| 35 to 39 Minutes | 16 | 10.3% |
| 40 to 44 Minutes | 19 | 12.2% |
| 45 to 59 Minutes | 0 | 0.0% |
| 60 to 89 Minutes | 0 | 0.0% |
| 90 or more Minutes | 0 | 0.0% |
Commute Time by Sex in Groveland
The most common commute times in Groveland are 10 to 14 minutes (34 commuters, 53.1%) for males and 30 to 34 minutes (36 commuters, 39.1%) for females.
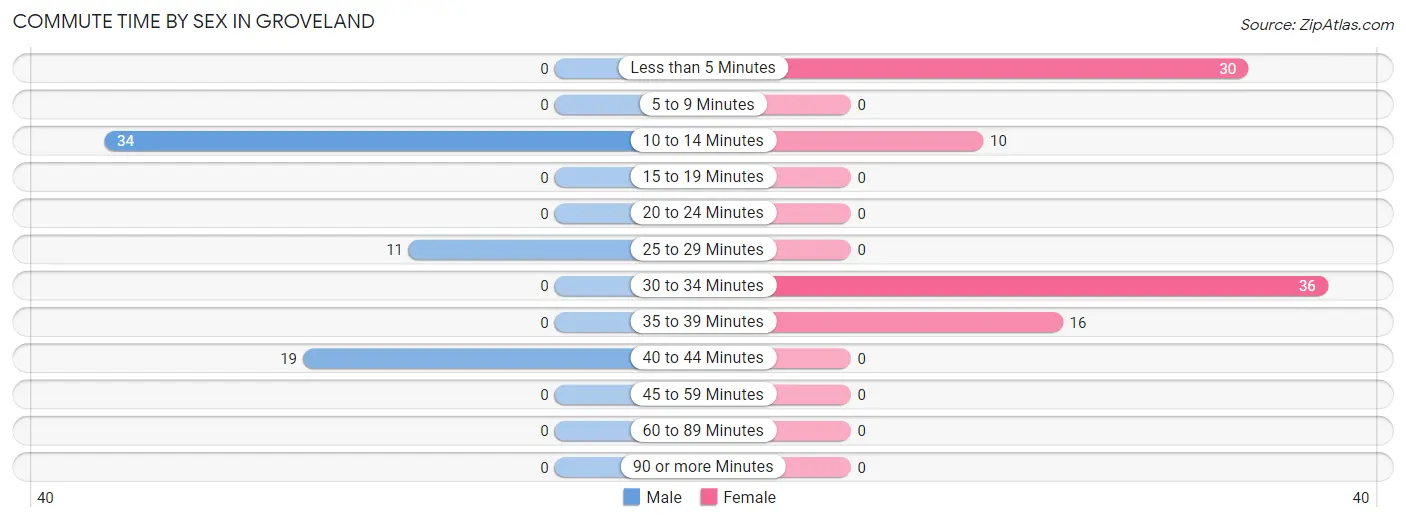
| Commute Time | Male | Female |
| Less than 5 Minutes | 0 (0.0%) | 30 (32.6%) |
| 5 to 9 Minutes | 0 (0.0%) | 0 (0.0%) |
| 10 to 14 Minutes | 34 (53.1%) | 10 (10.9%) |
| 15 to 19 Minutes | 0 (0.0%) | 0 (0.0%) |
| 20 to 24 Minutes | 0 (0.0%) | 0 (0.0%) |
| 25 to 29 Minutes | 11 (17.2%) | 0 (0.0%) |
| 30 to 34 Minutes | 0 (0.0%) | 36 (39.1%) |
| 35 to 39 Minutes | 0 (0.0%) | 16 (17.4%) |
| 40 to 44 Minutes | 19 (29.7%) | 0 (0.0%) |
| 45 to 59 Minutes | 0 (0.0%) | 0 (0.0%) |
| 60 to 89 Minutes | 0 (0.0%) | 0 (0.0%) |
| 90 or more Minutes | 0 (0.0%) | 0 (0.0%) |
Time of Departure to Work by Sex in Groveland
The most frequent times of departure to work in Groveland are 6:30 AM to 6:59 AM (45, 70.3%) for males and 12:00 AM to 4:59 AM (30, 32.6%) for females.
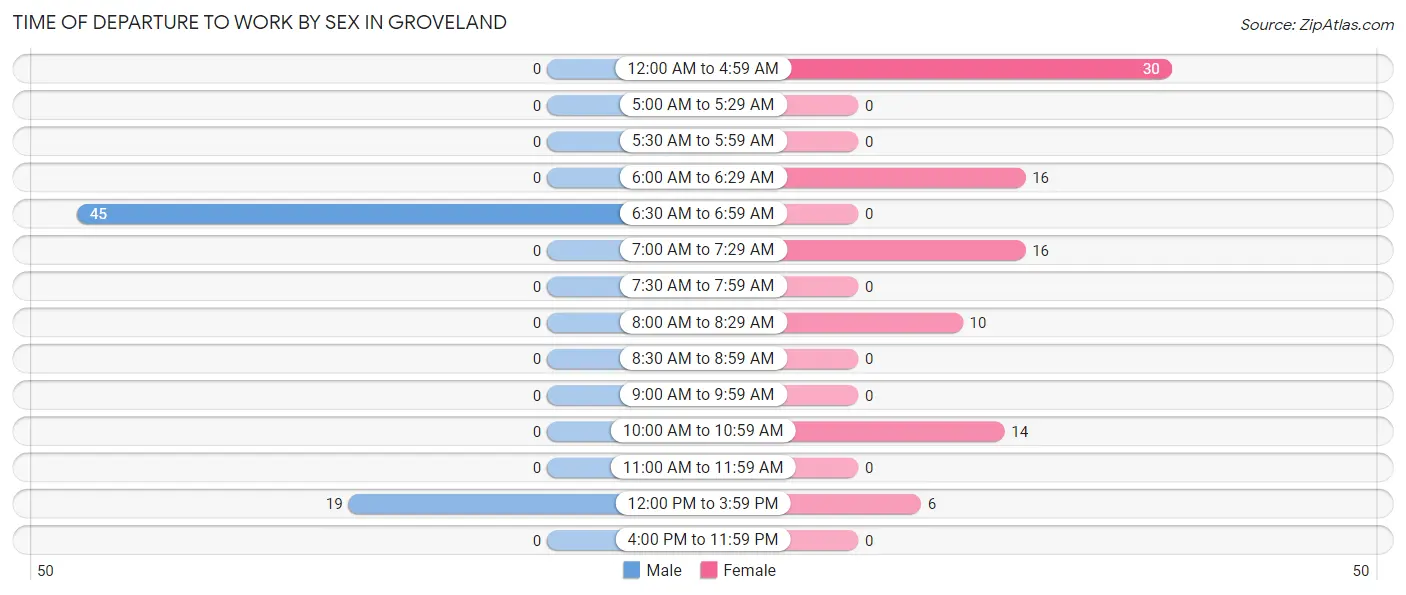
| Time of Departure | Male | Female |
| 12:00 AM to 4:59 AM | 0 (0.0%) | 30 (32.6%) |
| 5:00 AM to 5:29 AM | 0 (0.0%) | 0 (0.0%) |
| 5:30 AM to 5:59 AM | 0 (0.0%) | 0 (0.0%) |
| 6:00 AM to 6:29 AM | 0 (0.0%) | 16 (17.4%) |
| 6:30 AM to 6:59 AM | 45 (70.3%) | 0 (0.0%) |
| 7:00 AM to 7:29 AM | 0 (0.0%) | 16 (17.4%) |
| 7:30 AM to 7:59 AM | 0 (0.0%) | 0 (0.0%) |
| 8:00 AM to 8:29 AM | 0 (0.0%) | 10 (10.9%) |
| 8:30 AM to 8:59 AM | 0 (0.0%) | 0 (0.0%) |
| 9:00 AM to 9:59 AM | 0 (0.0%) | 0 (0.0%) |
| 10:00 AM to 10:59 AM | 0 (0.0%) | 14 (15.2%) |
| 11:00 AM to 11:59 AM | 0 (0.0%) | 0 (0.0%) |
| 12:00 PM to 3:59 PM | 19 (29.7%) | 6 (6.5%) |
| 4:00 PM to 11:59 PM | 0 (0.0%) | 0 (0.0%) |
| Total | 64 (100.0%) | 92 (100.0%) |
Housing Occupancy in Groveland
Occupancy by Ownership in Groveland
Of the total 302 dwellings in Groveland, owner-occupied units account for 215 (71.2%), while renter-occupied units make up 87 (28.8%).
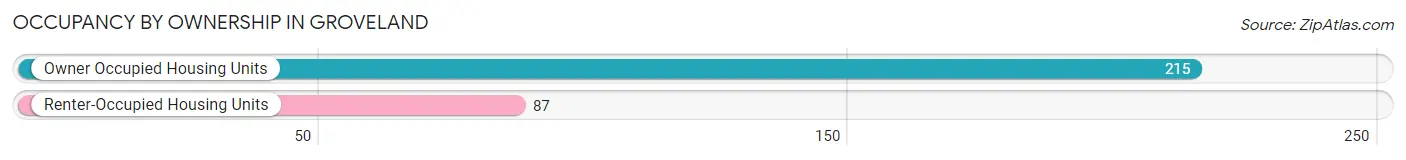
| Occupancy | # Housing Units | % Housing Units |
| Owner Occupied Housing Units | 215 | 71.2% |
| Renter-Occupied Housing Units | 87 | 28.8% |
| Total Occupied Housing Units | 302 | 100.0% |
Occupancy by Household Size in Groveland
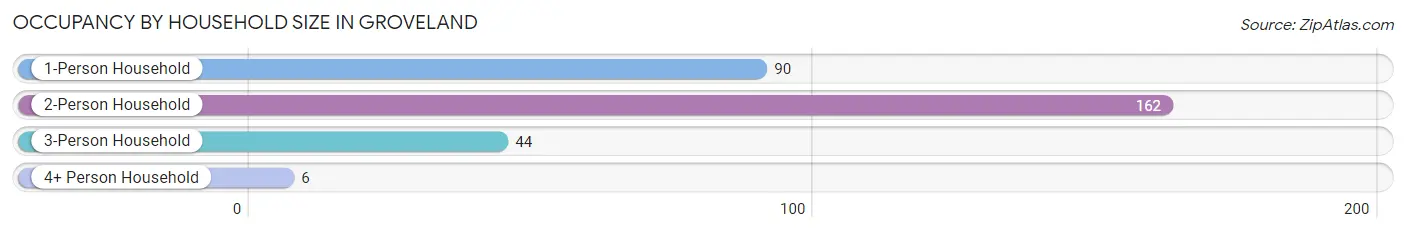
| Household Size | # Housing Units | % Housing Units |
| 1-Person Household | 90 | 29.8% |
| 2-Person Household | 162 | 53.6% |
| 3-Person Household | 44 | 14.6% |
| 4+ Person Household | 6 | 2.0% |
| Total Housing Units | 302 | 100.0% |
Occupancy by Ownership by Household Size in Groveland
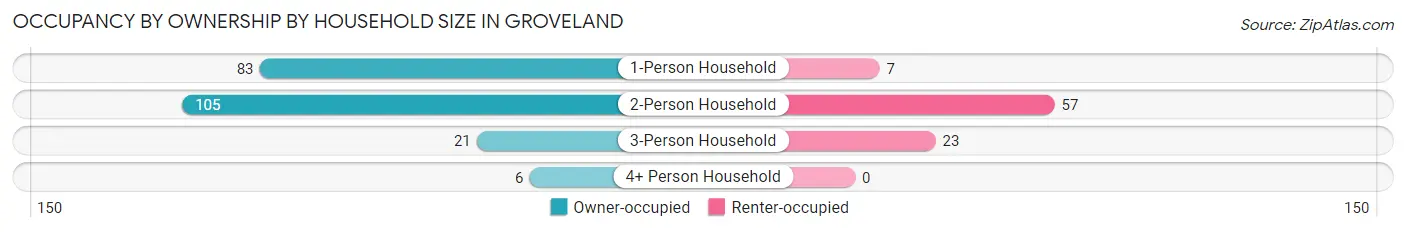
| Household Size | Owner-occupied | Renter-occupied |
| 1-Person Household | 83 (92.2%) | 7 (7.8%) |
| 2-Person Household | 105 (64.8%) | 57 (35.2%) |
| 3-Person Household | 21 (47.7%) | 23 (52.3%) |
| 4+ Person Household | 6 (100.0%) | 0 (0.0%) |
| Total Housing Units | 215 (71.2%) | 87 (28.8%) |
Occupancy by Educational Attainment in Groveland
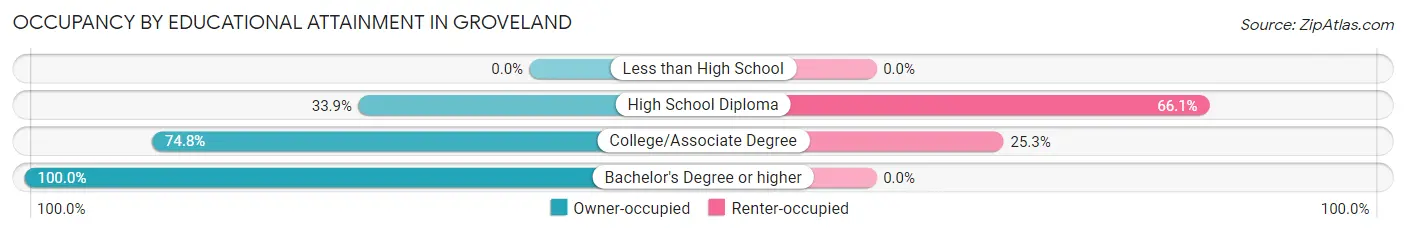
| Household Size | Owner-occupied | Renter-occupied |
| Less than High School | 0 (0.0%) | 0 (0.0%) |
| High School Diploma | 19 (33.9%) | 37 (66.1%) |
| College/Associate Degree | 148 (74.8%) | 50 (25.3%) |
| Bachelor's Degree or higher | 48 (100.0%) | 0 (0.0%) |
Occupancy by Age of Householder in Groveland
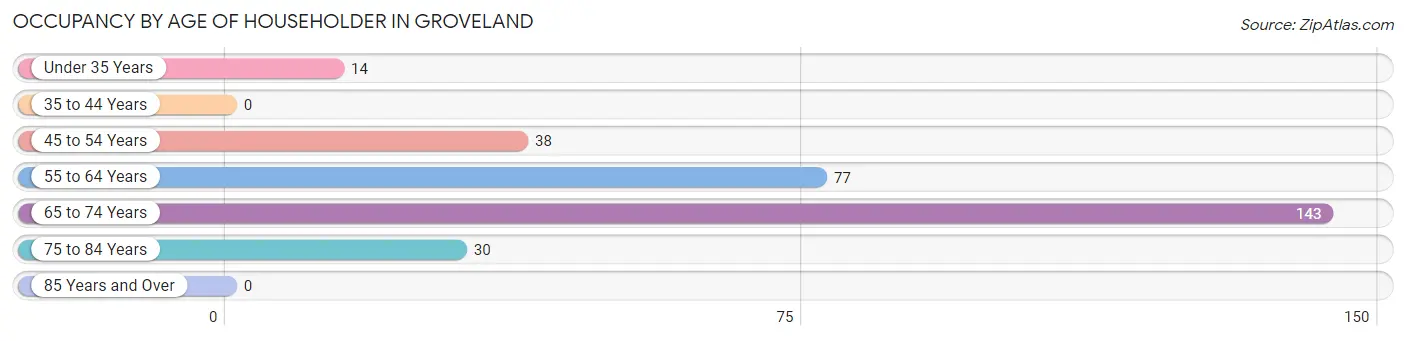
| Age Bracket | # Households | % Households |
| Under 35 Years | 14 | 4.6% |
| 35 to 44 Years | 0 | 0.0% |
| 45 to 54 Years | 38 | 12.6% |
| 55 to 64 Years | 77 | 25.5% |
| 65 to 74 Years | 143 | 47.3% |
| 75 to 84 Years | 30 | 9.9% |
| 85 Years and Over | 0 | 0.0% |
| Total | 302 | 100.0% |
Housing Finances in Groveland
Median Income by Occupancy in Groveland
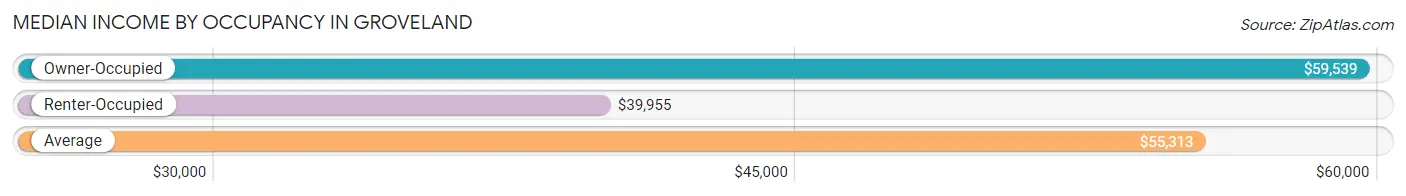
| Occupancy Type | # Households | Median Income |
| Owner-Occupied | 215 (71.2%) | $59,539 |
| Renter-Occupied | 87 (28.8%) | $39,955 |
| Average | 302 (100.0%) | $55,313 |
Occupancy by Householder Income Bracket in Groveland
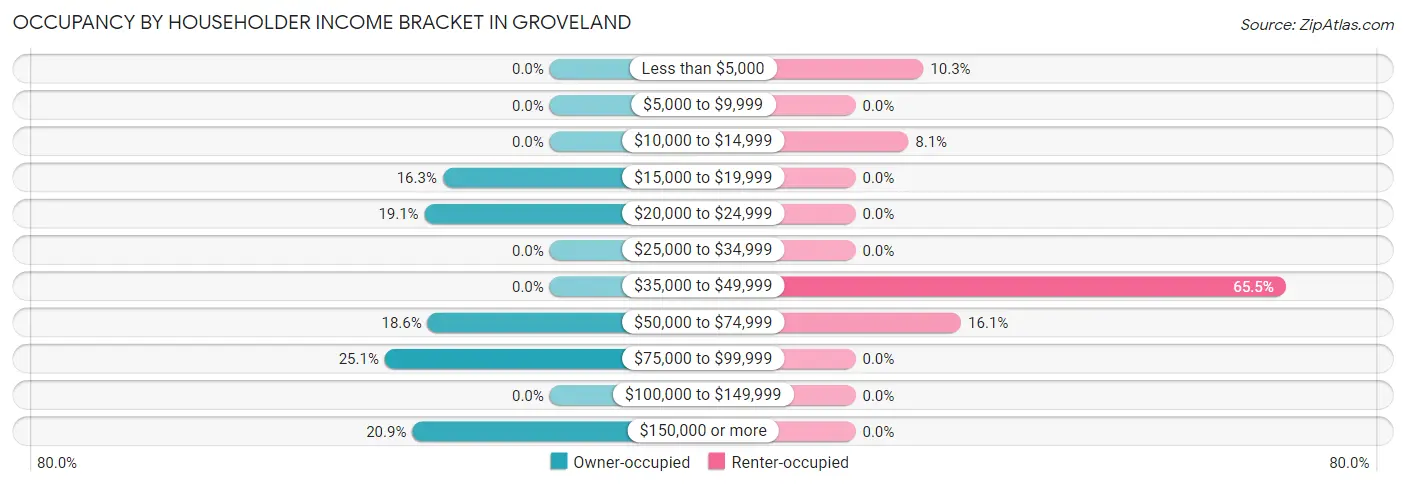
| Income Bracket | Owner-occupied | Renter-occupied |
| Less than $5,000 | 0 (0.0%) | 9 (10.3%) |
| $5,000 to $9,999 | 0 (0.0%) | 0 (0.0%) |
| $10,000 to $14,999 | 0 (0.0%) | 7 (8.1%) |
| $15,000 to $19,999 | 35 (16.3%) | 0 (0.0%) |
| $20,000 to $24,999 | 41 (19.1%) | 0 (0.0%) |
| $25,000 to $34,999 | 0 (0.0%) | 0 (0.0%) |
| $35,000 to $49,999 | 0 (0.0%) | 57 (65.5%) |
| $50,000 to $74,999 | 40 (18.6%) | 14 (16.1%) |
| $75,000 to $99,999 | 54 (25.1%) | 0 (0.0%) |
| $100,000 to $149,999 | 0 (0.0%) | 0 (0.0%) |
| $150,000 or more | 45 (20.9%) | 0 (0.0%) |
| Total | 215 (100.0%) | 87 (100.0%) |
Monthly Housing Cost Tiers in Groveland
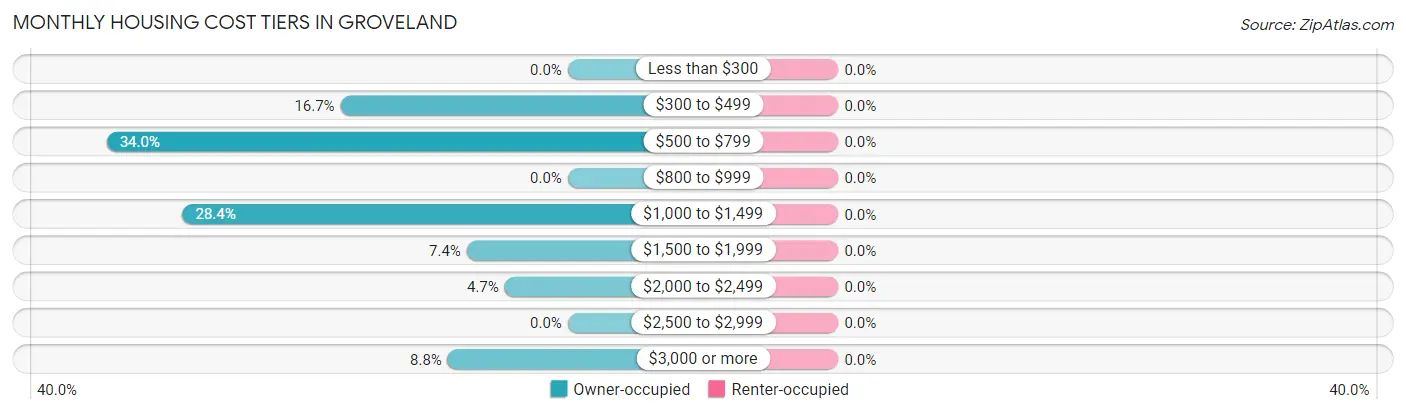
| Monthly Cost | Owner-occupied | Renter-occupied |
| Less than $300 | 0 (0.0%) | 0 (0.0%) |
| $300 to $499 | 36 (16.7%) | 0 (0.0%) |
| $500 to $799 | 73 (34.0%) | 0 (0.0%) |
| $800 to $999 | 0 (0.0%) | 0 (0.0%) |
| $1,000 to $1,499 | 61 (28.4%) | 0 (0.0%) |
| $1,500 to $1,999 | 16 (7.4%) | 0 (0.0%) |
| $2,000 to $2,499 | 10 (4.6%) | 0 (0.0%) |
| $2,500 to $2,999 | 0 (0.0%) | 0 (0.0%) |
| $3,000 or more | 19 (8.8%) | 0 (0.0%) |
| Total | 215 (100.0%) | 87 (100.0%) |
Physical Housing Characteristics in Groveland
Housing Structures in Groveland
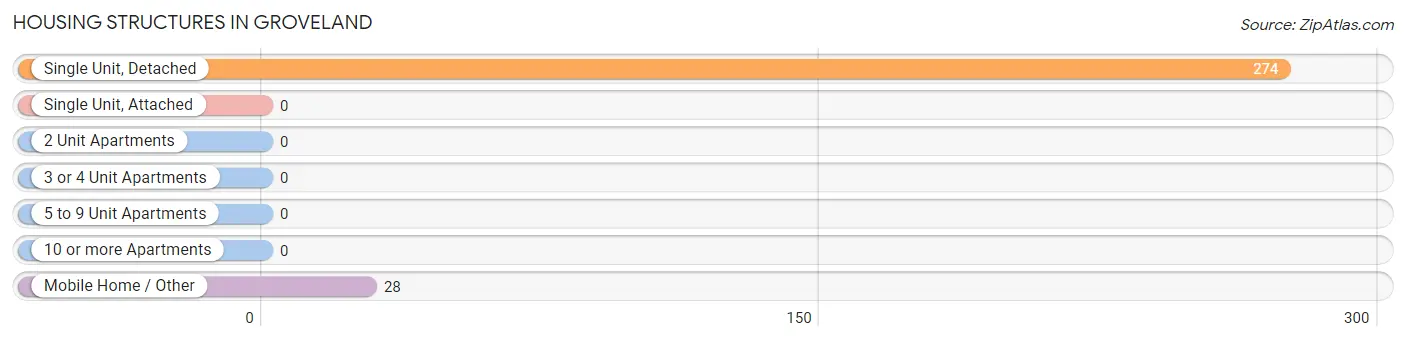
| Structure Type | # Housing Units | % Housing Units |
| Single Unit, Detached | 274 | 90.7% |
| Single Unit, Attached | 0 | 0.0% |
| 2 Unit Apartments | 0 | 0.0% |
| 3 or 4 Unit Apartments | 0 | 0.0% |
| 5 to 9 Unit Apartments | 0 | 0.0% |
| 10 or more Apartments | 0 | 0.0% |
| Mobile Home / Other | 28 | 9.3% |
| Total | 302 | 100.0% |
Housing Structures by Occupancy in Groveland
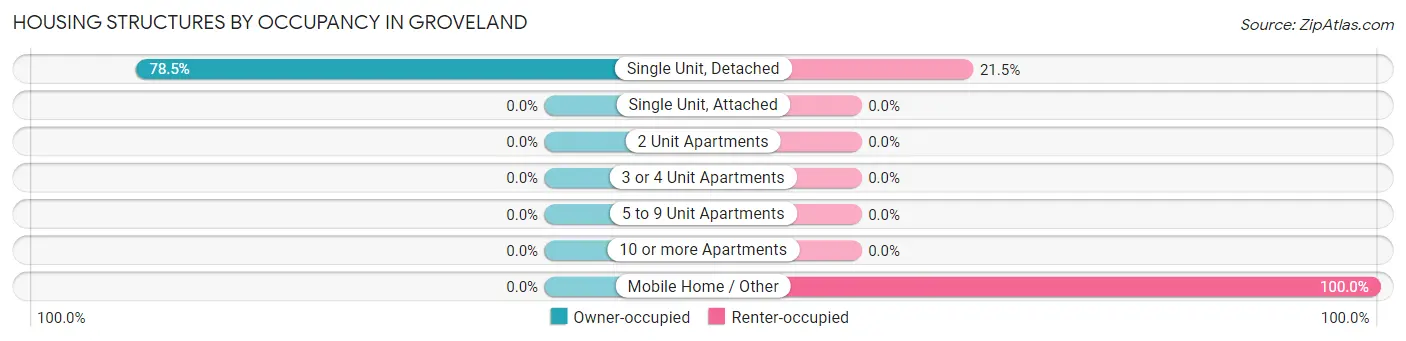
| Structure Type | Owner-occupied | Renter-occupied |
| Single Unit, Detached | 215 (78.5%) | 59 (21.5%) |
| Single Unit, Attached | 0 (0.0%) | 0 (0.0%) |
| 2 Unit Apartments | 0 (0.0%) | 0 (0.0%) |
| 3 or 4 Unit Apartments | 0 (0.0%) | 0 (0.0%) |
| 5 to 9 Unit Apartments | 0 (0.0%) | 0 (0.0%) |
| 10 or more Apartments | 0 (0.0%) | 0 (0.0%) |
| Mobile Home / Other | 0 (0.0%) | 28 (100.0%) |
| Total | 215 (71.2%) | 87 (28.8%) |
Housing Structures by Number of Rooms in Groveland
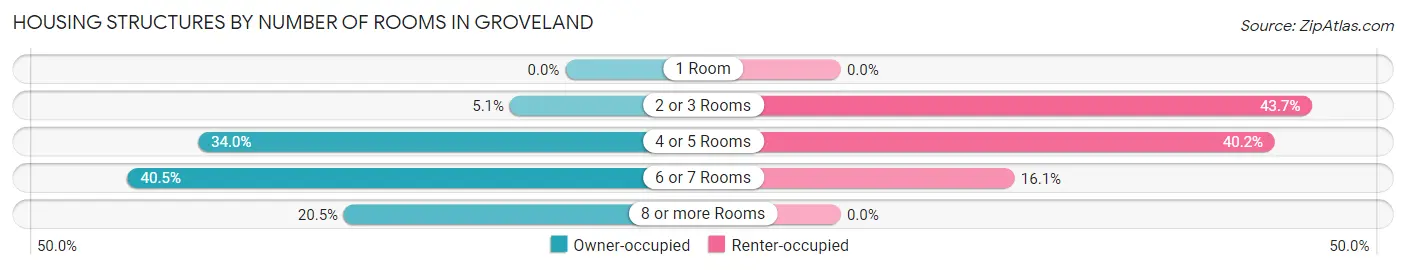
| Number of Rooms | Owner-occupied | Renter-occupied |
| 1 Room | 0 (0.0%) | 0 (0.0%) |
| 2 or 3 Rooms | 11 (5.1%) | 38 (43.7%) |
| 4 or 5 Rooms | 73 (34.0%) | 35 (40.2%) |
| 6 or 7 Rooms | 87 (40.5%) | 14 (16.1%) |
| 8 or more Rooms | 44 (20.5%) | 0 (0.0%) |
| Total | 215 (100.0%) | 87 (100.0%) |
Housing Structure by Heating Type in Groveland
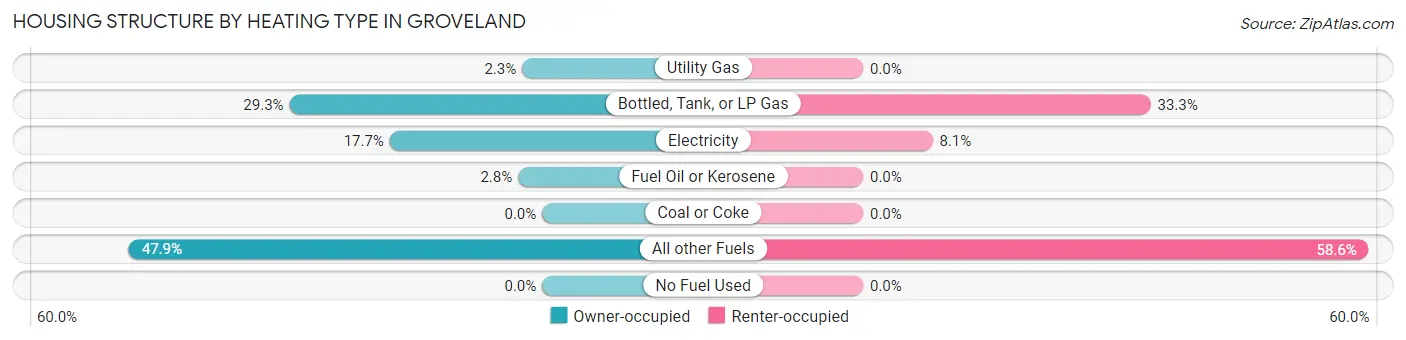
| Heating Type | Owner-occupied | Renter-occupied |
| Utility Gas | 5 (2.3%) | 0 (0.0%) |
| Bottled, Tank, or LP Gas | 63 (29.3%) | 29 (33.3%) |
| Electricity | 38 (17.7%) | 7 (8.1%) |
| Fuel Oil or Kerosene | 6 (2.8%) | 0 (0.0%) |
| Coal or Coke | 0 (0.0%) | 0 (0.0%) |
| All other Fuels | 103 (47.9%) | 51 (58.6%) |
| No Fuel Used | 0 (0.0%) | 0 (0.0%) |
| Total | 215 (100.0%) | 87 (100.0%) |
Household Vehicle Usage in Groveland
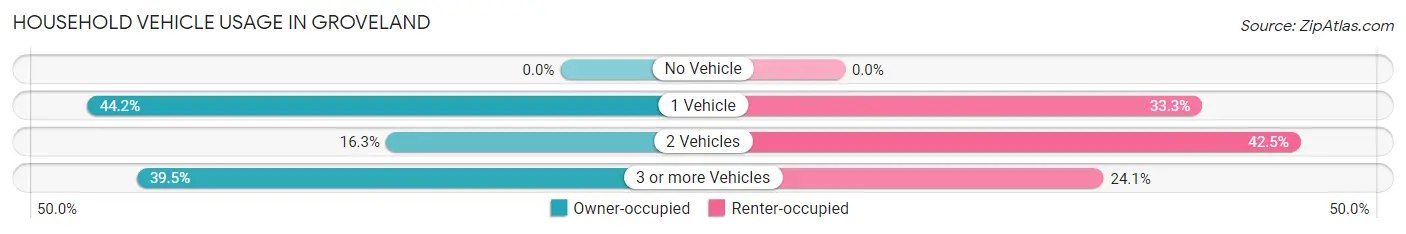
| Vehicles per Household | Owner-occupied | Renter-occupied |
| No Vehicle | 0 (0.0%) | 0 (0.0%) |
| 1 Vehicle | 95 (44.2%) | 29 (33.3%) |
| 2 Vehicles | 35 (16.3%) | 37 (42.5%) |
| 3 or more Vehicles | 85 (39.5%) | 21 (24.1%) |
| Total | 215 (100.0%) | 87 (100.0%) |
Real Estate & Mortgages in Groveland
Real Estate and Mortgage Overview in Groveland
| Characteristic | Without Mortgage | With Mortgage |
| Housing Units | 85 | 130 |
| Median Property Value | $321,600 | $313,300 |
| Median Household Income | - | - |
| Monthly Housing Costs | $602 | $19 |
| Real Estate Taxes | $2,244 | $0 |
Property Value by Mortgage Status in Groveland
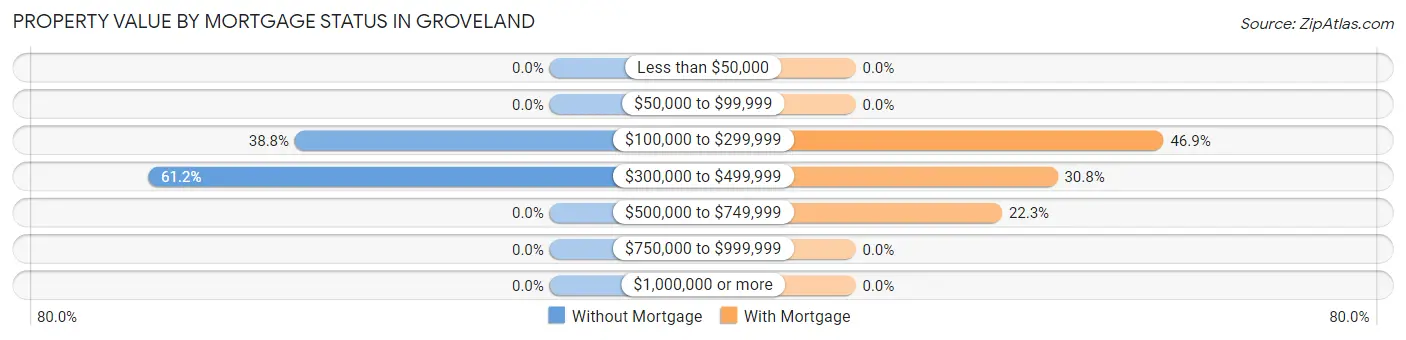
| Property Value | Without Mortgage | With Mortgage |
| Less than $50,000 | 0 (0.0%) | 0 (0.0%) |
| $50,000 to $99,999 | 0 (0.0%) | 0 (0.0%) |
| $100,000 to $299,999 | 33 (38.8%) | 61 (46.9%) |
| $300,000 to $499,999 | 52 (61.2%) | 40 (30.8%) |
| $500,000 to $749,999 | 0 (0.0%) | 29 (22.3%) |
| $750,000 to $999,999 | 0 (0.0%) | 0 (0.0%) |
| $1,000,000 or more | 0 (0.0%) | 0 (0.0%) |
| Total | 85 (100.0%) | 130 (100.0%) |
Household Income by Mortgage Status in Groveland
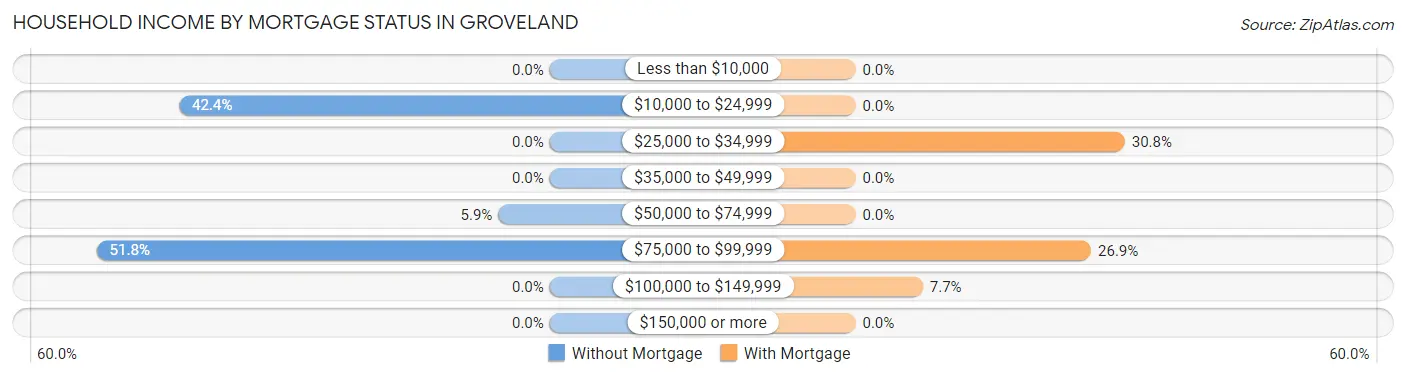
| Household Income | Without Mortgage | With Mortgage |
| Less than $10,000 | 0 (0.0%) | 0 (0.0%) |
| $10,000 to $24,999 | 36 (42.3%) | 0 (0.0%) |
| $25,000 to $34,999 | 0 (0.0%) | 40 (30.8%) |
| $35,000 to $49,999 | 0 (0.0%) | 0 (0.0%) |
| $50,000 to $74,999 | 5 (5.9%) | 0 (0.0%) |
| $75,000 to $99,999 | 44 (51.8%) | 35 (26.9%) |
| $100,000 to $149,999 | 0 (0.0%) | 10 (7.7%) |
| $150,000 or more | 0 (0.0%) | 0 (0.0%) |
| Total | 85 (100.0%) | 130 (100.0%) |
Property Value to Household Income Ratio in Groveland
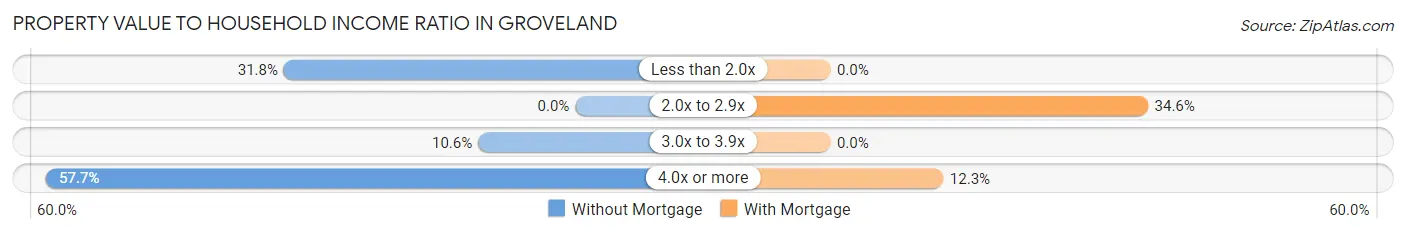
| Value-to-Income Ratio | Without Mortgage | With Mortgage |
| Less than 2.0x | 27 (31.8%) | 0 (0.0%) |
| 2.0x to 2.9x | 0 (0.0%) | 45 (34.6%) |
| 3.0x to 3.9x | 9 (10.6%) | 0 (0.0%) |
| 4.0x or more | 49 (57.7%) | 16 (12.3%) |
| Total | 85 (100.0%) | 130 (100.0%) |
Real Estate Taxes by Mortgage Status in Groveland
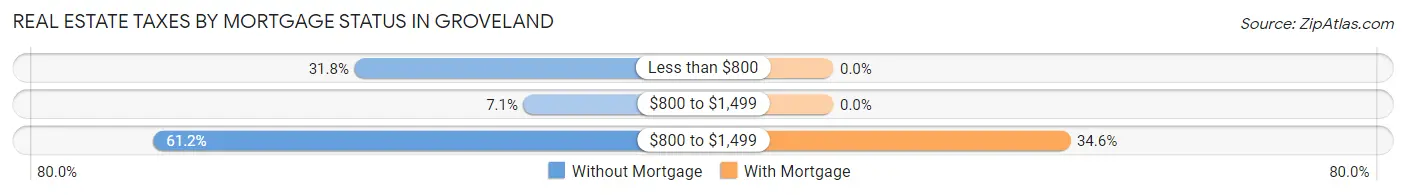
| Property Taxes | Without Mortgage | With Mortgage |
| Less than $800 | 27 (31.8%) | 0 (0.0%) |
| $800 to $1,499 | 6 (7.1%) | 0 (0.0%) |
| $800 to $1,499 | 52 (61.2%) | 45 (34.6%) |
| Total | 85 (100.0%) | 130 (100.0%) |
Health & Disability in Groveland
Health Insurance Coverage by Age in Groveland
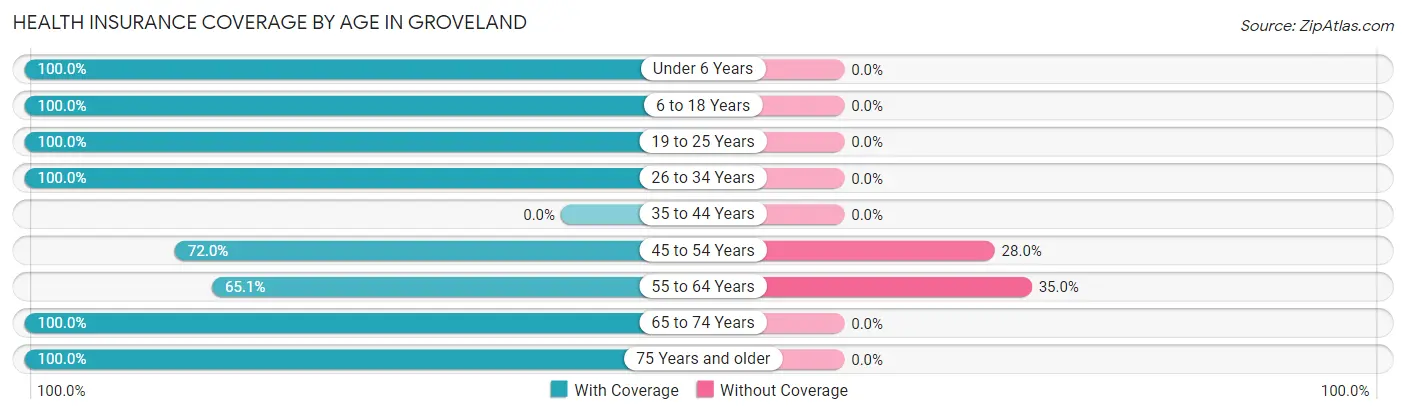
| Age Bracket | With Coverage | Without Coverage |
| Under 6 Years | 25 (100.0%) | 0 (0.0%) |
| 6 to 18 Years | 13 (100.0%) | 0 (0.0%) |
| 19 to 25 Years | 8 (100.0%) | 0 (0.0%) |
| 26 to 34 Years | 44 (100.0%) | 0 (0.0%) |
| 35 to 44 Years | 0 (0.0%) | 0 (0.0%) |
| 45 to 54 Years | 77 (72.0%) | 30 (28.0%) |
| 55 to 64 Years | 67 (65.0%) | 36 (34.9%) |
| 65 to 74 Years | 220 (100.0%) | 0 (0.0%) |
| 75 Years and older | 71 (100.0%) | 0 (0.0%) |
| Total | 525 (88.8%) | 66 (11.2%) |
Health Insurance Coverage by Citizenship Status in Groveland
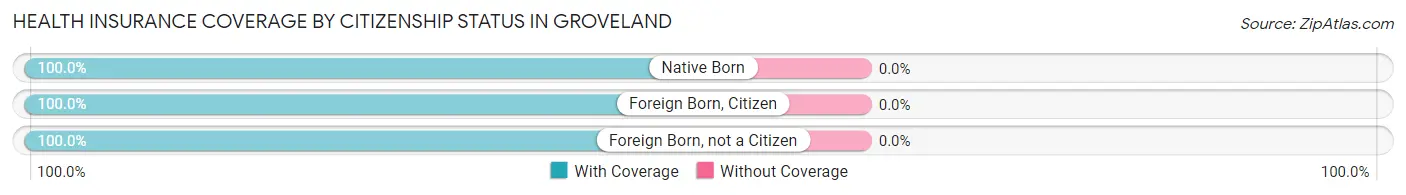
| Citizenship Status | With Coverage | Without Coverage |
| Native Born | 25 (100.0%) | 0 (0.0%) |
| Foreign Born, Citizen | 13 (100.0%) | 0 (0.0%) |
| Foreign Born, not a Citizen | 8 (100.0%) | 0 (0.0%) |
Health Insurance Coverage by Household Income in Groveland
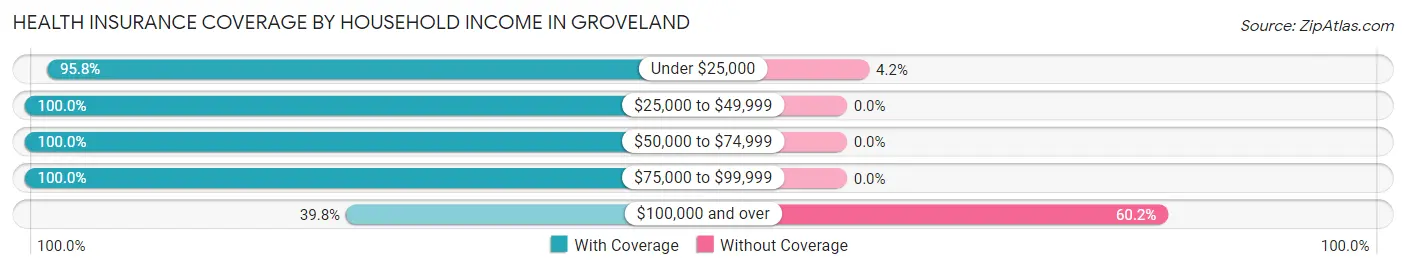
| Household Income | With Coverage | Without Coverage |
| Under $25,000 | 160 (95.8%) | 7 (4.2%) |
| $25,000 to $49,999 | 115 (100.0%) | 0 (0.0%) |
| $50,000 to $74,999 | 109 (100.0%) | 0 (0.0%) |
| $75,000 to $99,999 | 102 (100.0%) | 0 (0.0%) |
| $100,000 and over | 39 (39.8%) | 59 (60.2%) |
Public vs Private Health Insurance Coverage by Age in Groveland
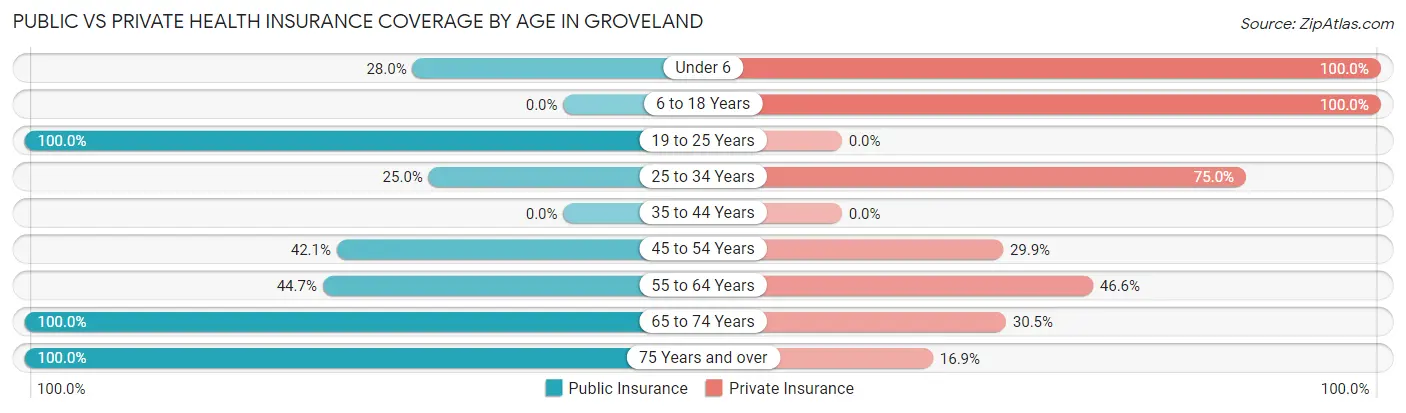
| Age Bracket | Public Insurance | Private Insurance |
| Under 6 | 7 (28.0%) | 25 (100.0%) |
| 6 to 18 Years | 0 (0.0%) | 13 (100.0%) |
| 19 to 25 Years | 8 (100.0%) | 0 (0.0%) |
| 25 to 34 Years | 11 (25.0%) | 33 (75.0%) |
| 35 to 44 Years | 0 (0.0%) | 0 (0.0%) |
| 45 to 54 Years | 45 (42.1%) | 32 (29.9%) |
| 55 to 64 Years | 46 (44.7%) | 48 (46.6%) |
| 65 to 74 Years | 220 (100.0%) | 67 (30.4%) |
| 75 Years and over | 71 (100.0%) | 12 (16.9%) |
| Total | 408 (69.0%) | 230 (38.9%) |
Disability Status by Sex by Age in Groveland
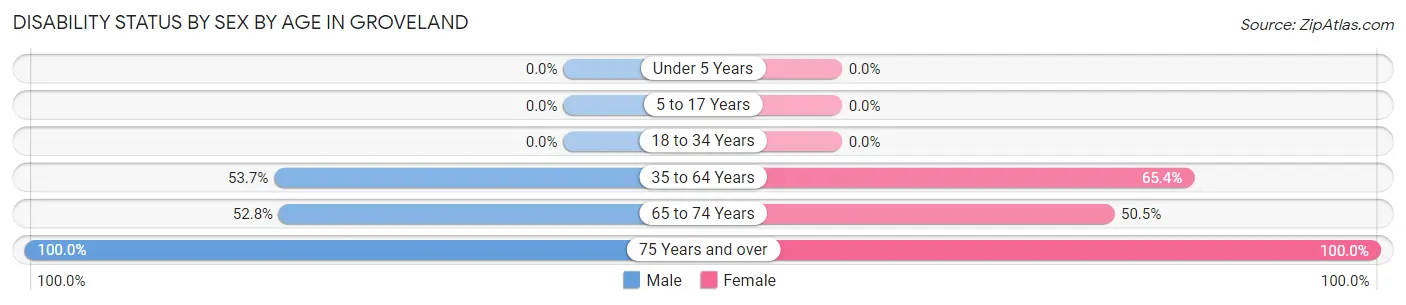
| Age Bracket | Male | Female |
| Under 5 Years | 0 (0.0%) | 0 (0.0%) |
| 5 to 17 Years | 0 (0.0%) | 0 (0.0%) |
| 18 to 34 Years | 0 (0.0%) | 0 (0.0%) |
| 35 to 64 Years | 29 (53.7%) | 102 (65.4%) |
| 65 to 74 Years | 66 (52.8%) | 48 (50.5%) |
| 75 Years and over | 42 (100.0%) | 29 (100.0%) |
Disability Class by Sex by Age in Groveland
Disability Class: Hearing Difficulty
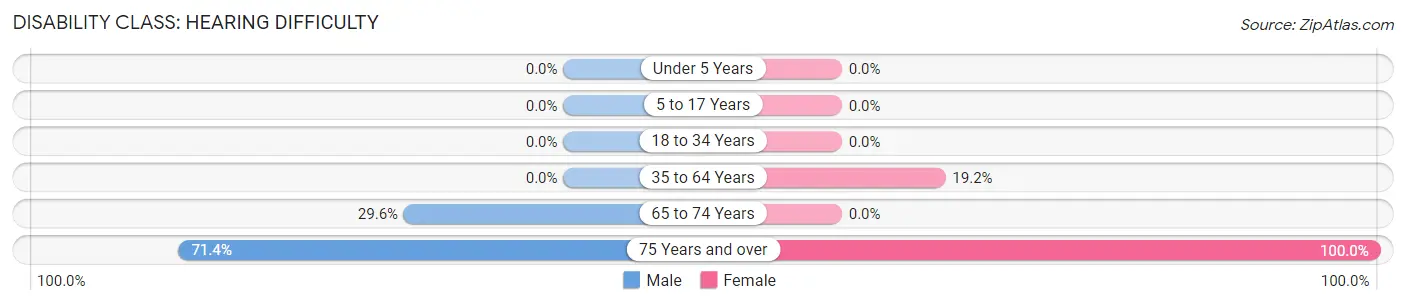
| Age Bracket | Male | Female |
| Under 5 Years | 0 (0.0%) | 0 (0.0%) |
| 5 to 17 Years | 0 (0.0%) | 0 (0.0%) |
| 18 to 34 Years | 0 (0.0%) | 0 (0.0%) |
| 35 to 64 Years | 0 (0.0%) | 30 (19.2%) |
| 65 to 74 Years | 37 (29.6%) | 0 (0.0%) |
| 75 Years and over | 30 (71.4%) | 29 (100.0%) |
Disability Class: Vision Difficulty
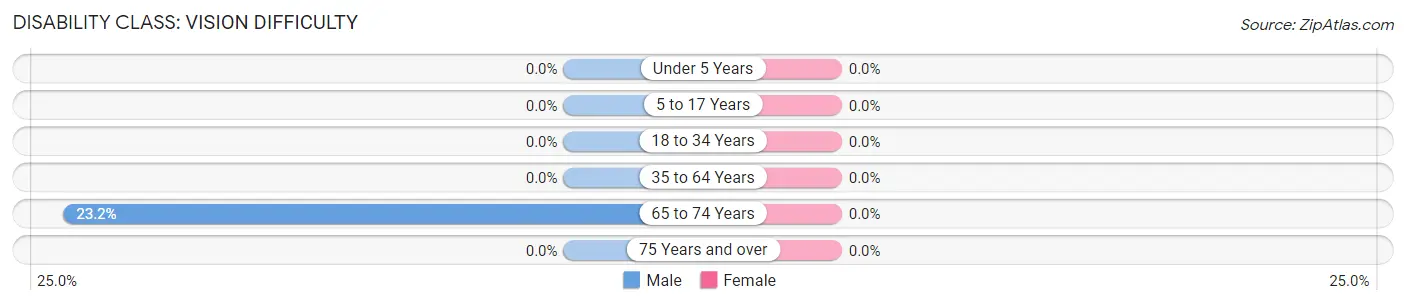
| Age Bracket | Male | Female |
| Under 5 Years | 0 (0.0%) | 0 (0.0%) |
| 5 to 17 Years | 0 (0.0%) | 0 (0.0%) |
| 18 to 34 Years | 0 (0.0%) | 0 (0.0%) |
| 35 to 64 Years | 0 (0.0%) | 0 (0.0%) |
| 65 to 74 Years | 29 (23.2%) | 0 (0.0%) |
| 75 Years and over | 0 (0.0%) | 0 (0.0%) |
Disability Class: Cognitive Difficulty
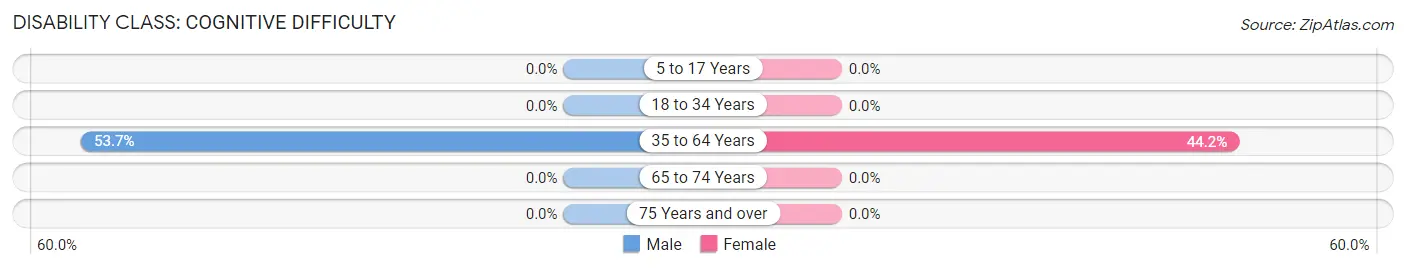
| Age Bracket | Male | Female |
| 5 to 17 Years | 0 (0.0%) | 0 (0.0%) |
| 18 to 34 Years | 0 (0.0%) | 0 (0.0%) |
| 35 to 64 Years | 29 (53.7%) | 69 (44.2%) |
| 65 to 74 Years | 0 (0.0%) | 0 (0.0%) |
| 75 Years and over | 0 (0.0%) | 0 (0.0%) |
Disability Class: Ambulatory Difficulty
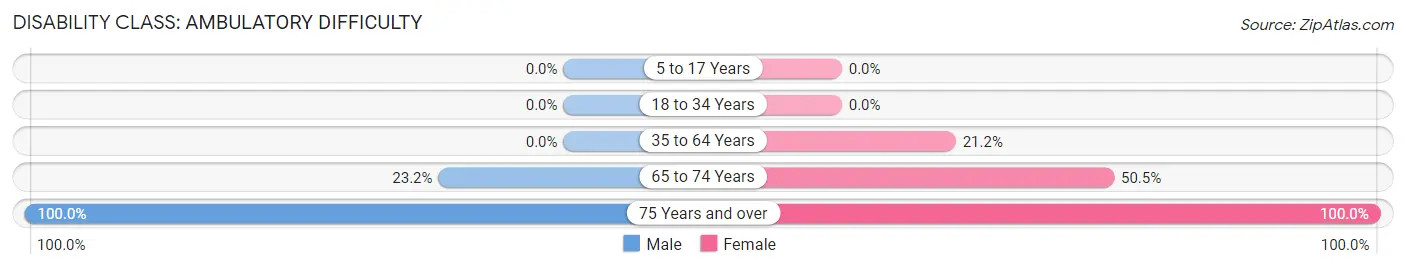
| Age Bracket | Male | Female |
| 5 to 17 Years | 0 (0.0%) | 0 (0.0%) |
| 18 to 34 Years | 0 (0.0%) | 0 (0.0%) |
| 35 to 64 Years | 0 (0.0%) | 33 (21.1%) |
| 65 to 74 Years | 29 (23.2%) | 48 (50.5%) |
| 75 Years and over | 42 (100.0%) | 29 (100.0%) |
Disability Class: Self-Care Difficulty
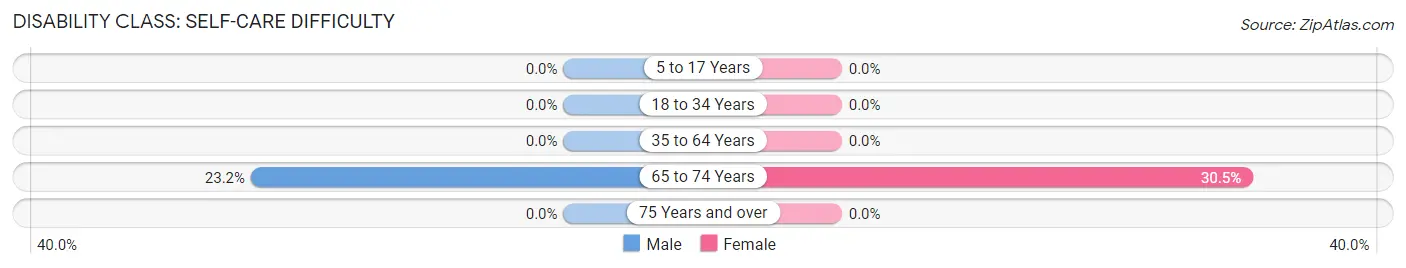
| Age Bracket | Male | Female |
| 5 to 17 Years | 0 (0.0%) | 0 (0.0%) |
| 18 to 34 Years | 0 (0.0%) | 0 (0.0%) |
| 35 to 64 Years | 0 (0.0%) | 0 (0.0%) |
| 65 to 74 Years | 29 (23.2%) | 29 (30.5%) |
| 75 Years and over | 0 (0.0%) | 0 (0.0%) |
Technology Access in Groveland
Computing Device Access in Groveland
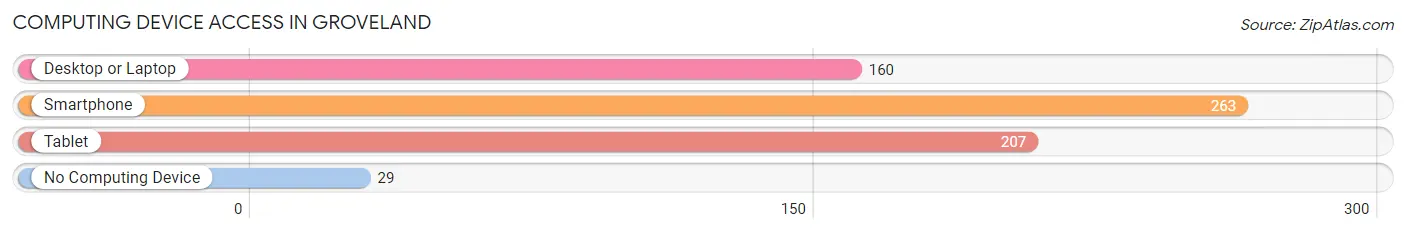
| Device Type | # Households | % Households |
| Desktop or Laptop | 160 | 53.0% |
| Smartphone | 263 | 87.1% |
| Tablet | 207 | 68.5% |
| No Computing Device | 29 | 9.6% |
| Total | 302 | 100.0% |
Internet Access in Groveland
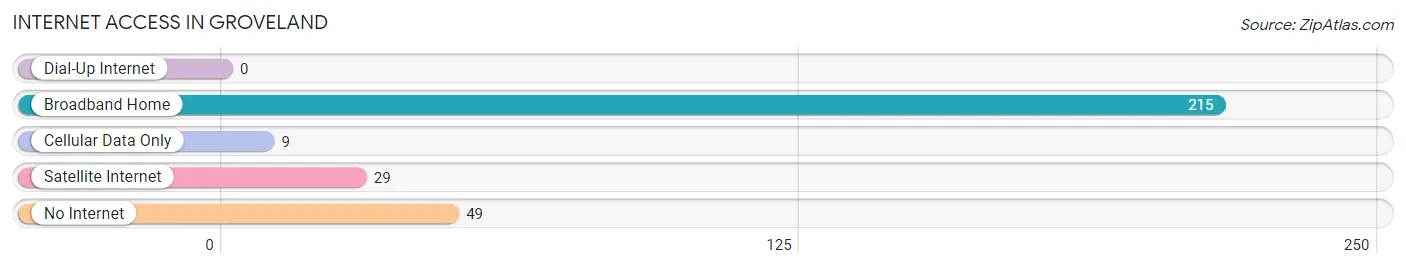
| Internet Type | # Households | % Households |
| Dial-Up Internet | 0 | 0.0% |
| Broadband Home | 215 | 71.2% |
| Cellular Data Only | 9 | 3.0% |
| Satellite Internet | 29 | 9.6% |
| No Internet | 49 | 16.2% |
| Total | 302 | 100.0% |
Groveland Summary
History
The area now known as Groveland, California was originally inhabited by the Miwok Native Americans. The first European settlers arrived in the area in the late 1840s, and the town was officially founded in 1854. The town was originally called Garrote, after the Spanish word for “hanging”, as it was the site of a hanging of a local criminal. The town was later renamed Groveland in 1858, after the groves of oak trees that surrounded the area.
The town was initially a mining town, with gold being discovered in the area in 1848. The town quickly grew as miners flocked to the area in search of gold. The town was also home to a number of saloons, hotels, and other businesses that catered to the miners.
In the late 19th century, the town began to decline as the gold rush ended and the population began to dwindle. The town was nearly abandoned by the early 20th century, but was revived in the 1920s when the Hetch Hetchy Dam was built nearby. The dam provided jobs and a new source of income for the town, and the population began to grow again.
Geography
Groveland is located in Tuolumne County, California, in the Sierra Nevada mountain range. The town is situated at an elevation of 2,845 feet, and is surrounded by the Stanislaus National Forest. The town is located on the banks of the Tuolumne River, and is approximately 40 miles east of Modesto.
The town is located in a temperate climate, with hot summers and mild winters. The average annual temperature is around 60 degrees Fahrenheit, and the average annual precipitation is around 20 inches.
Economy
The economy of Groveland is largely based on tourism. The town is a popular destination for outdoor recreation, and is home to a number of campgrounds, hiking trails, and other attractions. The town is also home to a number of restaurants, shops, and other businesses that cater to tourists.
The town is also home to a number of small businesses, including a number of wineries, a brewery, and a distillery. The town is also home to a number of small manufacturing businesses, including a furniture maker and a woodworking shop.
Demographics
As of the 2010 census, the population of Groveland was 1,817. The population is largely white (90.2%), with a small Hispanic population (4.2%) and a small African American population (1.2%). The median household income is $45,000, and the median home value is $250,000. The town has a low unemployment rate (3.2%), and a high rate of homeownership (77.2%).
Common Questions
What is Per Capita Income in Groveland?
Per Capita income in Groveland is $49,017.
What is the Median Family Income in Groveland?
Median Family Income in Groveland is $68,304.
What is the Median Household income in Groveland?
Median Household Income in Groveland is $55,313.
What is Inequality or Gini Index in Groveland?
Inequality or Gini Index in Groveland is 0.56.
What is the Total Population of Groveland?
Total Population of Groveland is 591.
What is the Total Male Population of Groveland?
Total Male Population of Groveland is 253.
What is the Total Female Population of Groveland?
Total Female Population of Groveland is 338.
What is the Ratio of Males per 100 Females in Groveland?
There are 74.85 Males per 100 Females in Groveland.
What is the Ratio of Females per 100 Males in Groveland?
There are 133.60 Females per 100 Males in Groveland.
What is the Median Population Age in Groveland?
Median Population Age in Groveland is 63.6 Years.
What is the Average Family Size in Groveland
Average Family Size in Groveland is 2.4 People.
What is the Average Household Size in Groveland
Average Household Size in Groveland is 2.0 People.
How Large is the Labor Force in Groveland?
There are 165 People in the Labor Forcein in Groveland.
What is the Percentage of People in the Labor Force in Groveland?
29.8% of People are in the Labor Force in Groveland.