Weatogue, CT Map & Demographics
Weatogue Map
Weatogue Overview
$85,915
PER CAPITA INCOME
$180,893
AVG FAMILY INCOME
$154,716
AVG HOUSEHOLD INCOME
24.7%
WAGE / INCOME GAP [ % ]
75.3¢/ $1
WAGE / INCOME GAP [ $ ]
0.42
INEQUALITY / GINI INDEX
2,671
TOTAL POPULATION
1,356
MALE POPULATION
1,315
FEMALE POPULATION
103.12
MALES / 100 FEMALES
96.98
FEMALES / 100 MALES
40.4
MEDIAN AGE
2.9
AVG FAMILY SIZE
2.4
AVG HOUSEHOLD SIZE
1,488
LABOR FORCE [ PEOPLE ]
69.3%
PERCENT IN LABOR FORCE
0.7%
UNEMPLOYMENT RATE
Weatogue Zip Codes
Weatogue Area Codes
Income in Weatogue
Income Overview in Weatogue
Per Capita Income in Weatogue is $85,915, while median incomes of families and households are $180,893 and $154,716 respectively.
| Characteristic | Number | Measure |
| Per Capita Income | 2,671 | $85,915 |
| Median Family Income | 795 | $180,893 |
| Mean Family Income | 795 | $232,724 |
| Median Household Income | 1,111 | $154,716 |
| Mean Household Income | 1,111 | $203,799 |
| Income Deficit | 795 | $0 |
| Wage / Income Gap (%) | 2,671 | 24.70% |
| Wage / Income Gap ($) | 2,671 | 75.30¢ per $1 |
| Gini / Inequality Index | 2,671 | 0.42 |
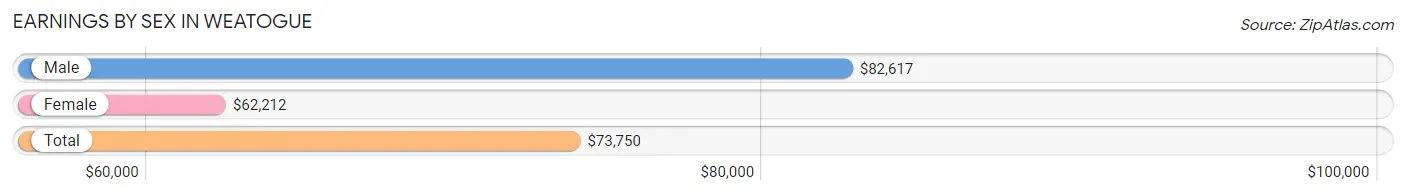
Earnings by Sex in Weatogue
Average Earnings in Weatogue are $73,750, $82,617 for men and $62,212 for women, a difference of 24.7%.
| Sex | Number | Average Earnings |
| Male | 810 (52.2%) | $82,617 |
| Female | 743 (47.8%) | $62,212 |
| Total | 1,553 (100.0%) | $73,750 |
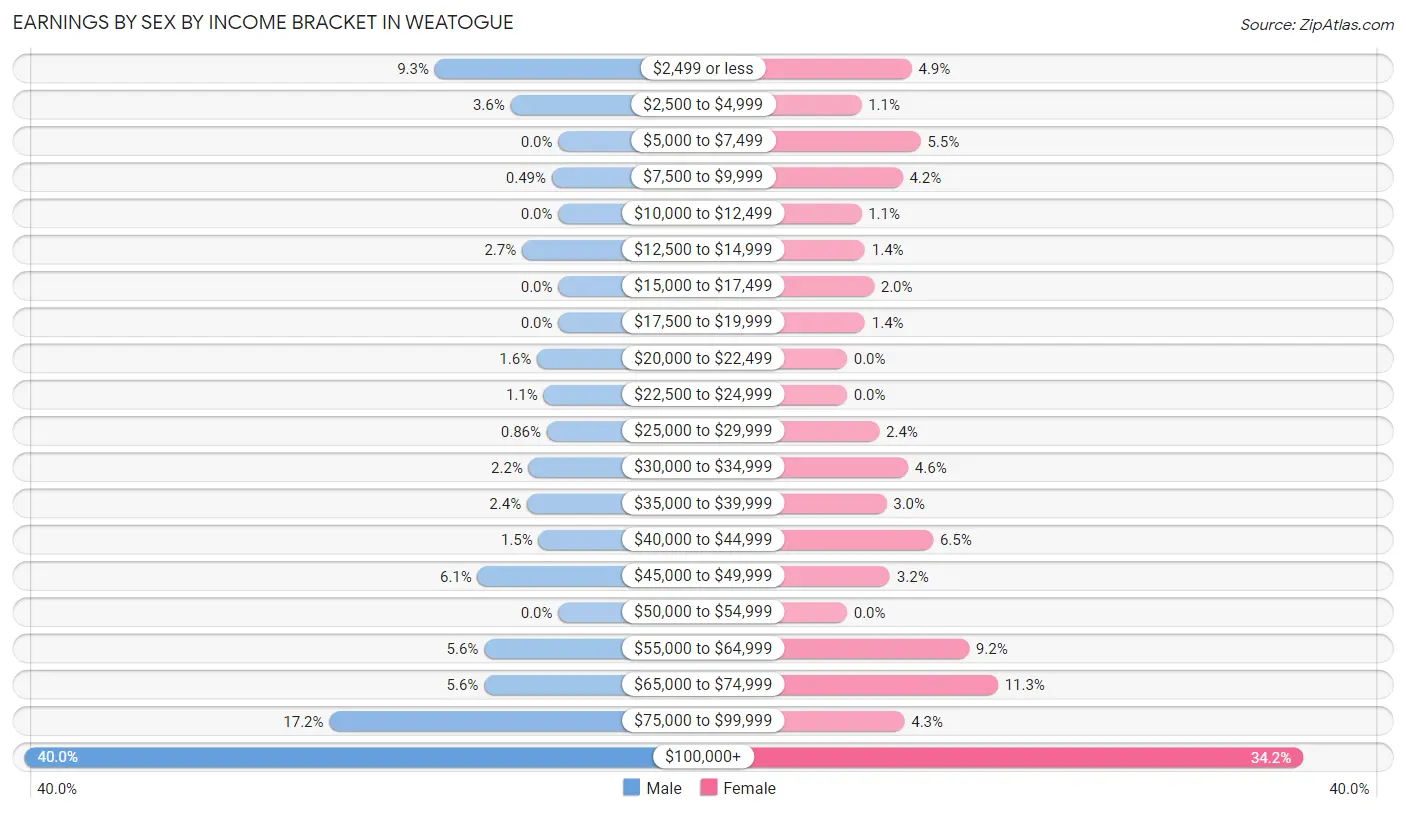
Earnings by Sex by Income Bracket in Weatogue
The most common earnings brackets in Weatogue are $100,000+ for men (324 | 40.0%) and $100,000+ for women (254 | 34.2%).
| Income | Male | Female |
| $2,499 or less | 75 (9.3%) | 36 (4.9%) |
| $2,500 to $4,999 | 29 (3.6%) | 8 (1.1%) |
| $5,000 to $7,499 | 0 (0.0%) | 41 (5.5%) |
| $7,500 to $9,999 | 4 (0.5%) | 31 (4.2%) |
| $10,000 to $12,499 | 0 (0.0%) | 8 (1.1%) |
| $12,500 to $14,999 | 22 (2.7%) | 10 (1.3%) |
| $15,000 to $17,499 | 0 (0.0%) | 15 (2.0%) |
| $17,500 to $19,999 | 0 (0.0%) | 10 (1.3%) |
| $20,000 to $22,499 | 13 (1.6%) | 0 (0.0%) |
| $22,500 to $24,999 | 9 (1.1%) | 0 (0.0%) |
| $25,000 to $29,999 | 7 (0.9%) | 18 (2.4%) |
| $30,000 to $34,999 | 18 (2.2%) | 34 (4.6%) |
| $35,000 to $39,999 | 19 (2.4%) | 22 (3.0%) |
| $40,000 to $44,999 | 12 (1.5%) | 48 (6.5%) |
| $45,000 to $49,999 | 49 (6.0%) | 24 (3.2%) |
| $50,000 to $54,999 | 0 (0.0%) | 0 (0.0%) |
| $55,000 to $64,999 | 45 (5.6%) | 68 (9.1%) |
| $65,000 to $74,999 | 45 (5.6%) | 84 (11.3%) |
| $75,000 to $99,999 | 139 (17.2%) | 32 (4.3%) |
| $100,000+ | 324 (40.0%) | 254 (34.2%) |
| Total | 810 (100.0%) | 743 (100.0%) |
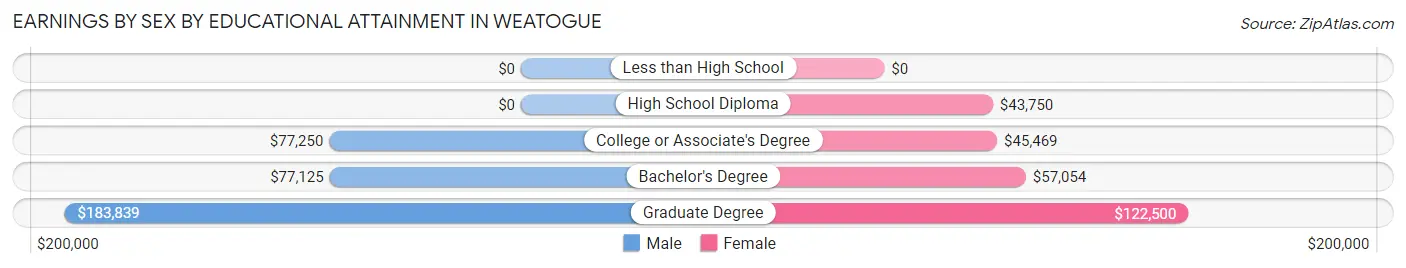
Earnings by Sex by Educational Attainment in Weatogue
Average earnings in Weatogue are $83,242 for men and $70,524 for women, a difference of 15.3%. Men with an educational attainment of graduate degree enjoy the highest average annual earnings of $183,839, while those with bachelor's degree education earn the least with $77,125. Women with an educational attainment of graduate degree earn the most with the average annual earnings of $122,500, while those with high school diploma education have the smallest earnings of $43,750.
| Educational Attainment | Male Income | Female Income |
| Less than High School | - | - |
| High School Diploma | - | - |
| College or Associate's Degree | $77,250 | $45,469 |
| Bachelor's Degree | $77,125 | $57,054 |
| Graduate Degree | $183,839 | $122,500 |
| Total | $83,242 | $70,524 |
Family Income in Weatogue
Family Income Brackets in Weatogue
According to the Weatogue family income data, there are 303 families falling into the $200,000+ income range, which is the most common income bracket and makes up 38.1% of all families.
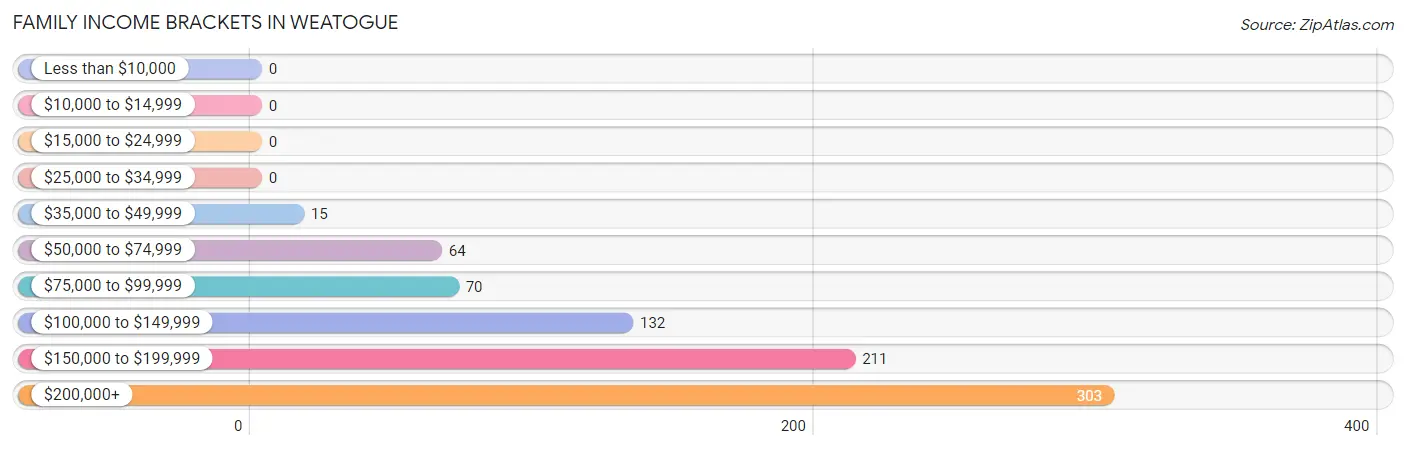
| Income Bracket | # Families | % Families |
| Less than $10,000 | 0 | 0.0% |
| $10,000 to $14,999 | 0 | 0.0% |
| $15,000 to $24,999 | 0 | 0.0% |
| $25,000 to $34,999 | 0 | 0.0% |
| $35,000 to $49,999 | 15 | 1.9% |
| $50,000 to $74,999 | 64 | 8.1% |
| $75,000 to $99,999 | 70 | 8.8% |
| $100,000 to $149,999 | 132 | 16.6% |
| $150,000 to $199,999 | 211 | 26.5% |
| $200,000+ | 303 | 38.1% |
Family Income by Famaliy Size in Weatogue
3-person families (161 | 20.3%) account for the highest median family income in Weatogue with $187,054 per family, while 2-person families (386 | 48.5%) have the highest median income of $78,750 per family member.
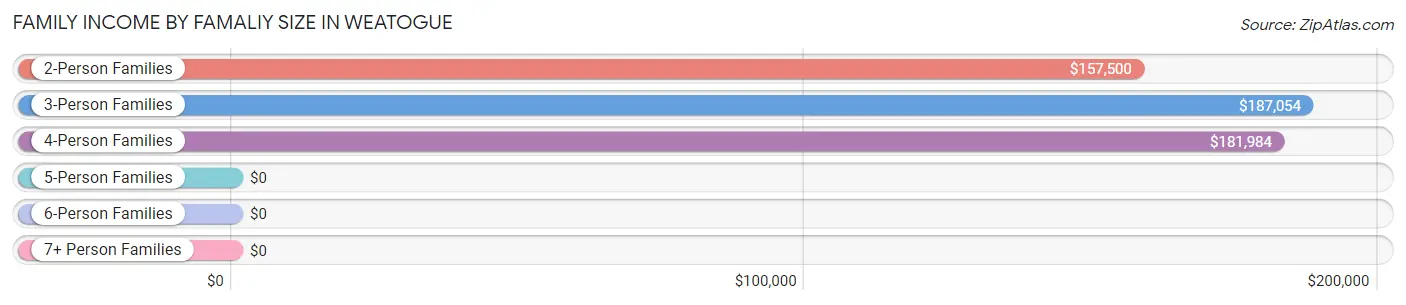
| Income Bracket | # Families | Median Income |
| 2-Person Families | 386 (48.5%) | $157,500 |
| 3-Person Families | 161 (20.3%) | $187,054 |
| 4-Person Families | 234 (29.4%) | $181,984 |
| 5-Person Families | 6 (0.7%) | $0 |
| 6-Person Families | 8 (1.0%) | $0 |
| 7+ Person Families | 0 (0.0%) | $0 |
| Total | 795 (100.0%) | $180,893 |
Family Income by Number of Earners in Weatogue
The median family income in Weatogue is $180,893, with families comprising 2 earners (481) having the highest median family income of $182,401, while families with no earners (107) have the lowest median family income of $82,625, accounting for 60.5% and 13.5% of families, respectively.
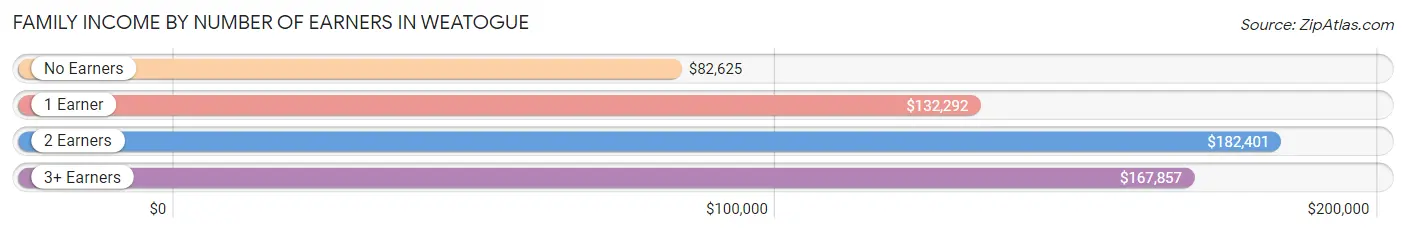
| Number of Earners | # Families | Median Income |
| No Earners | 107 (13.5%) | $82,625 |
| 1 Earner | 139 (17.5%) | $132,292 |
| 2 Earners | 481 (60.5%) | $182,401 |
| 3+ Earners | 68 (8.6%) | $167,857 |
| Total | 795 (100.0%) | $180,893 |
Household Income in Weatogue
Household Income Brackets in Weatogue
With 328 households falling in the category, the $200,000+ income range is the most frequent in Weatogue, accounting for 29.5% of all households.
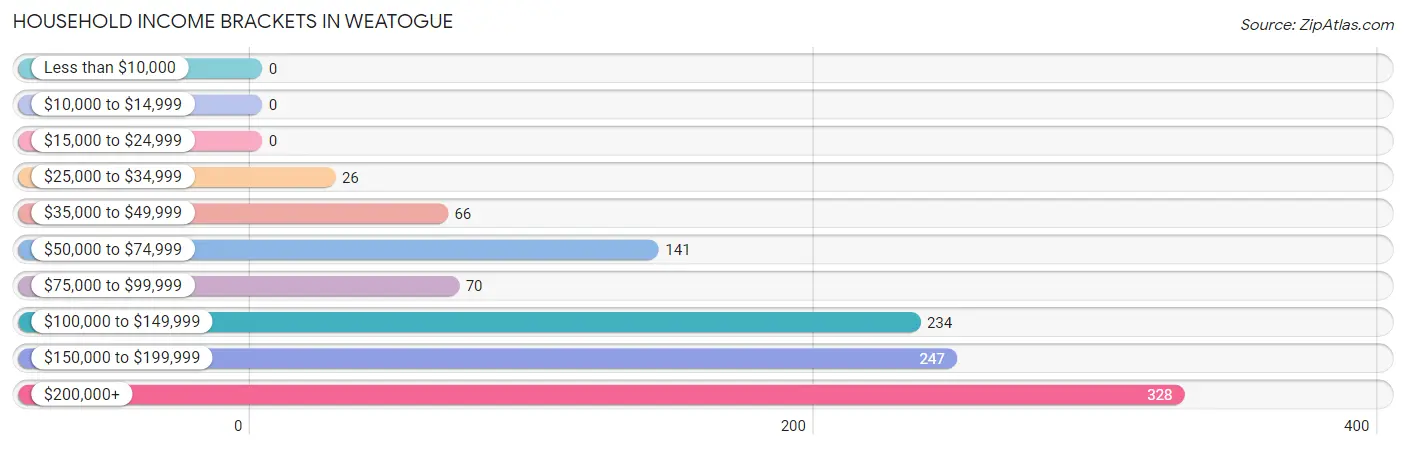
| Income Bracket | # Households | % Households |
| Less than $10,000 | 0 | 0.0% |
| $10,000 to $14,999 | 0 | 0.0% |
| $15,000 to $24,999 | 0 | 0.0% |
| $25,000 to $34,999 | 26 | 2.3% |
| $35,000 to $49,999 | 66 | 5.9% |
| $50,000 to $74,999 | 141 | 12.7% |
| $75,000 to $99,999 | 70 | 6.3% |
| $100,000 to $149,999 | 234 | 21.1% |
| $150,000 to $199,999 | 247 | 22.2% |
| $200,000+ | 328 | 29.5% |
Household Income by Householder Age in Weatogue
The median household income in Weatogue is $154,716, with the highest median household income of $187,411 found in the 45 to 64 years age bracket for the primary householder. A total of 323 households (29.1%) fall into this category.
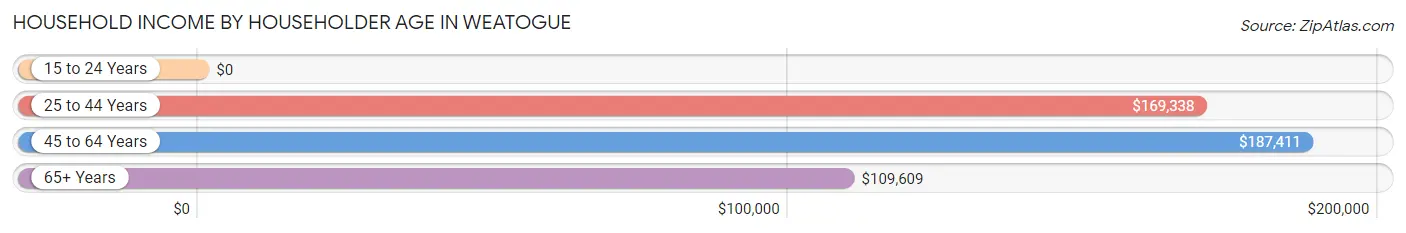
| Income Bracket | # Households | Median Income |
| 15 to 24 Years | 0 (0.0%) | $0 |
| 25 to 44 Years | 407 (36.6%) | $169,338 |
| 45 to 64 Years | 323 (29.1%) | $187,411 |
| 65+ Years | 381 (34.3%) | $109,609 |
| Total | 1,111 (100.0%) | $154,716 |
Poverty in Weatogue
Income Below Poverty by Sex and Age in Weatogue
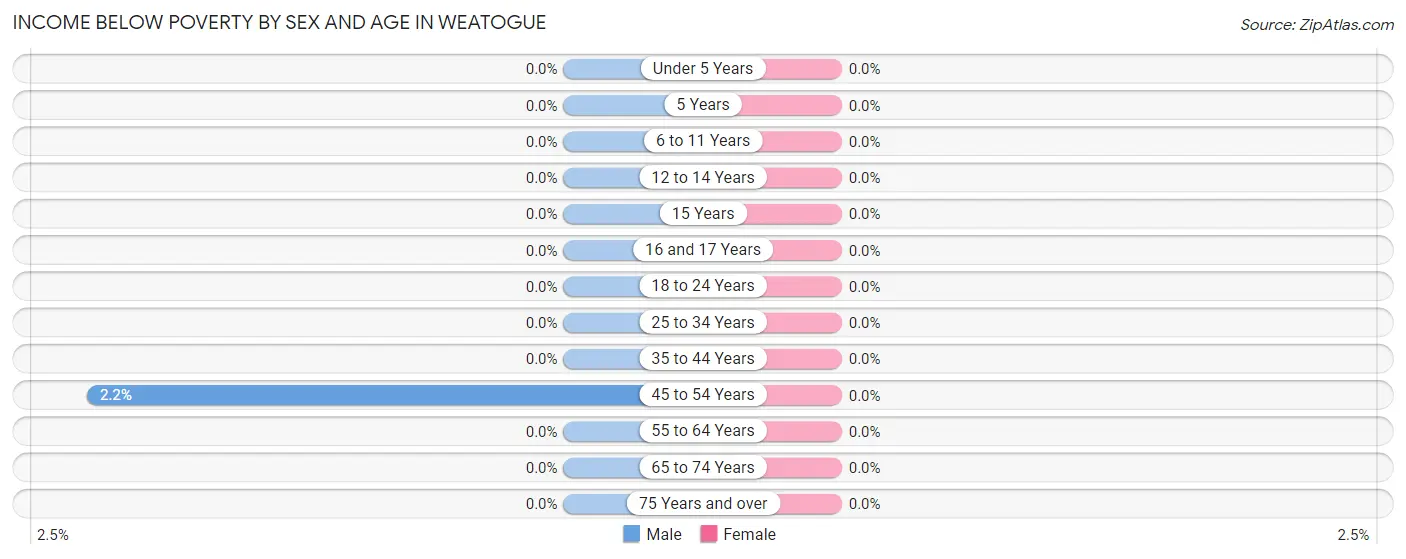
| Age Bracket | Male | Female |
| Under 5 Years | 0 (0.0%) | 0 (0.0%) |
| 5 Years | 0 (0.0%) | 0 (0.0%) |
| 6 to 11 Years | 0 (0.0%) | 0 (0.0%) |
| 12 to 14 Years | 0 (0.0%) | 0 (0.0%) |
| 15 Years | 0 (0.0%) | 0 (0.0%) |
| 16 and 17 Years | 0 (0.0%) | 0 (0.0%) |
| 18 to 24 Years | 0 (0.0%) | 0 (0.0%) |
| 25 to 34 Years | 0 (0.0%) | 0 (0.0%) |
| 35 to 44 Years | 0 (0.0%) | 0 (0.0%) |
| 45 to 54 Years | 3 (2.2%) | 0 (0.0%) |
| 55 to 64 Years | 0 (0.0%) | 0 (0.0%) |
| 65 to 74 Years | 0 (0.0%) | 0 (0.0%) |
| 75 Years and over | 0 (0.0%) | 0 (0.0%) |
| Total | 3 (0.2%) | 0 (0.0%) |
Income Above Poverty by Sex and Age in Weatogue
According to the poverty statistics in Weatogue, males aged under 5 years and females aged under 5 years are the age groups that are most secure financially, with 100.0% of males and 100.0% of females in these age groups living above the poverty line.
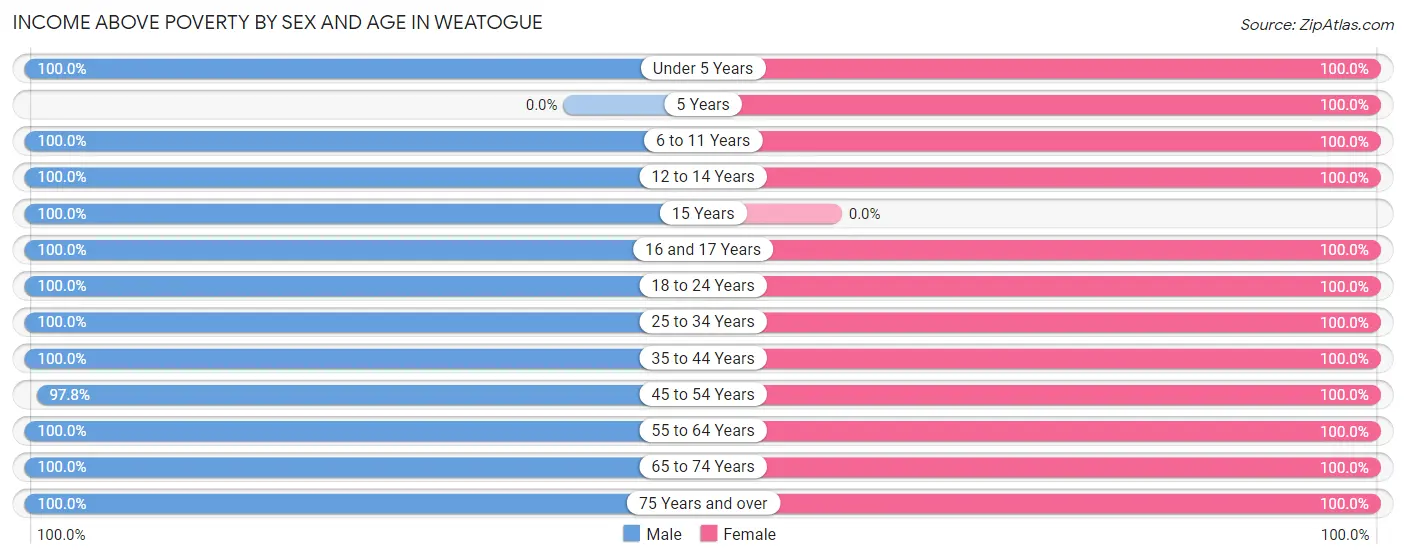
| Age Bracket | Male | Female |
| Under 5 Years | 100 (100.0%) | 104 (100.0%) |
| 5 Years | 0 (0.0%) | 8 (100.0%) |
| 6 to 11 Years | 154 (100.0%) | 75 (100.0%) |
| 12 to 14 Years | 26 (100.0%) | 48 (100.0%) |
| 15 Years | 9 (100.0%) | 0 (0.0%) |
| 16 and 17 Years | 24 (100.0%) | 42 (100.0%) |
| 18 to 24 Years | 20 (100.0%) | 40 (100.0%) |
| 25 to 34 Years | 177 (100.0%) | 182 (100.0%) |
| 35 to 44 Years | 244 (100.0%) | 233 (100.0%) |
| 45 to 54 Years | 133 (97.8%) | 82 (100.0%) |
| 55 to 64 Years | 183 (100.0%) | 241 (100.0%) |
| 65 to 74 Years | 143 (100.0%) | 122 (100.0%) |
| 75 Years and over | 133 (100.0%) | 130 (100.0%) |
| Total | 1,346 (99.8%) | 1,307 (100.0%) |
Income Below Poverty Among Married-Couple Families in Weatogue
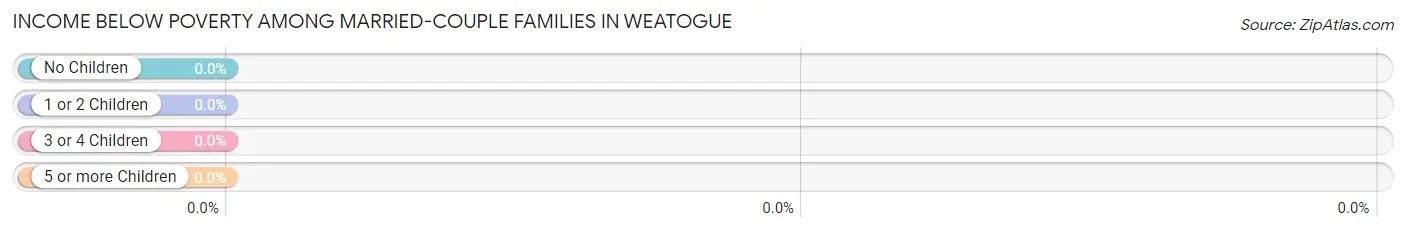
| Children | Above Poverty | Below Poverty |
| No Children | 402 (100.0%) | 0 (0.0%) |
| 1 or 2 Children | 278 (100.0%) | 0 (0.0%) |
| 3 or 4 Children | 14 (100.0%) | 0 (0.0%) |
| 5 or more Children | 0 (0.0%) | 0 (0.0%) |
| Total | 694 (100.0%) | 0 (0.0%) |
Income Below Poverty Among Single-Parent Households in Weatogue
| Children | Single Father | Single Mother |
| No Children | 0 (0.0%) | 0 (0.0%) |
| 1 or 2 Children | 0 (0.0%) | 0 (0.0%) |
| 3 or 4 Children | 0 (0.0%) | 0 (0.0%) |
| 5 or more Children | 0 (0.0%) | 0 (0.0%) |
| Total | 0 (0.0%) | 0 (0.0%) |
Income Below Poverty Among Married-Couple vs Single-Parent Households in Weatogue
| Children | Married-Couple Families | Single-Parent Households |
| No Children | 0 (0.0%) | 0 (0.0%) |
| 1 or 2 Children | 0 (0.0%) | 0 (0.0%) |
| 3 or 4 Children | 0 (0.0%) | 0 (0.0%) |
| 5 or more Children | 0 (0.0%) | 0 (0.0%) |
| Total | 0 (0.0%) | 0 (0.0%) |
Race in Weatogue
The most populous races in Weatogue are White / Caucasian (2,433 | 91.1%), Hispanic or Latino (206 | 7.7%), and Two or more Races (103 | 3.9%).
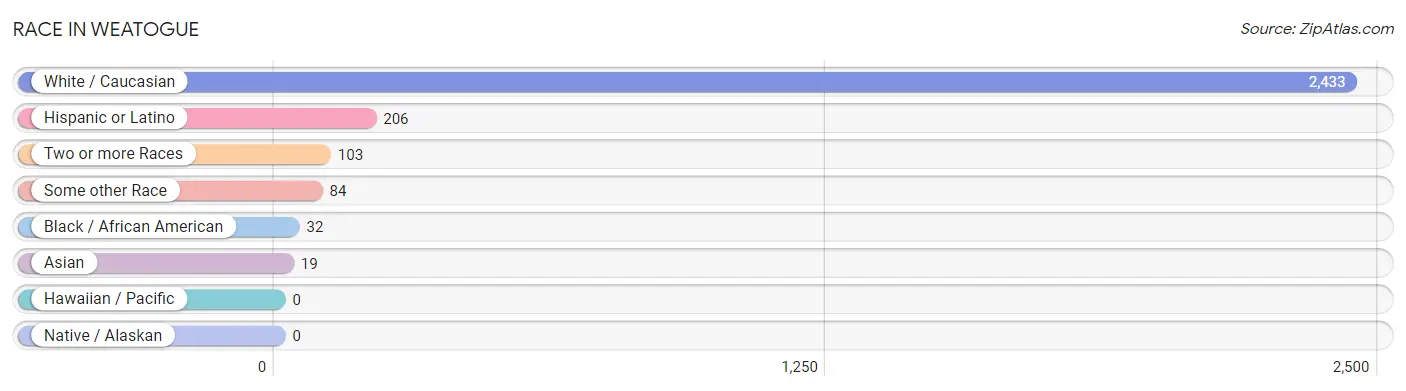
| Race | # Population | % Population |
| Asian | 19 | 0.7% |
| Black / African American | 32 | 1.2% |
| Hawaiian / Pacific | 0 | 0.0% |
| Hispanic or Latino | 206 | 7.7% |
| Native / Alaskan | 0 | 0.0% |
| White / Caucasian | 2,433 | 91.1% |
| Two or more Races | 103 | 3.9% |
| Some other Race | 84 | 3.1% |
| Total | 2,671 | 100.0% |
Ancestry in Weatogue
The most populous ancestries reported in Weatogue are Irish (555 | 20.8%), English (435 | 16.3%), Italian (432 | 16.2%), German (398 | 14.9%), and Polish (226 | 8.5%), together accounting for 76.6% of all Weatogue residents.
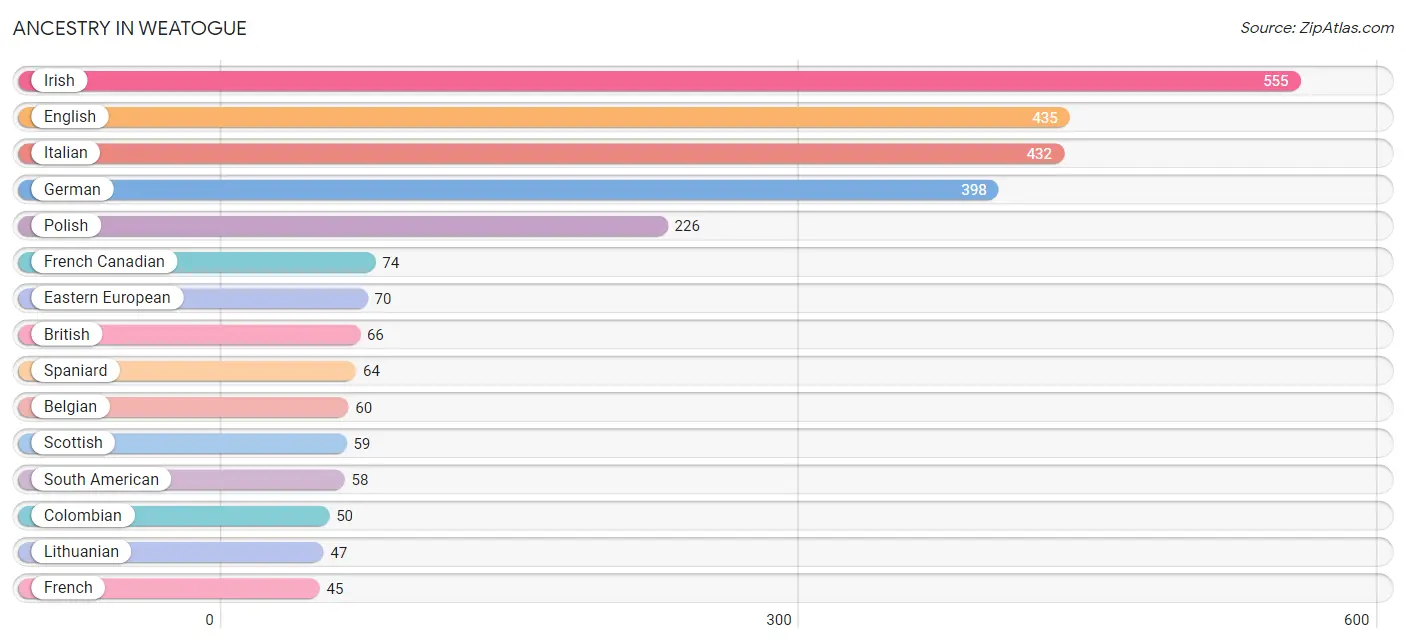
| Ancestry | # Population | % Population |
| African | 3 | 0.1% |
| American | 23 | 0.9% |
| Argentinean | 8 | 0.3% |
| Armenian | 11 | 0.4% |
| Austrian | 18 | 0.7% |
| Belgian | 60 | 2.2% |
| Bhutanese | 19 | 0.7% |
| Brazilian | 11 | 0.4% |
| British | 66 | 2.5% |
| Canadian | 20 | 0.7% |
| Colombian | 50 | 1.9% |
| Danish | 14 | 0.5% |
| Dominican | 12 | 0.4% |
| Dutch | 38 | 1.4% |
| Eastern European | 70 | 2.6% |
| English | 435 | 16.3% |
| European | 18 | 0.7% |
| French | 45 | 1.7% |
| French Canadian | 74 | 2.8% |
| German | 398 | 14.9% |
| Hungarian | 9 | 0.3% |
| Irish | 555 | 20.8% |
| Italian | 432 | 16.2% |
| Jamaican | 2 | 0.1% |
| Latvian | 36 | 1.3% |
| Lithuanian | 47 | 1.8% |
| Mexican | 43 | 1.6% |
| Norwegian | 23 | 0.9% |
| Polish | 226 | 8.5% |
| Portuguese | 32 | 1.2% |
| Pueblo | 38 | 1.4% |
| Puerto Rican | 3 | 0.1% |
| Russian | 40 | 1.5% |
| Scotch-Irish | 20 | 0.7% |
| Scottish | 59 | 2.2% |
| South African | 32 | 1.2% |
| South American | 58 | 2.2% |
| Spaniard | 64 | 2.4% |
| Spanish | 26 | 1.0% |
| Subsaharan African | 35 | 1.3% |
| Swiss | 40 | 1.5% |
| Welsh | 21 | 0.8% | View All 42 Rows |
Immigrants in Weatogue
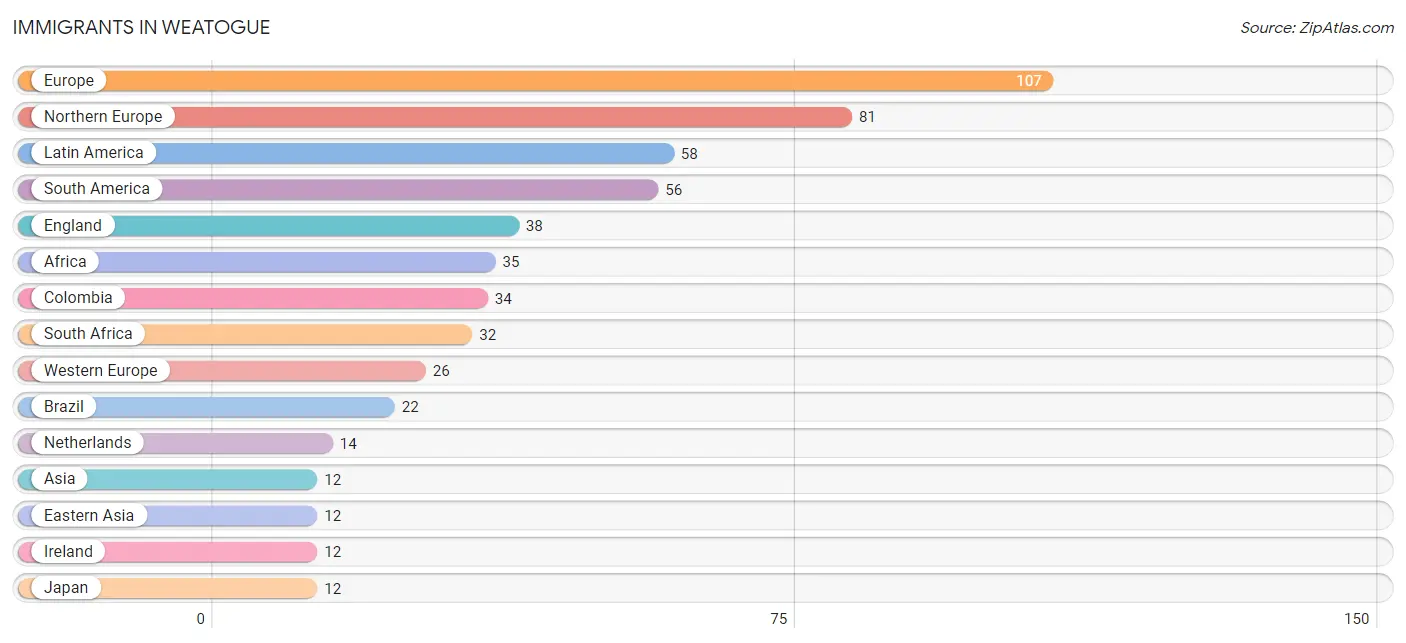
The most numerous immigrant groups reported in Weatogue came from Europe (107 | 4.0%), Northern Europe (81 | 3.0%), Latin America (58 | 2.2%), South America (56 | 2.1%), and England (38 | 1.4%), together accounting for 12.7% of all Weatogue residents.
| Immigration Origin | # Population | % Population |
| Africa | 35 | 1.3% |
| Asia | 12 | 0.4% |
| Austria | 8 | 0.3% |
| Brazil | 22 | 0.8% |
| Caribbean | 2 | 0.1% |
| Colombia | 34 | 1.3% |
| Eastern Asia | 12 | 0.4% |
| England | 38 | 1.4% |
| Europe | 107 | 4.0% |
| Germany | 4 | 0.2% |
| Ireland | 12 | 0.4% |
| Jamaica | 2 | 0.1% |
| Japan | 12 | 0.4% |
| Latin America | 58 | 2.2% |
| Netherlands | 14 | 0.5% |
| Northern Europe | 81 | 3.0% |
| South Africa | 32 | 1.2% |
| South America | 56 | 2.1% |
| Western Europe | 26 | 1.0% | View All 19 Rows |
Sex and Age in Weatogue
Sex and Age in Weatogue
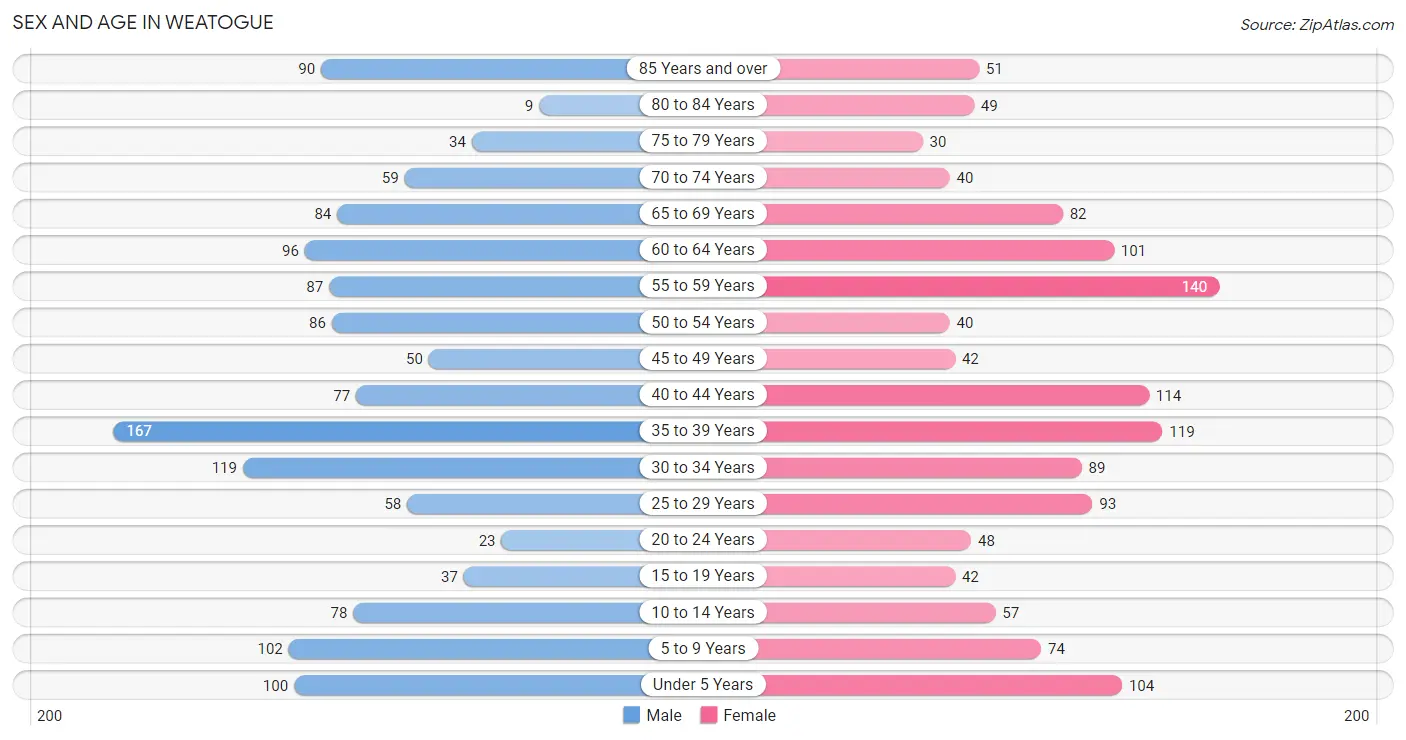
The most populous age groups in Weatogue are 35 to 39 Years (167 | 12.3%) for men and 55 to 59 Years (140 | 10.6%) for women.
| Age Bracket | Male | Female |
| Under 5 Years | 100 (7.4%) | 104 (7.9%) |
| 5 to 9 Years | 102 (7.5%) | 74 (5.6%) |
| 10 to 14 Years | 78 (5.8%) | 57 (4.3%) |
| 15 to 19 Years | 37 (2.7%) | 42 (3.2%) |
| 20 to 24 Years | 23 (1.7%) | 48 (3.6%) |
| 25 to 29 Years | 58 (4.3%) | 93 (7.1%) |
| 30 to 34 Years | 119 (8.8%) | 89 (6.8%) |
| 35 to 39 Years | 167 (12.3%) | 119 (9.0%) |
| 40 to 44 Years | 77 (5.7%) | 114 (8.7%) |
| 45 to 49 Years | 50 (3.7%) | 42 (3.2%) |
| 50 to 54 Years | 86 (6.3%) | 40 (3.0%) |
| 55 to 59 Years | 87 (6.4%) | 140 (10.6%) |
| 60 to 64 Years | 96 (7.1%) | 101 (7.7%) |
| 65 to 69 Years | 84 (6.2%) | 82 (6.2%) |
| 70 to 74 Years | 59 (4.3%) | 40 (3.0%) |
| 75 to 79 Years | 34 (2.5%) | 30 (2.3%) |
| 80 to 84 Years | 9 (0.7%) | 49 (3.7%) |
| 85 Years and over | 90 (6.6%) | 51 (3.9%) |
| Total | 1,356 (100.0%) | 1,315 (100.0%) |
Families and Households in Weatogue
Median Family Size in Weatogue
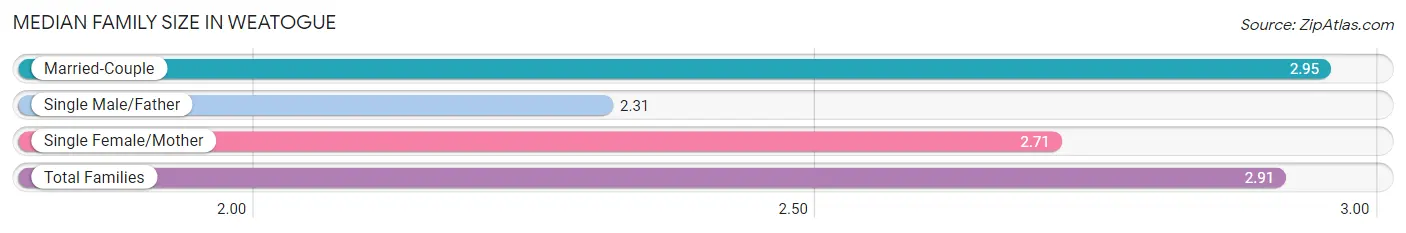
The median family size in Weatogue is 2.91 persons per family, with married-couple families (694 | 87.3%) accounting for the largest median family size of 2.95 persons per family. On the other hand, single male/father families (32 | 4.0%) represent the smallest median family size with 2.31 persons per family.
| Family Type | # Families | Family Size |
| Married-Couple | 694 (87.3%) | 2.95 |
| Single Male/Father | 32 (4.0%) | 2.31 |
| Single Female/Mother | 69 (8.7%) | 2.71 |
| Total Families | 795 (100.0%) | 2.91 |
Median Household Size in Weatogue
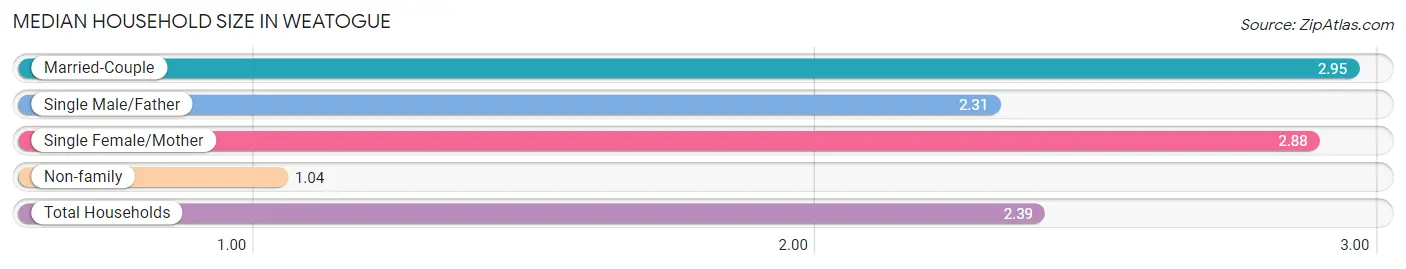
The median household size in Weatogue is 2.39 persons per household, with married-couple households (694 | 62.5%) accounting for the largest median household size of 2.95 persons per household. non-family households (316 | 28.4%) represent the smallest median household size with 1.04 persons per household.
| Household Type | # Households | Household Size |
| Married-Couple | 694 (62.5%) | 2.95 |
| Single Male/Father | 32 (2.9%) | 2.31 |
| Single Female/Mother | 69 (6.2%) | 2.88 |
| Non-family | 316 (28.4%) | 1.04 |
| Total Households | 1,111 (100.0%) | 2.39 |
Household Size by Marriage Status in Weatogue
Out of a total of 1,111 households in Weatogue, 795 (71.6%) are family households, while 316 (28.4%) are nonfamily households. The most numerous type of family households are 2-person households, comprising 374, and the most common type of nonfamily households are 1-person households, comprising 302.
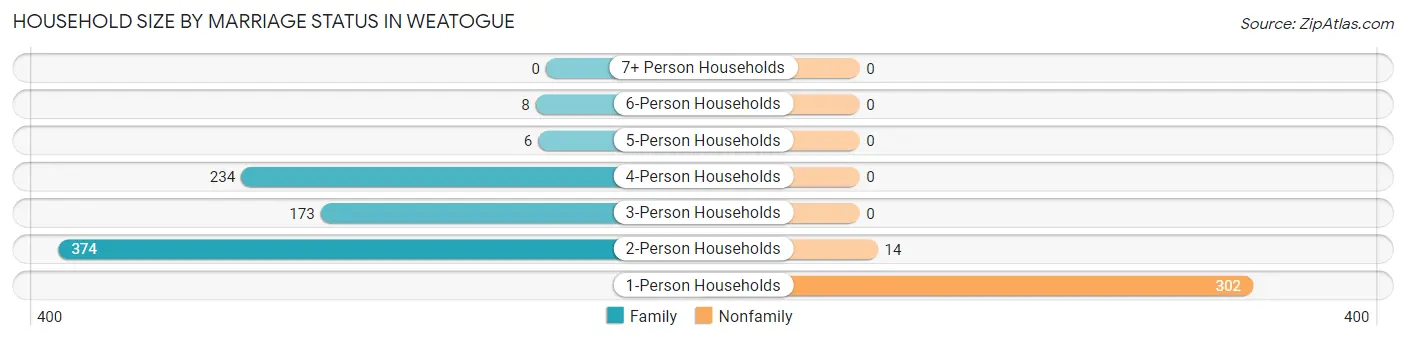
| Household Size | Family Households | Nonfamily Households |
| 1-Person Households | - | 302 (27.2%) |
| 2-Person Households | 374 (33.7%) | 14 (1.3%) |
| 3-Person Households | 173 (15.6%) | 0 (0.0%) |
| 4-Person Households | 234 (21.1%) | 0 (0.0%) |
| 5-Person Households | 6 (0.5%) | 0 (0.0%) |
| 6-Person Households | 8 (0.7%) | 0 (0.0%) |
| 7+ Person Households | 0 (0.0%) | 0 (0.0%) |
| Total | 795 (71.6%) | 316 (28.4%) |
Female Fertility in Weatogue
Fertility by Age in Weatogue
Average fertility rate in Weatogue is 38.0 births per 1,000 women. Women in the age bracket of 20 to 34 years have the highest fertility rate with 43.0 births per 1,000 women. Women in the age bracket of 35 to 50 years acount for 54.5% of all women with births.
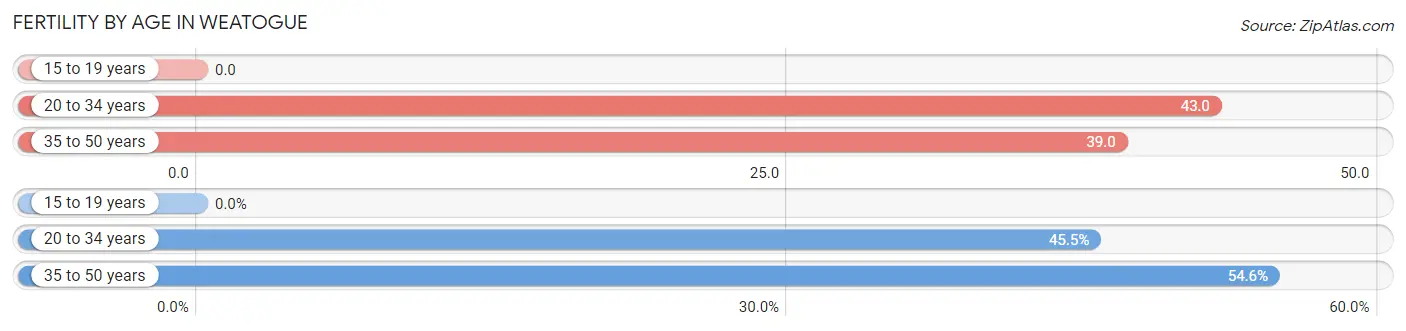
| Age Bracket | Women with Births | Births / 1,000 Women |
| 15 to 19 years | 0 (0.0%) | 0.0 |
| 20 to 34 years | 10 (45.5%) | 43.0 |
| 35 to 50 years | 12 (54.5%) | 39.0 |
| Total | 22 (100.0%) | 38.0 |
Fertility by Age by Marriage Status in Weatogue
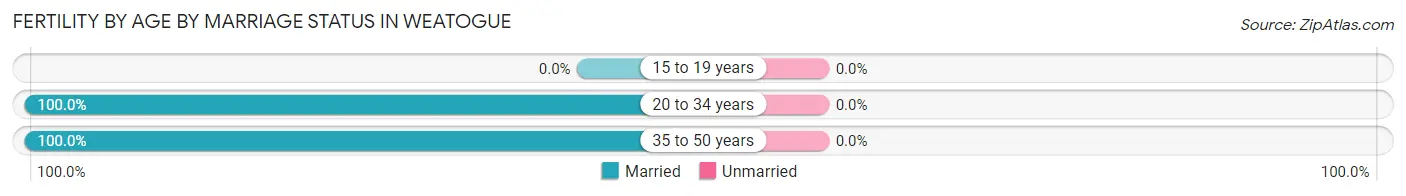
| Age Bracket | Married | Unmarried |
| 15 to 19 years | 0 (0.0%) | 0 (0.0%) |
| 20 to 34 years | 10 (100.0%) | 0 (0.0%) |
| 35 to 50 years | 12 (100.0%) | 0 (0.0%) |
| Total | 22 (100.0%) | 0 (0.0%) |
Fertility by Education in Weatogue
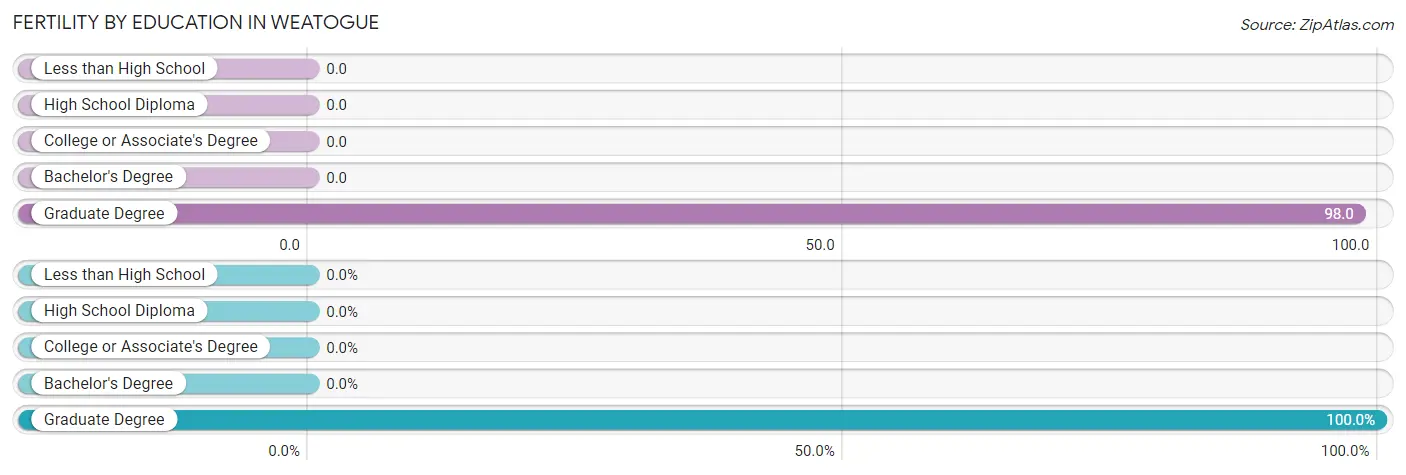
| Educational Attainment | Women with Births | Births / 1,000 Women |
| Less than High School | 0 (0.0%) | 0.0 |
| High School Diploma | 0 (0.0%) | 0.0 |
| College or Associate's Degree | 0 (0.0%) | 0.0 |
| Bachelor's Degree | 0 (0.0%) | 0.0 |
| Graduate Degree | 22 (100.0%) | 98.0 |
| Total | 22 (100.0%) | 38.0 |
Fertility by Education by Marriage Status in Weatogue
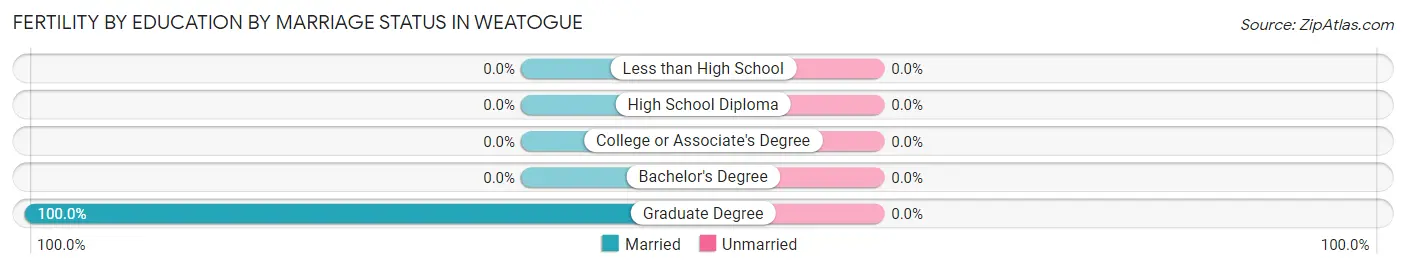
| Educational Attainment | Married | Unmarried |
| Less than High School | 0 (0.0%) | 0 (0.0%) |
| High School Diploma | 0 (0.0%) | 0 (0.0%) |
| College or Associate's Degree | 0 (0.0%) | 0 (0.0%) |
| Bachelor's Degree | 0 (0.0%) | 0 (0.0%) |
| Graduate Degree | 22 (100.0%) | 0 (0.0%) |
| Total | 22 (100.0%) | 0 (0.0%) |
Employment Characteristics in Weatogue
Employment by Class of Employer in Weatogue
Among the 1,476 employed individuals in Weatogue, private company employees (880 | 59.6%), not-for-profit organizations (161 | 10.9%), and self-employed (not incorporated) (150 | 10.2%) make up the most common classes of employment.
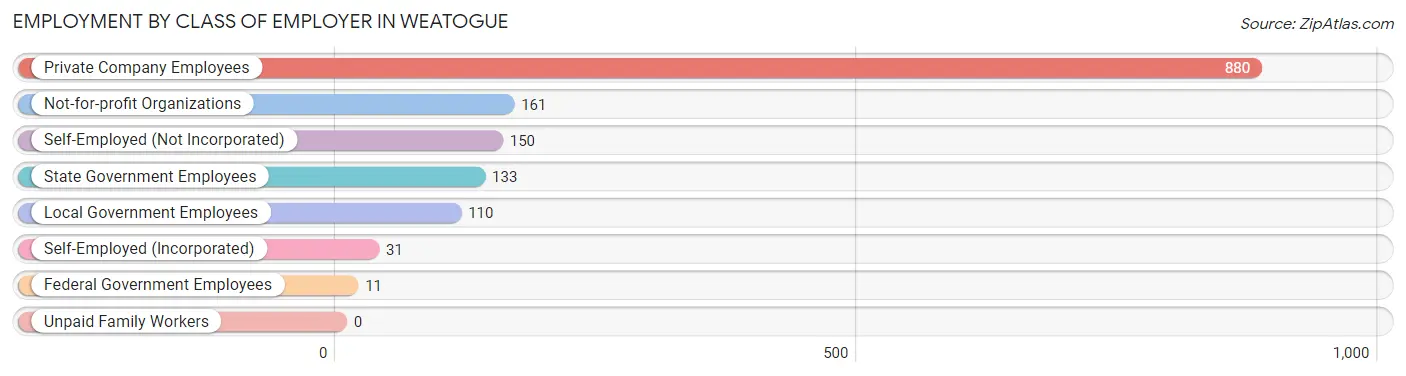
| Employer Class | # Employees | % Employees |
| Private Company Employees | 880 | 59.6% |
| Self-Employed (Incorporated) | 31 | 2.1% |
| Self-Employed (Not Incorporated) | 150 | 10.2% |
| Not-for-profit Organizations | 161 | 10.9% |
| Local Government Employees | 110 | 7.4% |
| State Government Employees | 133 | 9.0% |
| Federal Government Employees | 11 | 0.7% |
| Unpaid Family Workers | 0 | 0.0% |
| Total | 1,476 | 100.0% |
Employment Status by Age in Weatogue
According to the labor force statistics for Weatogue, out of the total population over 16 years of age (2,147), 69.3% or 1,488 individuals are in the labor force, with 0.7% or 10 of them unemployed. The age group with the highest labor force participation rate is 45 to 54 years, with 98.2% or 214 individuals in the labor force. Within the labor force, the 35 to 44 years age range has the highest percentage of unemployed individuals, with 1.8% or 8 of them being unemployed.
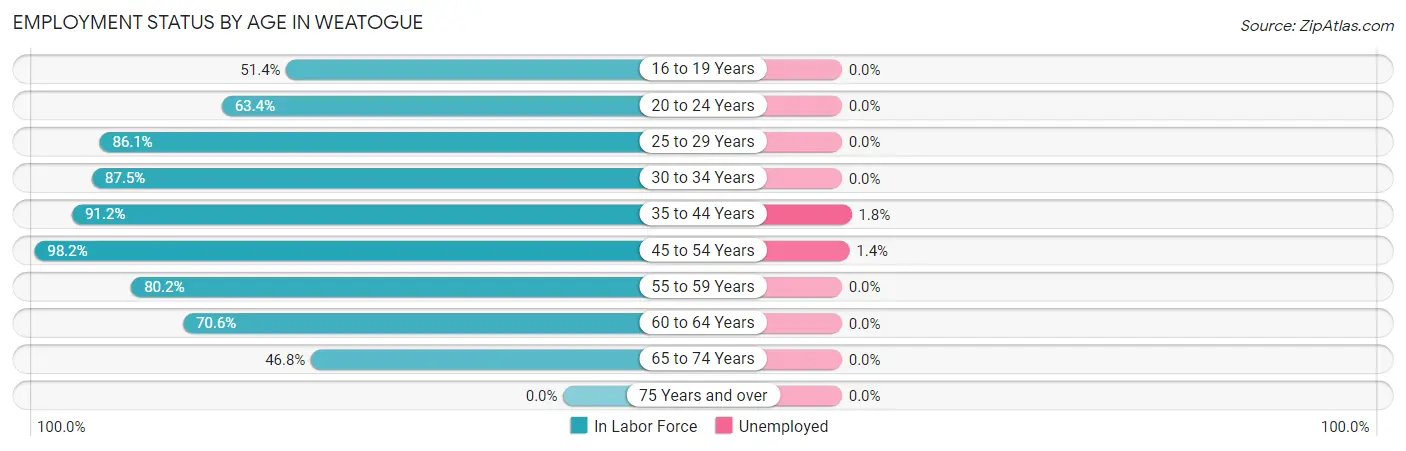
| Age Bracket | In Labor Force | Unemployed |
| 16 to 19 Years | 36 (51.4%) | 0 (0.0%) |
| 20 to 24 Years | 45 (63.4%) | 0 (0.0%) |
| 25 to 29 Years | 130 (86.1%) | 0 (0.0%) |
| 30 to 34 Years | 182 (87.5%) | 0 (0.0%) |
| 35 to 44 Years | 435 (91.2%) | 8 (1.8%) |
| 45 to 54 Years | 214 (98.2%) | 3 (1.4%) |
| 55 to 59 Years | 182 (80.2%) | 0 (0.0%) |
| 60 to 64 Years | 139 (70.6%) | 0 (0.0%) |
| 65 to 74 Years | 124 (46.8%) | 0 (0.0%) |
| 75 Years and over | 0 (0.0%) | 0 (0.0%) |
| Total | 1,488 (69.3%) | 10 (0.7%) |
Employment Status by Educational Attainment in Weatogue
According to labor force statistics for Weatogue, 86.7% of individuals (1,281) out of the total population between 25 and 64 years of age (1,478) are in the labor force, with 0.9% or 12 of them being unemployed. The group with the highest labor force participation rate are those with the educational attainment of bachelor's degree or higher, with 91.8% or 1,039 individuals in the labor force. Within the labor force, individuals with high school diploma education have the highest percentage of unemployment, with 4.2% or 3 of them being unemployed.
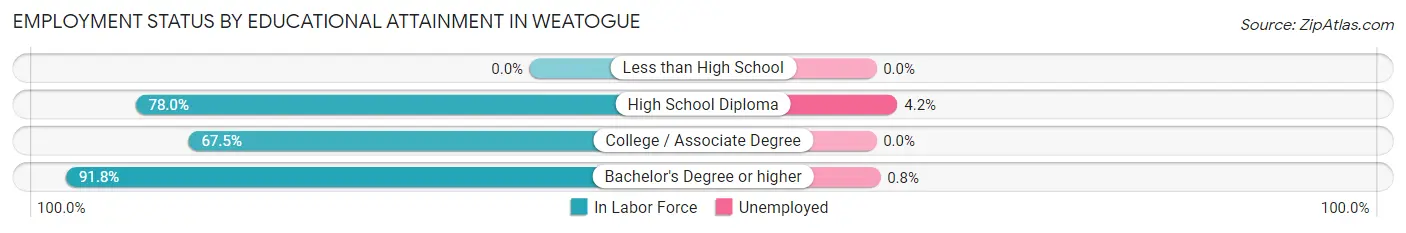
| Educational Attainment | In Labor Force | Unemployed |
| Less than High School | 0 (0.0%) | 0 (0.0%) |
| High School Diploma | 71 (78.0%) | 4 (4.2%) |
| College / Associate Degree | 172 (67.5%) | 0 (0.0%) |
| Bachelor's Degree or higher | 1,039 (91.8%) | 9 (0.8%) |
| Total | 1,281 (86.7%) | 13 (0.9%) |
Employment Occupations by Sex in Weatogue
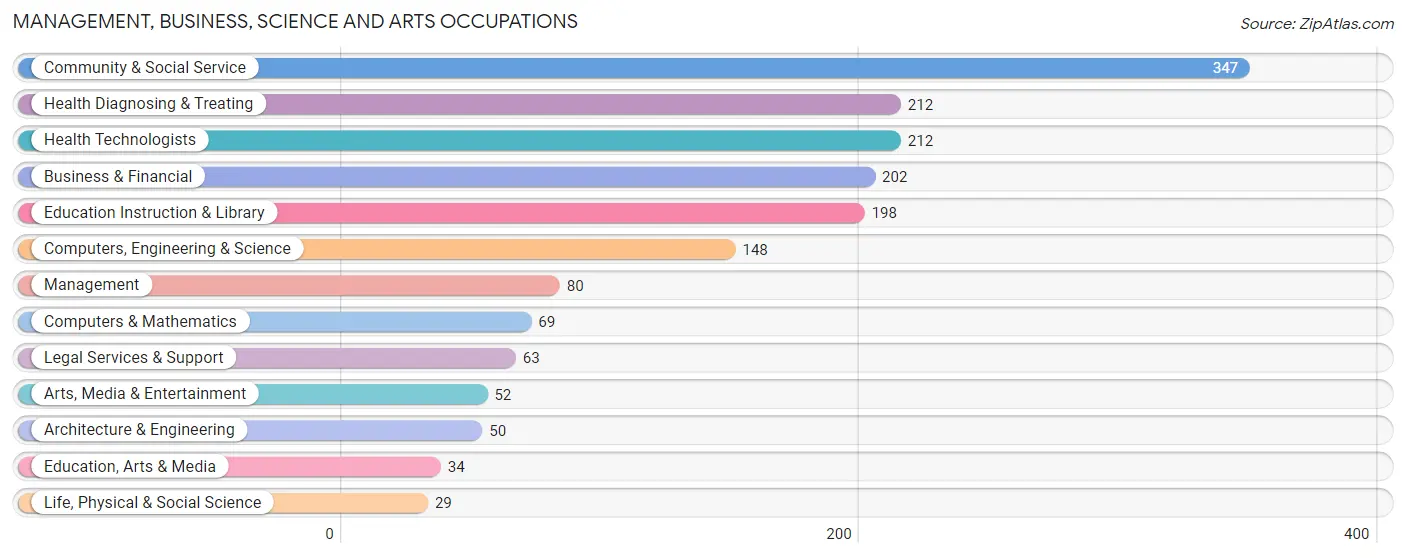
Management, Business, Science and Arts Occupations
The most common Management, Business, Science and Arts occupations in Weatogue are Community & Social Service (347 | 23.5%), Health Diagnosing & Treating (212 | 14.4%), Health Technologists (212 | 14.4%), Business & Financial (202 | 13.7%), and Education Instruction & Library (198 | 13.4%).
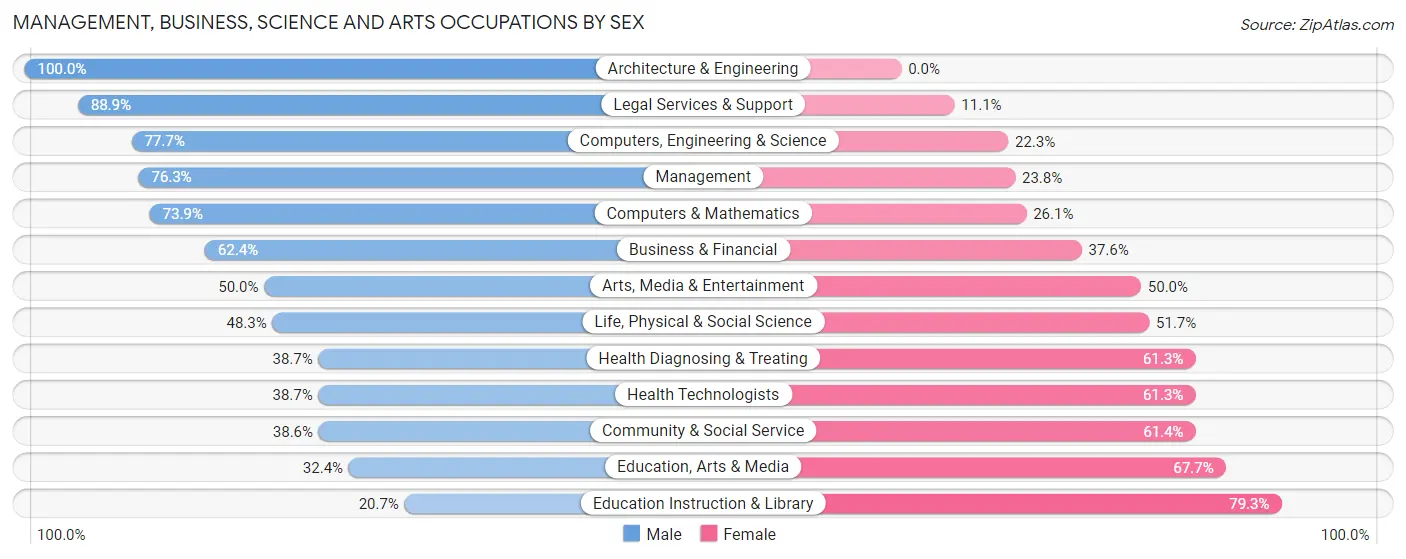
Management, Business, Science and Arts Occupations by Sex
Within the Management, Business, Science and Arts occupations in Weatogue, the most male-oriented occupations are Architecture & Engineering (100.0%), Legal Services & Support (88.9%), and Computers, Engineering & Science (77.7%), while the most female-oriented occupations are Education Instruction & Library (79.3%), Education, Arts & Media (67.6%), and Community & Social Service (61.4%).
| Occupation | Male | Female |
| Management | 61 (76.2%) | 19 (23.7%) |
| Business & Financial | 126 (62.4%) | 76 (37.6%) |
| Computers, Engineering & Science | 115 (77.7%) | 33 (22.3%) |
| Computers & Mathematics | 51 (73.9%) | 18 (26.1%) |
| Architecture & Engineering | 50 (100.0%) | 0 (0.0%) |
| Life, Physical & Social Science | 14 (48.3%) | 15 (51.7%) |
| Community & Social Service | 134 (38.6%) | 213 (61.4%) |
| Education, Arts & Media | 11 (32.4%) | 23 (67.6%) |
| Legal Services & Support | 56 (88.9%) | 7 (11.1%) |
| Education Instruction & Library | 41 (20.7%) | 157 (79.3%) |
| Arts, Media & Entertainment | 26 (50.0%) | 26 (50.0%) |
| Health Diagnosing & Treating | 82 (38.7%) | 130 (61.3%) |
| Health Technologists | 82 (38.7%) | 130 (61.3%) |
| Total (Category) | 518 (52.4%) | 471 (47.6%) |
| Total (Overall) | 777 (52.6%) | 699 (47.4%) |
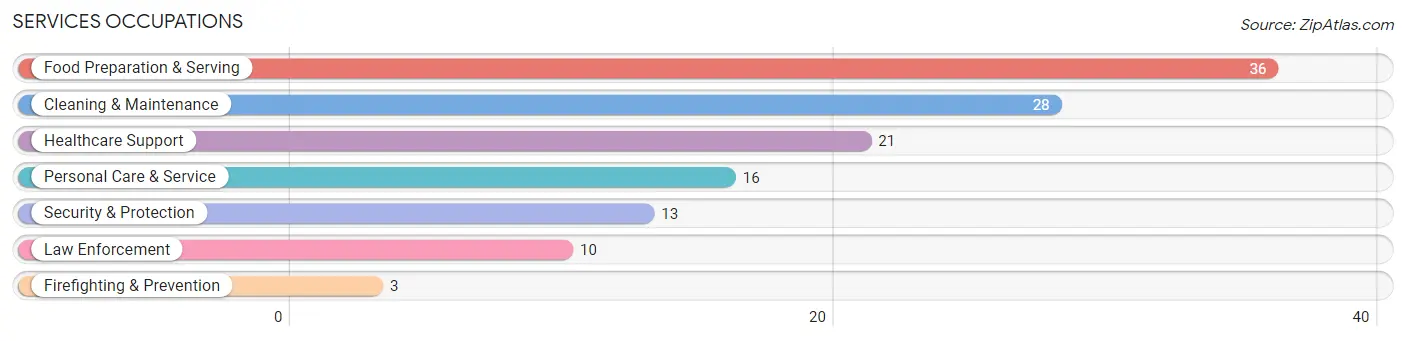
Services Occupations
The most common Services occupations in Weatogue are Food Preparation & Serving (36 | 2.4%), Cleaning & Maintenance (28 | 1.9%), Healthcare Support (21 | 1.4%), Personal Care & Service (16 | 1.1%), and Security & Protection (13 | 0.9%).
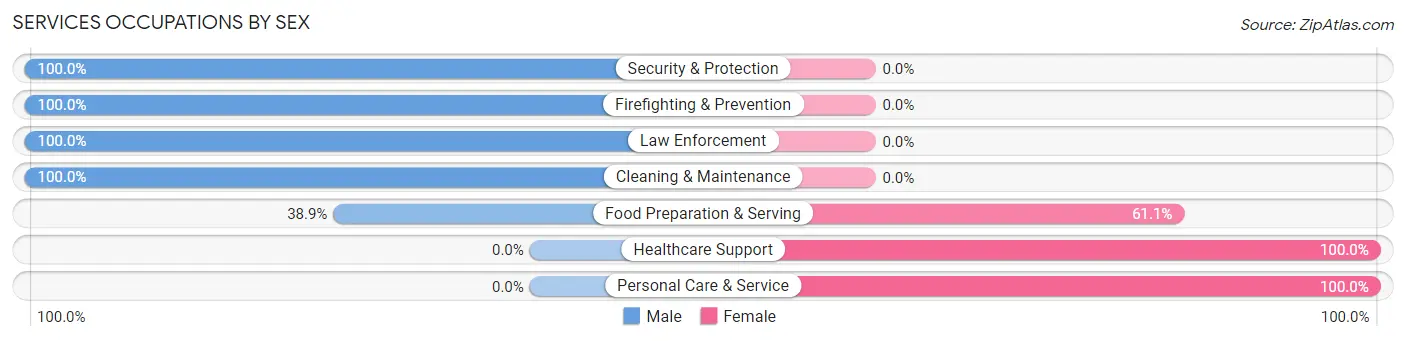
Services Occupations by Sex
Within the Services occupations in Weatogue, the most male-oriented occupations are Security & Protection (100.0%), Firefighting & Prevention (100.0%), and Law Enforcement (100.0%), while the most female-oriented occupations are Healthcare Support (100.0%), Personal Care & Service (100.0%), and Food Preparation & Serving (61.1%).
| Occupation | Male | Female |
| Healthcare Support | 0 (0.0%) | 21 (100.0%) |
| Security & Protection | 13 (100.0%) | 0 (0.0%) |
| Firefighting & Prevention | 3 (100.0%) | 0 (0.0%) |
| Law Enforcement | 10 (100.0%) | 0 (0.0%) |
| Food Preparation & Serving | 14 (38.9%) | 22 (61.1%) |
| Cleaning & Maintenance | 28 (100.0%) | 0 (0.0%) |
| Personal Care & Service | 0 (0.0%) | 16 (100.0%) |
| Total (Category) | 55 (48.2%) | 59 (51.7%) |
| Total (Overall) | 777 (52.6%) | 699 (47.4%) |
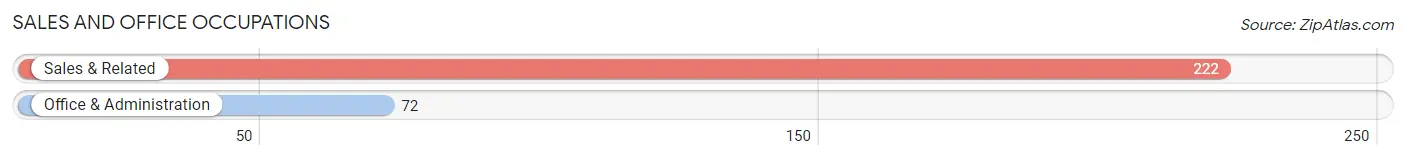
Sales and Office Occupations
The most common Sales and Office occupations in Weatogue are Sales & Related (222 | 15.0%), and Office & Administration (72 | 4.9%).
Sales and Office Occupations by Sex
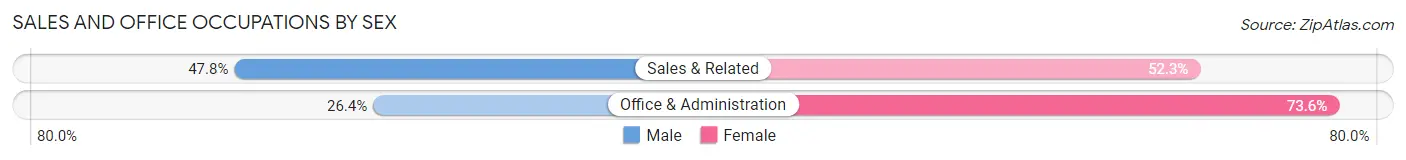
| Occupation | Male | Female |
| Sales & Related | 106 (47.7%) | 116 (52.2%) |
| Office & Administration | 19 (26.4%) | 53 (73.6%) |
| Total (Category) | 125 (42.5%) | 169 (57.5%) |
| Total (Overall) | 777 (52.6%) | 699 (47.4%) |
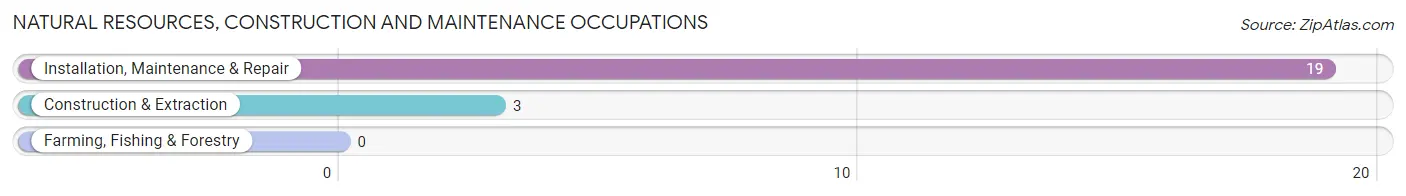
Natural Resources, Construction and Maintenance Occupations
The most common Natural Resources, Construction and Maintenance occupations in Weatogue are Installation, Maintenance & Repair (19 | 1.3%), and Construction & Extraction (3 | 0.2%).
Natural Resources, Construction and Maintenance Occupations by Sex
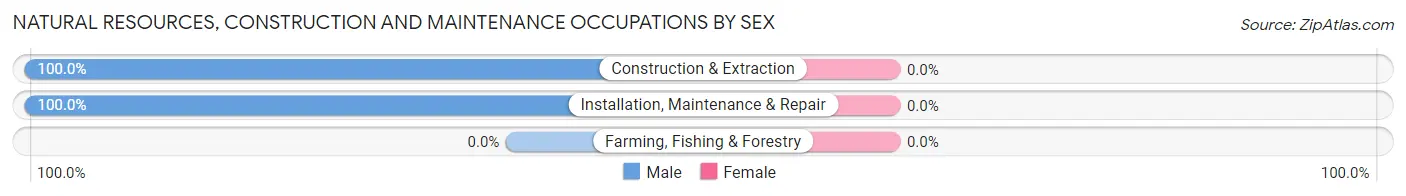
| Occupation | Male | Female |
| Farming, Fishing & Forestry | 0 (0.0%) | 0 (0.0%) |
| Construction & Extraction | 3 (100.0%) | 0 (0.0%) |
| Installation, Maintenance & Repair | 19 (100.0%) | 0 (0.0%) |
| Total (Category) | 22 (100.0%) | 0 (0.0%) |
| Total (Overall) | 777 (52.6%) | 699 (47.4%) |
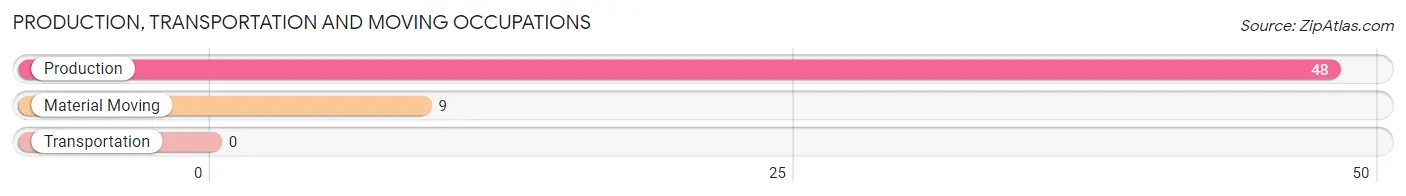
Production, Transportation and Moving Occupations
The most common Production, Transportation and Moving occupations in Weatogue are Production (48 | 3.3%), and Material Moving (9 | 0.6%).
Production, Transportation and Moving Occupations by Sex
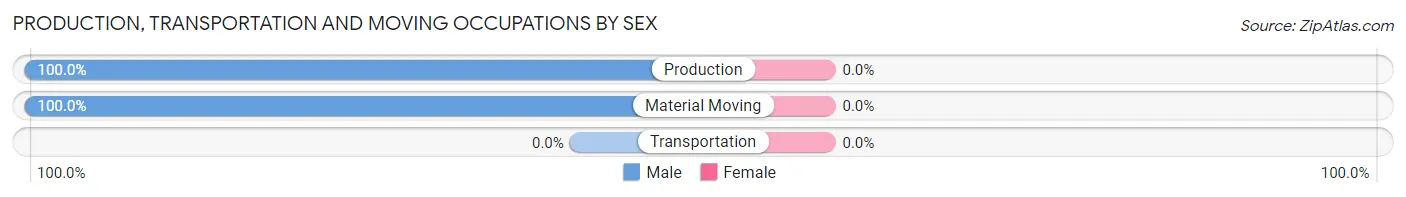
| Occupation | Male | Female |
| Production | 48 (100.0%) | 0 (0.0%) |
| Transportation | 0 (0.0%) | 0 (0.0%) |
| Material Moving | 9 (100.0%) | 0 (0.0%) |
| Total (Category) | 57 (100.0%) | 0 (0.0%) |
| Total (Overall) | 777 (52.6%) | 699 (47.4%) |
Employment Industries by Sex in Weatogue
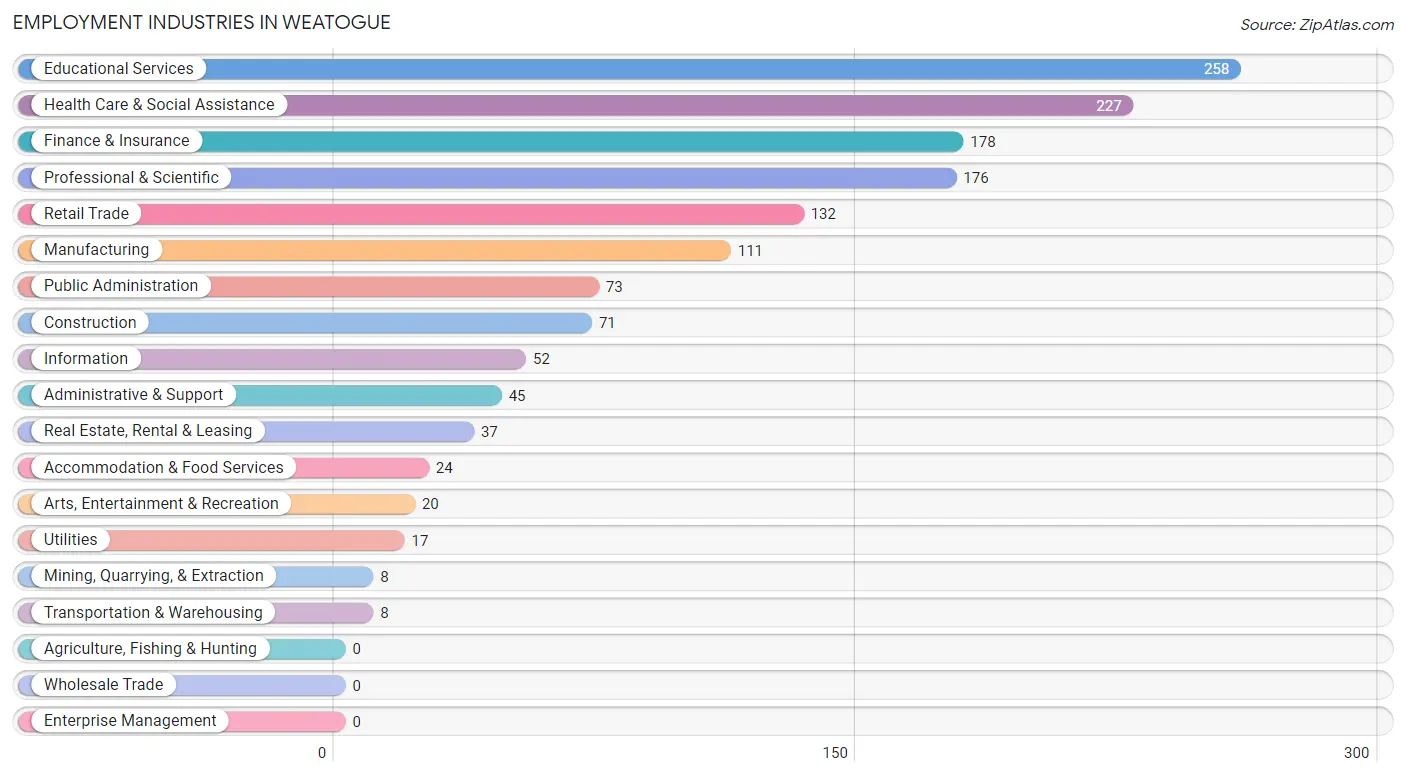
Employment Industries in Weatogue
The major employment industries in Weatogue include Educational Services (258 | 17.5%), Health Care & Social Assistance (227 | 15.4%), Finance & Insurance (178 | 12.1%), Professional & Scientific (176 | 11.9%), and Retail Trade (132 | 8.9%).
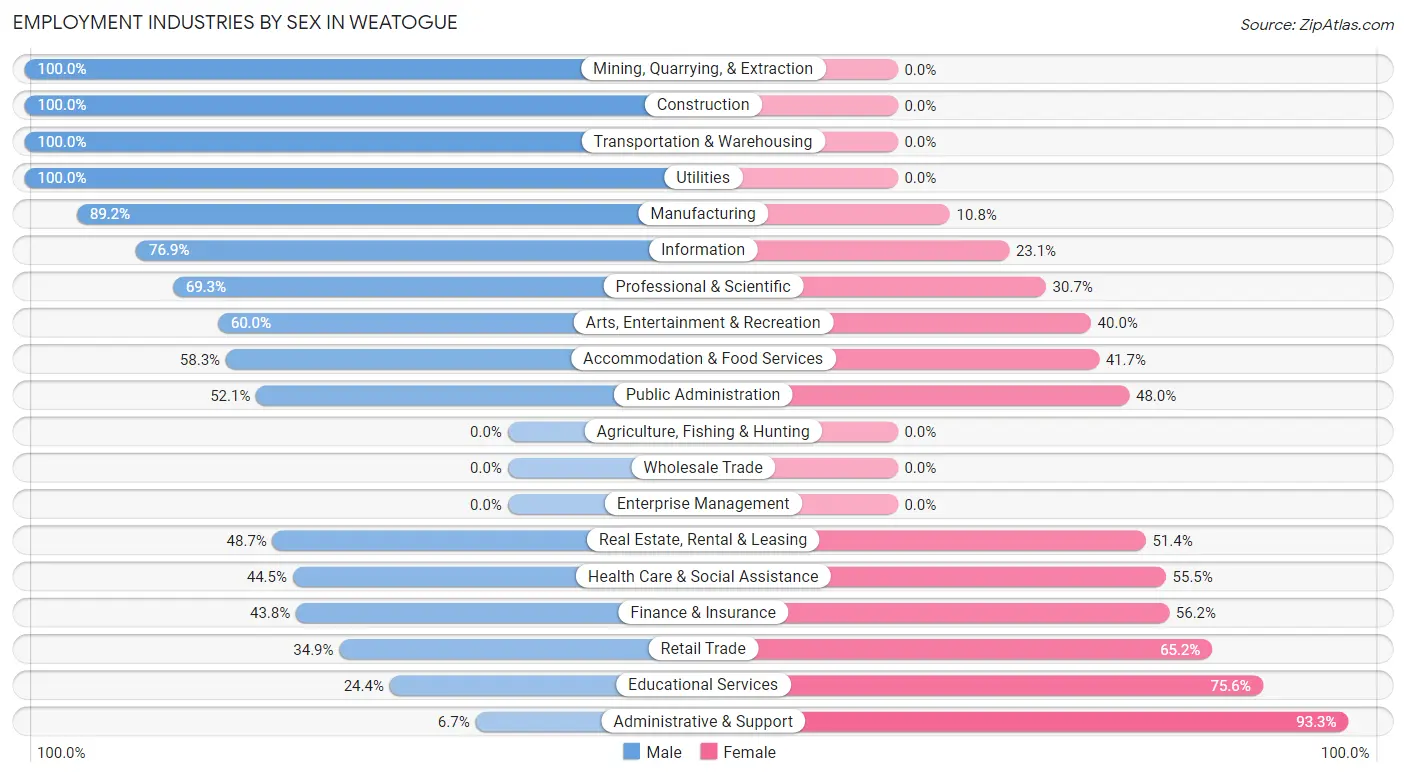
Employment Industries by Sex in Weatogue
The Weatogue industries that see more men than women are Mining, Quarrying, & Extraction (100.0%), Construction (100.0%), and Transportation & Warehousing (100.0%), whereas the industries that tend to have a higher number of women are Administrative & Support (93.3%), Educational Services (75.6%), and Retail Trade (65.1%).
| Industry | Male | Female |
| Agriculture, Fishing & Hunting | 0 (0.0%) | 0 (0.0%) |
| Mining, Quarrying, & Extraction | 8 (100.0%) | 0 (0.0%) |
| Construction | 71 (100.0%) | 0 (0.0%) |
| Manufacturing | 99 (89.2%) | 12 (10.8%) |
| Wholesale Trade | 0 (0.0%) | 0 (0.0%) |
| Retail Trade | 46 (34.8%) | 86 (65.1%) |
| Transportation & Warehousing | 8 (100.0%) | 0 (0.0%) |
| Utilities | 17 (100.0%) | 0 (0.0%) |
| Information | 40 (76.9%) | 12 (23.1%) |
| Finance & Insurance | 78 (43.8%) | 100 (56.2%) |
| Real Estate, Rental & Leasing | 18 (48.6%) | 19 (51.3%) |
| Professional & Scientific | 122 (69.3%) | 54 (30.7%) |
| Enterprise Management | 0 (0.0%) | 0 (0.0%) |
| Administrative & Support | 3 (6.7%) | 42 (93.3%) |
| Educational Services | 63 (24.4%) | 195 (75.6%) |
| Health Care & Social Assistance | 101 (44.5%) | 126 (55.5%) |
| Arts, Entertainment & Recreation | 12 (60.0%) | 8 (40.0%) |
| Accommodation & Food Services | 14 (58.3%) | 10 (41.7%) |
| Public Administration | 38 (52.0%) | 35 (47.9%) |
| Total | 777 (52.6%) | 699 (47.4%) |
Education in Weatogue
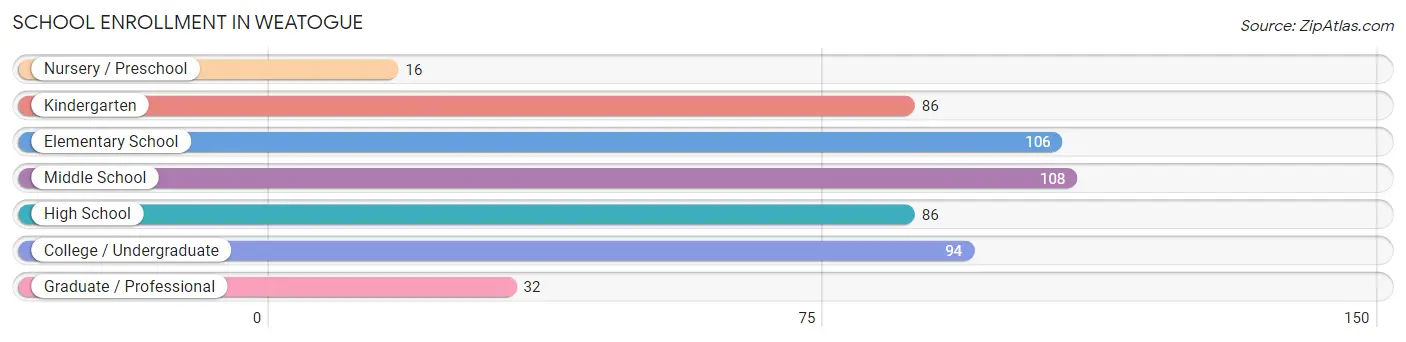
School Enrollment in Weatogue
The most common levels of schooling among the 528 students in Weatogue are middle school (108 | 20.4%), elementary school (106 | 20.1%), and college / undergraduate (94 | 17.8%).
| School Level | # Students | % Students |
| Nursery / Preschool | 16 | 3.0% |
| Kindergarten | 86 | 16.3% |
| Elementary School | 106 | 20.1% |
| Middle School | 108 | 20.4% |
| High School | 86 | 16.3% |
| College / Undergraduate | 94 | 17.8% |
| Graduate / Professional | 32 | 6.1% |
| Total | 528 | 100.0% |
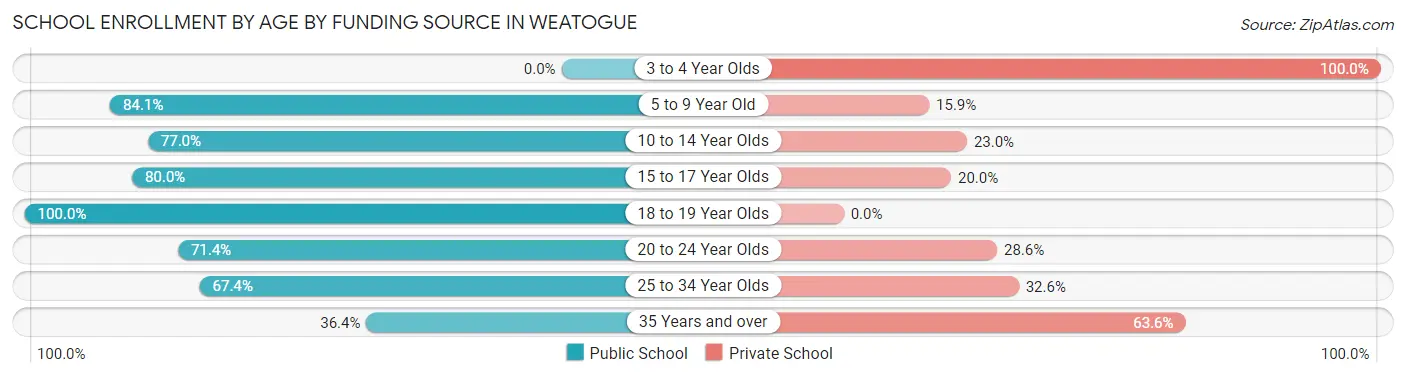
School Enrollment by Age by Funding Source in Weatogue
Out of a total of 528 students who are enrolled in schools in Weatogue, 146 (27.7%) attend a private institution, while the remaining 382 (72.3%) are enrolled in public schools. The age group of 3 to 4 year olds has the highest likelihood of being enrolled in private schools, with 16 (100.0% in the age bracket) enrolled. Conversely, the age group of 18 to 19 year olds has the lowest likelihood of being enrolled in a private school, with 4 (100.0% in the age bracket) attending a public institution.
| Age Bracket | Public School | Private School |
| 3 to 4 Year Olds | 0 (0.0%) | 16 (100.0%) |
| 5 to 9 Year Old | 148 (84.1%) | 28 (15.9%) |
| 10 to 14 Year Olds | 104 (77.0%) | 31 (23.0%) |
| 15 to 17 Year Olds | 60 (80.0%) | 15 (20.0%) |
| 18 to 19 Year Olds | 4 (100.0%) | 0 (0.0%) |
| 20 to 24 Year Olds | 15 (71.4%) | 6 (28.6%) |
| 25 to 34 Year Olds | 31 (67.4%) | 15 (32.6%) |
| 35 Years and over | 20 (36.4%) | 35 (63.6%) |
| Total | 382 (72.3%) | 146 (27.7%) |
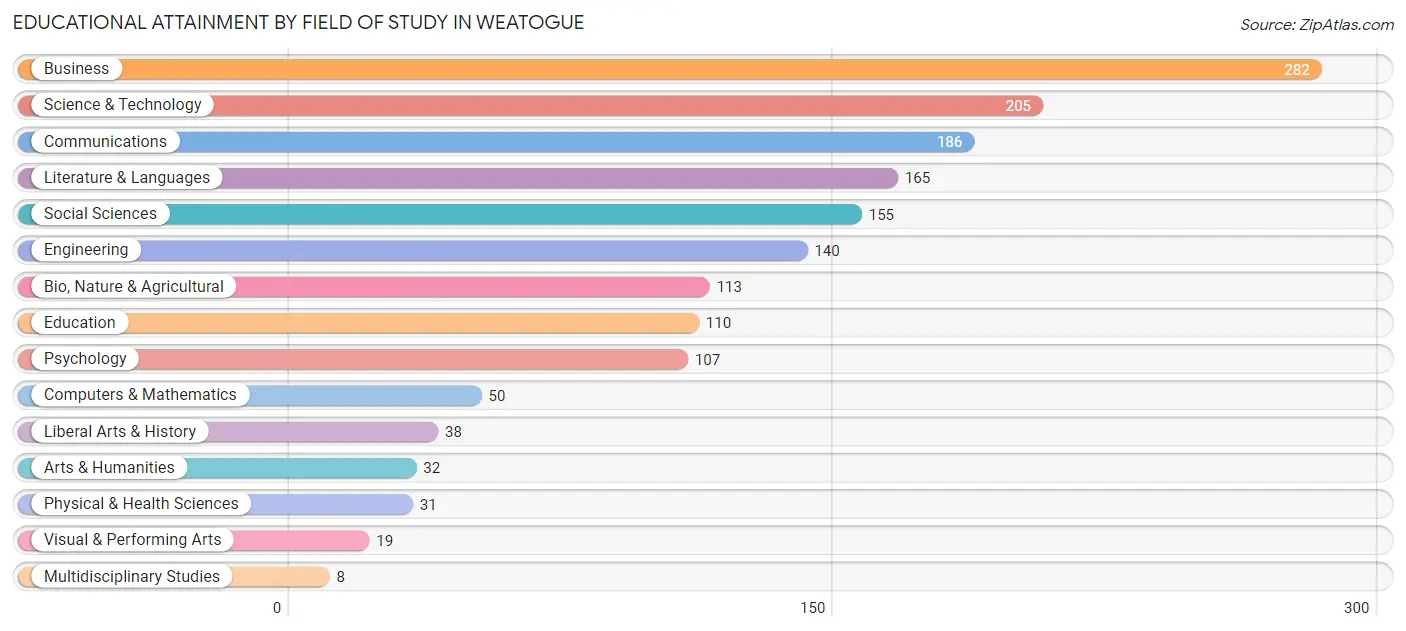
Educational Attainment by Field of Study in Weatogue
Business (282 | 17.2%), science & technology (205 | 12.5%), communications (186 | 11.3%), literature & languages (165 | 10.1%), and social sciences (155 | 9.5%) are the most common fields of study among 1,641 individuals in Weatogue who have obtained a bachelor's degree or higher.
| Field of Study | # Graduates | % Graduates |
| Computers & Mathematics | 50 | 3.0% |
| Bio, Nature & Agricultural | 113 | 6.9% |
| Physical & Health Sciences | 31 | 1.9% |
| Psychology | 107 | 6.5% |
| Social Sciences | 155 | 9.5% |
| Engineering | 140 | 8.5% |
| Multidisciplinary Studies | 8 | 0.5% |
| Science & Technology | 205 | 12.5% |
| Business | 282 | 17.2% |
| Education | 110 | 6.7% |
| Literature & Languages | 165 | 10.1% |
| Liberal Arts & History | 38 | 2.3% |
| Visual & Performing Arts | 19 | 1.2% |
| Communications | 186 | 11.3% |
| Arts & Humanities | 32 | 1.9% |
| Total | 1,641 | 100.0% |
Transportation & Commute in Weatogue
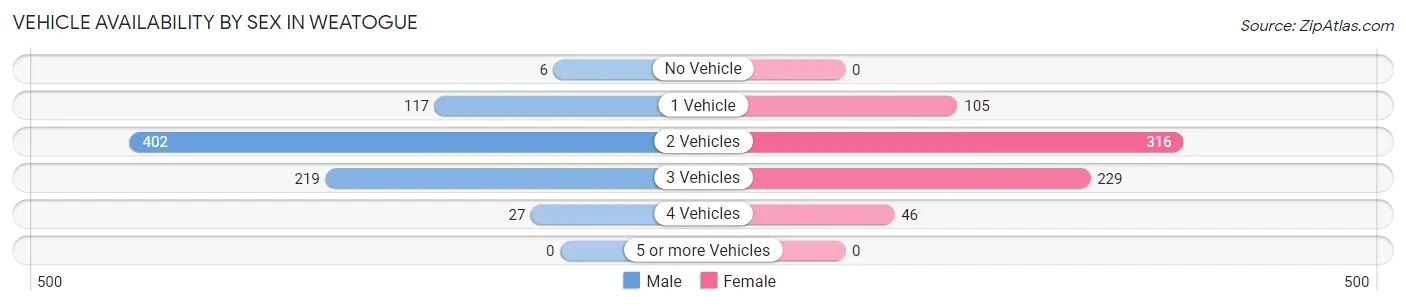
Vehicle Availability by Sex in Weatogue
The most prevalent vehicle ownership categories in Weatogue are males with 2 vehicles (402, accounting for 52.1%) and females with 2 vehicles (316, making up 57.8%).
| Vehicles Available | Male | Female |
| No Vehicle | 6 (0.8%) | 0 (0.0%) |
| 1 Vehicle | 117 (15.2%) | 105 (15.1%) |
| 2 Vehicles | 402 (52.1%) | 316 (45.4%) |
| 3 Vehicles | 219 (28.4%) | 229 (32.9%) |
| 4 Vehicles | 27 (3.5%) | 46 (6.6%) |
| 5 or more Vehicles | 0 (0.0%) | 0 (0.0%) |
| Total | 771 (100.0%) | 696 (100.0%) |
Commute Time in Weatogue
The most frequently occuring commute durations in Weatogue are 15 to 19 minutes (167 commuters, 14.2%), 45 to 59 minutes (159 commuters, 13.5%), and 25 to 29 minutes (157 commuters, 13.4%).
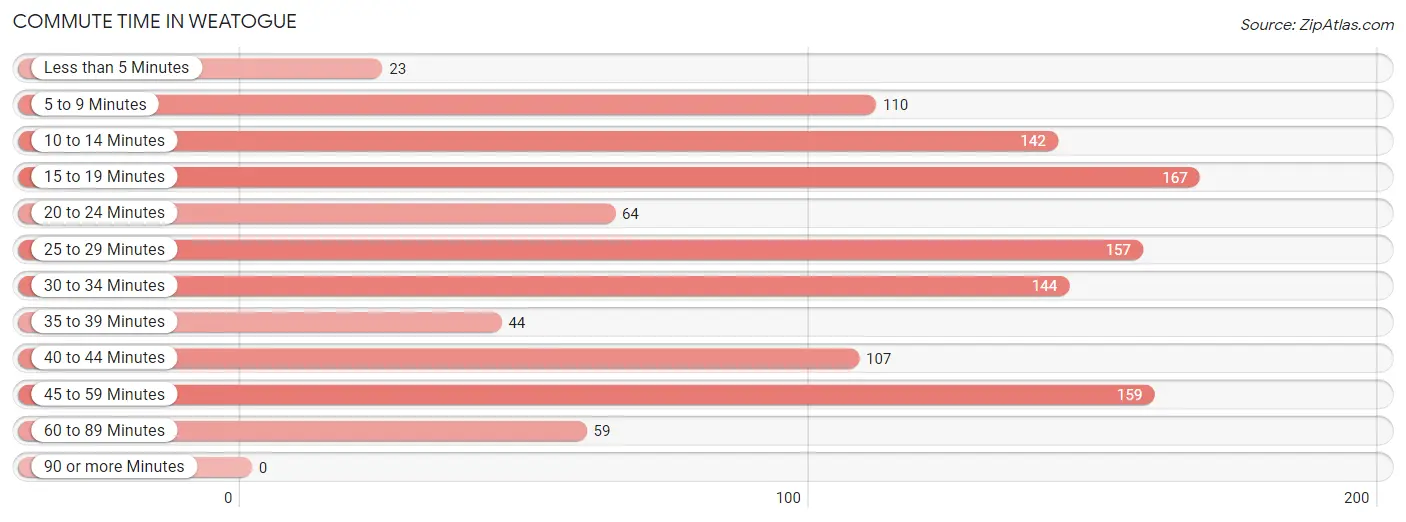
| Commute Time | # Commuters | % Commuters |
| Less than 5 Minutes | 23 | 2.0% |
| 5 to 9 Minutes | 110 | 9.3% |
| 10 to 14 Minutes | 142 | 12.1% |
| 15 to 19 Minutes | 167 | 14.2% |
| 20 to 24 Minutes | 64 | 5.4% |
| 25 to 29 Minutes | 157 | 13.4% |
| 30 to 34 Minutes | 144 | 12.2% |
| 35 to 39 Minutes | 44 | 3.7% |
| 40 to 44 Minutes | 107 | 9.1% |
| 45 to 59 Minutes | 159 | 13.5% |
| 60 to 89 Minutes | 59 | 5.0% |
| 90 or more Minutes | 0 | 0.0% |
Commute Time by Sex in Weatogue
The most common commute times in Weatogue are 25 to 29 minutes (114 commuters, 18.1%) for males and 10 to 14 minutes (101 commuters, 18.5%) for females.
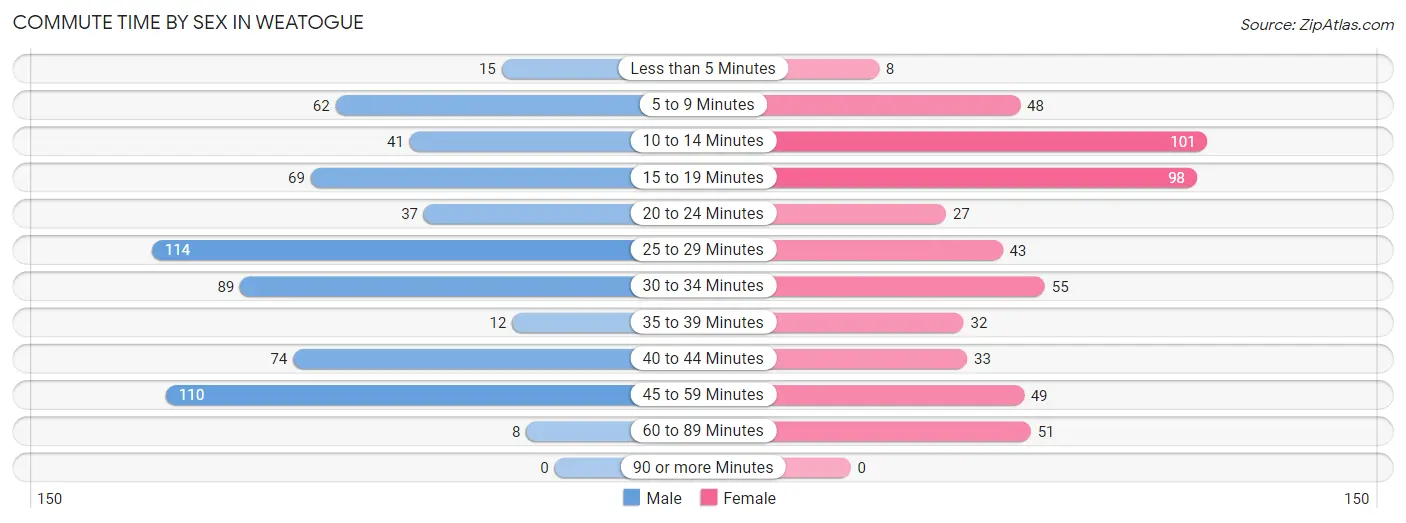
| Commute Time | Male | Female |
| Less than 5 Minutes | 15 (2.4%) | 8 (1.5%) |
| 5 to 9 Minutes | 62 (9.8%) | 48 (8.8%) |
| 10 to 14 Minutes | 41 (6.5%) | 101 (18.5%) |
| 15 to 19 Minutes | 69 (10.9%) | 98 (18.0%) |
| 20 to 24 Minutes | 37 (5.9%) | 27 (5.0%) |
| 25 to 29 Minutes | 114 (18.1%) | 43 (7.9%) |
| 30 to 34 Minutes | 89 (14.1%) | 55 (10.1%) |
| 35 to 39 Minutes | 12 (1.9%) | 32 (5.9%) |
| 40 to 44 Minutes | 74 (11.7%) | 33 (6.1%) |
| 45 to 59 Minutes | 110 (17.4%) | 49 (9.0%) |
| 60 to 89 Minutes | 8 (1.3%) | 51 (9.4%) |
| 90 or more Minutes | 0 (0.0%) | 0 (0.0%) |
Time of Departure to Work by Sex in Weatogue
The most frequent times of departure to work in Weatogue are 8:30 AM to 8:59 AM (120, 19.0%) for males and 6:30 AM to 6:59 AM (113, 20.7%) for females.
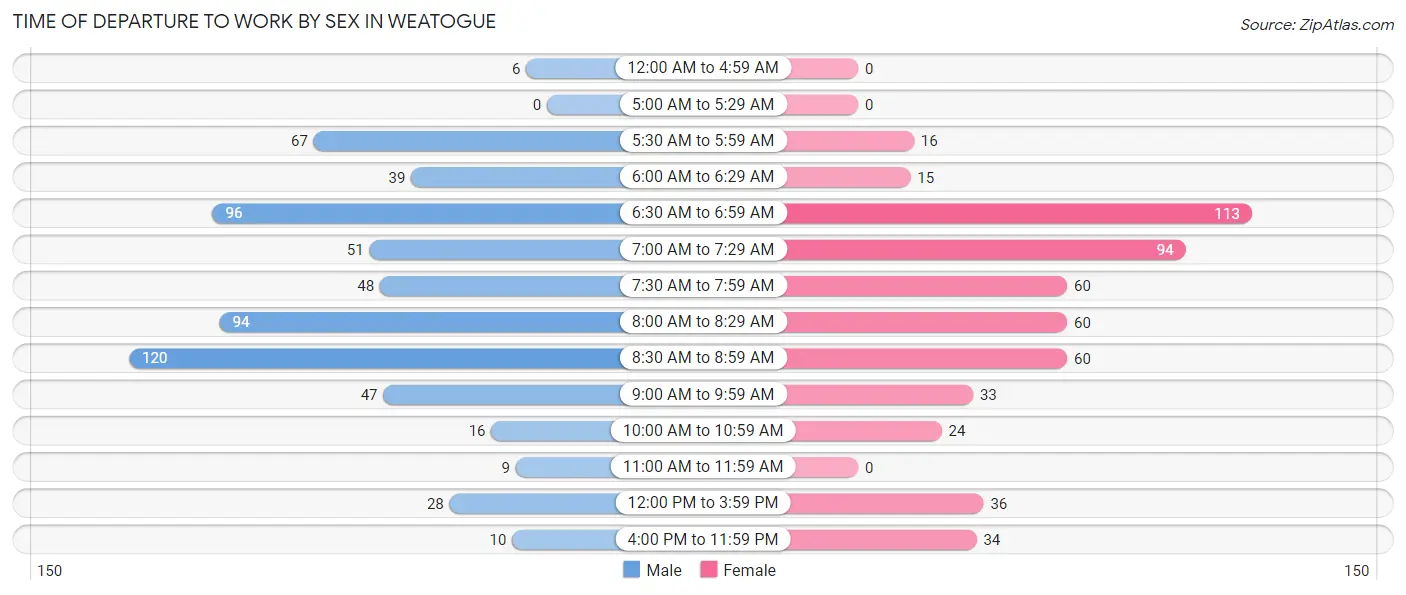
| Time of Departure | Male | Female |
| 12:00 AM to 4:59 AM | 6 (0.9%) | 0 (0.0%) |
| 5:00 AM to 5:29 AM | 0 (0.0%) | 0 (0.0%) |
| 5:30 AM to 5:59 AM | 67 (10.6%) | 16 (2.9%) |
| 6:00 AM to 6:29 AM | 39 (6.2%) | 15 (2.8%) |
| 6:30 AM to 6:59 AM | 96 (15.2%) | 113 (20.7%) |
| 7:00 AM to 7:29 AM | 51 (8.1%) | 94 (17.2%) |
| 7:30 AM to 7:59 AM | 48 (7.6%) | 60 (11.0%) |
| 8:00 AM to 8:29 AM | 94 (14.9%) | 60 (11.0%) |
| 8:30 AM to 8:59 AM | 120 (19.0%) | 60 (11.0%) |
| 9:00 AM to 9:59 AM | 47 (7.4%) | 33 (6.1%) |
| 10:00 AM to 10:59 AM | 16 (2.5%) | 24 (4.4%) |
| 11:00 AM to 11:59 AM | 9 (1.4%) | 0 (0.0%) |
| 12:00 PM to 3:59 PM | 28 (4.4%) | 36 (6.6%) |
| 4:00 PM to 11:59 PM | 10 (1.6%) | 34 (6.2%) |
| Total | 631 (100.0%) | 545 (100.0%) |
Housing Occupancy in Weatogue
Occupancy by Ownership in Weatogue
Of the total 1,111 dwellings in Weatogue, owner-occupied units account for 915 (82.4%), while renter-occupied units make up 196 (17.6%).
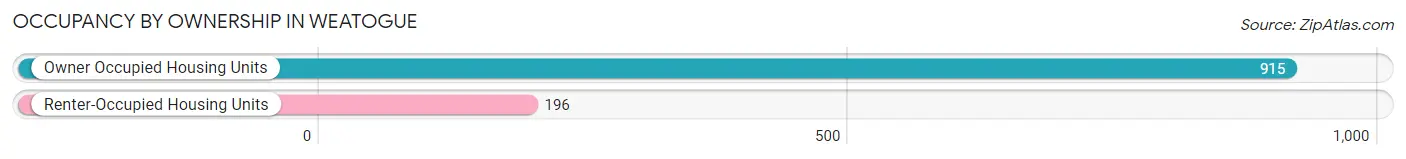
| Occupancy | # Housing Units | % Housing Units |
| Owner Occupied Housing Units | 915 | 82.4% |
| Renter-Occupied Housing Units | 196 | 17.6% |
| Total Occupied Housing Units | 1,111 | 100.0% |
Occupancy by Household Size in Weatogue
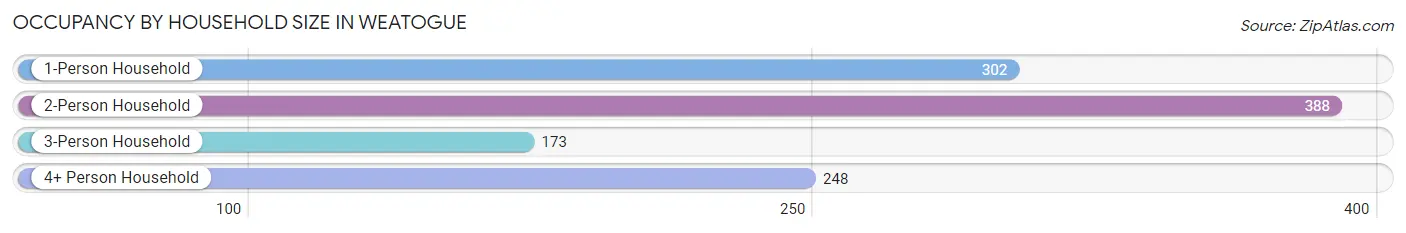
| Household Size | # Housing Units | % Housing Units |
| 1-Person Household | 302 | 27.2% |
| 2-Person Household | 388 | 34.9% |
| 3-Person Household | 173 | 15.6% |
| 4+ Person Household | 248 | 22.3% |
| Total Housing Units | 1,111 | 100.0% |
Occupancy by Ownership by Household Size in Weatogue
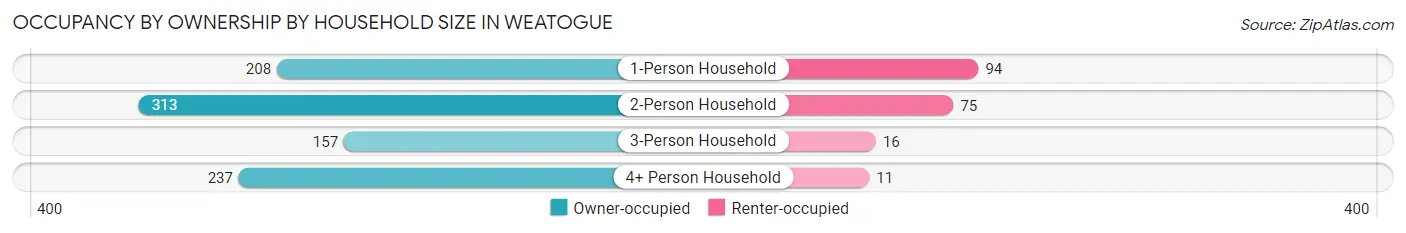
| Household Size | Owner-occupied | Renter-occupied |
| 1-Person Household | 208 (68.9%) | 94 (31.1%) |
| 2-Person Household | 313 (80.7%) | 75 (19.3%) |
| 3-Person Household | 157 (90.7%) | 16 (9.2%) |
| 4+ Person Household | 237 (95.6%) | 11 (4.4%) |
| Total Housing Units | 915 (82.4%) | 196 (17.6%) |
Occupancy by Educational Attainment in Weatogue
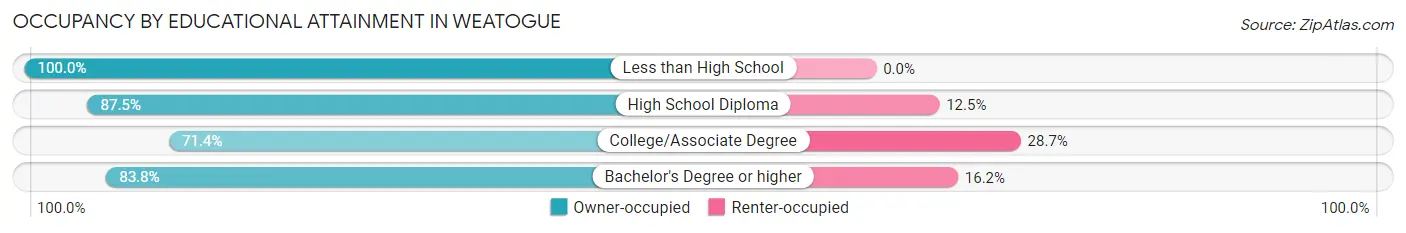
| Household Size | Owner-occupied | Renter-occupied |
| Less than High School | 9 (100.0%) | 0 (0.0%) |
| High School Diploma | 91 (87.5%) | 13 (12.5%) |
| College/Associate Degree | 122 (71.4%) | 49 (28.6%) |
| Bachelor's Degree or higher | 693 (83.8%) | 134 (16.2%) |
Occupancy by Age of Householder in Weatogue
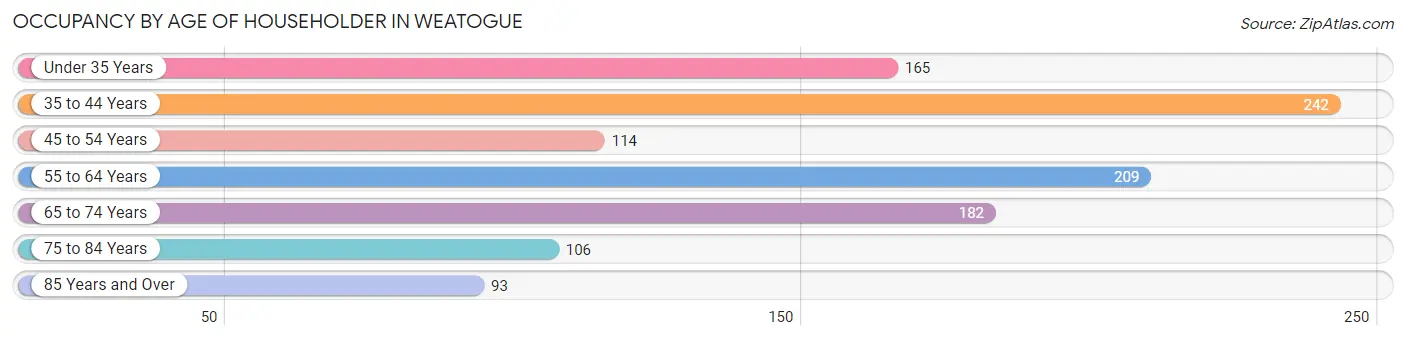
| Age Bracket | # Households | % Households |
| Under 35 Years | 165 | 14.8% |
| 35 to 44 Years | 242 | 21.8% |
| 45 to 54 Years | 114 | 10.3% |
| 55 to 64 Years | 209 | 18.8% |
| 65 to 74 Years | 182 | 16.4% |
| 75 to 84 Years | 106 | 9.5% |
| 85 Years and Over | 93 | 8.4% |
| Total | 1,111 | 100.0% |
Housing Finances in Weatogue
Median Income by Occupancy in Weatogue
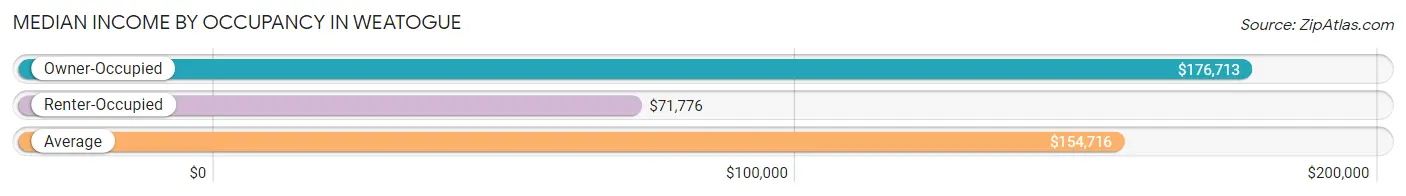
| Occupancy Type | # Households | Median Income |
| Owner-Occupied | 915 (82.4%) | $176,713 |
| Renter-Occupied | 196 (17.6%) | $71,776 |
| Average | 1,111 (100.0%) | $154,716 |
Occupancy by Householder Income Bracket in Weatogue
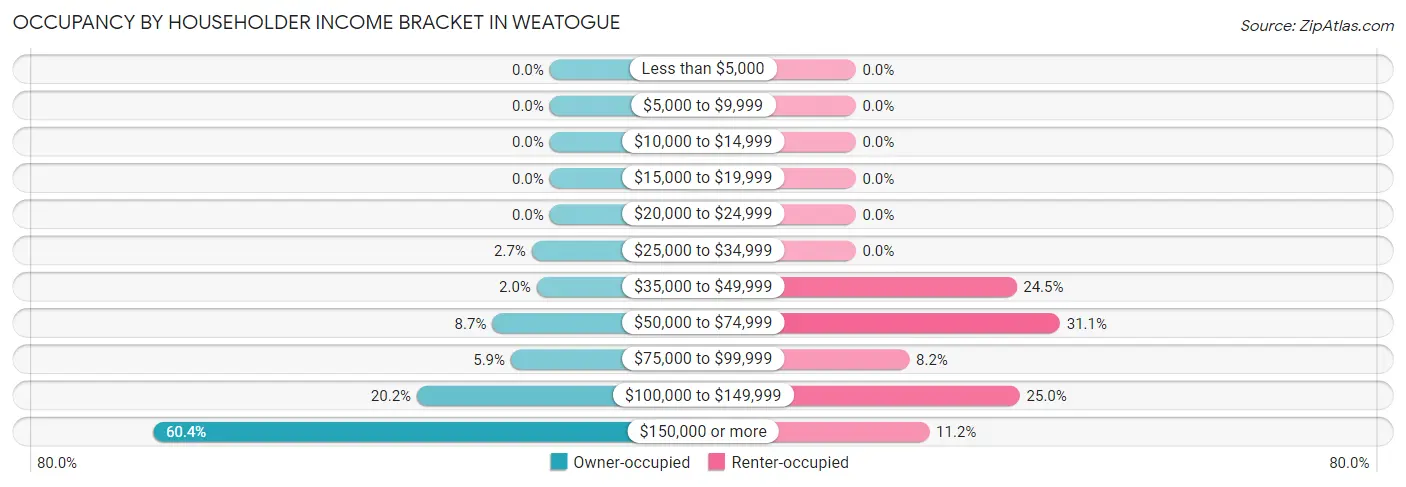
| Income Bracket | Owner-occupied | Renter-occupied |
| Less than $5,000 | 0 (0.0%) | 0 (0.0%) |
| $5,000 to $9,999 | 0 (0.0%) | 0 (0.0%) |
| $10,000 to $14,999 | 0 (0.0%) | 0 (0.0%) |
| $15,000 to $19,999 | 0 (0.0%) | 0 (0.0%) |
| $20,000 to $24,999 | 0 (0.0%) | 0 (0.0%) |
| $25,000 to $34,999 | 25 (2.7%) | 0 (0.0%) |
| $35,000 to $49,999 | 18 (2.0%) | 48 (24.5%) |
| $50,000 to $74,999 | 80 (8.7%) | 61 (31.1%) |
| $75,000 to $99,999 | 54 (5.9%) | 16 (8.2%) |
| $100,000 to $149,999 | 185 (20.2%) | 49 (25.0%) |
| $150,000 or more | 553 (60.4%) | 22 (11.2%) |
| Total | 915 (100.0%) | 196 (100.0%) |
Monthly Housing Cost Tiers in Weatogue
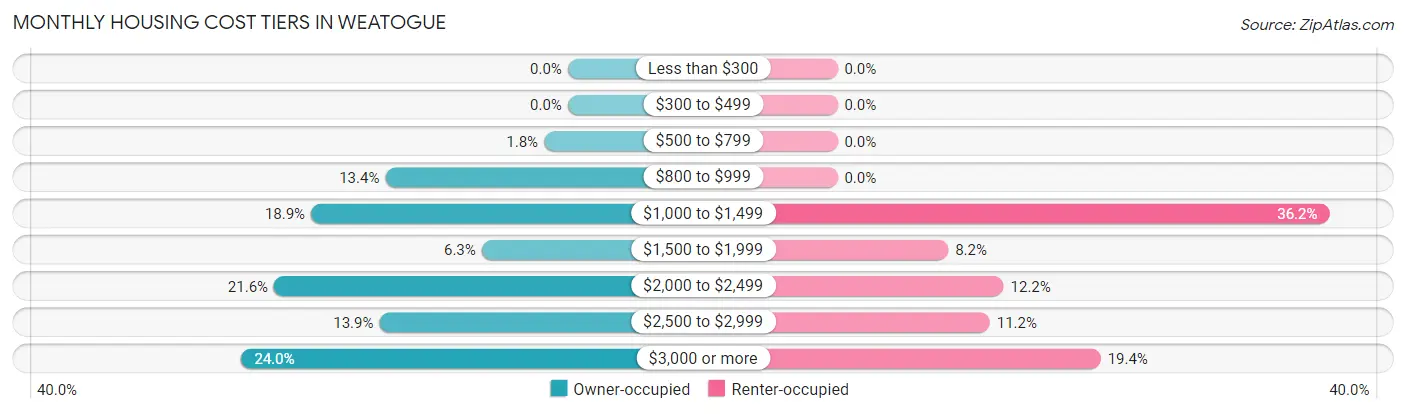
| Monthly Cost | Owner-occupied | Renter-occupied |
| Less than $300 | 0 (0.0%) | 0 (0.0%) |
| $300 to $499 | 0 (0.0%) | 0 (0.0%) |
| $500 to $799 | 16 (1.8%) | 0 (0.0%) |
| $800 to $999 | 123 (13.4%) | 0 (0.0%) |
| $1,000 to $1,499 | 173 (18.9%) | 71 (36.2%) |
| $1,500 to $1,999 | 58 (6.3%) | 16 (8.2%) |
| $2,000 to $2,499 | 198 (21.6%) | 24 (12.2%) |
| $2,500 to $2,999 | 127 (13.9%) | 22 (11.2%) |
| $3,000 or more | 220 (24.0%) | 38 (19.4%) |
| Total | 915 (100.0%) | 196 (100.0%) |
Physical Housing Characteristics in Weatogue
Housing Structures in Weatogue
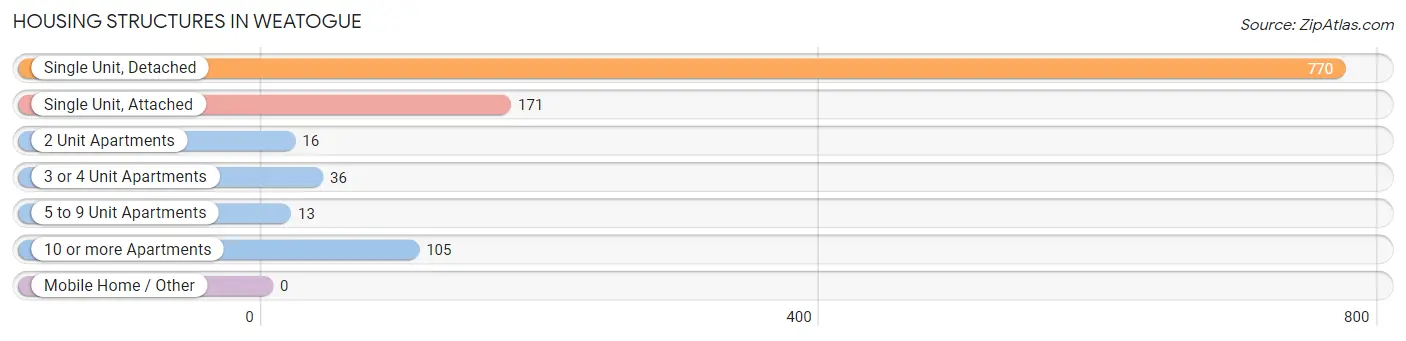
| Structure Type | # Housing Units | % Housing Units |
| Single Unit, Detached | 770 | 69.3% |
| Single Unit, Attached | 171 | 15.4% |
| 2 Unit Apartments | 16 | 1.4% |
| 3 or 4 Unit Apartments | 36 | 3.2% |
| 5 to 9 Unit Apartments | 13 | 1.2% |
| 10 or more Apartments | 105 | 9.5% |
| Mobile Home / Other | 0 | 0.0% |
| Total | 1,111 | 100.0% |
Housing Structures by Occupancy in Weatogue
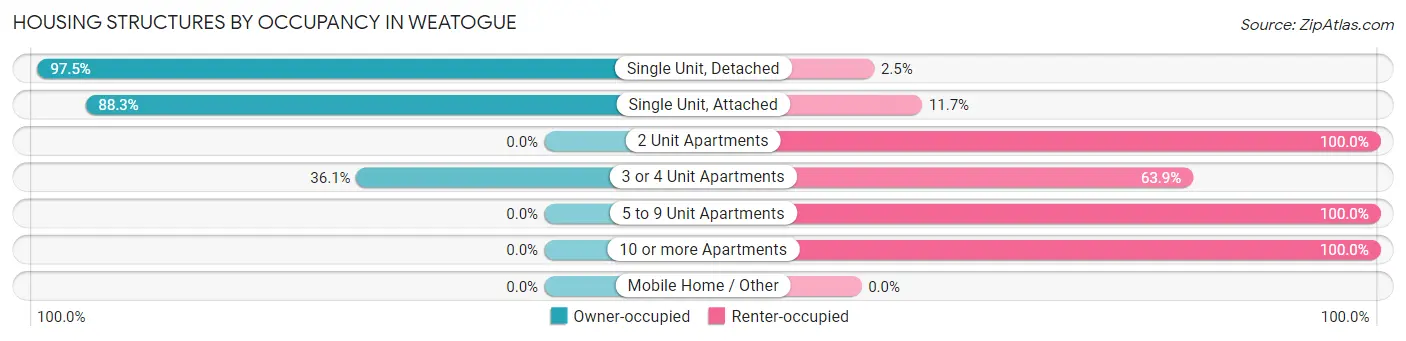
| Structure Type | Owner-occupied | Renter-occupied |
| Single Unit, Detached | 751 (97.5%) | 19 (2.5%) |
| Single Unit, Attached | 151 (88.3%) | 20 (11.7%) |
| 2 Unit Apartments | 0 (0.0%) | 16 (100.0%) |
| 3 or 4 Unit Apartments | 13 (36.1%) | 23 (63.9%) |
| 5 to 9 Unit Apartments | 0 (0.0%) | 13 (100.0%) |
| 10 or more Apartments | 0 (0.0%) | 105 (100.0%) |
| Mobile Home / Other | 0 (0.0%) | 0 (0.0%) |
| Total | 915 (82.4%) | 196 (17.6%) |
Housing Structures by Number of Rooms in Weatogue
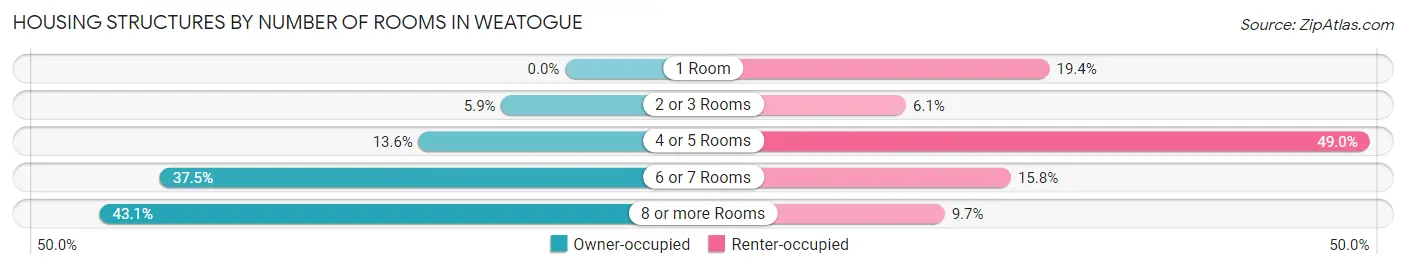
| Number of Rooms | Owner-occupied | Renter-occupied |
| 1 Room | 0 (0.0%) | 38 (19.4%) |
| 2 or 3 Rooms | 54 (5.9%) | 12 (6.1%) |
| 4 or 5 Rooms | 124 (13.6%) | 96 (49.0%) |
| 6 or 7 Rooms | 343 (37.5%) | 31 (15.8%) |
| 8 or more Rooms | 394 (43.1%) | 19 (9.7%) |
| Total | 915 (100.0%) | 196 (100.0%) |
Housing Structure by Heating Type in Weatogue
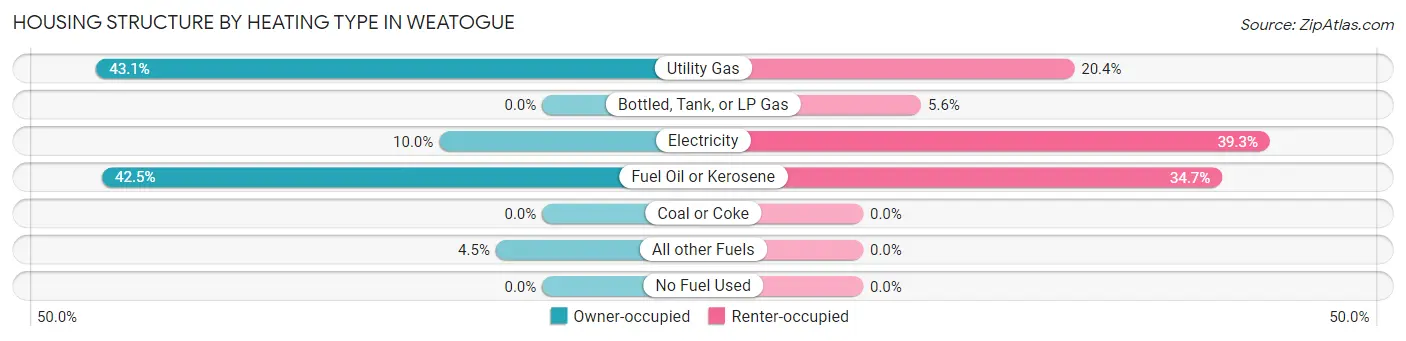
| Heating Type | Owner-occupied | Renter-occupied |
| Utility Gas | 394 (43.1%) | 40 (20.4%) |
| Bottled, Tank, or LP Gas | 0 (0.0%) | 11 (5.6%) |
| Electricity | 91 (10.0%) | 77 (39.3%) |
| Fuel Oil or Kerosene | 389 (42.5%) | 68 (34.7%) |
| Coal or Coke | 0 (0.0%) | 0 (0.0%) |
| All other Fuels | 41 (4.5%) | 0 (0.0%) |
| No Fuel Used | 0 (0.0%) | 0 (0.0%) |
| Total | 915 (100.0%) | 196 (100.0%) |
Household Vehicle Usage in Weatogue
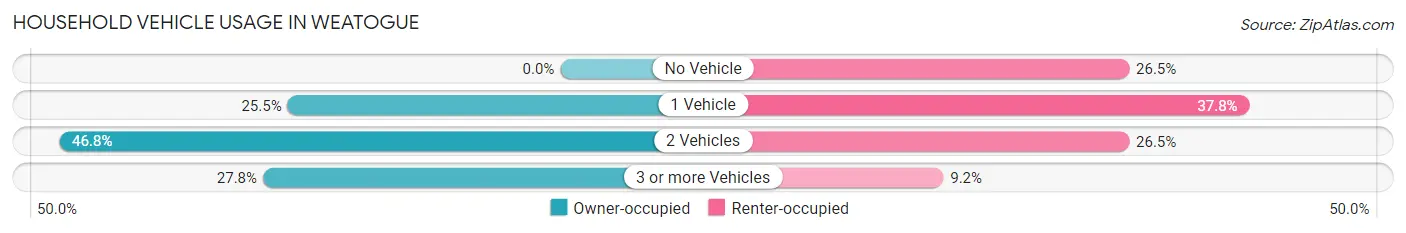
| Vehicles per Household | Owner-occupied | Renter-occupied |
| No Vehicle | 0 (0.0%) | 52 (26.5%) |
| 1 Vehicle | 233 (25.5%) | 74 (37.8%) |
| 2 Vehicles | 428 (46.8%) | 52 (26.5%) |
| 3 or more Vehicles | 254 (27.8%) | 18 (9.2%) |
| Total | 915 (100.0%) | 196 (100.0%) |
Real Estate & Mortgages in Weatogue
Real Estate and Mortgage Overview in Weatogue
| Characteristic | Without Mortgage | With Mortgage |
| Housing Units | 318 | 597 |
| Median Property Value | $372,400 | $365,000 |
| Median Household Income | $176,771 | $369 |
| Monthly Housing Costs | $1,242 | $220 |
| Real Estate Taxes | $9,000 | $0 |
Property Value by Mortgage Status in Weatogue
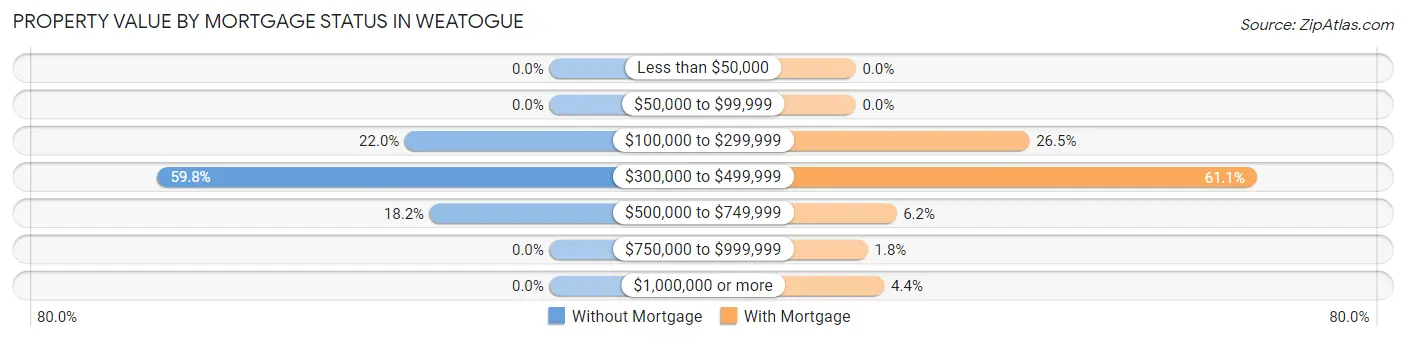
| Property Value | Without Mortgage | With Mortgage |
| Less than $50,000 | 0 (0.0%) | 0 (0.0%) |
| $50,000 to $99,999 | 0 (0.0%) | 0 (0.0%) |
| $100,000 to $299,999 | 70 (22.0%) | 158 (26.5%) |
| $300,000 to $499,999 | 190 (59.8%) | 365 (61.1%) |
| $500,000 to $749,999 | 58 (18.2%) | 37 (6.2%) |
| $750,000 to $999,999 | 0 (0.0%) | 11 (1.8%) |
| $1,000,000 or more | 0 (0.0%) | 26 (4.4%) |
| Total | 318 (100.0%) | 597 (100.0%) |
Household Income by Mortgage Status in Weatogue
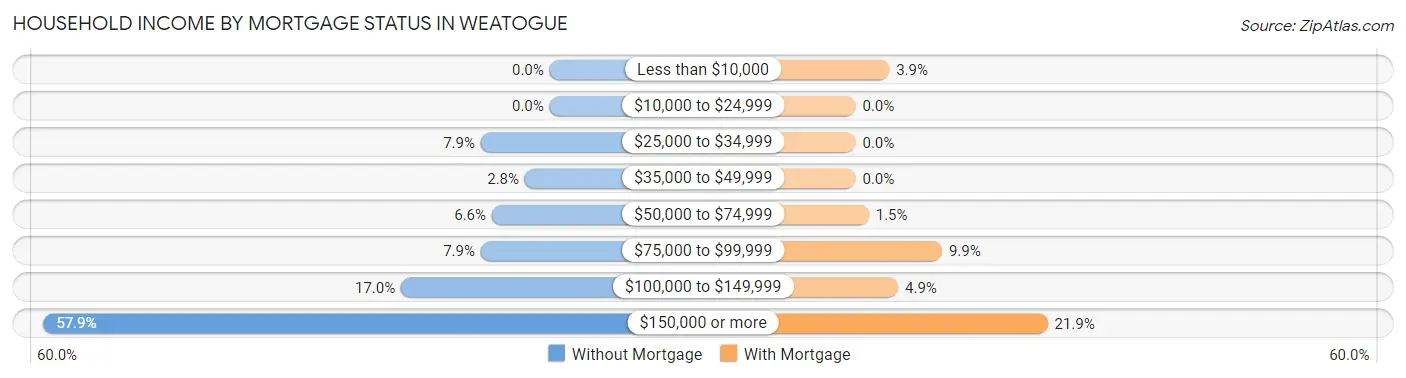
| Household Income | Without Mortgage | With Mortgage |
| Less than $10,000 | 0 (0.0%) | 23 (3.8%) |
| $10,000 to $24,999 | 0 (0.0%) | 0 (0.0%) |
| $25,000 to $34,999 | 25 (7.9%) | 0 (0.0%) |
| $35,000 to $49,999 | 9 (2.8%) | 0 (0.0%) |
| $50,000 to $74,999 | 21 (6.6%) | 9 (1.5%) |
| $75,000 to $99,999 | 25 (7.9%) | 59 (9.9%) |
| $100,000 to $149,999 | 54 (17.0%) | 29 (4.9%) |
| $150,000 or more | 184 (57.9%) | 131 (21.9%) |
| Total | 318 (100.0%) | 597 (100.0%) |
Property Value to Household Income Ratio in Weatogue
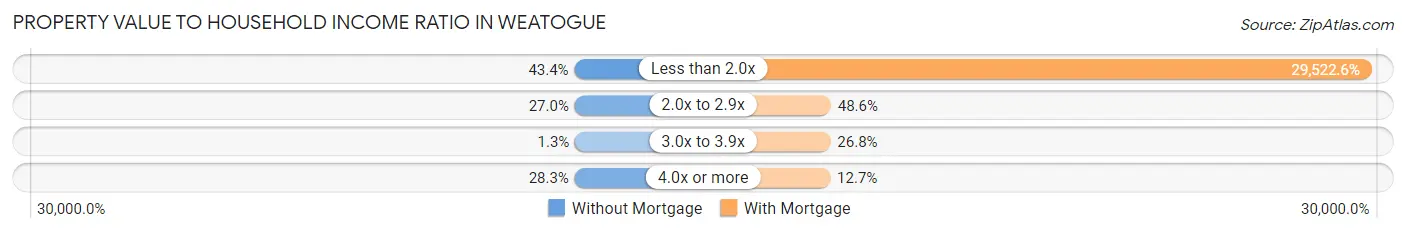
| Value-to-Income Ratio | Without Mortgage | With Mortgage |
| Less than 2.0x | 138 (43.4%) | 176,250 (29,522.6%) |
| 2.0x to 2.9x | 86 (27.0%) | 290 (48.6%) |
| 3.0x to 3.9x | 4 (1.3%) | 160 (26.8%) |
| 4.0x or more | 90 (28.3%) | 76 (12.7%) |
| Total | 318 (100.0%) | 597 (100.0%) |
Real Estate Taxes by Mortgage Status in Weatogue
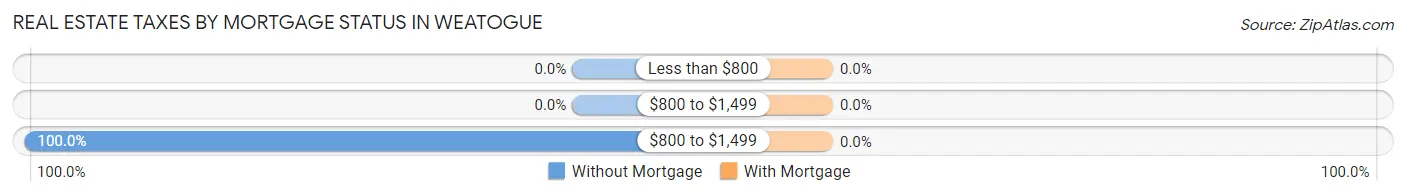
| Property Taxes | Without Mortgage | With Mortgage |
| Less than $800 | 0 (0.0%) | 0 (0.0%) |
| $800 to $1,499 | 0 (0.0%) | 0 (0.0%) |
| $800 to $1,499 | 318 (100.0%) | 0 (0.0%) |
| Total | 318 (100.0%) | 597 (100.0%) |
Health & Disability in Weatogue
Health Insurance Coverage by Age in Weatogue
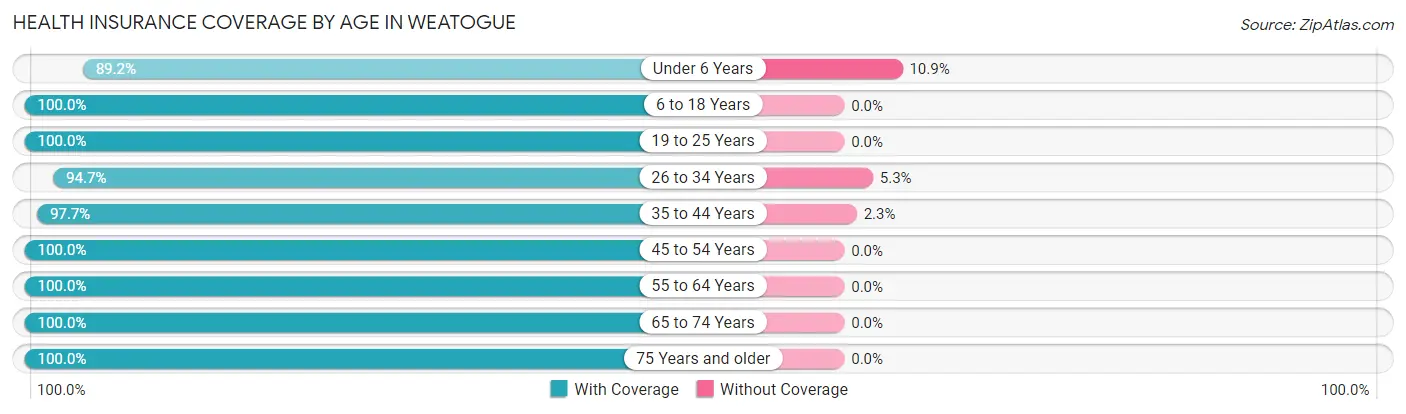
| Age Bracket | With Coverage | Without Coverage |
| Under 6 Years | 189 (89.1%) | 23 (10.8%) |
| 6 to 18 Years | 382 (100.0%) | 0 (0.0%) |
| 19 to 25 Years | 92 (100.0%) | 0 (0.0%) |
| 26 to 34 Years | 320 (94.7%) | 18 (5.3%) |
| 35 to 44 Years | 466 (97.7%) | 11 (2.3%) |
| 45 to 54 Years | 218 (100.0%) | 0 (0.0%) |
| 55 to 64 Years | 424 (100.0%) | 0 (0.0%) |
| 65 to 74 Years | 265 (100.0%) | 0 (0.0%) |
| 75 Years and older | 263 (100.0%) | 0 (0.0%) |
| Total | 2,619 (98.1%) | 52 (1.9%) |
Health Insurance Coverage by Citizenship Status in Weatogue
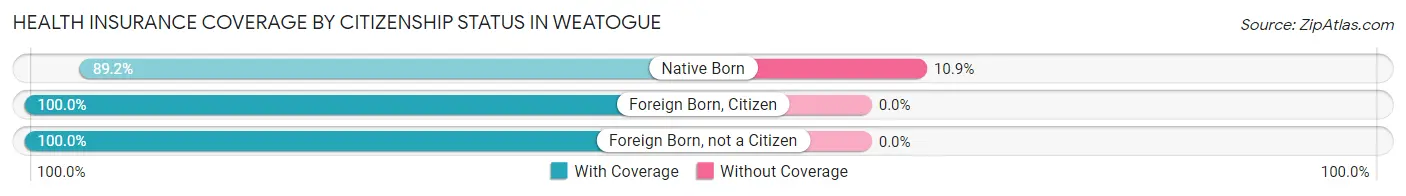
| Citizenship Status | With Coverage | Without Coverage |
| Native Born | 189 (89.1%) | 23 (10.8%) |
| Foreign Born, Citizen | 382 (100.0%) | 0 (0.0%) |
| Foreign Born, not a Citizen | 92 (100.0%) | 0 (0.0%) |
Health Insurance Coverage by Household Income in Weatogue
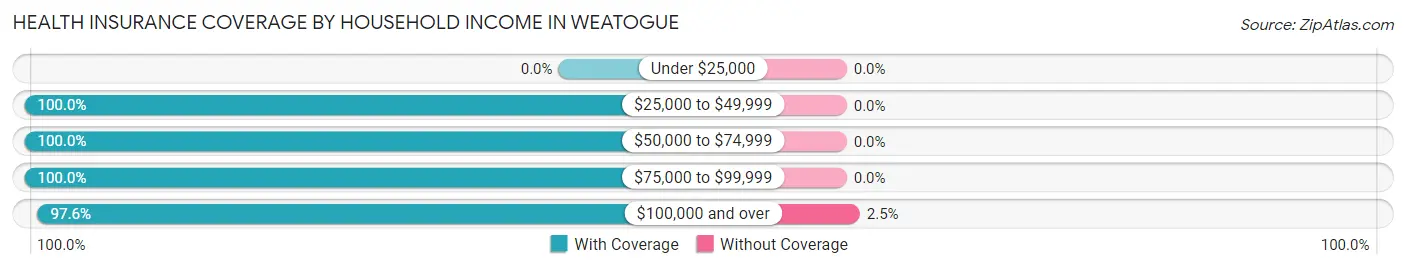
| Household Income | With Coverage | Without Coverage |
| Under $25,000 | 0 (0.0%) | 0 (0.0%) |
| $25,000 to $49,999 | 103 (100.0%) | 0 (0.0%) |
| $50,000 to $74,999 | 200 (100.0%) | 0 (0.0%) |
| $75,000 to $99,999 | 224 (100.0%) | 0 (0.0%) |
| $100,000 and over | 2,074 (97.6%) | 52 (2.5%) |
Public vs Private Health Insurance Coverage by Age in Weatogue
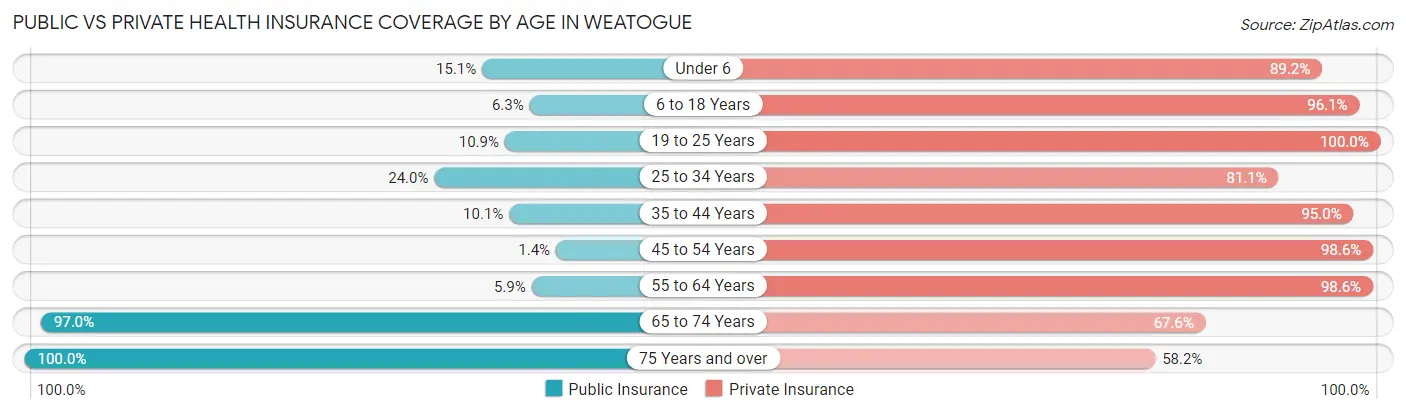
| Age Bracket | Public Insurance | Private Insurance |
| Under 6 | 32 (15.1%) | 189 (89.1%) |
| 6 to 18 Years | 24 (6.3%) | 367 (96.1%) |
| 19 to 25 Years | 10 (10.9%) | 92 (100.0%) |
| 25 to 34 Years | 81 (24.0%) | 274 (81.1%) |
| 35 to 44 Years | 48 (10.1%) | 453 (95.0%) |
| 45 to 54 Years | 3 (1.4%) | 215 (98.6%) |
| 55 to 64 Years | 25 (5.9%) | 418 (98.6%) |
| 65 to 74 Years | 257 (97.0%) | 179 (67.5%) |
| 75 Years and over | 263 (100.0%) | 153 (58.2%) |
| Total | 743 (27.8%) | 2,340 (87.6%) |
Disability Status by Sex by Age in Weatogue
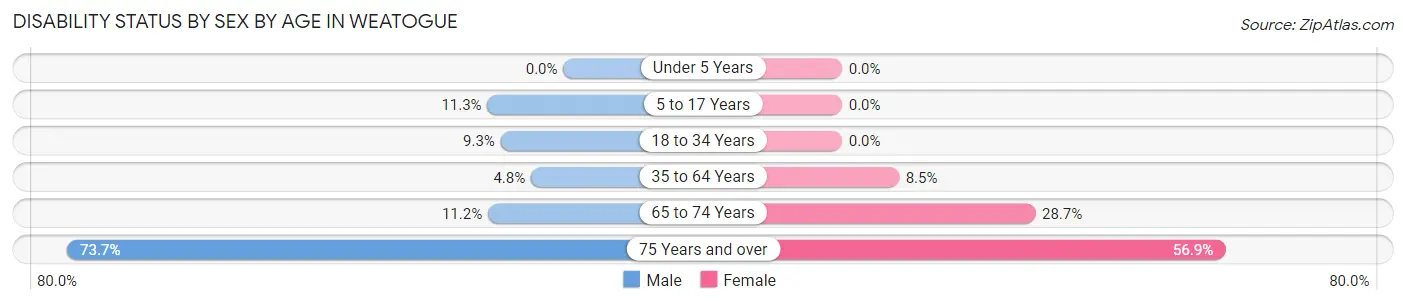
| Age Bracket | Male | Female |
| Under 5 Years | 0 (0.0%) | 0 (0.0%) |
| 5 to 17 Years | 24 (11.3%) | 0 (0.0%) |
| 18 to 34 Years | 19 (9.3%) | 0 (0.0%) |
| 35 to 64 Years | 27 (4.8%) | 47 (8.5%) |
| 65 to 74 Years | 16 (11.2%) | 35 (28.7%) |
| 75 Years and over | 98 (73.7%) | 74 (56.9%) |
Disability Class by Sex by Age in Weatogue
Disability Class: Hearing Difficulty
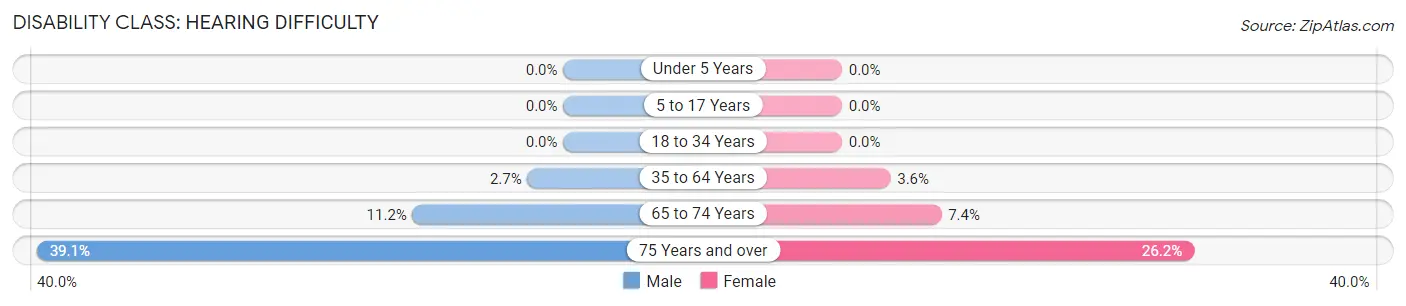
| Age Bracket | Male | Female |
| Under 5 Years | 0 (0.0%) | 0 (0.0%) |
| 5 to 17 Years | 0 (0.0%) | 0 (0.0%) |
| 18 to 34 Years | 0 (0.0%) | 0 (0.0%) |
| 35 to 64 Years | 15 (2.7%) | 20 (3.6%) |
| 65 to 74 Years | 16 (11.2%) | 9 (7.4%) |
| 75 Years and over | 52 (39.1%) | 34 (26.2%) |
Disability Class: Vision Difficulty
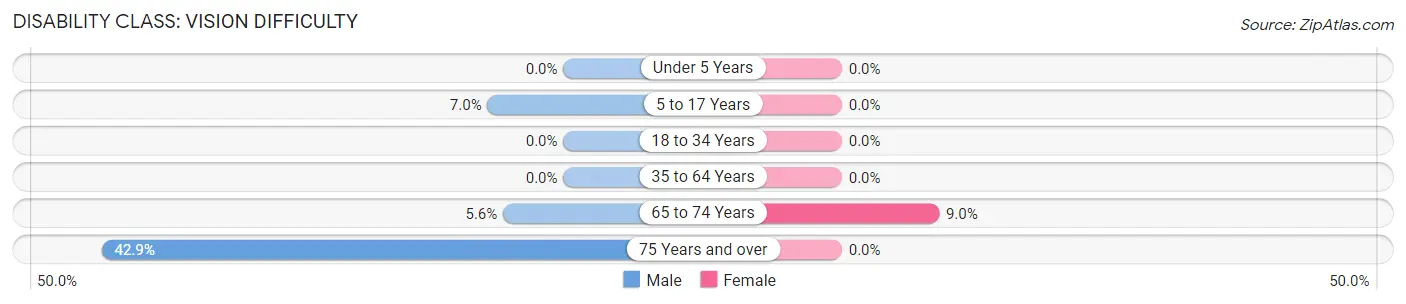
| Age Bracket | Male | Female |
| Under 5 Years | 0 (0.0%) | 0 (0.0%) |
| 5 to 17 Years | 15 (7.0%) | 0 (0.0%) |
| 18 to 34 Years | 0 (0.0%) | 0 (0.0%) |
| 35 to 64 Years | 0 (0.0%) | 0 (0.0%) |
| 65 to 74 Years | 8 (5.6%) | 11 (9.0%) |
| 75 Years and over | 57 (42.9%) | 0 (0.0%) |
Disability Class: Cognitive Difficulty
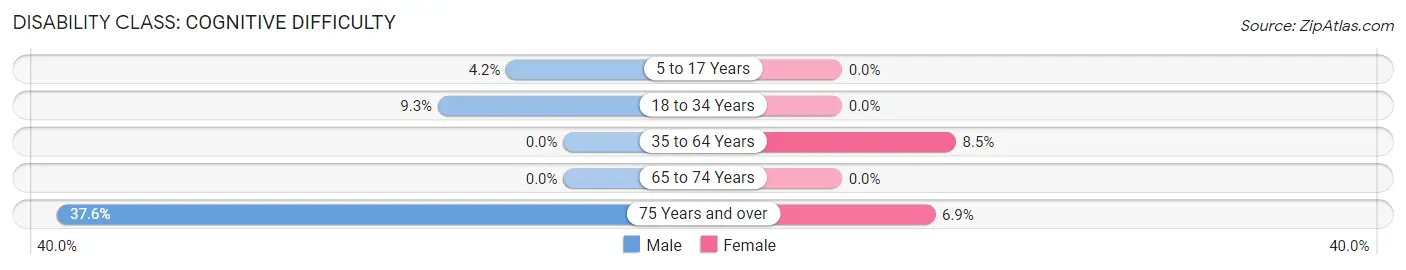
| Age Bracket | Male | Female |
| 5 to 17 Years | 9 (4.2%) | 0 (0.0%) |
| 18 to 34 Years | 19 (9.3%) | 0 (0.0%) |
| 35 to 64 Years | 0 (0.0%) | 47 (8.5%) |
| 65 to 74 Years | 0 (0.0%) | 0 (0.0%) |
| 75 Years and over | 50 (37.6%) | 9 (6.9%) |
Disability Class: Ambulatory Difficulty
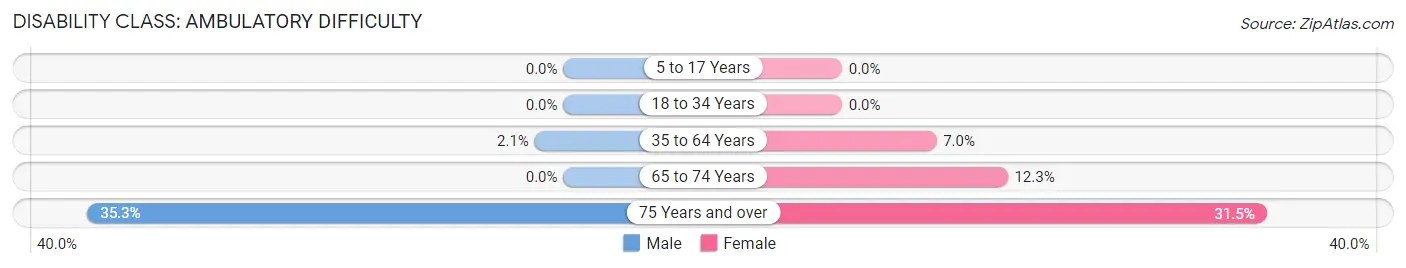
| Age Bracket | Male | Female |
| 5 to 17 Years | 0 (0.0%) | 0 (0.0%) |
| 18 to 34 Years | 0 (0.0%) | 0 (0.0%) |
| 35 to 64 Years | 12 (2.1%) | 39 (7.0%) |
| 65 to 74 Years | 0 (0.0%) | 15 (12.3%) |
| 75 Years and over | 47 (35.3%) | 41 (31.5%) |
Disability Class: Self-Care Difficulty
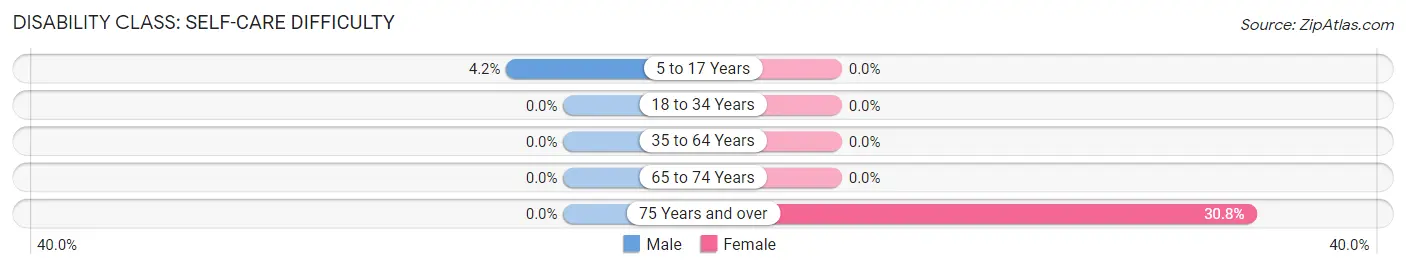
| Age Bracket | Male | Female |
| 5 to 17 Years | 9 (4.2%) | 0 (0.0%) |
| 18 to 34 Years | 0 (0.0%) | 0 (0.0%) |
| 35 to 64 Years | 0 (0.0%) | 0 (0.0%) |
| 65 to 74 Years | 0 (0.0%) | 0 (0.0%) |
| 75 Years and over | 0 (0.0%) | 40 (30.8%) |
Technology Access in Weatogue
Computing Device Access in Weatogue
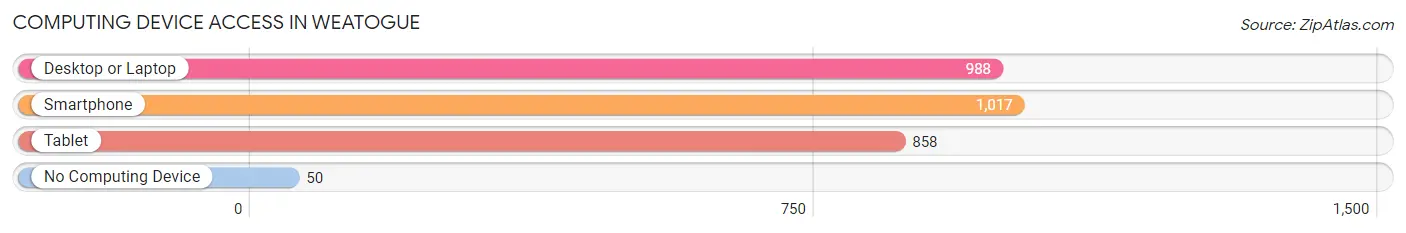
| Device Type | # Households | % Households |
| Desktop or Laptop | 988 | 88.9% |
| Smartphone | 1,017 | 91.5% |
| Tablet | 858 | 77.2% |
| No Computing Device | 50 | 4.5% |
| Total | 1,111 | 100.0% |
Internet Access in Weatogue
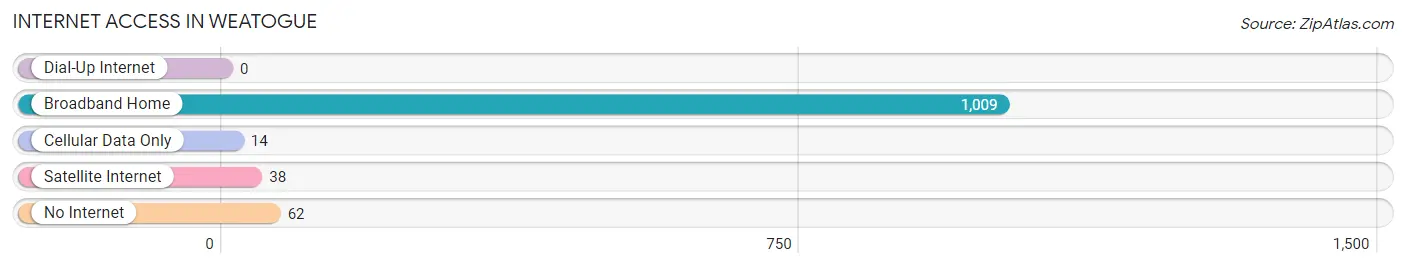
| Internet Type | # Households | % Households |
| Dial-Up Internet | 0 | 0.0% |
| Broadband Home | 1,009 | 90.8% |
| Cellular Data Only | 14 | 1.3% |
| Satellite Internet | 38 | 3.4% |
| No Internet | 62 | 5.6% |
| Total | 1,111 | 100.0% |
Weatogue Summary
Weatogue is a small town located in Hartford County, Connecticut. It is situated in the northwest corner of the state, just south of the Massachusetts border. The town was incorporated in 1779 and has a population of approximately 2,500 people.
Geography
Weatogue is located in the northwest corner of Hartford County, Connecticut. It is bordered by the towns of Simsbury to the east, Granby to the south, and Suffield to the west. The town is situated on the Farmington River, which flows through the center of town. The town is mostly rural, with a few small businesses and residential areas. The town is also home to a few small lakes, including Lake Congamond and Lake McDonough.
Economy
Weatogue is a small, rural town with a limited economy. The town is home to a few small businesses, including a grocery store, a hardware store, and a few restaurants. The town also has a few small manufacturing companies, including a plastics manufacturer and a metal fabricator. The town is also home to a few small farms, which produce a variety of crops, including corn, hay, and vegetables.
Demographics
As of the 2010 census, Weatogue had a population of 2,500 people. The racial makeup of the town was 95.2% White, 1.2% African American, 0.4% Native American, 0.8% Asian, 0.1% Pacific Islander, 0.6% from other races, and 1.7% from two or more races. Hispanic or Latino of any race were 2.2% of the population.
The median income for a household in Weatogue was $68,750, and the median income for a family was $76,250. Males had a median income of $50,000 versus $37,500 for females. The per capita income for the town was $30,945. About 4.2% of families and 5.2% of the population were below the poverty line, including 6.2% of those under age 18 and 4.2% of those age 65 or over.
History
Weatogue was first settled in 1779 by a group of settlers from Simsbury. The town was originally known as West Simsbury, but was later changed to Weatogue. The town was named after the Weatogue Indians, who were a local Native American tribe. The town was incorporated in 1779 and has remained a small, rural town ever since. The town has a long history of farming and manufacturing, and is still home to a few small businesses and farms.
Common Questions
What is Per Capita Income in Weatogue?
Per Capita income in Weatogue is $85,915.
What is the Median Family Income in Weatogue?
Median Family Income in Weatogue is $180,893.
What is the Median Household income in Weatogue?
Median Household Income in Weatogue is $154,716.
What is Income or Wage Gap in Weatogue?
Income or Wage Gap in Weatogue is 24.7%.
Women in Weatogue earn 75.3 cents for every dollar earned by a man.
What is Inequality or Gini Index in Weatogue?
Inequality or Gini Index in Weatogue is 0.42.
What is the Total Population of Weatogue?
Total Population of Weatogue is 2,671.
What is the Total Male Population of Weatogue?
Total Male Population of Weatogue is 1,356.
What is the Total Female Population of Weatogue?
Total Female Population of Weatogue is 1,315.
What is the Ratio of Males per 100 Females in Weatogue?
There are 103.12 Males per 100 Females in Weatogue.
What is the Ratio of Females per 100 Males in Weatogue?
There are 96.98 Females per 100 Males in Weatogue.
What is the Median Population Age in Weatogue?
Median Population Age in Weatogue is 40.4 Years.
What is the Average Family Size in Weatogue
Average Family Size in Weatogue is 2.9 People.
What is the Average Household Size in Weatogue
Average Household Size in Weatogue is 2.4 People.
How Large is the Labor Force in Weatogue?
There are 1,488 People in the Labor Forcein in Weatogue.
What is the Percentage of People in the Labor Force in Weatogue?
69.3% of People are in the Labor Force in Weatogue.
What is the Unemployment Rate in Weatogue?
Unemployment Rate in Weatogue is 0.7%.